Embed Size (px)
Citation preview

Technical Report Documentation PU2e
I. Report No. 2. Government Accession No. 3. Recipient's Catalog No.
FHW AffX-96/1361-1F
4. Title and Subtitle 5. Report Date
INVESTIGATION OF LAND USE, DEVELOPMENT, AND November 1995 PARKING POLICIES TO SUPPORT THE USE OF HIGH- 6. Performing Organization Code
OCCUPANCY VEHICLES IN TEXAS
7. Author(s) 8. Performing Organization Report No.
Katherine F. Turnbull, Patricia A. Turner, and Nell Frazer Lindquist Research Report 1361-1F
9. Performing Organization Name and Address 10. Work Unit No. (TRAIS)
Texas Transportation Institute The Texas A&M University System 1 I. Contract or Grant No.
College Station, Texas 77843-3135 Study No. 0-1361
12. Sponsoring Agency Name and Addtess 13. Type of Report and Period Covered
Texas Department of Transportation Final: Research and Technology Transfer Office September 1993-August 1995 P. O. Box 5080 Austin, Texas 78763-5080 14. Sponsoring Agency Code
15. Supplementary Notes
Research performed in cooperation with the Texas Department of Transportation and the U.S. Department of Transportation, Federal Highway Administration Research Study Title: Investigation of Land Use, Development, and Parking Policies to Support the Use of High-Occupancy Vehicles in Texas
16. Abstract
This research study examined the factors that influence commuting behavior, the reaction of commuters to various strategies and techniques to encourage alternative commute modes, and the use of different programs by public agencies and businesses in Texas. This was accomplished through a state-of-the-art literature review; discussion groups with representatives from the public and private sectors in Dallas, Houston, and Austin; an evaluation of the Houston Employer Trip Reduction Plans; and surveys of bus riders, carpoolers, and motorists on HOV lanes and freeways in Dallas and Houston. The research results identify the strategies that appear most appropriate for further application in Texas and potential implementation techniques. The results indicate that voluntary efforts are favored over mandatory programs. Further, support was strongest for transit services and support facilities, ridesharing, employee incentives, and on-site amenities. Less support was voiced for pricing strategies, including congestion pricing, increasing parking rates, and raising the tax on gasoline.
17. Key Words 18. Distribution Statement
High-occupancy vehicles, HOV, transit, carpooling, No restrictions. This document is available to the vanpooling, ridesharing, parking, land use, public through NTIS: development, travel demand management, TDM, National Technical Information Service TMO'sITMA's 5285 Port Royal Road
Springfield, Virginia 22161
19. Security Classif.(ofthis report) 20. Security Classif. (of this page) 21. No. of Pages 22. Price
Unclassified Unclassified 170
Form DOT F 1700.7 (8.72) Reproduction of completed page authorized


INVESTIGATION OF LAND USE, DEVELOPMENT, AND PARKING POLICIES
TO SUPPORT THE USE OF HIGHOCCUPANCY VEHICLES IN TEXAS
by
Katherine F. Turnbull Research Scientist
Texas Transportation Institute
Patricia A. Turner Assistant Research Scientist
and
Nell Frazer Lindquist Assistant Research Scientist
Research Report 1361-1F Research Study Number 0-1361
Research Study Title: Investigation of Land Use, Development, and Parking Policies to Support the Use of High-Occupancy Vehicles in Texas
Sponsored by Texas Department of Transportation
In Cooperation with U.S. Department of Transportation
Federal Highway Administration
November 1995
TEXAS TRANSPORTATION INSTITUTE The Texas A&M University System College Station, Texas 77843-3135


IMPLEMENTATION STATEMENT
Most urban areas in Texas continue to experience significant problems relating to traffic
congestion, increasing concerns about air quality, and maintaining the mobility of area residents
and visitors. All forms of high-occupancy vehicles-rail, bus, carpools, and vanpools-along
with bicycling, walking, and work schedule management, are viewed as playing important roles
in helping to address many of these concerns. Encouraging greater use of these approaches has
become an important focus of efforts in Texas cities. Experience in Texas and throughout the
country indicates HOV use can be enhanced by providing supporting policies such as employer
incentives, land use and zoning practices, coordinated development activities, parking supply and
pricing strategies, and other techniques.
This study examined the national experience with various programs and assessed the
efforts currently underway in Houston, Dallas, and Austin. Discussion groups in these three
cities provided an overview of current programs, as well as the reaction of public and private
sector representatives to different approaches. Surveys of commuters in Houston and Dallas
provided further insight into the general public's support for various strategies.
This research study should be of benefit to the Texas Department of Transportation,
transit agencies, metropolitan planning organizations, municipalities, public and private sector
employers, and other groups interested in identifying realistic approaches to encourage greater
use of all high-occupancy commute modes. The results should also be of interest to federal
agencies, national organizations, and groups in other states.
Texas Transportation Institute v


DISCLAIMER
The contents of this report reflect the views of the authors who are responsible for the
opinions, findings, and conclusions presented herein. The contents do not necessarily reflect the official views or policies of the Federal Highway Administration or the Texas Department of
Transportation. This report does not constitute a standard, specification, or regulation, and is
not intended for construction, bidding, or permit purposes.
Texas Transportation Institute vii
ACKNOWLEDGMENT
The authors would like to recognize the following TTl staff for their assistance with the
data collection and data entry activities associated with this research project:
viii
Luke Albert, Student Worker, College Station Paul Allen, Student Worker, Arlington Jim Blagrave, Student Worker, Arlington Patty Diaz, Student Worker, College Station Jeff Dublin, Student Worker, Arlington Bonnie Duke, Administrative Assistant, College Station Kim Duren, Student Technician, College Station Shari Cadogan, Graduate Research Assistant, College Station Xavier Cervantes, Graduate Research Assistant, College Station William Eisele, Assistant Research Scientist, College Station Steve Farnsworth, Graduate Research Assistant, College Station William Frawley, Assistant Research Scientist, Arlington Jay Hall, Student Technician, Arlington Kevin Hall, Assistant Research Scientist, College Station Mike Hoeinghaus, Student Worker, College Station Laura Higgins, Assistant Research Scientist, College Station Brigitta Keitgen, Research Assistant, College Station Brad Morello, Student Technician, College Station Danny Morris, Research Associate, College Station Darryl Puckett, Associate Research Scientist, Houston Stephen Ranft, Research Associate, Arlington Jordan Richard, Student Worker, College Station Janet Ricci, Research Associate, College Station Pam Rowe, Technical Secretary, College Station David Schrank, Research Associate, College Station JoBeth Schreiber, Student Worker, College Station Jeff Simmons, Student Worker, Arlington Doug Skowronek, Assistant Research Scientist, Arlington Joe Slack, Student Worker, Arlington Diana Wallace, Assistant Research Scientist, Arlington Stacy White, Research Assistant, Arlington Steve Wohlschlaeger, Assistant Research Scientist, Houston
The assistance of these individuals is both acknowledged and greatly appreciated.
Texas Transportation Institute

TABLE OF CONTENTS
Page
LIST OF FIGURES . . . . . . . . . . . . . . . . . . . . . . . . . . . . . . . . . . . . . . . . .. xii
LIST OF TABLES .......................................... xiv
SUMMARY ............................................ " xv Introduction .... . . . . . . . . . . . . . . . . . . . . . . . . . . . . . . . . . . . . .. xv Research Approach . . . . . . . . . . . . . . . . . . . . . . . . . . . . . . . . . . . . .. xv Research Results ....................................... xvi Strategies for Further Application in Texas .......... . . . . . . . . . . .. xviii Implementation . . . . . . . . . . . . . . . . . . . . . . . . . . . . . . . . . . . . . . .. xxi
CHAPTER I-INTRODUCTION .................................. 1 Research Overview . . . . . . . . . . . . . . . . . . . . . . . . . . . . . . . . . . . . . .. 1 Study Objectives ........................................ 2 Research Approach . . . . . . . . . . . . . . . . . . . . . . . . . . . . . . . . . . . . . .. 2 Report Organization .......... . . . . . . . . . . . . . . . . . . . . . . . . . . .. 3
CHAPTER II-NATIONAL OVERVIEW .. . . . . . . . . . . . . . . . . . . . . . . . . . .. 5 Recent Demographic and Travel Trends . . . . . . . . . . . . . . . . . . . . . . . . .. 7 Factors Influencing Greater Use of Alternative Commute Modes ......... " 8 Transit Services . . . . . . . . . . . . . . . . . . . . . . . . . . . . . . . . . . . . . . . .. 9 Supporting Facilities . . . . . . . . . . . . . . . . . . . . . . . . . . . . . . . . . . . . . . 11 Rideshare Programs ...................................... 15 Guaranteed Ride Home Programs .............................. 16 Bicycling and Walking . . . . . . . . . . . . . . . . . . . . . . . . . . . . . . . . . . . . . 17 Employer Incentives ...................................... 18 On-Site Amenities ....................................... 19 Parking Management . . . . . . . . . . . . . . . . . . . . . . . . . . . . . . . . . . . . . . 20 Work Schedule Management . . . . . . . . . . . . . . . . . . . . . . . . . . . . . . . . . 21 Congestion Pricing . . . . . . . . . . . . . . . . . . . . . . . . . . . . . . . . . . . . . . . 22 Land Use Planning and Development Regulations . . . . . . . . . . . . . . . . . . . . 23 Public Awareness Campaigns and Organizational Structures . . . . . . . . . . . . . . 24 Comprehensive Approaches ................................. 26
Texas Transportation Institute ix

TABLE OF CONTENTS, Continued
Page
CHAPTER III-STATE OVERVIEW ................................ 27 Employee Trip Reduction Plans . . . . . . . . . . . . . . . . . . . . . . . . . . . . . . . 27 Discussion Groups .., . . . . . . . . . . . . . . . . . . . . . . . . . . . . . . . . . . . . 29 Transit Services . . . . . . . . . . . . . . . . . . . . . . . . . . . . . . . . . . . . . . . . . 32 Support Facilities . . . . . . . . . . . . . . . . . . . . . . . . . . . . . . . . . . . . . . . . 34 Rideshare Programs ...................................... 36 Guaranteed Ride Home Programs .............................. 38 Bicycles and Walking ..................................... 39 Employer Incentives . . . . . . . . . . . . . . . . . . . . . . . . . . . . . . . . . . . . . . 39 On-Site Amenities ....................................... 40 Parking Management and Parking Pricing ......................... 41 Work Schedule Management . . . . . . . . . . . . . . . . . . . . . . . . . . . . . . . . . 41 Congestion Pricing . . . . . . . . . . . . . . . . . . . . . . . . . . . . . . . . . . . . . . . 42 Land Use Planning and Development Regulations . . . . . . . . . . . . . . . . . . . . 42 Public Awareness Campaigns and Organizational Structures . . . . . . . . . . . . . . 44
CHAPTER IV-HOUSTON AND DALLAS HOV LANE USER AND NON-USER SURVEYS ............................................ 47 Survey Methodology . . . . . . . . . . . . . . . . . . . . . . . . . . . . .......... 47 Survey Results ......................................... 57
Demographic Information .............................. 57 Travel Behavior Characteristics . . . . . . . . . . . . . . . . . . . . . . . . . . . 69 Attitudes About HOV Facilities ........................... 81 Employer Incentives to Encourage HOV Use .................. 86 Strategies to Encourage HOV Use ......................... 90
CHAPTER V -CONCLUSIONS . . . . . . . . . . . . . . . . . . . . . . . . . . . . . . . . .. 105 Strategies for Further Application . . . . . . . . . . . . . . . . . . . . . . . . . . . .. 105 Implementation . . . . . . . . . . . . . . . . . . . . . . . . . . . . . . . . . . . . . . . . 109 Additional Research ..................................... 110
x Texas Transportation Institute

T ABLE OF CONTENTS, Continued
Page
REFERENCES 111
APPENDIX A-Script for Private Sector Discussion Groups. . . . . . . . . . . . . . . .. 117
APPENDIX B-Script for Public Agency Discussion Groups ................ 121
APPENDIX C-Discussion Group Participants ......................... 125
APPENDIX D-Survey Results .................................. 129
Texas Transportation Institute xi
LIST OF FIGURES
Figure Page
1 Strategies to Encourage High-Occupancy Vehicle Use. . . . . . . . . . . . . . . . . .. 6
2 Houston HOV System ...................................... 48
3 Dallas HOV System .............................. ......... 49
4 Carpooler and Solo Commuter Sample Zip Codes ..................... 51
5 East R. L. Thornton Freeway HOV Lane Transit User Demographic Profile . . . . . 58
6 Katy Freeway HOV Lane Transit User Demographic Profile . . . . . . . . . . . . . . . 59 7 Northwest Freeway HOV Lane Transit User Demographic Profile ........... 60
8 East R. L. Thornton Freeway HOV Lane Carpooler Demographic Profile ...... 62
9 Katy Freeway HOV Lane Carpooler Demographic Profile ........ . . . . . . . . 63
10 Northwest Freeway HOV Lane Carpooler Demographic Profile ............. 64
11 East R. L. Thornton Freeway Motorist Demographic Profile .............. 66
12 Katy Freeway Motorist Demographic Profile ........................ 67 13 Northwest Freeway Motorist Demographic Profile ..................... 68
14 Trip Purpose: Transit Users, Carpoolers, and Freeway Motorists ........... 70
15 Reasons for Using Transit .................................... 72
16 Reasons for Carpooling ..................................... 73 17 Reasons for Driving Alone ................................... 74
18 Previous Trip Mode: Transit Users .............................. 76
19 Previous Trip Mode: Carpoolers ............................... 77
20 Previous Carpool Participation By Transit Users ...................... 79 21 Length of Time Carpool Exists ................................. 80
22 How Carpools Are Formed . . . . . . . . . . . . . . . . . . . . . . . . . . . . . . . . . . . 80 23 Composition of Carpools .................................... 81 24 Importance of HOV Lane in Decision to Use Transit ................... 83 25 Impact of HOV Lane on Mode Choice: Transit Users .................. 83 26 Impact of HOV Lane on Mode Choice: Carpoolers . . . . . . . . . . . . . . . . . . . . 84 27 Perceived HOV Lane Travel Time Savings: Transit Users . . . . . . . . . . . . . . . . 84
28 Perceived HOV Lane Travel Time Savings: Carpoolers ................. 85
29 Employer Incentives to Encourage HOV Use: Transit Users .............. 87
30 Employer Incentives to Encourage HOV Use: Carpoolers ................ 88
31 Employer Incentives to Encourage HOV Use: Freeway Motorists ........... 89
xii Texas Transportation Institute

LIST OF FIGURES Continued
Figure Page
32 Degree of Support for Expanded Bus Service . . . . . . . . . . . . . . . . . . . . . . . . 93 33 Degree of Support for More Park-and-Ride Lots ...................... 94 34 Degree of Support for the Addition of More HOV Lanes . . . . . . . . . . . . . . . . . 95 35 Degree of Support for the Addition of More HOV Lane Access Points ........ 96 36 Degree of Support for Employer Incentives To Rideshare and Use Transit ...... 98 37 Degree of Support for Flexible Work Hour Arrangements ................ 99 38 Degree of Support for Telecommuting ........................... 100 39 Degree of Support for Higher Parking Fees . . . . . . . . . . . . . . . . . . . . . .. 102 40 Degree of Support for Higher Gasoline Taxes . . . . . . . . . . . . . . . . . . . . . .. 103 41 Degree of Support for Charging For Use of Roads. . . . . . . . . . . . . . . . . . .. 104
Texas Transportation Institute xiii
LIST OF TABLES
Table Page
1 Alternative Mode Preferences-Houston Employees .... . . . . . . . . . . . . . . . . 28 2 Summary of Trip Reduction Measures Currently Offered or Planned by Houston
Employers ............................................. 30 3 Survey Distribution and Response Rates-East R. L. Thornton Freeway and HOV
Lane ................................................. 52 4 On-Board Transit User Survey Distribution and Response Rates-East R. L. Thornton
Freeway HOV Lane ....................................... 53 5 Motorist and Carpooler Survey Distribution and Response Rates-Katy and Northwest
Freeways and HOV Lanes . . . . . . . . . . . . . . . . . . . . . . . . . . . . . . . . . . . . 55 6 On-Board Transit User Survey Distribution and Response Rate, Katy and Northwest
Freeway Bus Routes ....................................... 56 7 Previous Trip Mode: Carpoolers . . . . . . . . . . . . . . . . . . . . . . . . . . . . . . . . 78 8 Support for Strategies to Encourage HOV Use: Transit Users and Carpoolers .... 91 9 Support for Strategies to Encourage HOV Use: Freeway Motorists ........... 92
xiv Texas Transportation Institute
SUMMARY
INTRODUCTION
Major urban areas in Texas continue to experience problems with growing traffic congestion, increasing concerns about air quality and the environment, and maintaining the
mobility of area residents. All forms of high-occupancy commute modes-bus, carpools,
vanpools, and rail-as well as other strategies to reduce driving alone, can play"important roles
in addressing many of these concerns. Experience in Texas and other states indicates that
encouraging greater use of high-occupancy vehicles (HOY) and alternative commute modes is
most effective when integrated with other supporting policies and programs.
This research project was undertaken to expand the understanding of the factors that
influence commuting behavior, the reaction of commuters to various strategies and techniques,
and the use of different programs by public agencies and businesses in Texas. As such, it is
intended to help develop a realistic assessment of the strategies and programs that appear most appropriate for use in Texas. Approaches examined include transit improvements, HOY
facilities, TDM programs, parking policies, pricing strategies, land use and development
requirements, and employer-based incentives and disincentives.
RESEARCH APPROACH
Researchers conducted a number of activities to accomplish the objectives of this study.
First, a state-of-the-art literature review was completed on strategies and programs in use
throughout the country. This review examined the experience with different approaches to encourage HOY use and identified those appropriate for further application within Texas.
Second, researchers assessed the efforts currently underway in Texas. Information on programs in the major cities was obtained from local agencies, and discussion groups were held with representatives from public agencies and private businesses in Houston, Dallas, and Austin. The Employer Trip Reduction Plans submitted by employers in Houston provided further information on commuter preferences and current programs. Third, surveys were conducted of
carpoolers and bus riders using the HOY lanes and motorists in the general purpose lanes on two
freeways in Houston and one freeway in Dallas.
Texas Transportation Institute xv

This information helped identify the approaches and techniques that appear to have the most widespread support among businesses, governmental agencies, and the general public. Further, techniques for implementing these strategies were outlined. The study results provide
a useful guide for all groups interested in encouraging greater use of HOV and other alternative
commute modes in Texas.
RESEARCH RESULTS
A number of common themes emerged from the discussion groups, surveys, and Houston
ETR plans. Although differences emerged from the discussion groups, participants voiced
stronger support for voluntary measures rather than mandatory regulations. They supported
increased transit services and more innovative service applications, rideshare programs, preferential parking and reduced parking rates for carpoolers, guaranteed ride home programs,
alternative work schedules, and special programs on ozone alert days. Many, but not all
participants, noted that on-site amenities for bus riders and bicyclists, such as bicycle shelters
or lockers and shower facilities were important.
The surveys of HOV lane users and non-users included several questions designed to
obtain a better understanding of the level of support among the various groups for different policies and programs encouraging HOV use. The three survey groups-bus riders, carpoolers
and vanpoolers, and motorists-were asked to indicate their level of support for ten strategies.
These strategies focused on the three general categories of expanded transit services and facilities, employer-based programs, and increasing the cost of driving alone. The major
responses to these question are highlighted next.
xvi
• There was more support among all three groups for strategies focusing on expanding transit services and facilities and employer incentives, than increasing the cost of the driving.
• All groups rated employer incentives, flexible work hours, expanded bus services, additional park-and-ride lots, additional HOV lanes, telecommuting, and additional HOV lane access points the highest. Between 40 to 92 percent of the respondents supported these strategies.
• The three approaches receiving the least amount of support were increasing the
gasoline tax, charging for the use of roads, or charging higher parking fees.
Texas Transportation Institute

Only three to nine percent of respondents in the different groups indicated support for these strategies.
• Bus riders and carpoolers expressed stronger support for the bus service and facility enhancements and employer incentives than did motorists.
• Employer incentives were rated highest by bus riders with 82 percent to 92 percent indicating support. Telecommuting and expanded bus services were
supported by 70 percent to 84 percent of the bus riders. Other strategies supported by at least half the transit riders were additional HOV lanes, additional
park-and-ride lots, telecommuting, and additional HOV lane access points.
• Carpoolers rated additional HOV lanes, flexible work hours, and employer incentives the highest. All of these were supported by between 60 percent and 82 percent of the carpoolers in all three corridors. Additional HOV lane access
points and telecommuting were supported by approximately 50 percent of the carpool respondents.
• Motorists indicated less support than the other two user groups for all the strategies. Flexible work hours, employer incentives, additional HOV lane access
points, and telecommuting were rated the highest by the freeway motorists.
These strategies received support from between 40 percent and 56 percent of the
motorists responding to the survey. Support for expanding bus services, additional park-and-ride lots, and additional HOV lanes were supported by 30
percent to 46 percent of the respondents.
• None of the three user groups indicated support for increasing the gasoline tax, charging for the use of roads, or charging higher parking fees. Bus riders and carpoolers offered slightly higher levels of support for these strategies than did motorists, however.
Texas Transportation Institute xvii

STRATEGIES FOR FURTHER APPLICATION IN TEXAS
In assessing potential programs and strategies, it is important to remember some of the unique aspects of many metropolitan areas in Texas. These include low density land use and
development patterns, fewer land use controls in some cities, a relatively stable source of funding for the metropolitan transit authorities (MTAs), and active private sector involvement
in many activities. Some of these factors, such as lower densities and the lack of land use
controls in some areas, may work against strategies to encourage HOV and other alternate
commute modes. Others, such as stable funding sources for the larger transit agencies and the active participation of the business community in various programs, provide opportunities to
undertake new and innovative efforts. The study results indicate that the following strategies are most appropriate for further application in Texas.
xviii
• Transit Services. There is widespread support for expanding and enhancing transit services in the three cities included in the study. Commuters, public agencies, and
private businesses all responded favorably to strategies that enhance existing transit services, such as those oriented to the traditional markets, as well as innovative approaches to serving new markets. Expanding and enhancing transit services should
continue to be a high priority for transit agencies, businesses, TMOs, TxDOT, and other groups.
• Support Facilities. There was also strong support among all groups for additional facilities to enhance the use of transit and ride sharing . TxDOT, transit agencies, local communities, developers, businesses, and other groups should continue to pursue the
development and operation of a wide range of supporting facilities, such as HOV
lanes, park-and-ride lots, transit centers, LRT and bus coordination, shelters, and other facilities.
• Rideshare Programs. Widespread support was voiced for carpool and vanpool programs and other ridematching services. These programs are appropriate for all travel markets, but are especially good for areas without fixed-route transit services. New and innovative rideshare approaches, including real-time ridematching, casual
carpooling, and application of intelligent transportation system (ITS) technologies,
should be pursued rather than relying solely on the traditional match list. Rideshare programs within transit agencies, TxDOT, MPOs, TMOs, and private businesses
should continue to work together on these approaches.
Texas Transportation Institute

• Guaranteed Ride Home Programs. All groups voiced strong support for guaranteed ride home programs. As a result, the use of guaranteed ride home programs should be actively pursued by public and private sector groups in Texas.
• Employer Incentives. HOV lane users and non-users in Houston and Dallas and employees in Houston responding to the ETR surveys viewed a number of employer incentives positively. These included subsidizing bus passes, payroll deduction for
transit passes, on-site bus pass sales, and other incentives. Both the public and private sectors should be encouraged to continue existing incentives and to develop new
programs.
• On-Site Amenities. The results from the Houston ETR surveys and the discussion groups indicate there is support for various on-site amenities. The provision of on-site
amenities or the addition of services in close proximity to major work sites should continue to be explored and developed by private businesses and public agencies.
• Work Schedule Management. Strong support was voiced by all groups for various work schedule strategies, although management personnel did raise some concerns. Staggered schedules, flexible work hours, and compressed work weeks were rated the highest, followed by telecommuting. These approaches are currently being used by
both the public and private sectors and further implementation should be supported by
all groups.
• Land Use and Development Regulations. The discussion group participants generally supported strategies involving greater coordination of land use and development patterns, public transportation, roadway improvements, and other elements of the
transportation system. Local communities, private businesses, and developers will need to take the lead on these strategies. TxDOT, transit agencies, MPOs, TMOs, and other groups can play important roles supporting and assisting with the planning and implementation of these techniques.
• Public Awareness Campaigns and New Organizational Structures. The need for ongoing informational and educational efforts aimed at the general public, policy
makers, and businesses was raised by discussion group participants. Continued
support should be provided by all groups for the development, implementation, and
ongoing use of public information campaigns and other related activities. TxDOT can
playa key role in helping promote these activities. Further, development and use of
TMOs, TMAs, and other innovative organizational structures should be encouraged.
Texas Transportation Institute xix

• Comprehensive Programs. Consideration should also be given to the development and implementation of comprehensive programs in major cities in Texas. Although efforts have been made in this direction in some areas, additional elements may be needed in various programs. All groups-TxDOT, transit agencies, MPOs, local
communities, TMOs, and private businesses-should be involved in the development
and implementation of comprehensive programs.
Three strategies-bicycling and walking, parking management and pricing, and congestion
pricing-received lower levels of support from all groups. As noted next, however, additional
consideration of these techniques is still appropriate.
xx
• Bicycling and Walking. For various reasons, all groups voiced lower levels of interest and support for commuting by bicycling and walking. These techniques may
have applications in some areas; however, and efforts to promote these alternatives
should be focused carefully on these opportunities. Cities, MPOs, TxDOT, private
businesses, and bicycle groups should work together on these applications.
• Parking Management and Parking Pricing. These techniques have not been used extensively within Texas. There was support among some groups for preferential
parking strategies for HOVs, but little support was voiced for parking pricing strategies. Although it does not appear that widespread parking pricing programs will be used in the near future, it may be appropriate to consider a few demonstration
projects focusing on parking pricing and supply strategies to test these concepts.
• Congestion Pricing. Little support was voiced for congestion pricing although some interest was expressed for charging single-occupant vehicles for use of the HOV lanes
in Dallas and Houston. Monitoring the assessment of a possible Houston HOV lane demonstration and any test that may be conducted is appropriate. The results of this project can be used to help assess the potential for additional applications of congestion pricing in the state.
Texas Transportation Institute

IMPLEMENTATION
A number of techniques are appropriate to help implement the strategies described in the
previous section. These include videos, training courses, educational outreach programs,
technical assistance, advanced communication technology, and other techniques. The successful
planning, implementation, and ongoing operation of these strategies will require the coordinated
efforts of numerous groups. TxDOT, transit agencies, MPOs, TMOs, local governments,
private businesses, and other organizations will all need to be involved.
Texas Transportation Institute xxi

I. INTRODUCTION
RESEARCH OVERVIEW
Major urban areas in Texas continue to face significant problems related to traffic congestion, increasing concerns about air quality, and maintaining the mobility of area residents. All forms of high-occupancy commute modes-bus, carpools, vanpools, and rail-as well as
other strategies to reduce driving alone, can play important roles in addressing many of these
concerns. As a result, encouraging greater use of high-occupancy vehicles (HOVs), other
alternative commute modes, and innovative work scheduling has become an important focus in
many Texas cities. The forecasted growth in population and vehicle miles of travel (VMT) for the state indicate that these issues will continue to be important in the future (1).
Experience in Texas and other states indicates that encouraging greater use of HOV and alternative commute modes is most effective when integrated with other supporting policies and programs. A recent focus of transportation research has been on obtaining a better understanding of the factors that influence commuter behavior, especially mode choice, and the
role incentives, disincentives, and supporting programs play in encouraging greater use of HOV and alternative modes. This research has lead to a growing realization that many factors
influence commuting behavior and that a wide range of services, programs, and strategies must
be present to meet the needs of diverse segments of the popUlation.
This research project was undertaken to expand the understanding of the factors that
influence commuting behavior, the reaction of commuters to various strategies and techniques, and the use of different programs by public agencies and businesses in Texas. As such, it is intended to help develop a realistic assessment of the strategies and programs that appear most appropriate for use in Texas. Approaches examined include transit improvements, HOV facilities, TDM programs, parking policies, pricing strategies, land use and development requirements, and employer-based incentives and disincentives.
The research conducted in this study builds upon previous work conducted by the Texas
Transportation Institute (TTl) for TxDOT and others. These include surveys of HOV lane users
and non-users in Houston (2,3), national assessments of HOV facilities (4), and the examination of policies supporting transit use (5). This research expands on these efforts and provides a
realistic assessment of techniques for encouraging greater use of HOV and alternative commute
modes in Texas. The results of the study, as outlined in this report, should be of benefit to
Texas Transportation Institute 1

TxDOT, transit agencies, businesses, and other federal, state, and local groups interested in
enhancing mobility and addressing traffic congestion and environmental concerns.
STUDY OBJECTIVES
This research study was designed to meet a number of objectives. The major focus of
the study was to assess the role different policies, programs, and strategies play in encouraging
greater use of HOV commute modes in Texas cities. Transit improvements, HOV facilities,
TDM programs, parking policies, pricing strategies, land use and development requirements,
and employer-based incentives and disincentives are the major techniques examined in the study.
The second objective of the research project was to gain a better understanding of the
factors that influence the travel patterns and mode choice of commuters in major urban areas in
the state, as well as preferences toward different strategies. This objective was accomplished
by using discussion groups and mail surveys, as well as obtaining relevant information from
public agencies and other groups.
The third objective of the study was to identify the approaches and techniques that appear
to have the greatest potential for encouraging greater use of HOV modes and other alternatives
among commuters in Texas. Techniques for implementing, monitoring, and evaluating selected
strategies were also assessed.
The results of this study will be of benefit to TxDOT, transit agencies, metropolitan
planning organizations (MPOs), cities and counties, businesses, and other groups interested in
encouraging greater use of HOV modes. The research results provide guidance on the strategies
and approaches that appear to be most appropriate for application in Texas. The study provides
a realistic and useful resource for the development, implementation, and evaluation of programs and techniques to increase the use of HOV modes and other alternatives to meet local needs as well as federal requirements.
RESEARCH APPROACH
Researchers conducted a number of activities to accomplish the objectives of this study.
First, a state-of-the-art literature review was completed on strategies and programs in use
throughout the country. This review examined the experiences with different approaches to
encourage HOV use and identified those appropriate for further application within Texas.
2 Texas Transportation Institute

Second, researchers assessed the efforts currently underway in Texas. Information on programs in the major cities was obtained from local agencies, and discussion groups were held with representatives from public agencies and private businesses in Houston, Dallas, and Austin. The discussion groups provided additional insights into the factors that influence travel behavior and the mode choice of commuters. The current use of different approaches were discussed,
along with the reactions toward potential strategies.
Third, surveys were conducted of carpoolers and bus riders using the HOV lanes and motorists in the general purpose lanes on two freeways in Houston and one freeway in Dallas. These surveys provided additional information about commuter travel behavior, as well as
attitudes toward alternative commute modes and other strategies.
The information obtained from all these sources was used to identify the approaches and techniques that appear to have the most widespread support among businesses, governmental
agencies, and the general public. Further, techniques for implementing these strategies were
outlined. The study results are intended to provide a useful guide for all groups interested in
encouraging greater use of HOV modes in Texas.
REPORT ORGANIZATION
The remainder of this report is divided into four chapters. The next chapter summarizes the national state-of-the-art programs focusing on encouraging HOV use and other alternative
strategies to reduce driving alone. Examples are provided of various strategies in use throughout
the country. Chapter Three reviews the experience with programs and activities within the state.
The results of the discussion groups, as well as other information on efforts within Texas, are presented. Chapter Four summarizes the results of the on-board surveys of bus riders and the mail surveys of carpoolers and motorists using freeways and HOV lanes in Houston and Dallas. The final chapter identifies those approaches which appear most appropriate for further application, techniques to implement these strategies, and areas for further examination.
Texas Transportation Institute 3


II. NATIONAL OVERVIEW
Public agencies and private businesses throughout the country are implementing a variety
of different approaches to encourage greater use of alternative commute modes. Additional strategies, such as flexible work schedules, telecommuting, and congestion pricing are also being
examined to help manage the demand on transportation facilities.
In general, the strategies being considered and implemented fall into two general categories. The first is those approaches aimed at encouraging commuters to change from
driving alone to using an HOV mode, walking, or bicycling. The second group of strategies
focuses on moving trips outside of the morning and afternoon peak-periods and into less
congested travel periods or removing trips from the roadway altogether. A wide range of techniques falls into these general categories and there is no overlap between the different
approaches.
Figure 1 provides a summary of the major strategies to encourage HOV use and to better
manage demand on the transportation system. Twelve general approaches are identified, along
with examples of specific techniques. While the national experience with some of these strategies is well established, the influence of many is still evolving. This chapter summarizes
the general characteristics of the different techniques and reviews the experience with various
programs throughout the country. The use of these strategies in Texas is examined in Chapter
III.
Before assessing the various techniques to encourage greater use of HOV s, it is first important to understand the recent trends influencing travel behavior. Many of these trends are working against the use of HOVs and alternative commute modes. The discussion of these trends is followed by a brief overview of factors that appear to influence mode choice. The use of different strategies throughout the country are then summarized.
Texas Transportation Institute 5
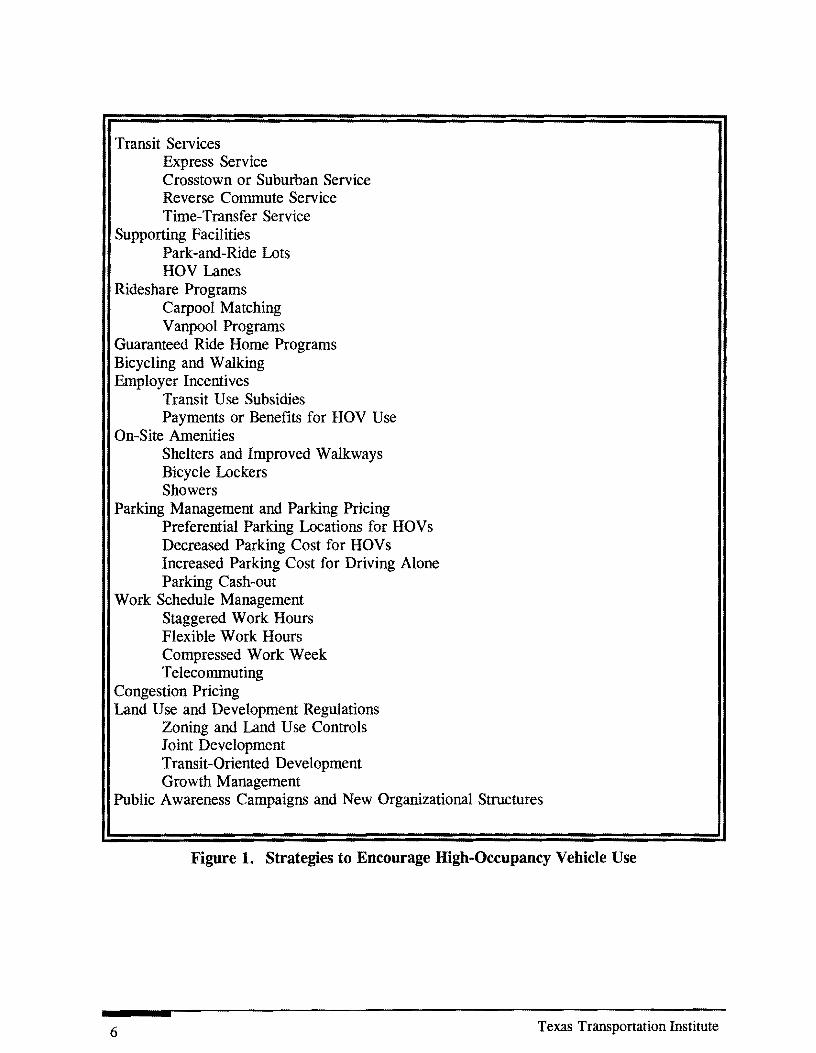
Transit Services Express Service Crosstown or Suburban Service Reverse Commute Service Time-Transfer Service
Supporting Facilities Park-and-Ride Lots HOV Lanes
Rideshare Programs Carpool Matching Vanpool Programs
Guaranteed Ride Home Programs Bicycling and Walking Employer Incentives
Transit Use Subsidies Payments or Benefits for HOV Use
On-Site Amenities Shelters and Improved Walkways Bicycle Lockers Showers
Parking Management and Parking Pricing Preferential Parking Locations for HOVs Decreased Parking Cost for HOVs Increased Parking Cost for Driving Alone Parking Cash-out
Work Schedule Management Staggered Work Hours Flexible Work Hours Compressed Work Week Telecommuting
Congestion Pricing Land Use and Development Regulations
Zoning and Land Use Controls Joint Development Transit -Oriented Development Growth Management
Public Awareness Campaigns and New Organizational Structures
Figure 1. Strategies to Encourage High-Occupancy Vehicle Use
6 Texas Transportation Institute

RECENT DEMOGRAPHIC AND TRA VEL TRENDS
The changes in demographics, socio-economic characteristics, and travel behavior that
have occurred over the last 30 years are well known. The three major trends that have influenced travel behavior over this time period are the worker boom, the suburban commuting
boom, and the automobile commuting boom (6). An additional trend is that low income and transit dependent groups continue to reside primarily in the central city areas or older first ring
suburbs. Many of these trends, which are highlighted next, are counter to encouraging the use
of HOV modes.
• Worker Boom. Approximately 24 million new workers were added to the labor force in the United States between 1980 and 1990. About 10 million of this increase
was due to population growth, while 14 million was due to the changing nature of
the popUlation. Further, approximately 60 percent of these new workers were
women (6). The increase in workers means an increase in commuting trips.
Although this trend would be good for transit if the new jobs were located in areas
served by transit, they often are not. Further, the addition of significant numbers
of women into the work force has resulted in more two-worker families and single
parent households. As a result, two cars are often used per household for work trips
and many work trips also must accommodate dropping and picking children up at
school or day care, grocery shopping, and other errands. Recent studies have
indicated that women have different commuting patterns, partly as a result of child
care and other responsibilities (7).
• Suburban Commuting Boom. Since World War II, there has been a steady trend toward the movement of both housing and jobs from central city areas to the suburbs. This has resulted in major changes in commuting patterns in most metropolitan areas. In the past, the suburb-to-downtown work trip represented the major commute pattern in most metropolitan areas. On a national basis this is no longer the case. The development of suburban office parks and edge cities has resulted in the suburb-to-suburb work trip being the dominant commute pattern in most metropolitan areas today (6). This trend has resulted in significant levels of
traffic congestion on many suburban freeways and arterial streets. This travel
pattern, which focuses on dispersed origins and destinations, is difficult to serve with
public transportation. It is important to note, however, that the suburb-to-Central
Business District (CBD) trip still represents an important-and in some areas growing-commute pattern that is usually well served by transit (6,8).
Texas Transportation Institute 7

• Automobile Commuting Boom. Automobile ownership, vehicle miles of travel (VMT), and the use of the single-occupant automobiles all continue to increase. In 1990, the majority of households in the United States owned two automobiles. Only
13 percent of the households in the country did not have an automobile available, and 20 percent of these were in New York City (8,9). Thus, the trend is toward
higher automobile ownership and increased use of those vehicles. These trends have
resulted in an increase in the use of the automobile-by a single driver-for
commuting. According to the 1990 Census, the number of employed Americans
who drive alone to work increased by some 9 percent between 1980 and 1990, while
the number of carpoolers declined, and the use of public transit remained relatively constant (8,9).
• Transit Dependent Groups. Many of the groups that tend to rely heavily on transit as their main method of transportation-low income individuals, the elderly, and
individuals without access to an automobile-still reside in central cities or first ring suburbs in many areas (8,9). Meeting the travel needs of these groups, and
providing access to jobs, social services, and recreation activities-which are often located in the suburbs-will continue to be a priority for public transit.
These trends have resulted in significant levels of traffic congestion in major metropolitan
areas, as well as concerns over air quality and mobility. The annual cost of congestion-based on the costs associated with time delay and fuel-for the 50 largest metropolitan areas in the
country is estimated to be approximately $48 billion (10).
FACTORS INFLUENCING GREATER USE OF ALTERNATIVE COMMUTE MODES
A number of factors appear to influence mode choice selection and the use of alternative commute modes. These factors relate to the convenience and attractiveness of the various modes
and commute alternatives. Most of the programs focus on increasing the use of HOV modes to make using the bus or ride sharing more convenient and more competitive with driving alone.
Providing travel time savings, cost savings, and other incentives are examples of some of these
approaches. Using disincentives to driving alone, such as higher parking costs, have also been
examined. The state-of-the-art literature review provided insight into some of these factors.
8 Texas Transportation Institute

• Travel Time. A number of studies have found that the travel times associated with different modes is a key factor in mode choice selection. The travel time savings offered by driving alone has been identified as a major factor in the selection of
commute mode (11,12,13). Studies have also shown that providing travel time savings to HOVs through the use of HOV lanes or exclusive rail or bus facilities has
attracted commuters to these modes from driving alone (2,4,14).
• Convenience. Commuters also rate convenience very highly in the mode choice decision. Convenience relates to the ease of use, flexibility, and related attributes of the various modes. Commuters often identify the conveniences of driving alone
as the major factor in their choice of this mode (2,11,12,13). Convenience may also
relate to the location of parking facilities. For example, commuters view more
convenient parking for shared-ride vehicles as a benefit (15,16).
• Cost. The cost associated with various modes also influences commute choices, although many individuals do not use the lowest cost alternatives. The cost savings
associated with transit and ridesharing have been identified as important factors influencing the use of these modes (2,15,16). This appears to be especially true if
commuters receive additional subsidies from their employers. On the other hand, free or low cost parking tends to influence greater use of driving alone (15).
TRANSIT SERVICES
Alternatives must be available for commuters if they are to be expected to change from driving alone to using an HOV mode. Historically, transit services-including bus and
rail-have provided the major alternatives to driving alone in metropolitan areas throughout the country. Traditionally, these systems have focused primarily on providing regular route services oriented toward the downtown or major activity centers.
Meeting the diverse travel needs of all segments of society is a challenge for public transit, especially in light of the trends described in the previous section. Identifying the
traditional, as well as the new markets for transit, developing services that meet the needs of these markets, and operating cost-effective services is not an easy process. Many transit systems
throughout the country have tried different approaches for addressing these new travel markets,
with varying degrees of success.
Texas Transportation Institute 9

In addition to the regular or fixed-route services, other approaches that have been tried
or are being used include paratransit and demand responsive services, premium express services, reverse commute routes, timed-transfer systems, suburban shuttle services, suburban cross-town
routes, downtown and major activity center circulation systems, point deviation services, and
jitneys. A few examples of these services are presented next.
• Multidestination Express Service-Community Transit. Community Transit in
Snohomish County operates express service from Everett, Washington and the
surrounding areas to downtown Seattle, the University of Washington, and North
Seattle Community College. The service, which originates from both neighborhoods
and park-and-ride lots, uses the 1-5 North HOV lanes to provide travel time savings
and more reliable trip times (17).
• Reverse Commute Services-Southwest Metro, Minneapolis, Minnesota, and Wheels Bus Service, New Jersey Transit. Southwest Metro operates express
service into downtown Minneapolis and reverse commute service providing inner city
residents of Minneapolis with access to jobs in three southwestern suburbs. The
Wheels Bus Service is oriented towards residents of Bergen and Passaic Counties
who work in Newark. This is just one element of a program to increase non
traditional transit services. Other elements include providing more direct service to
major suburban activity centers and linking shuttle services to major rail stations
(18).
• Suburban Circulator-Roseville Area Transit. This service, which is operated in
the communities to the north of St. Paul, provides circulation service within a
suburban environment. The service is focused on Rosedale-a major suburban
shopping center. This facility acts as a transit hub; it is both a major destination for
many trips and provides riders with access to express bus service to both downtown Minneapolis and St. Paul. The system also connects with routes to the University
of Minnesota (19).
• Point Deviation Service-Hamilton, Ohio. The Hamilton transit system provides fixed route point deviation services. Buses operating on fixed routes deviate to pick
up passengers when requests are made (20).
• Reverse Commute Services-Southwest Metro, Minneapolis, Minnesota; ACCEL Transportation, Chicago, Illinois; and Nickerson Gardens, Los Angeles.
10 Texas Transportation Institute

Southwest Metro provides transit services in three southwestern suburbs of
Minneapolis. Express service to downtown Minneapolis is operated, along with reverse commute service, providing inner city residents of Minneapolis with access
to jobs in suburban areas. ACCEL Transportation provides inner-city residents in Chicago with door-to-door services to employment sites located in the south and
southwest suburbs. The Nickerson Gardens Resident Management Corporation (NGRMC) operates van service providing residents of the inner-city public housing
project with low-cost transportation to jobs, training facilities, child care, and other services in suburban areas (20,21).
• Timed-Transfer Services-I-394 Corridor, Minneapolis. A timed-transfer bus system has been implemented in the 1-394 corridor as part of an overall system that includes an HOV lane and other supporting facilities. The system focuses on major
transit centers and park-and-ride lots in the corridor and is designed to facilitate fast and convenient transferring among different routes. Timed transfer networks have
been set up so that routes and buses are linked at these major interchange points.
Buses on all routes serving the transfer points operate on the same headways and
arrive at the interchange point at the same time. Following a layover period that allows passengers to change buses, the vehicles leave the interchange point at the
same time. The advantage of this system is that passengers do not have to go to downtown Minneapolis to transfer, as in a radial system, and riders can reach
additional destinations more quickly and conveniently (22).
SUPPORTING FACILITIES
Park-and-ride lots, HOV lanes, and transit centers are three major types of support facilities commonly found with transit and ridesharing programs. Light rail transit (LRT) and heavy rail systems are also supported by park-and-ride lots and other elements. These facilities can help make the use of HOV modes more convenient to commuters and can enhance the ability of transit operators to offer a wide range of services.
Park-and-ride facilities provide a common location for individuals to transfer from a low
occupancy travel mode to a high-occupancy travel mode. This may mean transferring from an
automobile to a bus or a rail system, or to a carpool or vanpool. Most park-and-ride lots
provide ample parking spaces for automobiles connected with bus or rail stations and frequent transit services. In areas where bus and rail service is not available, however, park-and-pool
lots may be provided to encourage the formation of carpools and vanpools. Parking areas for
Texas Transportation Institute 11

the formation of carpools and vanpools may also be provided at bus and rail lots. Access to park-and-ride lots may also be accomplished by walking or bicycling. In addition, some travelers may be dropped off and picked up, rather than leaving their vehicles in the lot all day.
Short term waiting areas, called kiss-and-ride facilities, are often provided at lots to accommodate these travelers (23). The following national examples of park-and-ride lots are
most relevant to Texas.
12
• Connecticut. The Connecticut Department of Transportation (ConnDOT), in cooperation with FHWA, local jurisdictions, transit operators, rideshare agencies,
and other groups, has developed a statewide system of park-and-ride lots. These
facilities are designed to encourage commuters to change from driving alone to
carpooling, vanpooling, or taking the bus or train. Currently, approximately 226 lots are in operation. Of these, 95 provide rail or express bus service, while the
remainder are oriented toward local bus services, carpools, or vanpools. The
facilities range in size from small lots of 10 to 20 parking spaces, to large lots
averaging 800 to 1,000 spaces (23).
• Denver, Colorado. The Regional Transportation District (RTD) in Denver currently
operates 49 park-and-ride lots, with a total of approximately 9,500 parking spaces. Most of these are exclusive lots, with a few shared-use facilities. All are currently
served by buses and one is linked with the new LRT system (24).
• Phoenix, Arizona. Valley Metro, which serves the Phoenix area, currently uses 64 park-and-ride facilities accounting for some 2,462 parking spaces. Most of these are
shared-use lots located at shopping centers; however, a few exclusive lots are in use.
All facilities are oriented toward the bus system or ridesharing, and some lots
provide bicycle racks or bicycle lockers. Further, some of the lots are oriented to the 1-10 HOV lanes (24).
• Sacramento, California. A total of 15 park-and-ride facilities are operating in the Sacramento area. These lots, which are oriented toward the LRT system, bus services, and ride sharing activities, provide a total of 3,908 parking spaces. The Sacramento Regional Transit District (RTD) has nine park-and-ride lots, accounting
for 3,713 spaces, at stations along the LRT system. The largest is the Roseville
Road park-and-ride lot, which contains 1,087 parking spaces. Further, the RTD
operates two shared-use lots, with 39 spaces, along bus routes. The California
Texas Transportation Institute

Department of Transportation (Caltrans) operates and maintains four lots in the area,
with parking spaces for 156 vehicles (24).
• Seattle, Washington. Park-and-ride facilities represent an important element of the overall transportation system in the Seattle metropolitan area and the state of
Washington as a whole. Some 96 exclusive park-and-ride lots, providing almost
19,000 parking spaces, are in operation in King and Snohomish counties. Further,
approximately 42 leased park-and-ride lots, with some 2,079 spaces, are in
operation. Many of these facilities are oriented toward the HOV lane system in the
area and support both bus and carpool use. The park-and-ride system has been
developed through the cooperative efforts of the Washington State Department of
Transportation (WSDOT), King County METRO, Community Transit, and local
jurisdictions. To the south of Seattle, 19 lots, providing 1,998 parking spaces, are
located in the City of Tacoma and Pierce county. WSDOT, Pierce Transit, and local
jurisdictions are responsible for these facilities, which are oriented toward the bus
system and carpooling. Some 238 park-and-ride facilities are in use throughout the
State of Washington, accounting for a total of 28,793 parking spaces. WSDOT is
responsible for 121 of these lots, while transit systems operate 26 and other groups
have developed 91 facilities (23).
High-occupancy vehicle facilities, which offer priority treatments to buses, vanpools, and
carpools, focus on increasing the person-movement-rather than vehicle-movement-efficiency of a travel corridor. Currently in North America, approximately 50 HOV lanes are in operation
on freeways or separate rights-of-way in 22 metropolitan areas. Many more HOV projects are
in the planning, design, and construction stages (4).
The primary concept behind HOV facilities is to provide travel time savings and more
predictable travel times to buses, carpools, and vanpools. These two benefits serve as incentives for individuals to choose a higher-occupancy mode. Four general categories are usually used
to describe HOV facilities. HOV facilities in separate rights-of-way are roadways or lanes developed in a separate right-of-way and designated for the exclusive use of HOVs. HOV
facilities in freeway rights-of-way are physically separated from the general purpose freeway
lanes, either by concrete barriers or painted buffers, and used exclusively by HOVs. Concurrent
flow lanes are freeway lanes in the same direction of travel as the general-purpose lanes that are
not physically separated from the general-purpose lanes. Contraflow lanes are typically the
innermost lanes in the off-peak direction of travel, designated for exclusive use by HOV s
traveling in the peak direction. Plastic posts or pylons separate the lane from the off-peak
direction general-purpose travel lanes.
Texas Transportation Institute 13

Both Houston and Dallas have operating HOV lanes. A few examples of extensive networks of HOV lanes in other metropolitan areas in North America are provided next.
14
• Los Angeles and Orange County, California. Several HOV lanes are in operation in the Southern California area, and many more are in the planning, design, and
implementation stages. The San Bernardino Freeway (I-10) Busway operates from downtown Los Angeles to El Monte. The 2-lane, 2-direction facility is 13 miles in length. Open to buses, vanpools and carpools, the facility is supported by park-and
ride lots and transit centers at strategic locations. Currently, some 1,440 vehicles
carrying 7,100 passengers, use the facility in the peak direction during the morning peak hour. Other HOV lanes are currently in operation on Route 55, 1-405, Route
57, Route 91 and 1-5. Although bus services are operated on some of these
facilities, most are used by carpools (4,24).
• Ottawa, Canada. About 15 miles of an exclusive 2-lane, 2-direction transitway system is in operation in Ottawa, Ontario. This is part of a 19-mile, 26-station
Phase I system. An additional 19 miles is planned for the future. About 180 buses, carrying 11,000 passengers, operate on the facility in the peak hour peak-direction
(4,24).
• Pittsburgh, Pennsylvania. Two types of HOV lanes currently are found in the Pittsburgh area. Two, 2-lane, bus-only facilities, located in separated rights-of-way,
have been in operation since 1977 and 1983. The East Busway is seven miles and the South Busway is four miles. The opening of both facilities reduced bus travel
times from 25 minutes to 10 minutes on some routes. The East Busway currently carries some 6,000 passengers in 103 buses (4,24).
• Seattle, Washington. An extensive system of HOV lanes and supporting facilities and services are in operation in the metropolitan Seattle area. Major HOV lanes are located on 1-5, I-90, 1-405, and SR 520. Concurrent flow lanes are found on both the inside lane and the outside lane. Additional arterial street HOV treatments are also in place, including the downtown Seattle bus tunnel (4,24).
Texas Transportation Institute

RIDESHARE PROGRAMS
Most transit agencies, or, in some cases, special regional organizations, provide
ridematching, carpooling, and vanpooling programs for commuters who do not have access to
regular route services or who desire more flexibility in their commute. In addition, some
businesses provide in-house carpool matching services, vanpool programs, and other assistance to help employees share rides.
Ridematching involves the creation of match lists of potential carpool or vanpool
members based on their origins, destinations, and schedules. Most rideshare programs use
commercially available computer software programs or a specially designed system to provide
ridematching services. These systems use some type of geographic base to record and track
individual origins and destinations and to identify potential carpool matches.
An individual accesses the rideshare system by providing the necessary information over
the telephone or by mailing in a ridesharing application. An individual's origin, destination, and
travel times are matched by the computer with others in the database, and the individual is
provided with a list of possible carpoolers. The individual is then responsible for making contact
with prospective carpoolers. When the demand is large enough, vanpools may be formed. A
number of approaches are used to organize and operate vanpools. These include owner
operated, employer sponsored, and third-party arrangements.
A number of areas have implemented innovative approaches to attract more riders to
carpools and vanpools. Most of these focus on enhancing the convenience of ridesharing.
However, some programs are attempting to provide more personalized service to help
commuters form carpools and vanpools. Many of the approaches being tested focus on providing greater flexibility for those who may not be able to rideshare every day. A few of
these programs are summarized next.
GeoMatch RideMatching System-Portland, Maine. The greater Portland Council of
Governments has implemented a geographic information system (GIS)-based ridematching program. The system allows operators to quickly identify possible matches on a color
map. The system is also easy to use; operators can simply point and click for most
functions (25).
Antelope Valley/San Francisco Valley-Burbank, Los Angeles, California. Kaufman
and Broad, which is a large single-family home builder in Southern California, offers
Texas Transportation Institute 15
vanpools to residents of the Antelope Valley to job locations in San Fernando Valley,
Burbank, and Los Angeles (26).
Casual Carpooling, Washington D.C. and San Francisco. Casual carpooling is in use
in both the Shirley Highway corridor in the northern Virginia/Washington D.C. area and
on the Oakland Bay Bridge in the San Francisco area. In both cases, individuals are
forming informal carpools on a daily basis to take advantage of the travel time savings
afforded by the HOV facilities in the corridor. These activities occur without any formal
planning or sanctions by any agency or organization and were initiated by commuters.
Individuals wanting rides gather at park-and-ride lots and other locations and are picked
up by drivers going to the same destination. The vehicle occupancy requirement on the
Shirley Highway and the Bay Bridge HOV facilities is three or more individuals (4,24).
3M Vanpool Program-St. Paul, Minnesota. The 3M Company is often noted as the
leader of business vanpool programs. The 3M vanpool program was started in 1973,
primarily in response to the high cost of building additional parking facilities at the
company's headquarters in the eastern suburbs of St. Paul. At its peak during the energy
shortage of 1978 to 1980, some 135 vanpools were in operation. Currently,
approximately 100 vans are used by company personnel (27).
State of Connecticut Vanpool Incentives Program. The state offers comprehensive
assistance and incentive programs to encourage vanpooling. Working through the three
non-profit ridesharing organizations in Connecticut, the program provides financing for
the purchase of owner-operated vanpools. A partial rebate on the state gasoline sales tax
is also offered for vans operating in Connecticut (27).
GUARANTEED RIDE HOME PROGRAMS
The lack of backup transportation in the case of an emergency at home or the need to
stay late at work is often given as an important reason why many commuters do not use transit or ride sharing . Guaranteed ride home service is one approach that has been used in some areas
to overcome these concerns. The intent of guaranteed ride home programs is to provide a source of transportation for bus riders, carpoolers, and vanpoolers to use if their travel needs
change. The experience to date with guaranteed ride home programs indicates that employees use them only in cases of an emergency and do not abuse the benefit (27,28). Further, at least
16 Texas Transportation Institute

one study has shown that the presence of this type of program did help encourage bus use (27,28).
Guaranteed ride home programs take many forms and may be offered by transit and ride sharing agencies or through employers. Taxis, agency or company vehicles, or personal
automobiles may be used to provide the service (28). A few examples of these programs are summarized next.
U-Pass Program, University of Washington-The U-Pass Program offered by the University contains a number of elements, including a guaranteed ride home program. Faculty and staff who need to leave due to an emergency may call a taxi and be reimbursed for 90 percent of the fare for up to 50 miles a quarter (28).
Transamerica Life Company, Los Angeles, California-The Transamerica Life Insurance Company, which includes 3,000 employees at a site near downtown Los Angeles, has had a long history of vanpool and other related programs. A guaranteed ride home service is provided as part of the company's package to encourage greater use of all HOV modes. Vouchers for taxi service are given to employees who use HOV modes. The company pays for midday emergency trips out of their TDM program budget, while trips needed because an employee is required to work late are paid for out of departmental budgets (27).
BICYCLING AND WALKING
Bicycling and walking are not frequently used as commute modes due to a variety of factors. These include long distances between home and work locations, lack of safe and convenient bike or pedestrian paths, weather, and other barriers. Bicycling and walking may be appropriate commute modes in some areas, however. In addition to being the primary mode of travel, bicycling and walking can also be used to access other HOV modes and can be used for midday trips in a downtown area or a major activity center.
Improvements will be needed in most areas to accommodate greater use of bicycling and
walking. Physical improvements, such as bicycle lanes, sidewalks, bicycle and pedestrian paths, bicycle lockers, and improved lighting may be necessary in many areas. On-site amenities,
including showers and changing facilities, may also be needed. Examples of the use of these two modes for regular commuting are highlighted next.
Texas Transportation Institute 17

University of California at Davis. The University has encouraged bicycle use on campus since the 1960s by providing extensive bicycle lanes and other support facilities. High parking fees further encourage bicycling, and enforcement of both bicycle
registration and traffic laws has helped to minimize automobile traffic and maximize bicycling (27).
Boulder, Colorado. Boulder actively supports a pedestrian-friendly environment and
encourages alternative commute modes, including bicycling and walking. Extensive
sidewalks and pedestrian pathway systems encourage walking to stores, entertainment and
transit centers. A city-funded Alternative Transportation Center and Pedestrian Systems
Coordinator continue to explore possibilities for pedestrian, bicycle and public transit
use. Boulder also hosts an annual International Pedestrian Conference (2).
Warner Center Transportation Management Organization (TMO)-Woodland Hills,
California. The Warner Center TMO serves a mixed-use suburban center to the west
of Los Angeles. The TMO uses a number of mechanisms to actively promote
commuting by bicycle. These include a newsletter, a Bike Buddy program to introduce
new cyclists, safety and bicycle maintenance seminars, special bicycling events and
promotions, discounts at local bicycle stores, and on-site lockers and shower facilities (27).
EMPLOYER INCENTIVES
Employer incentives are often used to encourage alternative commute modes and other
strategies. Experience indicates that most successful programs involve some type of employer
support or incentives (27,29,30). These might include providing on-site bus information and ridematching services, subsidizing transit passes, providing company vanpools or paying part of the cost of vanpooling or carpooling, and providing bonuses or cash payments to employees who use alternative modes. A few examples of incentives currently being used by businesses throughout the country are provided next.
18
• Payments for HOV Use-Commonwealth Land Title Company, Glendale, California. Commonwealth has a multifaceted program to encourage alternative
commute modes that includes ridematching services, a guaranteed ride home
program, and subsidies for transit use and ridesharing. The company pays
employees $1 a day for each day they use transit, $1 a day for participating in a 2
Texas Transportation Institute

person carpool, $2 a day for a 3 person carpool, and $4 a day for a 4 person carpool (31).
• Promotions for HOV Use-Allergan, Irvine, California. The 1,300-employee Allergan company, located in Irvine, subsidizes employee vanpools and bus passes,
and provides other bonuses for employees who use alternative modes. These include
bonus holidays, drawings for vacation trips and free gas, and other promotions (27).
• Transit Pass Subsidies and Transit Checks. Numerous public agencies and private businesses throughout the country subsidize employee transit passes. A new
approach that has been tested in a few areas recently is the use of transit checks. The Metrocheck program operated by the Washington Metropolitan Area Transit
Authority (WMATA) provides one example of this. Metrocheck is an exchange fare voucher system that is good on rail, bus, and vanpool services in the Washington,
D.C. area. Metrochecks have been marketed extensively with businesses and agencies, who provide them at a discount to their employees.
ON-SITE AMENITIES
The provision of on-site amenities is another approach that can enhance the use of
alternative commute modes. On-site amenities may include showers and changing areas for employees who walk or bike to work, shelters for transit riders, and improved lighting and
pathways. They may also include the provision of lunch, banking, and other services on-site
or close by for employees who used an alternate mode and do not have an automobile available.
These types of facilities and amenities are especially important in suburban areas where office complexes are often isolated. Examples of the current use of on-site amenities are highlighted
next.
On-Site Services-Allergan Company, Irvine, California. This company provides a convenience store, cafeteria, banking facilities, postal service, and exercise facilities onsite to reduce the number of trips their employees need to make downtown (27).
Shower and Changing Facilities-Xerox, Palo Alto, California. The Xerox Company
provides shower facilities, personal lockers, and a covered bicycle storage area for
employees who cycle to work (27).
Texas Transportation Institute 19

PARKING MANAGEMENT
Numerous studies have shown that the availability, cost, and accessibility of parking has
a significant influence on mode choice (32,33,34). Individuals are more likely to drive alone
when convenient, and reasonably priced parking is available. When parking is expensive or
located far from an employee's work site, transit and ridesharing may be more attractive
alternatives. Some employees also receive subsidized parking, which may further encourage
driving alone. As a result, parking management strategies are being used in some areas to
encourage greater use of alternative commute modes.
A variety of techniques are included under the broad heading of parking management.
These may include limiting aU-day parking, strictly enforcing parking regulations, providing
fringe parking to facilitate transfers to transit, and providing preferential parking spots for
carpools and vanpools. Pricing strategies may also be used. These could include eliminating
parking subsidies, raising parking charges, and providing employees with transportation
allowances which can be used for various purposes. Examples of different parking management
programs are highlighted next. It is important to note that alternatives to driving alone must be
provided in concert with the parking programs.
20
• Downtown Parking Regulations to Encourage HOV Use-Portland, Oregon.
Portland has taken an active role in using parking, land use, and development
requirements to encourage the use of alternative commute modes. For example, the
city does not provide long-term parking in the downtown area and limits the amount
private developers can build. The city does provide short-term parking on the edge
of the downtown and use of buses and LRT is free in a downtown zone. Portland
limits the number of parking spaces allowed for commercial and public buildings,
permitting 0.7 to 1.0 spaces per 1000 square feet of building space, depending on
the building's proximity to transit facilities. Forty-three percent of Portland
commuters use transit, with another 17 percent using carpools (27,35).
• Parking Discounts for Carpools and Vanpools-Seattle, Washington and
Minneapolis, Minnesota. Seattle provides parking rates for carpools at two
downtown facilities. In Minneapolis, three parking garages were built on the edge
of downtown as part of the 1-394 HOV system project. Reduced parking rates are
provided for carpools and vanpools, and a direct access ramp connects the HOV lane
into the garages (27,36).
Texas Transportation Institute

WORK SCHEDULE MANAGEMENT
The use of alternative work schedules can help spread the time people start and stop
work, thus spreading the demand on the transportation system by alternating the time people travel to and from work. These strategies can help to ease congestion without requiring large
investments in additional transportation facilities. Employers have also found that alternative work schedules help increase productivity and provide a benefit many employees find attractive
(30). The three most common alternative work strategies-compressed work weeks, flextime, and staggered hours-are briefly described next.
• Compressed Work Week. The most common compressed work week arrangement consists of a four day work week composed of ten hour days. Employees thus
complete the normal 40 hour work week while eliminating one day of work-and
thus commuting-entirely. Other variations include maxiflex arrangements, which
allow employees one extra day off every two weeks, and an arrangement with nine hour days incorporated into nine work days during a two week period. In addition
to reducing vehicle miles of travel each week, compressed work weeks spread the normal peak commute times out due to the ten hour work day.
• Flextime. Flextime allows employees to choose their daily work schedules within
certain guidelines. For example, employees may be allowed to start work anytime
between 7 A.M. and 9 A.M., as long as they put in a complete eight hour day.
Employees are allowed to vary their arrival times from day to day with flextime.
• Staggered Work Hours. Staggered work schedules allow employees to select their own work schedules within pre-set limits. In contrast to flextime, work schedules remain the same once selected. For example, some employees may work 8:00 A.M.
to 5:00 P.M. schedules, while others work from 7:30 A.M. to 4:30 P.M.
The final work schedule management approach is telecommuting, which allows employees to work at home or at an alternative work site one or more days a week. Employees
may be connected to the office by computer, modem, and/or fax machine, or they may simply be working on projects that do not require them to be in the office. There are several different
forms of telecommuting, including work-at-home arrangements, satellite work centers, and
neighborhood work centers. The obvious benefit of telecommuting is that it eliminates or
shortens the home-to-work trips for participating employees. Additionally, employees enjoy
personal advantages from working at home at their own pace. The impacts of telecommuting
Texas Transportation Institute 21

on the transportation system and the issues commonly associated with telecommuting are being examined in a separate research study (37).
CONGESTION PRICING
Congestion pricing focuses on the concept of charging travellers for the use of roadways.
The exact charges would be related to congestion levels to discourage drivers from using
roadways during peak times of the day. The intent is to discourage single-occupant commuting
and encourage commuters to use transit, ridesharing, or to switch to off-peak travel. Many
transportation economists favor this approach because it reflects charging for the use of roadways and more efficiently uses society's economic resources, including both the capital
invested in roads and the time motorists spend commuting. Economists hold that these resources would be used more efficiently if travel could be shifted from peak to non-peak hours.
Congestion pricing would also provide a monetary incentive for those commuters who must travel during peak hours to rideshare or use transit and could provide a new revenue source for
transportation improvements (38).
A number of concerns have been raised with congestion pricing, primarily relating to equity and efficiency. Equity concerns relate to the possibility that congestion pricing permits
high income individuals to travel at the most convenient times, while those with lower incomes cannot afford peak-hour tolls. Criticisms related to the inefficiency of congestion pricing
schemes arise from questions regarding the actual collection and enforcement of tolls. Both of
these concerns could be addressed through providing low-income individuals with vouchers and
the use of new technologies such as automatic vehicle identification (A VI) to streamline toll
payments.
Congestion pricing has not been used in the United States to date and has had only limited applications in other parts of the world. The Intermodal Surface Transportation Efficiency Act (ISTEA) of 1991 did provide funds for congestion pricing demonstrations, and
possible projects are being considered at this time. These include varying time of day tolls on the San Francisco-Oakland Bay Bridge and charging single-occupant vehicles for use of the
Route 91 HOV lane in Orange County, California. As summarized next, one congesting pricing
project was tested in Hong Kong.
22
• Hong Kong. A test of this concept in Hong Kong included charging for use of
roadways during different times of the day and tracked drivers who did not pay.
Texas Transportation Institute

Closed circuit television cameras photographed the rear license plates of such
vehicles. The photos were then transmitted to the system's control center, along with data on where and when the violation occurred. The Hong Kong
demonstration, which lasted eight months, indicates that congestion pricing can be
done with toll collection and enforcement using existing technologies.
LAND USE PLANNING AND DEVELOPMENT REGULATIONS
Enhancing the coordination between land use and transportation planning can help support
the utilization of alternative commute modes and other strategies. Development regulations and
design practices can also encourage HOV use. A number of different approaches and techniques
are being used throughout the country. These include growth management, comprehensive
planning, land use and zoning controls, and joint development. Many of these strategies have
been examined in other TTl research projects (5,39,40). An overview of the various approaches
is provided next; more detailed descriptions can be found in the previously cited reports.
• Growth Management. The concept of growth management emerged primarily in
response to concerns in areas experiencing rapid growth, as well as those on the
fringes of such areas. Growth management focuses on controlling the pattern, type,
intensity, location, and timing of development. Growth management policies can
encourage HOV use through more compact urban development patterns, thus helping
to alleviate urban sprawl and its subsequent long distance commutes and increased
dependence on the automobile. Growth management policies can be pursued at the
state, regional, or local level. A number of states, including Washington, Oregon,
Colorado, California, Florida, Maryland, and New Jersey, have enacted state-wide
growth management legislation. Tools for implementing growth management
strategies include mandatory comprehensive plans, local capital facilities plans, adequate public facilities ordinances, impact fees, establishment of urban growth
boundaries, trip reduction ordinances, and criteria for jobs/housing balance (5).
• Comprehensive Planning. Comprehensive plans, which provide a long-range vision for the development of an area, can also help promote alternative commute modes.
Comprehensive plans address transportation, housing, employment, recreation,
schools, community facilities, water and sewer, and other community elements. The
comprehensive planning process can help coordinate these elements and can promote
development patterns more conducive to alternative commute modes. Linking
Texas Transportation Institute 23

comprehensive planning to capital facility plans further helps ensure coordination
between land use and transportation elements.
• Land Use and Zoning. Land use policies and zoning ordinances are two tools used to implement comprehensive plans. Specific techniques include transit zoning
districts, mixed use zoning, special commercial zones, transition zones, pedestrian
priority zones, incentive zones, floating zones, transit easements, land banking, and
transfer of development rights. All of these approaches can enhance transit and
pedestrian access to developments, further encouraging alternative commute modes.
• Joint Development. The joint development concept focuses on developing public transit facilities in conjunction with the private sector. Joint development has the
potential to provide benefits for both public transit systems and the private sector.
These benefits may include increased revenues to the transit system through lease or
rental payments, reduced costs for property, increased ridership levels, promotion of economic development, or redevelopment, encouragement of transit compatible
land use, and support for local and regional policies (40).
PUBLIC AWARENESS CAMPAIGNS AND ORGANIZATIONAL STRUCTURES
Commuters must be made aware of alternatives and options before they can be expected
to use them. There is also often a need to educate and inform the general public and policy
makers about the problems associated with increasing traffic congestion, declining air quality
levels, and mobility concerns. Public awareness campaigns and ongoing education and outreach
efforts are being used in a number of areas to promote alternative commute modes. A few examples of these programs are provided next.
24
• Clean Air Month Campaign-Orange County. This ongoing annual effort is sponsored by the Orange County American Lung Association Chapter, along with businesses and public agencies in the area. It includes a mix of activities and
programs aimed at increasing the awareness of the general public about traffic
congestion and air pollution, and promoting alternative commute modes. Activities
include a 5K walk, a children's poster contest, a bike-to-work day, a clean commute
day, corporate competitions and awards, and other efforts (41).
Texas Transportation Institute

• HOV Facilities-I-394, Minneapolis, Minnesota. A major marketing and public information program was undertaken to introduce the Minneapolis-St. Paul Metropolitan area to the HOV lane concept and the components of the 1-394 project. All types of media were used in the effort, including radio, television, and newspaper advertising: press tours and press releases; 'direct mail; a telephone
information number; billboards; bus signs; special events; and bus and rideshare promotions (36,42).
Many areas are also using new organizational structures to develop and implement
programs to encourage alternative commute modes and to address other needs. A common approach is to bring public and private sector groups together into a new organization, often
referred to as transportation management organizations or transportation management associations (TMOs/TMAs). Representatives from major employers and developers, local
communities, state departments of transportation, and transit authorities are typically involved in TMOs/TMAs. The purpose of these organizations is to work together to address community
transportation issues and concerns. In addition to planning on a general scale, TMOs may help facilitate the implementation of ride sharing and transit services to private employment sites and
serve as a forum for public/private discussions on local transportation improvements. The following are examples of TMOs and TMAs in use throughout the country.
• Warner Center TMO-Woodland Hills, California. The Warner Center TMO encompasses a suburban mixed-use employment center in Woodland Hills,
California, 20 miles west of Los Angeles. The TMO provides a number of services to its members including ride sharing programs, transit marketing, a comprehensive
bicycling program, and other activities (27,30).
• Bellevue Downtown Association-Bellevue, Washington. The Bellevue Downtown Association provides a mix of services to businesses and public agencies in Bellevue, Washington, which is located to the east of Seattle. The Association promotes transit and ridesharing, provides ridematching services, and has worked with King County Metro for service enhancements and a transit center (30).
• Greater BWI Commuter Transportation Center-Baltimore, Maryland. This TMO serves the suburban Baltimore area around the BWI airport. It is one of the older TMOs in the country and provides a wide range of services. These include
rideshare promotions, newsletters, coordinating transportation improvements, guaranteed ride home programs, and other activities (30).
Texas Transportation Institute 25

COMPREHENSIVE APPROACHES
Many areas utilize a combination of the strategies and programs described previously.
Realizing that no single approach can meet the needs of diverse market segments, most programs attempt to offer a mix of services. It appears that the most successful programs provide a
comprehensive package of services to reach mUltiple markets. The following case studies
provide a few examples of comprehensive approaches.
26
• GO Boulder Program-Boulder, Colorado. The Greater Options Boulder (GO
Boulder) program was created by the City Council in 1989. The multifaceted
program offers information and programs to encourage transit use, ridesharing,
bicycling, walking, alternative work schedules, and telecommuting. GO Boulder
also offers transit passes for the University of Colorado and high school students,
and sponsors events such as Bike Week, Find Another Way Day, and the annual
national pedestrian conference. Information on alternative commute modes is also
provided to realtors to help introduce new residents to the various programs (43).
• U-Pass Program-University of Washington. The U-Pass Program, which was
implemented at the University of Washington in 1991, provides a wide range of
commute options for the 50,000 students, faculty, and staff at the Seattle campus.
Students pay $20 a quarter and faculty pay $27 for a sticker which is attached to an individual's University identification card. This sticker allows the individual to use
bus services provided by Seattle Metro and Community Transit, free carpool parking
spaces, ridematching services, University shuttle bus services, a guaranteed ride
home program, and discounts at participating merchants. The program has been very popular and is well utilized. An evaluation of the U-Pass Program indicated
that it has reduced the number of single-occupant vehicle trips to the campus by 15 percent and has increased transit ridership and carpooling (44).
Texas Transportation Institute

III. STATE OVERVIEW
This chapter provides a summary of the approaches currently being utilized in Texas to
encourage HOV commute modes, walking and bicycling, and other strategies to reduce demand
on the transportation system. The information presented in this chapter comes from a number of sources. First, available reports, documents, and newsletters from agencies and groups
throughout the state were reviewed. Additional information on specific programs was obtained from follow-up telephone calls to representatives from public and private sector groups. Second,
information was reviewed from the Employer Trip Reduction (ETR) Plans submitted by
employers in Houston to the Texas Natural Resource Conservation Commission (TNRCC).
Finally, five discussion groups were held with representatives from the public and private sectors
in Houston, Dallas, and Austin.
This chapter summarizes the results from these activities. An overview of information
collected from the Houston ETR plans and the discussion groups is presented first. This is
followed by a review of the various activities within Texas and the general level of support for
different approaches. The same twelve categories used to describe the national activities are
used to summarize efforts within the state.
EMPLOYEE TRIP REDUCTION PLANS
Houston is classified as a severe ozone non-attainment area by the Environmental
Protection Agency (EPA). The 1990 Clean Air Act Amendments require employers with over
100 employees to develop, implement, and monitor plans and programs to increase vehicle
occupancy levels and to reduce the number of commuters driving alone. Companies in Houston had to conduct surveys of employees to identify current commute modes and travel preferences, and develop plans outlining how they would meet the required average vehicle occupancy (A VO)
levels. These plans were submitted to TNRCC on various dates in 1994 depending on the size of the company.
TTl was able to make copies of the approximately 1,400 plans submitted to TNRCC. The information in the plans is being analyzed to assist with a number of research efforts,
including this study. Although the regulations governing the employee trip requirements are
being reevaluated, the plans contain a wealth of information on the alternate mode preferences
of approximately 400,000 employees in the Houston area and the programs proposed by
employers to increase the use of alternative commute modes.
Texas Transportation Institute 27

As shown in Table 1, the most popular measures noted by employees were guaranteed ride home programs and various flexible work schedules. Also rated favorable by at least 20 percent of the employees were employer subsidies for carpools, vanpools, and bus passes, parkand-ride bus service to the work site, and ridematching services. The responses are discussed
in more detail under the individual strategies later in this chapter.
Table 1. Alternative Mode Preferences-Houston Employees*
Incentive or Measure Percentage of
Employees Favoring
Guaranteed ride home 39% 4/40 Compressed work week 39% Variable/flexible work hours 29% Employer pay some/all of vanpool/carpool costs 34% Carpool/vanpool matching 21 % Employer pay all/some of bus pass 20% Park-and-ride bus service to work site 20% Telecommuting 19% 9/80 work week 16% Preferential parking for carpools/vanpools 16% Local bus service to your work site 16% Employer provided vehicle for midday business trips 13% Midday shuttle bus to shopping/dining areas near your work site 12% HOV lanes 12% Cafeteria on-site 12% 3/36 work week 12% Increase costs for parking 11% Banking facilities on site 11% More information on bus routes 10% Late evening bus service 10% Day care on-site 8% On-site showers/lockers for walkerslbikers 8% Biking commuting incentives 6% Secured bike racks 5% Walking incentives 4%
*Information obtained from Employer Trip Reduction Plans submitted to TNRCC. Approximately 400,000 employees are represented in responses.
28 Texas Transportation Institute

Employers were also required to identify in the ETR plans the services, incentives, facilities, and information they intended to provide to employees to encourage alternative commute modes. Any changes in company or agency policies needed to implement the ETR program also had to be outlined. Table 2 summarizes the major services and programs employers are currently offering, as well as those they intend to provide under the ETR
requirements. The percentage of companies planning to offer each strategy is presented, along
with the status of each effort. The percentage of employers indicating existing, revised, and new
programs are noted.
The existing and proposed use of different strategies are described more extensively in
the next sections. It is interesting to note, however, that the most frequently cited measures
relate to information, marketing, and employee services. Fewer employers included changes
in policies, incentives, and new facilities or equipment in their ETR plans.
DISCUSSION GROUPS
A series of discussion or focus groups were conducted to obtain additional insights into
the factors that influence the travel behavior and the mode choice of commuters in Texas. The purpose of these meetings was to obtain information on the strategies currently being used by
public agencies and private businesses to encourage greater use of HOVs by their employees. The application of other programs and policies identified through the national review were also
discussed, along with potential issues and barriers associated with various approaches. Thus,
information was obtained from the participants on current approaches, as well as reactions
toward possible strategies.
Discussion groups were held with representatives from the public and private sectors in Houston, Dallas, and Austin. Existing organizations and committees in the three cities were used to help organize the discussion groups. A discussion group script was used to facilitate input from participants in the sessions. A copy of the script used with private business groups is provided in Appendix A, and a copy of the public agency script is provided in Appendix B.
The script and a stamped return-addressed envelope was also given to participants at the end of the session to provide additional opportunities for comment on the various strategies. The
following six discussion groups were held during this phase of the research study. Appendix C
provides a listing of the participants in each of the discussion groups.
Texas Transportation Institute 29

Table 2. Summary of Trip Reduction Measures Currently Offered or Planned by Houston Employers*
Strategy Plan to Offer as Existing Revised
Part of ETR Plan Program Program
Employee Service Commute information center 64% 10% 1% Guaranteed ride home program 55% 8% 2% Mail services 55% 47% 1% Personalized assistance 50% 6% 0 Banking services 38% 30% 0 On-site transit pass sales 33% 13% 1% Child care information 28% 15% 1% Dry cleaning arra~ements 12% 9% 0 Midday shuttle to ood shopping 9% 6% 0 Shuttle to park-and-ride lot 5% 1% 0
Incentives Recognition 34% 1% 1% Subsidies 24% 1% 0 Monetary rewards 23% 1% 0 Time rewards 6% 1% 0
Facilities/Equipment Lunchroom/food service 60% 57% 1% Clothes lockers/changing rooms 41% 37% 2% Shower facilities 34% 30% 2% Bicycle parking 32% 18% 1% Bus shelters 15% 13% 0 Home office equipment 12% 9% 0 Exercise equipment 9% 7% 0 Child care 2% 1% 0
Information/Marketing Posters 82% 23% 1% New employee orientation 80% 18% 9% Flyers 66% 16% 1% Brochures 64% 15% 1% Transit schedules 56% 14% 1% Pay envelope stuffers 43% 12% 1% Newsletters 42% 21 % 5% Special events 33% 5% 1% Give-aways/promotional items 27% 2% 0 Prize drawings 21% 1% 0
E~loy'er Policies F eXlble work hours 47% 26% 4% Compressed work week 43% 15% 4% Late meetings/overtime policy 32% 9% 3% Parking management 28% 7% 1% Telecommuting 22% 8% 1% Leave early privilege 9% 3% 1%
New Program
51 % 43% 5%
39% 3% 19% 11% 3% 3% 3%
29% 18% 19% 4%
1% 2% 2% 12% 2% 2% 1% 1%
54% 49% 46% 45% 38% 27% 13% 24% 23% 19%
15% 22% 18% 16% 13% 4%
*Information obtained from Employer Trip Reduction Plans submitted to TNRCC. Approximately 1,200 employers are represented. Responses from some 200 Independent School Districts (ISDs) are not included.
30 Texas Transportation Institute

• Dallas-Greater Dallas Area Chamber of Commerce Transportation Committee.
• Dallas-North Central Texas Council of Governments (NCTCOG) Surface Transportation Technical Committee and Travel Demand Management Task Force.
• Houston-Transportation Management Organization Coalition (TMOC).
• Houston-Houston Galveston Area Council (HGAC) Technical Advisory Committee.
• Austin-Voluntary Trip Reduction Program (V-TRIP).
Although differences exist among the comments made by participants in the various
discussion groups, a number of common themes emerged. For example, participants voiced
stronger support for voluntary efforts rather than mandatory measures. Increased transit services
and more innovative service applications, ride sharing programs, guaranteed ride home programs,
alternative work schedules, and special programs on ozone alert days were all supported by
participants in the sessions. Noted as important by some, but not all, participants were on-site
amenities for bus riders and bicycles, and preferential parking for carpools and vanpools. Little
support was expressed for pricing strategies-such as roadway congestion pricing, increasing
parking rates for single occupant vehicles, and raising the gasoline tax.
Two other common themes emerged from the discussion groups. First, participants in
all groups stressed the need to raise awareness among the public and policy makers about the
issues associated with traffic congestion, mobility, and air quality. Support was voiced for
public education programs, as well as efforts targeted toward specific groups such as decisionmakers, commuters, and businesses.
The second common theme from the discussion groups related to the role top
management support plays in successful programs. Involvement from the head and key
administrators of public agencies and private business was identified as critical to the success
of different strategies. Obtaining the support and encouragement from management and decision-makers was stressed as an important step.
The information obtained from all the sources noted previously-reports from agencies, follow-up telephone calls, the ETR plans, and the discussion groups-is described in more detail in the remainder of this chapter. The Texas experience is presented by the 12 general categories of strategies outlined in Chapter II. Examples of the use of different approaches are provided
as appropriate.
Texas Transportation Institute 31
TRANSIT SERVICES
Participants in all of the discussion groups favored continuing existing transit services, expanding current systems, and implementing new services. Discussion group participants expressed general satisfaction for transit services provided to the downtown areas in all three
metropolitan areas. New and innovative services were noted as needed to better meet travel patterns in suburban areas. Additional transit services were also favored by 16 to 20 percent
of the Houston employees responding to the ETR surveys.
Express bus routes, park-and-ride services, and local services were all supported by discussion group participants. Individuals noted that good levels of service are currently provided from most areas to the downtowns. The HOY lanes in Dallas and Houston, and the new LRT system in Dallas, were noted as important techniques to encourage HOY use. Many participants expressed the need to continue to explore and implement innovative transit services to address travel needs in suburban areas, as well as to the downtowns. Reverse commute services, suburb-to-suburb routes, and other targeted services were a few examples suggested by participants for further consideration.
A number of examples of successful transit services were identified by participants in the discussion groups and through other information. These included the following traditional approaches and more recent innovative techniques.
32
• Premium Express Service-Houston METRO. METRO operates premium express bus services out of a number of park-and-ride lots in the Houston area. Over-theroad coaches are used and the service operates on the HOY lanes, providing significant travel time savings and travel time reliability. In addition, frequent service-with peak hour headways averaging 2 to 3 minutes-is provided. Most service is oriented to downtown Houston, but a few routes provide service to the Texas Medical Center, Greenway Plaza, and the Post Oak/Galleria areas.
• Express Service-Capital Metro and DART. Both Capital Metro and DART operate express and limited stop service from suburban locations into downtown Austin and downtown Dallas, respectively. The DART service in the East R. L. Thornton corridor uses the HOY lane on that facility.
• Crosstown Routes-DART. The Dallas Area Rapid Transit District (DART) has implemented a number of crosstown routes, many focusing on suburban areas.
Texas Transportation Institute
DART is currently reviewing its route structure to provide additional crosstown routes and feeder services to the new LRT line.
• Green Line Express-Houston, METRO. The Green Line Express, which provides service from the Kingwood Park-and-Ride lot to the Greenspoint Business District, was initiated in 1994. The service was developed and implemented through
the cooperative efforts of METRO and six businesses in the Greenspoint area. The cost of the service is being shared by METRO and the businesses. The six employers contributed $38,000 to help subsidize the first year of service, and
METRO is providing a subsidy of up to $2.50 per passenger trip. Passengers pay a $90 monthly fare for the 42 mile round trip service. Ridership averaged 30
passengers over the ftrst six months of operation.
• Jitneys-Houston METRO. METRO has recently implemented a program using Jitneys to provide service in some areas of Houston. Possible areas for the service
were identifted through a collaborative process between METRO and potential
operators. METRO then issued a request for proposal (RFP) and selected operators
for various areas. METRO sets the fare levels and subsidizes the operators. The
program has been in operation since the spring of 1995.
• Sunrise Service-Capital Metro. This service, which was implemented in 1995, allows customers to ride Metro buses during what were previously dead-head
portions of routes. These time periods are usually in the early morning as buses are
traveling from the operations facility to the start of a run. The service was started in response to suggestions from passenger surveys, which indicated a need for early
morning crosstown service from the area around Capital Metro's operations facility.
Participants in all of the discussion groups expressed interest in expanding transit services. For example, the Houston private sector discussion group voiced support for additional bus service to the Post Oak/Galleria area, Greenspoint, and other major non-downtown activity centers. The Austin discussion group noted the lack of good bus service to the Riverside area as an issue. In the same session, representatives from TNRCC indicated that they were working with Capital Metro on possible subscription bus and shuttle services to their offtces which
currently do not have any service. Capital Metro's guidelines require an initial ridership of at least 25 passengers to initiate subscription bus service. In response to a survey of TNRCC
employees, 300 people indicated an interest in some type of bus service and 50 attended an
initial informational meeting. Capital Metro responded to this demand and recently implemented
Texas Transportation Institute 33

subscription service from two park-and-ride lots to the TNRCC offices. Some 50 employees are currently using the service.
The Houston ETR plans also indicated support for additional transit services from both
employers and employees. Approximately 20 percent of the employees included in the ETR plans indicated a preference for park-and-ride service to their work site, while 16 percent supported local bus service, 12 percent indicated a need for midday shuttle busses, and 10 percent wanted additional late night service.
SUPPORT FACILITIES
As noted in Chapter II, the provision of supporting facilities-such as park-and-ride lots,
HOV lanes, transit centers, light rail transit (LRT), and other elements-can enhance the use of
alternative commute modes. Many of these facilities are found in Texas cities. For example, as highlighted next, park-and-ride lots are currently used by transit systems in all of the major
metropolitan areas in Texas.
34
Austin, Texas-Capital Metro currently operates three exclusive park-and-ride lots in the
Austin area, which provide a total of 650 parking spaces, as well as eight shared-use lots.
One fringe parking lot, located on the edge of the downtown area, is connected to the downtown "Dillo" circulator service, and another facility is coordinated with CARTS,
the rural operator in the area, allowing riders to transfer between the two systems. All of these facilities are oriented toward the bus system. A new park-and-ride facility,
which will contain 250 parking spaces, is scheduled to open by 1996. A number of parkand-pool lots, constructed and maintained by TxDOT, are also provided in outlying
portions of the metropolitan area.
Dallas, Texas-The Dallas Area Rapid Transit (DART) currently operates 16 formal and four shared-use park-and-ride lots within its service area, providing a total of almost 9,600 parking spaces. Additional park-and-pool lots have been developed in the metropolitan area by TxDOT. Currently, all of these facilities are oriented toward the bus system or ridesharing. An additional three lots with 2,000 spaces are being planned as part of the bus system and nine park-and-ride lots are being developed with the new
LRT system.
Houston, Texas-Currently, 39 park-and-ride and park-and-poollots are in operation in
the Houston metropolitan area. These include 21 existing park-and-ride lots, 7 transit
Texas Transportation Institute

centers with park-and-ride facilities, and 11 park-and-pool lots, all of which provide
approximately 27,000 parking spaces. Planning for five additional park-and-ride and five
park-and-pool facilities is underway. The park-and-poollots have been developed either
jointly by TxDOT and Houston METRO or by METRO alone. All of the park-and-ride
lots are exclusive facilities focused on bus service, and most are large lots located
adjacent to the five operating HOV lanes. Fourteen of the lots, with head ways the
largest of which is the Kuykendahl park-and-ride lot along the 1-45 North Freeway,
contain spaces for between 950 and 2,246 automobiles each. Direct access to the HOV
lanes is provided from most of these facilities. Frequent bus service is provided from
most lots, averaging around 5 minutes or less during peak hours. At the largest lots,
peak-hour headways average 3 minutes or less, and limited midday service is provided
using mini-buses.
High-occupancy vehicle lanes are in use in Houston and Dallas. As summarized next,
these systems are also linked with park-and-ride lots, transit centers, and service improvements.
The Dallas Area Rapid Transit (DART) is also constructing a new light rail transit (LRT) line.
• HOV Lanes and Supporting Facilities-Houston METRO. HOV lanes are in
operation on five radial freeways in Houston. These facilities account for about 103
kilometers of a planned HOV system. The HOV lanes are primarily one-lane,
reversible facilities located in the freeway median. The lanes are separated from the
general purpose lanes by concrete barriers. The HOV lanes are supported by an
extensive system of park-and-ride lots, transit centers, and premium bus services. An
HOV lane is under design in a sixth corridor and extensions to existing lanes are
under construction in several other corridors.
• HOV Lanes-DART. A contraflow HOV lane, using a moveable barrier, is in operation on the East R. L. Thornton Freeway (1-30E) in Dallas. The lane, which
operates only in the morning and afternoon peak-periods, takes a lane in the off-peak
direction of travel and designates it exclusively for use by HOVs traveling in the peak
direction. The facility represents the first use in the United States of a moveable
barrier with an HOV facility. The East R. L. Thornton Freeway HOV lanes represent just the first of a number of planned HOV lanes in the Dallas area.
• Light Rail Transit (LRT)-DART. An LRT system is under construction in the
Dallas area. The 20-mile LRT starter line represents a major component of the
DART 20-year plan. The initial system provides radially-oriented LRT lines
connecting the Dallas Central Business District (CBD) with major activity centers to
Texas Transportation Institute 35

the north and to the south. Provisions for system expansion have also been provided.
The LRT starter line includes both at-grade and tunnel sections. Further, it includes LRT stations, 3 transit centers, and a vehicle maintenance building. The initial LRT
line is scheduled to be operational by late 1996.
Participants in the discussion groups reacted favorably to the developm~nt of additional support facilities. Extending existing HOV lanes and constructing new lanes in Houston and
Dallas were viewed positively. The use of park-and-ride lots, direct access ramps, LRT, and other facilities were also supported. Similar support was also indicated by employees in
Houston. Twelve percent of the employees responding to the ETR plan survey indicated a
preference for additional HOV lanes.
RIDESHARE PROGRAMS
Rideshare programs-focusing primarily on carpooling and vanpooling-were rated highly
by the discussion group participants, and by Houston employees responding to the ETR surveys. Although ridesharing was suggested as an appropriate approach for all areas, it was noted as
especially important in areas that do not have bus service. Most participants indicated they
utilize the rideshare programs offered through their local transit agency, although some use
company programs or coordinated efforts among employers. For example, in Houston, only 6
percent of the companies submitting ETR plans currently offer in-house ridematching services.
Advantages to the identified rideshare programs included employees familiarity with these
approaches, the relative ease to set up and operate rideshare efforts, and the flexibility provided
by ridesharing. Concerns were raised, however, related to liability and confidentiality. For example, some companies ask employees to sign a waiver form before using any type of
ridematching service. Other participants noted that their employees are matched only with others in their company, unless an individual specifically requests to be included in the regional pool.
A few participants suggested that incentives such as preferential parking, subsidies, additional vacation time, or other benefits may need to be provided to obtain higher levels of carpooling and vanpooling. For example, some of the petrochemical companies in Southeast Houston have linked staggered and flexible work hours with ridesharing, since employees
consider these a benefit. Only individuals ride sharing are eligible for flexible work schedules.
Discussion group participants in Houston and Austin expressed interest in the vanpool
initiatives provided by Houston METRO and Capital Metro. Support was also voiced for other
36 Texas Transportation Institute
innovative approaches, such as casual carpooling, real-time ridematching, and providing commuters with current traffic and transit information.
The following examples of region-wide and company or area based rideshare programs
were highlighted in the discussion groups.
• Vanpool Program-Capital Metro. The Ridefinders vanpool program offered by Capital Metro utilizes leased vehicles from a van service company. Vanpool riders pay a monthly fee of $10 for vanpools within the Capital Metro service area. Fees
for vanpools outside the service area are based on round trip mileage and the number of riders. Van pool riders are also provided with a bus pass for use on any Capital
Metro route.
• METROV AN-Houston lVIETRO. In late 1994, Houston METRO implemented a
new vanpool program. Called METROV AN, the program includes three different
elements or options for employers. First, METRO will match employer funding of
vanpool cost up to $35 a month for up to four months. Second, METRO will match monthly employer vanpool subsidies up to $35 per rider. Finally, METRO will pay
$10 toward the RideHome program. The METROV AN program has been well
received by employers and employees. As of mid-1995, 35 vans have been funded, accommodating approximately 492 riders or 15,885 monthly passenger trips. Some
30 different companies are participating in the program.
• SchoolPool-Fort Worth Transit (T). This program is aimed at promoting ride sharing among the parents of elementary and junior high students who regularly
drive their children to school. In the same way that workers going to a single
employee site are encouraged to share rides, match lists are provided for parents whose children attend the same schools so that carpools can be formed for student transportation.
• Real-time Ridematching-Houston METRO. One element of the Houston Smart
Commuter ITS operational test focuses on the provision of a real-time carpooling system in the 1-10 West corridor. This system, which is currently under development,
will include the ability to provide real-time carpool matches to employees in the Post
Oak/Galleria area who live in the 1-10 West corridor.
Texas Transportation Institute 37

GUARANTEED RIDE HOME PROGRAMS
Participants in all of the discussion groups supported the use of guaranteed ride home
programs. Representatives from both public agencies and private businesses noted that these
services were viewed very positively by employees and helped encourage the use of HOV
modes. Further, participants noted that guaranteed ride home programs were supported by management and that management was willing to commit funds to support these services.
Private sector representatives in Houston went so far as to indicate that providing guaranteed
ride home services was a "given" part of their employee commute assistance plans.
Guaranteed ride home programs were also rated very highly by employees and employers
on the Houston ETR surveys and plans. Guaranteed ride home programs were supported by 39
percent of the Houston employees responding to the ETR surveys. Further, 55 percent of the employers included guaranteed ride home programs in their ETR plans. Only 8 percent reported
existing programs, however, with some 43 percent indicating that new programs would be
developed.
A wide variety of approaches are currently being used with guaranteed ride home services
in Texas. These include programs offered through transit agencies, as well as those provided directly by a company or a group of companies. For example, some of the participants in the
Houston meetings noted that they received guaranteed ride home services through their
participation in METRO's RideSponsor program. Other representatives, such as those
representing petrochemical companies located outside the METRO service area, provide their
own service.
Currently, most guaranteed ride home programs provide service to carpoolers, vanpoolers, and transit riders. The City of Austin is considering expanding its program to include bicyclists and walkers.
38
• RideHome-Houston METRO. METRO implemented a guaranteed RideHome Program in 1993. The service is offered to businesses participating in METRO's Corporate RideSponsor Program. Employees of these businesses can access the
RideHome program in case of an emergency or other change in schedule that requires
a trip when regular METRO service is not available.
• Guaranteed Ride Home Program-Capital Metro. Capital Metro offers a guaranteed ride home service to vanpool commuters, and Express/Park & Ride and
Texas Transportation Institute
Flyer bus passengers, for a $5 annual fee. The fee buys four vouchers for guaranteed rides home, good for one calendar year. The service is provided through local taxi companies. Trips up to 35 miles and fares up to $49.50 are reimbursed, less a $1
surcharge.
BICYCLES AND WALKING
The use of bicycling and walking as alternative commute modes elicited lower levels of
support among discussion group participants and employees in Houston. Hot and humid
weather, the lack of sidewalks and bicycle paths, and the long distance of commutes were
identified as major barriers to greater use of these travel modes. A few examples were provided
of commuters using these modes, however, especially in Austin. The bicycle users group (BUG)
at TNRCC represents one of these. This group promotes bicycling to the TNRCC office in
Austin and coordinates support activities for employees. Although participants in the discussion
groups indicated that these travel options should be supported, concerns were raised that walking
and bicycling would never account for major work trip modes in the three cities.
EMPLOYER INCENTIVES
Discussion group participants identified a variety of employee benefits or incentives to
encourage HOV use. The most frequently cited incentives were subsidizing bus passes, payroll
deduction for transit passes, on-site bus pass sales, and special promotions. The Houston ETR
plans provide additional insights into the types of incentives employers are currently offering,
as well as those under consideration.
Currently, most employer incentives focus on subsidizing bus passes or allowing passes to be sold on-site and providing guaranteed ride home programs described previously. The ETR plans indicated that only about one percent of Houston employers offer any type of monetary, recognition, or time benefits for HOV use. Only one example, the cash payments to employees
of the North Central Texas Council of Governments (NCTCOG), was identified during the discussion groups.
On the other hand, employees responding to the Houston ETR survey indicated that
employer incentives would help influence their use of HOV modes. For example, 32 percent
supported employers paying some of the costs associated with carpooling and vanpooling, 20
percent supported employer subsidization of transit passes, 13 percent favored employer
Texas Transportation Institute 39

provided vehicles for midday trips, and 6 percent and 4 percent supported employer incentives for bicycle use and walking.
• RideSponsor Program-Houston METRO. The Corporate RideSponsor program provides a number of services to encourage employers to help support and promote bus use among employees. The program is open to public and private sector employers. To participate, a company must agree to sell bus passes on-site and must
have at least 25 regular bus riders. Employers are also encouraged to subsidize a portion of their employees' bus fares. METRO, in tum, provides a discount of 10
percent on all passes and ticket books. Currently, 104 public agencies and private businesses are participating in the program.
• North Central Texas Council of Governments (NCTCOG). The NCTCOG recently implemented a financial incentive program to encourage employees to use alternative
commute modes-including walking, bicycling, carpooling, and vanpooling. The program pays $1.00 for each one-way commute trip an employee makes using an alternate mode. Employees must use an alternative commute mode at least 20 times
a month to quality for the program. The program has been in operation for approximately 6 months and 25 of 125 staff members are currently participating.
ON-SITE AMENITIES
The responses from discussion group participants and the analysis of the Houston ETR
plans indicate that with the exception of some type of lunchroom facility, few on-site amenities are being provided by either public or private sector employers. Almost 60 percent of the Houston employers filing ETR plans currently provide lunchroom or food services on site. Approximately 37 percent have some type of area for employees to change clothes, and 30 percent have shower and changing facilities. A few additional examples were provided during the discussion groups. These included adding bicycle racks at the TxDOT Riverside complex, consideration of bicycle racks and converting a janitor's closet into a shower facility by the City of Austin Air Quality group.
Discussion group participants indicated that additional on-site amenities could be
considered if it was determined that employees would find them of benefit and if they would help encourage use of alternative commute modes. The Houston ETR employee surveys indicate approximately 8 percent supported on-site shower and changing facilities, while on-site
40 Texas Transportation Institute

cafeterias, day care, and banking services each received favorable responses from 10 percent of
the employees.
PARKING MANAGEMENT AND PARKING PRICING
The discussion of parking management and parking pricing strategies elicited some of the
most heated debate among discussion group participants. Support was voiced for providing
preferential parking locations for carpools and vanpools, but there was little interest in pricing
strategies. Although participants acknowledged that parking pricing strategies were likely to
have significant impacts on travel behavior, both public and private sector representatives
indicated that pricing strategies should be considered as a last resort.
Sixteen percent of the employees responding to the Houston ETR surveys favored
preferential parking for carpools and vanpools, while 12 percent indicated that increasing parking
costs for driving alone would encourage them to use an HOV mode. Only 7 percent of the
employers submitting ETR plans reported existing parking management programs, while 16
percent indicated new programs were being developed.
A number of issues were raised with parking pricing strategies. These included concerns
about potential loss of competitive advantages in attracting and retaining employees and
customers, equity issues, and administrative procedures. There was a general consensus that
parking pricing strategies would need to be applied on a region-wide basis to be seriously
considered. Overall, participants emphasized the use of incentives, such as preferential parking
locations or lower parking rates for carpools and vanpools, rather than increasing parking rates
for commuters who drive alone.
WORK SCHEDULE MANAGEMENT
The results from the discussion groups, as well as the Houston ETR plans, indicate that there is a fairly widespread support among employees and employers for various work schedule management strategies. Staggered and flexible work hours, and compressed work weeks, were
noted most frequently, followed by telecommuting.
Employees responding to the Houston ETR surveys ranked the 4/40 compressed work
week and variable/flexible work hours among the top three incentives, with 39 percent and 29
percent, respectively. Telecommuting was supported by 19 percent of the respondents, and
other variations of compressed work weeks were favored by between 12 percent and 16 percent.
Texas Transportation Institute 41
On the other hand, 26 percent of the Houston employers submitting ETR plans currently have
flexible work hour programs, while 15 percent utilize compressed work weeks, and 8 percent have telecommuting programs.
CONGESTION PRICING
Congestion pricing strategies were not rated highly by discussion group participants.
Concerns were raised with equity issues, the lack of alternative routes in some areas, the
development and implementation of a congestion pricing system, and how funds generated from
the program would be used.
Some interest was expressed for using congestion pricing on the toll facilities in Houston
and Dallas to encourage HOV use. For example, providing reduced toll charges for carpools
and vanpools was suggested. An alternative approach would be to allow lower occupancy
vehicles to use the HOV lanes for a price. As described next, a feasibility study is being
conducted on this concept in Houston.
• HOV Lane Pricing-Houston. A feasibility study is currently underway in Houston
examining the concept of allowing single occupant vehicles or lower occupant vehicles
to use the Katy HOV lane for a price. One of the possible approaches being evaluated
would allow three person carpools to continue to use the Katy HOV lane during the
morning and afternoon peak hours for no charge. Carpools with only two people
could also use the lane during this time for a charge and single-occupant vehicles may
also be allowed access for a cost. During other operating hours, two person carpools
would continue to use the HOV lane for free, while single-occupant vehicles would
have access for a fee. The feasibility study is examining public policy and legal
issues, public reaction, and how such a demonstration would be implemented and operated.
LAND USE PLANNING AND DEVEWPMENT REGULATIONS
The potential use of land use planning and development regulations to encourage
alternative commute modes received generally favorable reactions from discussion group
participants. Many respondents noted that these strategies have a longer term focus than other
techniques. Land use policies and changes in development patterns take longer to implement
and potential benefits will be realized over the long term. Although some participants indicated
42 Texas Transportation Institute
that it may be too late to reverse existing trends in some areas, others were more optimistic that changes could be realized over time.
A few examples of land use and development activities supporting HOV use were identified during the discussion groups, the literature review, and conversations with agency representatives throughout the state. A few of these examples are highlighted next. Additional information is available on some of these projects in previous TTl reports (5,40).
• Joint LRT and Land Use Planning-DART. DART has worked with the City of Dallas and other groups in the development of plans for stations associated with the new LRT system. The station area planning activities have included consideration of traffic issues, pedestrian access, and land use concerns.
• Joint Developments-Houston METRO. METRO has been involved in public/private joint developments, including the construction of additional space at the Addicks Park-and-Ride facility for use by an intercity bus company. In addition to the commuter parking area, the bus platform, and the passenger waiting areas, METRO constructed a shelter for the intercity buses and ticketing agents. The company is leasing the facility from METRO and also sells METRO passes and tickets at the site. METRO has also completed two small joint development projects at Greenspoint Mall and at a Fiesta grocery store. These have been informal, cooperative ventures, through which METRO has been allowed to operate small transit centers on parts of the privately owned property.
• Downtown Transit Terminal-EI Metro, Laredo. El Metro, the public transit department in the city of Laredo, is developing a downtown joint-use transit terminal. At the time of this survey, the necessary land was being acquired and financing was being arranged. The facility will be owned and operated by the city, and space will be leased to other public agencies and private businesses. The plans for the transit center call for a five-level structure. Most of the first level will consist of a bus terminal with 24 bus bays. Six of those spaces will be leased to an intercity bus company, several others will be used by a Section 18 provider, and the rest are intended for El Metro buses. Space on the first level also will be leased to at least one restaurant company. The upper four levels of the structure will house a SOD-space
parking ramp.
• Livable Community Initiative-Regional Transit Authority, Corpus Christi. The Regional Transit Authority (RTA) has received a $1 million Livable Community
Texas Transportation Institute 43

Initiative grant from the Federal Transit Administration (FTA). The grant will be used to enhance pedestrian access to two major transit centers through improved sidewalks, lighting, and landscaping around the transit centers and the neighborhoods. This project builds on a previous effort by the RTA, the City of Corpus Christi, the
Project for Public Spaces (PPS) , and private businesses to develop a series of bus
transfer centers. RTA engaged PPS to work on a bus transfer center at City Hall. Serving seven routes, the center opened in February 1994 with new landscaping and
an innovative public art project. The Creative Arts Center, a local arts organization, sponsored a project to embellish the bus transfer centers with decorative ceramic tiling, handmade by 1,500 children and adult members of the community.
PUBLIC AWARENESS CAMPAIGNS AND ORGANIZATIONAL STRUCTURES
Participants in the discussion groups identified informational and outreach activities as critical components to any effort aimed at encouraging alternative commute modes and other strategies. The involvement of the state, regional, and local agencies, and the private sector, was noted as important for successful programs. Members of the Houston area private sector
discussion group cited the lack of public awareness as a major obstacle to implementing mandated trip reduction programs. The private sector discussion group in Dallas also cited
education and marketing as essential for building an awareness of congestion and air quality
issues and the need for ride sharing and public transit.
Examples of public awareness efforts currently underway in Texas are highlighted next.
As noted, a number of significant programs have been implemented, while others are in the
development stage.
44
• Ozone Alert Program-Dallas/Fort Worth Area. A number of coordinated efforts have been undertaken in the Dallas Fort Worth area to raise awareness of ozone alert days and to promote commute alternatives and other strategies on these days. NCTCOG produced two videos-one oriented toward Chief Executive Officers and one oriented to the general public-on ozone alert days and strategies that can be used on those days. Both DART and the T do not charge bus fares on these days to
encourage commuters to take the bus rather than driving alone. Other agencies and businesses have also developed activities oriented to these days.
Texas Transportation Institute
• Austin AIR Force. Agencies and groups in the Austin area have fonned a coalition called the Austin AIR Force to help promote actions and activities to improve air quality. Fonnerly called Clean Air Metro Austin, the Austin AIR Force has
undertaken a variety of activities. These include the Ozone Action Days, the V-TRIP
program mentioned previously, and other educational efforts. Brochures on How You
Can Help Improve Austin's Air and Ozone Action Days have been developed and
distributed widely throughout the Austin area. Additional activities and programs are also being considered.
• Don't Be An SOY Campaign-TxDOT. TxDOT is developing a public infonnation and marketing campaign around the slogan of Don't Be An SOY. The multimedia campaign will be used by TxDOT and will be made available to groups throughout
the state.
A number of new organizational structures are also being used in Texas cities to encourage alternative commute modes, coordinate programs among multiple groups, and
promote other transportation improvements. These include new employer-based organizations and public/private organizations, as well as existing groups. Transportation management
organizations (TMOs) and other coalitions have been fonned in Houston, Dallas, Austin, and
other areas to develop new initiatives and better coordinate existing efforts. Examples of these
organizations are provided next.
• Trip Reduction Efficiency Council (TREC)-Houston. The TREC serves the 60,000 - 80,000 employees in the Galleria/Post Oak area and coordinates with the
Galleria Chamber of Commerce and the Uptown District. TREC has organized several conferences, seminars, and training sessions for its members. It also conducts educational programs on ridesharing, telecommuting, and alternative work schedules. TREC has also approached a major taxi company in the area about discounted rates for the members to provide guaranteed ride home programs. The organization is a major coordinator of infonnation on the employer trip reduction program. It has been designated by Houston METRO and the Houston-Galveston Area Council (HGAC) as a Transportation Reduction Assistance Center (TRAC) for the area and regularly provides material and infonnation for companies not belonging to TREC. TREC is also working with Houston METRO to expand transit services and facilities in the
area .
• Clear Lake Transportation Partnership (CLTP)-Houston. The CLTP serves the
high-tech corridor in and around NASA, which is approximately a 400-square
Texas Transportation Institute 45

46
kilometer area. The CLTP currently serves over 60,000 employees in this region and
has a goal of 120,000 employees when funding sources become more secured.
Approximately 20 large employers participate in their employer trip reduction
activities. Membership dues are based on a rate of $3.00 per employee. The CLTP
provides information to its members on alternative commute modes and work
schedules, and coordinates other activities among its members. The CLTP also is
involved in long range mobility planning for the area and is working with METRO
on enhancing bus services and the area-wide traffic light synchronization project.
• Central Dallas Association (CDA)-Dallas. This organization is currently the only
operating TMO in the Dallas/Fort Worth area. The CDA is part of the larger Central
Dallas Business Association (CDBA) which represents employers in downtown Dallas.
The CDA currently provides information and limited assistance to members. Plans
are underway to expand the range of services offered, however.
• Voluntary Trip Reduction Program (V-TRIP)-Austin. V-TRIP is comprised of
public agencies and private businesses in the Austin area. Participating groups include
the City, Capital Metro, TxDOT, TNRCC, Travis County, Southwestern Bell, and
IBM. V-TRIP is focusing on a number of initiatives and activities including employee
surveys, public information, and promoting alternative commute modes and work
schedules.
Texas Transportation Institute
IV. HOUSTON AND DALLAS HOV LANE USER AND NON-USER SlTRVEYS
During the second phase of this research study, surveys of users and non-users of the
HOV lanes in Houston and Dallas were conducted. The purpose of the surveys was to gather
additional infonnation about commuter travel behavior, as well as public attitudes toward
alternative commute modes and various strategies designed to encourage HOV travel.
SlTRVEY METHODOLOGY
As illustrated in Figure 2, the Houston HOV lanes represent the most extensive network
of barrier-separated HOV lanes in the country. Designed and operated to provide preferential
treatment for buses, carpools, and vanpools, the HOV lane system represents one important
approach to managing traffic congestion and enhancing mobility in Houston. As of 1995, almost
103 kilometers of a planned 167 kilometer system were in operation. The majority of the HOV
lanes are approximately 6.1 meters wide, reversible, and are located in the median of the
freeway (3).
Approximately 81,000 daily passengers travel on the region's five HOV lanes. The Katy
Freeway HOV lane is the most heavily traveled with more than 21,000 passengers per day,
while the North Freeway HOV lane carries about 20,000 passengers per day. The Northwest
Freeway HOV lane carries about 13,000 passengers, the Southwest HOV lane about 15,000, and
the recently extended Gulf Freeway HOV lane about 11,000 passengers per day (3). Surveys
for this study were conducted ofHOV users and non-users on the Katy and Northwest Freeways.
These facilities are highlighted in Figure 2.
Figure 3 shows the existing and the proposed Dallas HOV lane system. Dallas plans to
construct and operate 59.5 kilometers of pennanent HOV lanes by the year 2010. Currently an 8.4 kilometer HOV lane is in operation on the East R. L. Thornton Freeway HOV lane. This
HOV lane carries about 13,000 passengers per day (3). This HOV lane is a one-lane contraflow
facility that utilizes a lane from the off-peak direction of traffic and is separated from the
opposing traffic flow by movable concrete barriers. Surveys were conducted for this study on
the East R. L. Thornton Freeway and HOV lane.
Texas Transportation Institute 47

i
48
/', I ,
I US 290', < , Northweat " , , , , , , , ,
" .....
1-45 North
1-610
BeHway 8
us 59 Eastex
Ft.41960
-.... Beltway 8 , (Futl.re)
\
\ , , , ,
I-_.-J~------r-- HO
Beltway 8 (Future)
1-------1-- SH 225
I /
I
I I
I
..... -------SH 288
LEGEND
EJ Operational HOV Lanes f22I HOV Lanes Being Designed/Planned o HOV Lanes Under Construction
o HOV Lane Access Locations [=1 study Corridor
1-45 QUI
Figure 2. Houston HOV System
Texas Transportation Institute
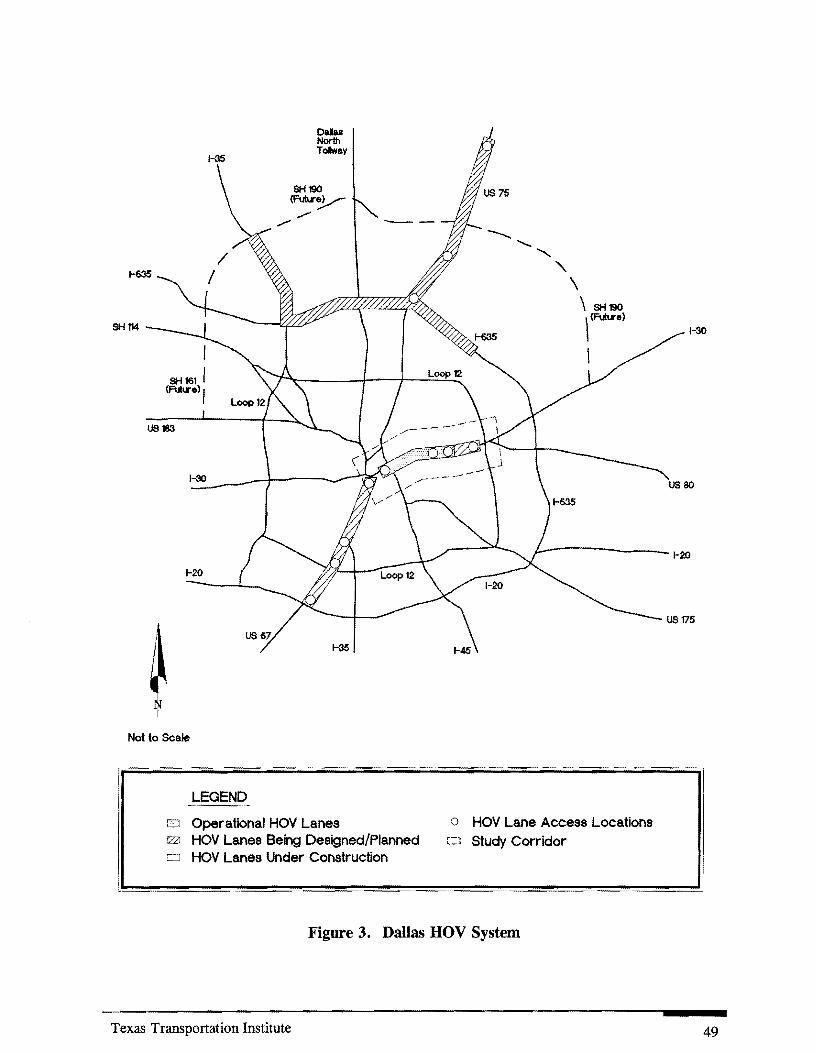
SH1I4
us 183
1-30
1-20
DaJas North Tot.vay
1-35
Not to Scale
LEGEND
I'IJ Operational HOY Lanes 1221 HOY Lanes Being Designed/Planned o HOY Lanes Under Construction
\SH19O \ (Fuh.re)
o HOY Lane Access Locations [:] study Corridor
Figure 3. Dallas HOV System
Texas Transportation Institute
1-30
us 80
1-20
49
The instruments used in this research were developed based on standard survey design
techniques and previous surveys conducted by TTl of HOV lane users and non-users (2). Three
different surveys were used-one for carpoolers and vanpoolers, one for bus riders, and one for
motorists in the general-purpose lanes. The surveys were reviewed by representatives from
TxDOT, METRO, and DART before being implemented. The survey instruments are provided
in Appendix D.
As noted previously, surveys were conducted of carpoolers, transit users, and motorists
in the general-purpose lanes on the Katy and Northwest HOV lanes and freeways in Houston and
the East R. L. Thornton HOV lane and freeway in Dallas. Carpoolers in the HOV lanes and
motorists in the general-purpose lanes were identified by recording the license plate number of
vehicles on audiotape during the morning peak-period from 6:00 A.M. to 9:00 A.M. The names
and addresses of the vehicle owners were then obtained from the Texas Division of Motor
Vehicles. The sample for the on-board transit user survey was selected from METRO and
DART bus routes operating on three HOV lanes during the morning peak-period. For each
route the objective was to survey 100 percent of the passengers on approximately 30 percent of
the bus runs.
A survey with a cover letter from TxDOT was mailed to each carpool driver and motorist
along with a postage-paid return envelope. Vehicles registered to persons residing in other states
and persons living outside the zip code areas shown in Figure 4 were excluded to omit motorists
that do not travel the corridors on a daily basis. Information on the number of license plates
recorded, surveys mailed, surveyed returned, and on-board bus surveys conducted are
summarized next.
50
• Dallas-Carpool and Motorist Survey. Vehicle license plates were recorded on the
East R. L. Thornton Freeway HOV lane and the general-purpose lanes on January 17, 1995. Surveys were mailed on March 3, 1995, and the survey return period extended
to May 2, 1995. As summarized in Table 3, of 3,152 motorist surveys mailed, 823 were returned, yielding a response rate of 26 percent. Of the 797 HOV user surveys mailed, 210 were returned, yielding a response rate of 26 percent.
• Dallas-On-Board Passenger Survey. The Dallas on-board bus survey was conducted
March 28, 1995, on DART bus routes using the East R. L. Thornton Freeway HOV
lane during the morning peak-period. TTl staff rode the selected buses and handed out
and collected surveys from bus riders. As summarized in Table 4, the overall response
rate for all the routes surveyed was 84 percent.
Texas Transportation Institute
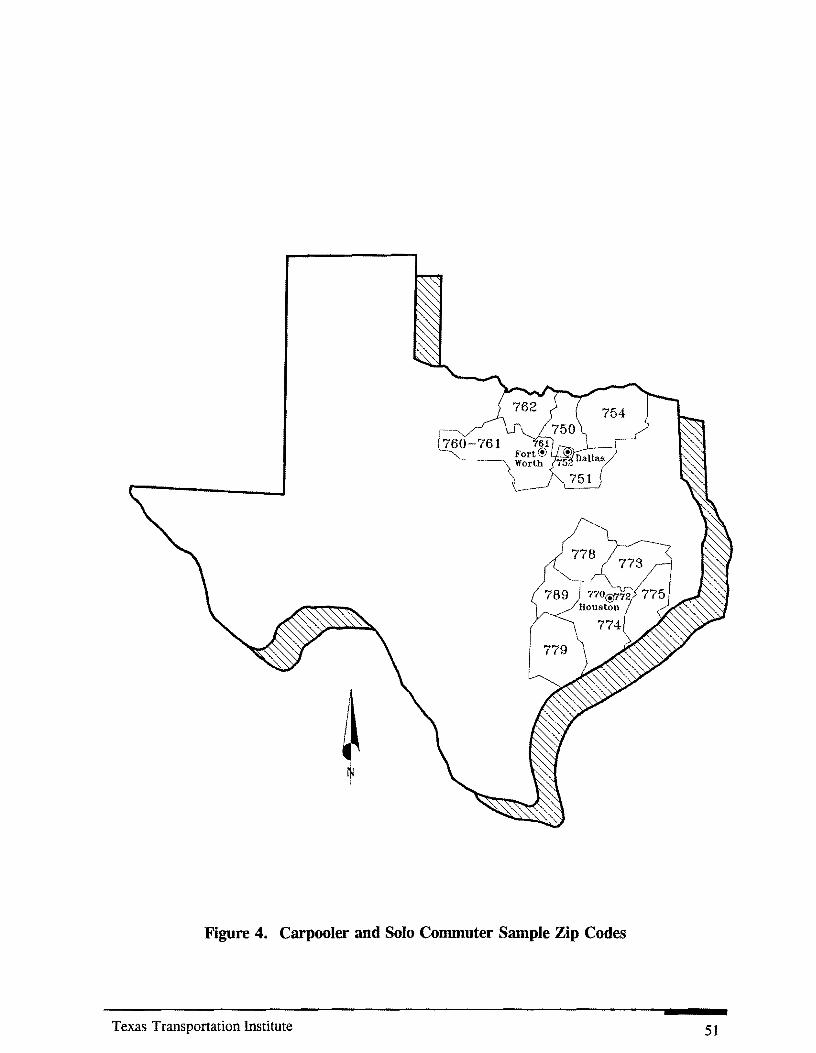
Figure 4. Carpooler and Solo Commuter Sample Zip Codes
Texas Transportation Institute 51

Table 3. Survey Distribution and Response Rates-East R. L. Thornton Freeway and HOV Lane
Morning License Surveys
Survey Sample Peak-Period Plates Surveys Returned Surveys Response Vehicle Mailed Address Completed Rate Volume Read Unknown
General-Purpose 17,955 4,943 3,152 23 823 26% Lane Drivers I
HOV lane 2,252 1,315 797 15 210 26%
TOTAL 20,207 6,258 3,949 38 1,033 26%
52 Texas Transportation Institute

Table 4. On-Board Transit User Survey Distribution and Response Rates-East R. L. Thornton Freeway HOV Lane
Route Block Number Garage Start Number of Surveys Response Number Location Passengers Completed Rate
2811282 28120 ATE 47 45 96%
2811282 28103 ATE 42 34 81 % I
2821283 28109 ATE 59 55 93%
283/281 28106 ATE 65 58 89%
283 28114 ATE 57 57 100%
207 20702 ATE 26 26 100%
207 20705 ATE 30 30 100%
64 6410 East Dallas 69 49 71 %
64 6409 East Dallas 55 39 71%
64 6411 East Dallas 61 59 97%
64 6414 East Dallas 89 52 58%
64 6415 East Dallas 35 30 86%
64 6417 East Dallas 36 34 94%
18 1805 East Grand 34 34 100%
60E/N 6010 East Grand 40 22 55%
60N/E 6006 East Grand 27 24 89%
TOTAL 772 648 84%
Texas Transportation Institute 53
I

• Houston-Carpool and Motorist Survey. Vehicle license plates were recorded during the peak-period on the Katy and Northwest HOV lanes on March 29 and March 30,
1995, and on the freeway main lanes on April 25 and April 26, 1995. The freeway motorist and HOV user surveys were mailed on May 5, 1995, and the survey return
period extended to June 16, 1995. As shown in Table 5, response rates ranged from a low of 28 percent for the Katy Freeway HOV lane users and the Northwest Freeway
motorists, to a high of 39 percent for the Northwest Freeway HOV lane users. The
overall response rate for all four groups was 31 percent.
• Houston-On-Board Passenger Survey. The Houston on-board bus survey was conducted May 24, 1995, on a sample of runs for METRO bus routes using the Katy
and Northwest HOV lanes during the morning peak-period. Table 6 summarizes the
distribution and the response rates for Katy and Northwest bus passengers. An overall
response rate of 82 percent was achieved on the Houston on-board surveys.
A data entry code book was created for each of the surveys, and TTl staff entered the
survey data into d-Base, a database software program. The statistical analysis was completed
using the SAS-PC software program. The initial analysis included verification testing for
accuracy of data input. A combination of descriptive and inferential statistics was used to
analyze the survey data. Standard frequencies were computed for each entry and bivariate
analyses were conducted using the standard cross-tabulation program, yielding the appropriate
tests of statistical significance. The next section highlights the results of the survey analysis.
54 Texas Transportation Institute
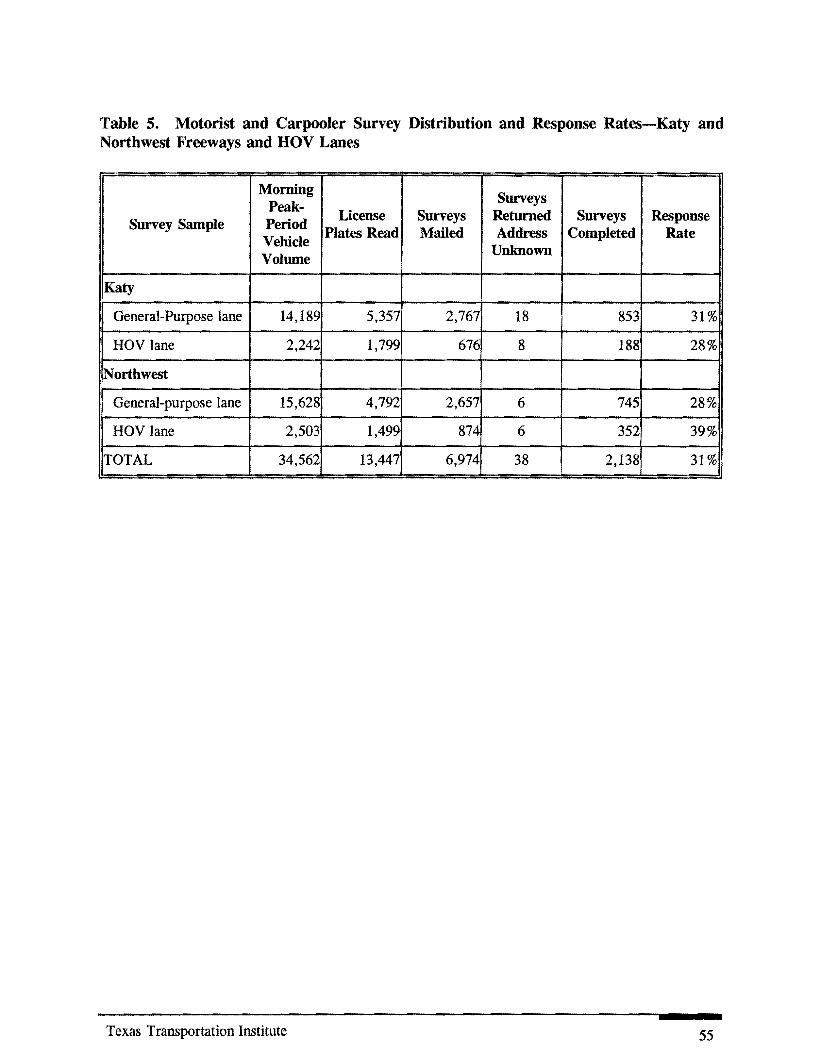
Table 5. Motorist and Carpooler Survey Distribution and Response Rates-Katy and Northwest Freeways and HOV Lanes
Morning Surveys Peak-Survey Sample Period License Surveys Returned Surveys Response
Vehicle Plates Read Mailed Address Completed Rate
Volume Unknown
Katy
General-Purpose lane 14,189 5,357 2,767 18 853 31 %
HOV lane 2,242 1,799 676 8 188 28%
Northwest
General-purpose lane 15,628 4,792 2,657 6 745 28%
HOV lane 2,503 1,499 874 6 352 39%
TOTAL 34,562 13,447 6,974 38 2,138 31 %
Texas Transportation Institute 55

Table 6. On-Board Transit User Survey Distribution and Response Rate, Katy and Northwest Freeway Bus Routes
Route Block Park & Ride Number of Surveys Response Number Number Location Passengers Completed Rate
210 1021 Katy/West Belt 34 29 85%
228 321 Kingsland 108 46 43%
228 322 Kingsland 89 70 79%
228 323 Kingsland 101 92 91 %
228 359 Addicks 77 67 87%
228 326 Addicks 84 82 98%
228 327 Addicks 77 67 87%
228 331 Addicks 80 62 77%
295 1023 Kingsland 18 13 72%
214 621 Northwest Station 114 104 91 %
214 622 Northwest Station 136 108 79%
214 623 Northwest Station 84 70 83%
214 624 Northwest Station 90 71 79%
214 628 Northwest Station 88 82 93%
216 621 West Little York 62 58 93%
TOTAL 1,242 1,021 82%
56 Texas Transportation Institute

SURVEY RESULTS
Knowledge of commuter travel behavior characteristics and the underlying motivating
factors that influence daily travel decisions is essential in the development of effective policies
and programs to encourage high-occupancy vehicle use. Several survey questions were designed
to gather demographic and travel behavior information from bus riders, carpoolers and
vanpoolers, and motorists. Other questions solicited information about employer-provided
incentives for HOV use, attitudes toward alternative commute modes, and preferences for
various strategies that may encourage HOV travel. The survey results are summarized in this
section. The analysis includes comparisons of the responses from the three sample groups, as
well as additional observations on similarities and differences in the responses from Houston and
those from Dallas.
The section is divided into five major parts. Demographic information is presented first,
followed by travel behavior characteristics, attitudes pertaining to the HOV lanes, employer
incentives and disincentives to encourage HOV travel, and preferences toward potential strategies
to encourage HOV use. Information for Dallas is presented first, followed by Houston. A
complete tabulation of the survey responses is provided in Appendix D.
Demograpbic Information
A number of survey questions focused on the demographic characteristics of transit users,
carpoolers, and freeway motorists. The demographic and socioeconomic information examined
in this section includes the age, gender, education level, and occupation of the three user groups.
Information is provided for transit users first, followed by carpoolers and freeway motorists.
HOV Lane Transit User Profile
The demographic information for HOV lane transit patrons is presented in Figures 5-7
and summarized below .
• Age. The median age of transit users is 37 years on the East R. L. Thornton HOV
lane and 38 years on the Katy and Northwest Freeway HOV lanes. The 35 to 44 age
group represents the largest group of riders on all three HOV lanes, followed by the
25 to 34 age group. A higher percentage of transit patrons using buses on the East R.
L. Thornton HOV lane are under 17 years of age, which corresponds to a higher
school trip purpose reported on a later question.
Texas Transportation Institute 57

58
Figure 5. East R. L. Thornton Freeway HOV Lane Transit User Demographic Profile
Under 17
18-24
25-34
35-44
45-54
55-64
65+
o
AGE
10 20
Less than high school
High school
Some college
College degree
Graduate/professional degree
30
o 10
GENDER
Female 71 %
40
EDUCATION
OCCUPATION
20 30 40 50
Texas Transportation Institute

Figure 6. Katy Freeway HOV lane Transit User Demographic Profile
Under 17
18-24
25-34
35-44
45-54
55-64
65+
0% 10%
AGE
20%
Less than high school
G raduate/professional
o
Professional
Managerial
Clerical
Sales
Service
Student
Other
0
Texas Transportation Institute
GENDER
Female 57%
30% 40%
EDUCATION
52
20 40 60
OCCUPATION
61
20 40 60 80
Male 43%
59

60
Figure 7. Northwest Freeway HOV Lane Transit User Demographic Profile
Less than high school
High school
Some college
College degree
Graduate/professional degree
f<Z"ill==
o 10
o
EDUCATION
20 30 40 50
OCCUPATION
20 40 60
Texas Transportation Institute

• Gender. As is typical for transit ridership, more women than men ride buses on all three HOV lanes. The percentages range from 72 percent female and 28 percent male
on the East R. L. Thornton HOV lane, to 57 percent female and 43 percent male on
the Katy HOV lane and 51 percent female and 49 percent male on the Northwest
Freeway HOV lane.
• Education. The educational profile of Dallas HOV lane bus patrons differs from bus
passengers on the two Houston HOV lanes. The average educational level of the
Dallas transit rider is 12 years compared to 15 years for the Katy and Northwest
samples. The Dallas sample displays an almost equal representation among high school
graduates, college graduates, and those indicating some college training, and contains
the highest proportion of respondents without a high school diploma. The differences
may be attributed to the fact that a large number of students in Dallas use DART to
travel to and from school. Katy and Northwest HOV lane transit users report higher
education levels, with about half having college degrees and some 17 percent holding
graduate or professional degrees.
• Occupation. A majority of bus riders on all three HOV lanes work in a professional
capacity, with clerical and managerial employees representing the second and third
largest occupational groups. Six percent of the Dallas HOV lane transit users
identified themselves as students-the highest among the three facilities.
HOV Lane Carpooler Profile
Graphical summaries of the demographic information for HOV lane carpoolers are
presented in Figures 8-10.
• Age. The median age for carpoolers varies from 41 years on the East R. L. Thornton HOV lane to 39 years on the Katy and Northwest Freeway HOV lanes. Over 60
percent of the HOV lane users in all three facilities are between the ages of 25 and 44.
The largest percentage of carpoolers on the Northwest and East R. L. Thornton HOV
lanes are in the 35 to 44 year old age group, while the largest on the Katy HOV lane
are in the 25 to 34 age group.
Texas Transportation Institute 61

Figure 8. East R. L. Thornton Freeway HOV Lane Carpooler Demographic Profile
Under 17
18-24
25-34
35-44
45-54
55-64
65+
AGE
Less than high school
High school
Some college
College degree
Graduate/professional degree
62
o
Professional
Managerial
Clerical
Sales
Service
Student
Other
o
GENDER
36 Male 45% Female 55%
40
EDUCATION
33
10 20 30 40
OCCUPATION
54
20 40 60
Texas Transportation Institute

Figure 9. Katy Freeway HOV Lane Carpooler Demographic Profile
Under 17
18-24
25-34
35-44
45-54
55-64
65+
o
AGE
10 20
Less than high school
High school
Some college
College degree
Graduate/professional degree
o
Professional
Managerial
Clerical
Sales
Service
Student
Other
Texas Transportation Institute
o
30
GENDER
33
Female 52%
40
EDUCATION
44
10 20 30 40 50
OCCUPATION
53
20 40 60
Male 48%
63
64
Figure 10. Northwest Freeway HOV Lane Carpooler Demographic Profile
o
AGE
10 20
Less than high school
High school
Some college
College degree
Graduate/professional degree
o
Professional
Managerial
Clerical
Sales
Service
Student
Other
o
30
10
GENDER
Female 47% 37
Male 53%
40
EDUCATION
20 30 40 50
OCCUPATION
20 40 60
Texas Transportation Institute
• Gender. Carpoolers tend to be more evenly split between males and females than bus
riders. Males represent from 45 percent to 53 percent of the carpoolers surveyed on
all three HOV lanes.
• Education. The average Katy and Northwest HOV lane carpooler has completed at
least three years of college, with approximately 45 percent holding college degrees and
another 20 percent with graduate or professional degrees. Fewer than 20 percent of
those surveyed have a high school education or less. The average East R. L. Thornton
HOV lane carpooler has completed at least two years of college; 33 percent have
college degrees, while 30 percent are high school graduates, and 11 percent hold
graduate or professional degrees.
• Occupation. The majority of HOV lane carpoolers in all three corridors are employed
in a professional capacity. With the exception of East R. L. Thornton HOV lane
carpoolers, managerial and clerical employees represented the second and third largest
occupational groups, respectively. In Dallas, slightly more carpoolers hold clerical
positions than managerial positions.
Freeway Motorist Profile
Graphical summaries of the demographic information for motorists in the general-purpose
freeway lanes are presented in Figures 11-13.
• Age. The median age of the freeway motorists in all three corridors is 42 years. The
largest age group of motorists on all three freeways fall within the 35 to 44 year old
category, with the 45 to 54 age group representing the second largest percentage.
These figures indicate a slightly higher median age for the motorist than for carpoolers
and bus riders.
• Gender. Men comprise the majority of single-occupant drivers on all three freeways.
Males represented 54 percent of the East R. L. Thornton Freeway motorists, 56
percent on the Northwest Freeway, and 60 percent on the Katy Freeway.
Texas Transportation Institute 65
Figure 11. East R. L. Thornton Freeway Motorist Demographic Profile
Under 17
18-24
25-34
35-44
45-54
55-64
65+
o
AGE
10 20
Less than high school
High school
Some college
College degree
Graduate/professional degree
66
o
Professional
Managerial
Clerical
Sales
Service
Student
Other
o
34
30
10
10
GENDER
Female 46%
Male 54%
40
EDUCATION
20 30 40
OCCUPATION
20 30 40 50
Texas Transportation Institute

Figure 12. Katy Freeway Motorist Demographic Profile
Under 17
18-24
25-34
35-44
45-54
55-64
65+
o
AGE
10 20
Less than high school
High school
Some college
College degree
Graduate/professional degree
o
Professional
Managerial
Clerical
Sales
Service
Student
Other
Texas Transportation Institute
o
30
10
10
GENDER
Female 40%
36
40
EDUCATION
43
20 30 40 50
OCCUPATION
20 30 40 50
Male 60%
67

Figure 13. Northwest Freeway Motorist Demographic Profile
Under 17
18-24
25-34
35-44
45-54
55-64
65+
o
AGE
10
Less than high school
High school
Some college
College degree
Graduate/professional degree
68
o
Professional
Managerial
Clerical
Sales
Service
Student
Other
o
30
10
10
GENDER
Female 43%
Male 57%
40
EDUCATION
36
20 30 40
OCCUPATION
20 30 40 50
Texas Transportation Institute

• Education. The motorists responding to the surveys on all the freeways are well educated. The average educational level of Dallas freeway motorists is 14 years, compared to 15 and 14 years for the Katy and Northwest Freeways, respectively. Approximately 43 percent of the Katy Freeway motorists have college degrees, compared to 36 percent of the Northwest Freeway motorists. Among East R. L. Thornton motorists, almost one third graduated from college and about 15 percent hold graduate or professional degrees.
• Occupation. Similar to the HOV lane users, between 45 and 48 percent of motorists on the three freeways work in professional occupations. The percentage of motorists employed in managerial positions ranged from 15 percent to 18 percent, while clerical workers ranged from 11 percent to 13 percent.
Travel Behavior Characteristics
The surveys contained several questions focusing on the travel behavior of HOV users and non-users. Travel behavior information was obtained on trip purpose, mode choice, and previous trip mode choice for bus riders, carpoolers, and vanpoolers. In addition, information
was collected on any previous carpool participation by bus riders and the composition of existing carpools. The survey results in these categories are summarized next.
Trip Purpose
Survey respondents were asked about the purpose of their trip. Figure 14 shows the results of this question for the three user groups on all three facilities.
• Transit Users. The predominant trip purpose for the HOV bus passengers is work. In Houston, 98 percent of the bus riders were traveling to work, compared to 88 percent in Dallas. A larger proportion of Dallas respondents-approximately 9 percent-were traveling to school.
• Carpoolers. HOV lane carpoolers exhibit slightly more varied trip purposes. Workrelated trips range from 88 percent on the Katy HOV lane to close to 95 percent on the
Northwest HOV lane. Approximately 8 percent of the Katy carpoolers cited schoolrelated trip purposes. Other reasons carpoolers were traveling on the HOV lane include medical and day-care trips.
Texas Transportation Institute 69
Figure 14. Trip Purpose: Transit Users, Carpoolers, and Freewav Motorists
TRANSIT USERS
Other School 3%
School Other .4% .6%
School Other .6% .4%
88%
East R. L. Thornton FwV Katy Fwy Northwest Fwy
CARPOOlERS
Other School 3%
School Other 8% 4%
School Other 4% 1%
92% 88% 95%
East R. L. Thornton Fwy Katy Fwy Northwest Fwy
FREEWAY MOTORISTS
Other School 6%
School Other 2% 6%
School Other 2% 4%
92% 92% 94%
East R. l. Thornton Fwy Katy Fwy Northwest Fwy
70 Texas Transportation Institute

• Freeway Motorists. The majority of freeway motorists are also going to work. Motorists reported more trips for other purposes, however, including jury duty, personal business, medical appointments, shopping, working out, meetings, and running errands.
Mode Choice
Survey respondents were asked to identify the major reasons for using their particular commute mode. The results are presented in Figures 15-17.
• Transit Users. Bus riders in all three corridors cited convenience as their main reason for using transit. Having free time to read or work is also an important factor in the decision to use transit, as is employer support of bus fares. Cost factors, time savings,
and environmental concerns are other reasons identified for using transit. The lack of an automobile is not a significant factor for many in the decision to use the bus in Houston, but it is for 32 percent of the respondents in Dallas. Between 39 and 57
percent of the bus riders in all three corridors receive fare subsidies from their employers.
• Carpoolers. Houston respondents cited time savings as the primary reason for carpooling, while carpoolers in Dallas rated the cost savings of carpooling first. Cost, convenience, companionship, environmental concerns, and parking cost/availability are also important factors. In both urban areas, less than 8 percent of the respondents indicated that employer incentives induced them to carpool.
• Freeway Motorists. The largest percentage of motorists in both urban areas rated the convenience and flexibility of having a car as primary reasons for driving alone. Almost one half of all respondents indicated they drove alone because of irregular work hours and another 40 percent needed a car for their job. About the same number indicated a lack of convenient bus service and vanpooling or carpooling partners. Although driving a company car and having gas paid for were not noted by many respondents as significant reasons for driving alone, free parking was cited as a reason for driving alone by over one fourth of the survey respondents. Other reasons for driving alone are the need for a car for taking children to day care or school, visiting
fami!y or friends after work, attending school during or after work hours, working out
at the gym, and running errands. Insufficient access points to get on and off the HOV facilities is also a reason for driving alone for some motorists.
Texas Transportation Institute 71
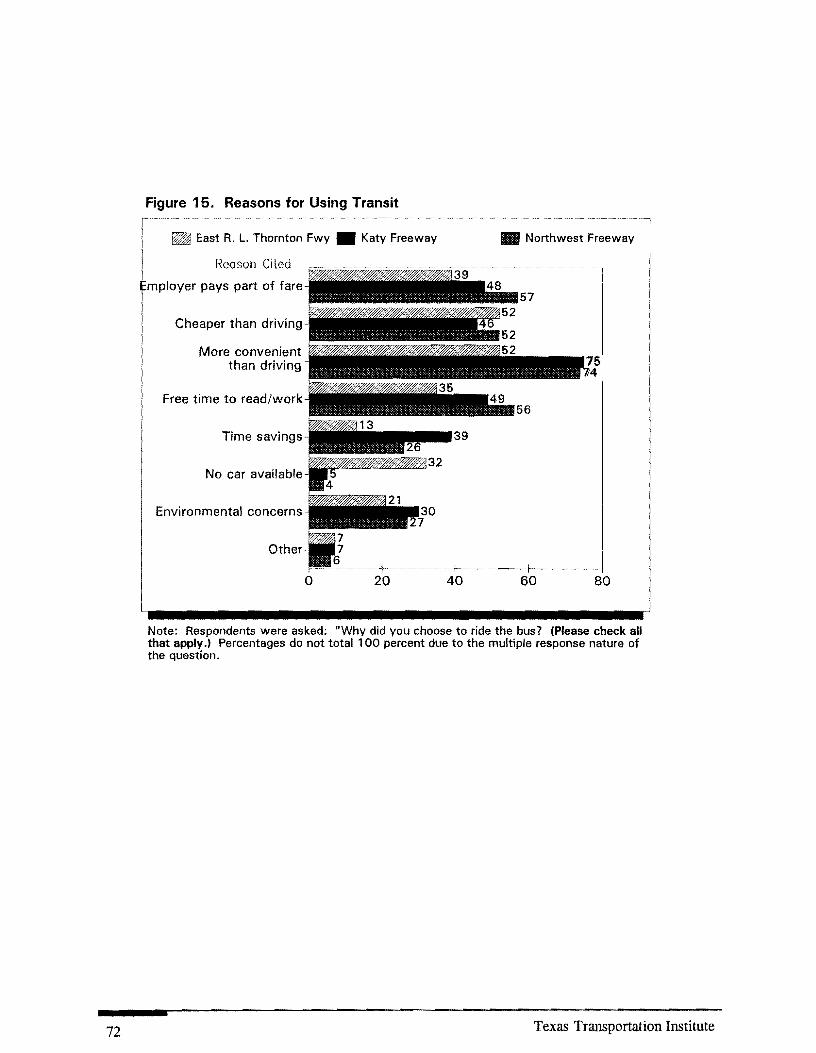
72
Figure 15. Reasons for Using Transit
East R. L. Thornton Fwy • Katy Freeway
Reason Cited
mployer pays part of fare
Cheaper than driving
More convenient than driving
Free time to read/work
Time savings
No car available
Environmental concerns
Other
o 20
• Northwest Freeway
40 60 80
Note: Respondents were asked: "Why did you choose to ride the bus? (Please check all that apply.) Percentages do not total 100 percent due to the multiple response nature of the question.
Texas Transportation Institute

Figure 16. Reasons For Carpooling .~~.~ .. ~.~ .. ~~ .. ~~~~~.~ .. ~~~~-~~--.--~~~~~~~- .. ~~~.~-~~----- ··~·~···~··-·~-~--I
East R.L. Thornton Fwy • Katy Freeway • Northwest Freeway
Employer incentives
heaper than driving alone
More convenient than driving alone
Parking cost/availability
Time savings
No car available
Companionship
Environmental concerns
Other
o 20 40 60
72 72
80
Note: Respondents were asked: "Why do you choose to carpool!vanpool rather than drive alone or ride the bus? (Please check all that apply. 1 Percentages do not total 100 percent due to the multiple response nature of the question.
Texas Transportation Institute 73

74
Figure 17. Reasons For Driving Alone -~-----~-~--~--~--~--~---~-~~--~--------~------~ -~-------~----~--~l
East R.L. Thornton Fwy • Katy Freeway
Need car for job
Car is more convenient and flexible
No convenient bus, vanpool, or carpool
available
Work irregular hours
Parking is free
Gas is paid for
Company car
Other
o 20
• Northwest Freeway
40 60 80
Note: Respondents were asked: "What are your reasons for driving your car on the freeway mainlanes, rather than traveling in a bus, carpool, or vanpool on the HOV lane? (Please check all that applv.l Percentages do not total 100 percent due to the multiple response nature of the question.
Texas Transportation Institute
Previous Trip Mode
The primary reason for developing HOV facilities is to influence commuters to change from driving alone to taking the bus or carpooling or vanpooling. HOV lanes attempt to
encourage drivers to switch to HOV modes by offering an attractive alternative to heavily congested freeway main lanes. Figures 18 and 19 identify the previous travel modes of bus riders and carpoolers in the three corridors.
• Transit Users. Transit patrons were asked to report their mode of travel prior to riding a bus on the HOV lane. As Figure 18 indicates, previous trip mode choices
differ between the urban areas, possibly reflecting the approach to developing the HOV
lanes and bus services in the two areas. In Dallas, existing buses were re-routed to utilize the HOV lane, while in Houston bus service did not exist in the corridors and new park-and-ride bus service was implemented along with the HOV lanes. In Dallas,
57 percent of the respondents rode the bus before the HOV lane was open. However, 24 percent reported previously driving alone to make the trip. In contrast, in Houston, less than 5 percent of those surveyed indicated any previous use of park-and-ride,
regular route, or express bus services. Approximately 46 percent previously drove
alone, while some 30 percent did not make the trip. Previous carpoolers accounted for less than 12 percent in all three corridors, while previous vanpoolers accounted for 8
percent or less. The majority citing other factors said that they either worked
elsewhere or did not live in the area prior to riding the bus on the HOV lane.
• Carpoolers. Figure 19 shows that the majority of carpoolers in both urban areas previously used the regular freeway lanes. As shown in Table 7, however, there are
differences between carpoolers in the urban areas regarding which mode was used to travel on the freeways. Carpoolers in Houston who formerly used the regular freeway traffic lanes or a parallel roadway were more likely to have driven alone than those in Dallas.
Texas Transportation Institute 75

76
Figure 18. Previous Trip Mode: Transit Users
East R. L. Thornton Fwy • Katy Freeway
Mode Used
Drove alone
Carpooled
Vanpooled
Rode park & ride bus on regular freeway lanes
Rode regular route or express bus
Did not make trip
Other
• Northwest Freeway
46
o 10 20 30 40 50
I_~ ____ ----~ Note: Respondents were asked: "Before you began riding a bus on the HOV lane, how did you normally make this trip? (Please check one.)
Texas Transportation Institute
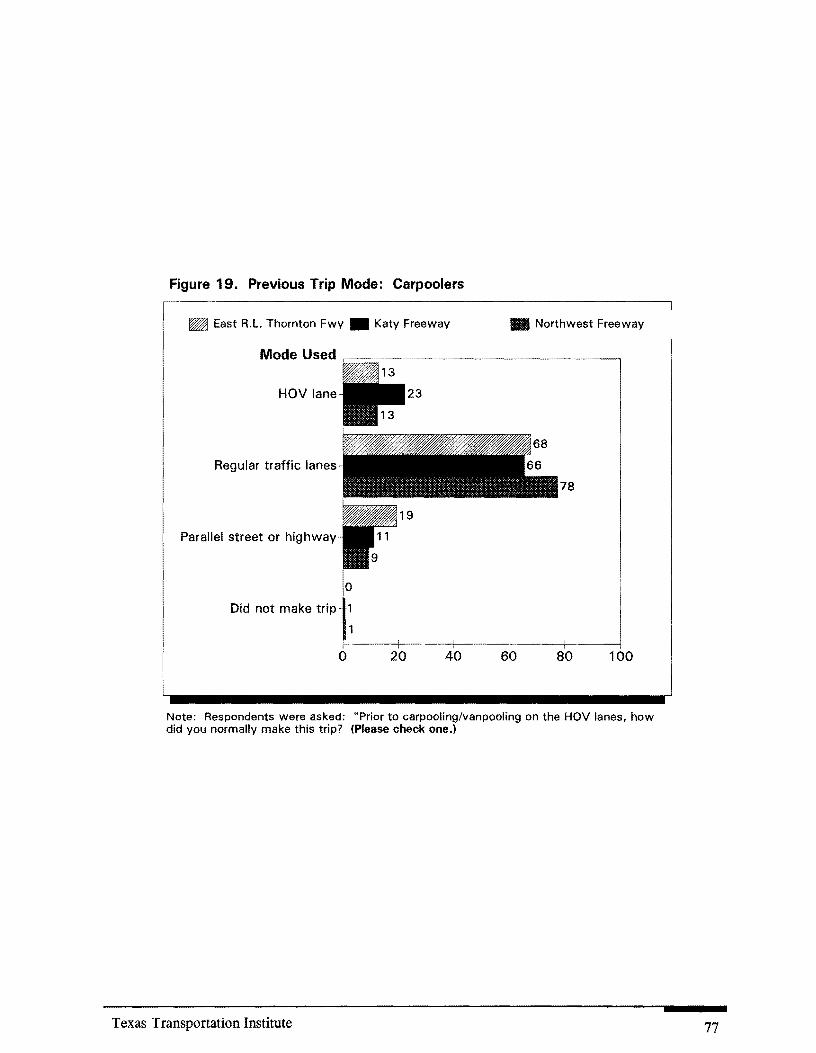
Figure 19. Previous Trip Mode: Carpoolers
~ East R.L. Thornton Fwy • Katy Freeway II Northwest Freeway
Mode Used ,--______ ... _________ .. __ --,
HOV lane
Regular traffic lanes
78
Parallel street or highway
Did not make trip
o 20 40 60 80 100
Note: Respondents were asked: "Prior to carpoolinglvanpooling on the HOV lanes, how did you normally make this trip? (Please check one.)
Texas Transportation Institute 77

Table 7. Previous Trip Mode: Carpoolers
Previous Trip Mode East R. L.
Katy Fwy Northwest Fwy • Thornton Fwy
!
On HOV Lane
Bus 48% 76% 82%
Vanpool 0 6% 3%
Carpool 52% 18% 15%
On regular freeway traffic lanes
Bus 3% 0 1%
Vanpool 7% 1% 1%
Carpool 47% 18% 21%
Drove alone 43% 81% 77%
On a parallel street or highway
Bus 3% 6% 0
Vanpool 3% 12% 0
Carpool 63% 29% 40%
Drove alone 31 % 53% 60%
78 Texas Transportation Institute
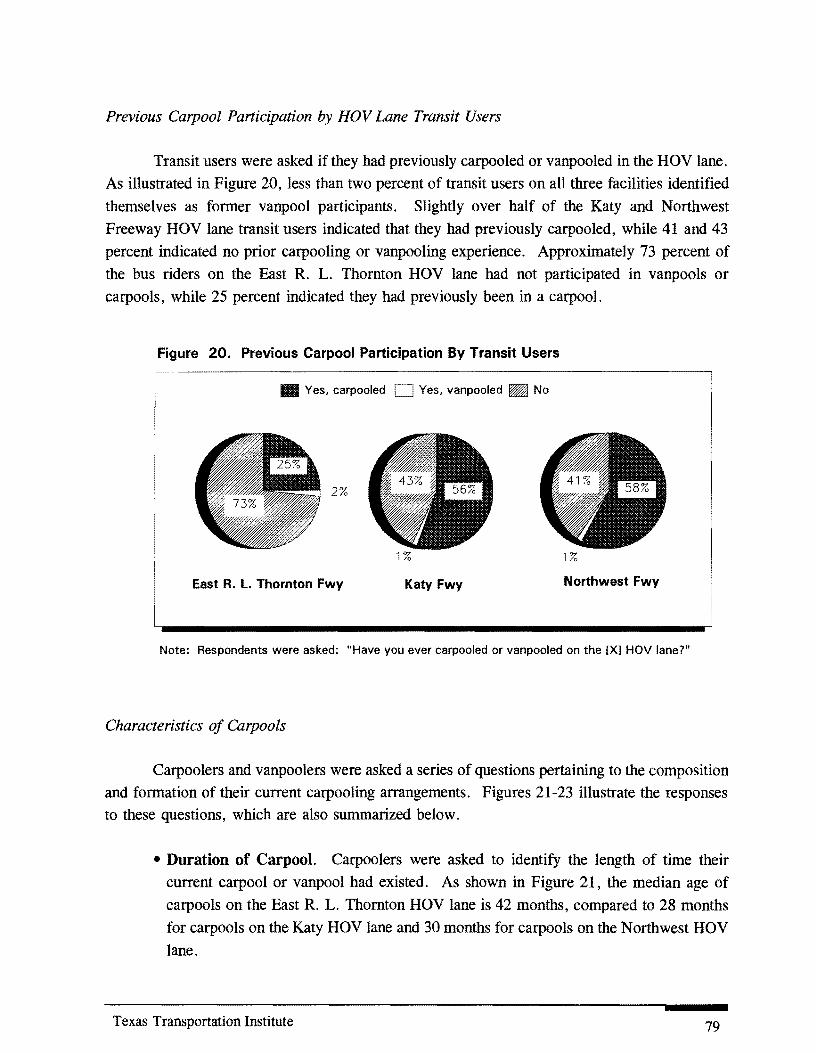
Previous Carpool Participation by HOV Lane Transit Users
Transit users were asked if they had previously carpooled or vanpooled in the HOV lane.
As illustrated in Figure 20, less than two percent of transit users on all three facilities identified
themselves as former vanpool participants. Slightly over half of the Katy and Northwest
Freeway HOV lane transit users indicated that they had previously carpooled, while 41 and 43
percent indicated no prior carpooling or vanpooling experience. Approximately 73 percent of
the bus riders on the East R. L. Thornton HOV lane had not participated in vanpools or
carpools, while 25 percent indicated they had previously been in a carpool.
Figure 20. Previous Carpool Participation By Transit Users
• Yes, carpooled Yes, van pooled ~ No
2%
1% 1%
East R. L. Thornton Fwy Katy Fwy Northwest Fwy
Note: Respondents were asked: "Have you ever carpooled or van pooled on the [X] HOV lane?"
Characteristics of Carpools
Carpoolers and vanpoolers were asked a series of questions pertaining to the composition
and formation of their current carpooling arrangements. Figures 21-23 illustrate the responses to these questions, which are also summarized below.
• Duration of Carpool. Carpoolers were asked to identify the length of time their
current carpool or vanpool had existed. As shown in Figure 21, the median age of
carpools on the East R. L. Thornton HOV lane is 42 months, compared to 28 months
for carpools on the Katy HOV lane and 30 months for carpools on the Northwest HOV
lane.
Texas Transportation Institute 79

80
Figure 21. Length of Time Carpool Exists r-------------------------------.-----.----------------------------, ~ East R.L. Thornton Fwy • Katy Freeway
50
le 40
b :2 30 '5
::::J:I::
§ 20
:2 10
o
42
Months
• Northwest Freeway
Note: Respondents were asked: "How long has your current carpool/vanpool existed?"
Figure 22. How Carpools Are Formed
DART E I rideshare Other mp oyer
2% program 1%
East R. L. Thornton Fwy
METRO rideshare Other Employer program 2 % program
1% 5%
Katy Fwy
Other Employer 4% program
1%
Northwest Fwy
L _________________ ~
Note: Respondents were asked: "How did you form your carpool/vanpool?" (Please check one.)
Texas Transportation Institute

Figure 23. Composition of Carpools
East R.L. Thornton Fwy • Katy Freeway • Northwest Freeway
Family members
Neighboors
Co-workers
Others
Note: Respondents were asked: "Who makes up your carpool/vanpool group? (Please check all that apply.) Percentages do not total 100 percent due to the multiple response nature of the question.
• Formation of Carpools. Information was also obtained on carpool formation. The
results. as shown in Figure 22. indicate that the majority of carpools are formed with
family members. Friends and co-workers comprise the second largest group, with only
a small percent formed through the ridesharing programs offered by local transit
agencies or employers.
• Composition of Carpools. Supporting the trends in carpool formation described
previously, as illustrated in Figure 23 approximately 70 percent of carpoolers on all three HOV lanes ride with family members. Most of the remaining carpools are formed with co-workers. These trends follow national experiences, which indicate
most carpools are comprised of family members. friends, or co-workers.
Attitudes About HOV Facilities
Transit users and carpoolers were asked several questions to obtain additional information
concerning their attitudes toward HOV facilities. Information on the impact of the HOV lanes
on mode choice and the perceived HOV lane travel time savings is summarized in this section.
Texas Transportation Institute 81

Impact of HOV Lane on Mode Choice
• Transit Users. As shown in Figure 24, the impact of the HOV lanes is different
among transit riders in Houston and Dallas. Almost three fourths of the East R. L.
Thornton HOV lane transit users would still use the bus even in the absence of the
HOV lane. In Houston, the presence of HOV facilities is a significant factor in the
decision to use transit. Only 18 percent of the Katy and 26 percent of the HOV lane
bus riders would continue to ride the bus if the HOV lane was not available. One half
of the transit users on the Katy HOV lane and 35 percent of the transit patrons on the
Northwest HOV lane indicated they would change travel modes in the absence of the
H 0 V lane. Further, as shown in Figure 25, 92 percent of the Katy, 88 percent of the
Northwest, and 65 percent of the East R. L. Thornton bus riders noted that the HOV
lanes are very important factors in their decision to use transit.
• Carpoolers. As shown in Figure 26, the HOV lanes playa slightly less important role
in the decision to carpool. Approximately 73 percent of the carpoolers on the East
R. L. Thornton HOV lanes indicated they would continued to carpool in the absence
of the HOV lane. In Houston, 40 percent of the Katy and 47 percent of the Northwest
HOV lane carpoolers would continue to rideshare without the HOV lanes. However,
the Houston facilities would lose many more carpoolers-39 percent on the Katy
Freeway and 29 percent on the Northwest Freeway-than the East R. L. Thornton
Freeway-14 percent-if the HOV lane was not available.
Perceived HOV Lane Travel Time Savings
Figures 27 and 28 illustrate the travel time savings transit riders and carpoolers perceive
through use of the HOV lanes. As summarized next, the differences in travel time savings among the three facilities relates somewhat to the length of the HOV lanes and traffic congestion on the adjacent freeways.
82 Texas Transportation Institute

Figure 24. Impact of HOV Lane on Mode Choice: Transit Users
~Yes Not sure
9%
East R. L. Thornton Fwy Katy Fwy Northwest Fwy
Note: Respondents were asked: "If the HOV lane did not exist, would you be riding the bus now?
Figure 25. Importance of HOV Lane in Decision to Use Transit
~ Very important • Somewhat important D Not important
5% 3% 10% 2%
East R. L. Thornton Fwy Katy Fwy Northwest Fwy
Note: Respondents were asked: "How important is the HOV lane in your decision to ride the bus?"
Texas Transportation Institute 83

84
Figure 26. Impact of HOV Lane on Mode Choice: Carpoolers
~Yes • No Not Sure
East R. L. Thornton Fwy Katy Fwy Northwest Fwy
Note: Respondents were asked: "If the HOV lane did not exist, would you be carpooling/vanpooling now?"
Figure 27. Perceived HOV Lane Travel Time Savings: Transit Users
Note: Respondents were asked: "How many minutes, if any, do you believe this bus saves by using the HOV lane instead of the regular traffic lanes?"
Texas Transportation Institute
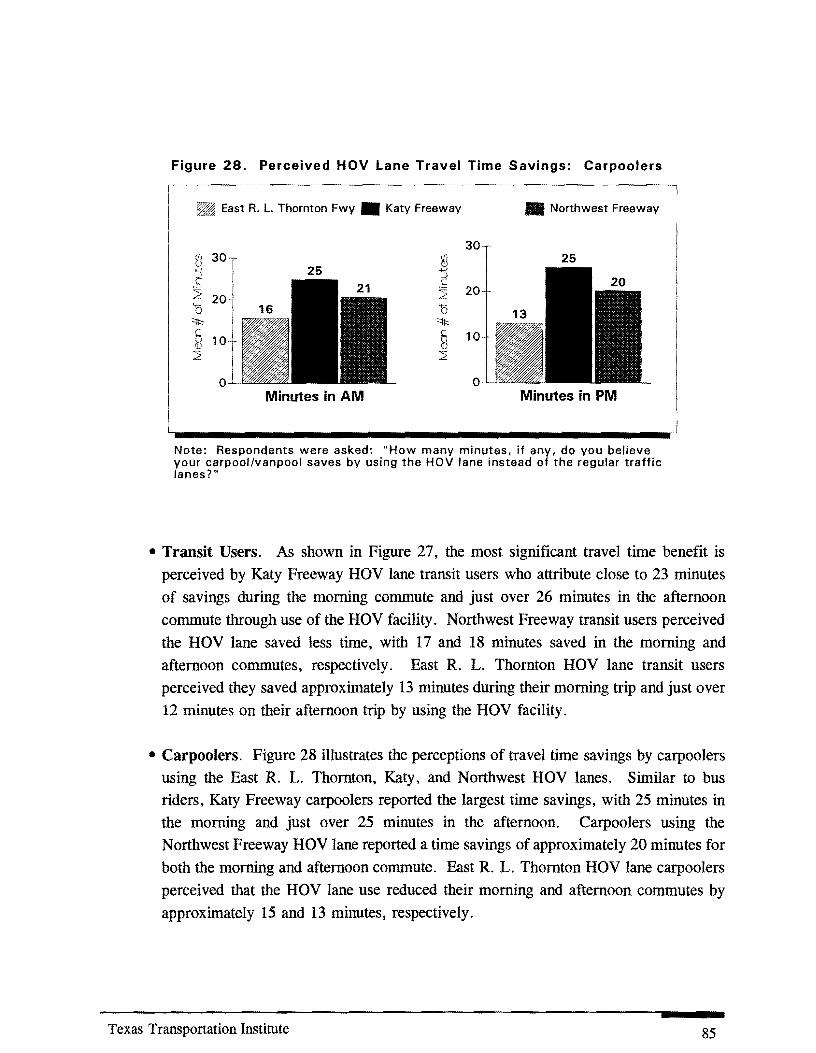
Figure 28. Perceived HOV Lane Travel Time Savings: Carpoolers
East R. L. Thornton Fwy • Katy Freeway • Northwest Freeway
30 [l 30 al ~ 25 :s c
25
~ 20 ~ 20
0 0 "It:: "It::
~ 10 § 10 ::;;; ::;;;
0 0 Minutes in AM Minutes in PM
~------------------~j Note: Respondents were asked: "How many minutes, if any, do you believe your carpool/vanpool saves by using the HOV lane instead of the regular traffic lanes? "
• Transit Users. As shown in Figure 27, the most significant travel time benefit is
perceived by Katy Freeway HOV lane transit users who attribute close to 23 minutes
of savings during the morning commute and just over 26 minutes in the afternoon
commute through use of the HOV facility. Northwest Freeway transit users perceived
the HOV lane saved less time, with 17 and 18 minutes saved in the morning and
afternoon commutes, respectively. East R. L. Thornton HOV lane transit users
perceived they saved approximately 13 minutes during their morning trip and just over
12 minutes on their afternoon trip by using the HOV facility.
• Carpoolers. Figure 28 illustrates the perceptions of travel time savings by carpoolers using the East R. L. Thornton, Katy, and Northwest HOV lanes. Similar to bus riders, Katy Freeway carpoolers reported the largest time savings, with 25 minutes in
the morning and just over 25 minutes in the afternoon. Carpoolers using the
Northwest Freeway HOV lane reported a time savings of approximately 20 minutes for
both the morning and afternoon commute. East R. L. Thornton HOV lane carpoolers
perceived that the HOV lane use reduced their morning and afternoon commutes by
approximately 15 and 13 minutes, respectively.
Texas Transportation Institute 85

Employer Incentives to Encourage HOV Use
All three user groups were asked to identify any incentives or programs provided by their
employers to encourage HOY use. The responses to this question are summarized below and
illustrated in Figures 29-31.
86
• Transit Users. As shown in Figure 29, over three fourths of the bus riders in all three corridors indicated that their employer pays for part or all of their bus fare. At the
same time, between 17 percent and 30 percent of the bus respondents indicated that their employer paid all or part of their work site parking costs. Houston employers
appear to be more likely to pay part or all of an employee's parking fees than in
Dallas. Flexible work hours was the second most frequently reported incentive among bus riders. The availability of a guaranteed ride home program was noted more
frequently by Houston bus riders than by their counterparts in Dallas. Other employer
incentives such as rideshare matching and vanpool programs, preferential parking for carpools, and telecommuting were cited by less than 8 percent of respondents in all
three corridors.
• Carpoolers. Figure 30 illustrates the responses from carpoolers on the incentives offered by their employers. Flexible work hours was the most frequently cited
incentive, although Houston employers appear more likely to offer this incentive than
Dallas employers. Employer contributions toward the cost of bus passes, as well as paying for parking fees, were also reported by at least one third of the respondents.
Other incentives noted included preferential parking for carpools and vanpools, vanpool
programs, guaranteed ride home programs, and ride matching services. Houston
employers were again more likely to provide guaranteed ride home programs than
Dallas employers.
• Freeway Motorists. As shown in Figure 31, flexible work hours and employer support of parking fees were the most commonly reported incentives by motorists in all three corridors. Over 50 percent of the respondents noted that their employers allow flexible work hours, while between 44 percent and 54 percent receive subsidies for parking. Freeway motorists reported lower levels of employer bus pass subsidies
than bus riders or carpoolers. This may be the case, or motorists may not be aware
of transit pass programs offered by their employer.
Texas Transportation Institute

Figure 29. Employer Incentives to Encourage HOV Use: Transit Users
m East R. L. Thornton Fwy • Katy Freeway
Incentive
Pays partlall of bus pass
Allows flexible work hours
Allows telecommuting
Pays partlall parking fees
Guaranteed ride home program
Rideshare matching program
Vanpool program
Preferential parking for carpools/vanpools
o
• Northwest Freeway
60 80 100
Note: Respondents were asked: "Does your employer provide any of the following?" (Please check all that apply.) Percentages do not total 100 percent due to the multiple response nature of the question.
Texas Transportation Institute 87
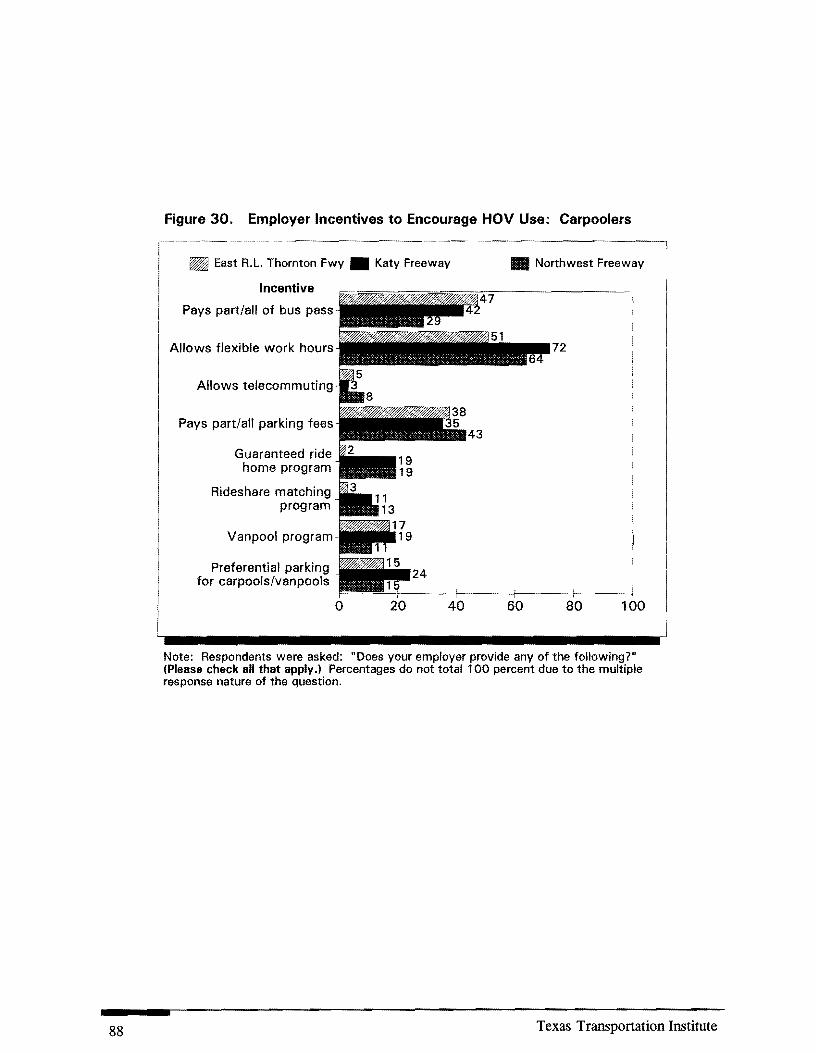
88
Figure 30. Employer Incentives to Encourage HOV Use: Carpoolers
~ East R.L. Thornton Fwy • Katy Freeway
Incentive
Pays partiall of bus pass
Allows flexible work hours
Allows telecommuting
Pays part/all parking fees
Guaranteed ride home program
Rideshare matching program
Vanpool program
Preferential parking for carpools/van pools
o 20
• Northwest Freeway
72
60 80 100
Note: Respondents were asked: "Does your employer provide any of the following?" (Please check all that apply.) Percentages do not total 100 percent due to the multiple response nature of the question.
Texas Transportation Institute

Figure 31. Employer Incentives to Encourage HOV Use: Freeway Motorists
East R.L. Thornton Fwy • Katy Freeway
Incentive
Pays partlall of bus pass
Allows flexible work hours
Allows telecommuting
Pays partlall parking fees
Guaranteed ride home program
Rideshare matching program
Vanpool program
Preferential parking for carpools/vanpools
o 20 40
• Northwest Freeway
60 80 100
Note: Respondents were asked: "Does your employer provide any of the following?" (Please check all that apply.J Percentages do not total 100 percent due to the multiple response nature of the question.
Texas Transportation Institute 89

Strategies to Encourage HOV Use
The surveys included several questions to help evaluate the level of public support for various strategies to encourage HOV use. Alternatives included those commonly found in Texas
cities, as well as other techniques being used or considered in urban areas through the country.
Survey respondents were given a list of several strategies and asked to identify the approaches
they would support. Freeway motorists were also asked if these strategies would influence them
to change their travel behavior. The success of these policies and programs to encourage HOV
use is largely dependent on public support and acceptance. The results from this part of the
survey are summarized into three major categories-expanded transit facilities, employer
programs, and policies that increase the cost of driving alone. Tables 8 and 9 provide a
summary of the results for all user groups in the three corridors. Figures 32 through 41 also
illustrate the responses.
Support for Expanded Transit Facilities
Transit users, carpoolers, and freeway motorists were asked about their level of support
for expanded bus services, more park-and-ride lots, additional HOV lanes, and more HOV lane
access points to help reduce traffic congestion and improve air quality. The results are presented graphically in Figures 32 through 35 and summarized next. Overall, there was strong support
among all three user groups.
90
• Expanded Bus Service. Bus riders, carpoolers, and freeway motorists in all three
corridors supported expanding bus services. As could be expected, the highest degree
of support came from current bus riders. Approximately 80 percent of the bus users
in all three corridors supported this approach. Support among carpoolers and motorists
ranged from 26 percent to 48 percent.
• Additional Park-and-Ride Lots. Providing more park-and-ride lots was also supported by all three user groups, with bus riders again showing the strongest preference for this strategy. Between 57 percent and 71 percent of the bus passengers
supported this technique, compared to 30 percent to 42 percent of the carpoolers and 34 to 39 percent of the freeway motorists.
Texas Transportation Institute

Table 8. Support for Strategies to Encourage HOV Use: Transit Users and Carpoolers
Transit Users
East R. L. Katy Northwest Thornton Freeway Freeway
1:: 1:: 1:: 8- 8- 8-
i "; =- 1:: "; ~ 1:: "; ~ .. J.l ~ .. 8- ~ : '$ ... '$ ~ §' ~ "" ~ :I -l. "" ;z; fIl fIl ;z;
Expanded Transit Facilities Expanded bus service 83 15 2 78 19 2 84 15 1 More park-and-ride lots 58 39 4 64 31 5 71 24 5 More HOV lanes 75 21 4 67 24 8 63 31 6 More HOV lane access points 59 29 12 48 29 23 48 36 17
Employer programs Flexible work hour arrangements 63 32 6 85 13 2 81 17 2 Charging more for parking 9 26 65 7 20 74 7 22 71 Employer incentives for use of buses or ridesharing 82 14 4 90 9 1 92 6 2 Telecommuting 43 48 9 55 40 5 56 41 3
Increase costs of SOY commuting Charging for use of roads 9 20 71 8 14 78 5 13 83 Higher gasoline taxes 4 12 84 5 8 87 6 10 85
Carpoolers
Expanded Transit Facilities Expanded bus service 26 46 28 44 42 13 48 41 11 More park-and-ride lots 30 58 12 32 56 12 42 51 8 More HOV lanes 82 15 3 66 24 10 71 23 6 More HOV lane access points 61 20 19 56 25 19 50 29 21
Employer programs Flexible work hour arrangements 66 30 4 76 20 4 78 19 3 Charging more for parking 2 18 80 5 23 72 3 28 69 Employer incentives for use of buses or ridesharing 60 32 8 68 24 9 75 19 6 Telecommuting 43 49 8 47 42 11 51 43 6
Increase costs of SOY commuting Charging for use of roads 4 11 85 10 17 73 4 13 83 Higher gasoline taxes 2 5 93 6 10 85 '5 8 87
Texas Transportation Institute 91

Table 9. Support for Strategies to Encourage HOV Use: Freeway Motorists
East R. L. Thornton
t: 'S 8.
t: ] c. Zt:
8. =' "0 ::98. rJ:l -=' c. =' .... ~
=' c. =' 4i
~ ~~ rJ:l Z
Expanded Transit Facilities Expanded bus service 37 42 21 23 77 More park-and-ride lots 36 49 15 19 81 More HOV lanes 41 30 30 21 79 More HOV lane access points 41 35 24 21 79
Employer Programs Flexible work hour arrangements 58 35 8 42 58 Charging more for parking 5 22 74 14 86 Employer incentives for use of buses or ridesharing 49 37 14 35 65 Telecommuting 40 46 14 38 62
Increase Costs of SOY Commuting Charging for use of roads 4 9 87 29 71 Higher gasoline taxes 3 6 9 21 79
Katy Freeway
Expanded Transit Facilities Expanded bus service 47 39 15 26 75 More park-and-ride lots 34 48 18 16 84 More HOV lanes 33 33 34 23 78 More HOV lane access points 51 27 22 30 70
Employer Programs Flexible work hour arrangements 65 25 10 44 56 Charging more for parking 3 22 75 11 89 Employer incentives for use of buses or ridesharing 51 32 18 35 65 Telecommuting 42 44 14 34 66
Increase Costs of SOY Commuting Charging for use of roads 8 12 81 25 75 Higher gasoline taxes 3 8 89 16 84
Northwest Freeway
Expanded Transit Facilities Expanded bus service 46 38 16 28 72 More park-and-ride lots 39 44 17 21 79 More HOV lanes 29 39 32 17 83 More HOV lane access points 46 33 21 27 73
Employer Programs Flexible work hour arrangements 68 22 10 49 51 Charging more for parking 4 18 77 12 88 Employer incentives for use of buses or ridesharing 56 29 15 41 59 Telecommuting 44 42 14 38 62
Increase Costs of SOY Commuting Charging for use of roads 4 9 87 26 74 Higher gasoline taxes 3 7 90 19 81
92 Texas Transportation Institute

Figure 32. Degree of Support for Expanded Bus Service
Support • Neutral Not Support
TRANSIT USERS
2% 19% 2% 15% 1%
East R. L. Thornton Fwy Katy Fwy Northwest Fwy
CARPOOLERS
East R. L. Thornton Fwy Katy Fwy Northwest Fwy
FREEWAY MOTORISTS
East R. L. Thornton Fwy Katy Fwy Northwest Fwy
Note: Respondents were asked: "A number of ideas have been suggested for addressing traffic congestion and air quality concerns. Which of the following approaches would you support to help address these concerns?"
Texas Transportation Institute 93
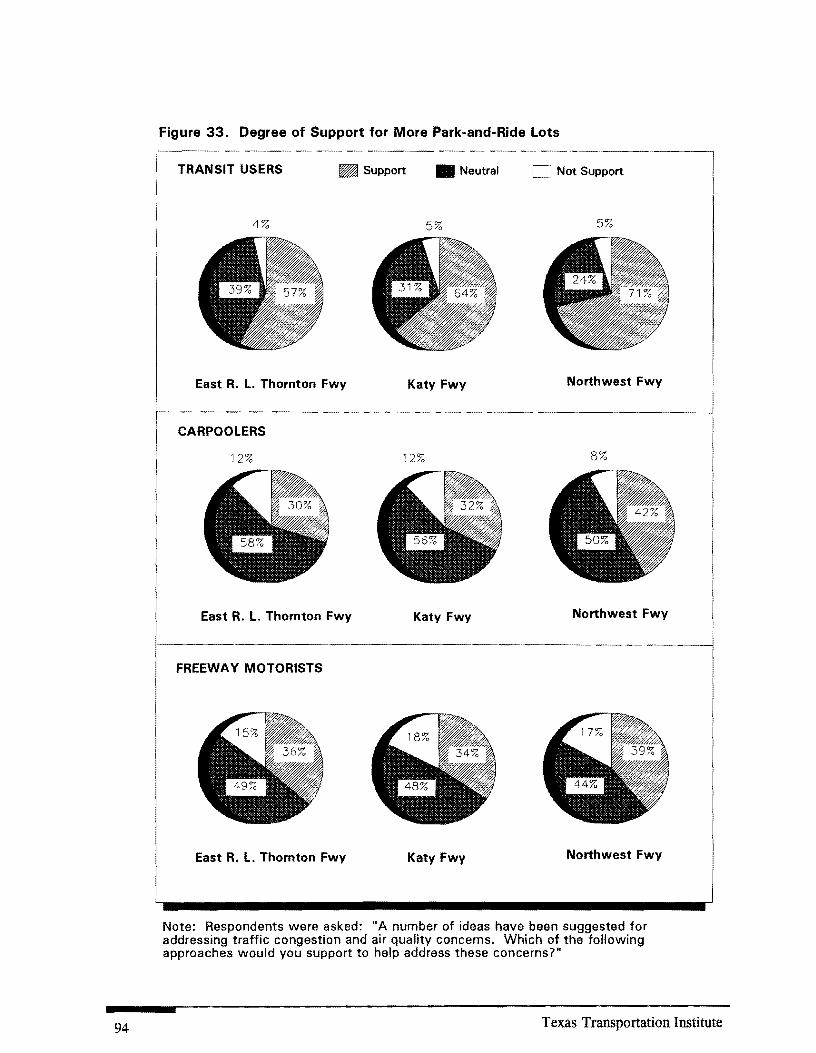
94
Figure 33. Degree of Support for More Park-and-Ride Lots
TRANSIT USERS ~ Support • Neutral Not Support
4% 5% 5%
East R. L. Thornton FwV Katv FwV Northwest FwV
CARPOOLERS
12% 12% 8%
East R. L. Thornton FwV Katv FwV Northwest FwV
FREEWA Y MOTORISTS
East R. L. Thornton FwV Katy Fwy Northwest FwV
Note: Respondents were asked: "A number of ideas have been suggested for addressing traffic congestion and air quality concerns. Which of the following approaches would you support to help address these concerns?"
Texas Transportation Institute

Figure 34. Degree of Support for the Addition of More HOV Lanes
TRANSIT USERS Support • Neutral D Not Support
4% 8% 6%
East R. L. Thornton Fwy Katy Fwy Northwest Fwy
CARPOOLERS
10% 6%
East R. L. Thornton Fwy Katy Fwy Northwest Fwy
FREEWAY MOTORISTS
East R. L. Thornton Fwy Katy Fwy Northwest Fwy
Note: Respondents were asked: "A number of ideas have been suggested for addressing traffic congestion and air quality concerns. Which of the following approaches would you support to help address these concerns?"
Texas Transportation Institute 95

96
Figure 35. Degree of Support for the Addition of More HOV lane Access Points
TRANSIT USERS ~ Support • Neutral Not Support
12%
East R. L. Thornton Fwy Katy Fwy Northwest Fwy
CARPOOLERS
East R. L Thornton Fwy Katy Fwy Northwest Fwy
FREEWAY MOTORISTS
East R. L. "rhornton Fwy Katy Fwy Northwest Fwy
Note: Respondents were asked: "A number of ideas have been suggested for addressing traffic congestion and air quality concerns. Which of the following approaches would you support to help address these concerns?"
Texas Transportation Institute

• Additional HOV Lanes. Carpoolers and bus riders strongly supported the development of additional HOV lanes, while freeway motorists were more neutral on this technique. Between 71 percent and 82 percent of carpoolers in the three corridors supported adding more HOV lanes. Support was also strong from bus riders with between 63 percent and 75 percent favoring this approach. Support among motorists in the three corridors averaged between 29 percent and 40 percent.
• Additional HOV Lane Access Points. Providing additional HOV lane access points received slightly lower levels of support than the other three strategies in this category.
Approximately half of the respondents in all three user groups supported this approach.
Support For Employer Programs to Encourage HOV Use
Survey respondents were asked to indicate their degree of support for several employerbased strategies to encourage HOV travel to and from the work site, including employer
incentives for transit and carpool use, flexible work hour arrangements, and telecommuting. As summarized below and illustrated in Figures 36 through 38, there was fairly strong support for these approaches among bus riders, carpoolers, and motorists in all three corridors.
• Incentives for Ridesbaring and Transit Use. Bus riders and carpoolers strongly supported the use of incentives by their employers. Over 80 percent of the Dallas bus riders and over 90 percent of the Houston passengers supported this approach.
Carpoolers' preference for employer incentives were slightly lower, ranging between 60 percent and 75 percent. Although they may not make use of these incentives, motorists still showed support for this approach with approximately half indicating approval.
• Flexible Work Hour Arrangements. All user groups in the three corridors expressed support for flexible work hour arrangements. Approximately 60 percent of all respondents indicated support for this incentive.
• Telecommuting. Telecommuting received a slightly lower level of support among all groups than flexible work hour arrangements, although at least 40 percent of the respondents in all three corridors favored this approach.
Texas Transportation Institute 97
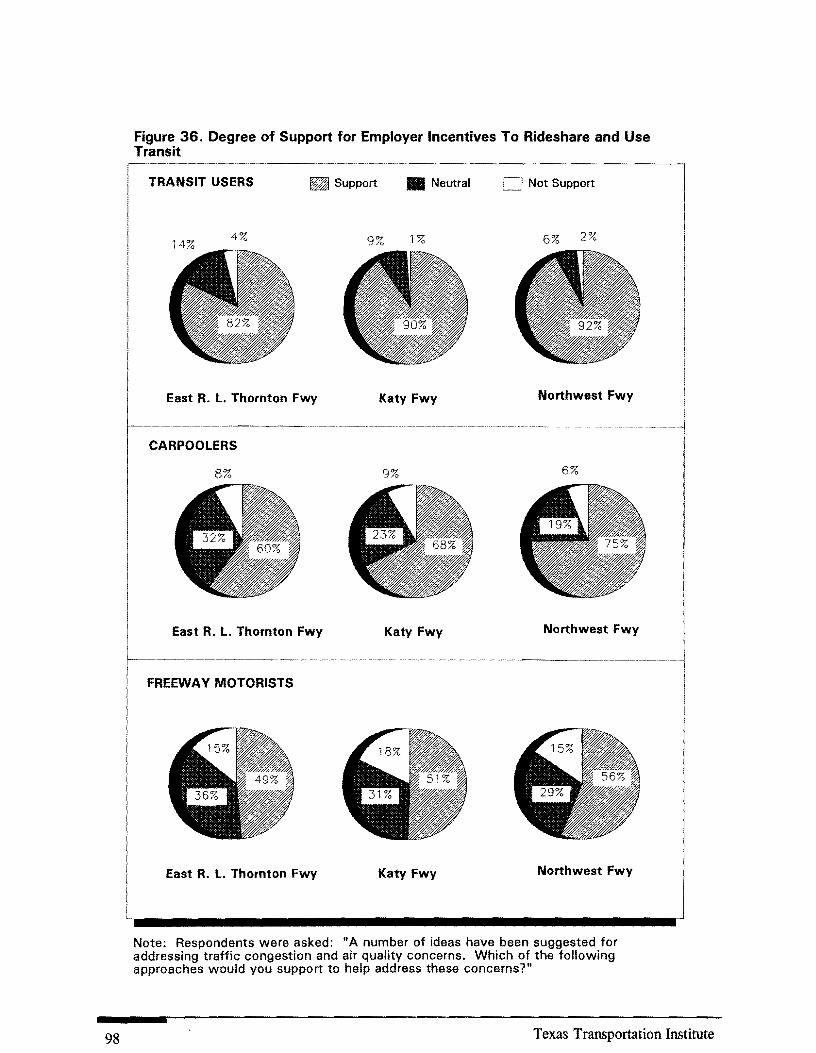
98
Figure 36. Degree of Support for Employer Incentives To Rideshare and Use Transit
TRANSIT USERS ~ Support • Neutral Not Support
9% 1% 6% 2%
East R. L. Thornton Fwy Katy Fwy Northwest Fwy
CARPOOLERS
8% 9% 6%
East R. L. Thornton Fwy Katy Fwy Northwest Fwy
FREEWAY MOTORISTS
East R. L. Thornton Fwy Katy Fwy Northwest Fwy
Note: Respondents were asked: "A number of ideas have been suggested for addressing traffic congestion and air quality concerns. Which of the following approaches would you support to help address these concerns?"
Texas Transportation Institute
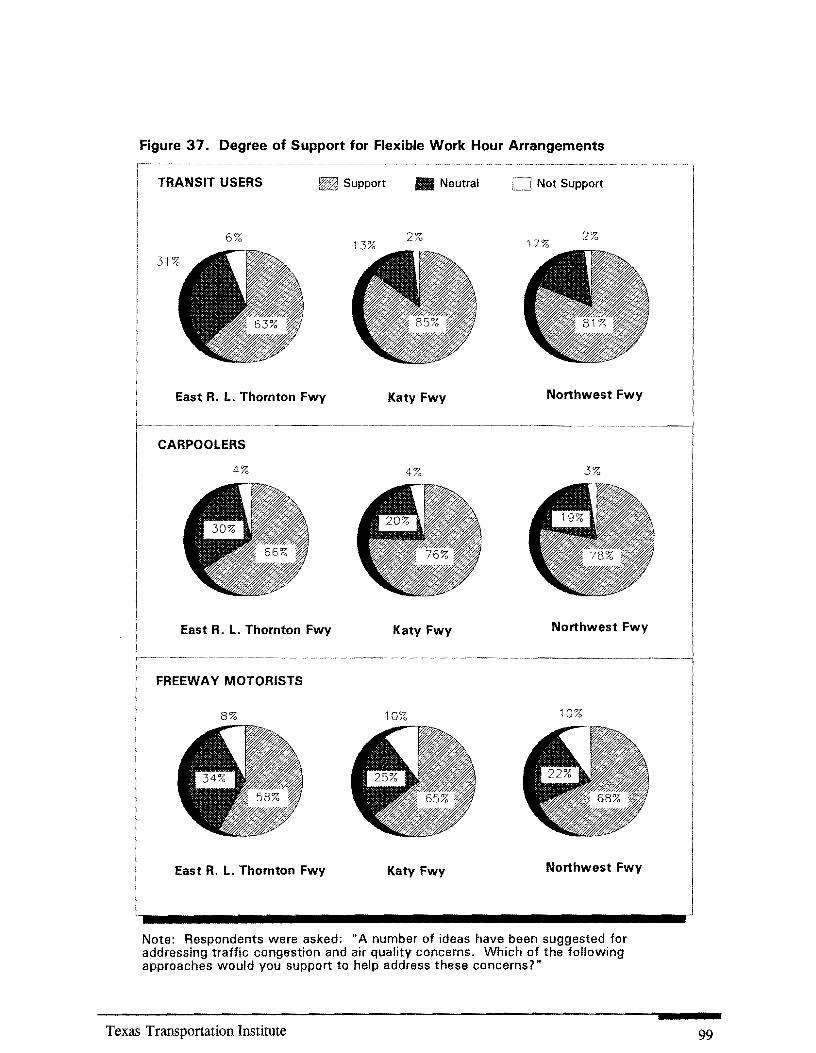
Figure 37" Degree of Support for Flexible Work Hour Arrangements
TRANSIT USERS Support l1li Neutral Not Support
6% 2% 17%
2%
East R. L. "rhornton Fwy Katy Fwy Northwest Fwy
CARPOOLERS
4% 4% 3%
East R. L. Thornton Fwy Katy Fwy Northwest Fwy
FREEWAY MOTORISTS
8% 10% 10%
East R. L. Thornton Fwy Katy Fwy Northwest Fwy
Note: Respondents were asked: "A number of ideas have been suggested for addressing traffic congestion and air quality concerns. Which of the following approaches would you support to help address these concerns?"
Texas Transportation Institute 99
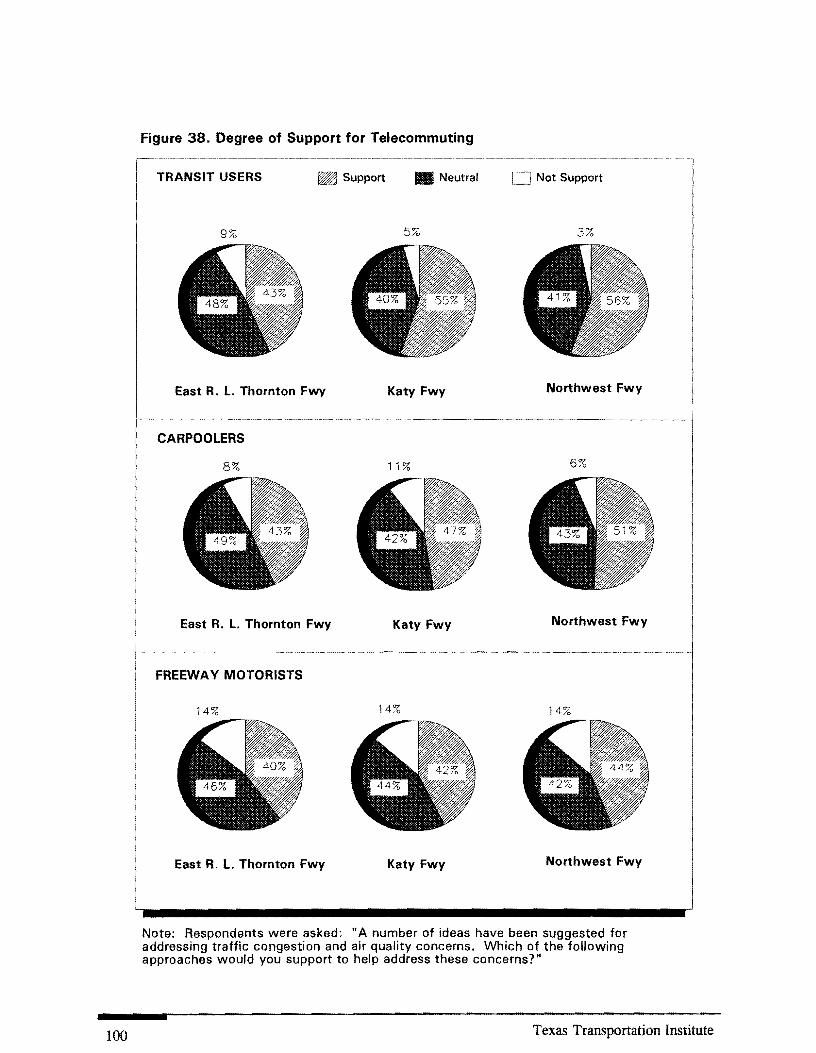
100
Figure 38. Degree of Support for Telecommuting
TRANSIT USERS ~ Support • Neutral Not Support
9% 5% 3%
East R. L. Thornton Fwy Katy Fwy Northwest Fwy
8% 11 % 6%
East R. L. Thornton Fwy Katy Fwy Northwest Fwy
FREEWAY MOTORISTS
14% 14% 14%
East R. l. Thornton Fwy Katy Fwy Northwest Fwy
Note: Respondents were asked: "A number of ideas have been suggested for addressing traffic congestion and air quality concerns. Which of the following approaches would you support to help address these concerns?"
Texas Transportation Institute

Support for Measures That Increase the Cost of Operating Automobiles
Three pricing strategies were included in the survey. These were higher parking charges, increased gasoline taxes, and charging for the use of roads or congestion pricing. As illustrated
in Figures 39 through 41 and summarized next, there was little support for these approaches by
any user group.
• Higher Parking Fees. None of the user groups in the three corridors supported higher parking fees for single-occupant vehicles. Less than 10 percent indicated support for
this approach, while between 65 percent and 80 percent noted they would not support
increased parking fees .
• Increased Gasoline Taxes. This strategy was also not supported by any group.
Between 84 percent and 93 percent of the respondents opposed higher gasoline taxes,
with 6 percent or less indicating any support for this approach .
• Charging for Use of Roads. At least 70 percent of the respondents in all user groups
in the three corridors would not support congestion pricing. Support for this approach
was 10 percent or less among the various groups.
Texas Transportation Institute 101

102
Figure 39. Degree of Support for Higher Parking Fees
TRANSIT USERS Support • Neutral Not Support
9% 7% 7%
East R. L. Thornton Fwy Katy Fwy Northwest Fwy
CARPOOLERS
2% 5% 3%
East R. L. Thornton Fwy Katy Fwy Northwest Fwy
FREEWAY MOTORISTS
5% 3% 4%
East R. L. Thornton Fwy Katy Fwy Northwest Fwy
Note: Respondents were asked: itA number of ideas have been suggested for addressing traffic congestion and air quality concerns. Which of the following approaches would you support to help address these concerns?"
Texas Transportation Institute
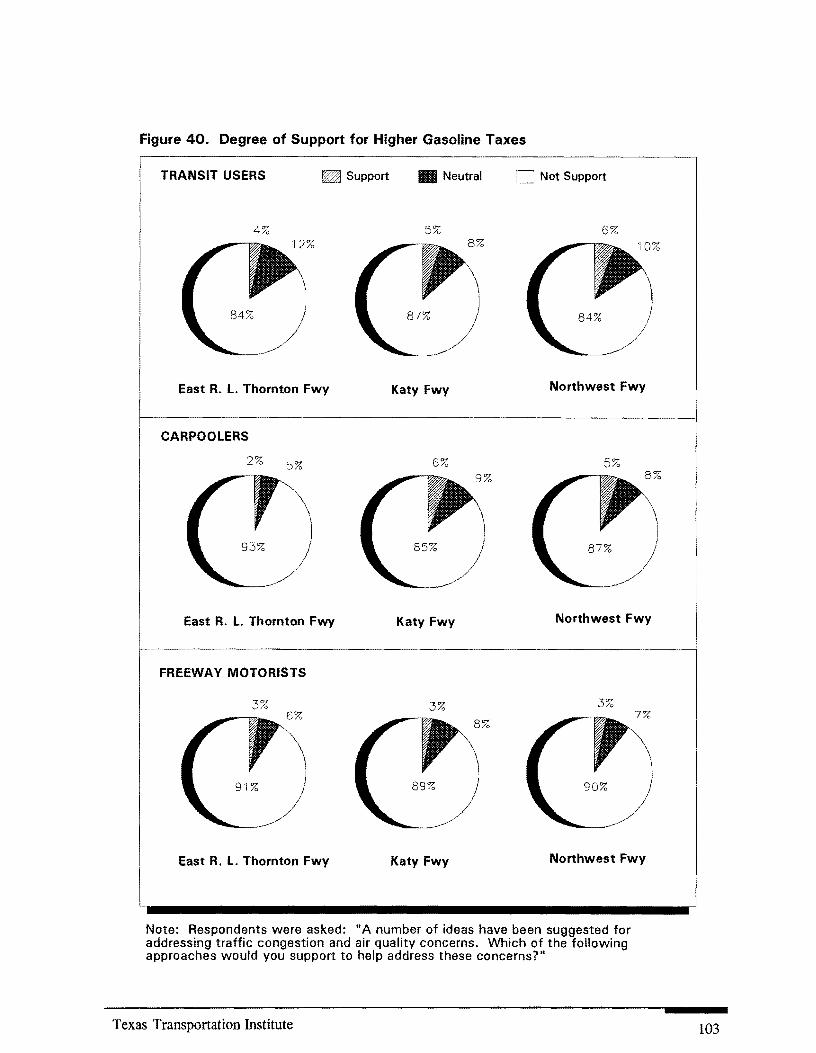
Figure 40. Degree of Support for Higher Gasoline Taxes
TRANSIT USERS Support .. Neutral Not Support
4% 5% 6%
East R. L. Thornton Fwy Katy Fwy Northwest Fwy
CARPOOLERS
2% 5% 6% 5%
East R. L. Thornton Fwy Katy Fwy Northwest Fwy
FREEWAY MOTORISTS
3% 6%
3% 3%
.~
East R. L. Thornton Fwy Katy Fwy Northwest Fwy
Note: Respondents were asked: II A number of ideas have been suggested for addressing traffic congestion and air quality concerns. Which of the following approaches would you support to help address these concerns?"
Texas Transportation Institute 103

104
Figure 41. Degree of Support for Charging For Use of Roads
TRANSIT USERS Support • Neutral Not Support
9% 8% 5%
20%
East R. l. Thornton Fwy Katy Fwy Northwest Fwy
CARPootERS
4% 10% 4%
17%
East R. t. Thornton Fwy Katy Fwy Northwest Fwy
FREEWAY MOTORISTS
4% 8% 4%
East R. l. Thornton Fwy Katy Fwy Northwest Fwy
Note: Respondents were asked: "A number of ideas have been suggested for addressing traffic congestion and air quality concerns. Which of the following approaches would you support to help address these concerns?"
Texas Transportation Institute

v. CONCLUSIONS
This report has provided an overview of strategies and techniques to encourage greater use of HOV and alternative commute modes. The national experience with different approaches was reviewed, and programs within Texas were assessed. Information from the national
literature review, the discussion groups, the Houston ETR plans, and the surveys of HOV lane users and non-users in Dallas and Houston were analyzed.
The results of this study indicate that a wide range of strategies, techniques, and
programs are in use throughout the state and the country to encourage alternative commute modes and other efforts aimed at managing demand on the transportation system. The results also suggest that some approaches are favored more than others by commuters, public agencies,
and private businesses in Texas. This information was used to better define the techniques that
appear most appropriate for further application in Texas and those that appear to have the
greatest chance of success.
This chapter reviews each of the 12 general strategies described previously and identifies those that appear to be most appropriate for further consideration in the state. Specific techniques within the 12 categories are highlighted as appropriate. Suggestions on potential
implementation approaches are also described, along with areas for additional research.
STRATEGIES FOR FURTHER APPLICATION
In assessing potential programs and strategies, it is important to remember some of the unique aspects of many metropolitan areas in Texas. These include low density land use and development patterns, fewer land use controls in some cities, a relatively stable source of funding for the metropolitan transit authorities (MTAs), and active private sector invovlement in many activities. Some of these factors, such as lower densities and the lack of land use controls in some areas, may work against strategies to encourage HOV and other alternate commute modes. Others, such as stable funding sources for the larger transit agencies and the active participation of the business community in various programs, provide opportunities to undertake new and innovative efforts. The potential to implement additional techniques and
programs in each of the twelve general areas are reviewed next. Those that appear most
appropriate for further use in Texas are highlighted, and the groups that should be involved in
implementing the techniques are identified.
Texas Transportation Institute 105
106
• Transit Services. The study results indicate that there is widespread support for expanding and enhancing transit services. Commuters, public agencies, and private businesses all responded favorably to strategies that enhance existing transit services, such as those oriented to the traditional markets, as well as innovative approaches to
serving new markets. Transit agencies in Texas are implementing new suburb-to
suburb, subscription, crosstown, reverse commute, and route deviation services to try to meet the needs of emerging markets. Expanding and enhancing transit services
should continue to be a high priority for transit agencies, businesses, TMOs, TxDOT, and other groups.
• Support Facilities. There was also strong support among all groups for additional facilities to enhance the use of transit and ridesharing. TxDOT, transit agencies, local communities, developers, businesses, and other groups should continue to pursue the development and operation of a wide range of supporting facilities. These may include HOV lanes, park-and-ride lots, transit centers, LRT and bus coordination, shelters, and
other facilities.
• Rideshare Programs. Widespread support was voiced for carpool and vanpool programs and other ridematching services. Although these programs are appropriate for all travel markets, targeting them to areas without fixed-route transit services and
to other markets that are hard to serve with more traditional transit modes should be a priority. New and innovative rideshare approaches, including real-time
ridematching, casual carpooling, and application of intelligent transportation system
(ITS) technologies, should be pursued rather than relying solely on the traditional
match list. Rideshare programs within transit agencies, TxDOT, MPOs, TMOs, and private businesses should continue to work together on these approaches.
• Guaranteed Ride Home Programs. The fact that guaranteed ride home programs were rated as the top enhancement on the Houston ETR surveys provides an indication of the value commuters place on these services. The results from the discussion groups further indicate that these programs have widespread support among top management in public agencies and private businesses. The state and national experience indicates that employees do not abuse the privileges of guaranteed ride
home programs, and, therefore, they are very cost effective. As a result, the use of guaranteed ride home programs should be actively pursued by public and private sector
groups in Texas.
Texas Transportation Institute

• Bicycling and Walking. Commuting by bicycling and walking elicit lower levels of
interest and support. The hot and humid weather during much of the year, long
commute distances, and the lack of showers and changing facilities at most
employment sites appear to limit the potential use of these strategies. Commuting by
bicycling and walking may have applications in some areas, however, and efforts to
promote these alternatives should be focused carefully on these opportunities. Cities,
MPOs, TxDOT, private businesses, and bicycle groups should work together on these
app lications .
• Employer Incentives. HOV lane users and non-users in Houston and Dallas and
employees in Houston responding to the ETR surveys view a number of employer
incentives positively. These included subsidizing bus passes, payroll deduction for
transit passes, on-site bus pass sales, and other incentives. The NCTCOG program
was the only effort identified which currently provides cash incentives for alternative
commute modes. Both the public and private sectors should be encouraged to continue
existing incentives and to develop new programs.
• On-Site Amenities. The results from the Houston ETR surveys and the discussion
groups indicate there is support for various on-site amenities. The provision of on-site
amenities or the addition of services in close proximity to major work sites should
continue to be explored and developed by private businesses and public agencies.
Given the costs involved with many on-site facilities, these efforts should be carefully
planned and implemented to help ensure that any amenities will be used by employees.
• Parking Management and Parking Pricing. These techniques have not been used extensively within Texas, although examples do exist of parking management programs
which provide preferential parking to carpools and vanpools. There was support among discussion group participants, as well as employees responding to the Houston ETR surveys and the Houston and Dallas HOV user and non-user surveys for preferential parking strategies for HOVs. Little support was voiced for parking pricing strategies, however. Given this lack of interest, it does not appear that widespread parking pricing programs will be used in the near future. It may be appropriate to consider a few demonstration projects focusing on parking pricing and supply strategies
to test these concepts.
• Work Schedule Management. Strong support was voiced by all groups for various
work schedule management strategies. Staggered schedules, flexible work hours, and
compressed work weeks rated the highest, followed by telecommuting. Management
Texas Transportation Institute 107

108
personnel in the discussion groups did raise some concerns with these techniques,
however, especially with telecommuting. These approaches are currently being used by both the public and private sectors and further implementation should be supported
by all groups. These techniques have beneficial impacts on the transportation system
and are of personal benefit to employees.
• Congestion Pricing. Little support was voiced for congestion pricing although some
interest was expressed for charging single-occupant vehicles for use of the HOV lanes
in Dallas and Houston. This approach may be more appropriate, and more amenable
to commuters, at some future point. Monitoring the assessment of a possible Houston
HOV lane demonstration and any test that may be conducted is appropriate. The
results of this project can be used to help assess the potential for additional applications
of congestion pricing in the state.
• Land Use and Development Regulations. Strategies involving greater coordination of land use and development patterns, public transportation, roadway improvements,
and other elements of the transportation system should be encouraged. These may
include providing joint development opportunities, enhancing planning and zoning
around major transit stations and park-and-ride facilities, and better integrating new
developments to support HOV use and alternative commute modes. Local
communities, private businesses, and developers will need to take the lead on these
strategies. TxDOT, transit agencies, MPOs, TMOs, and other groups can play
important roles supporting and assisting with the planning and implementation of these
techniques.
• Public Awareness Campaigns and New Organizational Structures. Many of the discussion group participants stressed the need for ongoing informational and educational efforts aimed at the general public, policy makers, and businesses. Continued support should be provided by all groups for the development, implementation, and ongoing use of public information campaigns and other related activities. The recent efforts undertaken in Austin and the Dallas/Fort Worth area, as well as the state wide program being developed by TxDOT, provide excellent examples of public informational efforts. Additional programs could be initiated in
other areas. TxDOT can playa key role in helping promote these activities. Further,
development and use of TMOs, TMAs, and other innovative organizational structures
should be encouraged. Providing ongoing support and technical assistance to these
Texas Transportation Institute

groups is appropriate. TxDOT, local agencies, MPOs, and private businesses should
all support these efforts and actively participate in the new organizations.
• Comprehensive Programs. Consideration should also be given to the development and implementation of comprehensive programs in major cities in Texas. Although
efforts have been made in this direction in some areas, additional elements may be
needed in various programs. All group s-TxDOT , transit agencies, MPOs, local
communities, TMOs, and private businesses-should be involved in the development
and implementation of comprehensive programs.
• Other Approaches. ITS technologies may help encourage the use of HOV and alternative commute modes. TTl, through the Texas A&M ITS Research Center of
Excellence, is currently exploring innovative applications of ITS technologies to
enhance the use of transit, carpools, vanpools, and other TDM strategies. TxDOT is
participating in these efforts, and possible demonstration projects may be implemented
in the future.
IMPLEMENTATION
A number of techniques are appropriate to help implement the strategies described in the
previous section. The successful planning, implementation, and ongoing operation of these
strategies will require the coordinated efforts of numerous groups. TxDOT, transit agencies,
MPOs, TMOs, local governments, private businesses, and other organizations will all need to
be involved. Further, a wide range of approaches can be used to help encourage the use of the
strategies described in this report. The following highlight a few of the techniques TxDOT and other groups may wish to consider.
• Videos. A video could be produced explaining the various strategies that can be used to encourage the use of HOVs and alternative commute modes. The video could include state and national examples, as well as describing techniques to plan and implement different approaches.
• Training Courses. A training course or seminar could be developed and offered
providing a summary of the various techniques and methods to plan and implement
specific elements. It might be appropriate to provide a general overview seminar for
policy and management level personnel and a more detailed course focusing on
technical staff.
Texas Transportation Institute 109

• Educational Outreach Program. TxDOT could utilize the new Don't Be An SOY program and other information to develop a state-wide educational outreach program. Such an effort would be aimed at the general public and could be coordinated with
local public and private sector groups throughout the state.
• Technical Assistance. A technical assistance program could be developed to provide ongoing support to TMOs, private businesses, public agencies, and other groups
interested in implementing the strategies discussed in this report. Such a program
could be developed and funded at the metropolitan level or at the state level.
• Use of Advanced Technologies. Electronic mail, a Home Page on the World Wide Web, and video and telephone conferencing could all be used to provide ongoing assistance, education, and outreach efforts. Consideration could be given to
coordinating these activities at the state level, through TxDOT, or at the regional level
through MPOs.
ADDITIONAL RESEARCH
This research project examined various techniques to encourage greater use of HOVs and
alternative commute modes. It built on previous studies conducted by TTl and others on the
factors that influence commute mode choice, commuter preferences toward different strategies,
and the impact of various techniques on commuter behavior. As such, it has helped enhance the
understanding of commute mode choice and the strategies that appear most appropriate for
further application in Texas.
Additional research in the future should focus on continuing to expand the level of knowledge in these areas. For example, it would be beneficial to monitor and evaluate the impact of new programs in the state, such as the NCTCOG payment for alternative mode use and the innovative transit services being implemented in many areas. Continuing research studies focusing on commuter behavior and the factors that influence mode choice will be important in the future.
110 Texas Transportation Institute

REFERENCES
1. Williams, J. "Texas Face Growing Pains Down the Road." Houston Chronicle.
November 21, 1994, llA.
2. Bullard, Diane L. An Assessment of Carpool Utilization of the Katy High-Occupancy
Vehicle Lane and the Characteristics of Houston's HOV Lane Users and Nonusers.
College Station, Texas: Texas Transportation Institute, 1991.
3. Henk, Russell H., Daniel E. Morris, and Dennis L. Christiansen. An Evaluation of High
Occupancy Vehicle Lanes in Texas, 1993. College Station, Texas: Texas Transportation
Institute, 1994.
4. Turnbull, Katherine F. An Assessment of High-Occupancy Vehicle Facilities in North
America: Executive Report. College Station, Texas: Texas Transportation Institute, 1992.
5. Lindquist, Nell Frazer, Kevin M. Hall, and Katherine F. Turnbull. Examination of
Policies and Programs Supporting Transit Use in Texas. College Station, Texas: Texas
Transportation Institute, 1994.
6. Pisarski, Alan E. Commuting in America-A National Report on Commuting Patterns and
Trends. Eno Foundation.
7. U. S. Department of Transportation. Emerging Travel Trends: Summary of the Conference
on Implications of Emerging Travel Trends-What Does the NPTS Tell Us? Washington,
D. C. : Federal Highway Administration, 1994.
8. Ball, William J. Commuting Alternatives in the United States: Recent Trends and a Look
to the Future. Washington, D.C.: U.S. Department of Transportation, 1994.
9. U.S. Bureau of Census. 1990 Census. Washington, D.C.: Bureau of Census, 1991.
10. Schrank, David, Shawn Turner, and Tim Lomax. Urban Roadway Congestion - 1982 to
1992. College Station, Texas: Texas Transportation Institute, 1995.
Texas Transportation Institute 111
11. Crain and Associates. San Bernardino Freeway Busway Evaluation of Mixed-Mode
Operations. Los Angeles, California: California Department of Transportation, 1978.
12. Valdez, R. and C. Arce. "Comparison of Travel Behavior and Attitudes of Rideshare,
Solo Drivers, and the General Commuter Population." 105-108. In Transportation
Research Record 1285. Washington, D.C.: Transportation Research Board, 1990.
13. Cervero, Robert and Bob Griesenbeck. "Factors Influencing Commuting Choices in
Suburban Labor Markets: A Case Study of Pleasanton, California." 151-161. In
Transportation Researcher Volume 22A, Number 3. Washington, D.C.: Transportation
Research Board, 1988.
14. Turnbull, Katherine F. High-Occupancy Vehicle Project Case Studies: Historical Trends
and Project Experiences. College Station, Texas: Texas Transportation Institute, 1992.
15. Association for Commuter Transportation and Municipality of Metropolitan Seattle.
Proceedings of the Commuter Parking Symposium. Seattle, Washington: Association for
Commuter Transportation and Municipality of Seattle, 1990.
16. Strgar-Roscoe-Fausch, Inc. 1-394 Phase III Evaluation-Final Report. Minneapolis,
Minnesota: Minnesota Department of Transportation, 1995.
17. Texas Transportation Institute and Washington State Transportation Center. 1-5 North
High-Occupancy Vehicle Lane 2+ Occupancy Requirement Demonstration Evaluation.
Seattle, Washington: Washington State Department of Transportation, 1992.
18. American Public Transit Association. Reverse Commute Strategies. Washington, D.C.: American Public Transit Association, 1994.
19. Regional Transit Board. Transit Service Needs Assessment. St. Paul, Minnesota: Regional Transit Board, 1988.
20. Turnbull, Katherine. Public Transportation: Challenges and Opportunities. Resource
paper prepared for the Transportation Research Board Workshop on Public Transportation
Management and Planning in a Rapidly Changing Environment, Irvine, California, July
27-29, 1995. Publication forthcoming.
112 Texas Transportation Institute

21. Urban Mobility Corporation. Private Sector Briefs: ACCEL Transportation. Washington, D.C.: Federal Transit Administration, 1992.
22. SRF, Inc. 1-394 Transportation Management System Plan. Minneapolis, Minnesota: Minnesota Department of Transportation, 1984.
23. Turnbull, Katherine F. Synthesis of Highway Practice 213: Effective Use of Park-and
Ride Facilities. Washington, D.C.: Transportation Research Board, 1995.
24. Turnbull, Katherine F. A Description of High-Occupancy Vehicle Facilities in North
America. College Station, Texas: Texas Transportation Institute, 1990.
25. Balicki, John, Greg Roche, and Larry Mahar. "The GeoMatch Ride Matching System."
In 1995 National Association for Commuter Transportation Conference Proceedings,
September 17-20, Houston, Texas, 45-59. Washington, D.C., Association for Commuter
Transportation, 1995.
26. Urban Mobility Corporation. Private Sector Briefs: Innovative Rideshare Programs.
Washington, D. C. : Federal Transit Administration, 1993.
27. Comsis Corporation. Implementing Effective Travel Demand Management Measures:
Inventory of Measures and Synthesis of Experience. Washington, D.C.: Federal Highway
Administration, 1993.
28. Kadesh, Eileen and Laurie Elder. "Guaranteed Ride Home: An Insurance Program for
HOV Users." In Transportation Research Record 1212. Washington, D.C.:
Transportation Research Board, 1980.
29. Comsis Corporation. A Guidance Manual for Implementing Effective Employer-Based
Travel Demand Management Programs. Washington, D.C.: U.S. Department of
Transportation, 1993.
30. Dunphy, Robert and Ben C. Lin. Transportation Management through Partnerships.
Washington, D.C.: The Urban Land Institute, 1990.
31. Olwin, Jeanne E. and Minh Q Thai. "Glendale TMA Parking Management Program."
In 1995 National Association for Commuter Transportation Conference Proceedings,
Texas Transportation Institute 113

September 17-20, Houston, Texas, 273-276. Washington, D.C., Association for
Commuter Transportation, 1995.
32. Higgins, Thomas J. Parking Management and Traffic Mitigation in Six Cities:
Implicationsjor Local Policy, Transportation Research Record 1232. Washington, D.C.:
Transportation Research Board, 1981.
33. Shoup, Donald and Richard Willson. "Employer-Paid Parking: The Problem and Proposed
Solutions," Transportation Quarterly, 46: 169-192, 1992.
34. Pratt, Richard H. "Employer Parking Pricing and Incentive Programs that Change Modal
Split," TDM Review, 1:13-17,1993.
35. Arrington, B. G. "Light Rail and Land Use: A Portland Success Story." In Light Rail
Transit: New Successes at Affordable Prices. Washington, D.C.: Transportation
Research Board, 1989.
36. Turnbull, Katherine F. High-Occupancy Vehicle Project Case Studies: History and
Institutional Arrangements. College Station, Texas: Texas Transportation Institute, 1990.
37. Turnbull, Katherine F., Laura Higgins, and Darryl Puckett. Potential oj Telecommuting
jor Travel Demand Management. College Station, Texas: Texas Transportation Institute,
1995.
38. Downs, Anthony. Stuck in Traffic: Coping with Peak-Hour Traffic Congestion.
Washington, D.C.: The Brookings Institution and Cambridge, Massachusetts: The
Lincoln Institute of Land Policy, 1992.
39. Hall, Kevin M. and Katherine F. Turnbull. Design Guidelines to Enhance Pedestrian and Transit Interaction. College Station, Texas: Texas Transportation Institute, 1994.
40. Ringrose, Michael R. and Katherine F. Turnbull. Financial Benefits Associated with the Joint Development and Use oj Transit Facilities in Texas. College Station, Texas: Texas
Transportation Institute, 1992.
41. Linsey, Rita. "Tap into Win-Win Partnerships-American Lung Association Clean Air
Month Campaign." In 1995 National Association jor Commuter Transportation
114 Texas Transportation Institute

Conference Proceedings, September 17-30, Houston, Texas, 171-182. Washington, D.C.: Association for Commuter Transportation, 1995.
42. Billheimer, John W., J. B. Moore, and Heidi Stamm. High-Occupancy Vehicle Lane
Marketing Manual. Washington, D.C.: Federal Highway Administration, 1994.
43. GO Boulder Newsletters, 1994 and 1995.
44. Urban Mobility Corporation. Private Sector Briefs: University of Washington U-Pass
Program. Washington, D.C.: Federal Transit Administration, 1993.
Texas Transportation Institute 115


APPENDIX A-SCRIPT FOR PRIVATE SECTOR DISCUSSION GROUPS
ENCOURAGING HOV USE-DISCUSSION QUESTIONS FOR PRIVATE SECTOR
The Texas Transportation Institute (TTl), a part of The Texas A&M University System,
is conducting a research project for the Texas Department of Transportation (TxDOT) focusing
on techniques that can be used to encourage greater use of high-occupancy vehicles (HOV) ,
including buses, carpools and vanpools, and other strategies to better manage demand on the
transportation system. As part of this study, information is being gathered from major
employers and businesses to obtain a better understanding of employer-based strategies and
approaches that impact private sector groups. The intent of this element of the study is to
develop a realistic assessment of approaches to encourage HOV use that the private sector may
feel are most appropriate and the potential issues associated with implementation of the identified
strategies.
Your help in this effort is greatly appreciated. The following list of questions is provided
for discussion. In addition, please feel free to write any comments and return them at the end
of the meeting, or mail them to the address given at the end of this form. Thank you again for
your assistance!
I. In general, how do your employees get to and from work? Do you have any idea of the
approximate number or percentage who take the bus, carpool, vanpool, or drive alone?
II. Has your company implemented, or are you considering, any of the following programs to help encourage greater use of high-occupancy commute modes?
• Subsidize employee transit use (passes, vouchers, etc.).
• Promote rideshare programs.
-In-house.
-Transit agency program.
• Guaranteed Ride Home program.
Texas Transportation Institute 117

• Provide other incentives to employees to use bus or carpoollvanpool.
• Allow employees to work alternative schedules? If yes, what type of schedules are used?
• Allow employees to telecommute, part- or full-time?
III. Do you plan to implement any other programs or strategies to encourage HOV use?
IV. Are there any factors that limit the ability of your company to implement any strategies
to encourage HOV use?
V. Studies have indicated that the cost and location of parking has a significant impact on
commute mode choice. Do you provide free parking for your employees?
• If your company charges for parking, what is the rate?
• How far from your workplace is employee parking located?
• Would you consider initiating parking charges, or raising parking fees, to encourage greater use of alternative commute modes?
VI. Do you have, or do you intend to add, any physical amenities to encourage alternate commute modes-such as bus shelters, sidewalks from transit stops, bike racks, and shower facilities?
• Would you consider adding any of these?
VII. What interaction have you had with METRO, DART, TxDOT, and other public agencies
to help with your programs? What could these agencies do to help you implement various
strategies to encourage HOV use?
118 Texas Transportation Institute

VIII. In general, how effective do you think: the following strategies are at reducing the use of
single-occupant vehicles and encouraging HOVs, from an employee and employer
perspective?
• Car/Vanpooling programs.
• Employer programs:
-Financial incentives to employees.
-In-house rideshare programs.
-Guaranteed ride home services.
-Alternative work arrangements.
-Telecommuting.
-Transportation management organizations/associations.
• Parking management-including preferential parking for car/vanpool vehicles, charging
for parking, raising parking fees.
• Transit education and outreach programs.
• Enhanced transit services-from transit providers.
-Reverse commute programs.
-High-occupancy vehicle facilities.
-Park-and-ride lots.
-Express bus service.
-Suburb-to-suburb services.
• Employer support services provided by transit agencies.
Texas Transportation Institute 119
• Increasing the costs of owning and operating automobiles.
• Planning policies, land use controls, and development regulations to guide growth in denser patterns.
• Joint development and site design improvements.
IX. Congestion pricing-or charging commuters for use of roadways during different times of
the day-has been discussed recently at the national and local level. How do you think
your employees would react to this concept?
X. Is your company required to draft a trip reduction plan under the Clean Air Act
Amendments?
XI. Do you have any other suggestions or ideas for approaches to encourage high-occupancy
vehicle use that should be considered in the Houston area?
Thank you for your time. If you have any questions on this discussion guide, or would
like to provide additional information, please contact Kevin Hall, Nell Lindquist, or Patricia Turner by telephone at (409) 845-1535, or send your comments to their attention at:
120
Texas Transportation Institute Systems Planning Division Texas A&M University System College Station, TX 77843-3135
Texas Transportation Institute
APPENDIX B-SCRIPT FOR PUBLIC AGENCY DISCUSSION GROUPS
ENCOURAGING HOV USE-DISCUSSION QUESTIONS FOR PUBLIC SECTOR
The Texas Transportation Institute (TTl), a part of The Texas A&M University System,
is conducting a research project for the Texas Department of Transportation (TxDOT) focusing
on techniques that can be used to encourage greater use of high-occupancy vehicles (HOV),
including buses, carpools and vanpools, and other strategies to better manage demand on the
transportation system. As part of this study, infonnation is being gathered from both public and
private sector representatives to obtain a better understanding of various policies and strategies
that impact commute mode choice. The intent of this element of the study is to develop a
realistic assessment of approaches to encourage HOV use that representatives of public agencies
may feel are most appropriate, and the potential issues associated with implementation of the
identified strategies. In addition, this discussion is intended to gather infonnation on any current
and future strategies used by public agencies to encourage HOV use among their own
employees.
Your help in this effort is greatly appreciated. The following list of questions is provided
for discussion. In addition, please feel free to write any comments and return them at the end
of the meeting, or mail them to the address given at the end of this fonn. Thank you again for
your assistance!
I. What agency or governmental entity do you represent?
II. In general, how do the employees of your organization get to and from work? Do you
have an idea of the approximate number or percentage who:
• Take the bus.
• Carpool.
• Vanpool.
• Drive alone.
Texas Transportation Institute 121
III. Are there any factors that limit the ability of your agency to implement strategies to encourage HOV use?
IV. Has your agency implemented, or are you considering, any of the following programs
to help encourage greater use of high-occupancy commute modes?
• Subsidize employee transit use (passes, vouchers, etc.)
• Promote rides hare programs: -In-house.
-Local transit agency .
• Guaranteed Ride Home program.
• Allow employees to work alternative schedules? If so, type of schedules are used?
• Allow employees to telecommute, part- or full-time?
• Other programs or strategies to encourage HOV use? (Please specify).
V. Studies have indicated that the cost and location of parking has a significant impact on
commute mode choice.
122
• Do you provide free parking for your employees?
• If your agency charges for parking, what is the rate?
• How far from your workplace is employee parking located?
• Would you consider initiating parking charges, or raising parking fees, to encourage greater use of alternative commute modes?
Texas Transportation Institute
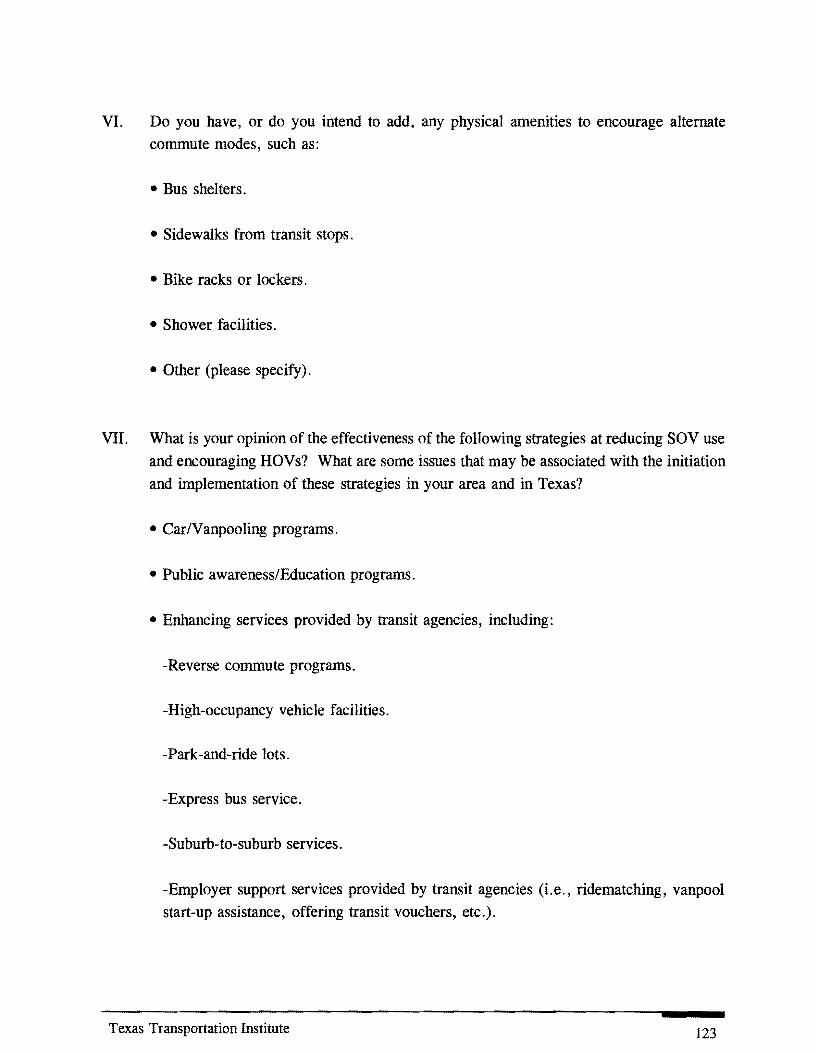
VI. Do you have, or do you intend to add, any physical amenities to encourage alternate
commute modes, such as:
• Bus shelters.
• Sidewalks from transit stops.
• Bike racks or lockers.
• Shower facilities .
• Other (please specify).
VII. What is your opinion of the effectiveness of the following strategies at reducing SOV use
and encouraging HOVs? What are some issues that may be associated with the initiation
and implementation of these strategies in your area and in Texas?
• Car/Vanpooling programs.
• Public awareness/Education programs.
• Enhancing services provided by transit agencies, including:
-Reverse commute programs.
-High-occupancy vehicle facilities.
-Park-and-ride lots.
-Express bus service.
-Suburb-to-suburb services.
-Employer support services provided by transit agencies (Le., ridematching, vanpool
start-up assistance, offering transit vouchers, etc.).
Texas Transportation Institute 123

• Planning policies, land use controls, and development regulations to guide growth in
denser patterns.
• Joint development and site design improvements.
• Parking management-including preferential parking for car/vanpool vehicles, charging for parking, raising parking fees, parking caps.
• Congestion pricing-charging commuters for use of roadways during different times
of the day.
VIII. Do you have any other suggestions or ideas for approaches to encourage high-occupancy
vehicle use that should be considered for your area and for Texas?
Thank you for your time. If you have any questions on this discussion guide, or would
like to provide additional infonnation, please contact Kevin Hall, Nell Lindquist, or Patricia
Turner by telephone at (409) 845-1535, or send your comments to their attention at:
124
Texas Transportation Institute
Systems Planning Division
Texas A&M University System
College Station, TX 77843-3135
Texas Transportation Institute

APPENDIX C-DISCUSSION GROUP PARTICIPANTS
HOUSTON TMO COALITION
Tuesday, October 25, 1995
Name
Cindy Sparkman Will Sieber Larry Willis Bill Kennedy Susan Sugarbaker Diane Coufer Sharon Barnes Malisa Stanley Susan Renner Sammy Woody Rod Branch
Representing
Apache Corp/TREC Mitchell Energy & Development Corp. Continental Airlines M.D. Anderson Texas Medical Center M.D. Anderson Rockwell/CLTP/CLASP North Houston Association West Houston Association Shell Oil Company EOTT Energy Corporation
NORTH CENTRAL TEXAS COUNCIL OF GOVERNMENTS
January 20, 1995
Name
Lisa Pyles, Chairman Dave Davis, Vice Chairman Wallace Ewell, Secretary Nancy Amos Deanna Anderson John Baumgartner Roger Beall Kent Bell Rick Berry John Blain Trip Brizell J. Milton Brooks John Brunk Larry Cervenka Jerry Clark Walter Cooper Don Cranford
Texas Transportation Institute
Representing
RAILTRAN City of Farmers Branch Texas Department of Transportation, Fort Worth Fort Worth Transportation Authority Fort Worth Transportation Authority City of Addison Texas Department of Transportation, Austin City of Irving City of Mesquite Texas Department of Transportation, Dallas Dallas Area Rapid Transit City of Dallas City of Dallas City of Garland City of Denton City of Fort Worth Dallas County
125

Clarence Daugherty Frank Davis Tom Dingler Jim Driscoll Ron Epps Rondell Fagan Steve Gilbreath James Griffin Jerry Hodge George Human Michael Jones Mary Kaderka Paul Kruckemeyer Richard Larkins Gordon Mayer Don McChesney Mark Mendez Emil Moncivais Koorosh Olyai Phillip Patterson Richard Peterson Terry Sams Sue Scanlan Dave Schultz Dennis Schwartz Bud Smallwood Wilma Smith Jim Sparks Cissy Sylo Paul Tiley Mike Walker Tom Walton Mary Wieder Dallas Williams Richard Williams Mark Young
126
Collin County Ellis County City of Lewisville City of Irving City of Bedford Texas Department of Transportation, Fort Worth Town of Flower Mound Texas Turnpike Authority City of Grapevine City of Richardson Denton County City of Dallas City of Euless City of Grand Prairie City of DeSoto Tarrant County Tarrant County City of Fort Worth Dallas Area Rapid Transit City of Haltom City Dallas County Texas Department of Transportation, Dallas City of Arlington City of Garland City of Duncanville City of University Park City of Arlington City of Hurst City of Carrollton Texas Department of Transportation, Austin Johnson County City of Plano City of North Richland Hills City of Fort Worth Rockwall County Texas Department of Transportation Regional Planning Office
Texas Transportation Institute
DALLAS CHAMBER OF COMMERCE
February 7, 1995
Name
Vic Travis Jeff McLaughlin Don Lenz Tom Barton Charlie Davidson Terri West Lois Smith Allen Curry
Representing
TV Service Texas Instruments GTE Central & Southwest Services Southwestern Bell OGA EDS EDS Greater Dallas Area Chamber of Commerce
AUSTIN VOLUNTARY TRIP REDUCTION PROGRAM (V-TRIP) COMMITTEE
March 2, 1995
Name
Nancy Ledbetter Jenny Peterman Charlie Albert Karen Glynn Joel Brundrett Ita Vfot Kim Herndon Scott Fieldman
Texas Transportation Institute
Representing
Austin Transportation Study Texas Department of Transportation City of Austin City of Austin, Public Works and Transportation City of Austin, Public Works and Transportation Texas Natural Resource Conservation Commission Texas Natural Resource Conservation Commission City of Austin, Public Works and Transportation
127


APPENDIX D-SVRVEY RESULTS
Texas Transportation Institute 129

NORTHWEST HOV LANE BUS RIDER SURVEY
This survey is being undertaken by the Texas Transportation Institute, for the Texas Department of Transportation, in cooperation with the Metropolitan Transit Authority of Harris County. The survey is intended to obtain information about your use of the Northwest HOV lane. Please take a few minutes to answer the Questions below and return this form to the survey taker before leaving the bus. Thank you for your assistance.
1. What is the purpose of your bus trip this morning? 99.4Work 0.4School 0.20ther (specifyl __
2. What is your home Zip Code? ____________________________ _
3. What is your final destination on this trip? ~ Downtown -1:.5... Texas Medical Center -1:.5...0ther (specify Zip Code below I ..J...,.L Greenway Plaza -1:.5... Galleria area
4. Why did you choose to ride the bus? (Please check all that apply.) 57.1 Employer pays part of fare 56.3 Free time to read/work 27.0 Environmental concerns 52.4 Cheaper than driving 26.4 Time savings 6.3 Other (specify) ____ _ 74.4 More convenient than driving ~ No car available
5. How did you get to the location where you boarded the bus? (Please check one.) 88.2 Drove alone to park-and-ride lot 0.4 Walked to bus stop 0.4 Dropped off at park-and-ride lot 3.0 Dropped off at bus stop 7.9 Carpooled to park-and-ride lot -1L Other (specify) ______________ _
6. How many miles is it from your home to the park-and-ride lot or bus stop? ....:6=::".c;.:4 __ (~m!.!:e:::a~n!LI ______ _
7. How many blocks is your final destination from the stop where you get off the bus? 1.9 (mean)
8. Have you ever carpooled or vanpooled on the Northwest HOV lane? 58.0 Yes, carpooled 1.4 Yes, vanpooled 40.6 No
9. How important is the Northwest HOV lane in your decision to ride the bus? 87.8 Very important J!JL Somewhat important 2.4 Not important
10. If the HOV lane did not exist, would you be riding a bus now? 25.9 Yes 35.3 No 38.8 Not sure
11. How many minutes, if any, do you believe this bus saves by using the HOV lane instead of the regular traffic lanes?
17.0 Minutes in the morning 18.1 Minutes in the evening
12. How long have you been using the bus on the Northwest HOV lane? 35.3 months (mean)
13. Before you began riding a bus on the Northwest HOV lane, how did you normally make this trip? (Please check one.)
14.
42.8 Drove alone ~ Rode a park and ride bus on the regular freeway lanes . .1.1:.§.. Carpooled ..J...,.L Rode a regular route or express bus. 8.0 Vanpooled 24.9 Did not make this trip prior to using the Northwest HOV lane.
8.6 Other (specify) ___________________ _
Does your employer provide any of the following? 81 .9 Pays part/all of bus pass. 47.9 Allows some type of flexible work hours. 2.8 Allows telecommuting.
30.6 Pays part/all parking fees.
(Please check all that apply.) 19.9 Guaranteed ride home program. 7.4 Rideshare matching program. 6.7 Vanpool program.
2.&.. Preferential parking for carpools/vanpools.
15. Do you feel that the HOV lane is presently being sufficiently utilized? 70.9 Yes 10.7 No 18.4 Not sure
130 Texas Transportation Institute

16. A number of ideas have been suggested for addressing traffic congestion and air quality concerns. Which of the following approaches would you support to help address these concerns?
Expand bus service More park-and-ride lots Add more HOV lanes Add HOV lane access points Flexible work hour arrangements Charging more for parking Employer incentives for use of buses/ridesharing Telecommuting Charging for use of roads Higher gasoline taxes
17. What is your ... Age? 38.3 (mean) Sex? Male - 48.9 Female - 51.1
18. What is the last level of school you completed? 14.7
Please use the back of this form to provide any additional comments.
THANK YOU FOR YOUR COOPERA TlON.
Texas Transportation Institute
Occupation? __ _
131

KATY HOV LANE BUS RIDER SURVEY
This survey is being undertaken by the Texas Transportation Institute, for the Texas Department of Transportation, in cooperation with the Metropolitan Transit Authority of Harris County. The survey is intended to obtain information about your use of the Katy HOV lane. Please take a few minutes to answer the questions below and return this form to the survey taker before leaving the bus. Thank you for your assistance.
1. What is the purpose of your bus trip this morning? 99.0 Work 0.4 School 0.6 Other (specifyl.
2. What is your home Zip Code? ____________________________ _
3. What is your final destination on this trip? 93.1 Downtown .l:.L Texas Medical Center ..1..:L Other (specify Zip Code below) 0.2 Greenway Plaza ~ Galleria area
4. Why did you choose to ride the bus? (Please check all that apply.) 47.9 Employer pays part of fare 49.4 Free time to readlwork 30.2 Environmental concerns 46.0 Cheaper than driving 39.3 Time savings .L.L Other {specify) ____ _ 75.2 More convenient than driving 4.6 No car available
5. How did you get to the location where you boarded the bus? (Please check one.) 88.4 Drove alone to park-and-ride lot 0.8 Walked to bus stop 0.2 Dropped off at park-and-ride lot ..L..L Dropped off at bus stop 9.0 Carpooled to park-and-ride lot 0.6 Other (specify) _____________ _
6. How many miles is it from your home to the park-and-ride lot or bus stop? ---=6"".7"'--l(,.,.m:..:e:..::a""n .... ) ______ _ 7. How many blocks is your final destination from the stop where you get off the bus? 1.9 (mean) 8. Have you ever carpooled or vanpooled on the Katy HOV lane?
55.7 Yes, carpooled ..1..d. Yes, vanpooled 43.0 No
9. How important is the Katy HOV lane in your decision to ride the bus? 92.7 Very important 4.8 Somewhat important ..bJL Not important
10. If the HOV lane did not exist, would you be riding a bus now? 17.9 Yes 50.3 No 31.9 Not sure
11. How many minutes, if any, do you believe this bus saves by using the HOV lane instead of the regular traffic lanes? 22.6 (mean) Minutes in the morning 26.1 (mean) Minutes in the evening
12. How long have you been using the bus on the Katy HOV lane? 41.6 months (mean) 13. Before you began riding a bus on the Katy HOV lane, how did you normally make this trip?
(Please check one.)
14.
46.0 Drove alone ...;LL Rode a park and ride bus on the regular freeway lanes . ..1.JL Carpooled 0.2 Rode a regular route or express bus . ..IJL Vanpooled 29.8 Did not make this trip prior to using the Katy HOV lane.
M.. Other (specify) ___________________ _
Does your employer provide any of the following? 76.3 Pays partlall of bus pass. 43.8 Allows some type of flexible work hours. ...1&.. Allows telecommuting. 26.3 Pays partlall parking fees.
(Please check all that apply.) 18.9 Guaranteed ride home program. 9.0 Rideshare matching program . 6.9 Vanpool program.
.L.L Preferential parking for carpools/vanpools.
15. Do you feel that the HOV lane is presently being sufficiently utilized? 63.7 Yes 16.9 No 19.4 Not sure
132 Texas Transportation Institute

16. A number of ideas have been suggested for addressing traffic congestion and air quality concerns. Which of the following approaches would you support to help address these concerns?
Expand bus service More park-and-ride lots Add more HOV lanes Add HOV lane access points Flexible work hour arrangements Charging more for parking Employer incentives for use of buses/ridesharing Telecommuting Charging for use of roads Higher gasoline taxes
17. What is your ... Age? 38.0 (mean) Sex? Male - 42.6 Female - 57.4
18. What is the last level of school you completed? 14.99
Please use the back of this form to provide any additional comments.
THANK YOU FOR YOUR COOPERA TION.
Texas Transportation Institute
Occupation ? __ _
133
EAST R. L. THORNTON HOV LANE BUS RIDER SURVEY
This survey is being undertaken by the Texas Transportation Institute, for the Texas Department of Transportation, in cooperation with Dallas Area Rapid Transit (DART). The survey is intended to obtain information about your use of the East R. L Thomton HOV lane. Please take a few minutes to answer the questions below and return this form to the survey taker before leaving the bus. Thank you for your assistance.
1. What is the purpose of your bus trip this morning? 87.8 Work jihLSchooi ~Other (specify!.
2. What is your home Zip Code? ____________________________ _
3. What is your final destination on this trip? 88.0 Downtown Dallas 1.3 Las Colinas 0.8 Galleria 0.9 Park Central 1 .1 Market Center 0 DFW Airport 7.9 Other (specify Zip Code) _______ _
4. Why did you choose to ride the bus? (Please check all that apply.) 38.8 Employer pays part of fare 35.0 Free time to readlwork 20.9 Environmental concerns 52.2 Cheaper than driving 13.0 Time savings 6.5 Other (specify) ____ _ 51.5 More convenient than driving 31.5 No car available
5. How did you get to the location where you boarded the bus? (Please check one.) 38.2 Drove alone to park-and-ride lot 41.2 Walked to bus stop ~4.. Dropped off at park-and-ride lot ....!bL Dropped off at bus stop ...L.L Carpooled to park-and-ride lot 4.4 Other (specify) _____________ _
6. How many miles is it from your home to the park-and-ride lot or bus stop? 2.8 miles (mean)
7. How many blocks is your final destination from the stop where you get off the bus? 2.3 blocks (mean)
8. Have you ever carpooled or vanpooled on the East R. L. Thornton HOV lane? 25.0 Yes, carpooled ..L..§.. Yes, vanpooled 73.5 No
9. How important is the East R. L. Thornton HOV lane in your decision to ride the bus? 64.6 Very important 19.4 Somewhat important 16.0 Not important
10. If the HOV lane did not exist, would you be riding a bus now? 74.2 Yes J!JL No 17.2 Not sure
11. How many minutes, if any, do you believe this bus saves by using the HOV lane instead of the regular traffic lanes? 13.4 (mean) Minutes in the morning 12.3 (mean) Minutes in the evening
12. How has construction of the Fair Park Bridge affected your travel times? .2d.Much longer 42.6 A little longer 46.0 Same ~Shorter
13. How long have you been using the bus on the East R. L. Thornton HOV lane? 26.1 months (mean)
14. Before you began riding a bus on the East R. L. Thorton HOV lane, how did you normally make this trip? (Please check one.)
15.
24.1 Drove alone 20.1 Rode a park and ride bus on the regular freeway lanes. 4.2 Carpooled 36.5 Rode a regular route or express bus. 0.3 Vanpooled 9.2 Did not make this trip prior to using the East R. L. Thornton HOV lane .
..§.&.. Other (specify) ___________________ _
Does your employer provide any of the following? 76.5 Pays part/all of bus pass. 36.4 Allows some type of flexible work hours. 2.9 Allows telecommuting.
17.5 Pays partlall parking fees.
(Please check all that apply.) 2.0 Guaranteed ride home program.
.2.:..L Rideshare matching program. 5.9 Vanpool program. 5.0 Preferential parking for carpools/vanpools.
16. Do you feel that the HOV lane is presently being sufficiently utilized? 62.2 Yes 13.2 No 24.6 Not sure
134 Texas Transportation Institute

17. A number of ideas have been suggested for addressing traffic congestion and air quality concerns. Which of the following approaches would you support to help address these concerns?
Expand bus service More park-and-ride lots Add more HOV lanes Add HOV lane access points Flexible work hour arrangements Charging more for parking
Support 82.6 57.8 75.4 58.9 62.7
Employer incentives for use of buses/ridesharing Telecommuting
9.0 82.0 43.1 8:'7 Charging for use of roads
Higher gasoline taxes 3.5
Neutral 15.4 38.6 20.6 29.0 31.2 25.8 14.1 48.2 20.0 12.2
Not Support 2.0 3.7 3.9
12.1 6.1 65.2 4.0 8.7 71.3 84.3
18. What is your ... Age? 36.6 (mean) Sex? Male - 28.6 Female - 71.4 Occupation ? __
19. What is the last level of school you completed? _.!.;12=.3:,::9:..-_________________ _
Please use the back of this form to provide any additional comments.
THANK YOU FOR YOUR COOPERA TlON.
Texas Transportation Institute 135

NORTHWEST HOV LANE CARPOOL/V ANPOOL SURVEY
This survey is being undertaken by the Texas Transportation Institute for the Texas Department of Transportation in cooperation with the Metropolitan Transit Authority of Harris County. The survey is intended to obtain information about your use of the Northwest HOV lane. Please take a few minutes to answer the questions below and return the survey in the attached envelope. Thank you for your assistance.
1 . Is your vehicle a carpool or a vanpool? 99.1 Carpool
2. What is the primary purpose of your A.M. carpool/vanpool trip?
0.9Vanpool
94.7Work 4.4School 0.90ther (specify) ____________________________________ _
3. How many members are regularly in your carpool/Vanpool (including yourself)? .::2"'.2"'-___ _
4. Who makes up your carpool!vanpool group? 67.8 Family Members 7.9 Neighbors 32.2Co-Workers 3.20thers (Check all that apply.)
5. Does your carpool/vanpool use a park & ride lot or a park & pool lot as a meeting area? ~ Yes (please specify which lot you typically use) _______________ _ 80.9 No
6. How long have you been a regular user of the Northwest HOV lane? 33.14 months (mean)
7. Which HOV lane entrance do you normally use to access the Northwest in the morning? (Please check one.) 37.1 Northwest Freeway Mainlane 28.4 Northwest Transit Station 23.4 Little York 11.:.LPinemont Dacoma
8. What time do you normally enter the HOV lane in the morning? ______ A.M.
9. What is your A.M. carpool/vanpool destination? 42.2 Downtown 31.9Galieria/Post Oak area 5.6 Greenway Plaza 5.6 Texas Medical Center 14.5 Other (specify Zip Code) _________ _
10. How long has your current carpool/vanpool existed? ~2:.::::9",".6~_ months or ____ years
11. How did you form your carpool/vanpool? (Please check one.)
12.
.1JLEmployer Program 61.4 Family Member 33.1 Friend/Co-worker -2.,METRO Rideshare Program 3.6 Other
Why do you choose to carpoollvanpool rather than drive alone or ride the bus? 7.4 Employer incentives 14.9 Parking cost/availability 54.8 Cheaper than driving alone 72.0 Time savings 47.0 More convenient than driving alone ~No car available to drive alone
(Please check all that apply.) 37.5 Companionship 29.5 Environmental concerns 13.4 Other (specify' ___ _
13. How important is the Northwest HOV lane in your decision to carpoollvanpool? 82.0 Very important 11JLSomewhat important 6.2 Not important
14. If the Northwest HOV lane did not exist, would you be carpooling/vanpooling now? 47.3 Yes 29.3 No 23.4 Not Sure
15. Prior to carpooling/vanpooling on the Northwest HOV lanes, how did you normally make this trip? (Please check one., 12.5 On the HOV lane: 81.8 Bus 3.0 Vanpool 15.2 Carpool 77.5 On the Northwest Freeway regular traffic lanes: 0.98 Bus 0.49 Vanpool 21.0 Carpool 77.5 Drove alone JL1..0n a parallel street or highway: 2--Bus 2--Vanpool ~Carpool .2lL-Drove alone ...1J...Did not make this trip
16. How many minutes, if any, do you believe your carpoollvanpool saves by using the Northwest HOV lane instead of the regular traffic lanes? 20.54 (mean) Minutes in the morning 20.06 (mean) Minutes in the evening
17. Do you feel that the Northwest HOV lane is currently sufficiently utilized? 83.1 Yes 16.9No
18. Does your employer provide any of the following? 28.9 Pays part/all of bus pass. 63.9 Allows some type of flexible work hours. J!d. Allows telecommuting. 43.3 Pays part/all parking fees.
136
(Please check all that apply.) 19.4 Guaranteed ride home program. 13.3 Rideshare matching program. .1.L..L Vanpool program. 15.0 Preferential parking for carpoolslvanpools.
Texas Transportation Institute

19. A number of ideas have been suggested for addressing traffic congestion and air quality concerns. Which of the following approaches would you support to help address these concerns?
Expand bus service More park-and-ride lots Add more HOV lanes Add HOV lane access points Flexible work hour arrangements Charging more for parking Employer incentives for use of buses/ridesharing Telecommuting Charging for use of roads Higher gasoline taxes
Not Support 11d. 7.9 ~ 20.6 2.6
68.7 ..§.,l 6.4
83.2 7.987.1
20. What is your ..• Age? 38.55 (mean) Sex?Male - 53.0 Female - 47.0 Occupation? _______ _
21. What is the last level of school you completed? _1:...:5:..:. . .,..0.:..7 ___ _
22. What is your home Zip Code? ______________________________ _
Please use the back of this form for additional comments. Thank you for your cooperation.
Please return this form at your earliest convenience in the postage-paid envelope provided.
Texas Transportation Institute 137

KATY HOV LANE CARPOOL/V ANPOOL SURVEY
This survey is being undertaken by the Texas Transportation Institute for the Texas Department of Transportation in cooperation with the Metropolitan Transit Authority of Harris County. The survey is intended to obtain information about your use of the Katy HOV lane. Please take a few minutes to answer the questions below and return the survey in the attached envelope. Thank you for your assistance.
1. Is your vehicle a carpool or a vanpool? 94.5 Carpool
2. What is the primary purpose of your A.M. carpool/vanpool trip?
5.5 Vanpool
88.3 Work 8.0 School ~Other (specify) ____________________________________ _
3. How many members are regularly in your carpool/vanpool (including yourself)? ...:2"" . .,.5.,.6,-__
4. Who makes up your carpool/vanpool group? 70.1Family Members 6.4Neighbors 30.5Co-Workers 10.20thers (Check all that apply.)
5. Does your carpool/vanpool use a park & ride lot or a park & pool lot as a meeting area? 22.6Yes (please specify which lot you typically use) 77 .4No
6. How long have you been a regular user of the Katy HOV lane? 31.1 months (mean)
7. Which HOV lane entrance do you normally use to access the Katy in the morning? 32.4Katy Freeway Mainlane 46.7 Addicks 20.9Gessner
8. What time do you normally enter the HOV lane in the morning? _______ A.M.
9. What is your A.M. carpoollvanpool destination? 65.8Downtown 3.3Galleria/Post Oak area 1.&Greenway Plaza 4.9Texas Medical Center 24.50ther (specify Zip Codel ___________ _
10. How long has your current carpool/vanpool existed? ...:!2~7~.~9 ___ months or ____ years
11 . How did you form your carpool/vanpool? [Please check one.)
12.
5.0 Employer Program 61.3 Family Member 31.5 Friend/Co-worker 0.6 METRO Rideshare Program 1.:.LOther
Why do you choose to carpool/vanpool rather than drive alone or ride the bus? 4.3 Employer incentives 14.6 Parking cost/availability
42.7 Cheaper than driving alone 72.4 Time savings 46.5 More convenient than driving alone 3.8 No car available to drive alone
(Please check all that apply). 28.1 Companionship 18.9 Environmental concerns 17.3 Other (specifyl ___ _
13. How important is the Katy HOV lane in your decision to carpool/vanpool? 81.5 Very important 13.0 Somewhat important 5.4 Not important
14. If the Katy HOV lane did not exist, would you be carpoolingivanpooling now? 40.1 Yes 38.5 No 21.4 Not Sure
15. Prior to carpooling/vanpooling on the Katy HOV lanes, how did you normally make this trip? (Please check one.) 22.5 On the HOV lane: 76.5 Bus ..§.JL Vanpool 17.6 Carpool 65.6 On the Katy Freeway regular traffic lanes: ~Bus ..LQ..Vanpool 18.2 Carpool 80.8 Drove alone 1.1:.1..0n a parallel street or highway: ~Bus .11&. Vanpool 29.4 Carpool 52.9 Drove alone 0.7 Did not make this trip
16. How many minutes, if any, do you believe your carpool/vanpool saves by using the Katy HOV lane instead of the regular traffic lanes? 24.8 (mean) Minutes in the morning 25.3 (mean) Minutes in the evening
17. Do you feel that the Katy HOV lane is currently sufficiently utilized to justify the project? 87.7 Yes 12.3 No
18. Does your employer provide any of the following? 42.4 Pays part/all of bus pass. 71.7 Allows some type of flexible work hours. 3.0 Allows telecommuting.
35.4 Pays part/all parking fees.
138
(Please check all that apply.) 19.2 Guaranteed ride home program. 1.1.:..L Rideshare matching program. 19.2 Van pool program. 24.2 Preferential parking for carpools/vanpools.
Texas Transportation Institute

19. A number of ideas have been suggested for addressing traffic congestion and air quality concerns. Which of the following approaches would you support to help address these concerns?
Expand bus service More park.-and-ride lots Add more HOV lanes Add HOV lane access points Flexible work. hour arrangements Charging more for park.ing Employer incentives for use of buses/ridesharing Telecommuting Charging for use of roads Higher gasoline taxes
Support 44.2 31.9 66.2 56.0 75.6 4.6
67.7 47.4 10.3 ..Q&..
Neutral 42.4 56.2 23.8 25.2 20.2 23.0 23.8 42.1 16.8
Not Support 13.3 11.9 10.0 18.9 4.2
72.4 J!&. 10.5 72.9 9.0 85.3
20. What is your ... Age? 38.5 (mean) Sex? Male - 48.4 Female - 51.6 Occupation? _______ _
21. What is the last level of school you completed? 15.08
22. What is your home Zip Code? ______________________________ _
Please use the back of this form for additional comments. Thank you for your cooperation.
Please return this form at your earliest convenience in the postage-paid envelope provided.
Texas Transportation Institute 139
EAST R. L. THORNTON HOV LANE CARPOOL/V ANPOOL SURVEY
This survey is being undertaken by the Texas Transportation Institute for the Texas Department of Transportation in cooperation with Dallas Area Rapid Transit (DART). The survey is intended to obtain information about your use of the East R. L. Thornton HOV lane. Please take a few minutes to answer the questions below and return the survey in the attached envelope. Thank you for your assistance.
1. Is your vehicle a carpool or a vanpool? 94.2 Carpool
2. What is the primary purpose of your A.M. carpool/vanpool trip?
5.8 Vanpool
91.9 Work J2.d.School 2.9 Other (specify) ______________________________________ _
3. How many members are regularly in your carpoo!/vanpool (including yourself)? ~
4. Who makes up your carpool/vanpool group? 70.5Family Members !h1Neighbors 32.4Co-Workers 4.30thers (Check all that apply.)
5. Does your carpool/vanpool use a park & ride lot or a park & pool lot as a meeting area? 6.3 Yes (please specify which lot you typically use) _______________ _
6. How long have you been a regular user of the East R. L. Thornton HOV lane? 33.27 months !mean)
7. Which HOV lane exit do you normally use? (Please check one.l 73.2 Downtown 26.8 East R. L. Thornton Freeway
8. What time do you normally enter the HOV lane in the moming? _______ A.M.
9. What is your A.M. carpool!vanpool destination? 70.7 Downtown Dallas 3.4 Las Colin as 1.0 Galleria Park Central
93.7No
3.8 Market Center 0.5 DFW Airport 20.7 Other (specify Zip Code) ___________ _
10. How long has your current carpoo!/vanpool existed? _4..:...1,-,.",9""9.....c!",m",e..,a",,n!L.) __ months or ____ years
11. How did you form your carpoollvanpool? (Please check one.)
12.
..LQ..Employer Program 65.4 Family Member 29.8 Friend/Co-worker 2.0 DART Rideshare Program 2.0 Other
Why do you choose to carpool/vanpool rather than drive alone or ride the bus? 4.8 Employer incentives 28.5 Parking cost/availability
54.1 Cheaper than driving alone 47.8 Time savings 35.3 More convenient than driving alone 13.5 No car available to drive alone
(Please check all that apply). 32.4 Companionship 24.6 Environmental concerns 20.3 Other (specifyl ___ _
13. How important is the East R. L. Thornton HOV lane in your decision to carpool/vanpool? 63.9 Very important 18.8 Somewhat important 17.3 Not important
14. If the East R. L. Thornton HOV lane did not exist, would you be carpooling/vanpooling now? 72.9 Yes 14.0 No 13.0 Not Sure
15. Prior to carpooling/vanpooling on the East R. L Thornton HOV lanes, how did you normally make this trip? (Please check one.) 12.8 On the HOV lane: !!1.&..Bus JL Vanpool 52.2 Carpool 67.8 On the East R. L Thornton Freeway regular traffic lanes: 3.3 Bus 7.3 Vanpool 46.7 Carpool 42.6 Drove alone 19.4 On a parallel street or highway: 2.9 Bus 2.9 Vanpool 62.9 Carpool 31.4 Drove alone LDid not make this trip
16. How many minutes, if any, do you believe your carpoo!/vanpool saves by using the East R. L Thornton HOV lane instead of the regular traffic lanes? 15.6 (mean) Minutes in the morning 13.08 (mean) Minutes in the evening
17. How has construction of the Fair Park Bridge affected your travel times? 8.2 Much longer 46.6 A little longer 41.3 Same llShorter
18. Do you feel that the East R. L. Thornton HOV lane is currently sufficiently utilized to justify the project? 95.0 Yes JhQ....No
140 Texas Transportation Institute

19. Does your employer provide any of the following? 47.2 Pays partlall of bus pass. 50.9 Allows some type of flexible work hours. ...1:l.. Allows telecommuting. 37.7 Pays partlall parking fees.
(Please check all that apply.) .iJL Guaranteed ride home program. 2.8 Rideshare matching program. 17 .0 Vanpool program . llJ.. Preferential parking for carpools/vanpools.
20. A number of ideas have been suggested for addressing traffic congestion and air quality concerns. Which of the following approaches would you support to help address these concerns?
Expand bus service More park-and-ride lots Add more HOV lanes Add HOV lane access points Flexible work hour arrangements Charging more for parking Employer incentives for use of buseslridesharing Telecommuting Charging for use of roads Higher gasoline taxes
Support ~ 29.8 82.1 60.8 66.3 2.3 59.9 43.2 4.0 1.7
Neutral ~ 58.0 14.9 20.1 29.7 17.5 31.9 48.5 10.8
Not Support 27.7 12.2 ..bl... 19.0 4.0 80.1 8.2 8.3
85.2 5.2 93.1
21 . What is your ... Age? 41.2 (mean) Sex? Male - 44.7 Female - 55.3 Occupation? ______ _
22. What is the last level of school you completed? 14.1
23. What is your home Zip Code? ______________________________ _
Please use the back of this form for additional comments. Thank you for your cooperation.
Please return this form at your earliest convenience in the postage-paid envelope provided.
Texas Transportation Institute 141
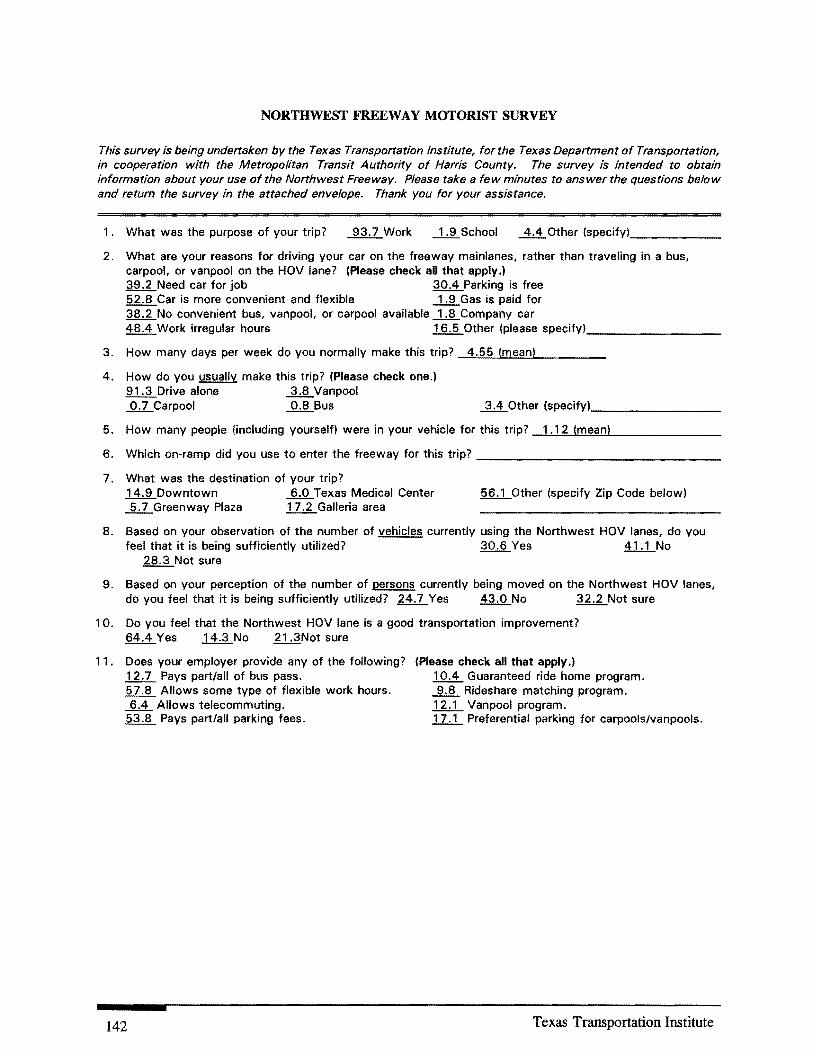
NORTHWEST FREEWAY MOTORIST SURVEY
This survey is being undertaken by the Texas Transportation Institute, for the Texas Department of Transportation, in cooperation with the Metropolitan Transit Authority of Harris County. The survey is intended to obtain information about your use of the Northwest Freeway. Please take a few minutes to answer the questions below and return the survey in the attached envelope. Thank you for your assistance.
1. What was the purpose of your trip? 93.7 Work ....1,.JlSchool 4.4 Other (specify), _____ _
2. What are your reasons for driving your car on the freeway mainlanes, rather than traveling in a bus, carpool, or vanpool on the HOV lane? (Please check all that apply.) 39.2 Need car for job 30.4 Parking is free 52.8 Car is more convenient and flexible ...L..§LGas is paid for 38.2 No convenient bus, vanpool, or carpool available ...1.JLCompany car 48.4 Work irregular hours 16.5 Other (please specify) ________ _
3. How many days per week do you normally make this trip? 4.55 (mean)
4. How do you usually make this trip? (Please check one.) 91.3 Drive alone 3.8 Vanpool 0.7 Carpool 0.8 Bus 3.4 Other (specify) ________ _
5. How many people (including yourself) were in your vehicle for this trip? ---!1..!. . ..:.,12::.....l(:,:.m""e"'a""n:J...1 ______ _
6. Which on-ramp did you use to enter the freeway for this trip? ________________ _
7. What was the destination of your trip? 14.9 Downtown 6.0 Texas Medical Center 56.1 Other (specify Zip Code below) JLLGreenway Plaza 17.2 Galleria area
8. Based on your observation of the number of vehicles currently using the Northwest HOV lanes, do you feel that it is being sufficiently utilized? 30.6 Yes .1.L.LNo
28.3 Not sure
9. Based on your perception of the number of persons currently being moved on the Northwest HOV lanes, do you feel that it is being sufficiently utilized? 24.7 Yes 43.0 No 32.2 Not sure
10. Do you feel that the Northwest HOV lane is a good transportation improvement?
11 .
64.4 Yes 14.3 No 21 .3Not sure
Does your employer provide any of the following? 12.7 Pays partlall of bus pass. 57.8 Allows some type of flexible work hours. 6.4 Allows telecommuting.
53.8 Pays partlall parking fees.
142
(Please check all that apply.) 10.4 Guaranteed ride home program. J!.JL Rideshare matching program. 1£:1... Van pool program. 1L.L Preferential parking for carpools/vanpools.
Texas Transportation Institute
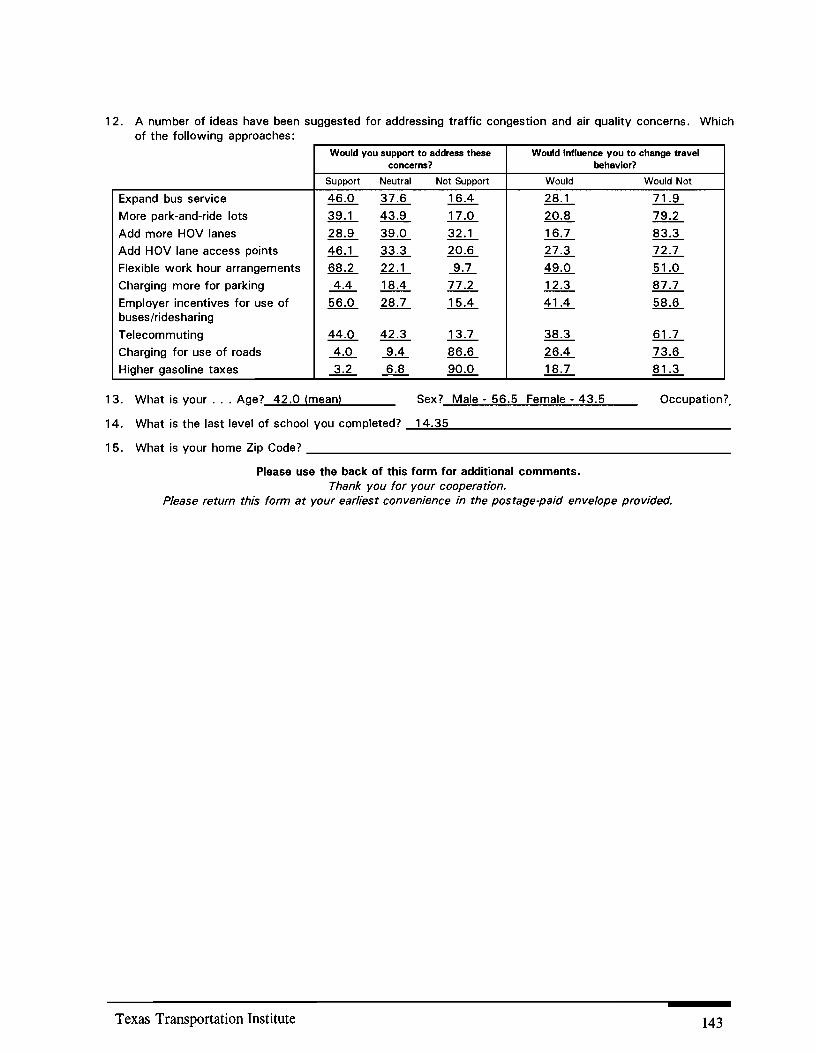
12. A number of ideas have been suggested for addressing traffic congestion and air quality concerns. Which of the following approaches:
Would you support to address these Would influence you to change travel concerns? behavior?
Support Neutral Not Support Would Would Not
Expand bus service 46.0 37.6 16.4 28.1 71.9
More park-and-ride lots 39.1 43.9 17.0 20.8 79.2
Add more HOV lanes 28.9 39.0 32.1 16.7 83.3
Add HOV lane access points 46.1 33.3 20.6 27.3 72.7
Flexible work hour arrangements 68.2 22.1 ~ 49.0 51.0
Charging more for parking 4.4 18.4 77.2 12.3 87.7
Employer incentives for use of 56.0 28.7 15.4 41.4 58.6 buses/ridesharing
Telecommuting 44.0 42.3 13.7 38.3 61.7
Charging for use of roads 4.0 9.4 86.6 26.4 73.6
Higher gasoline taxes ~ ...2.&.. 90.0 18.7 81.3
13. What is your ... Age? 42.0 (mean) Sex? Male - 56.5 Female - 43.5 Occupation ?
14. What is the last level of school you completed? ---!.1.::!4:..:.;.3~5:::....-__________________ _
15. What is your home Zip Code? _____________________________ _
Please use the back of this form for additional comments. Thank you for your cooperation.
Please return this form at your earliest convenience in the postage-paid envelope provided.
Texas Transportation Institute 143

KATY FREEWAY MOTORIST SURVEY
This survey is being undertaken by the Texas Transportation Institute, for the Texas Department of Transportation, in cooperation with the Metropolitan Transit Authority of Harris County. The survey is intended to obtain information about your use of the Katy Freeway. Please take a few minutes to answer the questions below and return the survey in the attached envelope. Thank you for your assistance.
1. What was the purpose of your trip? 91.4 Work ...b1..School 6.4 Other (specify) ______ _
2. What are your reasons for driving your car on the freeway mainlanes, rather than traveling in a bus, carpool, or vanpool on the HOV lane? (Please check all that apply.} 44.0 Need car for job 26.7 Parking is free 49.9 Car is more convenient and flexible ~Gas is paid for 41 .4 No convenient bus, vanpool, or carpool available ~ Company car 47.0 Work irregular hours 14.6 Other (please specify) ________ _
3. How many days per week do you normally make this trip? --,4:"':";::.5....l(.:..:.m.:.:e:.=a:.:.;n:z..) ____ _
4. How do you usually make this trip? (Please check one.} 91.8 Drive alone 0.8 Vanpool 2.4 Carpool ...1..cl...Bus 3.7 Other (specify) ___________ _
5. How many people (including yourself) were in your vehicle for this trip? _..:..1 "".1'---1(.:..:.m.:.:e'-=a:.:.;n:z..I ______ _
6. Which on-ramp did you use to enter the freeway for this trip? ________________ _
7. What was the destination of your trip? 12.9 Downtown ...2.:..L Texas Medical Center 68.5 Other (specify Zip Code below) 2.3 Greenway Plaza 13.3 Galleria area
8. Based on your observation of the number of vehicles currently using the Katy HOV lanes, do you feel that it is being sufficiently utilized? 20.6 Yes 62.4 No 17.0 Not sure
9. Based on your perception of the number of persons currently being moved on the Katy HOV lanes, do you feel that it is being sufficiently utilized? 19.0 Yes 59.1 No 22.0 Not sure
10. Do you feel that the Katy HOV lane is a good transportation improvement?
11.
65.7Yes 20.8No 13.5Not sure
Does your employer provide any of the following? 12.2 Pays partlall of bus pass. 66.1 Allows some type of flexible work hours. 7.9 Allows telecommuting.
49.7 Pays partlall parking fees.
144
(Please check all that apply.J 8.5 Guaranteed ride home program. 6.9 Rideshare matching program.
...§JL Vanpool program.
.1.1JL Preferential parking for carpools/vanpools.
Texas Transportation Institute

1 2. A number of ideas have been suggested for addressing traffic congestion and air quality concerns. Which of the following approaches:
Would you support to address thase Would Influence you to change travel concerns? behavior?
Support Neutral Not Support Would Would Not
Expand bus service 46.7 38.5 14.8 25.5 74.5
More park-and-ride lots 34.2 48.2 17.7 15.7 84.3
Add more HOV lanes 32.6 33.2 22.5 77.5
Add HOV lane access points 50.6 27.4 22.0 29.8 70.2
Flexible work hour arrangements 64.6 25.3 10.2 55.8
Charging more for parking ..l..:.L 22.3 74.7 10.8 89.2
Employer incentives for use of 50.5 31.7 17.8 34.9 65.1 buseslridesharing
Telecommuting 42.4 43.9 34.4 65.6
Charging for use of roads 2.§... 11JL 80.7 25.2 74.8
Higher gasoline taxes 3.0 8.2 88.8 15.6 84.4
13. What is your ... Age? 41.87 (mean) Sex? Male - 60.2 Female 39.8 Occupation? __________________________________________________________________________ __
14. What is the last level of school you completed? ---!1.::!4:.:.;.9~9~ ____________________________________ _
1 5. What is your home Zip Code? _____________________________________________________ __
Please use the back of this form for additional comments. Thank you for your cooperation.
Please retum this form at your earliest convenience in the postage-paid envelope provided.
Texas Transportation Institute 145
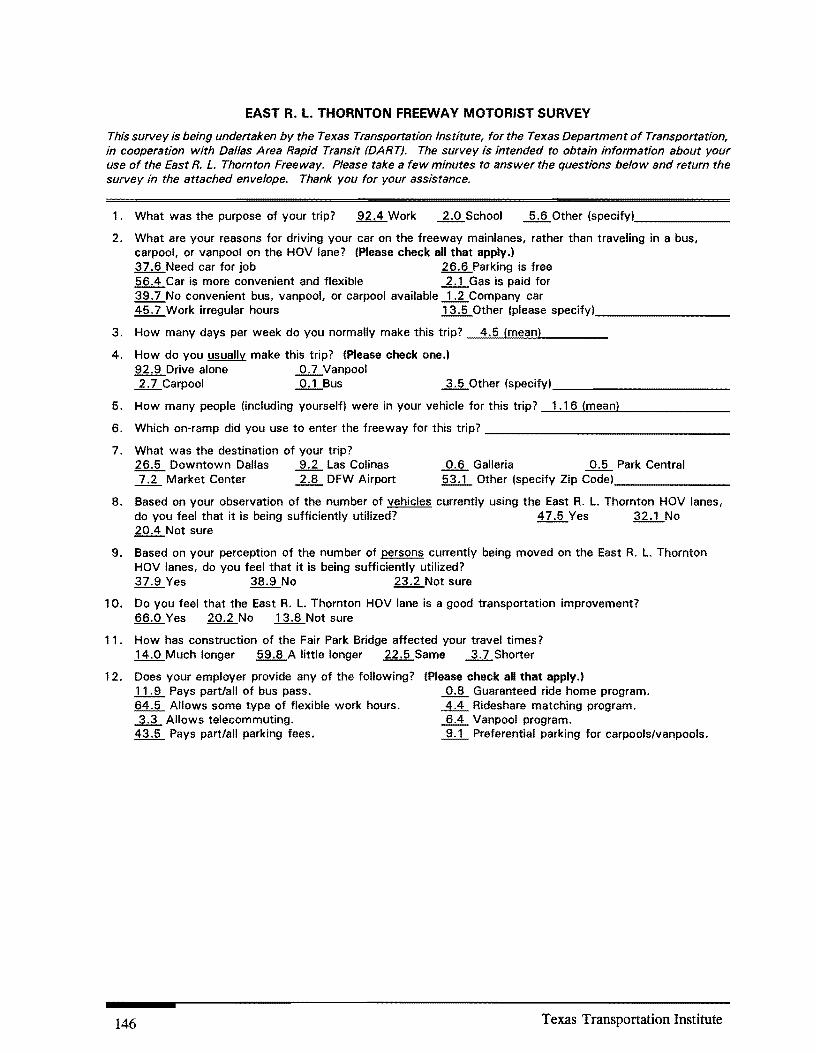
EAST R. L. THORNTON FREEWAY MOTORIST SURVEY
This survey is being undertaken by the Texas Transportation Institute, for the Texas Department of Transportation, in cooperation with Dallas Area Rapid Transit (DART). The survey is intended to obtain information about your use of the East R. L. Thornton Freeway. Please take a few minutes to answer the questions below and return the survey in the attached envelope. Thank you for your assistance.
1. What was the purpose of your trip? 92.4 Work ..bQ..School ~Other (specify} _____ _
2. What are your reasons for driving your car on the freeway mainlanes, rather than traveling in a bus, carpool, or vanpool on the HOV lane? (Please check all that apply.) 37.6 Need car for job 26.6 Parking is free 56.4 Car is more convenient and flexible ..bLGas is paid for 39.7 No convenient bus, vanpool, or carpool available ...1..:.6...Company car 45.7 Work irregular hours 13.5 Other (please specify} ________ _
3. How many days per week do you normally make this trip? 4.5 (mean)
4. How do you usually make this trip? (Please check one.) 92.9 Drive alone 0.7 Vanpool ~Carpool ..Q"LBus .±..!LOther (specify) ___________ _
5. How many people (including yourself) were in your vehicle for this trip? --:1...!. . ..:..16.:....>(:.:.m:.,:e""a""n:.l..) ______ _
6. Which on-ramp did you use to enter the freeway for this trip? ________________ _
7. What was the destination of your trip? 26.5 Downtown Dallas ~ Las Colinas 0.6 Galleria ~ Park Central ..J....:L Market Center 2.8 DFW Airport 53.1 Other (specify Zip Code) _______ _
8. Based on your observation of the number of vehicles currently using the East R. L. Thornton HOV lanes, do you feel that it is being sufficiently utilized? 47.5 Yes 32.1 No 20.4 Not sure
9. Based on your perception of the number of persons currently being moved on the East R. L. Thornton HOV lanes, do you feel that it is being sufficiently utilized? 37.9 Yes 38.9 No 23.2 Not sure
10. Do you feel that the East R. L. Thornton HOV lane is a good transportation improvement? 66.0 Yes 20.2 No 13.8 Not sure
11. How has construction of the Fair Park Bridge affected your travel times? 14.0 Much longer 59.8 A little longer 22.5 Same 3.7 Shorter
12. Does your employer provide any of the following? .1.1.Jl Pays part/all of bus pass. 64.5 Allows some type of flexible work hours. ~ Allows telecommuting. 43.5 Pays part/all parking fees.
146
(Please check all that apply.) 0.8 Guaranteed ride home program .
Rideshare matching program. 6.4 Vanpool program.
Preferential parking for carpoolslvanpools.
Texas Transportation Institute

13. A number of ideas have been suggested for addressing traffic congestion and air quality concerns. Which of the following approaches:
Would you support to address these Would influence you to change travel concerns? behavior?
Support Neutral Not Would Would Not Support
Expand bus service 36.5 42.2 21.3 22.6 77.4
More park-and-ride lots 36.3 48.8 14.8 19.3 80.7
Add more HOV lanes 40.6 29.8 29.6 20.9 79.1
Add HOV lane access points 41.2 34.7 24.1 21.3 78.7
Flexible work hour arrangements 57.7 34.6 .LL 42.1 57.9
Charging more for parking 4.5 22.0 73.5 13.9 86.1
Employer incentives for use of 48.6 37.2 14.2 34.9 65.1 buses/ridesharing
Telecommuting 39.6 46.1 14.3 38.2 61.8
Charging for use of roads 4.3 9.3 86.5 29.4 70.6
Higher gasoline taxes ..l.JL 6.2 .ll:..L 21.0 79.0
14. What is your ... Age? 41.7 (mean) Sex? Male - 54.2 Female - 45.8 Occupation ? __
15. What is the last level of school you completed? _...:1...!4C!. . .!..17.!.-_________________ _
16. What is your home Zip Code? ____________________________ _
Please use the back of this form for additional comments. Thank you for your cooperation.
Please return this form at your earliest convenience in the postage-paid envelope provided.
Texas Transportation Institute 147