Embed Size (px)
Citation preview

Investigation of Mechanical Properties of Recycled Polypropylene
By
L.F. Elgammudi, B. Sc, M. Sc.
This Thesis is Submitted to Dublin City University in Fulfilment of the requirement for the award of the degree of
Doctor of Philosophy (PhD)
Supervisor
Dr. A.G. Olabi
School of Mechanical & Manufacturing Engineering Dublin City University, Ireland.
/
j< m
August 2007

Declaration
I hereby certify that this material, which I now submit for assessment on the
programme of study leading to the award of Doctor o f Philosophy is entirely
my own work and has not been taken from the work of others and to the
extent that such work has been cited and acknowledged within the text of my
work.
Lutfi Furji Elgammudi
ID No:52159663
Date:
I

Acknowledgem ents
The author would like to express his gratitude and appreciation to his thesis
supervisor. Dr A.G.Olabi “main supervisor”, lecturer in the School of Mechanical
and Manufacturing Engineering in Dublin City University, has given constant
guidance, friendly enthusiasm, constructive criticism, valuable suggestions and
encouragement in carrying out the research work as well as in writing this thesis.
The author wishes to thank Prof. Mohie El-Baradie lecturer in the School of
Mechanical and Manufacturing Engineering for her support and guidance with the
design of the survey. I also would like to express my thanks to DR. Kaled
Benyounis and Dr. Amr Arisha who have given me valuable support and advice
to accomplish this project.
Sincere thanks are due to school technicians for their generous assistance,
especially to Mr. Cian Merne, Mr. Christopher Crouch, Mr. Liam Domican and
Mr. Keith Hickey. Thanks are also due to the officers and staff of the school for
their help in various stages of the study. The author would also like to thank all
his friends and colleagues.
The author is grateful to his country Libya for having offered the scholarship for
pursuing postgraduate study at Dublin City University.
Last but not least, the author wishes to express his gratitude to his wife, kids and
family, for their continued encouragement and inspiration throughout his life as
well as during this research work.
II

‘lUis workjs dedicated to my 6e(oved parents, wife and daughters
III

Investigation of Mechanical Properties of Recycled Polypropylene
Lutfi Furji Elgammudi, B.Sc., M.Sc.
ABSTRACT
Every year there is an increase in the amount of plastics formed by all types of processes, such as extrusion, blow moulding, injection moulding, etc. The recycling of waste plastic materials is developing at a manufacturing process scale, and its aim is to increase further the sales of plastic products by reducing raw material costs. However this economic argument is only one of the reasons why it is important to recycle these materials. The other is environmental.
Each time an item of plastic material passes through the manufacturing process, its quality is reduced. Some plastic material can be recycled over and over again. This research concerns the number of times polypropylene (PP) formed by the injection moulding process can be recycled. The work focuses on the quality of the material after each recycling operation. Material was passed through the forming process up to three times. Also, since it is possible to improve the quality and reliability of the polypropylene, by adding a percentage of fresh “raw” material, the study included an investigation to optimise the mechanical properties using this approach.
The moulding process was used to produce products whose mechanical properties could be measured to provide an indication of the quality of the material at that stage. The relationship between the moulding process parameters and the quality of the subsequent products was analysed, and this was extended for cases where the material was recycled twice or three times through the equipment. The powders produced in these trials were then mixed with different percentages of raw material, and passed through the equipment again to produce products whose mechanical properties could be measured.
To reduce the number of permutations a Design of Experiments (DoE) method was implemented to define the moulding process conditions which resulted in the optimum product quality for material being recycled once, twice or three times. A2 Factorial Design (FD) technique was also used. Different mathematical models were obtained to show the relationship between the process parameters, the number of times the material was recycled, and the product quality. This was extended to show the effect of adding a percentage of raw material to the powder mix.
All the mathematical models were verified by further experimentation. The results show that these models can predict the mechanical properties of the products adequately, once the processing parameters have been defined.
IV

TABLE OF CONTENTS
Declaration IAcknowledgements IIAbstract IVTable of Contents VList of Figures IXList of Tables XV
CHAPTER 1 INTRODUCTION Page No
1. Introduction 11.1. Background to the Research 11.2. Materials Study and Description of Method 51.3. Research Questions 81.4. Problem Definition 81.5. Aim of the Research 91.6. Research Hypothesis 101.7. Preliminary Research 10
1.7.1. Designing the survey 111.7.2. Survey analysis 11
1.8. Significance and contribution of this study 111.9. Overview of the Thesis 121.10. Chapter Summary 15
CHAPTER 2 LITERATURE REVIEW
2. Literature Review 182.1. Introduction 182.2. Purposes of Literature Review 182.3. History and Background of Recycling Plastics 202.4. Definition of Recycling 212.5. Types of Recycling 212.6. Utilisation Technology for Recycled Plastics 222.7. Recycling as an Economic Activity 232.8. Review of Some Previous Studies on the Surveying of the 24
Recycling Process of Plastic Materials2.9.Injection Moulding Technology 29
2.9.1. Type of moulding processes 292.9.2. Inj ection moulding materials 3 32.9.3. Injection moulding process stages 33
2.9.3.1. Heating stage of the injection moulding process 422.9.3.2. Filing stage of the injection moulding process 432.9.3.3. Packing stage of the injection moulding process 432.9.3.4. Cooling stage 43
2.10. Review of some Previous Studies on Recycling Process 45of Mixed (PP)
2.11. Chapter Summary 54
V

CHAPTER 3 DESIGNING THE SURVEY AND EXPERIMENTAL PROCEDURE
3. Research Methodology 553.1. Introduction 5 63. 2. Research Process of This Study 563.3. Research Methodology 59
3.3.1. Theory verification and theory building 603.3.2. Exploratory Versus Explanatory 613.3.4. Quantities versus Qualitative 62
3.4. Research design 633.4.1. Observation 633.4.2. Experimentation 643.4.3. Survey research 643.4.4. Data collection methods 65
3.5. Designing the Survey Instrument 683.5.1. Survey Objectives 683.5.2. Coverage of Survey 693.5.3. Limitation of postal questionnaire survey method 703.5.4. Steps in questionnaire construction 723.5.5. Questionnaire content 73
3.6. Processing the Survey 753.6.1. Questionnaire layout 7 53.6.2. Pre-test and pilot test 753.6.3. Main survey 773.6.4. Response Rate 79
3.7. Reliability and Validity 803.7.1. Reliability 803.7.2. Validity 813.8. Data Processing and SPSS Statistical Technique 823.8.1. Data processing 823.8.2. Statistical Package for the Social Sciences (SPSS) 82
Statistical technique3.9. Statistical Analytical Tools and Analysis 83
3.9.1. Statistical terminology 833.9.2. Frequency distribution 8 53.9.3. Cross tabulation 873.9.4. Reliability test for survey instrument 883.9.5. Correlation analysis 89
3.10. Primary Data 903.11. Scaling of Responses 92
3.11.1. Response Time 933.11.2. Cost 93
3.12. Questionnaire analysis 933.13. On -line survey 106
3.13.1. Introduction 1063.13.2. Brief history of on-line survey 1063.13.3. Coverage of on-line Survey 107
VI

3.14. Experimental Procedure 1103.14.1. Introduction 1103.14.2. Description of Injection Moulding HM7 1113.14.3. Materials Study and Method Description 114
3.14.3.1. Method description 1143.14.3.2. Materials study 1153.14.3.3. Sample dimension 1173.14.3.4. Mechanical properties 118
3.14.3.4.1. Tensile testing 1183.14.3.5. Pilot test 120
3.15. Chapter Summary 125
CHAPTER 4 SURVEY RESULTS AND ANALYSIS
4. Survey Results and Analysis 1274.1. Introduction 1275.2. Results and Data Analysis of Survey 1274.3. Frequency Analyses and Cross -Tabulation 128
4.3.1. General information 12 84.3.2. Stage of used recycled materials 1304.3.3. Inputs process parameters 133
4.3.3.1. External process 1334.3.3.2. Internal process 1344.3.3.3. Quality of recycled products 1354.3.3.4. Cost estimation 137
4.3.4. S ale of recycled product 1384.3.4.1. Involved in the sale of recycled products 13 84.3.4.2. Price of recycled products 142
4.4. Results Discussions of Survey Findings 1434.4.1. Testing hypothesis 1434.4.2. Company background 1444.4.3. Quality of recycled products 1454.4.4. Sell of recycled products 147
4.6. Chapter Summary 148
CHAPTER 5 EXPERIMENTAL DESIGN
5. Experimental Design results 1495.1. Introduction 1495.2. Experimental design and data analysis 149
5.2.1. Factorial design 1505.2.1.2. Development of the mathematical model 1545.2.1.3. Testing the adequacy of the models developed 1545.2.1.4. Development of the final reduced model 1555.2.1.5. Post analysis 155
5.2.2. Optimisation 156
VII

5.2.2.1. Desirability approach 1565. 2.2. 2. Optimization approach in Design-Expert software 156
5.3 Results and discussion 1585.4. Recycling process with no mixture of raw material PP 158
5.4.1. Development of raw material PP 1595.4.1.1. Effects of A, B and C on the % of reduction in Y 160
of the raw PP5.4.2. Development of the first recycling model 165
5.4.2.1. Effects of A, B and C on the % of reduction of the 166yield strength of 1 st recycling
5.4.3. Development of second recycling model 1605.4.3.1. Effects of A, B and C on the % of reduction in the 170
yield strength for the second recycling5.4.4. Development of third recycling 174
5.4.4.1. Effects of A, B and C on the % of reduction of the 175yield strength of the third recycling
5.5. Recycling process of mixture raw material PP 1795.5.1. Development of first recycling 180
5.5.1.1. Effects of C, D on the yield strength in the first 181recycling
5.5.1.2. Effects of B, C and D on the ultimate tensile 184strength in the first recycling
5.5.2. Development of second recycling 1875.5.2.1. Effects of A, B, C and D on the yield strength in 190
the second recycling5.5.2.2. Effects of A, B and D on the UTS of the second 193
recycling5.5.3. Development of third recycling 195
5.5.3.1. Effects of A, B and D on the yield strength in 197the third recycling
5.5.3.2. Effects of A on the ultimate tensile strength of 200the third recycling
5.6. Operating cost calculation 2035.6.1. Effects of A, B and C on the operating cost 2045.7. Optimisation 2065.7.1. First recycling 206
5.7.1.1. Numerical Optimisation 2065.7.1.2. Graphical Optimisation 207
5.7.2. Second recycling 2115.7.2.1. Numerical Optimisation 2115.7.2.2. Graphical Optimisation 211
5.7.3. Third recycling 2165.7.3.1. Numerical Optimisation 2165.132. Graphical Optimisation 217
5.8. Validation of the developed models 2195.8.1 First stage 2205.8.2 Second stage 2205.8.3 Third stage 221
5.9. Chapter Summary 221
VIII

CHAPTER 6 CONCLUSION AND FUTURE WORK
6.1 Introduction 2226.2 Conclusions for Survey Results 2226.3 Conclusions for Experimental Design 2246.4 Recommendation for Future Work 225
List of Publication 226Reference 227Appendix
IX

LIST OF FIGURES
Figure 1.1: Recycle steps of plastic materials 3
Figure 1.2: Schematic diagram of research out line 16
Figure 1.3 : The method of approach used in the present study 17
Figure 2.1: Schematic diagram of demonstrated rejects and sale recycling 19Figure 2.2: The link between business, manufacturing strategy and 20
recycling processFigure 2.3: Integration company department 24
Figure 2.4: Total plastic recycling rates (1997-2002) 26
Figure 2.5 : Total recycling of individual recycling plastic materials 27
Figure 2.6: Schematic of different recycling waste and process mould 28equipment
Figure 2.7: Process mould techniques, blow moulding (a), injection 30moulding (b) and extrusion (c)
Figure. 2.8: Main stage in the injection moulding process (a) heating (b) 34filling (c)packing and cooling (d)
Figure. 2.9: A single screw injection-moulding machine for thermoplastics, 35showing the plastic zing screw, a barrel, and band heaters to heat the barrel, a stationary platen, and a movable platen
Figure 2.10: Nozzle connection 36
Figure 2.11: Part of injection unit 37
Figure 2.12: Type of mould 38
Figure 2.13: Two and three-plate mould 40
Figure 2.14: Typical injection moulding cycle 41
Figure 2.15: Primary injection moulding parameters 42
Figure 2.16: Injection moulding cycle stage 44
Figure 2.17: Different materials that are usually recycled 45
Figure 3.1: The research model - Punch 57
Figure 3.2: Summary of research process 58
Figure 3.3: Survey research using postal and online questionnaire approach 67
Figures Description Page No
X

Figure 3.5: Shows the response rate of the survey sended to Ireland and 77United Kingdom
Figure 3.6: Shows the response number for first and reminder survey in 78Ireland and United Kingdom
Figure 3.7: Total of response rate of the first and reminder questionnaire in Ireland 79
Figure 3.4: Comparison o f responses in pilot survey 77
and United Kingdom
80Figure 3.8: Shows the total response rate in Ireland and the United Kingdom.
Figure 3.9: Response rate in the traditional postal of the first survey and reminder In Ireland and the United Kingdom
Figure3.10: Snapshot view of variable view in SPSS software 86
Figure 3.11: Snapshot view of frequency analysis in SPSS software 86
Figure 3.12: Snapshot view of cross-tabulation analysis in SPSS software 87
Figure 3.13: Snapshot view of reliability analysis using SPSS software 87
Figure 3.14: Snap shot view of online survey questionnaire 107
Figure 3.15: Snapshot view of question page 108
Figure 3.16: Snapshot view of thank you page 108
Figure 3.17: Snapshot view of kompass of plastic industrial in Ireland 109
Figure 3.18: Snapshot view of kompass of plastic industrial in UK 109
Figure 3.19: Equipment and parameters used in the experimental phase of the researc 111
Figure 3.20: HM7 injection moulding machine equipment 112
Figure 3.21: HM7 moulding machine equipment 112
Figure 3.22: Typical mould HM7 113
Figure 3.23: Mould product shape 113
Figure 3.24: Barrel and nozzle temperature 113
Figure 3.25:Raw material PP 115
Figure 3.26: Recycled material PP 115
Figure 3.27: Plastic sample of PP 116
Figure 3.28: Several recycle samples of plastic material PP, (1) raw material, (2) 116First recycle, (3) second recycle and (4) third recycle
Figure 3.29: Third recycle samples 116
Figure 3.30: Sprue and runner 116
XI

Figure 3.31: Schematic diagrams showing the dimensions of the standard subsize 117tensile specimen
Figure 3.32: Plastic grinder machine 118
Figure 3.33: Several of add percentages raw PP with the recycled material PP, (1) 118first recycle, (2) second recycle and (3) third recycle
Figure 3.34: Schematic of tensile machine model housfield (HZOK-W) 119
Figure 3.35: Schematic of stress-strain curve plastic PP 119
Figure 3.36: Time cycle of produce mould products by HM7 machine 122
Figure 3.37: Schematic diagram of several weight samples in each stage, 123(1) raw material, (2) first stage
Figure 3.38: Schematic diagram of several weight samples in each stage, (1) 124second stage , (2) third stage
Figure 4.1: Identification of current company ownership 128
Figure 4.2: The number of employees for current recycling companies 128
Figure 4.3 highlights the company spend on staff from 2001 to 2004 129
Figure 4.4: The processing methods presented by recycling companies 129
Figure 4.5: Number of years of manufacturing for the plastic industry 130
Figure 4.6: The average percentage of rejects on an annual basis 130
Figure 4.7: Implementation of recycling of plastic materials within industry 131
Figure 4 .8: Stages of recycling 131
Figure 4.10: First stag 133
Figure 4.11: Second recycle 133
Figure 4.12: Third recycle 133
Figure 4.13: Internal parameters affecting the mould process 134
Figure 4.14: The effect of the inputs process parameters on the first recycling Stage 134
Figure 4.15: The effect of the inputs process parameters on the second recycling stag* 135
Figure 4.16: The effect of frequency of the inputs process parameters on the third staj 135
Figure 4.17: First recycle 135
Figure 4.18: Second recycle 135
Figure 4.19: Third recycle 135
Figure 4.20: Cost estimation for first stage recycling 137
Figure 4.21: Cost estimation for second stage recycling 137
Figure 4.22: Cost estimation for third stage recycling 137
XII

Figure 4.23: Percentage sale of recycled plastic 138
Figure 4.24: Number of years used on the sell of recycling plastic 138
Figure 4.25: The trend for sale of plastic recycled products in 2001 140
Figure 4 .26: The trend for sale of plastic recycled products in 2002 140
Figure 4.27: The trend for sale of plastic recycled products in 2003 141
Figure 4.28: The trend for sale of plastic recycled products in 2004 141
Figure 4.29: Price of plastic recycled products produced from first stage recycling 142
Figure 4.30: Price of plastic recycled products produced from second stage recycling 142
Figure 4.31: Price of plastic recycled products produced from third stage recycling 142
Figure 5.1: A 23 two-level, full factorial design; factors XI, X2, X3 152
Figure 5.2: Flowchart shows the building and using the factorial design model 153
Figure 5.3: Flowchart shows the optimisation steps 157
Figure 5.4: Cycle time for raw material 162
Figure 5.5: Contours graph shows the effects of three variables on the 163% of reduction of the yield strength for the raw PP
Figure 5.6: Perturbation graph shows the relationship between the three 164factors and the percentage of reduction for raw PP
Figure 5.7: Scatter diagram 164
Figure 5.8: Scatter diagram for 1st recycling 167
Figure 5.9: Contours graph shows the effects of three variables on the % of reduction 169of the first recycling
Figure 5.10: Cycle time for first stage 169
Figure 5.11: Scatter diagram 172
Figure 5.12: Contours graph shows the effects of the three variables on the 173
% of reduction in (Y) of the second recycling
Figure 5.13: Cycle time for second stage 174
Figure 5.15: Contours graph showing the effects of three variables on the 177% of reduction in (y) of the third recycling PP
Figure 5.16: Contours graph shows the effects of the nozzle temperature 178and barrel temperature on the response of the third recycled PP
Figure 5.17: Cycle time in third stage 17 8
Figure 5.18: Interaction graph shows the effect of C and D on Y for the first stage 183
Figure 5.19: Perturbation graph shows the effect C and D on Y for the first stage 183
XIII

Figure 5.21: Contours graph shows the effects of C and D on UTS at the first stage 186
Figure 5.22: 3D graph show the effect of C and A on UTS at first stage 186
Figure 5.23: Perturbation graph show the effect of B, C and D on UTS at first stage 187
Figure 5.24: Contours graph shows the effects of A and B on Y for second stage 191
Figure 5.25: Contours graph shows the effects of B ad D on Y for the second stage 192
Figure 5.26: Perturbation graph show the effect A, B and D on Y 192for the second stage
Figure 5.27: Contours graph shows the effects of A and B on the UTS for the second 194Stage
Figure 5.28: Contours graph shows the effects of C and D on the UTS for the second 195Stage
Figure 5.29: Contours graph shows the effects of A and B on Y for the third stage 199
Figure 5.30: 3D graph shows the effects of C and D on Y for the third stage 199
Figure 5.31: Perturbation graph shows the effects of A, B and D on Y for the third stc 200
Figure 5.32: Interaction grape show the effect of C on UTS at third stage 201
Figure 5.33: Contours graph shows the effects of A and C on OC 205
Figure 5.34: Contours graph shows the effects of B and C on OC 205
Figure 5.35: Perturbation graph shows the effects of A, B and C on OC 206
Figure 5.36: Overlay plot shows the optimal conditions according to 209The first criterion at D = 35% of RM
Figure 5.37: Overlay plot shows the optimal conditions according to the 211second criterion at D = 5% of RM
Figure 5.38: Overlay plot shows the optimal according to the first criterion 213of the second stage at D= 30% of RM
Figure 5.39: Overlay plot shows the optimal according to the second 215criterion for second recycling at D = 20% of RM
Figure 5.40: Overlay plot shows the optimal according to the first 218criterion for the third stage at D= 50% of RM
Figure 5.41: Overlay plot shows the optimal according to the second 219criterion for the third recycling at D= 21% of RM
Figure 5.20: Contours graph shows the effects o f C and B on UTS at the first stage 185
XIV

LIST OF TABLES
Table 1.1: Various thermoplastic materials used in industry 7
Table 2.1: Shows different plastic products produced by the mould process 32
Table 2.2: Shows the part of moulding 39
Table 3.1 - The research model 56
Table 3.2 - Main ranges for qualitative and quantitative data collection methods 56
Table 3.3: Response rate for Ireland and United Kingdom 79
Table 3.4: HM7 mould machine specification 114
Table 3.5: Pilot test of factors using by injection moulding 121
Table 3.6: Actual and coded values of the factorial design of the pilot test by using 121
Table 3.7: Actual values of the pilot test in the second experiment 122
Table 3.8: Actual values % of raw PP for the pilot test in the second experiment 122
Table 3.9: Actual values/levels for the variables of the second experiment 123
Table 4.1: The percentages by Cross -Tabulation of rejects which come from process 132
producing less than200 tonnes in the different recycling stage
Table 4.2: The percentages of reduced process costs from 2001-2004 132
Table 4.3: The percentages Cross -Tabulation of maximizes profits from 2001-2004 132
Table 4.4: The percentages Cross -Tabulation of the sale of recycled products with 139
Respect/regards company ownership
Table 4.5: The percentages Cross -Tabulation of the sale of recycled products within 139
manufacturing plastic companies
Table 4.6: The percentages Cross -Tabulation of profits to results the sale of recycled 140
products
Table 5.1: ANOVA table for full model 155
Table 5.2: Actual and coded values of the three factors 160
Table 5.3: The experiment layout and the measured responses 160
Table 5.4: ANOVA for reduced quadratic mode of the % of reduction of raw material 162
Table 5.5: The experiment layout and the measured responses for 1st recycling 165
Page NoTable Description
XV

Table 5.7: ANOVA for reduced quadratic mode of the % of reduction of 1st stage 167
Table 5.8: The experiment layout and the measured responses for 2nd recycling 170
Table 5.9: Actual and coded values of the three factors for 2nd recycling 170
Table 5.10: ANOVA for reduced quadratic mode of the % of reduction of 2nd stage 171
Table 5.11: The experiment layout and the measured responses for 3rd recycling 175
Table 5.12: Actual and coded values of the three factors for 3rd recycling 175
Table 5.13: ANOVA for reduced quadratic mode of the % of reduction of 3rd stag 176
Table 5.14: Process variables and experimental design levels used 180
Table 5.15: Experimental layout for first recycled material 180
Table 5.16: Responses values corresponding to each experiment 181
Table 5.17: ANOVA analysis for (Y) with the model in the first stage mixture 182
material
Table 5.18: Presents ANOVA analysis for UTS with the model in the first stage 185
Mixture material
Table 5.19: Process variables and experimental design levels used 186
Table 5.20: Experimental layout for second recycled material 188
Table 5.21: Responses values corresponding to each experiment for 2nd 189
Table 5.22: ANOVA analysis for Y with the model in the 2nd stage mixed material 191
Table 5.23: ANOVA analysis for UTS with the model in the 2nd stage mixed material 194
Table 5.24: Process variables and experimental design levels used 195
Table 5.25: Experimental layout for third recycled material 196
Table 5.26: Responses values corresponding to each experiment for 3lld 197
Table 5 27: ANOVA analysis for Y with the model in the 3rd stage mixed material 198
Table 5.28: ANOVA analysis for UTS of the model in the 3rd stage mixed material 201
Table 5.29: Cycle time of first, second and third recycling stage with mixed raw PP 202
Table 5.30: Operating costs break down 204
Table 5.31: ANOVA analysis for operating 204
Table 5.32: Optimisation criteria used for the first stage 207
Table 5.33: Optimal bases on the first criterion for the first stage 208
Table 5.34: Optimal solution bases on the second criterion for the first stage 208
Table 5.35: Optimisation criteria used for second stage 212
Table 5.6: Actual and coded values o f the three factors for 1st recycling 165
XVI

Table 5.36: Optimal solution based on the first criterion for second stage 212
Table 5.37: Optimal solution based on the second criterion for second stag 213
Table 5.39: Optimisation criteria used in the third stage 216
Table 5.40: Optimal solution based on the first criterion for third stage 216
Table 5.41: Optimal solution based on the second criterion for third stage 217
Table 5.42: Confirmation experiments for first stage 219
Table 5.43: Confirmation experiments for second stage 219
Table 5.44: Confirmation experiments for third stage 220
XVII

CHAPTER 1
INTRODUCTION

Chapter 1: Introduction
1. Introduction
The main objective of this chapter is to introduce the research topic and explain the
aims of the work. A general introduction to the themes addressed in the study is
followed by an explanation of the research objectives. A review of what constitutes
research is also undertaken, and the link between survey method and experimental
work for the effect of the recycling process on the quality products at each stage is
considered. An outline methodology of the main stages in the research process for
this thesis is then provided. An examination of the theoretical foundation that
underpins the study follows, and this discussed in relation to the methodological
literature. To this end, this chapter describes the research approach used in this study
and the link between theory and practice. An outline of the significance and
contribution of this study is then provided, followed by the outline structure of the
thesis.
1.1. Background to the Research
The plastics industry is one of the fastest growing major industries in the world.
Every year in thermoplastic materials, there is an increased level in the amount of
plastics used in all types of products. Over the past 20 years, recycling of plastics
materials, (RPM), has grown and increased dramatically. This is important not only
from the point of view of recycling rejects but also from the economic perspective
and marketing of the plastics industry since recycling allows energy and materials to
be reused and creates development [1]. Income recycling rates are currently rising
fast [2], Also, recycling of plastic reject would reduce the cost of operation
processing [3]. The recycling of plastic industrial reject materials has been taking
place for decades in the United States. While there is no documented evidence as to
when the recycling of plastics first came about, a form of such was always utilised by
the plastic industry [4]. Plastic recycling has become an established national industry
[5], Plastic industry in the United States is now in its second century, the most
important developments having occurred since 1910 [6]. The number of plastics
recycling businesses has trebled since the 1990s, with more than 1,700 businesses,
which are handling and reclaiming plastic providing support both economical and
1

Chapter 1: Introduction
environmental and are responsible for sustaining plastics industry and related
organisations. The plastics industry invested more than $1 billion to support
increased recycling within the United Sates in that period between 1990 and 1998
[7]. More than 1,000 quality products made with packaging from recycled plastic are
now commercially available [8]. Currently most plastic recycling in the UK entails
processing of reject material from industry and municipal sold west, i.e. polymers
left over from the production of plastics. This is a relatively simple and economical
approach to recycling, as there is a regular and reliable source and the material is
relatively uncontaminated. Process scrap represents some 250,000 tonnes of plastic
waste extracts in the UK and approximately 95% of this is recycled. This process is
usually described as reprocessing rather than recycling [9]. Since the 1950s, plastics
have grown into a major industry, which impacts our lives in providing improved
packaging to giving us new textiles and to permitting the production of useful new
products.
In fact, since 1976, plastic has been the most used material in the world and was
recently voted one of the top materials [10]. The plastic process industry has been
modified and developed in numerous ways, and now there are different types of
mould equipments used in manufacturing plastic products [11]. That market
orientation is an important determinant of business performance as there is a positive
relationship between market orientation and sales growth [12]. A modern system for
the development and manufacturing of new products are strongly connected to
market demand [13]. In this investigation a comprehensive study on the state -of- the
recycling plastic materials and a focus on the quality of recycling products were
carried out. This issue can be translated into a generic question: How to develop a
quality product of the recycling process so that they are able to perform their quality
tasks involving several recycling stages, in the manufacturing plastic industries. This
anomaly sets the scene for the research presented in the thesis. The research
presented in this thesis is based on a study, which investigates the effects of the
recycling process of plastic materials on the quality of the resulting recycled products
finished at several recycling stages. The survey study combines topics discussing the
state of recycling and analysis of processes successfully implemented in Industrial
2

Chapter 1: Introduction
practice in the recycling of plastic materials to improve the products quality and return
to the market [14]. Fig. 1.1 shows the recycling steps of the plastic process.
Rejects
R ejec ts
Sprites Runners
AS Reprocrtfing
Grained
R ecycling
Yw
Rejects« L - S -
Al Srart Process
Raw Plastic Materials
MouldProcessing
Scrap
31 Sell
Products
S a le
A 4 R ecycling
S tage 1
S tage 2
S tage 3
— ---------- XB2 Sell
Products
Sale
Fig. 1.1: Recycle steps of plastic process.
3
Chapter 1: Introduction
This study concerns the determination of the most effective process at each stage of
the recycle process. Although recycled plastic would assume a greater share of the
markets, the primary question is aimed at identifying which of the parameters reduce
the quality of recycled products in the plastic industry.
This data has been plotted to show the best recycling materials, thereby greatly
enhancing the overall impact and providing a much more intuitive link between the
moulding machine parameters and the products quality at each recycling stage. In
this study, statistical analysis was carried out to assess which input parameters reduce
quality in moulding production of thermoplastics. The proposed concept involves
quality sensitivity analyses by considering the process parameters as variables to
define the relationship between process parameter variation and final product quality.
Recycling is likely to reduce environmental burden since it reduces virgin material
production in general [15-16]. Recycling is the recovery of the economic value and
energy of reject materials. It can also be of industrial reject and any numerous other
types of reject [17-18]. The plastics industry as a whole will have to encompass a
viable secondary or tertiary recycling capability. The environmental setting for the
plastic industry is such that the existing plastics recycling industry has undergone
substantial expansion and development since 1980. This opinion is partially
supported by the prediction of a recent survey on the future of the plastics industry
[19].
The main objective of this chapter is to introduce the research topic and explain the
aims of the work. A general introduction to the themes addressed in the study is
followed by an explanation of the research objectives. A review of what constitutes
research is also undertaken, and the link between survey method and experimental
work for the effect of the recycling process on the final quality products at each
recycling stage. An outline methodology of the main stages in the research process
for this thesis is then provided. An examination of the theoretical foundation that
underpins the study follows is also discussed in relation to the methodological
literature.
4

Chapter 1: Introduction
1. 2. Materials Study and Description of Method
In this work, survey research methods are implemented to collect data from the
manufacturing organisation. To improve and solve problems subsequently, it has
been used in the current research, to develop a method and explanation for some of
the findings on a more comprehensive basis. Adams and Schvaneveldt [20].
Generated new information or knowledge using this approach which, in turn, can be
applied to solve problems, improve the quality and provide abetter understanding of
conditions in a given area.
The three sections in the questionnaire were developed in order to address the overall
objectives and are presented at the end of this chapter. An examination of the study’s
contribution from the survey method and experimental work is then discussed in
order to highlight the need for the work.
In this research, a questionnaire survey was submitted to industry in the Republic of
Ireland and United Kingdom. The data was analysed using statistical package for the
social sciences (SPSS) software to analyses the results and also to determine the
relationship between the recycling process and final quality of the product to
determine which input parameters reduce the quality at the various recycling stages.
The survey questions have used different parameters (such as, screw rotation, barrel
temperature and nozzle temperature) of the plastic mould machine. The results were
analysed to obtain feedback within this parameters which were evaluated to
determine their response of increasing / decreasing product quality through each
stage of the recycling process. SPSS techniques were used to evaluate responses and
identify the optimal process inputs parameters. The materials studied for the
questionnaire, include the most common types of traditional thermoplastics material used in the manufacturing plastic industry, and in durable products such as those
described in Table 1.
5

Chapter 1: Introduction
The second aim to this to study was to examine the effects of injection mould
parameters on the product quality at each recycling stage. Tensile testing was carried
out on numerous samples o f polypropylene (PP) material. The results were analysed
to obtain feedback on which parameters had a significant effect on product quality.
Design o f Experiments (DoE) has also been applied, to study the effects of process
parameters using the injection-moulding machine, HM7.
The experimental plan was based on 2K Factorial Design (FD). Linear and quadratic
polynomial equations were developed to predict the yield strength (Y) and ultimate
tensile strength (UTS) for the different recycling stages. Set of mathematical and
statistical methods were used to predict and optimise a dependent response, which
was affected by several independent parameters Chapter six will cover in detail this
topic.
The research reveals good information from the two research methodologies, such as,
the questionnaire and experimental work, which can be applied to solve problems
within the process and improve the quality o f the final recycled products.
6
Chapter 1: Introduction
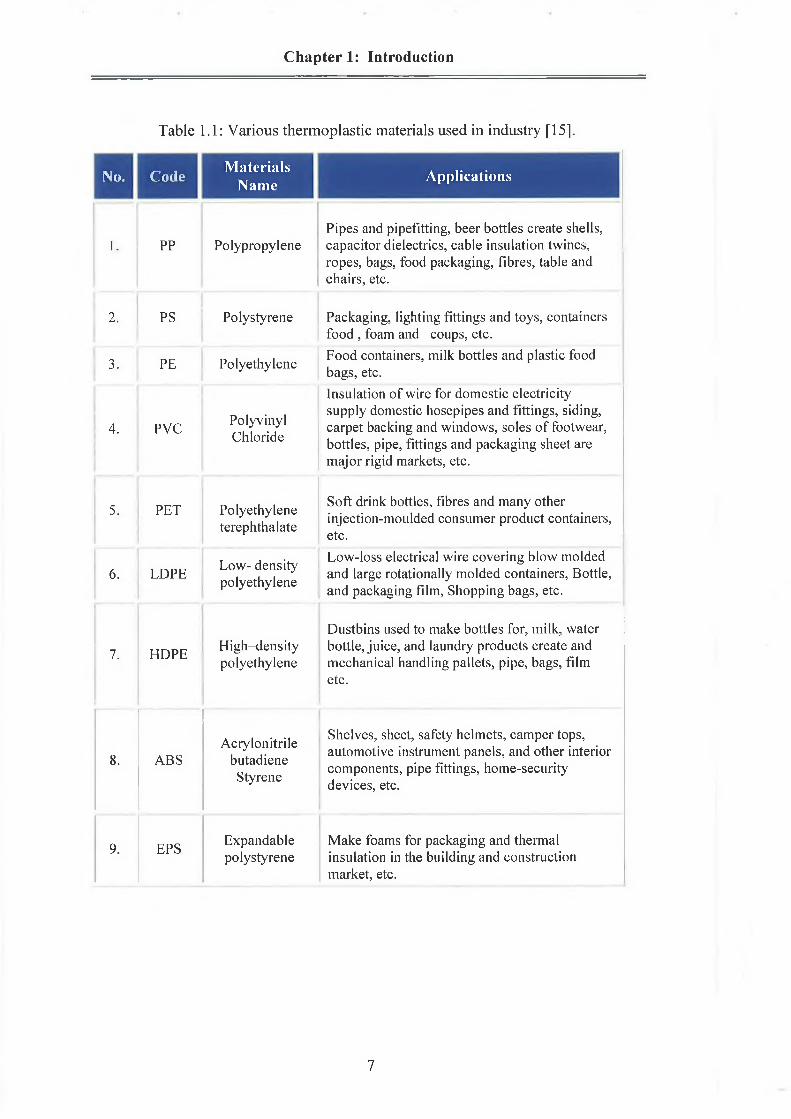
Table 1.1: Various thermoplastic materials used in industry [15].
No. Code MaterialsName Applications
1. PP PolypropylenePipes and pipefitting, beer bottles create shells, capacitor dielectrics, cable insulation twines, ropes, bags, food packaging, fibres, table and chairs, etc.
2, PS Polystyrene Packaging, lighting fittings and toys, containers food , foam and coups, etc.
3. PE Polyethylene Food containers, milk bottles and plastic food bags, etc.
4. PVC PolyvinylChloride
Insulation of wire for domestic electricity supply domestic hosepipes and fittings, siding, carpet backing and windows, soles of footwear, bottles, pipe, fittings and packaging sheet are major rigid markets, etc.
5. PET Polyethyleneterephthalate
Soft drink bottles, fibres and many other injection-moulded consumer product containers, etc.
6. LDPE Low- density polyethylene
Low-loss electrical wire covering blow molded and large rotationally molded containers, Bottle, and packaging film, Shopping bags, etc.
7. HDPE High-densitypolyethylene
Dustbins used to make bottles for, milk, water bottle, juice, and laundry products create and mechanical handling pallets, pipe, bags, film etc.
8. ABSAcrylonitrile
butadieneStyrene
Shelves, sheet, safety helmets, camper tops, automotive instrument panels, and other interior components, pipe fittings, home-security devices, etc.
9. EPS Expandablepolystyrene
Make foams for packaging and thermal insulation in the building and construction market, etc.
7

Chapter 1: Introduction
1.3. Research Questions
The research questions are used as a guide to address the study and are used as a
starting point for analysis [21] [22]. In general, these questions are developed in
order to address the issues raised from the research objectives as presented in the
section 1.6. As a result of the generic questions initially renewed, more specific
research questions have evolved and are outlined as follows:
1. Why and how recycling are process implemented within the plastic, industry
in Ireland and the United Kingdom?
2. How does the recycle process affect on the quality on the product at each
recycle stage?
3. What is the relationship between the process parameters and product quality
at each recycle stages?
4. How does the recycled process affected on sell of recycling products in the
different recycle stage?
In the context of this study, three hypotheses are formulated, for the purpose of
offering a clear framework and direction to this research, as well as to guide the
collecting, analysing and interpreting of data [23]. In order to answer these questions,
a number o f propositions are developed during the literature and presented in
chapters, four and six which examine in detail the issues involved.
Analysis o f the research questions involved bivariation correlation and “ANOVA”
test, applied to exam the quality of the recycled process at each recycling stage.
1.4. Problem Definition
The strategy of developing mixed material is extremely useful for recycled PP. Since
PP undergoes a rapid and deep degradation phenomena, with subsequent decrease in
mechanical properties. The problem investigated by this research is considered
amongst the basic problems, which focus on the quality of the product at different
recycling stages. Often during the manufacturing process o f traditional thermoplastic
8
Chapter 1: Introduction
materials there is a vast number o f rejects (that is, scraps) after the moulding process,
although this problem is solved by one of the most common recycling techniques, in
mixing raw PP and recycled PP to produce products with desired quality. This
practice is very common in industry where plastic rejects are ground and
reintroduced into the processing apparatus together with raw material. The main
problem related to this practice is choosing the right amount in percentage of
recycled PP to be mixed with the raw PP at the mixing stage.
Much research reviews the properties o f several percentages mixture, with particular
reference to the effects o f the amount o f the recycled PP used in the mix. A brief
overview of the models used to predict the properties of mix is also given. As
previously outlined, the preparation o f mixed PP is, in general, a very useful way of
managing plastic recycling. The analysis and prediction of the mechanical properties
of PP mixture is extremely complicated, as the different level of parameters used
dramatically affects these properties. This is the reason for different in results
published previously in literature. This study led to identification to an optimum and
subsequent improvement in product quality at varies recycling stages by the various
mixed percentages o f raw material with recycled polypropylene (PP) plastic
materials.
1.5. Aim of the Research
The primary objective of this research is to develop a mathematical model to
describe the behaviour of plastic materials PP, for each recycling stage, using
different recycling parameters with injection moulding machine, HM7. The
following points identify the core o f this research study:
1. To identify the economic and marketing benefits of recycling traditional
thermoplastic materials.
2. Effect of the length/ duration o f the recycling process on the mechanical
properties.
3. The effect o f the process parameters on the quality of recycled products.
4. To analyse the quality performance versus the product cost.
9

Chapter 1: Introduction
1.6. Research Hypothesis
This research thesis examines and develops the hypothesis though implementing two
methods, such as, that of questionnaires and experimental work, for each recycling
stages. This research also examines the premise that both quality and marked
orientation do indeed improve recycle.
Considering performance in the manufacturing thermoplastics. The following points
can be considered:
1. Relationships between numbers of recycle processing and product quality.
Also, the percentages of raw material used with recycled materials to
improve and achieve optimal quality products for second and third stage in
recycling.
2. Effects o f the process inputs parameters on the quality o f the product for
each recycling stage.
3. Relationship between recycle processing and market at each recycling stages.
The research analyses considered quality product, input process parameters and
market orientation as the independent variable (XI, X2 and X 3) and recycle
performance (Y), as the depended variable. The statistical analysis was done using
the” SPSS” software to determine the correlation between the variables of the study,
as well as the significant effect of the independent variable on the dependent variable
by using “ANOVA” test. Each hypothesis was discussed and tested based on the
findings o f the statistical analysis, which is presented in chapter four. The correlation
matrix indicated that there is a high relationship between Xi, X2 and X 3with the
depended variable. As indicated, there results are analysed in chapter four and six.
1.7. Preliminary Research
This is the starting point of the research. A comprehensive literature survey on the
subject o f the recycling process of thermoplastics was actively conducted. This study
will be reviewed in chapter three.
10

Chapter 1: Introduction
1.7.1. Designing the survey
The preliminary research is used in identifying the areas, which need to be addressed
in designing of the implementation framework. Following this, the most important
phase o f the work was the design o f the survey. Two kinds of survey method have
been used in this work.
1. Web based survey, (requiring a web page on the internet).
2. Traditional postal survey.
During this stage a pre- test and a pilot test of the survey was conducted. Chapter
three will cover in depth this topic.
1.7.2. Survey analysis
Data collection has been done by survey methods and some statistical tools have
been implemented for the data analysis such as frequency, cross -tabulation and
correlation. Also, graphical representation (such as, pie chart and bar charts) along
with a discussion which followed the results of the analysis. Chapter fife will cover
in detail this section.
1.8. Significance and contribution of this study
There has been little or no substantial research carried out in involving questionnaire
methods in the aspect o f recycling within the manufacturing plastics industrial and
laboratory work using several stages with mixed material. This research is therefore
important as it addresses the need for this in both Ireland and the United Kingdom. In
general, there are five main areas where the work presented in this thesis provides a
significant contribution to knowledge in the following manner:
1. The literature review addresses the gaps in the recycling process and related
operations involving plastic materials. Literature focuses on the aspects of
survey using plastic materials resource and mixed polypropylene recycled
material with the PP raw material at different percentages to be
development.
11

Chapter 1: Introduction
2. The study identifies the economic and marketing benefits of recycling
traditional thermoplastic materials.
3. The study examines and carries out a comparative study on the aspects of
recycling process implementation between survey method and experimental
work.
4. The study investigates possible linkages between the recycling process and
final product quality at each recycle stages.
5. The study investigates the effects o f process parameters during the injection-
moulding machine HM7 with PP plastic materials on the quality of recycled
products at several recycling stages.
6 . The study offers a proposed solution in providing predicted and optimised
mould process parameters.
1.9. Overview of the Thesis
This thesis is divided into seven chapters. A description o f each chapter is described
below:
Chapter l ”Introduction”:
This chapter present a brief introduction to the research topic area and explains the
aims o f the work and subsequent problem statement. The research addressed in this
study is followed by an explanation of the research questions and aims of the
research. An explanation on why questionnaire and experimentally selected as a
comparison study is also presented. This chapter also describes the research approach
used in this study and the link between theory and practice.
Chapter 2”Literature Review”:
This chapter presents a review o f existing literature on the subjects in accordance to
the aims o f the research that have been outlined in the previous chapter. A critical
evaluation of the recycling process in literature and other related areas is undertaken
to determine the research work that has taken place, as well as to identify gaps in the
12

Chapter 1: Introduction
literature that will provide the framework for this research study and direction for the
empirical research. The literature review is divided into four sections with the
specific sections as follows.
• The first section provides an overview of the recycling process of plastic
materials.
• The second section presents the technologies used in this study, such as
“Injection Mould “, and classification of mould equipments.
• The third section provides an overview for mechanical properties o f mixed
polypropylene (PP) plastic material.
• The final section of this chapter focuses on the related work for an application
of Design of Experiments (DoE).
Chapter 3 “Designing the Survey and experimental procedure”:
This chapter describes the methodologies used in this work and presented as follows:
• The first section provides a detailed survey using questionnaire’s designed
into three sections; section A: company profile; section B: recycling of plastic
materials and section C: selling o f recycled products. In this chapter, two
techniques are highlighted which have been used to assemble data collated in
response to survey conducted and analysed using “SPSS” statistical software.
• The second section describe the first traditional post survey method technique
which was used to assemble data from the Republic of Ireland and United
Kingdom plastic companies.
• The third section of this chapter focuses on the second online survey method
technique, which was used in this research.
The final section o f this chapter presents the study using an experimental work to
collect data, and analysis techniques used Design Experimental V.7 software. This
section is divided into three points:
13

Chapter 1: Introduction
• Material study. This section involved raw, first, second and third stage with
recycling polypropylene (PP) plastic material. Each every stage using grinder
samples with several process parameters used to determine the effect on the
mould sample using injection mould HM7 machine.
• Tensile Test: This section is presented to evaluate recycling properties for
several sample parameters in which mechanical properties are affected after
the moulding process and to analyse all the response data using Experiment
Design Software V7.
• Statistic design V7 Software, FD Technical'. This section highlights the
limitations and implication in developing response data witan experimental
plan based on 2K Factorial Design (FD) for each recycle stage.
Chapter 4 Survey Results ad Analysis:
This chapter covers the analyses of the results obtained from the survey. The results
of three hypotheses testing are provided in chapter’s fife and six.
Chapter 5 Experimental Design:
This chapter provides a detailed description on the experimental design modelling
which has been applied to study the effects o f processing parameters on the
mechanical properties by using the injection-moulding machine HM7. Data from the
experimental tests were carried out using Design o f Experimental (DoE) statistical
techniques. The tests were conducted on controlled-moulding samples at different
parameters, to examine yield strength (Y) and ultimate tensile strength (UTS) at
different recycling stages. 2K Factorial Design (FD) were applied by using “ANOVA
“test to produces models at each stage.
Chapter 6 “Conclusions and Future Work”:
This chapter presents the main results associated to this research. It also outlines the
thesis contribution and recommendation for future work based on the present study.
14

Chapter 1: Introduction
Finally Fig. 1.2 shows the schematic diagram of research out line Fig. 1.3 shows the
method of approach used in the present study for the two methods, as also provided
in chapter three.
1.10. Chapter Summary
This chapter introduces the research topic area and summarises the aims of the work.
It provides a general introduction to the background of the research addressed in this
study and also gives an overview of the methods describing the methodology. This is
followed by an explanation of the research questions and aims of the research. A
brief introduction on recycling o f several thermoplastic materials and the
implementation o f recycling process for rejects o f plastic materials coming from the
plastic industry. This chapter also describes the research approach used in this study
and the link between theory and practice.
15

Chapter 1: Introduction
CHAPTER ONEIntroduction
CHAPTER TWO Literature Review
Literature Survey
IIE U P H H L __________ _________CHAPTER THREE -
Designing the Survey And Experimental
Procedure■m
CHAPTER FOURSurvey Results and
Analysis
CHAPTER FIVE Experimental Design
^Appendic^^^^J^
Appendices B
.......... ........ .. .......... . • •CHAPTER SIX Conclusion and
Recommendations
A ppendices
Reference
« ■■■■ BPS9HHVHNHAppendices
.
16

Chapter 1: Introduction
I
I
Research Survey
"Preliminary Project
Questionnaire Survey
Sending Qi[uestionnaire
I
*
Gathering Data
m ~ ir~Ì',——1 -..HI --- ----Data malysis by Softw are
SPSS fERll.O
Resuit and Discussion
;Piciec; Objective
Experiment Investigation
IMould Plastic Materials PP
Injection Mould Mach in e HM1
_________ __________________Result aiid Discussici! I D
1Project Objective
~ T —Validly
-
.............5-------------—---
Data inputs, Experiment Design Software (V7)
r ........ ► Design Surrey
........►
► Pilot Test o f surv ey
■ -
..........► Post Sun'w- -
........► Online Suney
.*m m _______-► Frequency
I— I ID- Crosstabulatio
Mould Ran Materials ¥ Gtmdei Smpie-.
Mould First Recycle , , * Tensile Test i' « ■ M M r ; — - - - — -
.<m " 1 ~ ■+ G ru id« Saajples
■ ■ ■* Mould Second Recycle * “1
T ' * Tensile Test
TensflfcJTest )
]fiS............
* Approaches FD- —
Optimisation
UPk. >41FD__ - :
Quality
>■...... ► Result and Discussion
Fig. 1.3: The method of approach used in the present study.
17

CHAPTER 2 LITERATURE REVIEW

Chapter 2: Literature Review
2. Literature Review
2.1. Introduction
This chapter provides the reader with a clear explanation to what is involved in this
process, and also presents the relevant work that has been done by applying these
methodologies to the recycling process using addition of raw polypropylene (PP) to
recycled PP and also using various mixtures of PP with the other plastic materials.
Fig. 2.1 shows a schematic of the demonstrated reject and sale recycling products.
2.2. Purposes of Literature Review
In line with the purpose o f compiling a literature review, as mentioned above; this
chapter presents a review of existing literature in developing the theoretical and
experimental understanding on the following topics, in accordance to the aims of this
research; (1) recycling process of plastic materials; (2 ) rcycling process of mixed
polypropylene (PP) plastic materials; (3) application of Design of Experiments
(DoE). A critical evaluation of the maintenance literature and other related areas is
undertaken to determine the research works that had been done, as well as to identify
gaps in the literature that will provide direction for the empirical research. In the
context of this study, three hypotheses are formulated, for the purpose o f offering a
clear framework and direction to this research, as well as to guide the collecting,
analyzing and interpreting of data. This chapter provides the reader with a clear
explanation as to what is involved in this process, and also presents the relevant work
that has been done by applying these methodologies to the process. Fig. 2.2 shows a
link between business, manufacturing strategy and recycling process.
18

Chapter 2: Literature Review
Raw Materiel
No Yes
Moulding
No
Rejects
VGrinder
N o Products
Yes
Sale <........ ......................
Reprocess
i
I
— M o u ld
First Second recycling Third recycling
M ould
Rejects
M o u ld
ProductsM M H H P P P H I P I H P
Rejectsa s
Products■ mtÈitàÉÈimtÊk
v a p u p i M P i p p i B n
Rejects Product111111'
|1lii
f i l f
iiiiii
Fig. 2.1: Schematic diagram of demonstrated rejects and sale recycling.
19

Chapter 2: Literature Review
Fig. 2.2: The link between business, manufacturing strategy and recycling process.
2.3. History and Background of Recycling Plastics
Currently, most of plastic recycling in the UK entails the reprocessing of rejects from
industry and municipal solid waste (MSW), i.e. polymers left over from the
production of plastics. This is a relatively simple and economical way to recycle [24],
The recycling o f plastic waste is unlimited to rejects from manufacturing [25], The
utilisation of reject at various stages is presented in Fig. 2.2. In 1988, only 1% by
weight of all discarded plastic was recycled in Florida [26]. This represents 13% of
the total packaging material. From 1985 to 2000, plastic packaging was predicted to
increase by 77% PP, PET and HDPE are the major recycling plastics technology offer
more economically attractive alternatives for plastic recycling or disposal.
20

Chapter 2: Literature Review
Since the 1950s, the processing of plastics have grown into a major industry affecting
our lives, from providing improved packaging to giving us new textiles and permitting
the production of useful new products. In fact, since 1976, plastic has been become
the most used material in the world and was recently voted one of the top materials
[27]. In the USA, around two -third o f all petrochemicals are used in the production
o f plastic. 25% of these plastics were recycled representing an increase by 25% of
recycled materials being returned to the market [1]. An important series of articles
were published in “Kunstoffe-Germany Plastics” in 1978, when the articles provided a
detailed description o f developments in plastic recycling in many countries [28-29].
This could provide the basis o f a substantial tertiary plastics recycling industry [30].
2.4. Definition of Recycling
Recycling may be defined as any activity involving reclamation, recovery or reuse
o f materials; in other words; any method of extracting value in the form of energy or
material from waste generated at any time in the life cycle o f a product. Recycling
may be mechanical, chemical or thermal [31]. Recycling is only sensible if the cost
o f processing the rejects increases the value o f the recycled product. When the
recycling of plastics first came about, a form of it was utilised by the plastic industry
in its infancy. Various plastic manufacturers learned that rejected parts and trim from
the fabrication process could be reused in the process to contribute in the formation
o f new plastic products [32].
The plastic process industry has modified and developed numerous methods, and now
there are different types o f mould equipments used in the manufacture plastic products
[14]. Injection moulding is one of the most versatile and important processes for mass
production of complex plastic parts [15]. Injection moulding is the most important
method used for producing different plastic shapes [16].
21

Chapter 2: Literature Review
2.5. Types of Recycling
The methods by which value may be regained from waste or used plastics may be
divided into three categories:
• Mechanical recycling secondary.
• Chemical recycling tertiary.
• Thermal recovery quaternary
At each level of the original structure, in which the material and then the polymer
itself, is further dismantled, it may be argued that reuse is not really a form of
recycling, as many materials for instance are intended for repeated use. Mechanical
recycling may be primaiy or secondary, while the third categories have an exact
relationship [31].
Due to the mechanical recycling secondary poorer properties o f recycled material,
some companies establish a maximum percentage of recycled material to be added to
raw material, according to the product to be manufactured and their improve quality
[33-35], This study involves identifying profitable uses for each recycling stage.
2.6. Utilisation Technology for Recycled Plastics
Recycling of plastic materials is sensible for reducing the cost of operation
processing [36]. The recycling o f commercial and industrial reject materials from
plastic and textiles to metals and paper has been occurring for decades in the United
States. Various plastic manufacturers are aware that rejected parts and trim from the
fabrication process may be returned to the process to aid on the formation of new
plastic products. This procedure, known in the plastics industry as regrinding, can be
repeated numerous times, as long as the additional percentage o f raw materials
produces products with good. Any excess rejects may sell to other smaller firms to
22

Chapter 2: Literature Review
enable future utilization /re-processing o f the plastic [31]. The plastic process
industry has been modified and developed in numerous ways. Now there are
different types o f mould equipments used in the manufacture o f plastic products [14].
Currently, most plastic recycling in the UK is based on process rejects from industry,
such as, polymers left over from the production o f plastics. Process rejects represents
some 250,000 tonnes o f the plastic waste raisings in the UK and approximately 95%
of this is recycled. This is usually described as reprocessing rather than recycling
[36].
2.7. Recycling as an Economic Activity
The manufacturing plastic companies began to recognise the problems inherent in the
recycling polices that over-emphasise the materials supply at several stages, and to
see the potential cost saving and other economic benefits that recycling offers. In the
early 1990s, a wide range o f “market development “policies were adopted by state of
market development policies either sought to influence on the profits. Demands,
directly through companies purchasing or requiring certain product to process
minimum recycling content; promote recycling via taxes, fess, and other pricing
instruments [37].
If states are to achieve and maintain recycling rates of 50% or higher, then they will
need to intensify these efforts and build domestic capacity to absorb secondary
materials into their economies. This would imply a significant industrial shift from
resource extraction to materials recycling; creating important economic opportunities
for urban and rural regions, alike. In order to realise these opportunities; new
varieties o f economic development planning will be required, focusing on analysis of
local re-utilisation of these materials when considered as waste meanwhile,
environmental concerns have continued. Today, environmental awareness reaches
beyond localised concern about public health; to include large —scale impacts of
resource extraction and use upon natural ecosystems. In order to remain relevant to
the broader environmental challenges facing society today, recycling or material
policies o f the future must address the consumption as use o f materials as their
disposal, seeking to minimise environmental harm at each stage o f a products life
[37]. As the preceding discussion should make clear, the arena o f policy in which
23

Chapter 2: Literature Review
companies have sought to influence large-scale recycling markets is in-depth. Many
different types of approaches have been tried, and there has by now significant real -
world experience with many variations on each approach. An understanding of large-
scale market forces in the economy is of elemental importance to all aspects of
public policy, as it is of particular importance to recycling, since market realities
fundamentally shape the willingness of businesses to participate in the secondary
materials economy, significant market and no market barriers to the broader use of
secondary materials do indeed appear to exist, even in the absence of government
intervention to remove the remaining distortions. Recycling rates are currently rising
fast, with additional action; this trend can be expected to accelerate. Environmental
economics suggests how to analyze and rectify these barriers and distortions. The
basic scenarios include processing and marketing in each plastic material [37]. Fig.
2.3 illustrates the integration of economic development and planning between the
manufacture of the recycling process and market; financial department in businesses
plastics company.
Manufacturer process of recycling
“Environmental and economic”
Financial Marketing
Fig.2.3: Integration company department.
24

Chapter 2: Literature Review
2.8. Review of Some Previous Studies on the Surveying of the Recycling Process
of Plastic Materials
A survey directed to the post-consumer o f recycled plastics was designed to quantify
the amount o f recycled plastic bottles in 2002. The results indicated that 13 million
pounds increased total post-consumer plastic o f recycled bottles in 2002. A
questionnaire was developed and mailed to Elko County in Nevada-USA. The
questionnaire was used to obtain information pertaining to current recycling practices
and potentials for recycling in Elko County [6]. These studies have investigated the
recycling in Nevada -USA. This study looked at the public and private sector
activities in the recycling market development, and its recycling activities. Some
companies import secondary materials that are processed to their specifications. In
Nevada, much of the industrial plastic scrap was recycled. It was found that the
majority of recycling markets require suppliers to deliver plastics separated
according to the required product. The study also analysed the market trends and the
factors that affected demand o f such recycled products. It was demonstrated that
manufacturers using raw materials to produce their products would affect the
recycling market. The study also shows that small numbers of Americans have
realised the importance of recycling on the environment. Since 1980, the number of
people using recycled materials has increased by nearly 20 percent. The high cost of
oil and gas can cause companies seek for cheaper recycled plastics. The main
advantage o f using recycled plastic is that the cost of a recycled material is not
affected as much by the fossil fuel market in raw plastic. The recycling industry
should reduce their prices to gain more consumers of recycled goods [8]. The data
from the survey method was sought from over 150 recycling companies; information
about the quantity o f recycling material was requested. The questionnaire asked the
respondents to identify all materials that they recycle from a list developed for each
industrial category. The results show that 3,377,000 tonnes of material were diverted
from landfill during 1999-2000 - reflecting the activities o f 75 recycling companies
in the United State o f America [9].
25

Chapter 2: Literature Review
Ref [38] has described the Plastic and Chemicals Industries Association, (PACIA),
survey study have carried out, named the “National Plastic Recycling Survey”. The
survey gathered data from the years, 1993-2000, on the recycling and reprocessing o f
plastic in Australia. The PACIA has established systems for the collection and
reprocessing o f pre-consumer industrial scrap and post-consumer plastics waste. The
demand for recycled plastics, used for the production of new products was analyzed.
From 1997 to 2002, the total recycling rate o f plastic in Australia has increased from
7.0% to 13.4%, as shown in Fig. 2.4 [38].
Fig. 2.4: Total plastic recycling rate (1997-2002) [38].
In 2003, PACIA again, carried out the National Plastics Recycling Survey. The survey
gathered data for the 2002 calendar year. Results show a total o f increased recycling
plastic materials from the 2000 to 2002 [38], The total recycled quantities o f different
plastic materials were reprocessed in Australia from all sectors, as shown in Fig. 2.5.
It is important to note that the recycling performance of each plastic material is more
easily distinguished by its recycling rate, as some plastic material have lower
consumption volumes, and some are used most widely in long-term applications.
Plastic Material
2 6

Chapter 2: Literature Review
Fig. 2.5: Total recycling of individual recycling plastic materials [38].
In 2002 over 100, 000 tonnes were reprocessed locally and 43, 000 tonnes exported
for reprocessing. In 2002 the recycling rate was slightly higher than in 2001 by 13.1%.
The survey collected data on total plastics recycling, comprising o f local plastics
reprocessing and exported waste plastics destined for reprocessing [38], Other studies
have been carried out for different recycled materials. These studies investigate the
affect of marketing on the various recycled materials [39]. The survey analyses,
showed the effect o f the recycling process on the market of the final recycled
products. Recycled products include paper, plastic and glass. The analyses involved
the scrap of the products that come from the municipal and go to the manufacturers to
produce the final products. Manufacturers were using mixed raw materials to produce
their products with good quality [40]. Fig. 2.6 shows schematic of various recycling
waste and process mould equipment.
27

Chapter 2: Literature Review
A t Colktrian
Recycling o f plastic material
industrial rf asre
C o m m e rc ia l Was re
MunicipalWaste
> —n
| V M * MA g r ic u ltu ra l
Waste
Shops Sue«? II Hotels Ctthe:
A2 Rsjecu
Rejects after Process
A3 P n t m
Grinding
M ixed M aterial
Recycling
.lb CollfCtkMl ■ *
M ixed M ateria1
........ -
Rec\’cluiaII
Moulding
A4 [ P ro c u : equipm ent
A_Injection m ou ld in ' Blow M o u ld in g F ilm M o u ld in g Extrusion
Fig. 2.6: Schematic o f different recycling waste and process mould equipment.
28

Chapter 2: Literature Review
2.9. Injection Moulding Technology
In the injection moulding process, a plastic material is injected under pressure into a
mould. In the case o f thermoplastic injection moulding, the material is supplied in
pellet form, dried melted and injected into the mould where the material cools and
solidifies. Thermoplastic materials account for 80% o f all injection-moulding
materials worldwide [41-42]. The process allows the manufacturing of complex
shapes in a wide range of materials. The process can also be highly automated and is
capable of achieving high production rates with a high level o f reliability [43].
This makes the process ideal for mass production. In addition, components are
produced in a single operation with minimal waste [44]. During injection moulding
the heated plastic material is injected into a mould and stamped out. This process
changes the properties and causes the recyclable life to severely decline [8]. The
method is suitable for mass production with complicated shapes, and a large part in
the area of plastic processing. The injection system consists of a hopper, a
reciprocating screw and barrel assembly, and an injection nozzle. The nozzle
connection is shown in Fig. 2.10. Fig. 2.11 shows two and three-plate moulds [45].
2.9.1. Type of moulding processes
The plastic process industry has been modified and developed in numerous ways,
and now there are different types of injection mould equipments used in
manufacturer plastic products such as [46]:
• Injection Moulding.
• Blow Moulding.
• Extrusion Moulding.
• Film Mould.
Injection moulding is one of the most versatile and important operations for mass
production o f complex plastic parts [15]. Injection moulding is the most important of
all the commercial methods o f plastic processing [16]. Injection moulding in the
western world is becoming increasingly competitive as the manufacturing base for
many plastic materials has re-located to the east [17]. There are different types of
moulding method present in the manufacturing industry, such as; blow mould,
29

Chapter 2: Literature Review
injection mould and extrusion mould and all process are used in the recycling of
thermoplastic materials as shown in Fig. 2.7 [ 46].
(A)Hollow mandril form s Inner
surface o f bottle neck
Extruder and die as aboveCompressed a ir expands plastic
tube against mould M ould closed a t second stage
To nip end o f tube shut
(B)
Clarnp Hopper containing, plastic In form ofpellet or powder Two p a rt sp lit m ould
Clampholdslufouldshut
(C)
leaves die
Fig. 2.7: Process mould techniques, blow moulding (a), injection moulding (b) and
extrusion (c) [54].
30
Chapter 2: Literature Review
Plastic is one of the world’s faster growing industries. It involves a rapidly
increasing number of industrial, commercial and domestic applications, giving rise
for the need to expand existing development strategies and create new dimensions
at design and manufacture stage. Injection moulding has the advantage that
moulded parts can be manufactured in unlimited quantities o f products [47].
Injection moulding is the most important process used to manufacture plastic
products. Today, more than one third of all thermoplastic materials are injection
molded, and more than half of all polymer-processing equipment is for injection
moulding .The injection moulding process is ideally suited to manufacture mass-
produced parts o f complex shapes that require precise dimensions [48].
Injection moulding is one of the most common processing methods for
thermoplastics. Nowadays, a multitude o f different types o f injection-moulded
exist as shown in Table 2.1 to different mould products. In the injection moulding
process, a thermoplastic in the form of granules or powder, passes from a feed
hopper into a barrel where it is heated until it becomes soft. It is then forced
through a nozzle into a relatively cold mould, which is clamped tightly closed.
After the plastic is cooled and solidified, the article is ejected and the cycle is
repeated. The major advantages of the process includes its versatility in moulding
a wide range of products, the ease with which automation can be introduced, the
possibility o f high production rates and the manufacture o f articles with close
tolerances [49]
31

Chapter 2: Literature Review
Table 2.1: Shows different plastic products produced by the mould process [50], [51].
Applications
Different types o f injection-moulded products, such as, domestic applicable washing machines, dishwashers, air-conditions, office equipment kitchen utensils such as, spoons, knives, forks, kettle, toaster machine. Vehicle moulds include, panel, car lamp housings, automobile filters, car brake sockets and vents and factories mould
Injection Moulding include combs, syringes, paint brush, handles,crash helmets, telephones, mobile phone, gearwheels, brief cases, television cover housings, typewriters, computers cover, keyboard, automotive parts, medical equipment and communication facilities home appliances, pipe fitting, bin, chair, vegetable box, drawer, baby chair, baby walk, toys, tray mould, MDF floors molding and door hands.
Different type and size o f container and bottles.
Plastic sheet i.e. cups, plate, trays, pipes, house siding, door, window seals and flooring i.e. skirting, end-caps, reducers, T-mouldings, stair noses, and quarter rounds, etc.
Plastic sheet, such as, packing fruit, food, roof sheet garments, textiles, daily-use articles and industrial products, such as, plastic bags in
Extrusion Mould different size and types, plastic films in severalforms and formats, paper board and cloth material Ice-pop filling and sealing machines and different size tubes.
Blow Mould
Film Mould
Mould Process
32

Chapter 2: Literature Review
2.9.2. Injection moulding materials
The synthetic materials used in the injection moulding process are generally
termed plastics or polymers. Strictly speaking the terms have different meanings.
A plastic is defined as organic, synthetic or processed materials that can be easily
shaped or formed. Alternatively, a polymer is defined as a complex, organic,
polymerised compound consisting of repeating. Structural units that can be shaped
or formed [52]. Thus, polymers are a subgroup of plastics as most plastics are
development in the field of thermoplastic are associated with Polypropylene (PP),
Polyethylene (PE), Polystyrene (PS), and Polyvinyl Chloride (PVC)
thermoplastics which represent 85% of the world’s production [53],
2.9.3. Injection moulding process stages
Injection moulding is a continuous process consisting o f several different distinct
stages. The stages can be classified from either a machine or materials perspective
[53]. From a materials perspective, as the material progresses from raw state to final
form, it is heated to molten form (heating stage), injected under pressure (filling
stage), pressurised to full density (packing stage) and allowed to solidify (cooling
stage). It is then ejected from the mould. These main stages are illustrated in fig. 2.8 in
processes cooling commences as soon as the materials leaves the heated barrel while
in other processes the material is heated over an entire cycle [45]. Fig. 2.9 shows a
single-screw injection-moulding machine and its components.
33
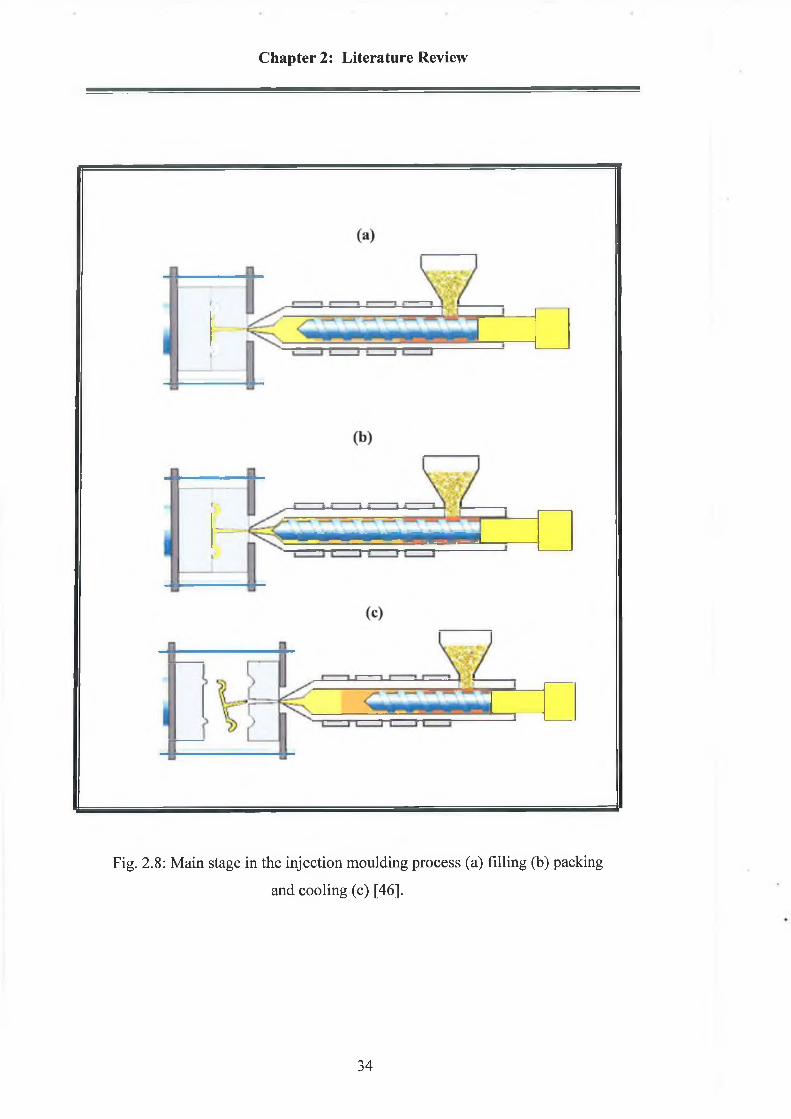
Chapter 2: Literature Review
Fig. 2.8: Main stage in the injection moulding process (a) filling (b) packing
and cooling (c) [46].
34

Chapter 2: Literature Review
Nozzle S tationary P la ten M ovable Platen
-H o p p e r Heateira
In je c ts n C ham ber
R o ta tin g and B a rre lR ecip roca ting Screw
MoldPlates
A
Ti
Sprue
Fig. 2.9: A single screw injection-moulding machine for thermoplastics, showing the
plastic zing screw, a barrel, and band heaters to heat the barrel, a stationary platen, and
a movable platen [45].
Components of the single parts o f injection -moulding machine include [47]. Fig. 2.10
shows nozzle connection.
(1)TheHopper
Thermoplastic material is supplied to the moulder in the form of small pellets. The
hopper on the injection-moulding machine holds these pellets. The pellets are
gravity-fed from the hopper through the hopper throat into the barrel and screw
assembly.
(2) The Barrel
As shown in Fig.2.11 the barrel o f the injection-moulding machine supports the
reciprocating plasticizing screw. It is heated by the surrounding electric heater bands.
3 5

Chapter 2: Literature Review
(3)The Reciprocating Screw
The reciprocating screw is used to compress, melt, and convey the material. The
reciprocating screw consists of three zones as follows:
-The feeding zone
-The compressing (or transition) zone
-The metering zone
(4)The Nozzle
The nozzle connects the barrel to the sprue brushing of the mould and forms a seal
between the barrel and the mould. The temperature of the nozzle should be set to the
material's melting temperature or just below it, depending on the recommendation of
the material supplier. When the barrel is in its full forward processing position, the
radius o f the nozzle should nest and seal in the concave radius in the sprue brushing
with a locating ring. During purging of the barrel, the barrel backs out from the sprue,
so the purging compounds can free fall from the nozzle. These two-barrel positions
are illustrated below.
Fig. 2.10: Nozzle connection [45].
36

Chapter 2: Literature Review
Fig. 2.11: Part o f injection unit [54].
Injection moulding is a method to obtain moulded products by injecting plastic
materials molten by heat into a mold, and then cooling and solidifying them. The
method is suitable for the mass production o f products with complicated shapes, and
takes a large part in the area o f plastic processing. The process of injection moulding
is divided into four major steps as shown below.
• The Mould
The mould system consists of tie bars, stationary and moving plate, as well as
molding plates (bases) that house the cavity, sprue and runner systems, ejector pins,
and cooling channels, as shown below. The mould is essentially a heat exchanger in
which the molten thermoplastic solidifies to the desired shape and dimensional
details are defined by the cavity. A list o f terms and a pictorial of their position on a
typical mould is shown in Fig. 2.12.
37

Chapter 2: Literature Review
Fig. 2.12: Type of mould [48].
38

Chapter 2: Literature Review
The moulding is completed in the following keys as shows in Table 2.2.
Table 2.2: Shows the part o f moulding [48].
No. P art of Mould i No. P art of Mould
1. Compression sring 12. ---------------Parting line
2. Ejector bolt 13. Cavity retainer plate3. Movable clamping plate 14. Stationary clamping plate4. Ejector and ejector retainer plates 15. Plug for cooling line
connection5. | Ejector pin 16. Locating ring6. Central sprue ejector 17. Sprue bushing7. Support plate 18. Cavity line8. i Straight bushing 19. Cooline line9. [ Cavity retainer plate 20. Cavity insert10. Leader pin 21. Support pillar
11. Shoulder bushing
• Two-plate mould
The vast majority o f moulds consist essentially o f two halves, as depicted Fig. 2.13.
This kind of mould is used for parts that are typically gated on or around their edge,
with the runner in the same mould plate as the cavity.
• Three-plate mould
The three-plate mould is typically used for parts that are gated away from their edge.
The runner is in two plates, separate from the cavity and core, as shown in figure 2.10.
From a machine perspective, (see Fig. 2.8), the cycle commences with the injection
stage, during which the mould is filled; a holding stage where the mould is brought up
to pressure and the materials allowed to cool. This is followed by mould opening,
component ejection and mould closing stage.
39

Chapter 2: Literature Review
ÎP a r t s
A " P la te S tr ip p e r P la te “ ß ” p la te
R unner
n ----------I
> 4
_______ _ 1
n
J ’ J " nt
P a rts
Fig. 2.13: Two and three-plate mould [45],
40

Chapter 2: Literature Review
The proportions of both the cycle and profiling as shown are indicative o f the time
spent on each stage in the cycle. The injection moulding process is completed in the
following stages [55]. Fig. 2.14 shows the typical injection moulding cycle.
■ Mould Closing; This stage should be as quick as possible, but not so fast as to
cause damage to the parting surface o f the injection mould.
■ Mould F illing; The plastic melt is forced to fill the cavity o f the mould.
■ M ould Packing; After the plastic is injected, the pressure is increased to
consolidate the plastic in the cavity.
■ Cooling ; This stage consists o f cooling the plastic from its injection temperature to
its ejection temperature.
■ Ejection; In this stage the mould is opened and automatically ejected.
5% 5 %
63%
■ Ejection■ Mould Closing□ Mould filling□ Mould Packing■ Cooling
Fig. 2.14: Typical injection moulding cycle [55].
During each of these process stages, it is necessary to control the dominant process
parameters in order to produce acceptable moulded products [55]. The main
parameters that influence the process fall into four categories; barrel temperature,
nozzle temperature, mould temperature and screw rotation. These are the process
parameters that affect the products quality as shown in Fig. 2.15 [56].
41

Chapter 2: Literature Review
Barrel Temperature
Nozzle Temperature
Screw Rotation
M ould Temperature
Fig. 2.15: Primary injection moulding parameters [56].
2.9.3.1. Heating stage of the injection moulding process
During the heating stage, the plastic materials in the barrel is heated by electrical
band heaters and where applicable, friction arising from screw rotation. The most
important temperature is the actual melt temperature, the temperature where the
materials must be heated to before it is injected into the cavity. All materials have a
range of temperature at which can be efficiently processed and still maintain their
optimum mechanical properties. For amorphous materials, which actually melt, the
range is smaller [57], Most injection moulding machines achieve this melt
temperature by gradually heating the materials as it moves from the rear o f the barrel
towards the nozzle.
42
Chapter 2: Literature Review
2.9.3.2. Filing stage of the injection moulding process
During the filing stage, the molten materials are forced either by the plunger or screw
through the nozzle of the cylinder into the mould. The molten plastic is directed
through a runner system into the actual mould cavity. As the material enters the
cavity, a frozen layer develops upon contact with cooler mould walls [58]. During
filling, the materials in the central core continues to flow generating frictional heat
which is conducted across the frozen layer to the mould wall, Initially the conduction
of heat across the frozen layer is rapid as the layer is relatively thin. This conduction
allows more materials to solidify, increasing the frozen layer thickness. An
equilibrium condition is reached when the frictional heat is generated at the same rate
as it is dissipated across the frozen layer. These effects can be demonstrated
experimentally by variation of the injection rate between cycles. The pressure, under
which the materials are injected, is referred to as the injection pressure and is
determined by the viscosity of the materials and the flow rate required to fill the
mould. [54]
2.9.3.3. Packing stage of the injection moulding process
The packing stage comprises of two phases, pressurisation and compensation [58].
During the pressurisation phase, the plunger or screw continues to move forward,
forcing additional materials into the mould. This is possible because molten plastic is
compressible, and with the injection pressure it is possible to inject molten materials
into the mould. The applied pressure is called the holding pressure and is applied to a
cushion o f materials in the barrel that transfer to the mould by the connection nozzle
to solidify plastic products [59].
2.9.3.4. Cooling stage
During the cooling stage the materials just inside the frozen layer, which is subject to
the maximum shear stress, freezes. The materials in the centre o f the core solidify at
a slower rate and are subjects to lower shear stresses. The combined action allows the
materials to relax, typically, reduced orientation is observed towards the centre of the
cavity [60, 61]. Fig. 2.16 shows injection moulding cycle stage.
43

Chapter 2: Literature Review
Mould opening
- t . . . . .Ejcctcd prod ucts
C ycIc End
Fig. 2.16: Injection moulding cycle stage.
2.10. Review of some Previous Studies on Recycling Process of Mixed (PP)
Recently, mixing raw plastic materials with the recycled materials would improve the
product mechanical properties, which would contribute in clear environment [62-63].
The approaches o f mixed plastics materials were found to give better mechanical
properties [64]. Poor mechanical properties are most to achieve when recycling the
plastic material twice or more [65]. The percentage of raw material in the mixture
44

Chapter 2: Literature Review
with the recycled, and the injection moulding process parameters such as mould
temperature and barrel temperature, speed etc, are the main factors that would affect
the quality o f the final product [66-67]. The recycled materials have been correlated
with the number o f reprocessing steps and compared with those obtained by
reprocessing raw materials o f the same composition; the properties of the secondary
material decreased with the number of mould steps, and the additions of raw materials
to the recycled are responsible o f obtaining excellent mechanical properties, in
different plastic materials [68]. Fig. 2.17 shows recycled materials percentages for
various types o f plastic materials; thus it is apparent that PE is the most recycled
material nowadays and PP has a quit high percentage of recycled material as well
[69].
P E T27%
Fig. 2.17: Different materials that are usually recycled [8].
Martins and De Paoli [70] have presented the extrusion moulding for 13 processing.
They were using formulations containing raw PP (H201) with the recycled materials
polypropylene with an additions antioxidant. They evaluated the effect of processing
parameters on the mechanical properties. The temperature was ranging between 180
and 210°C with screw rotation 50 rpm. The results indicated that the addition of raw
material PP has improved the quality o f the recycled materials. Agrawal, et al. [71]
have investigated the effects recycling process on the mechanical properties by using
extrusion moulding. The samples were prepared by mixing the raw polypropylene PP
(H020SG) with recycled PP. The additional percentages o f raw PP were, 60:40
(recycled PP: raw PP), the melt temperature ranges between 100 to 230 °C. The
45

Chapter 2: Literature Review
results indicated that the mechanical properties have been improved after the addition
o f raw PP material.
Aurrekoetxea, et al. [72] have discussed the use o f recycling materials by using
injection moulding machine model (SM6100) Moutell. The recycled materials PP
were mixed with the raw PP plastic material. Scanning electron microscopy (SEM)
was used to study the fracture surfaces; the effects o f recycling on the fracture
behaviour of PP and change in morphology were studied. The injection parameters
used are melting temperature at 200°C and screw rotation 200 rpm. The results
indicated that the increase in the yield stress is due to the higher degree of
crystallinity of the recycled materials. Incamato, et al. [73] has studied the effects of
recycling process on the mechanical properties of PP. In this study the raw material
PP has been added with the following to recycle PP (V/R, 70/30 and V/R 50/50) the
relationship between process parameters and mechanical properties were
investigated. The moulding temperature ranges between 210 and 240°C and speed of
80 rpm were used. Mechanical Properties testing were carried out by using tensile
testing machine model (4301), with speed of 50 mm/min, Young modulus and yield
stress were measured. The results indicated the empirical correlation between
rheological properties and molecular structure parameters.
Tall, et. al [74] has developed a mixture of recycled PP with the raw martial PP, of
injection moulding process. The parameters were: temperature ranges between 200
and 220°C, mould temperature 30 °C and speed 75 rpm. Mechanical properties were
measured with an Instron machine model (5566). The mixture was a composite
material consisting of 20% of PP raw material, 20% talc and 60% recycled PP. The
results indicated that the mechanical properties were improved by adding 20% of raw
materials.
Another author Tsenoglou et al. [75] have described the effects of the temperature of
the second recycling on the mechanical properties o f PP plastic material. The
material was also analysed by using high performance liquid chromatography. The
temperature ranges between 230 and 280 °C. Using the second recycling PP material
reduced the final product quality. Espert, et al. [76] have studied the effect of
46

Chapter 2: Literature Review
cellulose fibres as reinforcements in recycling the PP plastic material. They mixed
the PP plastic material with 40 wt % o f cellulose at temperature ranges between 210
and 250°C with the gas flow of 80 ml /min. The results indicate that an improvement
in the mechanical properties o f PP could be obtained by the addition of cellulose
fibres. Tiganis, et al. [77] have studied the effects of recycling o f PP in several times.
They investigated the effects o f process parameters on the mechanical properties by
using injection moulding at temperature ranges between 120 and 130°C, the
desirable mechanical properties was achieved with no significant in the different
recycling time.
Martins and De Paoli [78] have investigated mixing of raw polypropylene PP-H201
with the recycled PP. They have prepared samples by using injection-molding
machine. RSM was used to optimise the mechanical properties o f PP, The mechanical
properties was achieved good product quality. Bonelli, et al. [79] have studied the
effect of recycled PP (H503) in compatible mixture raw polypropylene and high
density polyethylene (HDPE), by using extrusion moulding at temperature ranges
between 190 and 215°C and screw rotation of 100 rpm. A mixture o f 50/50, PP/HDPE
was mixed. The results confirm good mechanical properties were obtained by using
mixed materials. Phinyocheep, et al. [80] has discussed the mixed raw polypropylene
with rejects rubber o f (NR, SBR and BR). They investigated mechanical properties of
three materials by using injection machine type HMC. The process parameters were;
speed 70 rpm and temperature range between 190 and 220 °C. SEM was used to
explore the morphology of the additional materials (75/25, PP/rejects rubber). It was
found that impact strength was improved and the tensile strength was slightly
decreased. Ross and Evans [81] have investigated the mixed polypropylene raw PP
with addition o f fibres. Mould temperature ranges between 180 and 190 °C. The
results indicated that good mechanical properties were obtained with the fibbers
addition.
Ref [82] has studied the effects of recycling on the mechanical properties of
polyethylene terephthalate (PET). The raw material has been mixed with the recycled
PET and without modifier (PP-graft-MA) to characterize the mechanical properties
47

Chapter 2: Literature Review
o f the modified PET. The results indicated that the mechanical properties were
improved by adding the modifier.
Bertin and Robin [83] have investigated the effect o f mechanical properties on the
recycling o f a mixture of two plastic materials namely: high-density polyethylene
(LDPE) and Polypropylene (PP). The study was carried out by compounding the
usage o f single-screw or twin -screw extruder. Mixtures o f different raw materials
have been prepared to compare mechanical properties o f both raw and regenerated
materials. The results indicated that the mechanical properties o f mixed materials have
been improved. Blom, et al. [84] have studied the effect o f mixing raw PP with
recycled high density polyethylene material on the mechanical properties. The
investigation was carried out by using injection-moulding machine with different
process parameters such as temperature between 190 and 210 °C, injection pressure of
3.22 M Pa and mould temperature o f 40 °C. The results indicated that a percentage of
50% o f PP/HDPE would lead to good impact properties and poor tensile properties.
Dintcheva et al. [85] have investigated post-consumer film coming from green house,
polyethylene (PE) were characterized to evaluate the mechanical properties, the
experimental tests have been carried out in different recycling steps, by using
extortion molding. The results indicated that the mechanical properties decrease with
the number o f reprocessing steps and also at secondary materials. Kallel et al. [86]
have discussed the effects of mixing two plastic materials PE/PP on the mechanical
properties, by using injection-moulding machine. The process parameters were:
temperature ranges between 210 and 235 °C for the mixed PE/PS, also temperature
range between 190 to 210°C for the PE/PP and mould temperature was 30°C.
Scanning electron microscope (SEM) was used for the fracture surfaces o f mistrals.
Two mixtures of, PE/PS and PE/PP o f 80/20 and 40/60 were prepared respectively.
The result has indicated that the impact properties were increased for the mixed
materials. Another author, Kim et al. [87] have studied two material (Ethylene
Propylene Diene Monomer) EPDM and PP. PP was the commercial extortion grade of
SK chemical (R930Y) and Korea Petrochemical (1088). The waste EPDM powder
was obtained by the vulcanized EPDM, the compounds were mixed at a percentage of
48

Chapter 2: Literature Review
70/30 and 75/25. The process parameters were; temperature ranges between 200 and
235 °C and extrusion speed of 50, 70, 100, and 150 rpm. The results demonstrate that
the best mechanical strength was obtained at a percentage o f 30 wt % PP at speed of
100 rpm. Rachtanapun, et al. [88] has studied the microcellular o f HDPE/
polypropylene (H704-04) mixtures. They investigated the effects o f process
parameters on the mechanical properties by using injection moulding, at temperature
ranges between 135 and 175 °C and speed o f 100 rpm. Mixtures of HDPE/PP at
various weight ratios (70:30, 50:50 and 30: 70 w/w) were prepared. Data were
analysed by using statically (ANOVA) test with SAS software. The results show that
the mixed materials HDPE/PP with weight 50:50 and 30:70 had improved the
properties o f the final product. Chang-sik Ha, et al. [89] have studied the effect of
combining cellulose on the properties of raw and recycled materials o f HDE, PP, PS
and PVC (7/1/ l / l ) , mixture was investigated in table kneader internal mixture,
temperature was 180 °C and speed of 60 rpm. Tensile strength was measured by using
tensile test machine model (HM25) with a speed of 10 mm/min. SEM was examine
the fractured surfaces of the commingled mixed. The results indicate that the tensile
strength was increased with the increasing the cellulose content. Santos, et al. [90]
have investigated the product quality of a mixed plastic materials o f PP with the high-
density polyethylene (HDPE) which was processed by using extrusion moulding. It
was found that a temperature range between 150 and 250 °C. Mould produces
products with good qualities.
Ragosta, et al. [31] have studied the mixed recycle materials, ethylene-propylene
copolymer with the raw PP plastic material. The results show that the mechanical
properties such as elongation at break and impact toughness were improved by
addition raw PP. Mehrabzadeh and Faramand [92] have studied the polyethylene’s
(PE) and PP. The samples were prepared by mixing them in (a Haake Buchler
Rheomix 750), internal and then a compression-moulding machine was used. The
hydrolytic was treated. SEM was used to study fracture surfaces of the plastic
materials. The results indicate that the mechanical property such as tensile strength of
the PP/PE was improved after hydrolytic.
Arroyo and Bell [93] have studied the effect of fibres on the mechanical properties of
PP and ethylene propylene- diene (EPDM), 50/50 in PP/EPDM. An addition o f fiber
49
Chapter 2: Literature Review
content around 10% was mixed, the moulding temperature ranges between 210 and
230 °C and speed of 40 rpm. Response surface methodology (RSM) was used in this
study to predict and analysis effect o f reinforcing fibres on properties. Tensile test
was carried out using testing machine model (T-4301), and speed 50 mm/min.
Fracture surfaces o f several composites were observed on model a JEOL T-330A
scanning electron microscope (SEM) to study the composite and interface
morphology. The results indicate that the mechanical properties have increased with
the addition of 10% fibres.
Santos and Pezzin [94] have investigated mixing of recycled polyethylene (PET) and
raw PP with percentages of 3, 5 and 7 %(w/w) of PET fibres by using injection
process moulding temperature ranges between 106 and 160 °C and screw rotation of
11 rpm. Tensile test was carried out using testing machine model (ISO -527) at speed
of 50 mm/min, the tensile properties were determined using five samples for each
composition. Impact strength and surface hardness were also implemented. SEM was
used to examine the fibre dispersion. The results indicated that the addition of PET in
PP does not change significantly the PP tensile strength but the impact properties of
the PP have been significant increased. Kukaleva, et al. [95] have studied a mixture
o f raw PP with 77-wt% of recycle high-density polyethylene (HDPE). Injection
moulding process was used to produce the samples. Mechanical properties such as,
Young modulus, yield stress and elongations at break were measured by using an
Instron testing machine model (4467). The fracture surfaces were conducted using
SEM model JEOL JSM (840A). The results demonstrate that good mechanical
properties have been obtained by using the above mixture. Albano and Sanchez [96]
have studied the properties of mixing raw PP material and recycled high-density
polyethylene (HDPE). The addition o f 5% to 20% o f PP was used to improve the
quality of the finished products. Mechanical properties after compression moulding
were measured by using a tensile testing machine model (1431-6), speed of 25
mm/min, and impact strength measurements were made. The results indicate that an
addition of 5% PP improved the mechanical properties o f this material.
Ismail and Suryadiansyah [97] have investigated the effects of recycled rubber (RR)
and raw PP. The mechanical properties and morphological of PP was examined. An
50
Chapter 2: Literature Review
injection temperature o f 190 °C and speed of 50 rpm were used. Tensile test were
carried out to examine the properties using tensile testing machine with a speed o f 50
m/min. SEM was carried out to gauge the tensile fracture surface o f PP/RR mixed
materials. The results indicated that the tensile strength and Young modulus o f the
mixed material was decreased with increasing rubber content in the mixed material.
Kim et al. [98] have investigated the mixture of recycled ethylene propylene diene-
monomer (EPDM) powder with raw PP plastic material. Samples were prepared by
using injection-moulding machine at temperature ranges from 200 and 235 °C and
screw rotation of 100 rpm. Samples were prepared by mixing EPDM and PP with
ratios of 25/75 and 30/70. The mechanical testing measurement was carried out by
tensile testing machine with speed o f 50 mm/min. SEM was used to study the
morphology of the mixed material. The results indicate that the mechanical
properties o f mixtures were improved by adding raw PP material. Vaccaro, et al. [99]
have developed a model for the predictions of yield strength o f plastic PE/PP. The
moulding temperature ranges between 190 and 200 °C and speed o f 50rpm were
used. Three different sets o f mixture were prepared with addition o f polyolefm’s.
Mechanical properties were measured by using tensile machine with speed of 10
mm/min. The results indicated that the mechanical properties are in good agreement
with the predicted model. Tall, et al. [100] have reported an experimental design
using response surface methodology to predict the mechanical properties o f the
mixed polyolefin’s with recycled materials produced by using injection. The results
indicate that the developed model was accurate.
Blom et al. [101] have studied the effects mechanical property of mixed two
material PP/HDPE. Injection moulding were using various process parameters to
produce samples with different ranges, the barrel temperature ranged between 190
and 210°C, mould temperature was 40°C and injection pressure was 3.22 Mpa. The
results indicated that the 50% mixed were achieved poor quality.
Cheng-Hsien and Wan-Jung [102] have investigated the effects o f various process
parameters on the characteristics of the weld line of an injection mould. Two
materials PP (PRO-FAX6331-8) and HDPE (L H606) were used. The Taguchi
method was applied to study the individual contribution o f process parameters on the
51
Chapter 2: Literature Review
tensile strength. Four process parameters that can be independently controlled such as
temperature, mould temperature, speed. The results indicate that the process
parameters have slight effect on the tensile strength of the HDPE, microstructure of
weld line is clearly observed. Wyser et al. [103] have studied the recycling of PP and
silicon oxide-coated polyethylene terephthalate (PET). No significant improvement in
the tensile behaviour of the mixed materials. Susan and selke [104] have investigated
the effects of mechanical properties for mixtuer two material HDPE/PP. Mechanical
properties were carried out using testing impact strength o f mixed material, the
samples has produced with various ranges of process parameters of injection
moulding machine. The temperature ranges were between 135 and 175 °C and speed
was lOOrpm, the mixture was also prepared three weight ratios 70:30, 50:50 and
30:70. SAS software were employed to analyse the effects o f mixing material. The
results indicate that improve mechanical properties have been achieved at mixture
range 50:50 and 30:70.
Scaffaro et al. [105] have studied the mixing o f raw and recycled polyethylene (PE).
In this study, they optimized the processing parameters such as temperature,
composition, mixing speed and mixing procedure. Injection mould was used to
produce the samples. The temperature range was between 170 and 210°C, the
mixture was prepared with two percentages: 75/25 and 50/50. The results indicate
that good mechanical properties have been achieved, also the process parameters has
small effects on the products quality o f the mixed material.
Ceni Jacob, et al. [106] has mixed the virgin ethylene propylene diene monomer
(EPDM) and recycled PP with percentages o f 70/30 EPDM/PP. SEM was used to
examine the fractured surface. The results indicate that the mechanical properties of
the mixture were superior. Chang-Sik, et al. [107] has investigated the effect of
mixing three plastic materials on the mechanical properties. The three materials are:
high-density polyethylene (HDPE), (PP) and polyvinyl chloride (PVC) and,
HDPE/PP/PVC the mixing percentage is 8/1/1. Temperature o f 180 °C and speed of
60 rpm were used. The results show that the mechanical properties were not
significantly increased. Santana and Manrich [108] have investigated the effects of
mixing two raw plastic material namely: (polystyrene-b-ethylen-co-butylene-b-
52

Chapter 2: Literature Review
stryrene)(SEBS) with two recycled materials PP (H-603,opp) and high impact
polystyrene (HIPS). The samples were fractured in liquid nitrogen and covered with
gold before being examined with the microscope. The results indicate that good
mechanical properties were achieved. Marco et al. [109] have studied a mixture of
raw PP and recycled HDPE. The results indicate poor tensile properties and impact
strength. Hwang et al. [110] have studied the recycling of a mixture o f two materials
PP and polystyrene. The results demonstrate that a product with good quality can be
produced with these recycled materials. Santos et al. [ I l l ] have studied the mixture
of raw PP with the recycled HDPE. The temperature was ranged between 150 and
180 °C and high 210 and 250 °C. The results indicate that after mixing the materials
the product quality has been improved.
Finally, the present research considers the review of some works done with the
estimation of recycling operation cost. Leu and Lin [112] have studied the cost-
benefit analysis o f the resource material recovery centre and the implications of this
pilot program on the municipal solid waste disposal. It was concluded that cost-
benefit analysis o f the operation for the period of high raw material prices the
recycling center can operate in the black by resale of the sorted recyclable materials
alone.
Palmer and Walls [113] have studied three prices o f recycled materials base policies
for solid waste reduction such as; deposit refunds, advance disposal fees and
recycling subsidies. The results indicate that the deposit refund is the least costly of
the policies and that 7.5% reduction o f the wastes has been gained. Rebeiz and Craft
[114] have investigated the cost of recycled process of soft drink plastic PET which
being collected from land filling, incineration, and recycling wastes to be concerted
into useful products. Establishment o f markets for the cost-effective use o f recycled
products are developed. It has been shown that the development of new construction
materials using recycled plastics is important to both the construction and the plastics
recycling. Hallberg et al. [115] have investigated the external cost of recycled
materials developed by the commission of the European Union. The results indicate
that a high degree of recycling is preferable, at least when considering external costs,
53
Chapter 2: Literature Review
because external costs of manufacturing o f new materials and disposal costs are
higher.
The theoretical cost saving arising from the recycling o f raw materials found in
municipal solid waste has been investigated by Lea [116]. The result indicated that
the plastic materials have high inherent energy content while the energy cost saving
from recycling is negligible, especially when sorting costs are considered.
Diamadopoulos, et al. [117] have studied the municipal solid waste recycling, the
model they suggested have considered all costs in present values. Namely: recycling
of products, disposal of solid wastes economic benefits include revenues coming
from the selling of the recycled goods, and those originating from extending the life
o f the landfill. It was shown that recycling brings about a significant reduction in the
mean annual cost of solid waste management by 35%, as well as an increase in the
life o f the landfill by 6 years.
2.11. Chapter Summary
This chapter provided a comprehensive and up-to-date literature review on the
subject o f recycling process with a brief description of the injection mould machine
as applied to polymers, and its accompanying definitions beginning from recycled of
plastic materials to conduct reprocessing mixed polypropylene. This is followed by a
discussion on the Design of Experimental requirement to optimise inputs process
parameters in the process of injection moulding HM7; briefly discussed several tools
and techniques, which have been used in the study. In line with the purposes of
literature review, this chapter presented a review of existing literature in developing
the theoretical understanding on the following topics with the specific purposes, in
accordance to the aims of this research.
Finally this chapter compares the application o f recycling process with some
common thermoplastic materials, and also review what has been done within
statistical design methods, FD. Following the preliminary research effort and
literature review, the next phase of the research work will be the selection o f research
methodology for collecting information, which will be addressed in chapter three.
54

CHAPTER 3
DESIGNING OF SURVEY AND EXPERIMENTALPROCEDURE

Chapter 3: Design of Survey and Experimental Procedure
3. Research Methodology
3.1. Introduction
The preliminary research effort and literature review assist in determining the areas
that need to be addressed in designing of the implementation framework. Following
this, the most important phase of the research work comes follows; that is, the
selection of research methodology for collecting information that will illuminate the
topic. Therefore, it is essential to gain a good understanding of the issues
surrounding the research methodology prior to initiating the fieldwork. The purpose
o f this chapter is to provide an overview of research methodologies and a
justification for the selection of the methodologies implemented in this study to
address the objectives o f the research. The chapter starts with an overview o f
research in general and a description of research philosophies; since it is an integral
part o f any research work. This follows by making explicit descriptions o f various
terminologies relating to the research methodology that will be used frequently
throughout the thesis. The chapter then presents the research methodology chosen
(that is, a questionnaire survey research, in elaborating the research instrument and
process, as well as the statistical analytical tools and tests used in this study). A
survey is an important means to identify and understand people’s attitudes,
behaviours, and characteristics and to assess any activities in any field. On daily
basis, the results o f surveys are used by policy-makers, the media, and market
researchers to describe the population, to make critical decisions and to analyse how
various groups feel about a range o f topics [121]. A survey is a systematic method
used to collect data from more than one source in order to answer one or more
questions typically arranged on a form called a questionnaire. This survey is the
foundation for research on recycling of plastic materials. It includes a wide spectrum
of recycling practices, as well as measures and indicators used in the industry [64],
The survey study combines topics discussing the state of recycling and analysis of
processes successfully implemented in industrial practice [122].
55
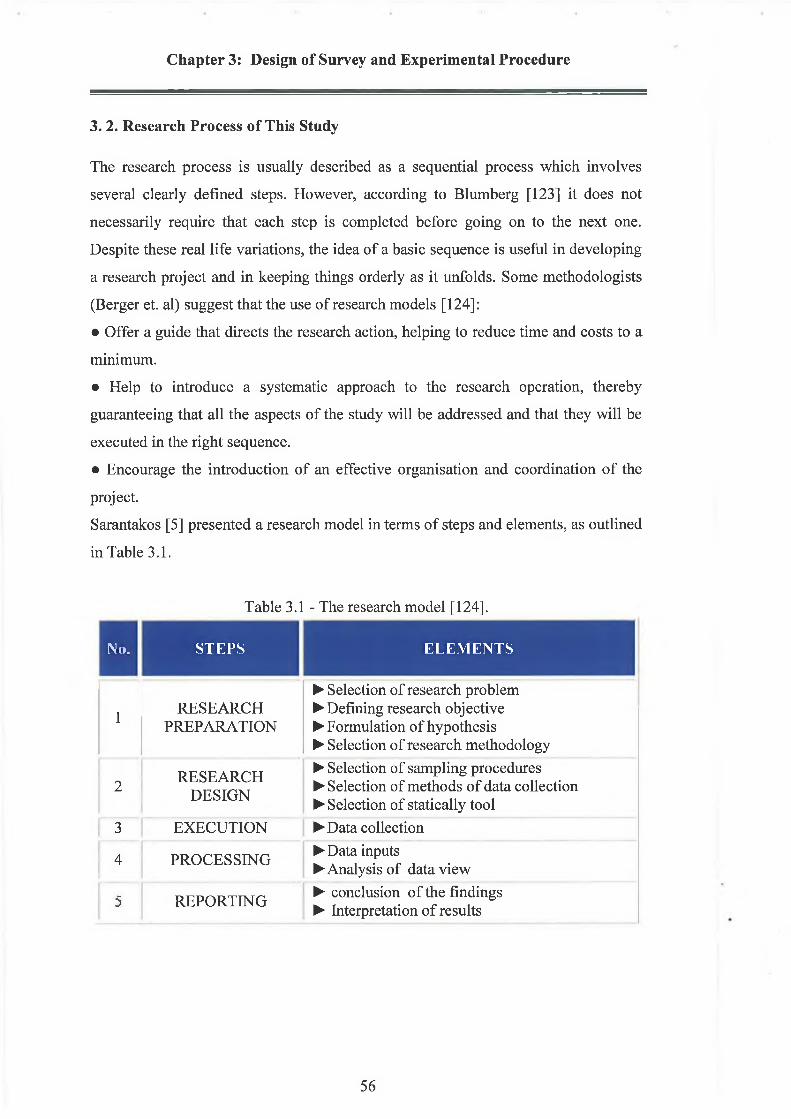
Chapter 3: Design of Survey and Experimental Procedure
3. 2. Research Process of This Study
The research process is usually described as a sequential process which involves
several clearly defined steps. However, according to Blumberg [123] it does not
necessarily require that each step is completed before going on to the next one.
Despite these real life variations, the idea o f a basic sequence is useful in developing
a research project and in keeping things orderly as it unfolds. Some methodologists
(Berger et. al) suggest that the use of research models [124]:
• Offer a guide that directs the research action, helping to reduce time and costs to a
minimum.
• Help to introduce a systematic approach to the research operation, thereby
guaranteeing that all the aspects o f the study will be addressed and that they will be
executed in the right sequence.
• Encourage the introduction of an effective organisation and coordination o f the
project.
Sarantakos [5] presented a research model in terms o f steps and elements, as outlined
in Table 3.1.
Table 3.1 - The research model [124].
No. STEPS ELEM ENTS
1 RESEARCHPREPARATION
► Selection of research problem► Defining research objective► Formulation o f hypothesis► Selection of research methodology
2 RESEARCHDESIGN
► Selection of sampling procedures► Selection of methods o f data collection► Selection of statically tool
3 EXECUTION ►Data collection
4 PROCESSING ► Data inputs ►Analysis of data view
5 REPORTING ► conclusion o f the findings► Interpretation o f results
56

Chapter 3: Design of Survey and Experimental Procedure
Another author, Punch [125] put forward another model o f research, which shows
research questions with hypothesis as shown in Fig.3.1. The research questions are
the straightforward ones o f iw ha f (what question is the research trying to answer?
what is it trying to find out?) and ‘how’ (how will the research answer these
questions?). This model o f research helps to organise the planning, execution and
writing up of the research.
What data are required to test
hypotheses?Theory'
Literature
I 1Research ► Problem Questions —^ Hypotheses
area a
Design Data — ► Data — Testcollection analyst hypotheses
IContext
Pre-empirical Empirical ^stage stage
Fig.3.1: The research model - Punch [125].
In adopting the two research models as described in Table 3.1 and Fig.3.1, Fig.3.2
illustrates the research journey o f this study. This provides a structured guidance to
understand the link between each process and tasks at the various stages of the
research work. The details of research philosophies, research methodology and
research design employed in this study are discussed in the following section.
57

Chapter 3: Design of Survey and Experimental Procedure
58

Chapter 3: Design of Survey and Experimental Procedure
3.3. Research Methodology
In the literature, it is found that there exists, differences between authors description
in the definition o f a research methodology. Various researchers offer different
definitions according to their own personal views. According to Sarantakos [124], a
research methodology seems to be defined in at least two ways. In one form,
methodology is identical to a research model employed by a researcher in a
particular project. Another definition relates the nature o f methodology to a
theoretical and more abstract context.
Here, a methodology is supposed to offer research principles related closely to a
distinct paradigm translated clearly and accurately. In terms o f prominent operational
features o f a research methodology, Easterby-Smith et al [126] described that a
research methodology will explain and justify the particular research strategy and
methods used in the study.
Flynn et al [127] outlined a methodology and recommended the following steps be followed:
• Establish the theoretical foundation.
• Select a research design.
• Select and implement a data collection method.
• Analyse data and present work.
The process of the theoretical foundation establishment is discussed in the following
section. Accordingly, the selection o f the research methodology and description of
the data collection method are described. The results and data analysis may be
referred to in chapter four of this thesis.
59

Chapter 3: Design of Survey and Experimental Procedure
3.3.1. Theory verification and theory building
Flynn et al [127] believed that there are two ways in which the theoretical foundation
can be established, (such as, by ‘theory verification’ or ‘theory building’). According
to Wolcott [128], this is the distinction between “theory-first” and “theory-after”. In
theory-first research, it starts with a theory, deduces hypotheses from it, and designs
a study to test these hypotheses. This is theory verification. On the other hand,
theory-after research does not start with a theory. Instead, the aim is to end up with a
theory, developed systematically from the data that has been collected. This is theory
building (or called theory generation).A similar explanation was given by Flynn et al
[8] in differentiating these two research purposes.
Theory verification is the approach used where the focus is on testing the hypotheses
rather than analysing its origin. In using this approach, the hypotheses are
constructed before the research starts and then tested when the data is obtained.
On the other hand, theory-building studies utilise information in different ways and
the starting point is based on propositions, assumptions or problems rather than
definite hypotheses. Information is collected in order to define the propositions, and
thus they are grounded in data even before the actual theory building begins [125].
This study utilises the theory verification approach, as the research hypotheses were
set down following a comprehensive literature review. The information collected
during this research period was used to clearly define the research hypotheses and
address the issues raised from the research objectives in section 1.6 o f chapter one,
in order to answer the research questions. The aim here is to substantial useful
information and guidance for the recycle processing.
Historically, there has been a correlation between the purpose o f the research
(whether it is aimed at theory verification or theory building) and the approach used
in the research (qualitative or quantitative). Quantitative research has typically been
directed primarily at theory verification, while qualitative research has typically been
more concerned with theory building [125]. While this correlation is historically
valid, it is by no means perfect, and there is no necessary connection between
60

Chapter 3: Design of Survey and Experimental Procedure
purpose and approach, as pointed out by various authors for example, Hammersley
[129] and Brewer and Hunter [130].
3.3.2. Exploratory Versus Explanatory
Before designing the research, a decision has to be made about the overall strategy
and what the most useful data collection methods are. Marshall and Rossman [131]
suggest that there are four different purposes for undertaking a study: (1)
exploratory, (2) explanatory, (3) descriptive and (4) predictive all of which are
employed here. Each o f these asks different kinds o f research questions, employs
different strategies even though there is often considerable overlap between them.
This study is both exploratory and explanatory in nature as it is difficult to
completely separate the two methods. Ryan, et. al [132]. Describes the distinction
between exploration and explanation as rather ambiguous. On the explanatory side
the research will attempt to explain the reasons for the practice being introduced and
hence to draw conclusions regarding the link between the introductions of recycling
processes in the different stages of the firms examined. The descriptive element of
the research is also important as description is the foundation of knowledge
according to, Preece [133]. As in highlighted this thesis, the descriptive and
predictive, experimental work can then be used to construct an explanation or be
fitted into an explanatory framework [134], Identifying relationships between
different variables will also achieve a certain level of prediction in which stage to
obtain a good product quality.
Descriptive and explanatory elements represent two different levels of
understanding. The distinction between them is particularly relevant to the purpose
of a piece of research. Description is concerned with making complicated things
understandable. Explanation, alternatively involves finding the reasons for things,
events and situations, showing why and how.
A good way to make contrast is to say that description focuses on what is the case,
whereas explanation focuses on why and how something is the case [125]. The
descriptive element o f the research is also important since “description is the
61

Chapter 3: Design of Survey and Experimental Procedure
foundation o f knowledge” [133]. As depicted in this thesis, the descriptive work can
then be used to construct an explanation or be fitted into an explanatory work [134].
Identifying the relationships or correlation between different variables will also
allow a certain level o f prediction to take place, although care will be taken in this
study so as not “to assume that all observed relationships are casual” [132].
Pinsonneault and Kraemer [135] differentiated between descriptive and explanatory
in terms of purpose for a survey research:
i) The purpose o f survey research in description is used to find out what situations,
events, attitudes or opinion are occurring in a population. It aims to describe a
distribution or to make comparisons between distributions.
ii) The purpose o f survey research in explanation is used to test theory and casual
relations. It aims to ask about the relationships between variables.
This study use a combination of descriptive and explanatory approach in nature
where the research will attempt to examine the aspect of recycle and the linkage
between the recycle process and the product quality in each stage employee
involvement in the companies examined.
3.3.3. Quantities versus Qualitative
Combining a qualitative and quantitative approach facilitates the acquisition of both
experimental and survey data. The results of the qualitative and quantitative
investigation allow the research propositions to be addressed in a rich and rigorous
way, and serve to guide clearly the final conclusions.
This combination method is one based upon wide agreement. Researchers such as
Bryman [136] Burgess [137] and Denzin [138] suggest that the best way to carry out
research in areas where people are involved is to use a combination of qualitative ad
quantitative techniques. Simon et al [139] assert that the use of both quantitative and
qualitative techniques help to obtain a clearer picture o f reality making sense, and
answering many o f the questions raised by the critics o f traditional empirical
research. Also believes in the strength of using more than one technical in a study
and states that the various strategies are not mutually exclusive. The previous
62

Chapter 3: Design of Survey and Experimental Procedure
arguments have helped contribute to the decision to combine qualitative and
quantitative methods in this study. A use of either quantitative technique alone in the
thesis would not have been substantial due to the nature o f the research questions
and propositions. Relying solely on laboratory experimental work would have
resulted in a lack of survey information on why and how quality changes in quality
products at different recycled stages and the selling o f recycled products measures
were made.
3.4. Research design
There are many definitions of research design offered by various researchers or
authors. Kerlinger [140] defined research design as a plan and structure of
investigation so conceived as to obtain answers to research questions. The plan is the
overall scheme or program of the research. It includes an outline of what the
investigator will do from writing hypotheses and their operational implications to the
final analysis of data. A structure is the framework, organisation, or configuration of
the relations among variables o f a study. A research design expresses both the
structure o f the research problem and the plan o f investigation used to obtain
empirical evidence on relations o f the problem. According to Blumberg [21], the
essential element of research design provides a guideline to the kind of answer the
study is looking for, methods to be applied to find them, techniques to be used to
gather data, kind of sampling to be used and how will time and cost constraints be
dealt with [21].
3.4.1. Observation
An observation consists of the systematic gathering, recording and analysis of data in
situations where the method is more appropriate (usually in terms of objectivity and
reliability) and able to yield concrete results. The major advantage and disadvantage
o f observation as a research method is that it is very largely a ‘real time’ activity
[141]. While the participant observers role offers a degree of insight into a situation
unlikely to be found in any other method (particularly when the researcher is also
counted as an employee of the company under investigation), the role can be both
63
Chapter 3: Design of Survey and Experimental Procedure
physically and psychologically exhausting, with issues of ethics and confidentiality
to consider as well. At the other end o f the scale the pure observer is rather detached
from the situation under study, and often looked upon with suspicion by those being
observed. Therefore, the researcher is unlikely to understand truly what is happening
in the situation and why things happen. In addition, any form o f observation entails
(quite difficult to attain) high level of cooperation by many members of an
organisation and the organisation as a whole, (for political as well as practical
reasons) [141].
3.4.2. Experimentation
An experiment is usually a process o f controlling all the variables so that by varying
one while holding the others constant, the effect of the input variable upon the output
variable can be determined [141]. It follows that a basic requirement for the conduct
o f an experiment is that one must be able to specify all the relevant variables.
Experiments are usually undertaken to determine if there is a causal relationship
between the variables under investigation.
3.4.3. Survey research
Baker [141] describes a survey research as a systematic gathering of information
from a sample of respondents for the purpose of understanding and/or predicting
some aspects o f the behaviour o f the population of interest. Consideration of these
definitions indicates that surveys are concerned with:
• Fact-finding.
• Asking questions.
• Persons representative o f the population of interest.
• To determine attitudes and opinions.
• To help understand and predict behaviour.
Pinsonneault and Kraemer [135] defined survey research as a quantitative method,
requiring standardised information from and or about the subject being studied. It
has three distinct characteristics. First, the purpose of the survey is to produce
64

Chapter 3: Design of Survey and Experimental Procedure
quantitative descriptions of some aspects o f studied population. Second, the main
way o f collecting information is by asking people structured and predefined
questions. Third, information is generally collected about a fraction o f the study
population, called a sample, but it is collected in such a way as to be able to
generalise the findings to the population. Hart [142] states that the survey research is
the most usual form of primary research undertaken and attributes its popularity to
the following factors:
i) Survey research provides the researcher with the means o f gathering
qualitative and quantitative data required to meet such objectives.
ii) One o f the greatest advantages o f the research is its scope; a great deal of
information can be collected from a large population, economically.
iii) Survey research confirms to the specification of scientific research; it is
logical, deterministic, general and specific.
Alreck and Settle [143] considered that the main advantages o f survey research are
as follow; comprehensive, customised, versatile, flexible and efficient.
Comprehensive means that the method is appropriate to almost all type o f research,
where as the other four advantages are closely interrelated and boil down to the fact
that one can design surveys to suit all kinds o f problems and budgets.
3.4.4. Data collection methods
The choice o f data collection method, such as postal questionnaire, email
questionnaire, telephone interview and face to face interview, is significant because
it also affects the quality and cost o f data collected [135]. The major methods
associated with qualitative data collection are interviews, observation and these
methods was using also in this study.
Diary methods, while the principal methods associated with quantitative data
collection are postal questionnaire and online (web page-based) questionnaire
surveys. Each method has a range o f options, primarily linked to the objectives of
the research, and each has its strengths and weaknesses. Table 3.2 summarises the
main range of the major methods [144].
65

Chapter 3: Design of Survey and Experimental Procedure
Table 3.2 - Main ranges for qualitative and quantitative data collection methods [144].
MethodsMain Range
Face-to-faceinterviews
Highly formalised and free-ranging conversation.
Observation Observation alone, participant observation (Whether implicit or explicit).
DiarySimple journal/record
o f events, personal journal recording perceptions, feelings, reflecting, insights etc.
Postal questionnaire Factual and closed (e.g. yes/no).
Web page-based survey Factual ,close-end.
Telephone survey Spontaneous, scheduled appointment.Survey (both
interview and questionnaire)
Stratified sample, random sample or selected.
Moser and Kalton [145] described five methods o f data collection as follows:
documentary sources, observation survey, postal questionnaire survey, interviewing,
and combinations of the above. According to Moser and Kalton [145] and Fowler
[146], the choice of collection methods depends on the research topic, the sample
frame, characteristics of the sample and resources. It is clearly one of the most
important decisions in this study as it has implications for the rate o f response, the
survey instrument and the survey cost.
The survey research using postal and online questionnaire approach of this thesis is
presented, as shown in Fig.3.3.
66

Chapter 3: Design of Survey and Experimental Procedure
<SVRVE¥ RESE.m H
DESIGNING SVRI'EY❖ Objective; and resources❖ Sampling design: coverage
area and participants❖ Questionnaire design
(ill PROCESSING DATA(USING SPSS VER 11.0)
> Establish databasel: Data earn’r: Data analysisc Generate report and documentation
T
RESULTS AND DISCUSSION
Fig.3.3: Survey research using postal and online questionnaire approach.
67

Chapter 3: Design of Survey and Experimental Procedure
3.5. Designing the Survey Instrument
The survey questionnaire in this study was developed based on previous relevant
empirical studies found in literature. Where possible, the study would make use of
frequently used and tested measures and indicators as well as questions. These steps
are necessary to address the issue of reliability and validity raised [146]. The
questionnaire was destined to capture information about the recycle practices and the
implementation level o f the recycling process in plastic industry. The questions have
been divided in to three sections as would be described below in the questionnaire
content:
• Company profile.
• Recycling o f plastic materials.
• Marketing and sale o f recycled products.
This study concerns plastic materials arising as a result of scrap and runners. Also
the survey questionnaire involves some traditional thermoplastic materials, such as
PP, PS, PVC, etc and some of the designs key questions have been used in the three
optimum recycle stage, first recycle, second recycle, and third recycle. Some survey-
designed questions were related to some variables such as “Increased, Decreased, No
Change“, communication techniques questions have been used for variable questions
to obtain new information, which would be optimal for, the plastic industry.
3.5.1. Survey Objectives
A survey is a systematic method used to collect data from more than one source to
answer one or more questions typically arranged on same form of questionnaire
[146]. The survey is the heart of this study; to decide which recycled stage is the
most efficient in production of top quality plastic. Recycling of plastic materials is
widely used and processes are currently in place, to gather information from the
plastic industry. Performance details from traditional thermoplastic materials have
been used to prepare the required questionnaire on the recycling process.
Comprehensive data has been collected from the plastic industry for analyses by
Statistical Package for the Social Sciences (SPSS) software. This study used two
68

Chapter 3: Design of Survey and Experimental Procedure
techniques to obtain good responses. The first postal survey was carried out in the
Republic of Ireland and United Kingdom. The secondly survey was conducted
online. This study attempts to analyse obtained by the data survey from the plastic
companies. The survey objectives are as follows:
■ To determine the percentages o f rejects from thermoplastic for each different
plastic materials.
■ To determine the percentages o f recycling materials which have been used.
■ To determine which process inputs increase or decrease the quality of
recycling products.
■ To determine which recycling stage has indicated increased or decreased
quality o f the recycled product.
■ To determine what percentages are affected by the sale of recycled products.
3.5.2. Coverage of Survey
The target coverage, for this survey is the plastic manufacturing industry sectors.
It is worth noting that many companies are involved in activities appropriate to two
or more industrial sectors. According to custom and practice using the Kompass
system a company is classified according to the principal activity, for selected plastic
companies from the Republic of Ireland and United Kingdom, under the following
headings;
• Products and service group: Ireland and UK Kompass directory.
• Total number o f companies: 200 companies.
• Description: Kompass database to selecte Ireland and UK companies
independently. The Kompass system is a marketplace for business and has served
European business and industry for some fifty years. Its usefulness has caused it to
grow continuously from its origin in Switzerland to its present coverage of more than
sixty countries in all continents [147] and [148].
• Nature of Business: Manufacturing o f plastic.
• Number o f employees [21-50; 51-100; 101-250; 251-500; 501 upward].
69

Chapter 3: Design of Survey and Experimental Procedure
• Mould equipment: injection moulding, extrusion moulding and blow
moulding.
3.5.3. Limitation of postal questionnaire survey method
Disadvantages o f this method of information gathering include the low response rate
and lack o f interaction between researcher and respondents [145]. Since a
questionnaire survey should be viewed, as in this case, as an important instrument of
research and a tool for accurate data collection, an effective questionnaire has
therefore to be carefully designed, to eliminate as far as possible the disadvantages
involved, and to elicit a positive response from the respondents.
According to Walker [30] researcher should be clear about the reasons why each
question in a questionnaire is asked in justifying: i) the purpose o f asking it; ii) its
format; and iii) the manner in which data gathered will be analysed. Whitman [121]
and Czaja and Blair [150] identified several important factors and procedures any
questionnaire design should take into consideration when designing questionnaires,
which are as follows:
- Question is clear and unambiguous,
- Wording o f questions.
- Formatting the questionnaire.
- Length of the questionnaire.
These important factors are also cited as by Sudman [151] and Fink [152], An
inexperienced researcher would regard this as the easiest part of the survey design
[152]. The research employed in this study involved designing a postal survey
questionnaire and web-based survey and mailing them to the manufacturing
companies in the plastics industry. As a general rule, experts recommend asking
continuously “why am I asking this question” for every question and to be able to
tie-in with the objectives of the survey. Apart from the above, the guidelines
proposed by Sudman [151] and Fink [152].
3.5.4. Steps in questionnaire construction
70

Chapter 3: Design of Survey and Experimental Procedure
Questionnaires are constructed in a very sophisticated and systematic way. The
process o f construction goes through a number of interrelated steps, and offers the
basis for the research stage to follow. According to Sarantakos [23] the following are
commonly mentioned steps of questionnaire construction:
Step 1: Preparation
In the first place, the researcher decides on the most suitable type of questionnaire
and determines the way it will be administered. As well, a search of relevant
questionnaires that might have already been developed by other investigators is
undertaken. If suitable questionnaires are founds they can either be adopted for the
study or used as guides in the construction of a new questionnaire.
Step 2: Constructing the first draft
The research formulates a number o f questions, usually a few more than necessary,
which directly relates to aspects o f the research topic.
Step 3: Self-critique
These questions are tested for relevancy, clarity and simplicity, as well as for
complying with the basic rules o f questionnaire construction.
Step 4: External scrutiny
The first draft is then given to experts or to persons with practical expertise in the
area of investigation, for scrutiny and suggestion. The critique offered by the experts
will be considered and eventual changes are implemented.
Step 5: Pilot test
In most cases, a pilot study is undertaken to check the suitability of the
questionnaire. A small sample is selected for this purpose and the respondents
requested to respond to the whole o f the questionnaire. The results are then analysed
and interpreted.
Step 6 : Revision
71

Chapter 3: Design of Survey and Experimental Procedure
The pilot test usually results in some minor or major changes. If the changes are
minor, the researcher will proceed to step 3.8.2.
Step 7: Formulation o f final draft
In this final draft, apart from implementing the suggestion derived from the pilot test,
the researcher works on editing the text, checking for spelling mistakes, instructions,
layout, space for response, pre-coding and general presentation o f the questionnaire
to Sudman [151]. Apart from the problem of response error that has a bearing on the
reliability and validity of the survey and consequently the research study, the
problem of low response rate has always been a major cause o f concern to any
researcher. In general, it is believed that the factors that contributed to the relatively
low response in this postal survey questionnaire are:
i) The length o f the questionnaire, which contained a list o f specific and many
closed-form questions.
ii) The time pressures on the managers (that is, a lack o f available time)
iii) A lack of knowledge regarding the questions being asked.
iv) Fearing that handing over such information may negatively impact on
his/her company.
These reasons are similar to those often cited in literature for similar studies [153],
[154], [155] and [156]. According to Moser and Kalton [145], it is not the loss in
sample numbers that is serious, but the likelihood that the non-respondents differ
significantly from the respondents. There are various types o f non-response and
some will be mentioned below:
i) Companies outside the population.
ii) Companies refusing to co-operate.
iii) Change of address or wrong addresses.
72

Chapter 3: Design of Survey and Experimental Procedure
3.5.5. Questionnaire content
Basically, the questionnaire is a set o f questions used to capture the experiences and
the practices of the organisation with respect to its recycled thermoplastics. A total
o f twenty-three questions, which has been classified into three sections:
a) Section A: General information
This section contains five questions (Questions A1 to A5). This covers the
information concerning company characteristics in terms of type o f industry,
ownership status, and number of years in operation, number o f employees, methods
of processing plastics, approximate turnover and achievement awarded. The industry
or manufacturing group classification is similar as classified in KOMPASS [147]
and [148]. A numbers of five digitals are used for coding of the responses in this
survey.
The main purpose o f these questions is to gather information about the company
characteristics and background. The information from this section will be used to
find if there is any correlation between company background and other variables
measured such as level o f recycling technology practice in Irish and UK in plastic
industry.
b) Section B: Recycling o f plastic materials
This section contains fifteen questions (Questions B1 to B16). It covers the
information concerning the level o f recycling, the integration level, use o f advanced
manufacturing technologies, as well as the obstacle and the motivation of
implementing automation in the production line.
The information from questions B1 (invest in the recycling o f rejects), B3, B4 and
B7 (percentage o f rejects), B5 (recycling introduced), B6 (level of recycling varies
by unit operation) and B8 (input parameters) will be used to examine the level of
recycle process and integration with several stages affected on the quality, cost,
productivity. As for the questions B l l , B12and B13 (type o f quality, cost,
productivity used), BIO (economic benefits), B14, B15 (reduce the quality), will be
used to understand the complexity o f production and recycled process technology
73

Chapter 3: Design of Survey and Experimental Procedure
used in the company. The data will be used to find if there is any correlation between
the level o f products and recycled practice as well as with other variables measured.
This information is linked to the testing of hypothesis H land H2. As for question B9
(obstacles o f implementation of why recycling was not used in each year), the data
will be used to understand the issue of implementation and employee resistance to
quality change, as has been presented in chapter two.
c) Section C: Marketing and sale o f recycled product
This section contains six questions (Questions C l to C6). In the first part (Questions
C l to C2), it covers the information concerning these involved in the sale of
products. The questions are referred to the (Questions A2, B1 and B2). In the second
part (Questions C3), the percentage of profits comes from the sale of recycled
products. It investigates the issue of troubleshooting methodology used, major
breakdown occurred according to the area, technology and implementation stages, as
well as the availability o f recycle manual. The questions C 4 (How has the sale of
recycled plastic materials affected sales), C5 (market benefits of recycling) relate
with the (BIO), question, and C6 (rate the cost o f each recycling process at different
stages. This information is linked to the testing of hypothesis H3. As for the
questions concerning the several traditional o f plastic materials such as (PP, PS,
PV C .. .etc), that is, questions B5 to B13, C4 and C6, the limitation of these questions
is four years as questions (B5, B9, BIO and C4, C5), from (2001 to 2004) were
developed and adopted based from previous study on recycle implementation in
manufacturing plants, conducted by (PACIA) in Australia [38].
The limitation o f this question is that the answer will be described based on the
respondent’s opinion. Thus, this question could be very subjective and will be
treated with caution [156]. The information from these questions will be used to
examine problems or obstacles faced by the recycle function. In addition, the data
will be used to examine how important the process factors are in affecting the overall
function o f quality o f products. This information is linked to the testing o f the third
hypothesis, H3.
74

Chapter 3: Design of Survey and Experimental Procedure
d) Re-contact
At the end of the questionnaire under “RE-CONTACT” section, the respondents
were queried on their willingness to participate and be contacted again in case some
further information was required. The respondents are requested to specify the
preferable mode o f further contact as well as: through: email, questionnaire or
interview.
3.6. Processing the Survey
The questions included in the survey were reviewed to ensure that they were all
linked to the objective o f the study and are easy to understand. A cover letter (refer
to Appendix A) was printed using the official letterhead o f DCU Mechanical and
Manufacturing Engineering School, Ireland, and signed by the head of school and
the supervisor. The letter was written to explain the purpose and the benefit of this
study to the participants. This letter also informed the participants that the
information will be treated as strictly confidential. As a token of appreciation and to
encourage better response rate, a lucky draw was conducted for all the respondents
who completed and returned the survey questionnaire (refer to Appendix A).
3.6.1. Questionnaire layout
The postal questionnaire survey materials in question were printed in booklet form,
(refer to Appendix A). The questionnaire has eight pages, which was divided into
three sections: general information, recycling o f plastic materials, marketing and sale
o f recycled product. A cover letter, a reply postage paid envelope and description of
lucky draw competition also included in the envelope, which was delivered using a
post.
3.6.2. Pre-test and pilot test
It is acknowledged that by its nature, the survey methodology selected to carry out
this fact-finding or collection o f information is difficult to administer, bearing in
mind the many factors to be considered in carrying out a sound survey. Thus, in
accordance with standard practice of professional survey bodies and due to its wide
75

Chapter 3: Design of Survey and Experimental Procedure
use in research surveys, pre-test and pilot test surveys are carefully carried out in this
research. The purpose o f conducting (a pre-test pilot test) was to test the
questionnaire before embarking on the complete study. The aims of this pilot study
were to test the approach used to solicit participants and to test the survey instrument
itself. In fact, a pilot study was made to access content validity, where few
questionnaires were administered to leading practitioners and academicians [157,
153].
In this study, a pre-test of the survey questionnaire was conducted on a number of
occasions. Sample questionnaires were given and discussed to peers and academic
staff in Dublin City University industrial experience, and have finally been revised
by the research supervisor. The purpose of this approach was to identify if any
obvious issues had not been addressed within the survey or if there were any
mistakes in the questionnaire. This ensured that the questions were easy to
understand and simple to answer. Different opinions and comments of the
respondents were used to determine whether the final draft of the postal
questionnaire was acceptable. As for the pilot test exercise, the survey questionnaire
was sent to selected companies (ten companies in Ireland and UK). The main
objective was to check the suitability and the relevancy o f the questionnaire [23].
The respondents had also been asked to make their own comments on the design of
the questionnaire. In this pilot test, comments were received from four respondents.
There are several reasons for conducting the pilot survey [145]. These are as follows:
1. Test the adequacy of the Kompass database.
2. Show some proof o f the variability o f the subjects in question.
3. Provide an estimate of the probable non-response rate.
4. Test the suitability o f the method of survey.
5. Test the adequacy o f the survey instrument,
6. Review the questions.
The pilot survey, often dubbed as the dress rehearsal and a standard practice by
many survey practitioners, was selected using a table of random numbers [158],
Based on this selection, ten companies were randomly selected from the target
population list. The pilot survey was conducted on the Thursday, 17th February 2005.
Closing date for the returns was fixed the 1st March 2005, giving the respondent a
76

Chapter 3: Design of Survey and Experimental Procedure
total of 12 working days to complete. Four questionnaires were returned, of which
one understood and answered all the questions in questionnaires. This is shown in
Fig.3.4. It is important to observe that the letter accompanying the questionnaire was
signed by the supervisor and included also the official letterhead.
Fig.3.4: Comparison of responses in pilot survey.
3.6.3. Main survey
At the very heart of this research is the main survey. After all the questions were
revised, the survey questionnaires were sent directly to the production or quality
manager of each plant. It was sent to two hundred companies in Ireland and UK. The
research employed in this study involves designing of a postal-survey questionnaire
and mailing it to 30 manufacturing firms in the Republic o f Ireland and another 170
were mailed to the United Kingdom. Similar were used for the web-based survey
and this is discussed in detail fighter 3.5 which illustrates the responses rate o f the
surveys sent to Ireland and UK questionnaire
200
Ireland United Kingdom
Nubmer of Company (s)
Fig.3.5: Shows the response rate of the survey sended to Ireland and
United Kingdom.
77
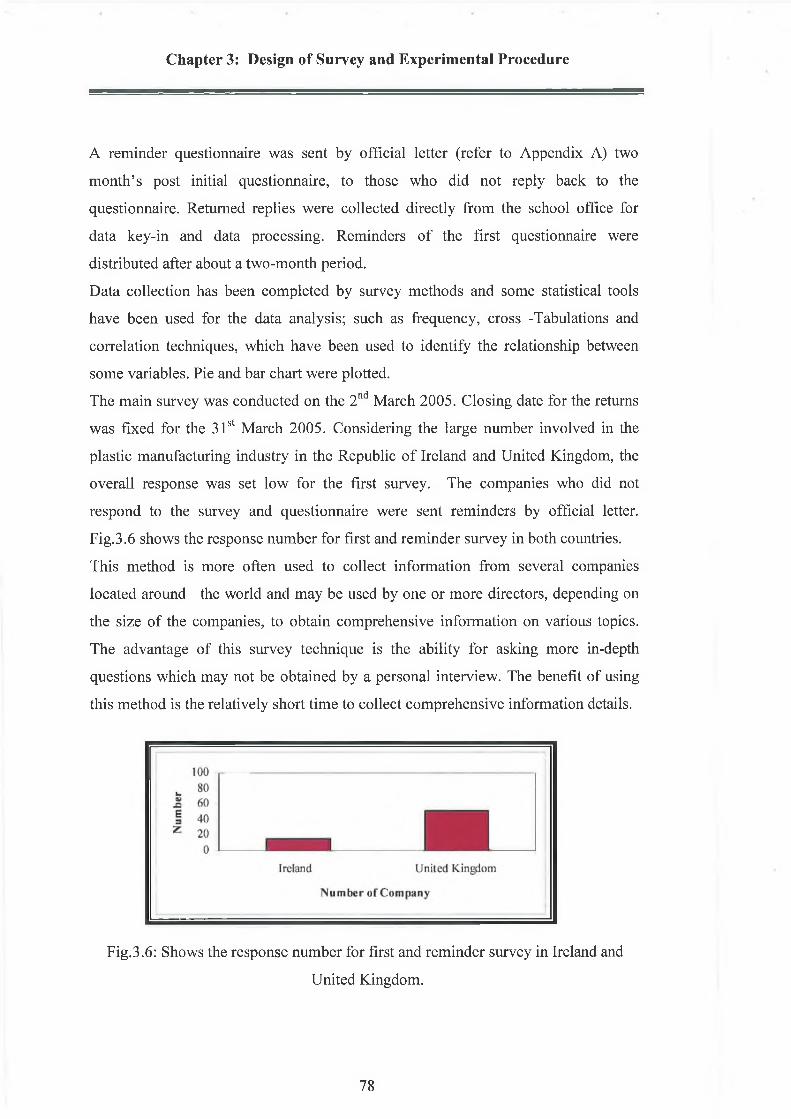
Chapter 3: Design of Survey and Experimental Procedure
A reminder questionnaire was sent by official letter (refer to Appendix A) two
month’s post initial questionnaire, to those who did not reply back to the
questionnaire. Returned replies were collected directly from the school office for
data key-in and data processing. Reminders of the first questionnaire were
distributed after about a two-month period.
Data collection has been completed by survey methods and some statistical tools
have been used for the data analysis; such as frequency, cross -Tabulations and
correlation techniques, which have been used to identify the relationship between
some variables. Pie and bar chart were plotted.
The main survey was conducted on the 2nd March 2005. Closing date for the returns
was fixed for the 31st March 2005. Considering the large number involved in the
plastic manufacturing industry in the Republic o f Ireland and United Kingdom, the
overall response was set low for the first survey. The companies who did not
respond to the survey and questionnaire were sent reminders by official letter.
Fig.3.6 shows the response number for first and reminder survey in both countries.
This method is more often used to collect information from several companies
located around the world and may be used by one or more directors, depending on
the size of the companies, to obtain comprehensive information on various topics.
The advantage of this survey technique is the ability for asking more in-depth
questions which may not be obtained by a personal interview. The benefit of using
this method is the relatively short time to collect comprehensive information details.
Fig.3.6: Shows the response number for first and reminder survey in Ireland and
United Kingdom.
78

Chapter 3: Design of Survey and Experimental Procedure
3.6.4. Response Rate
This study focuses on the data analysis o f the plastic industry questionnaire. In this
survey, the questionnaire itself was sent twice (main questionnaire and reminder, as
mentioned above) to the sample population. Table 3.3 shows the total number of
response rate, for Ireland and the United Kingdom. The response rate of the main
and reminder questionnaire, in Ireland and the United Kingdom was a total of 15.5%
and 18%, respectively, as shown in Fig.3.7.
13 Fust Qiesticrmaire
15.5% I Ruiiiidr ÇUsticmure
s ' □ Total
f
6 6 .5% V -7
Fig.3.7: Total o f response rate o f the first and reminder questionnaire in Ireland andUnited Kingdom.
Table3.3: Response rate for Ireland and 1Jnited Kingtlom.
Type o f respondents Ireland UK Total
No. o f Survey Sending 30 170 200First Response 9 22 31
Second Response 7 29 36No. of Total Survey Response 16 51 67
% of First Response 30 12.9 15.5% of Second Response 23.3 17 18
% of Total 53.3 29.9 33.5Total None Response 14 119 133
% of Total 46.6 70 66.5
In the traditional survey, a total of 200 manufacturing plastic companies were
selected, and one questionnaire and one reminder distributed.
Fig.3.8 illustrates the total response rate of the traditional postal survey. The total
was about 33.5%, as shown in Fig.3.9.
79
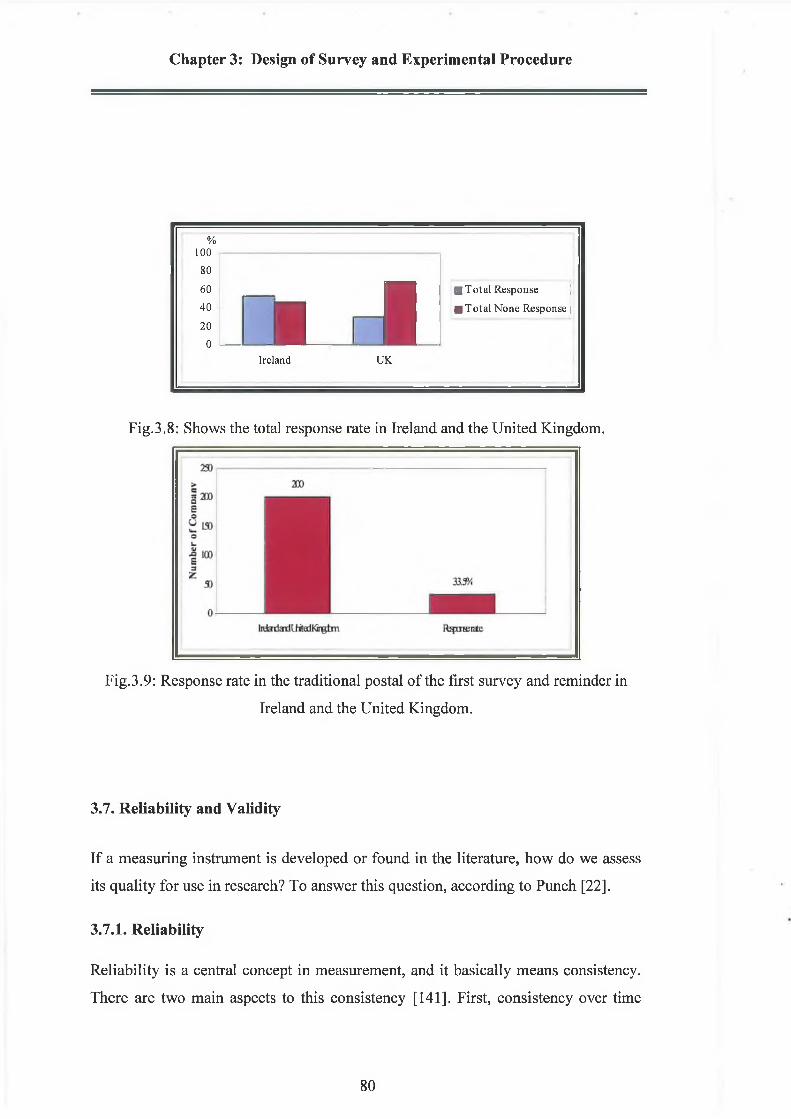
Chapter 3: Design of Survey and Experimental Procedure
%100
80
60
40
20
0 1 I■ T o ta l Response
■ T otal None Response
Ireland UK
Fig.3.8: Shows the total response rate in Ireland and the United Kingdom.
Fig.3.9: Response rate in the traditional postal o f the first survey and reminder in
Ireland and the United Kingdom.
3.7. Reliability and Validity
If a measuring instrument is developed or found in the literature, how do we assess
its quality for use in research? To answer this question, according to Punch [22].
3.7.1. Reliability
Reliability is a central concept in measurement, and it basically means consistency.
There are two main aspects to this consistency [141]. First, consistency over time
80

Chapter 3: Design of Survey and Experimental Procedure
means the stability of measurement over time, and it is usually expressed in the
question; if the same instrument was given to the same people, under the same
circumstances, but at a different time, to what extent would they get the same score?
To the extent that they would, the measuring instrument is reliable, otherwise it is
deemed unreliable. Second, internal consistency reliability relates to the concept-
indicator idea of measurement. Since multiple items are used, the question concerns
the extent to which the items are consistent with each other, or all working in the
same direction. This is the internal consistency of a measuring instrument. Various
ways have been devised to assess the internal consistency. The best knowns are the
coefficient alpha techniques [141].
3.7.2. Validity
A second central concept in measurement is validity. One view of it’s meaning is the
question: how do we know that this instrument measures what we think (or wish) it
measures? In this view, measurement validity means the extent to which an
instrument measures what it is claimed to measure; an indicator is valid to the extent
that it empirically represents the concept it purports to measure [141].
Content validity focuses on whether the full content of a conceptual description is
represented in the measure. Neuman [159] explained that a conceptual description is
a space, holdings ideas and concepts, and the indicators in a measure should sample
all ideas in the description. In this study, to access content validity, a pilot study was
made and questionnaires were administered to leading practitioners and
academicians. Based on their feedback, the final version of the questionnaire was
sent to the participants. Therefore an experimental pilot study was made and results
were carrying analysed using Design o f Experimental (DoE) software to predict and
optimise the data obtained from injection mould HM7, furthermore using valid
inference in some data o f experimental work at different recycled stage to establish
validation. In criterion-related validity, an indicator is compared with another
measure of the same construct in which the research has confidence. In this context,
Zeller [160] believed that no foolproof procedure to establish validity, and the
validation methods used should depend on the situation. He advocated a validation
81

Chapter 3: Design of Survey and Experimental Procedure
strategy: a valid inference occurs when there is no conflict between messages
received as a result o f the use of a variety o f different methodological procedure.
3.8. Data Processing and SPSS Statistical Technique
3.8.1. Data processing
On collection o f responses, the process of editing and entering data into the
computer is initiated. Pre-coding of questions ends this task. There are four main
steps: establish database; data entry; data analysis and generate o f report and
documentation. The data is divided into one file: Ireland and UK, so that the data
could be analysed together.
3.8.2. Statistical Package for the Social Sciences (SPSS) Statistical technique
SPSS has scores o f statistical and mathematical function. SPSS is one o f the most
popular statistical packages which can perform highly complex data manipulation
and analysis with simple instructions and very flexible techniques to analysis data
handling capability to select using several techniques such as descriptive statistical,
contingency tables, reliability test, correlation, T-test, ANOVA, Regression and
Logistic regression. The computer software used in the data entry and processing
was SPSS (Statistical Package for the Social Sciences) for version 11.0. SPSS is
one of the most widely available and powerful statistical software packages. SPSS is
an integrated system of computer programmes designed for the analysis o f social
science data. The system provides a unified and comprehensive package that enables
the user to perform many different types of data analysis in a simple and convenient
manner. SPSS allows a great deal o f flexibility in the format o f data. It provides the
user with a comprehensive set o f procedures for data transformation and file
manipulation, and it offers the researcher a large number o f statistical routines
commonly used in the social sciences [161].
In SPSS, data-management facilities can be used to modify a file of data
permanently and can also be used in conjunction with any of the statistical
procedures. These facilities enable the user to generate new variables, what are
mathematical and/or logical combinations o f existing variables, to record variables,
and to sample, select, or weight specified cases [162]. SPSS enables the social
82

Chapter 3: Design of Survey and Experimental Procedure
scientist to perform an analysis through the use of natural language control
statements. The text is a complete instructional guide to SPSS and is designed to
make the system more accessible to users with no prior computer experience. SPSS
will do three basic things for the user [161].
• It helps users to store and organise their data.
• It helps users to manipulate their data.
• It allows users to analyse this data using statistical procedures.
It covers a broad range o f statistical procedures that allow the users to summarize
data (that is, compute means and standard deviations), determine whether there are
significant differences between groups, examine relationships among variables (such
as, correlation, multiple regression), and graph results (such as, bar charts, pie
graphs).
3.9. Statistical Analytical Tools and Analysis
Quantitative research involves measurement, usually o f a number of variables, and
across a sample. In addition to the usual descriptive statistics, simple frequency
distributions, and cross-tabulations, SPSS used in this study contains procedures for
analytical tools and analysis. It covers a broad range of statistical procedures that
allows to summarise data (such as, compute means and standard deviations), test
reliability and validity o f the data, determine whether there are significant
differences between groups, as well as to examine the relationships among variables
(for both ordinal and interval data). In presenting the statistical procedures contained
in SPSS, the focus will particularly be on the statistical procedures and techniques
that are used in this study.
3.9.1. Statistical terminology
In discussing this study, certain technical terms and statistic terminologies will be
used. Many of them are self-explanatory, and require no special consideration.
However, there are terms or terminologies, which are part of a somewhat, specialised
vocabulary of statistical research. They are discussed here, to clarify their usage
[141,163]. These terms and their short description are outlined as follows:
83

Chapter 3: Design of Survey and Experimental Procedure
• Empirical
Empirical is a central term in this thesis. According to Ragin [164], empirical means
that something (or its impacts) is observable, where ‘observation’ is broadly
interpreted. The essential idea is to use observable, real world experience, evidence
and information as the way of developing and testing ideas. He refers “Empiricism”
as a philosophical position, which sees observation as the foundation of scientific
knowledge. Punch [141] preferred the general term “data” to describe this evidence
and information in a research context.
• Data
The data is the measurements that are made on the subjects o f an experiment.
• Statistic
A statistic is a number calculated on sample data that quantifies a characteristic of
the sample.
• Population
A population is the complete set of individual, objects or scores that the investigator
is interested in studying. In an actual experiment, the population is the larger group
o f individuals from which the subjects run in the experiment that have been taken.
• Sample
A sample is a subset of the population. In an experiment, for economical reasons, the
investigator usually collects data on a smaller group o f subjects that the entire
population. Furthermore, conjunction with two group samples is used to determined
data obtained from survey and experimental work.
• Parameter
A parameter is level of questions calculated on population data survey that quantifies
the characteristics of the questions respondent. Furthermore a parameter is a
number calculated on experimental data that quantifies the characteristics of the
84

Chapter 3: Design of Survey and Experimental Procedure
quality o f experimental processes. As mentioned above, this research uses several
parameters with three levels of recycled stages and each stage in the survey
questions are has three scales.
• Variable
A variable is any property or characteristic of some event, object or person that may
have different values at different times depending on the conditions. Three variables
are used in the investigation of this research.
• Independent variable
The independent variable in an experiment is the variable that is systematically
manipulated by the investigator. In most experiments, the investigator is interested in
determining the effect that one stag has on one or more variables. Variable the
recycling process is used as the independent variable in this research.
• Dependent variable
The dependent variable in an experiment is the variable that the investigator
measures to determine the effect o f the independent variable. Variable quality and
marketing are the dependent variables in this research.
3.9.2. Frequency distribution
In addition to the mean, standard deviation and variance; frequency distributions are
a useful way to summarise and understand data [141]. The individual scores in the
distribution are tabulated, where absolute numbers and / or percentages may be used.
The results can be presented as frequency distribution tables or as graphs such as
histograms, bar charts, frequency polygons, pie charts or other graph forms. Fig.3.10
shows a snapshot o f variable view of the SPSS page and Fig.3.11 shows a snapshot
o f a statistical analysis by using frequency distributions.
85

Chapter 3: Design of Survey and Experimental Procedure
NB Qtt [¿tit rranrfom \fM+t ty v
g£ | D m m - H = KDtQcrtt *
Name Typ« CustflR [Hie* » teaptot Vati as Missino J Column9 1 Align Measur« J -1si Wum»nc CaipvfltjMns * &jAve. 00. Local 1 1 00,-2 00 8 Right Nominal
2 a2 Numtnc N x HSwJMaletj *
Ooetrfu. 00. <51. 1 00.-200 8 Right Scat«3 a3 Humane ft*» ... CO. <50| 1 00,-200 8 Righi Seal« -J4 a41 Numtnc Nyw much did |1 00. GDI -1 00,-200 8 Righi Ordnal5 342 Numtnc H w much did |1 00 ® | •1 00.-200 11 RijM Ordnal6 >43 NiflMflC » How mucn did |1 00. ® | •1 00. -200 8 Right Ordnal
*44 Numtnc Osto Rödjcöcn * Hwrmuch did |1 0 0 .® l -•.00 2 00 8 Rkghl Ofdnal«51 Numtnc s< * * VVNch of th t fo j l 00. Y«» | 1 00 . 200 8 Right Nominal
1 »52 Numtnc yorp»«inetnc Tests • Which oflh«fo{1 00. Y«») • i 00 -200 9 Right Nominalt o 353 Numtnc Sarte* Winch of th* fa (1 000. Y « i) •1000. -2000 8 Right Nominal
1 11 *54 Mumtnc Sfjvh-ä VW »chofth«to(100.Y«»| •1.00. -200 8 Right Nominal12 «55 Numeric
mtr>} i t i jo t<\+n*Otft«t.whKh (I OO.Ym I -1 00. -200 8 Right Ncmmal
1] bl Numtnc Dots your co |1 0 0 .Y e *| •100 -200 8 Right Ncmmal14 b2 Numanc 8 2 How long h» i t (1 00. <2| 100 -200 « Right Seal«15 b3t Numeric 0 2 On «wr«qt wb (1 00. <2%| 100 -200 8 Right Seal*
16b32 Numeric 3 2 On avtra^t wti (1 00. <2%) •! 00. -200 8 Right Seal«17 b33 Numtnc a 2 On * * r * 9 «wh |1 00. <2%| •100. -200 B Right Seal«10 b34 Num«nc 3 2 On m*r«9 «wh (1 00. *2%| •100.-200 8 Right Seal«
I 19 M l Numtwc 9 2 Apprournataly |1 00. <2%| •100. -200 8 Right Scalei 2D M2 Numtnc 9 2 Appronrmttty |1 00. <2%| •I 00. 200 e Right Seal«i 21 M 3 Num*nc 9 2 ApprorifnMtty |1 00. <2%| •100 -2 ÛU 6 Right Seal«
22 M4 Numtnc 9 2 Appiuiunattlf (1 00. *2%| -100.-200 8 Right Seal«23 b45 Numtnc 3 2 Approximately ¡1 00. <2%J •100. -2 00 6 Riqht Seal«24 b5pp1 Numtnc 9 2 In which ytam (1 00. Nono R t -100. -200 6 Right Ordinal¡5 b5p*1 Numtnc a 2 In which y t* ia (1 00. Non« R* •1 00. -200 e Right Old n«l20 b 5 p *l Numtnc 9 2 In which y«ats |1 00. Non« R* -100.-200 8 R ijh l OrdnalV tóhdpel Numeric 9 2 In which y »i n (1 CO. Non« R« •100. -200 8 Right Ordnal20 b£ldp«1 Numeric 9 ¡2 In which y t m (1 00. Non« R* ■I 00.-200 e Right Ordnal29 b5«p)l Numeric 9 2 In which y«»rt (1 00. Non* R* •100.-200 9 Right Ordnal30 b5ap»t Numanc 9 2 In which y«aic |1 00. Non« R t •100. 200 =e Right Ordnal31 Numtnc 0 2 In which y ta n (1 00. Non« R t -100.-200 8 Right Ordinal32 bôotherl Numtnc 9 2 In which y««r» (1 00. Non« R®-1 00, -2 00 e Right Ordinal . i
LAV
11I
1« i . rh i-jrr. n STO feet*»» «rMdÿ
f i v - l ■j¡ a s ¡ © ? v -j> u ■ _J9>« 1I' -V - !•]«»»• HcroMft Word J Q '. < 0 2 { 22:«
Fig.3.10: Snapshot view of variable view in SPSS software.
■ Frequencies *Jyariable(s):
OK▼ B a a ll ll l l lu il —j£ How many years haH
Number of employee Paste How much did yiu s|
i How much did yiu sp 0 Beset
#) How much did yiu s|Cancel#) How much did yiu s|
§ Which of the followinHelp¿Which of the followin
») Which of the followin .Aun .:.k tk«
17 Qisplay frequency tables
Statistics.., Charts, Eormat..
Fig.3.11: Snapshot view o f frequency analysis in SPSS software.
86

Chapter 3: Design of Survey and Experimental Procedure
3.9.3. Cross tabulation
A cross-tabulation is distributions statistical techniques using the SPSS software to
summarise and interpret data. Using cross-tabulation to examine relationship
between two or several variables at the same time (nominal or ordinal), cross
tabulation statistical tests are available to determine whether there is a relationship
between variables in a table. Furthermore, frequency distributions techniques using
one variable at a time are used in order to partially describe data. Alternatively,
cross-tabulations used to analyse the relationships between independent and
dependent variables, what is, between defined problems and factors contributing to
those problems. A cross-tabulation is used in this research to examine questions to
identify the aim of the study [165]. The individual scores in the distribution are
tabulated, where absolute numbers and / or percentages may be used. The results can
be presented as distribution cross-tabulation as tables row and column. Fig.3.12
shows a snapshot view of a statistical analysis using a cross-tabulation distribution.
* 5iName
J MM J _i£j ÆI tfF* i WkSH I Oetinvafc ] Labd _ | Vafcjas jtt/’irX
tAtu j Cotow I toy I Mmìmi I
WÎ 144 US «*>« «*«1 tóp< 1 Wir*'t6*08t
ilMttflm-••••__3Î
•Eíi
f i t MM» ¿Ifte I jè u » » * * * • . L _ J♦ w*.»j i . u »
□ r4 r»i 0*mè to i ix (> « f« '
DqJy dbio ctJ L* thrfi
$«lci J
Niriwic 8Num*nc (INume« IlNwraflc KNimenc INumerò Ifkrfnanc IIWeiK $WjtWìic 0Nunenc 9
i i w4uch ye* t to' tuchyea« In vihtch years tnvrtichye*s In which years ki»4w:hyew In wftch y?ars bivrfychye« Vi v*ttch yeara
(tUO(100, Nam Re |t 00, None Reti 00 itane Re |100. M m Ref i DO, None Re |1 OO.NflMftì [IDO, (té [I 00, None Wi [100, Ne« n
). :<».1.-2 00 J.-2Q0 ). ÎC0 ).•}(!) >.-200
1.-ÎOO > . :coI . 200 ). λ I. -2.00
w , -200 110, -2 00
-1 00,-200 -t0 0 ,-200 -100,-2 00
.-I 00,-2 00 •100,-2 00 100.-2 00
-1 <0.-200 100,-200 <00. 200
9 9*t FOWi*0 RigH Scili0 Right Scale« Right Ordinalit Rtfi Ordiiila Rxjht Oninal« Righi Ordnal4 Right Normal9 Righ Norn nal3 Right NomnaJJ Rigrt Nominal9 Right fforwal0 Right Nominal) State1 R*jht Scäe9 Btfit Scale* Right SealsA Right Scale9 Right Scala« Right Sctó0 Right Scale» ftgtt Scale9 Right Scala« Right Ori») al11 R*gW Ordii il• Right Ordnal9 Ordnal9 Righi Ordini« Righ Ortral« R«ght Ordirsi9 Rght Ordinai01 Right Orinai4 Right Ordeal
I* _ L _w I n a i «
r OttoneHomir U rtup ijco A w t r g* im
F OimdCiWr’iV r Sowedr Lnbdi r KsrdrflLaitor 1¡TLO'jrtj r Kcndtfi rate
HnwJ t* Im» il rr eu r Hü
r mcnbw
1 C<*iwi's,jidM»*fH«rirri íMafa
Fig.3.12: Snapshot view of cross-tabulation analysis in SPSS software.
87

Chapter 3: Design of Survey and Experimental Procedure
3.9.4. Reliability test for survey instrument
In this research study, an internal consistency reliability analysis was performed for
the elements by using the SPSS “Scale Reliability Analysis” procedure. Reliability
tests on the survey instruments were performed using the guidelines provided by
Saraph et al [166]. Cronbach’s alpha (a) is one of the most commonly used
reliability coefficients, which ranges in value from 0 to 1 to estimate the value of
internal consistency [156,167]. Alpha is measured on the same scale as a correlation
coefficient. The closer the alpha is to 1.00, the greater the internal consistency of
items in the instrument being assessed [168]. The a value can be calculated from any
subset of the elements and it can provide the best illustration as regard to internal
consistency. The coefficient a was calculated for each elements. Saraph et al [166] It
is also viewed that an a value of 0.7 and above are considered to be adequate for
testing the reliability of the elements. Thus, it can be concluded that overall, the
survey instrument has high internal consistency and reliability. Fig.3.13 shows a
snapshot view of a reliability analysis using SPSS software as some questions exams
reliability analysis, (refer to Appendix B).
Reliab il i ty Analysis
£> how is productivity A;
<$> how is productivity
<§> how is productivity
'§> how is quality affec
how is quality affec
%> how is quality affec
<j§> how is quality affec :£> hnw is duality affer
Mode!: (Alpha
l~ List item labels
Items:
DD
#> Does your company in1
\j£> how is quality affectes
Statistics..
OK
Paste
Reset
Cancel
Help
Fig.3.13: Snapshot view of reliability analysis using SPSS software.
88

Chapter 3: Design of Survey and Experimental Procedure
3.9.5. C orrelation analysis
Correlation is technical statistical analysis deals with the relationship between
variables. If a relationship exists between two variables (a “predictor” and a
“response”), then it may be possible to estimate the value o f the response, by using
the value o f predictor. It is about determining the magnitude and direction o f the
relationship [169]. It provides the researcher with a technique for measuring the
linear relationship between two variables and produces a single summary statistic
describing the strength of the association; this statistic is known as the correlation
coefficient [170].
• Correlation coefficient
Correlation is a topic that studies the relationship between two variables. A
correlation coefficient can vary from “+1” (means the correlation is perfectly
positive, that is, very a strong relationship between the two variables) to “—1” (means
alternatively - the correlation is perfectly negative between two variables) whereas
the relationship is nonexistent if the correlation coefficient equals “0” [162, 171].
• Level o f significance
A correlation is said to be significant if it is greater than is likely to have arisen by
chance. Two levels of significance are generally used; 0.05 or 5 per cent level and
the 0.01 or 1 per cent level. The more significant a correlation is, the more confident
one can be that there truly is a relationship exists between the variables [164, 171].
Multiple R, R2, and the significance o f the equation are also computed at each stage.
This statistical method provides types of statistical models including R-Square,
analysis o f variance (ANOVA) and coefficients panel [172, 173]:
• R is a multiple correlation coefficient between the observed and predicted
values o f the dependent variable. The values o f R for models produced by the
89

Chapter 3: Design of Survey and Experimental Procedure
regression procedure range from 0 to 1. Larger values of R indicate stronger
relationships.
• R-Square is determination coefficient (model summary) is used to define the
proportion of variability in the dependent variable that can be explained by
changes in the values o f the independent variables. The values of R squared
range from 0 to 1. Small values indicate that the model does not fit the data
well. The sample R squared tends to optimistically estimate how well the
model fits the population.
• The analysis o f variance (ANOVA) indicates whether there is a significant
linear relationship between the dependent variable and the combination o f the
independent variables (P-Test is used to test the null hypothesis that there is
no linear relationship). The (P) statistic is the regression mean square divided
by the residual mean square. If the significance value of the (P) statistic is
small (smaller than say 0.05) then the independent variables do a good Job
explaining the variation in the dependent variable. However, if the
significance value o f F is larger than say 0.05 then the independent variables
do not explain the variation in the dependent variable.
3.10. Primary Data
In order to gather the required primary data, three main investigation techniques
were considered in this research.
1. Personal interview and observation.
2. Mail questionnaire.
3. Experimental work.
• Personal Interview:
The personal interview involves face-to-face contact between interviewer and
respondent. This technique has the advantage o f being the most flexible of the
survey methods. During the interview itself, the presence o f the interviewer permits
flexibility in procedure. The questioning can be adapted to the situation; further
explanations or clarifications can be requested if desired. It also has the major
disadvantages that the technique has the cost o f gathering the information and the
90

Chapter 3: Design of Survey and Experimental Procedure
time necessary to complete even a small survey. This technique was used as the
beginner method in this study is to obtained comprehensive information related to
this study. This data would be used for feedback and originations for second
methods have been used to indicate ability and quality policy.
• Mail Questionnaire:
This method is used to collect information from several companies located around
the world and may be used by one or more directors, depending on the size o f the
company, to obtain comprehensive information on various topics. The advantages of
this for survey technique is the ability to ask more in-depth questions which can not
be obtained through a personal interview; the benefits o f using this method is less
time to collect comprehensive information over a short period o f time. This study
uses a mailed questionnaire to each selected individual company in the Republic of
Ireland and United Kingdom. This method was established by one a two directors
and also has been started as a pilot test sent to some Irish plastic company to
complete the whole questionnaire in order to ensue the questionnaire is fully
understandable and to get any suggestions for improvement in this study or to avoid
any difficult questions. A survey of the literature has indicated that little work has
been done to study the effects o f recycle processes on the product quality of plastic
materials implementation at several recycling stages. Most o f the survey information
survey was related to scraps collected from landfill and municipal.
• Experimental Work:
This method is a very important and tool involves process inputs parameters from
the injection mould, HM7. The experimental work investigates the effects of
recycling injection mould processing parameters such as moulding speed, barrel
temperature and nozzle temperature, on mechanical properties o f recycle materials.
To carry out this work, different samples have been prepared from polypropylene
(PP). The plastic materials have been recycled from raw materials in three stages. To
carry out this optimisation, experimental design modelling has been applied. The
data was plotted to show the optimum moulding condition to obtain the best
91
Chapter 3: Design of Survey and Experimental Procedure
properties. Experimental design modelling has been applied to study the effects of
parameters during the injection moulding process. Recycling nature of plastic
materials has been applied successfully to many traditional thermoplastic types.
3.11. Scaling of Responses
The outcome of this fact-finding survey is to compare the internal factors of the
practices o f each recycling stage. This requires careful consideration in the
questionnaire design. Scales are ways o f ordering possible responses to a question.
There are four types of scales that may involve numbers, each with different
characteristics that determine the suitability of applying statistical test, the types of
scales are:
• Nominal scales• Ordinal Scales
• Interval scales
• Ratio scales
1. A nominal or categorical scale is simply a set of categories, which may or may not be
numerically coded. There are many questions in this survey, depending on the type
o f scale. An example of this is as follows:
• Question A5: Which of the following methods of processing plastic are used in
your company? And the possible responses offered are: Extrusion, Injection
Moulding, Blow moulding, Film Moulding, and other. This type of question has
limited application and is used sparingly .It is possible to code these responses
using letters or numbers
2. Ordinal scale; ranking the choices but without quantifying the magnitude of the
difference. Example:
• Question B13: Which process parameters inputs reduce the quality of recycling
products at each recycling stage? This type of question has limited application
and is used sparingly.
3. Interval or Numerical scales; this has equal units of measurement that makes it
possible to interpret not only the order o f the scales but also the magnitude of the
92
Chapter 3: Design of Survey and Experimental Procedure
distance between them. Example: question, B3 and B4: illustrated approximate
percentages o f rejects coming from the products? (Refer to appendix B).
4. Ratio scale; this is the most efficient method o f measurement which has the properties
o f an interval scale and a fixed origin or zero points makes it possible to compare
both difference in scores and the relative magnitude of scores.
Example:
• Question B6: Approximately how many times does your company recycle the
plastic materials? As can be seen from the above measurement scales, all effort
in designing questions must be directed to design specific and discriminating
questions that can help in distinguishing clearly one respondent from the other.
3.11.1. Response Time
The first response from the postal survey arrived at the mailbox within 7 days of
sending the questionnaire to the companies, and two month later the reminder
questionnaire was sent to them. There was a month waiting time for the response to
the reminder .The total response was approximately 33.5% .The period of time
required for postal survey was about four months. In this study the postal survey
method were percentages higher than the web-based survey (on-line survey) [145].
3.11.2. CostIn the traditional postal survey where the costs involved has been computed that is,
paper, envelopes and postage costs, the total of cost for each questionnaire is about
€2.20. This finding supports previous finding [174, 175], which concludes that the
cost o f postal data collection is higher than online methods used.
3.12. Questionnaire analysisThe questionnaire involves three sections, and every section divided into some
questions to obtained assistance information for develop and improve
implementation of recycles process in plastic industry. And there are links for each
section on the questionnaire.
A) Company profile:
93

Chapter 3: Design of Survey and Experimental Procedure
Question A 1: Ownership.
This question seeks information about classified ownership in plastic industries:
Answers are sub-divided into three groups; Local, Mixed and Foreign. The
respondent ticks where applicable to them.
Question A 2; How many years has your company been manufacturing plastic
products.
This question enquires how long the company has been established in the
manufacturing o f plastic materials. It is generally belived that the longer a company
has been in operation the more difficult it becomes to accept change to ensure that
resistance to change is minimal since these may hinder the introduction of recycling
and efficiency improvement initiatives .In this question, there are five options:
• Less than 5 years.
• 6-9 years.
• 10-20 years.
• 21-30 years.
• More than 30 years.
Again the respondent ticked the most appropriate option.
Question A 3: Number o f employees on site.
Some experts believe that the number o f employees plays a crucial role in the
development of quality. The quality o f recycling is inversely proportional to
productivity and efficiency of its employees. Larger organisations with a high out
put o f recycling ideally smaller o f employees. In this question, there are six options:
• Less than 50 employees
• 50-100 employees.
• 100-20 employees.
• 500-1000 employees.
• Over than 1000 employees.
94
Chapter 3: Design of Survey and Experimental Procedure
• 200-500 employees
Respondent should tick the appropriate one.
Question A 4; approximately, how much did you spend training staff in recycling
in recent years?
This question seeks to find approximately how much money has been spent in the
company training staff in recycling in recent years, this question enquires about the
level of money spent for the development of personal skills. Six options are provided
over a four-year period (2001-2004).
• € 0
• € 1-4999
• € 5000-9999
• € 10,000-24,999
• € 25,000-49,999
• Over than € 50,00
The respondent should tick as applicable.
Question A 5; Which o f the following methods ofprocessing plastics, are used in
your company?
This question seeks information on the kind of methods when are used in the plastic
industry for each different thermoplastic material. The questions involve five options
of mould process:
• Extrusion.
• Injection moulding
• Film moulding.
• Blow moulding.
• Others.
The respondent should tick as applicable.
B) Recvclins o f plastic materials:
95

Chapter 3: Design of Survey and Experimental Procedure
Question B1 Does your company invest in the recycling o f rejects?
This question is one of the most important questions. It seeks to cover information of
the study, and this question is constructed so as to lead to other questions similar to
question number B2.
This is to define the implementation and use o f recycling in plastic industry. There
are two options to this answer:
• Recycle.
• None.
And the respondent should tick as applicable.
Question B2; If yes, how long has the company been carrying out recycling?
This question is raised to provide a comparison between question number A2. To
this question, there are five options:
• Less than 2 years.
• 3-5 years.
• 6-9 years.
• 10-15 years.
• More than 16 years.
Respondent should tick as applicable.
Question B3; On average what percentage o f rejects comes from the process
products offowling years in your company?
This question seeks information on the average percentage of plastic rejects coming
from the thermoplastic process using traditional plastic materials within the last four
years from 2001 -2004. Five percentages have been used in this question over the
four year period to which provides the majority percentage from the plastic process.
This question is crucial to define problems in this study. Less than 2 %, 3-5 %, 6-9
%, 10-15 %, more than 16 %. The respondent should tick as applicable.
96

Chapter 3: Design of Survey and Experimental Procedure
Question B4: Approximately, how many percentages o f rejects come from the
process o f recycled products?
This question is important to determine what percentages o f rejects come from
thermoplastic process in the different materials and this study is indicated in tonnes
for responses in different percentages. This question also defines the problems of this
study, related to question number B3; a discussion on the percentages of which come
from thermoplastic materials. This question is expressed in five different tonnes
value for thermoplastic materials:
• Less than 200 tonnes.
• 200-800 tonnes.
• 800-1500 tonnes.
• 1500-3000 tonnes.
• Over than 3000 tonnes.
And in this question, different percentage options are also included: Less than 2 %.
• 3-5 %.
• 6-9 %.
• 10-15 %.
• More than 16 %.
Again, the respondent should tick as applicable.
Question B5: In which year was recycling introduced for the following plastic
materials?
This question asks in which years recycling was introduced for the following
untraditional thermoplastic, such as PP, PS and PVC. The question asks which
materials are not recycled and are recycled over the four last years from 2001-2004
and also to quantify which plastic materials were used during these years. This
question is critical to quantify responses for the next question, B6. In this question
there are two options:
• Recycled.
• None recycled.
97

Chapter 3: Design of Survey and Experimental Procedure
And the respondent should tick as applicable any unit, which has been recycled.
Question B6; How many times does your company recycle the plastic materials?
This question enquires how many times the company recycles the plastic materials.
This question seeks information on the specific recycle process used in the plastic
industry for each recycle stage. In this question there are four options; first recycling
process, second recycling process, third recycling process and more recycling
process. The respondent should tick where applicable.
Question B7; On average, in your company what percentage o f each plastic
material is recycled?
This question seeks information on the average percentage of each plastic material,
which is recycled coming from the various recycle stage that is, first recycling,
second recycling, third recycling. There are three recycling stages provided in this
question and five percentages used in each stage for each plastic material such as,
PP, PS, PVC. This question is important to define the percentages and totals for each
plastic materials used in recycle. For each recycling stage five options o f percentage
are produced:
• 0%.
• 1-5%.
• 6-9%.
• 10-15%.
• >16%.
The respondent should tick for each recycling stage.
Question B8; In your opinion, which o f the following input parameters reduce the
quality o f recycled products in your company?
There are many obstacles facing manufacturers in implementing recycle materials in
the plastic industry. This question seeks information on the obstacles, which reduce
the quality o f recycled products in your organisation. There are three options to
98

Chapter 3: Design of Survey and Experimental Procedure
answer this question for each recycling stage for several plastic materials (PP, PS,
and PVC).
• Process: An important factor in deciding to implement recycle materials is to
organise technology systems. The process for recycling materials has important
effect on the production of quality recycled products. This question is related to
question number A5. The following methods of processing plastic; extrusion
mould, injection mould, blow mould and film mould, and which ever process is
used; internal factors such, as screw speed, barrel temperature, mould
temperature. Mould shaping, nozzle temperature affect the recycle process and
impact on the quality o f products. This question is related to question number,
B14 and B15.
• Materials: Normally, a large quantity o f plastic rejects needed for the recycling
process. Deformation testing on the recycled materials will decide the suitability
of the business to introduce recycling. Also, carry out experimental work for
mould plastic materials, PP, to determine the suitability stage of the recycling
process. This question is related to question number BIO to the type o f several
plastic materials is recycled.
• Personnel skill: is one of the major obstacles for implementation in recycling
materials, based an a process system if the organisation lacks competency and
technically skilled, to affect the quality o f the recycled products for different
levels o f recycling such as, first recycle, second recycle and third recycle .In
order to over come this obstacle, the decision maker in the organisation has to
organize training for staff before implementing a recycle process. The respondent
should tick for each recycling stage.
Question B9: Choose the specific reason(s) why recycling was not used in each year.
Each factory or plant consists of several units and each one of these have a role in
the production process. The decision to set up a recycling unit depends on several
factors, such as quality, cost, value and staff skills. This question seeks information
on the specific reasons as to why recycling was not used in each year from 2001-
2004. And the following are the most likely reasons:
99

Chapter 3: Design of Survey and Experimental Procedure
• Cost o f recycling process.
• Change in properties of materials.
• Inadequate personnel skills.
• Cheap Raw material.
• Inability to distribution marketing.
• Reduction in quality.
• Low price sales.
• Decreased market in recycled products.
• Decrease quantity of productivity.
• Others
The respondent should tick where applicable.
Question B10; In your opinion what are the economic benefits of recycling plastic
materials in your company.
Normally the implementation of traditional recycling o f thermoplastic materials
increases gradually over the years due to development. This question seeks
information on the economic benefits of recycling plastic materials within the last
four years, and this question also relates to question number C5. In this question
there are seven factors to answer, which affect the recycle plastic industry:
• Increased productivity.
• Maximizes Sales.
• Reduce process cost.
• Low cost products.
• Maximizes profits.
• More Competitive.
• Other.
The respondent should tick each year as appropriate.
100

Chapter 3: Design of Survey and Experimental Procedure
Question B ll: For each plastic material, how is Cost affected by the recycling
process?
The level of recycling in the plastic industry is largely dependant on the production
process. The mould process has a direct effect on the end product; therefore the
recycling of plastic materials uses several input parameters, which affect the process
and thus cost. This question inquires about the cost o f the recycling process for each
plastic materials, such as PP, PS and PVC and also enquires about the relationship
costs of various materials in each recycling stages. For this question, every stage has
been selected with three options:
• Increases cost.
• Decrease cost.
• No change in cost.
This question is related to question number C6, to decide which plastic materials
most affects the recycle process at different recycle stage. This question is used as a
guide to the cost of plastic materials at different recycle stages.
The respondent should tick for each recycling stage.
Question B12: For each plastic material, how is Productivity affected by the
recycling process?
This study involves the benefit o f plastics rejects arising as a result of scrap, sprues
and runners. This question investigates the productivity of the recycling process for
each plastic material such as, PP, PS, and PVC. Also this question inquires about the
relationship between productivity at each recycling stage. Eight plastic materials
have been selected at three recycle stages; each recycle stage has three options:
• Increases productivity.
• Decrease productivity.
This question is related to question number C5, to decide which plastic materials has
more productivity from the recycle process at different stages. This question is used
101

Chapter 3: Design of Survey and Experimental Procedure
to indicate the productivity o f plastic materials in different recycle processes. The
respondent should tick for each recycling stage.
Question B13: For each plastic material, how is Quality affected by the recycling
process?
This question inquires about how the quality of plastic is affected by the recycling
process, for each plastic such as, PP, PS and PVC. The relationships between
products quality at different recycle stages were investigated. Eight plastic materials
have been selected at three recycle stages; each recycle stage has three options:
• Increases quality.
• Decrease quality.
• No change.
The respondent should tick for each recycling stage this question is related to
question number B5. This question decide which plastic materials are more affected
by the recycle process at different stages, and this question is used as a guide for
which recycle stage has the most significant impact on the quality of plastic
materials.
The respondent should tick for each recycling stage.
Question B14; When choosing a process, which one o f the following has an impact on your choice?As mentioned in question B8, there are many obstacles facing processes to
implement recycle materials. This question seeks information on the obstacles to
implementation of recycling materials in the plastic industry. This question is related
to question number B15. This question has indicated many different process
parameters on the plastic process and which process parameters have the most effect
on the mould products. To answer this question, the following parameters are given:
• Screw speed.
102

Chapter 3: Design of Survey and Experimental Procedure
• Barrel temperature.
• Mould shaping.
• Mould temperature.
• Venting.
• Injection pressure.
• Nozzle temperature.
• Hydraulic.
• Cooling.
• Moving piston rod.
• All of the above.
This question seeks information on which process, a parameters impact on the
implementation of recycled materials. And is used to determine which factors are
important to recycling. This question is compatible to question number B8, and also
has selected some process parameters, which reduce the quality o f recycled products
in the plastic industry. The respondents are required to check all the parameters
process, which applies in implementing recycling materials (such as, PP, PS and
PVC). The respondent should tick as applicable.
Question B15: In your opinion, which o f the following input parameters reduce
the quality o f recycled products in your company?
This question is concerned with the process factors, which affect the product quality.
The there are four options to select, including; Screw rotation; Barrel temperature;
Nozzle temperature and Mould temperature. The respondent should indicate which
o f the above parameters reduces the quality of products for each recycle stage.
C) Marketing and sale of recycled products:
103

Chapter 3: Design of Survey and Experimental Procedure
Question Cl: Does your company sell recycled products?
This question seeks information on the sale of recycled products. This question has
two-answer option; Sell recycles products and do not sell recycle products. This
question relates to question number C2. This question is limited to those selling
recycled products in the plastic industry. The respondent should tick as applicable.
Question C2; If yes, how long has the company been involved in the sale of
products
This question enquires whether the company has been involved in the sale of
recycled products and this question is also related to question number Cl.This
question also has a relationship to question number B2 and also a comparison to C2
and B2, to definite the period o f the use o f recycles. This question has five answers
are options:
• Less than 2 years.
• 3-5 years.
• 6-9 years.
• 10-15years.
• More than 16 years.
The respondent should tick as applicable.
Question C3: On average what percentage of profits comes from the sale o f
recycled products?
Usually in such companies there is a finance strategy to develop the manufacturing
operation and to reduce the cost. The question aims to define the percentage of
company profits from recycled products:
• 2%.
• 5%.
• 10%.
• 15%.
• 30%.
• 45%.
104

Chapter 3: Design of Survey and Experimental Procedure
• More.
And the respondent should tick as applicable.
Question C4; H ow has the sale o f recycled plastic materials affected sales, during
the following years in your company?
This question investigates the increase or decrease of the company sale rates
considering the use of recycled plastic materials, during 2001-2004. The respondent
should tick for each year as appropriate.
Question C5; What are the market benefits o f recycling in your company?
Normally, the implementation of recycling is part o f the development o f plastic
industry. This question provides information on the market benefits on the use of
recycling plastic materials over the last four years, and this question is related to
question number B7. Nine variables to one or more, which affects the recycle plastic
industry, are posed:
• Low price.
• Consumer Satisfaction.
• Increased Productivity.
• Maximizes Sales.
• Financial diversity.
• Reduced process cost.
• Maximizes profits.
• More Competitive.
• Others.
The respondent should tick each year as appropriate.
Question C6; How would you rate the cost o f each recycling process?
This question seeks information on the relation between product price and the
recycling process. Each recycle stage has three price options:
• Low price.
• Medium price.
105
Chapter 3: Design of Survey and Experimental Procedure
• High price.
And this question relates to question numbers B llan d B13. These questions are
raised in order to give guidance as to which recycle stage attains the optimum price.
The respondent should tick as applicable.
3.13. On -line survey
3.13.1. Introduction
Survey research has traditionally played an important role in many areas of the social
sciences and business, such as, policy development, marketing and consumer
research, health issues, educational practice, media, and political polling [176].
There are several methods that can be considered to collect data in survey research.
Each has advantages and a disadvantage of classified methods o f collecting data in
survey research divided into; mailed survey, telephone survey, personal interview
face -to-face, and web-based survey [177]. Over the last decade, electronic surveys
have evolved from disk -by-mail survey, to e-mails with embedded or attached
surveys and finally to web-based surveys posted on the internet [178]. With web-
based survey, participants are usually notified by e-mail to participate in the survey
[179]. Internet based technology, such as the world wide web (www) is fast
becoming accessible to large segments o f society. Usage is doubling every year with
a current estimate of one in six people using the internet in North America and
Europe [180]. In this research studying the field of recycling process of plastic
materials in the plastic industry is implemented through data collecting,
questionnaire survey post and web-based survey method as mention above. The two
methods (paper questionnaire and web-based survey) are implemented.
3.13.2. Brief history of on-line survey
Beginning in the late 1980 and early 1990, prior to the widespread use of the web, e-
mail was explored as a survey mode. As with the web, today, e-mail offered the
possibility of nearly instantaneous transmission o f surveys at little to no cost. E-mail
surveys tended to resemble the liner structure o f a paper survey and were generally
limited in length furthermore, because e-mail surveys were primarily text-based. The
only significant advantage they offered to increased response rates [181, 182]. The
106

Chapter 3: Design of Survey and Experimental Procedure
web started to become widely available in the early-to mid-1990, and quickly replace
e-mail as the internet survey medium o f choice. For convenience sample, the web
also offered a way around the necessity o f having to know respondents e-mail
addresses [183].
3.13.3. Coverage of on-line Survey
The target population that is the population for which the results are required are
some Irish manufacturing and United Kingdom companies within plastic industry
sector. In order to ensure that the survey was easy to complete, a pilot study was
undertaken in our department with how many participants. During the pilot testing
phase, the average time to complete the on-line survey was about 10 minutes.
In order to ensure that the survey was easy to understand and complete by
respondent. Fig.3.14 shows a snap shot o f the online questioner and Fig.3.15 and
3.16 shows question page and thank page.
F*b Vo** Fgvntw Jodi ftefci BäTijjf
*♦ J ü $ 4* » * * J -_V _> V5 ' _zl - j
SURVEY QUESTIONNAIRE:
Study on the recycling of plastic materialsThe questionnaire is divided into three sections', Section A: Company profile; Section B: Recycling o f
j I plastic matem i l s ; Section C: Marketing and sale o f Recycled products.
All the information will be treated strictly confidential and thank you for your co-operation with this , survey.
(Please note that; this study concerns with plastic rejects arising as a result of scrap or damaged product*, sprues, runners»)
Please answer all questions and then press submit button.
Company name 1
Location I
«JjCw» Hr c o w e r 1
Fig.3.14: Snap shot view o f online survey questionnaire.
This study used the <http://www.response-o-matic.com> website, which is a free
time-saving form processor for html authors who want to add forms to their web
107

Chapter 3: Design of Survey and Experimental Procedure
pages. The link to the survey <http://student.dcu.ie/~elgamml2/> was sent to the
respondents who were asked to complete the questionnaire on-line. Once the
questionnaire was completed, the respondents clicked the submit button. Therefore,
the contents o f the questionnaire forms were directly sent to response-o-matic
processing engine, which sends the answers to a specific email address.
-inixl
" - J <2 .jl l 'l ~Ej
S E C T IO N B: R C Y C L IN G O F P L A S T IC M A T E R IA L S
B I - D o es y o u r co m p an y in v e st ui the recy c lin g o f re je c ts?
r- Yes r NO
B 2- I f y e s , h o w long h as th e co m pany been ca rry in g o u t recyc ling?
<2 years 1 3-5 years ■ 6-9 years 10-15 years >16 years
B3- O n a v e ra g e w h a t p e rce n tag e o f re jec ts co m e from th e p ro c e ss p ro d u c ts o f fow ling y e a rs in y o u r company?Years I 3-5 % 10-15% 16%2001 r r r r r2002 r r __r___ __r r2003 r r r r r2004 - r r r
B 4- A pproxim ately, h o w m any percentage o f rejects co m e from the process o f recycled products?
■I
Fig.3.15: Snapshot view of question page.
£t* P vorles £Doh boto- jù i j j - _» ; • _i -*>•“ an| i *. «*0» MX
LDr E r r r
LLLL
EPS r r 1 r r r r rABS r r r r r r r r rPET r r r <- r- r r r rOther r r r
LLLL
M a n y thanks f o r y o u r p a tien ce ; y o u r kittd co o p eratio n is v e ry m uch a p p r ec ia te d
RE- CONTACT
In ca se w e n eed to get som e further inform ation on the ab ove study, are y ou w illing to b e participate and be contacted again, r Y es NO
It y e s , p lea se sp ecify r E-mail f
r Further questionnaire Interview
Click to submit th* survey j Hotl tntnai |
•JCMr* a --r c ™ -
Fig.3.16: Snapshot view of thank you page.
108
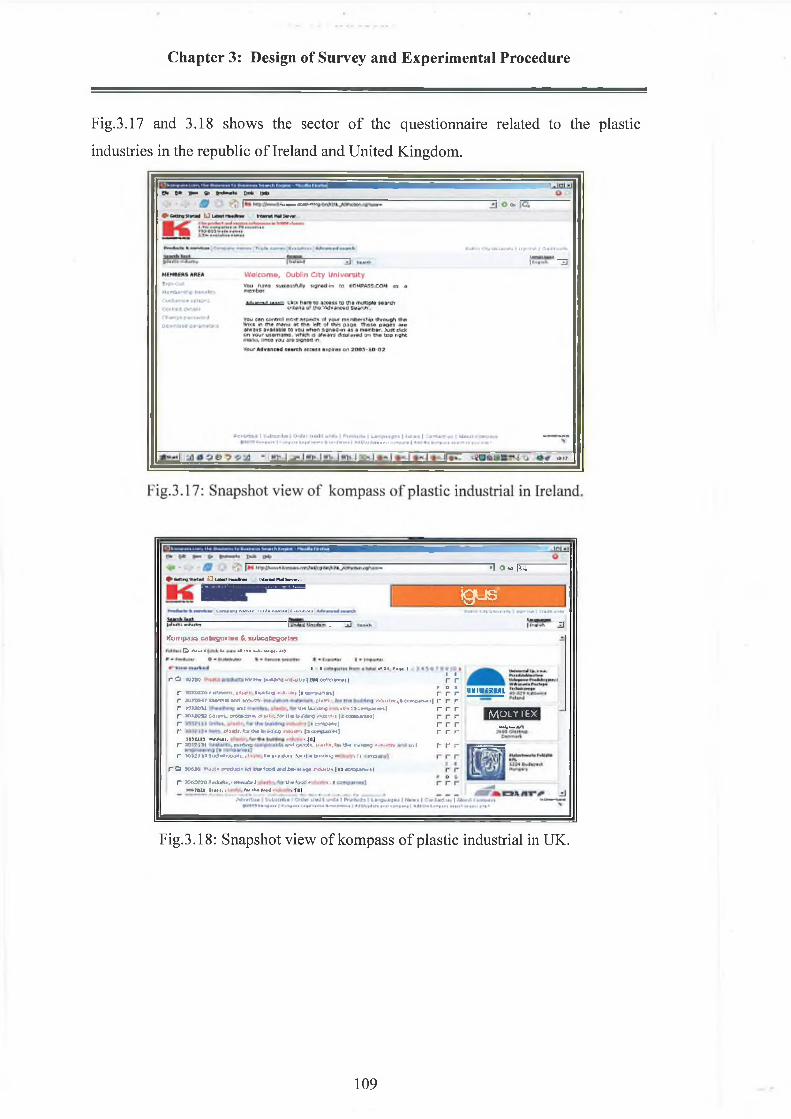
Chapter 3: Design of Survey and Experimental Procedure
Fig.3.17 and 3.18 shows the sector o f the questionnaire related to the plastic
industries in the republic o f Ireland and United Kingdom.
3 o« |cTU u w t l M h l [ r t w K M W
igus•Compas« categorie» & lubcateyonas
O «t.<< w r i Mm l a . m t i . ««)
r û Mno• »
K* On tuMno *ûMVr (I<M tO»T>pirr*i|■<411 »»H *•' I I
r r* o •P *JKOJ3*jiWxtii. »<#V> IMinj r iiitii [| iciT|4nM| f~ f f~r » R M I TDvnri v d m utn: l i t r i : M u 'r« ( lc o r« *M « | t~ T Tr m u m f t v i i * * •£*■■* >-■«* > la icm » * * « « ) r r rr »wi{.n«n,t»ix*»i«1i<»ii .fot»»uii*ig»«ui'it ii(oo«wttt] r r rr ra«Mni| r T Tr r*»«if.fcrii»h#df4 o4atM|iwiipiMii r r r>omn »*♦*•». . ■■■■•• i«ir m»hi »»«»j *vi çw.i. !• »ir*, «« (N im ♦»!'.' .'-n k* r r rr W W l >* l u d N lA V i |i> .> I - f t Ck^i. *0» if • oo'«ww} «V , [• m o *
r O MOMl »Wii« tn A K ti ta iM Iim i v d t w i n if * nituitit |u a n » < n « t|
uNiwiRMiMOLYTEX
“-*»1— M
r JBKWO*«k<0.'MMMlrJ Bwiijoi * . v It•unn h*fl, ; ‘ >V|S4|<*4< I (I)
Fig.3.18: Snapshot view of kompass o f plastic industrial in UK.
109

Chapter 3: Design of Survey and Experimental Procedure
3.14. Experimental Procedure
3.14.1. Introduction
The present research investigates an innovative optimisation of the process input
parameters to produce final products with good quality at minimal cost. In this work,
injection mould machine HM7, was used to produce samples of raw and recycled
polypropylene (PP) plastic materials. Several recycled stages were implemented. The
material properties were evaluated in order to decide which recycling stage could achieve
optimum properties of yield strength (Y) and ultimate tensile strength (UTS). The results
obtained are used to compare the effects of the input process parameters on the output
properties. There procedures used to compare different samples under various different
conditions are outlined in the current chapter. The injection mould facility used in the
current research is a manually controlled continuous process using various input
parameters.
This chapter details the material, equipment and procedures which were used in the
experimental and validation procedures, along with the parameters, the process and the
characterisation equipment implemented the process parameters used in the experimental
research is shown in Fig. 3.19. The injection mould (HM7) is described, along with the
design of mechanical properties tested and analysed using Design of Experimental (DoE).
A calibration test was performed of each recycling stage. In addition, evaluation of the
input process parameters was performed using various measuring equipment. The
procedure used to conduct these measurements is also presented.
In the present research, a detailed formulation was given of the simulation process of the
injection moulding machine and reviews of the input process parameters along with the
resultant property change of the plastic samples. These were conducted though eight tests
in each recycled stage and second exponential at each recycled stage as shown in chapter
six, conducted with the additional percentages of raw PP in the each stage. To optimise
the response y and UTS; the ultimate goal is achieved through optimising the values of
the three input parameters in each recycled stage.
110

Chapter 3: Design of Survey and Experimental Procedure
3.14.2. Description of Injection Moulding HM7
A systematic of the injection-moulding machine, model HM7 used in the present
research, is shown in Fig. 3.20 and 3.21. Table 3.4 shows the performance specifications
for type HM7. This machine is equipped with a standard call-type liquid crystal control
system and a parts feeder for moulding assembly lines using extra small products. This
machine is the smallest-of-its-type. Table-top in-line injection moulding machine exhibits
specific functions such as low-pressure mould closing, variable screw rotation and
continuous hydraulic ejection; permitting its use for trial manufacture, as well as any
other desired use specification to meet production requirements. The specific details of
the above components o f the injection-moulding machine will be described in the
following sections. Fig. 3.22 and 3.23 shows typical mould HM7. And fig. 3.24 illustrates
the barrel and nozzle temperature of the injection-moulding machine.
Fig. 3.19: Equipment and parameters used in the experimental phase of the research.
I l l

Chapter 3: Design of Survey and Experimental Procedure
Gaugatrttne
Iniccncn P an e!ProductsDrop
Un:; Cover
D oor
Screw oii Afea suringM o m t j i o b
Operators Control PanaiF ee d H opper
Fig. 3.20: HM7 injection moulding machine equipment.
Fig. 3.21 : HM7 moulding machine equipment.
112
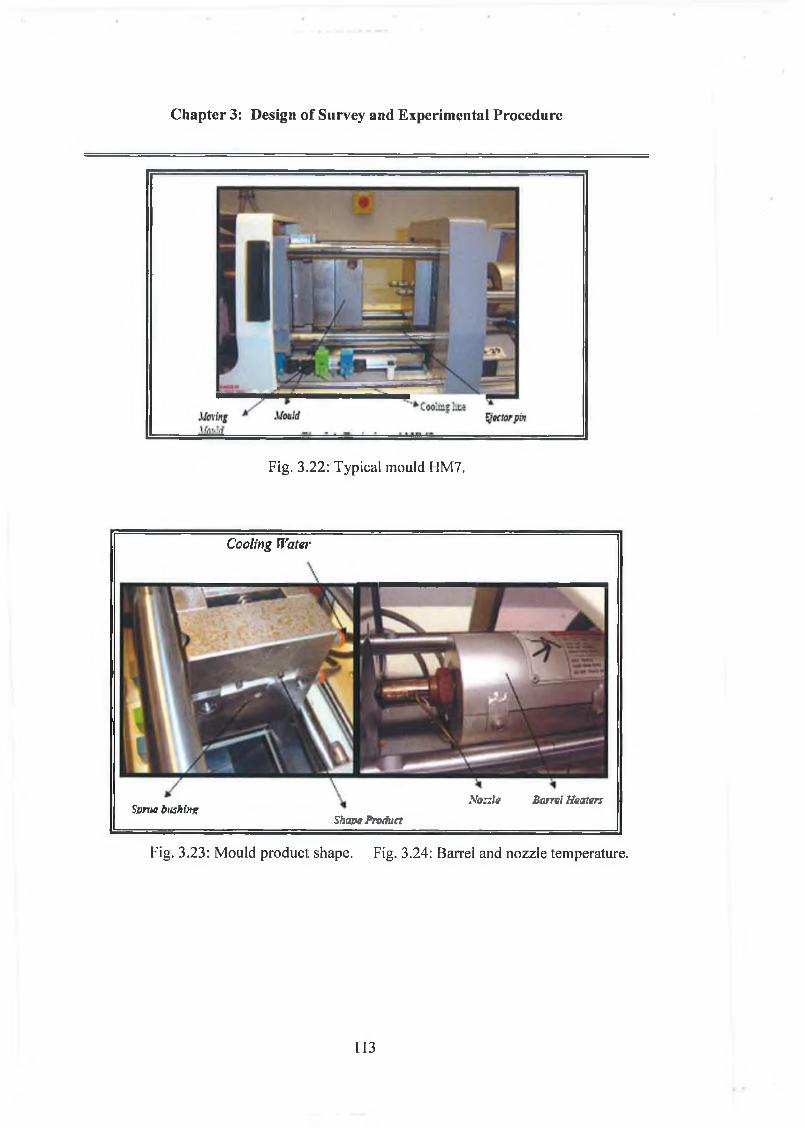
Chapter 3: Design of Survey and Experimental Procedure
Fig. 3.22: Typical mould HM7.
Cooling Water
Some bushingShape Product
Noz:!a Barrel Heater:
Fig. 3.23: Mould product shape. Fig. 3.24: Barrel and nozzle temperature.
113

Chapter 3: Design of Survey and Experimental Procedure
Table 3.4: HM7 mould machine specification
NO Model [Init NO Model Unit
1 . Machine Model HM7 15. Heater capacity-(coil tem) for barrel 760W
2 . Machine weight 280/ k g 16. Nozzle temperature Max
400°C
3.Machine electricity
consumption (Motor- Heater)
1.5 k w/h 0.9/ kw
17. Heater capacity- ( coil tem) for nozzle 70W
4. Oil heraldic price € 2 0 / litter 17 18. Screw Cost €2050
5. Oil temperature 15 °C- 50 °C 19. Nozzle cost €330
6 . Mould thickness 1 1 0 /mm2 0 . Barrel cost 61880
7. Screw diameter 14/mm 2 1 . Maximum line Pressure
13.7 Mpa (140 kgf/cm2 )
8 . Injection capacity 6 .2 /cm3 2 2 . Maximum water pressure
0.98 Mpa (10kgf/ cm2 )
9. Tie bar clearance 1 0 2 x 1 0 2 /mm 23. Voltage current totor -Heater) (400 v-230 v)
1 0 . Clamping stroke 1 1 0 /mm 24, Injection pressure 1785 kg/cm2
1 1 . Pump motor rotated 2 0 kg/cm2 25. Clamping force 7 Tons1 2 . Labour 400 € /Day 26. Min mould thickness 1 1 0 / mm
13. Screw Rotation 30 ,50 and lOOrpm
Cycle Time (sec) 23, 18 and 15 27. Max daylight opening 2 2 0 / mm
14. Barrel temperature max 400°C 28. Mould price € 2 0 0 0
3.14.3. Materials Study and Method Description
3.14.3.1. Method descriptionThe present study used an experimental approach in collecting and analysing data. A
factorial design (FD) and analysis technique using DoE approach through Design Expert
software Ver.7.0 to determine the relationship between the process input parameters and
find product quality. The input parameters were screw rotation, barrel temperature and
114

Chapter 3: Design of Survey and Experimental Procedure
nozzle temperature. DoE techniques were used to evaluate critical responses and identify
the optimum process parameters for improvement in the product quality.
3.14.3.2. Materials preparationThe present research involved raw, first, second and third stage recycling with selected
Polypropylene (PP)-(EP540P). Fig. 3.25 and 3.26 show the raw material PP and recycled
PP, which has been used to produces products by using the injection-moulding machine
HM7. Fig 3.27 shows the tensile sample of PP produced by HM7 machine. Fig.3.28 and
3.29 shows samples of the raw and recycled PP after preparation. In the present research,
grinding of the materials at different stages and moulding of the new products were
tensile tested at each stage. Fig. 3.30 identifies sprue and runner. In the second
experimental stage of this research, mixed raw material with the recycled material PP was
used at different percentages and in optimising the final optimum product quality at
several stages by observing the effects of adding different percentages of raw materials to
produces products with optimum quality.
Fig. 3.25: Raw material PP. Fig. 3.26: Recycled material PP.
115

Chapter 3: Design of Survey and Experimental Procedure
Fig. 3.27: Plastic sample of PP.
II1:1m
i_______________________________
Fig. 3.28: Several recycle samples of plastic material PP, (1) raw material, (2) first recycle, (3) second recycle and (4) third recycle.
JSWWIT-
rFig. 3.29: Third recycle samples. Fig. 3.30: Sprue and runner.

Chapter 3: Design of Survey and Experimental Procedure
3.14.3.3. Sample dimensionThe sample size used in the present research is shown in Fig. 3. 31, outlining the
dimension of the standard specimen sample produced from the injection mould machine
HM7. These dimensions include gauge length (19mm), width (5.9mm) and thickness
(2mm), while the weight of each plastic sample is (0.8g). Fig. 3.32 shows the grinder
machine, which has been used, for grinding samples at different recycling stages. Fig.
3.33 shows the different PP specimens used with different percentages of raw PP.
Fig. 3.31: Schematic diagrams showing the dimensions of the standard subsize tensile specimen.
117

Chapter 3: Design of Survey and Experimental Procedure
Qperanona!Mo:or
Fig. 3.32: Plastic grinder machine.
Fig. 3.33: Several of add percentages raw PP with the recycled material PP, (1) first recycle, (2) second recycle and (3) third recycle.
3.14.3.4. Mechanical properties
3.14.3.4.1. Tensile testingIn the present research, mechanical testing was carried out by using tensile test machine
model “Housfield (HZOK-W)”, tensile test was determine in using speed 40mm/min,
performed at room temperature (20 °C). PP plastic material was recycled to evaluate the raw,
118

Chapter 3: Design of Survey and Experimental Procedure
first, second and a third samples were applied for testing the tensile strength. Fig. 3.34 shows
the tensile machine model housfield (HZOK-W). The yield strength (Y) and ultimate tensile
strength (UTS) were measured as shows Fig. 3.35.
Range of yrr/v a?\d attachment To support tozispecimens
Load ceil- jb rce
?neasuring de\rce
Emergency stop burton
Liquid j t ' crystal Display
M oving beam made from solid steel applies jbrce in tension or compression
Sheet steei paneììing *
Printer R em rt Ktr*Darn entry and menu Select buttons Forward,
reverse and stop buttons
Fig. 3.34: Schematic of tensile machine model housfield (HZOK-W).
strengthtzrrst
Fig. 3.35: Schematic o f stress-strain curve plastic PP.
119

Chapter 3: Design of Survey and Experimental Procedure
3.14.3.5. Pilot testThe ranges of factors have been determined by running a pilot test, at which the factor have
been changed one at a time. An absence of visual defects was the criterion for choosing the
factor ranges. Table 3.5 show the pilot test range of mould process factors. It is
acknowledged that by its nature, the experimental methodology selected to carry out
this fact-finding or collection of information to administer the behaviour of material
affected by the inputs factors to be considered in carrying out sound mould plastic
samples at several stages. Thus, in accordance with standard practice of professional
testing bodies and due to its wide use in research experimental, pilot test experiment is
carefully carried out in this research. The purpose of conducting a pilot test was to test
the samples before embarking on the complete study. A pilot study was made to access
content validity, where few test were administered to leading, which range factor were
administered significant quality such as barrel temperature was using “five level”,
nozzle temperature “five level” and screw rotation “three level”.
Tensile strength data has been collected for each stage, average of four samples was
produced as data reading for each case. Mould temperature was monitored by reading
temperature as assistance response results.
Within the framework of the general principles and guidelines for administrating a
sound experiment, pilot test are a necessary prerequisite. In order to be sure that the
factors ranges are understandable, to get any suggestion for improvement, otherwise
were decided to selecte the factor range in general , which was not found that in
literature review as present research has been used three percentage at each stage with
the PP produced products by HM7. Using FD method, eight sets of main experiments
were applied with a combination of parameters in the first element of experimental
work has been used three factors and two levels, which were expected to identify the
variables having most significant effect on production variables. Considered for the
experimental design (Y) and (UTS), in second element experimental has used four
120

Chapter 3: Design of Survey and Experimental Procedure
factors and three levels has been applied in DoE, with fifty four sets mixture raw
material at different percentages, excepted nozzle temperature was using two level.
Table 3.5: Pilot test of factors using ?y injection moulding.No. Barrel
TemperatureScrew
RotationNozzle
TemperatureMould
TemperatureCycleTime(sec)
PartsSample
1. 270°C 30 rpm 270°C 20°C 23 302. 260°C 100 rpm 260°C 26°C 16.5 303. 225°C 50 rpm 225°C 22°C 18 304. 190°C 30 rpm 190°C 19°C 22 305. 180°C 100 rpm 180°C 25 °C 16 30
FD was applied using three levels and three variables. Each independent variable was
investigated at a high (+1) and a low (1) level. Table 3.6 shows actual and coded values
of the factorial design of the pilot test.
Table 3.6: Actual and coded values o the factorial design of the pilot test by using PP.No. Variable Unit Low level (-1) High level (+1)
1. Barrel Temp °C 180 2702. Screw Rotation RPM 30 1003. Nozzle Temp °C 180 270
Analysis of the pilot test results of the mould products, using HM7 injection mould
indicates that the processing parameters, such as, screw rotation have significant affect on
the resulting time cycle for producing recycled products. Fig. 3.36 shows that a screw
rotation at 100 rpm minimises the product time cycle; a screw rotation at 50rpm has an
increased effect on cycle time while 30 rpm maximizes the cycle time. This suggests that
a screw rotation at (100 rpm) is appropriate range to produce products with minimum
cycle time.
121

Chapter 3: Design of Survey and Experimental Procedure
120
100
1 80 'S 60» 40
-> 20
0Screw Rotation (rpm ) T im e C yc le (sec )
N u m b er o f process
Fig. 3.36: Time cycle of produce mould products by HM7 machine.
Table 3.7 and Table 3.8 show the moulding setting and the percentage of row material
used for the pilot test or to produce 2000 samples in order to obtain recycled material.
Table 3.8 presents the actual values of the variables and their level for each stage for
second experiment. Table 3.9 shows the actual values and level for all variables used in
the factorial design.
Table 3.7: Actual values of the pilot test in the second experiment.NO. Variable Unit Level
1. Barrel Temp °C 2602. Screw Rotation RPM 953. Nozzle Temp °C 150
r"able 3.8: Actual values % of raw PP for the pilot test in the second experiment.No. first stage second stage third stage
% of raw material
Cycle Time (sec)
% of raw material
Cycle Time (sec)
% of raw material
Cycle Time (sec)
1. 10% 15 20% 29 30% 19.62. 20% 11 30% 13 40% 13.33. 30% 16 40% 12.5 50% 11.1
122

Chapter 3: Design of Survey and Experimental Procedure
Table 3.9: Actual values/levels for the variables of the second experiment.Variable Stage/level
1st 2nd 3rd
% of raw material 5-20-35 10-25-40 20-35-50Barrel Temp °C 180, 225 & 270
Screw Rotation rpm 30, 65 & 100Nozzle Temp °C 160 and 270
Fig. 3.37 and 3.38 show several weight samples of each recycling stage. The results were
indifferent with respect to raw and controlled percentage weight products, which
indicated that sample weight has no significant affect on the final recycled product.
Fig. 3 .37: Schematic diagram of several weight samples in each
stage, (1) raw material, (2) first stage.
123

Chapter 3: Design of Survey and Experimental Procedure
Fig. 3 .38: Schematic diagram of several weight samples in each
stage, (1) second stage , (2) third stage.
124

Chapter 3: Design of Survey and Experimental Procedure
3. 15. Chapter Summary
This chapter outlined the overview of research methodologies and a justification for the
selection of appropriate methodologies used in this study to address the objectives of the
research. The chapter starts with an overview of research in general and a description of
research philosophies and a description of certain terms related to research
methodology. The chapter then presented the research methodology chosen that is,
questionnaire survey research, in elaborating the survey questionnaire design and
process, as well as the statistical analytical tools and tests used in this study. It also
described the justification of research method chosen in this study. This is followed by
describing the survey instrument used which covers the survey coverage, method of data
collection, questionnaire design, response scaling and questionnaire content and the
survey process steps including pre-testing and pilot test and main survey.
It also outlined the steps taken to ensure that the general principles and guidelines
according to the standard practice o f professional survey bodies are followed for
administering a sound survey. At the end, this chapter presented an overview of SPSS
software package and the statistical procedures contained in SPSS as well as the test
results, which are used in this study. The research approach and design discussed in this
chapter then are employed to obtain the empirical data, which will be presented in the
chapters - results and discussion. The chapter also describes the rationale behind each
question used in the survey and ends by explaining the scoring system adopted for the
study. Finally presented are discretion methods of online survey.
The next phase of the research work will be the selection of reviewing of the analysis of
the results obtained from the survey, as would be shown in the body of research efforts
reviewed on presentation of the descriptive statistics tool used in SPSS such as,
frequency distributions, cross-tabulations and correlation, analysis as well as the
comparison study between the each recycling stage the result of hypotheses testing is
discussed also, which will be addressed in chapter five.
125

Chapter 3: Design of Survey and Experimental Procedure
Also, the chapter presented an overview of the research equipment and procedures for
the selection o f injection moulding HM7 process parameters used in this study to
address the objectives of the research. The chapter starts with technical specification of
the injection moulding, HM7, and a method description related to the research
methodology. It also described the materials investigated study and sample dimension,
of the plastic materials polypropylene. This is followed by describing the mechanical
properties used which covers the coverage, method of data collection, experimental
design, process steps including pilot test and main experimentally. The chapter then
presented the second research methodology chosen i.e. experimental, in elaborating the
experimental work design and process in each stage, as well as the statistical analytical
tools and tests used in this research.
126

CHAPTER 4 SURVEY RESULTS AND ANALYSIS

Chapter 4: Survey Results and Analysis
4. Survey Results and Analysis
4.1. IntroductionThis chapter covers the analysis of the results obtained from the survey. The main
software used in this task is the Statistical Package for the Social Sciences (SPSS)
version 11.0, which is a data management and analysis product produced by “SPSS”
[1]. SPSS is considered one of the leading statistical software applications. The
integration of the graphics model to the base with excellent interface is just one
example of the status of this software. Also “SPSS” has a command language, which
is very easy to understand [1]. The process parameter input used in the survey would
be used as evidence to carry out applied experimental work to compare and determine
which inputs process parameters affect greatly the quality of recycling plastic
products in each recycle stage. Survey methods have been used in the three recycling
stages and each stage has selected three optional answers. This chapter presents the
survey analysis using statistical and technical methods to provide analysis of data
collection from the plastic industry.
This chapter depicts the results of the survey carried out and their discussions divided
into two main sections; survey results and discussions. In the first section, section 5.2,
the results and analysis of the data from the survey findings on the current
implementation, the stage of used recycled materials, processing methods, process
inputs parameter and the sale of recycled products is presented. It consists of a
presentation of the descriptive statistics, frequency distributions, cross-tabulations and
correlation, analysis as well as the comparison study between the each recycling
stage. In the second section section 5.3, discussions take place that will further
elaborate and evaluate the information from the findings of the results and analysis.
The result of the hypotheses and its testing is discussed in this section also. For each
hypothesis there is a discussion of the empirical findings in order to facilitate the
analysis in relation to the aims of this study.
4.2. Results and Data Analysis of Survey
This study covers the analysis of the results obtained from the survey. To indicate
which input parameters are statistically significant; several statistical tools have been
127

Chapter 4: Survey Results and Analysis
implemented, such as Frequency, Cross -Tabulation and Correlations to analyses data
obtained from the plastic industry and identify which variables are most affected in
the recycling plastic industry.
4.3. Frequency Analyses and Cross -Tabulation
4.3.1. General information
A survey conducted indicates that the majority of companies’ surveyed shows 74%
are local While 7% are mixed and 19 % foreign company (see Fig. 4.1).
100
80
60
40
20
0
Fig. 4.1: Identification of current company ownership.
The results indicated that the majority of companies’ surveyed les then fifty
employees (see Fig. 4.2).
%100
80
60
40
20
0
<50 50-100 100-200 200-500
Number of employees
Fig. 4.2: The number of employees for current recycling companies.
%
Local M ixed Foreign
C om pany ow nership
128

Chapter 4: Survey Results and Analysis
1 £ 5000-9999
€10,000-24,999
I 625,000-49,999
I 650,000+
Num ber o f Y ears
Fig. 4.3 highlights the company spend on staff from 2001 to 2004.
The results presented on Fig. 4.4 indicates that the majority of companies surveyed
are using injection moulding.
%100
80
60
40
20
0
Injection M oulding Extrusion M oulding Blow M oulding
N um ber o f M ethods
Fig. 4.4: The processing methods presented by recycling companies.
Fig. 4.5 indicates that majority of plastic companies (38%) have been in existences
for a period of greater then 16 years, 23% for 6-9 years, 19% for 10-15 years, 12% for
3-5 years and 8 % for les than 2 years.
129

Chapter 4: Survey Results and Analysis
%100
80
60
40
20
0
Fig. 4.5: Number of years of manufacturing for the plastic industry.
Fig. 4.6 shows that 3-5% of companies have a significant percentage of rejects
coming from the processed products for the following years.
<2 3-5 Years 6-9 Years 10-15 Years > 16
Number o f years on the plastic industry
2001 2002 2003 2004
N u m b e r o f Y e a r s u se d re c y c lin g
H<2 %■ 3-5 %
□ 6 -9 %
□ 10-15%
■ >16%
Fig. 4.6: The average percentage of rejects on an annual basis.
4.3.2. Stage of used recycled materials
The survey indicates that the majority of companies’ surveyed shows that 89% are
using recycled materials, while 11% are not (see Fig. 4.7).
130

Chapter 4: Survey Results and Analysis
Fig. 4.7: Implementation of recycling of plastic materials within industry.
Fig. 4.8 shows that the 63% of companies have used first stage recycling in their
plant 24% are planning to use second stage recycling, while 8 % of companies already
use third stage recycling in their plants and 5% are using additional stages of
recycling in their process.
Frst Recycling Second Recycling Third Recycling Futuer StageRecyling
R ecycling S tag e
Fig. 4.8: Stages of recycling.
Table 5.1 shows the findings relating to the rejects, which result from the different
recycling stages. The majority of rejects come from first recycling stage and this
result indicates that companies have main use for the first recycling stage.
131

Chapter 4: Survey Results and Analysis
Table 4.1: The percentages by Cross -Tabulation of rejects, which come from process producing less than2 0 0 tonnes in the different recycling stages.
Approximately ,what Percentage of rejects
Come from the process of recycled products
How many time does your company recycle the plastic materials Total
FirstRecycling
SecondRecycling
ThirdRecycling
<2 % 36.1% 9.5% 9.5% 57.1%3-5% 23.6% NB NB 23.8%6-9% 48% NB NB 4.8%
10-15% 14.3% NB NB 14.3%Total 81% 9.5% 9.5% 1 0 0 %
Table 4.2 shows the findings of reduced process costs in the recycling process. The
majority of companies (76.2%) surveyed used recycling of rejects of the years 2001.
Table 4.2: The percentages of reduced process costs from 2001-2004.
Does your company invest
in the recycling of rejects
leduce process costTotal
2 0 0 1 2 0 0 2 2003 2004
Yes 76.2% 4.6% 4.8% 4.8% 90.5%No 4.8% 4.7% NB NB 9.5%
Total 81% 9.3% 4.8% 4.8% 1 0 0 %
Table 4.3 shows the findings of maximum profits obtained as a result of 4 years the
recycling process. The majority of companies surveyed (75%) maximized profits in
2001 .
Table 4.3: The percentages Cross -Tabulation of maximizes profits
from 2001-2004.
Does your company invest
in the recycling of rejects
Maximizes profits
Total2 0 0 1 2 0 0 2 2003 2004
Yes 75% 5% 1 0 % 5% 95%No 5% NB NB NB 5%
Total 80% 5% 1 0 % 5% 1 0 0 %
1 3 2

Chapter 4: Survey Results and Analysis
4.3.3. Inputs process parameters
4.3.3.1. External processThe results reviewed recycling to the external process conducted for the moulding
process used within plastics companies, highlights that process parameters and
personal skill were the major factors affecting the quality of the products at different
stage. As presented in the figures bellow. Figs 5.10 to 5.12 graphically illustrates
these representatives:
a) Fig 5.10 factor attesting first-stage recycling.
b) Fig 5.11 factor attesting second-stage recycling.
c) Fig 5.12 factor attesting third-stage recycling.
%100
80604020
0
PP PS PVC HDPE LDPE Eps Abs PET other
N u m b er o f M aterial
131 Process
■ Materials
□ Personnel skill
Fig. 4.10: First stag.
% 1 0 0
80
£ 60
3 40^ 20
111 Process
■ Materials
□ Personnel skill
PP PS PVC HDPE LDPE Eps Abs PET other
N u m b e r o f M a te r ia l
Fig. 4.11: Second recycle.
%1 0 0
80CM£ 60
« 40u<20
0 1 d i
S Process
■ Materials
□ Personnel skill
PP PS PVC HDPE LDPE Eps
N u m b e r o f M a te r ia l
Abs PET other
F ig . 4 .1 2 : T h i r d r e c y c le .
133

Chapter 4: Survey Results and Analysis
4.3.3.2. Internal processThe results reviewed relating to the internal process conducted for the moulding
process used within plastics companies, indicated that process parameters; such as
screw rotation, barrel temperature and nozzle temperature had major affect on the
quality of the products at different recycling stage. These results are shown in Fig.
4.13.
100
80
60
40
20
0
Fig. 4.13: Internal parameters affecting the mould process.
The survey conducted also indicates that the majority of companies’ surveyed stated
that screw rotation and barrel temperature passed the greatest effect on the recycled
materials at different recycling stage. This is presented in Fig 5.14-5.16.
%
PP PS PVC HDPE LDPE Eps Abs PET other
N u m b e r o f M aterial
Fig. 4.14: The effect of the inputs process parameters on the first recycling stage.
%
N um ber o f param eters
134

Chapter 4: Survey Results and Analysis
SI Screw Rotation
■ Barrel Temp
□ N ozzle Temp
□ M ould Temp
Fig. 4.15: The effect of the inputs process parameters on the second recycling stage.
% e * 0 0
z 80E2 60
I 40 &Vg 20 u
PP PS PVC HDPE LDPE Eps Abs PET other
Number o f Material
Fig. 4.16: The effect of frequency of the inputs process parameters on the third stage.
4.3.3.3. Quality of recycled products
The results indicate that the majority of plastic companies’ surveyed show that the
quality of plastic materials is affected at different stages. These results are presented
in Figs 5.17 to 5.19.
• First Recycling
The results indicate that the majority of plastic materials do no change their quality
after the first recycling stage (see Fig. 4.17).
13 Screw Rotation
■ Barrel Temp
□ Nozzle Temp
□ M ould Temp
% „ 100 UQJ■S 80 E2 60
S' 40*3ug 20
£ o 1 1 1 lull 1 1PP PS PVC HDPE LDPE Eps Abs PET other
Num ber o f Material
135

Chapter 4: Survey Results and Analysis
II Increases Quality
■ Decreases Quality
□ No changeQuality
PP PS PVC HDPE LDPE Eps A bs PET other
N um ber of M ate ria ls
Fig. 4.17: First recycle.
• Second Recycling
The analysis of second recycling indicates that the majority of the quality in plastic
materials decreases (see Fig. 4.18).
% 100
80
£ 60 «£ 40
200
Fig. 4.18: Second recycle.
11111111 IPP PS PVC HDPE LDPE Eps Abs PET other
N u m b er o f M ateria l
IH Increases Quality
■ Decreases Quality
□ No changeQuality
80
60i
wO 40
20
0 ■ i r i i l i ■
• Third Recycling
The results indicate that the majority of the quality in plastic materials decreases after
the third recycling (see Fig. 4.19).
%100
80
I* 606 40
20
0
PP PS PVC HDPE LDPE Eps Abs PET other
Number ofiVIaterals
F ig . 4 .1 9 : T h i r d r e c y c le .
II 1 I
I fE Increases Quality |
■ Decreases Quality □ No changeQuality
1 3 6
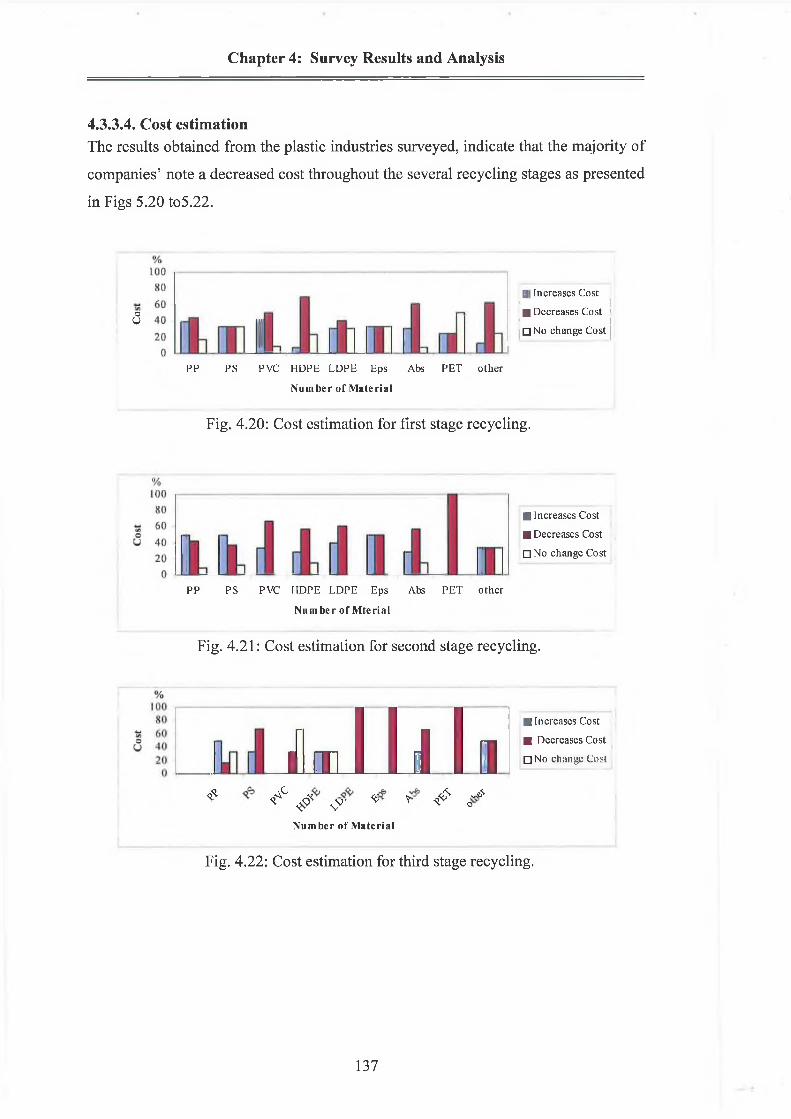
Chapter 4: Survey Results and Analysis
4.3.3.4. Cost estimationThe results obtained from the plastic industries surveyed, indicate that the majority of
companies’ note a decreased cost throughout the several recycling stages as presented
in Figs 5.20 to5.22.
oU
B Increases Cost
■ D ecreases Cost
□ N o change Cost
P P PS PVC H D PE LD PE Eps Abs PET o th e r
N u m b e r o f M a te r ia l
Fig. 4.20: Cost estimation for first stage recycling.
■ Increases Cost
■ D ecreases Cost
□ No change Cost
P P PS PVC H D PE LD PE E ps Abs P E T o th e r
N um b e r o f M te r ia l
Fig. 4.21: Cost estimation for second stage recycling.
JÌ m fl 1 1 1 03■ Increases Cost
■ D ecreases Cost
□ No chungc Cost
<£ 4 ° < 5 „eS^ ^ sX ^ ^ ^ °
N u m b e r o f M a te r ia l
Fig. 4.22: Cost estimation for third stage recycling.
137

Chapter 4: Survey Results and Analysis
4.3.4. Sale of recycled product
4.3.4.1. Involved in the sale of recycled productsThe results indicate that 58% of the companies surveyed sell recycled products where
as 42%, do not. Fig. 4.23 shows the percentage sale of recycled plastic products.
Fig. 4.23: Percentage sale of recycled plastic.
Fig. 4.24 indicates that 14% of the companies surveyed sell recycled plastic products
for less than 2 years, 21% since 3-5 years, 22% since 6-9 years, 14% since 10-15
years, and more than 29% have sold recycled plastic products for more than 16 years.
<2 3-5 Years 6-9 Years 10-15 Years >16
Num ber o f years
Fig. 4.24: Number of years used on the sell of recycling plastic.
138

Chapter 4: Survey Results and Analysis
Table 4.4 shows the findings of the sale of the recycled products. Local ownerships
majority of (75%) accounts for the companies selling recycled products.
Table 4.4: The percentages Cross -Tabulation of the sale of recycled products withrespect/regards company ownership.
OwnershipDoes your company sell
recycled products TotalYes No
Local 44.5 % 30.5% 75%Mixed 8.3% NB 8.3%Foreign 5.2% 11.5% 16.7%Total 58% 42% 1 0 0 %
Table 4.5 shows the percentages by Cross -Tabulation of the sale of recycled
products and also years operating recycling methods. It can be clearly noticed that the
majority of the companies surveyed have been selling products recycled for 21 to 30
years.
Table 4.5: The percentages Cross -Tabulation of the sale of recycled products withinmanufacturing p astic companies.
How many years has your companyDoes your cc
recycledjmpany sell Droducts Total
been manufacturing plastic products Yes No
<5 NB 4.2 % 4.2 %6-9 years 2 0 % 9% 29%
1 0 - 2 0 years 17% 8 % 25%21-30 years 2 1 % 12.3 % 33.3%>30 years NB 8.5% 8.5%
Total 58% 42% 1 0 0 %
Table 4.6 shows the information gathered interpreting the profits coming from the
sale of recycling materials. The majority of companies surveyed obtained 2% of their
profits over the years of though selling recycled materials and 5% of profits for
companies operating greater than 16 years.
139

Chapter 4: Survey Results and Analysis
Table 4.6: The percentages Cross -Tabulation of profits to results the sale of recycled _________________ _________products.________________ _________
If yes, how long has the company been
involved in the sale
On average what percentag come from the sale of recyc
e of profits ed products Total
2 % 5% 1 0 %
<2 Years 14.3% NB NB 14.3%3-5 Years 14.3% 7.1% NB 21.4%6-9 Years 14.3% 7.1% NB 21.4%10-15 Years 7.1% 7.1% NB 14.3%> 16 Years 7.1% 14.3% 7.1% 26.6%
Total 57.1% 35.7% 7.1% 1 0 0 %
Fig. 4.25 indicates that the sale of recycled plastic products materials increased in
2 0 0 1 for all various plastic materials and products.
%100
8060
4020
I Increase
I Decrease
PP PS PVC H D PE L D P E E ps Abs P ET other
N u m b e r o f M a te r ia l
Fig. 4.25: The trend for sale of plastic recycled products in 2001.
Fig. 4.26 indicates that the sales of various recycled of plastic material products
increased in the 2 0 0 2 .
%
kI Increase
I Decrease
Abs P E T other
N u m b e r o f M a te r ia l
Fig. 4 .26: The trend for sale of plastic recycled products in 2002.
140

Chapter 4: Survey Results and Analysis
Fig. 4.27 indicates that the sales of the majority of various recycled plastic materials
products decreased in the 2003.
%100
80 „ 60
£ 4020
0 0 1 j J□ Incrcnse
■ Decrease
P P PS PVC H D PE L D PE E ps Abs P E T o th e r
N um ber o f M aterial
Fig. 4.27: The trend for sale of plastic recycled products in 2003.
The results indicate that the sale of recycled plastic materials products decreased
again for the year 2004. Fig. 4.28 shows the sale of recycled plastic parts in 2004.
% 100
80
a* 60'aon 40
20
0
I Increase
I Decrease
PP PS PVC HDPE LDPE Eps Abs PET other
N um ber o f Material
Fig. 4.28: The trend for sale of plastic recycled products in 2004.
4.3.4.2. Price of recycled products
The results indicate that the majority of recycled plastic materials products are set to a
medium price during the first to second, while third stage recycled products are set to
a low price as presented in Figs 5.29 to5.31.
141

Chapter 4: Survey Results and Analysis
■ L ow Price
■ M edium Price
□ H igh P rice
PP P S PVC H D PE L D PE E ps Abs P E T o th e r
Number o f Material
Fig. 4.29: Price of plastic recycled products produced from first stage recycling.
■ LowPrice
■ Medium Price
□ High Price
PP PS PVC HDPE LDPE Eps Abs PET other
Number o f M aterial
Fig. 4.30: Price of plastic recycled products produced from second stage recycling.
%100 80
g 60
£ 40
20 0 h m
□ LowPrice
! ■ M edium Price
□ High P rice
PP PS PVC H D PE LD PE E ps Abs P E T o th e r
N um ber o f M aterial
Fig. 4.31: Price of plastic recycled products produced from third stage recycling.
142

Chapter 4: Survey Results and Analysis
4.4. Results and Discussions of Survey Results
4.4.1. Testing hypothesis
This study has provided information on the implementation of recycled plastic
materials and it’s marketing of plastic industry in both countries. Statistics from the
survey have shown factors, which have an effect on the product quality. The survey
has also shown several stages, which have an effect on the marketing and price of
recycled product.
This section further elaborates and evaluates the information from the results
reported in the previous sections. It consists of data interpretation and evaluation
from the descriptive statistics, frequency distributions, cross-tabulations and
correlations, analysis as well as the comparison from both quality and sell of
recycled products at each recycle stage. The statistical analysis was carried out using
SPSS software to determine the correlation between the variables (Xi, X2 and X 3 ),
with the (Y), as the depended variable of the study, where: (Xi quality product, X2
inputs process parameters, X3 sell of recycled products and Y recycle process), as
well as the significant of the independent variables on the dependent variable by
using ANOVA test. Finally the research model will be presented by a regression
equation by using DoE software and analysis by the ANOVA test at each recycle
stage. As for the hypotheses testing, for each hypothesis there is a discussion of the
empirical results in order to facilitate the analysis in relation to the aims of this study.
Research hypothesis are presented below:
• Hypothesis 1
Ho: There was no significant relationship between recycled process and quality o f
the products at each recycling stage.
Hi: There was significant relationship between recycled process and quality o f the
products at each recycling stage.
143

Chapter 4: Survey Results and Analysis
• Hypothesis 2
H q: Input process param eters have no interaction effect on the quality products at
each recycling stage.
H 2: Input process param eters have interaction effect on the quality products at each
recycling stage.
• Hypothesis 3
H q: There was no significant relationship between sells o f recycled products and
recycles perform ance products at each recycling stage.
Hj: There was significant relationships between sell o f recycled products and recycle
performance products at each recycling stage.
4.4.2. Company background
The results of the sample survey, as shown above in Fig. 4.1 demonstrate that 74 %
of the respondents are local business companies and they are using first recycling
stage only. Also, the results of the analyses of cross -tabulation show that these local
companies are selling products produced by first recycled material. On the other
hand, most of the companies in both countries have less than 50 employees as shown
in Fig. 4.2. Also Fig.5.3 shows that the human resource development is a vital
component in human resource management. Furthermore, the survey consists of a
question, which analyzes the companies training policy. For both countries, the
results of the survey prove that recycling business companies usually spend on
human training between €1 and € 4999. It was found that the major obstacle is the
lack of competencies technicians’ skill. A high investment in training and
development can lead to more effective and utilized high technology and higher skill
levels.
This statement is supported by the result of the correlation analysis, which indicates
the positive relationship between training planning and numbers of employees as
presented in Appendix B. It can be noted that the training staff are the most
144

Chapter 4: Survey Results and Analysis
appropriate and efficient approaches for the skilled personnel to increase their
knowledge and competencies in performing the recycled process.
Three different types of moulded products used in plastic companies. The frequency
results show that the majority of companies surveyed are using injection-moulding
process. In terms of the number of years in operation, the comparison between two
countries shows that the majority of the respondents in Ireland and UK have been in
plastic business for more thanl6 years as shown in Fig. 4.5. The results indicate that
the main benefits occurred from the implementation of the recycling process as the
majority of responded results indicate is maximizes sales and profits as presented in
Appendix B.
4.4.3. Quality of the recycled products
The majority of plastics companies using the first and second recycling stages only
as shown in Fig. 4.8. The third recycling stage is not often used due to the decrease
in the product quality it can be recommended to avoid to use third recycling stage
unless raw material is being added to improve the quality. For that, the first
hypothesis (HI) was formulated to address this aspect, and will be tested as follows:
■ Testing Hypothesis 1:
Hypothesis Hi: There was significant relationship between recycled process
and quality o f products at each recycling stage.
From the results, the recycling phases could be classified into three stages: First
recycle stage, which are quite extensively used. Second and third recycled which are
quite moderately used
To test this hypothesis, a relationship between the products quality (X|) and recycle
process (Y) at each stage was examined using correlation and frequency analysis
techniques, for this hypothesis there is a discussion of the empirical findings in order
to using survey question such as B13, The frequency analysis indicate that the
quality of the recycled products were decreased from first stage to third stage. As
reported in Figs. 5.17 to 5.19.
145

Chapter 4: Survey Results and Analysis
• In this research, correlation were analysed between two variables products quality
and recycling process for each stage. The results indicate that the correlation -
coefficient in first stage was statistically significant for this stage. For the second
and third stages were statistically not significant as presented in Appendix B.
• To analyse the quality performance versus the product cost, Figs. 5.20 to 5.22 show
that the first stage for PP has less cost, while, the second and the third stages have
higher cost. The corr-coefficient for the third stage is statistically significant with a
positive relationship, as presented in Appendix B.
• On the other hand, to analyse the quality performance versus the productivity, the
frequency results indicated that the majority of plastic materials such as PP, PS,
PVC, etc have high productivity in the first and second stages and no change in the
productivity in third stage as presented in Appendix B.
Therefore, the first hypothesis (Hi) is accepted and (Ho) refused. The results and
correlation matrix shows that there was a high relationship between X[ and
dependent variable Y. The hypothesis (H2) was formulated to address this aspect and
will be tested as follows:
■ Testing Hypothesis 2:
Hypothesis H2: Inputs process parameters have interaction effect on the products
quality at each recycling stage.
To test this hypothesis, a relationship between the inputs process parameters (X2) and
product quality (Xj) at each stage, was examined using frequency analysis. The
frequency results shown that the barrel temperature and screw rotation have highly
significant effects on the final product quality, as shown in Figs. 5.14 to 5.16.
Therefore, the second hypothesis (H2) is accepted and refused (Ho). The results and
correlation matrix show that there was relationship between Xi and independent
variable X2.
1 4 6

Chapter 4: Survey Results and Analysis
4.4.4. Selling of recycled products
The results indicate that the majority of company surveyed have been sold of
recycled products over 16 years. The results indicate that the third stage has low
price, and they recommend to reject it. While, the first and second stage have
medium price and this demonstrates that the first and second stages have effective
marketing.
Furthermore, cross -tabulation results show the sale profits of recycled products have
2 %. The result shows significant relation and viable affect between recycled
processes and sale products in each stage. In order to examine the hypothesis (H3), it
was formulated and will be tested as follows:
■ Testing Hypothesis 3:
Hypothesis H3: There was significant relationship between sell recycled
products and recycle performance products at each
recycling stage.
To test this hypothesis, a relationship between the sell-recycled products (X3 ) and
recycle process (Y) was examined using correlation techniques and frequency
analysis in the research survey. The survey questions C4, C6 were used to exam the
hypothesis (H3), the results indicate that there is a significant relations between
recycle and selling of recycled products in each stage. The correlation analysis
between two variables recycle and competitive were tested. The corr-coefficient was
positive relation, which means a statistically significant, as presented in refer
Appendix B. Therefore, the third hypothesis (H3) is accepted and refused (H0). The
results and correlation matrix shows that there was a high relationship between X3
and dependent variable Y.
147

Chapter 4: Survey Results and Analysis
4.6. Chapter Summary
This chapter has reported and analysed the results obtained from survey in Republic
of Ireland and UK for plastic companies. This chapter also identified several
statistically techniques to analyse the different hypothesises. It presents also
discussions on the information from the results from the descriptive statistics.
À discussion on the general questions and also the analysis of the results in this
chapter would help as a guide in the experimental work. Finally, based on the results
and discussions, it summarizes the key findings related to the recycle practice and
approaches, which linked to the development of products quality.
148

CHAPTER 5 EXPERIMENTAL DESIGN
Chapter 5: Experimental Design
5. Experimental Design results
5.1. IntroductionDesigns of Experiment (DoE) have been utilized in many disciplines such as biological,
pharmaceutical, engineering etc. In the last two decades, the use of DoE has grown
rapidly and been customized for many process in industry such as machining, chcmical
mixing and recycle to find out the optimal conditions. This chapter provides details on
the results of experimental design that been provide by Design-Expert software V7.
Also, the desirability approach was used in conjunction with FD to find out the optimal
combination of the recycling process parameters to achieve the required recycle quality
at low cost. In addition percentages of raw material has been investigated of the recycled
joints in order to study the effect of injection mould conditions on the mechanical
properties namely, yield strength (Y) and ultimate tensile strength (UTS) for three
recycling stages. In this chapter, detailed information was given on factorial design (FD)
and the selection of the inputs process parameters along with the resulted properties of
the PP plastic samples during the eight sets of main experiments.
5.2. Experimental design and data analysis
In this research, factorial design has been used to study the effects of each processing
parameter on the mechanical properties. Injection-moulding machine HM7 was used to
produce the specimens. The experimental data tests were analyzed using statistical
software. Three parameters at two levels were selected. The process parameters are
screw rotation rate (S), barrel temperature (B) and nozzle temperature (N), the
investigation was carried out in order to determine which process parameters would
affect the material properties after the injection-moulding process.
149

Chapter 5: Experimental Design
5.2.1. Factorial design
Factorial design is one of the optimisation techniques currently in widespread usage to
describe the performance of the recycling process and find the optimum of the responses
of interest. FD is a set of mathematical and statistical techniques that are useful for
modelling and predicting the response of interest affected by several inputs variables
with the aim of optimising this response [185]. This approach was applied to optimise
the mould process. The two-level factorial part of the design consists of all possible
combinations of the +1 and -1 levels of the factors. For the two factors case there are
four design points: (-1,-1) (+1,-1) (-1, +1) (+1, +1) as shown in Fig. 5.1. In general, the number of factorial points is equal to 2k Three factors were investigated; the melting
temperature, nozzle temperature and screw rotation the design contains eight
experiments and fifty four as shown in tables below; the performance of the synthesis
was evaluated by analysing two responses; (Y, UTS). In this work the essential process
factors were determined from the past literatures. Design-Experimental V7 software
was used to code the data, develop the design matrix and analyse the case , the limits for
each factor were coded via this relationship; Xi = 2(2x - (X max + X mm))/ (X m ax X m in ).
Where: Xi is the required coded value, X is any value of the factor which wanted to be
coded and X max, X 1Tnn are the upper and lower limit of the factor being coded
respectively.
In this study the tensile strength and yield strength were evaluated for all the setting.
Finally the results were compared with the tensile strength of the raw material. Fig. 5.2
shows a flowchart for the analysis steps. DoE techniques were used to evaluate
responses and identify the optimum process inputs parameters and to make suggestions
for improvement in this study.
Statistical analyses are extremely important to study basic mechanisms in complex
situations, thus providing better process control and understanding. The main objective
of FD is to determine the optimum operational conditions for the system or to determine
150

Chapter 5: Experimental Design
a region that satisfies the operating specifications. In this study, the effect of eight
experiment and fifty-four process parameters was examined with the aid of experimental
design in the presence of nutrients feeding. Regression analysis and the statistical
analysis of main and interaction effects were quantified by analysis of variance
(ANOVA). To optimise the response (Y) and (UTS), it is necessary to find an
appropriate approximation for the true functional relationship between the independent
variables and the responses. A second order polynomial model shown in Eq 5.1 was
used to describe the relationships between responses and experimental factors.
i±j±kY = b 0 + X h >X i + X b HX iX i + X b iikX i X i X k
i= \
(5.1)
Where y is the response, bo is the constant coefficient, Xi, Xj and Xk are the variables, b,s
are the linear coefficients, by are interaction coefficients and b^ is the three-interaction
coefficient. This polynomial model was fitted to the two responses. The value of the
coefficients can be calculated using regression analysis.
151

Chapter 5: Experimental Design
6 8
Fig. 5.1: A 2* two-level, full factorial design; factors XI, X2, X3 [185].
152

Chapter 5: Experimental Design
Inputs Data
Design-Expert V7
Factorial Design Selected
ModelInsignificant
Model Significant
Presentation o f
Optimisation of Results
StatisticalAnalyses
Raw M aterials1
ANOVA -------------- ► First MaterialsAnalysis Second Materials
Third Materials
Predicted vs.
Interaction Graph
C ontour an d 3D
Perturbation
Fig. 5.2: Flowchart shows the building and using the factorial design
model.
153

Chapter 5: Experimental Design
5.2.1.2. Development of the mathematical model
The functional relationship representing any response of interest can be expressed as
y = /(A , B, C and D) and Eq .5.2 becomes as follows.
Y= b/A+ b2B + b C + bi2AB + baAC + b2iBC + bi23ABC (5.2)
5.2.1.3. Testing the adequacy of the models developed
The analysis of variance (ANOVA) was used to test the adequacy of the models
developed. The statistical significance of the models developed and each term in the
egression equation were examined using the sequential F-test, and other adequacy
measures (i. e. R2 Adj- R2, Ped.R2 and Adeq precision ratio). The Prob>F (sometimes it
called P-value) of the model and of each term in the model can be computed by means
of ANOVA. If the Prob>F of the model and of each term in the model does not exceed
the level of significance (say a = 0.05) then the model may be considered adequate
within the confidence interval of (1- a). Table 5.1 below is a summary of the ANOVA
table.
154

Chapter 5: Experimental Design
Table 5.1: ANOVA table for full model:
Source SS df MS Fcai - Value p-value or Prob > F
Model SSm P
Each SS divided by its df
Each MS divided by
MSe '
From table or software
library
A SS, 1
B SS2 IC s s 3 1
AB SS. 2 1
AC SS,3 1
BC s s 23 1
ABC s s 123 1
Residual s s R N-p-1 -Cor Total SST N - 1 - - -
Where:P: Number of coefficients in the modelN: Total number of runsSS: Sum of squaresdf: Degree of freedomMS: Mean square
5.2.1.4. Development of the final reduced model
The model contains only the significant terms and the terms that are necessary to
maintain hierarch. Also, a reduced quadratic ANOVA table can be produced.
5.2.1.5. Post analysis
When the final model has been tested and checked and found to be adequate, then the
response at any midpoints can be predicted using this adequate model. Also, producing
some important plots, such as 3D graphs, contours and perturbation plots, to present the
factors effect and how they contribute to the response. Moreover it is now possible to
employ the developed model to find the mould setting at which the process could be
optimized.
155

C h a p t e r 5 : E x p e r i m e n t a l D e s ig n
5.2.2. Optimisation
5.2.2.1. Desirability approach
There are many statistical techniques for solving multiple response problem, such
overlaying the contours plots for each response, constrained optimisation problem and
desirability approach. The common statistical software packages, such as SPSS,
NEMROD and Design-Expert, include a multiple response optimisation techniques. The
desirability method is recommended due to its simplicity, availability in the software and
it’s also provides flexibility in recycling and giving importance to individual responses.
Solving such multiple response optimisation problems using this technique consists of
using a technique for combining multiple responses into a dimensionless measure of
performance called the overall desirability function.
5. 2.2. 2. Optimization approach in Design-Expert software
The optimisation part in Design-expert software V7 searches for a combination of factor
levels that simultaneously satisfy the requirements placed (i.e. optimisation criteria) on
each one of the responses and process factors (i.e. multiple response optimisation).
Numerical and graphical optimisation methods were used in this work by choosing the
desired goals for each factor and response. The numerical optimisation feature in the
design expert software packages finds appoint or more in the factors domain that would
maximize this objective function. In a graphical optimisation with multiple responses,
the software defines regions where requirements simultaneously meet the proposed
criteria. Superimposing or overlaying critical response contours on a contour plot. Then,
a visual search for best compromise becomes possible. In the case of dealing with many
responses, it is recommended to do numerical optimisation first; otherwise it could be
impossible to uncover a feasible region. The graphical optimisation displays the area of
feasible response values in the factor space. Regions that do not fit the optimisation
156

Chapter 5: Experimental Design
criteria are shaded [186]. Fig. 5.3 shows flow chart of the optimisation steps in the
design-expert software.
Fig. 5.3: Flowchart shows the optimisation steps [187],
157

Chapter 5: Experimental Design
5.3 Results and discussion
In this chapter, the experimental design used, the range of each process parameters and
experimental layout are presented for each recycling stage. This chapter also shows the
results for all the stages investigated in this work, in terms of ANOVA analysis of each
response, and the validation experiments. The effects of process parameters on each
response are described and discussed. Further, the results of the operating cost are
illustrated and discussed to distinguish the effects of the process parameters on the cost
estimation at each stage. All the variables used in this research with ANOVA table were
abbreviated as follows:
A= Barrel Temp
B= Screw Rotation
C= Nozzle Temp
AB= Barrel Temp * Screw Rotation
AC= Barrel Temp * Nozzle Temp
ABC= Barrel Temp * Screw Rotation * Nozzle Temp
5.4. Recycling process with no mixture of raw material PP
These experiments were carried out without addition of raw material PP, the design
levels, input variables and experimental design levels used for this material in each stage
are shown in table below. The yield strengths were measured as quality criteria for the
different injection mould conditions in order to identify which factors are having
significant effects on the Y. Three mathematical models were developed successfully to
predict the responses as follows:
158

Chapter 5: Experimental Design
5.4.1. Development of raw material PP
In this stage, the experiment was designed based on three process factors A,B,C and
two levels to working range of each variable. Table 5.2 shows the mould inputs
variables and experimental design levels used for this stage. The experiment was carried
out according to the design matrix of the FD method. Eight sets of experiments were
performed and the mechanical properties were measured for each experiment. Table 5.3
shows the experiment layout and the measured responses. For this stage the
mathematical models were developed successfully to predict the following response;
yield strength (Y). The percentages of reduction in the yield strength were measured for
each experiment by using Eq .5.3 to come up with an idea about how good is the
number of recycling stage is and there impact on the quality of the final product.
% = ^ —^ x l0 0 (5.3)A
Where:
%: percentage of reduction in the yield strength.
A: Expected value
E: Measured value
159

Chapter 5: Experimental Design
Table 5.2: Actual and coded values of the three factors.
Code Variables Unit
Low level
(-D
High level
(+1)
A Barrel Temp °C 180 270
B Screw Rotation RPM 30 100
C N o zzle Temp °C 160 270
Table 5.3: The experiment layout and the measured responses.
Exp.
No.
Run
Factors Responses
A: Barrel
Temp
°C
B: Screw
Rotation,
(rpm)
C: Nozzle Temp
°C(y) Raw
MPa%
of reduced
1 17 180 30 160 30.89 0.35
2 5 270 30 160 29.4 5.44
3 15 180 100 160 29.6 4.72
4 4 270 100 160 28.2 9.92
5 16 180 30 270 3 1 .56 -1.77
6 8 270 30 270 29.83 3.92
7 18 180 100 270 29.83 3.92
8 19 270 100 270 29.77 4 .13
5.4.1.1. Effects of A, B and C on the % of reduction in Y of the raw PP
Fig 5.4 shows the cycle time in eight sets of raw material PP. The results indicated that
the screw rotation at 1 0 0 rpm were appears effectible to produced samples within less
time than 65 and 30 rpm for example barrel temperature at 180 °C, screw rotation 100
rpm and nozzle temperature 160 °C. Which were appears effectives and economically
for this range. Table 5.4 presents the ANOVA results for the parentage of reduction of
the yield strength of the raw material. It indicates that the response can be described well
by polynomial models with a good coefficient of determination (R2). In this research the
main three process factors effect of (A, B and C), two interaction effects of (AB) and
160

Chapter 5: Experimental Design
(AC), were significant model terms. It is evident from Table 5.4 that the model is
significant since the “Prob>F” is less than 0.05. The adequacy measures considered
herein are R2 of 0.999, Adj- R2 of 0.991 Pred- R2 of 0.915, all these measures are in
reasonable agreement and confirm that the model is adequate. Also the adequate
precision ratio 35.033 is greater than 4, which indicates a desirable model. Fig. 5.5, it is
a contours graph showing the effect of two factors (A and C) and (A and B) on the
reduction percentage of tensile strenght. From Fig. 5.5a it is evident that less percentage
of reduction can be obtained as the nozzle temperature decreased and the barrel
temperature increased. From Fig. 5.6b, it is evident that as the screw rotation increase
and the barrel temperature increased the percentage of reduction increases. Fig. 5.6
perturbation graph shows the relationship between the three factors and the percentage
of reduction of raw PP, it is evident that the percentage of reduction in the yield strength
increases as the barrel temperature and screw rotation increased and nozzle temperature
decreased which can yield poor properties. Also, from this graph A and B is the most
important variable that affects the response, while C has less affecte. Furthermore, Fig.
5.7 shows the relationship between the actual and predicted values of the three variable
inputs (A, B and C). This Figure indicates that the developed models are adequate
because the residuals in prediction of response are tiny, as the residuals tend to be close
to the diagonal line to indicate good relationship between the experimental and predicted
value of response in recycling the raw material of PP. The (ANOVA) test indicated that
the main factor affecting the yield strength was (B) which is the most important factor
influencing on the recycle of raw PP. Also, the two factors (A) and (C) have strong
effect on the (Y). The final mathematical models in terms of coded factors as determined
by the design-expert V7 software can be expressed as follows Eq .5.4:
% of reduction of raw = 3.996 + 1.488 A + 2.125 B - 0.770 C-
1.109 A B -0.843 A C -1.036 ABC (5.4)
161

Chapter 5: Experimental Design
Table 5.4: ANOVA for reduced quadratic mode of the % of reduction of raw material.
SourceSum of Squares
DF MeanSquare
FValue
Prob > F
Model 82.691 6 13.782 125.986 0.0681 SignificantA- Barrel Temp 17.711 1 17.711 161.904 0.0499
B-Screw rotation 36.125 1 36.125 330.237 0.0350C-Nozzle Temp. 4.745 1 4.745 43.378 0.0959
AB 9.837 1 9.837 89.923 0.0669AC 5.682 1 5.682 51.939 0.0878
ABC 8.591 1 8.591 78.536 0.0715Residual 0.109 1 0.109
Cor Total 82.800 7R- = 0.999 Adj. R2 =0.991
Pred. R2= 0.915 Adeq .Precision= 35.033
Fig. 5.4: Cycle time for raw material.
162

Chapter 5: Experimental Design
% of reduction in Y-St. Raw MPa
180 203 225 248 270
A: Barre l T em p ., D eg ree C
(b)5.5: Contour graphs of the effects of three variables on the % of reduction of the yield
strength for the raw PP.
163

Chapter 5: Experimental Design
Fterturbation
D ev ia tion from R e fe rence P o in t (Coded Units)
Fig. 5.6: Perturbation graph shows the relationship between the three factors and thepercentage of reduction for raw PP.
P re d ic te d v s . A c tu a l
10.00. -
7 00 -
us■n 4 .0 0 -
I
1 .00
-2.00 — yi i i i i
-1 .81 0 93 3 67 6 41 9 .15
A ctua l
Fig. 5.7: Scatter diagram.
164

Chapter 5: Experimental Design
5.4.2. Development of the first recycling model
For the first stage, the experiment was designed based on three factors and two levels.
Table 5.5 shows the mould inputs variables and experimental design levels used for this
stage. The experiment was carried out according to the design matrix. Eight sets of
experiments were applied with a combination of parameters, which expected to
determine the variables having most significant effect on the response. Table 5.6 shows
the process variables and experimental design levels used. For this stage the
mathematical model was developed successfully to predict the following response the
percentages of reduction.
Table 5.5: The experiment layout and the measured responses for 1st recycling.
Exp.
No.Run
Factors Responses
A: Barrel Temp
°C
B: Screw Rotation
Rpm
C: Nozzle Temp
°C
(y)FirstMPa
%of reduced
1 17 180 30 160 28.20 9.92
2 5 270 30 160 28.28 9.61
3 15 180 100 160 28.87 7.37
4 4 270 100 160 27.73 11.79
5 16 180 30 270 29.94 3.54
6 8 270 30 270 29.03 6.78
7 18 180 100 270 28.32 9.46
8 19 270 100 270 28.46 8.92
Table 5.6: Actual and coded values of the three factors for 1 1 recycling.Variables Unit Low level (-1) High level (+1)
A Barrel Temp °C 180 270B Screw Rotation rpm 30 100C Nozzle Temp °C 160 270
165

Chapter 5: Experimental Design
5.4.2.1. Effects of A, B and C on the % of reduction of the yield strength of 1st recycling
In this case the effect of (A, B and C), two interaction effects of (BC) are significant
model terms. The results of the ANOVA test, is summarised in Table 5.7. It is evident
from Table 5.7 that the model is significant since the “Prob>F” is less than 0.05. The
adequacy measures considered herein are R2 of 0.996, Adj- R2 of 0.984, Pred- R2 of
0.929, all these measure are in reasonable agreement and confirm that the model is
adequate. Also the adequate precision ratio 30.366 is greater than 4, which indicates a
desirable model. Fig. 5.8 scatter diagram shows the relationship between the actual and
predicted values of the three variables. This Figure indicates that the developed models
are adequate because the residuals in prediction of response are minor, as the residuals
tend to be close to the diagonal line. Fig. 5.9a and b are contour graphs that show the
effect of the factors (A, C) and (B, C) on the percentage of reduction in tensile strength
of the recycling first stage. From Fig. 5.9a, it is evident that as the nozzle temperature
increases and the barrel temperature decreases and a good quality can be obtained.
While, from Fig. 5.9b the good quality product can be achieved as the screw rotation
decreases and the nozzle temperature increases. The results of ANOVA test indicated
that the main factors affecting the yield strength is nozzle temperature (C) is the most
important factor influencing on the recycle of first recycle PP. Furthermore, (B) and (A)
have significant effects on the response, where the effect of (B) was stronger than the
effect of (A). The Final mathematical models for percentage of reduction in the yield
strength of the first recycling in terms of coded factors as determined by the Design-
Expert are shown in Eq .5.5.
% of reduction in yield strength of 1st recycling = 7.730 + 0.738 A + 0.835B-1.07C +
0.931BC-0.915 ABC (5.5)
166

Chapter 5: Experimental Design
Table 5.7: ANOVA for reduced t uadratic moc e of the % of reduction of Is stage.
SourceSum of Squares DF
MeanSquare
FValue Prob > F
Model 32.846 5 6.569 89.387 0 . 0 1 1 1 SignificantA-Parrel Temp. 4.356 1 4.356 59.273 0.0165
B-Screw rotation 5.573 1 5.573 75.839 0.0129C-Nozzle Temp. 9.273 1 9.273 126.175 0.0078
BC 6.941 1 6.941 94.444 0.0104ABC 6.703 1 6.703 91.202 0.0108
Residual 0.147 2 0.073Cor Total 32.993 7
R2 = 0.996 Adj . R2 =0.984
Pred.R 2= 0.929 Adeq .Precision =30.366
Fig. 5.8: Scatter diagram for 1st recycling.
167

Chapter 5: Experimental Design
215
188
% of reduction in Y-St.1st.MPa
A: Barrel Tem p., Degree C
(a)
1 ------------ 1------------ 1------------ 1------------30 40 65 83 100
B Screw rotation, rpm
270% of reduction in Y-St.1st.MPa
(b)Fig. 5.9: Contour graphs of the effects of three variables on the % of reduction of the
first recycling.
168

Chapter 5: Experimental Design
Fig 6.10 shows the cycle time for the eight sets of the first recycling. The results
indicated that the screw rotation at 1 0 0 rpm were effectible to produce samples within
less time than 65 and 30 rpm for example barrel temperature at 270 °C, screw rotation
100 rpm and nozzle temperature 160 °C. Which appears effective and economically for
this range.
120
Screw Rotation (rpm) Time cycle (sec)
19 1 30 22
■ 2 30 19
□ 3 100 17 1
□ 4 100 17
■ 5 30 23 4
n 6 30 19
■ 7 100 17
□ 8 100 17
Number of Process
Fig. 5.10: Cycle time for first stage.
5.4.3. Development of second recycling model
For the second stage, the experiment was designed based on three factors and two levels.
Table 5.8 shows the mould inputs variables and experimental design levels used for this
169

Chapter 5: Experimental Design
stage. The experiential was carried out according to the design matrix. Eight sets of
experiments were applied with a combination of parameters, which were expected to
identify the variables having most significant effect on response. Table 5.9 presents the
process variables and experimental design levels used. For this stage the mathematical
model was developed successfully to predict the % of reduction in yield strength.
Table 5.8: The experiment layout and the measured responses for 2nd recycling.
Exp.
No.Run
Factors Response
A: Barrel
Temp
°C
B: Screw
Rotation
Rpm
C: Nozzle
Temp
°C
(y) Second
MPa
%
of reduction
1 17 180 30 160 27.36 13.30
2 5 270 30 160 27.15 14.18
3 15 180 1 0 0 160 27.55 12.52
4 4 270 1 0 0 160 26.38 17.51
5 16 180 30 270 28.95 7.08
6 8 270 30 270 28.35 9.34
7 18 180 1 0 0 270 27.05 14.60
8 19 270 1 0 0 270 26.22 18.23
Table 5.9: Actual and coded values of t ie three factors for 2 nd recycling.Code Variables Unit Low level (-1) High level (+1)
A Barrel Temp °C 180 270B Screw Rotation rpm 30 1 0 0
C Nozzle Temp °C 160 270
5.4.3.1. Effects of A, B and C on the % of reduction in the yield strength for the second recycling
In this case the effect of (A, B and C), two interaction effects of (AB) and two
factors interaction effect (BC) are significant model terms. The results of the
ANOVA test is summarised in Table 5.10. It is evident from Table 5.10. That the
model is significant since the “Prob>F” is less than 0.05. The adequacy measures
170

Chapter 5: Experimental Design
considered herein are R2 of 0.989, Adj- R2 of 0.961 _ Pred- R2 of 0.820, all these
measures are in reasonable agreement and confirm that the model is adequate. Also
the adequate precision ratio 17.154 is greater than 4, which indicates a desirable
model. Fig. 5.11 scatter diagram shows the relationship between the actual and
predicted values of the response. This Figure indicates that the developed models are
adequate because the residuals in prediction of response are small, as the residuals
tend to be close to the diagonal line. Fig. 5.12a and b are contour graphs that show
the effect of the three factors (A, B) and (B, C) on the response for second recycled
PP. From Fig. 5.12a it is evident that as both the screw rotation and barrel
temperature decreases superior quality products can be obtained as the percentage of
reduction decreases. From Fig. 5.12b it is clear that as the screw rotation decreases
and the nozzle temperature increases the desirable products could be achieved. The
results of ANOVA test indicated that the main factor affecting the response is screw
rotation (B), also (A) have strong effect on the response and (C). The Final
mathematical model in terms of coded factors as determined by the Design-Expert is
shown in Eq .5.6:
% of reduction in Y for 2nd recycling = 11.690 +1.133 A + 1.859B -0.859 C +
0.480 A B + 1.391 BC (5.6)
Table 5.10: ANOVA for reducec quadratic mode of the % of reduction of 2 nd stage.
SourceSum of Squares
DF MeanSquare
FValue
Prob > F
Model 61.139 5 12.228 35.117 0.0279 SignificantA-Barrel Temp. 10.271 1 10.271 29.496 0.0323B-Screw rotation 27.643 1 27.643 79.388 0.0124C-Nozzle Temp. 5.901 1 5.901 16.948 0.0542
AB 1.842 1 1.842 5.290 0.1482BC 15.482 1 15.482 44.462 0.0218
Residual 0.696 2 0.348Cor Total 61.835 7
R2 =0.989 Adj. R2 =0.961
Pred. R2= 0.820 Adeq .Precision= 17.154
171

Chapter 5: Experimental Design
Predicted vs. Actua l
Fig. 5.11 : Scatter diagram.

Chapter 5: Experimental Design
% o f redu c tion in Y -S t. 2nd
A: Barrel Tem p ., Degree C
(b )
Fig. 5.12: Contour graphs of the effects of the three variables on the % of reduction in
(Y) of the second recycling PP.
243
215
% o f red u c t io n in Y -S t. 2nd
46 65 83
B Screw rotation, rpm
173

Chapter 5: Experimental Design
Fig 5.13 shows the cycle time for the eight sets of second recycled PP. The results
indicated that the screw rotation at 1 0 0 rpm which appears effectible to produced
samples within less time than 65 and 30 rpm for example barrel temperature at 180 °C,
screw rotation 100 rpm and nozzle temperature 270 °C. Which appears effectives and
economically for this range.
100
60
40
20
0
ffl 1
■ 2□ 3□ 4
115
n 6 1
■ 7□ 8
1 1Screw Rotation(rpm )
30
30
100
100
30
30
100
100
Time cycle (sec)
21.3
19
17.3
17
21.2
19
17
17
N um ber o f Process
Fig. 5.13: Cycle time for second stage.
5.4.4. Development of third recycling
For the third stage, the experiment was designed based on three factors and two levels.
Table 5.1 1 shows the mould inputs variables and experimental design levels used for
this stage. The experiential was carried out according to the design matrix. The eight sets
of experiments were carried out to identify the variables having most significant effect
174

C h a p t e r 5 : E x p e r i m e n t a l D e s ig n
on response. Table 5.12 shows the process variables and experimental design levels
used. For this stage the mathematical model was developed successfully to predict the
percentages of reduction in the yield strength of the thirdly recycled pp.
Table 5.11: The experiment layout and the measured responses for 3rd recycling.
Exp.
No.Run
Factors ResponsesA: Barrel
Temp
°C
B -.Screw
Rotation
Rpm
C :Nozzle
Temp
°C
(Y) third
MPa% of reduced
1 17 180 30 160 24.15 28.36
2 5 270 30 160 23.87 29.87
3 15 180 1 0 0 160 24.63 25.86
4 4 270 1 0 0 160 23.47 32.08
5 16 180 30 270 27.03 14.68
6 8 270 30 270 25.87 19.82
7 18 180 1 0 0 270 25.87 19.82
8 19 270 1 0 0 270 23.56 31.57
Table 5.12: Actual and coded values of the three factors for 3rd recycling.
Code Variables Unit
Low level
(-D
High level
(+D
A Barrel Temp °C 180 270B Screw Rotation rpm 30 1 0 0
C Nozzle Temp °C 160 270
5.4.4.1. Effects of A, B and C on the % of reduction of the yield strength of the third recycling
In this case, the effect of (A, B and C), two factors interaction (BC), and three factors
interaction effect (ABC) are significant model terms. The results of the ANOVA test is
summarised in Table 5.13. It is evident from Table 5.13 that the model is significant* 2since the “Prob>F” is less than 0.05. The adequacy measures considered herein are R
0.997, Adj- R2 0.990; Pred- R2 0.954, all these measures are in reasonable agreement and
confirm that the model is adequate. Also the adequate precision ratio 31.446 is greater
175

Chapter 5: Experimental Design
than 4, which indicates a desirable model. Fig. 5.14 a scatter plot shows the
relationship between the actual and predicted values of the response. This figure
indicates that the developed models are adequate because the residuals in prediction of
response are tiny and the residuals tend to be close to the diagonal line. Contour graphs
Fig. 5.15a and b a showing the effects of the three factors (A, B) and (B, C) on the
response of the third recycled PP. From Fig. 5.15a it is evident that as the nozzle
temperature increases and the screw rotation decreases a good property of the product is
produced from third recycled PP. From Fig. 5.15b it is evident that as both the screw
rotation and the barrel temperature decrease good property could be achieved. While, the
desired quality could be achieved also as the nozzle temperature increased and the barrel
temperature decreases as can be seen in Fig. 5.16. The Final mathematical model for
this response in terms of coded factors as determined by the software is presented in Eq .5.7:
% of reduction in Y of the third stage = 20.948 + 1.012 A + 2.335 B - 1.536 C +
2.399 C - 0.859 ABC (5.7)
Table 5.13: ANOVA for reduced quadratic mode of the % of reduction of 3rd stage.
SourceSum of Squares DF Mean
SquareF
Value Prob > F
Model 122.632 5 24.526 137.735 0.0072 SignificantA-Barrel Temp. 8.195 1 8.195 46.020 0 . 0 2 1 0
B-Screw rotation 43.606 1 43.606 244.880 0.0041C-Nozzle Temp. 18.882 1 18.882 106.034 0.0093
BC 46.049 1 46.049 258.601 0.0038ABC 5.901 1 5.901 33.140 0.0289
Residual 0.356 2 0.178Cor Total 122.988 7
R2 = 0.997 Adj. R2= 0.990Pred. R2= 0.954 Adeq. Precision= 31.446
176

Chapter 5: Experimental Design
% o f red u c t io n in Y -S t, 3 rd
30 48 65 83 100
B S crew rotation, rpm
(a)
% o f red u c t io n in Y -S t , 3 rd
180 202 .5 225 2 47 .5 270
A: Barre l T em p ., D egree C
(b)
Fig. 5.15: Contours graph showing the effects of three variables on the % of reduction in (y)of the third recycling PP.
177

Chapter 5: Experimental Design
% of reduction in Y-St, 3rd
188
202.5 225 247.5
A: Barre l T e m p . , D e g re e C
Fig. 5.16: Contours graph shows the effects of the nozzle temperature and barrel temperature on the response of the third recycled PP.
Fig 5.17 shows the cycle time in eight set of third recycled. The results indicated that the
screw rotation at 1 0 0 rpm which appears effectible to produced samples within less time
than 65 and 30 rpm for example barrel temperature at 270 °C, screw rotation 100 rpm
and nozzle temperature 160°C. Which appears effectives and economically for this
range.
178

Chapter 5: Experimental Design
120
100
60
40
20
m l a x0 u—
Screw Rotation RPM Time cycle (sec)
111 1 30 22.4
■ 2 30 19.1
□ 3 100 17.1
□ 4 100 17
■ 5 30 20.4
■ 6 30 19.1
■ 7 100 17
□ 8 100 17
Fig. 5.17: Cycle time in third stage.
5.5. Recycling process of mixture raw material PP
In This experiment, the recycled material was mixed with raw material with different
percentages in order to enhance the quality of the final product. Table 5.14 shows the
input variables, percentage of raw material and the experimental design levels used for
this stage. Fifty-four different experiments for each stage were carried out and
specimens of tensile strength were produced for each experiment in each stage. The
responses which been considered herein are Y, UTS and operating cost per 500 samples
(OC), at each stage. The experiments for each stage were designed based on four factors
factorial design with three factors with three levels (the barrel temperature, screw
rotation and percentage of raw material) as well as one factor with two levels (nozzle
temperature).
179

Chapter 5: Experimental Design
5.5.1. Development of first recycling
For the first recycling stage, Table 5.14 shows the process variables and experimental
design levels used. Table 5.15 and Table 5.16 show the mould inputs variables used for
this stage and the responses values corresponding to each experiment.
’able 5.14: Process variables and ex lerimental desisn levels used.
Code Variables UnitLimits coded/actual
-1 0 +1A Barrel temp. °C 180 225 270B Nozzle Temp °C 160 - 270C Screw Rotation rpm 30 65 1 0 0
D % of RM. % 5 2 0 35
Table 5.15: Experimental layout for first recycled material.No. R u n A B C D N o. R u n A B C D
1 39 270 160 100 35 28 5 270 270 65 202 18 225 160 100 35 29 8 225 270 65 203 52 180 160 100 35 30 13 180 270 65 204 16 270 270 100 35 31 20 270 160 30 205 47 225 270 100 35 32 4 225 160 30 206 38 180 270 100 35 33 22 180 160 30 207 30 270 160 65 35 34 15 270 270 30 208 19 225 160 65 35 35 33 225 270 30 209 31 180 160 65 35 36 14 180 270 30 2010 42 270 270 65 35 37 35 270 160 100 511 24 225 270 65 35 38 9 225 160 100 512 2 180 270 65 35 39 17 180 160 100 513 13 270 160 30 35 40 40 270 270 100 514 20 225 160 30 35 41 10 225 270 100 515 4 180 160 30 35 42 34 180 270 100 516 22 270 270 30 35 43 49 270 160 65 517 15 225 270 30 35 44 50 225 160 65 518 33 180 270 30 35 45 5 180 160 65 519 14 270 160 100 20 46 8 270 270 65 520 35 225 160 100 20 47 13 225 270 65 521 9 180 160 100 20 48 20 180 270 65 522 17 270 270 100 20 49 4 270 160 30 523 40 225 270 100 20 50 22 225 160 30 524 10 180 270 100 20 51 15 180 160 30 525 34 270 160 65 20 52 33 270 270 30 526 49 225 160 65 20 53 14 225 270 30 527 50 180 160 65 20 54 35 180 270 30 5
180

Chapter 5: Experimental Design
Table 5.16: Responses values corresponding to each experimentNo. Run Y UTS OC No. Run Y UTS OC
1 39 349.00 265.55 0.6654 28 5 350.56 254.11 0.75362 18 336.11 252.67 0.6457 29 8 340.33 243.44 0.73143 52 352.33 264.11 0.6259 30 13 348.78 259.44 0.70924 16 336.78 255.33 0.6699 31 2 0 342.56 250.78 0.95665 47 334.78 265.00 0.6501 32 4 344.89 249.44 0.92826 38 335.11 258.44 0.6304 33 2 2 350.33 255.00 0.89987 30 333.33 244.33 0.7486 34 15 340.67 261.22 0.96308 19 336.00 257.00 0.7264 35 33 352.67 260.33 0.93469 31 351.78 261.89 0.7042 36 14 351.22 266.11 0.906210 42 341.33 283.33 0.7536 37 35 337.67 275.33 0.665411 24 369.11 286.00 0.7314 38 9 347.11 251.78 0.645712 2 367.44 276.67 0.7092 39 17 355.33 259.22 0.625913 13 352.56 267.33 0.9566 40 40 334.00 233.00 0.669914 2 0 382.89 282.56 0.9282 41 1 0 348.33 257.22 0.650115 4 350.33 252.00 0.8998 42 34 343.78 250.56 0.630416 2 2 359.11 280.78 0.9630 43 49 346.89 268.33 0.748617 15 340.33 271.78 0.9346 44 50 351.33 256.00 0.726418 33 356.78 265.67 0.9062 45 5 357.78 257.11 0.704219 14 348.56 268.44 0.6654 46 8 351.56 270.78 0.753620 35 360.44 260.89 0.6457 47 13 337.11 265.00 0.731421 9 349.78 253.22 0.6259 48 2 0 345.11 257.89 0.709222 17 346.78 252.89 0.6699 49 4 339.22 246.89 0.956623 40 349.22 259.33 0.6501 50 2 2 338.67 252.11 0.928224 1 0 336.89 252.33 0.6304 51 15 348.78 250.67 0.899825 34 351.11 266.89 0.7486 52 33 310.78 255.78 0.963026 49 346.33 282.11 0.7264 53 14 337.11 266.00 0.934627 50 317.67 252.00 0.7042 54 35 339.67 260.00 0.9062
5.5.1.1. Effects of C, D on the yield strength in the first recycling
In this case, the main effect of the two factors C and D and their interaction effect are
significant model terms. The results of the ANOVA test is summarised in Table 5.17. It
is evident from Table 5.17, that the model is significant since the “Prob>F” is less than
0.05. The adequacy measures considered herein are R2 of 0.193, Adj- R2 of 0.144 Pred-
181

Chapter 5: Experimental Design
R2 of 0.054, all these measure are in reasonable agreement and confirm that the model is
adequate. Also the adequate precaution ratio 6.557 is greater than 4, which indicates a
desirable model. Fig. 5.18 is an interaction graph shows the relationship between the
two factors C and D on response (Y), it is evident that as the percentage of raw material
(D) increased higher yield strength can be achieved Fig. 5.19 is a perturbation graph
show the effect of two factors C and D on response, it is evident that as the screw
rotation increased, poor yield strength will result despite the addition of raw material this
can be notched from Fig. 5.18 as well. Furthermore, the graph indicated also that when
the percentage of raw material is being increased this would result in higher tensile
strength. The results indicate good relationship between the experimental and predicted
values of (Y) of the first recycled PP. The results of (ANOVA) test indicated that the
factor (D) - percentage of RM. is the most significant factor affecting this response. The
Final mathematical models for this response in terms of coded factors as determined by
the Design-Expert are shown in Eq.5.8. While, the final mathematical models in terms of
actual factors are presented in Eqs. 5.9:
Y-Strength First = 346.0019 - 1.01541C + 3.19138D - 6.24537 CD (5.8)
Y-Strength First = 328.1678 + 0.208907 Screw Rotation + 0.985996 % of RM.
- 0.0119 Screw Rotation *% RM. (5.9)
Table 5.17: ANOVA analysis 'or (Y) with the model in the first stage mixture material
SourceSum of Squares
Df MeanSquare
F Value Prob > F
Model 1339.887 3 446.629 3.993 0.0126 SignificantC-Screw rotation 37.117 1 37.117 0.331 0.5671
D-% of RM. 366.656 1 366.656 3.278 0.0762CD 936.113 1 936.113 8.370 0.0056
Residual 5591.871 50 111.837Cor Total 6931.759 53
R2 = 0.193 Adj. R" =0.144Pred. R2= 0.054 Adeq .Precision= 6.557
182

Chapter 5: Experimental Design
Interaction
C: Screw rotaion, rpm
Fig. 5.18: Interaction graph shows the effect of C and D on Y for the first stage.
Perturbation
Deviation from Reference Point (Coded Units)
Fig. 5.19: Perturbation graph sh ow s the effect C and D on Y for the first stage.
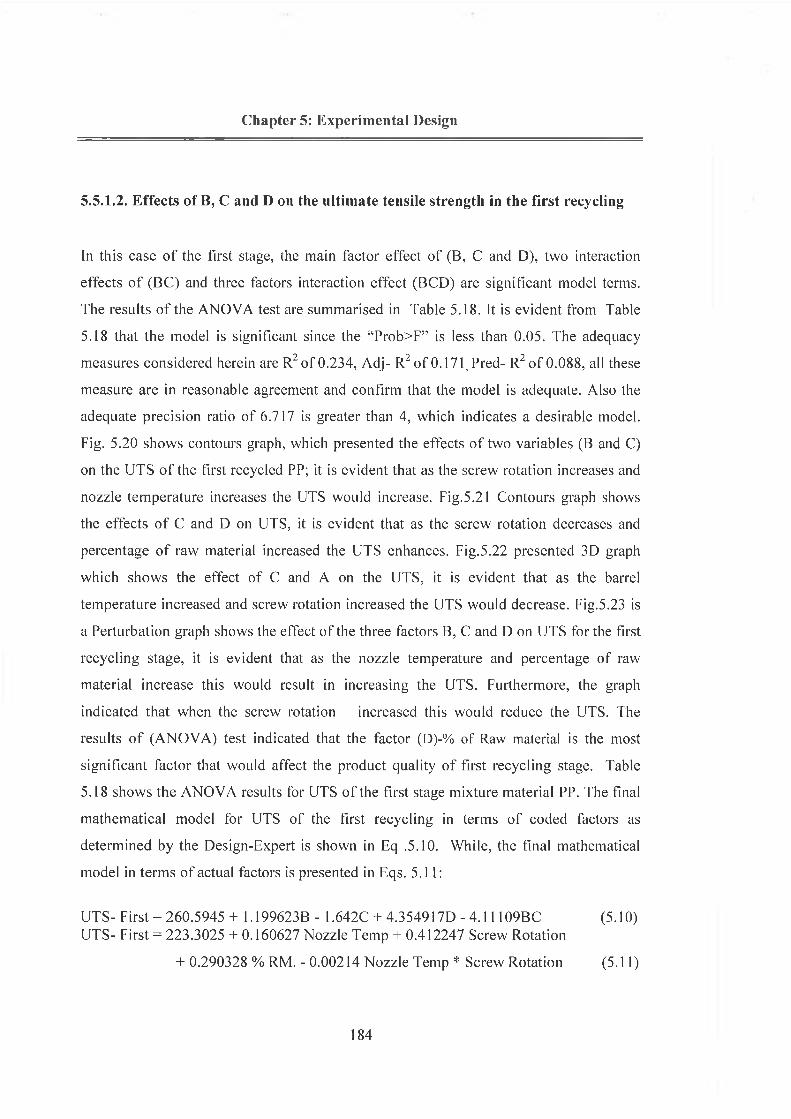
Chapter 5: Experimental Design
5.5.1.2. Effects of B, C and D on the ultimate tensile strength in the first recycling
In this case of the first stage, the main factor effect of (B, C and D), two interaction
effects of (BC) and three factors interaction effect (BCD) are significant model terms.
The results of the ANOVA test are summarised in Table 5.18. It is evident from Table
5.18 that the model is significant since the “Prob>F” is less than 0.05. The adequacy
measures considered herein are R2 of 0.234, Adj- R2 of 0.171, Pred- R2 of 0.088, all these
measure are in reasonable agreement and confirm that the model is adequate. Also the
adequate precision ratio of 6.717 is greater than 4, which indicates a desirable model.
Fig. 5.20 shows contours graph, which presented the effects of two variables (B and C)
on the UTS of the first recycled PP; it is evident that as the screw rotation increases and
nozzle temperature increases the UTS would increase. Fig.5.21 Contours graph shows
the effects of C and D on UTS, it is evident that as the screw rotation decreases and
percentage of raw material increased the UTS enhances. Fig.5.22 presented 3D graph
which shows the effect of C and A on the UTS, it is evident that as the barrel
temperature increased and screw rotation increased the UTS would decrease. Fig.5.23 is
a Perturbation graph shows the effect of the three factors B, C and D on UTS for the first
recycling stage, it is evident that as the nozzle temperature and percentage of raw
material increase this would result in increasing the UTS. Furthermore, the graph
indicated that when the screw rotation increased this would reduce the UTS. The
results of (ANOVA) test indicated that the factor (D)-% of Raw material is the most
significant factor that would affect the product quality of first recycling stage. Table
5.18 shows the ANOVA results for UTS of the first stage mixture material PP. The final
mathematical model for UTS of the first recycling in terms of coded factors as
determined by the Design-Expert is shown in Eq .5.10. While, the final mathematical
model in terms of actual factors is presented in Eqs. 5.11:
UTS-First = 260.5945 + 1.199623B- 1.642C + 4.354917D - 4.11109BC (5.10)UTS- First = 223.3025 + 0.160627 Nozzle Temp + 0.412247 Screw Rotation
+ 0.290328 % RM. - 0.00214 Nozzle Temp * Screw Rotation (5.11)
184

Chapter 5: Experimental Design
Table 5.18: Presents A N O V A analysis for UTS w ith the model in the first stage mixturematerial.
SourceSum of Squares df Mean
Square F Value Prob > F
Model 1465.963 4 366.490 3.747 0.0097 SignificantB-Nozzle Temp 77.711 1 77.711 0.794 0.3771
C-Screw Rotation 97.061 1 97.061 0.992 0.3240D-% of R.M. 682.750 1 682.750 6.980 0.0110
BC 608.439 1 608.438 6.221 0.0160Residual 4792.377 49 97.803
Cor Total 6258.34 53
R2 = 0.234 Adj. R2= 0.171
Pred.R2 =0.088 Adeq .Precision- 6.717
UTS First, MPa
m n s
EE
EiTi3 ESI
R5
R7;
rap,R3!
ranrvr,
160 00 107 50 215-00 242 50 270 00
B: N o zz le T e m p , d e g re e C
Fig.5.20: Contours graph show s the effects o f C and B on UTS at the first stage.
185

Chapter 5: Experimental Design
F ig .5 .21: Contours graph shows the effects o f C and D on UTS at the first stage.
F ig .5.22: 3D graph show the effect o f C and A on UTS at first stage.
262 3
261 45
260 6
259 75
258 9
30 00
47 50
65 00
C: Screw rota ion, rprr%2 so
100 00 " 270 oo
180 oo
A: Barrel Tem p, degree C
186

Chapter 5: Experimental Design
Perturbation
Deviation from Reference Point (Coded Units)
Fig.5.23: Perturbation graph show the effect of B, C and D on UTS at first stage.
5.5.2. Development of second recyclingFor the second recycling stage, Table 5.19 shows the process variables and
experimental design levels used. Table 5.20 and Table 5.21 present the mould inputs
variables used for this recycling stage.
able 5.19: Process variables and experimental design levels used.
Code Variables UnitLimits coded/actual
-1 0 +1
A Barrel temp. °c 180 225 270B Nozzle Temp °c 160 - 270C Screw Rotation Rpm 30 65 1 0 0
D % of RM. % 10 25 40
187

Chapter 5: Experimental Design
Table 5.20: Experimental layout for second recyclcd material.No. Run A B c D No. Run A B C D
1 39 270 160 100 40 28 8 225 270 65 252 18 225 160 100 40 29 11 180 270 65 253 52 180 160 100 40 30 37 270 160 30 254 16 270 270 100 40 31 44 225 160 30 255 47 225 270 100 40 32 8 225 270 65 256 38 180 270 100 40 33 36 180 160 30 257 30 270 160 65 40 34 41 270 270 30 258 19 225 160 65 40 35 3 225 270 30 259 31 180 160 65 40 36 26 180 270 30 2510 42 270 270 65 40 37 32 270 160 100 1011 24 225 270 65 40 38 51 225 160 100 1012 2 180 270 65 40 39 29 180 160 100 1013 13 270 160 30 40 40 45 270 270 100 1014 20 225 160 30 40 41 12 225 270 100 1015 4 180 160 30 40 42 21 180 270 100 1016 22 270 270 30 40 43 25 270 160 65 1017 15 225 270 30 40 44 28 225 160 65 1018 33 180 270 30 40 45 23 180 160 65 1019 14 270 160 100 25 46 53 270 270 65 1020 35 225 160 100 25 47 6 225 270 65 1021 9 180 160 100 25 48 27 180 270 65 1022 17 270 270 100 25 49 1 270 160 30 1023 40 225 270 100 25 50 48 225 160 30 1024 10 180 270 100 25 51 7 180 160 30 1025 34 270 160 65 25 52 43 270 270 30 1026 49 225 160 65 25 53 46 225 270 30 1027 50 180 160 65 25 54 54 180 270 30 10
188

Chapter 5: Experimental Design
Table 5.21 : Res Donses va ues corresponding to each experim ent for 2nd
No. Run Y UTS OC No. Run Y UTS OC1 39 334.00 247.44 0.6654 28 5 348.67 267.22 0.75362 18 345.11 244.67 0.6457 29 8 343.00 255.11 0.73143 52 360.00 252.44 0.6259 30 13 359.67 261.67 0.70924 16 353.67 241.56 0.6699 31 20 338.33 250.00 0.95665 47 347.67 266.00 0.6501 32 4 339.22 249.67 0.92826 38 357.00 273.11 0.6304 33 22 354.56 259.22 0.89987 30 348.56 254.11 0.7486 34 15 349.56 254.11 0.96308 19 354.56 261.33 0.7264 35 33 341.00 251.44 0.93469 31 363.56 266.00 0.7042 36 14 346.89 262.44 0.906210 42 344.44 270.78 0.7536 37 35 337.11 246.11 0.665411 24 353.22 256.78 0.7314 38 9 349.67 244.11 0.645712 2 352.56 268.11 0.7092 39 17 347.44 255.22 0.625913 13 335.78 243.11 0.9566 40 40 338.78 255.67 0.669914 20 336.78 253.78 0.9282 41 10 339.78 246.78 0.650115 4 352.44 264.33 0.8998 42 34 344.89 242.00 0.630416 22 347.89 263.00 0.9630 43 49 340.44 248.89 0.748617 15 348.56 259.89 0.9346 44 50 342.22 248.33 0.726418 33 357.00 275.00 0.9062 45 5 354.89 260.44 0.704219 14 348.00 247.44 0.6654 46 8 343.78 257.11 0.753620 35 346.44 255.00 0.6457 47 13 334.44 259.11 0.731421 9 367.11 267.67 0.6259 48 20 348.33 249.78 0.709222 17 349.78 252.78 0.6699 49 4 330.00 236.33 0.956623 40 337.67 249.67 0.6501 50 22 350.78 256.33 0.928224 10 351.11 331.67 0.6304 51 15 353.78 258.56 0.899825 34 347.33 248.11 0.7486 52 33 345.33 268.44 0.963026 49 350.78 253.44 0.7264 53 14 341.67 239.78 0.934627 50 360.78 261.11 0.7042 54 35 339.89 251.44 0.9062
189

Chapter 5: Experimental Design
5.5.2.1. Effects o f A, B, C and D on the yield streng th in the second recycling
In this case, the main factors effect of (A, B and C), two interaction effects of (AB) and
three factors interaction effect (ABC) are significant model terms. The results of the
ANOVA test is summarised in Table 5.22. It is evident from Table 5.22, that the model
is significant since the “Prob>F” is less than 0.05. The adequacy measures considered
herein are R2 of 0.552, Adj- R2 of 0.506, Pred- R2 0.442, all of these measure are in
reasonable agreement and confirm that the model is adequate. Also the adequate
precaution ratio 10.708 is greater than 4, which indicates a desirable model. Fig. 5.24 is
a contours graph shows the effect of the two factors A and B on the response (Y), it is
obvious that as both the barrel temperature and nozzle temperature are decrease, the
response would improve. Fig. 5.25 contours graph shows the effects of B ad D on Y. It
is clear for low amount of raw material, that as percentage of raw material increases and
the nozzle temperature decreases the desired quality can be achieved, but at high
percentage of raw material the desired quality can be achieved by using high nozzle
temperature. It is evident Fig. 5.25 that as the nozzle temperature and percentage of raw
material increased good properties can be obtained. Furthermore, the graph indicated
that the screw rotation increased it can obtained decreased UTS. The results of ANOVA
test indicate that the barrel temp (A) is most major factor affecting the product quality
for second recycling. Table 5.22 shows the ANOVA analysis for (Y) for the second
stage. The Final mathematical model for the yield strength of the second recycling in
terms of the coded factors as determined by the software is shown in Eq .5.12. While,
the final mathematical model in terms of actual factors is presented in Eqs. 5.13:
Y-Strength second = 347.3311-5.29014 A - 0.43415 B + 3.043194 +
3.320972 A B+ 1.685176 BD (5.12)
Y-Strength second = 446.2961 - 0.40605 * Barrel Temp - 0.36087 * Nozzle Temp -
0.23629 % R. M + 0.001342 Barrel Temp * Nozzle Temp +
0.002043 Nozzle Temp* % of RM (5.13)
190

Chapter 5: Experimental Design
Table 5.22: ANOVA analysis for Y with the model in the 2nd stage mixed material 1
Source Sum of Squares df Mean
Square F Value Prob > F
Model 1850.328 5 370.065 11.861 <0.0001 SignificantA-Barrel Temp 1007.481 1 1007.481 32.292 <0.0001B-Nozzle Temp 10.17817 1 10.178 0.326 0.5705D-% of R. M. 333.397 1 333.397 10.686 0.0020
AB 397.038 1 397.038 12.726 0.0008BD 102.233 1 102.233 3.276 0.0765
Residual 1497.517 48 31.198Cor Total 3347.845 53
R2 = 0.552 Adj. R2= 0.506Pred. R2= 0.442 Adeq .Precision= 10.708
YS second270 oo
242.50
a .EcuH® 215 0 0 -
8ZCO
107 5 0 -
160 00
A: Parrel Tem p
Fig. 5.24: Contours graph shows the effects of A and B on Y for second stage.
191

Chapter 5: Experimental Design
YS second, MPa
RE
R$
PiiFET
FTC
RS
RERB
RE
160 00 107 50 215 00 242 50 270 00
B: N ozze l T e m p , d e g re e C
Fig. 5.25: Contours graph shows the effects of B ad D on Y for the second stage.
Perturbation
D e v ia tio n from R e fe re n ce P o in t (C oded Units)
Fig. 5.26: Perturbation graph show the effect A, B and D on Y for the second stage.
192

Chapter 5: Experimental Design
5.5.2.2. Effects of A, B and D on the UTS of the second recycling
In this case, the main effects of the three factor effects (A, B and D) are significant
model terms. The results o f the ANOVA test are summarised in Table 5.23. It is evident
from Table 5.23, that the model is significant since the “Prob>F” is less than 0.05. The
adequacy measures considered herein are R2 of 0.247, Adj- R2 of 0.202; Pred- R2 of
0.127, all these measure are in reasonable agreement and confirm that the model is
adequate. Also the adequate precaution ratio 7.978 is greater than 4, which indicates a
desirable model. Fig. 5.27 contours graph shows the effects of A and B on UTS, it is
clear that as the nozzle temperature increases and the barrel temperature decreases the
desirable quality could be reached. Fig. 5.28 contours graph shows the effects of C and
D on UTS, it is evident that the screw rotation (C) has no significant effect, but as the
percentage of raw material increases the UTS of the second stage improves. The results
o f ANOVA test indicate that the barrel temperature (A) is the most important factor
affecting the product quality of second recycling stage. The Final mathematical model
for ultimate tensile strength for the second recycling in terms of coded factors as
determined by the Design-Expert is shown in Eq.5.14. Whilst, the final mathematical
models in terms of actual factors are presented in Eqs. 5.15:
UTS -Second recycle = 256.7345 - 5.77778A+ 3.652253B+ 3.805574D (5.14)
UTS -Second recycle = 265.0038 -0.1284 ^Barrel Temp+ 0.066405
* Nozzle Temp+ 0.253705 * % RM. (5.15)
193

Chapter 5: Experimental Design
Table 5.23: ANOVA analysis for UTS with the model in the 2nd stage mixed material.
Source Sum of Squares df
MeanSquare F
ValueProb >
F
Model 2443.447 3 814.482 5.480 0.0025 SignificantA-Barrel Temp 1201.778 1 1201.778 8.086 0.0064B-Nozzle Temp 720.303 1 720.303 4.846 0.0323D-% of R. M. 521.366 1 521.366 3.508 0.0669
Residual 7430.614 50 148.612Cor Total 9874.061 53
R1 = 0.247 Adj. R2= 0.202Pred. R2= 0.127 Adeq .Precision= 7.978
UTS second, MPa
00 202 50 225 00 247 50 270 00
A : B arre l T e m p , d e g re e C
Fig. 5.27: Contours graph shows the effects of A and B on the UTS for the secondstage.
194

Chapter 5: Experimental Design
UTS second, MPa
wü
D: % o f R. M
Fig. 5.28: Contours graph shows the effects of C and D on the UTS for the secondstage.
5.5.3. Development of third recyclingFor the third recycling stage, Table 5.24 illustrates the process variables and
experimental design levels used. Table 5.25 and Table 5.26 show the mould inputs
variables and the responses values corresponding to each experiment.
Table5.24: Process variables and experimental design levels used
Code Variables UnitLimits coded/actual
-1 0 +1
A Barrel temp. °C 180 225 270B Nozzle Temp °C 160 - 270C Screw Rotation rpm 30 65 100D % of RM. % 20 35 50
195

Chapter 5: Experimental Design
Table 5.25: Experimental layout for third recycled materia .No. Run A B C D No. Run A B C D
1 39 270 160 100 50 28 5 270 270 65 352 18 225 160 100 50 29 8 225 270 65 353 52 180 160 100 50 30 11 180 270 65 354 16 270 270 100 50 31 37 270 160 30 355 47 225 270 100 50 32 44 225 160 30 356 38 180 270 100 50 33 36 180 160 30 357 30 270 160 65 50 34 41 270 270 30 358 19 225 160 65 50 35 3 225 270 30 359 31 180 160 65 50 36 26 180 270 30 3510 42 270 270 65 50 37 32 270 160 100 2011 24 225 270 65 50 38 51 225 160 100 2012 2 180 270 65 50 39 29 180 160 100 2013 13 270 160 30 50 40 45 270 270 100 2014 20 225 160 30 50 41 12 225 270 100 2015 4 180 160 30 50 42 21 180 270 100 2016 22 270 270 30 50 43 25 270 160 65 2017 15 225 270 30 50 44 28 225 160 65 2018 33 180 270 30 50 45 23 180 160 65 2019 14 270 160 100 35 46 53 270 270 65 2020 35 225 160 100 35 47 6 225 270 65 2021 9 180 160 100 35 48 27 180 270 65 2022 17 270 270 100 35 49 1 270 160 30 2023 40 225 270 100 35 50 48 225 160 30 2024 10 180 270 100 35 51 7 180 160 30 2025 34 270 160 65 35 52 43 270 270 30 2026 49 225 160 65 35 53 46 225 270 30 2027 50 180 160 65 35 54 54 180 270 30 20
196

Chapter 5: Experimental Design
Table 5.26: Responses va ues corresponding to each experiment for 3n .No. Run Y UTS OC No. Run Y UTS OC
1 39 347.44 253.11 0.6654 28 5 351.11 237.33 0.75362 18 353.56 250.78 0.6457 29 8 356.00 247.56 0.73143 52 357.78 263.11 0.6259 30 11 348.78 256.00 0.70924 16 336.22 242.22 0.6699 31 37 355.78 252.11 0.95665 47 349.11 245.00 0.6501 32 44 347.11 247.44 0.92826 38 356.44 253.11 0.6304 33 36 352.78 251.78 0.89987 30 350.11 247.67 0.7486 34 41 329.78 243.78 0.96308 19 340.67 249.33 0.7264 35 3 339.11 242.67 0.93469 31 356.00 254.22 0.7042 36 26 340.67 249.22 0.906210 42 352.33 256.78 0.7536 37 32 335.00 236.78 0.665411 24 345.11 243.33 0.7314 38 51 339.00 245.67 0.645712 2 349.78 254.11 0.7092 39 29 349.44 259.33 0.625913 13 345.78 246.00 0.9566 40 45 338.00 251.89 0.669914 20 354.89 256.22 0.9282 41 12 335.78 243.56 0.650115 4 361.11 260.78 0.8998 42 21 344.22 257.33 0.630416 22 350.1 1 259.89 0.9630 43 25 335.00 251.33 0.748617 15 360.22 265.78 0.9346 44 28 344.67 253.22 0.726418 33 362.00 264.67 0.9062 45 23 347.78 251.33 0.704219 14 344.00 245.67 0.6654 46 53 342.67 266.33 0.753620 35 353.67 251.33 0.6457 47 6 341.56 251.22 0.731421 9 356.22 248.67 0.6259 48 27 350.89 262.11 0.709222 17 346.89 256.56 0.6699 49 1 335.67 237.44 0.956623 40 343.78 247.56 0.6501 50 48 343.11 249.78 0.928224 10 346.78 263.56 0.6304 51 7 348.44 252.00 0.899825 34 348.00 256.44 0.7486 52 43 347.44 248.33 0.963026 49 354.89 253.11 0.7264 53 46 338.44 268.78 0.934627 50 355.1 1 257.78 0.7042 54 54 339.89 257.89 0.9062
5.5.3.1. Effects of A, B and D on the yield strength in the third recycling
In this case the main effects of the three factors (A, B and D) are significant model
terms. The results of the ANOVA test are summarised in Table 5.27. It is evident from
Table 5.27, that the model is significant since the “Prob>F” is less than 0.05. The• ■ 2 * 2 2 adequacy measures considered herein are R" of 0.465, Adj- R“ of 0.433 Pred- R of
0.380, all these measure are in reasonable agreement and confirm that the model is
197

Chapter 5: Experimental Design
A: Barrel T e m p , de gree , C
Fig. 5.29: Contours graph shows the effects o f A and B on Y for the third stage.
353 4
348 6
too
82 5
65
47,5 C: Screw rotationD: % of R M
50 00
42 50
Fig. 5.30: 3D graph shows the effects o f C and D on Y for the third stage.
199
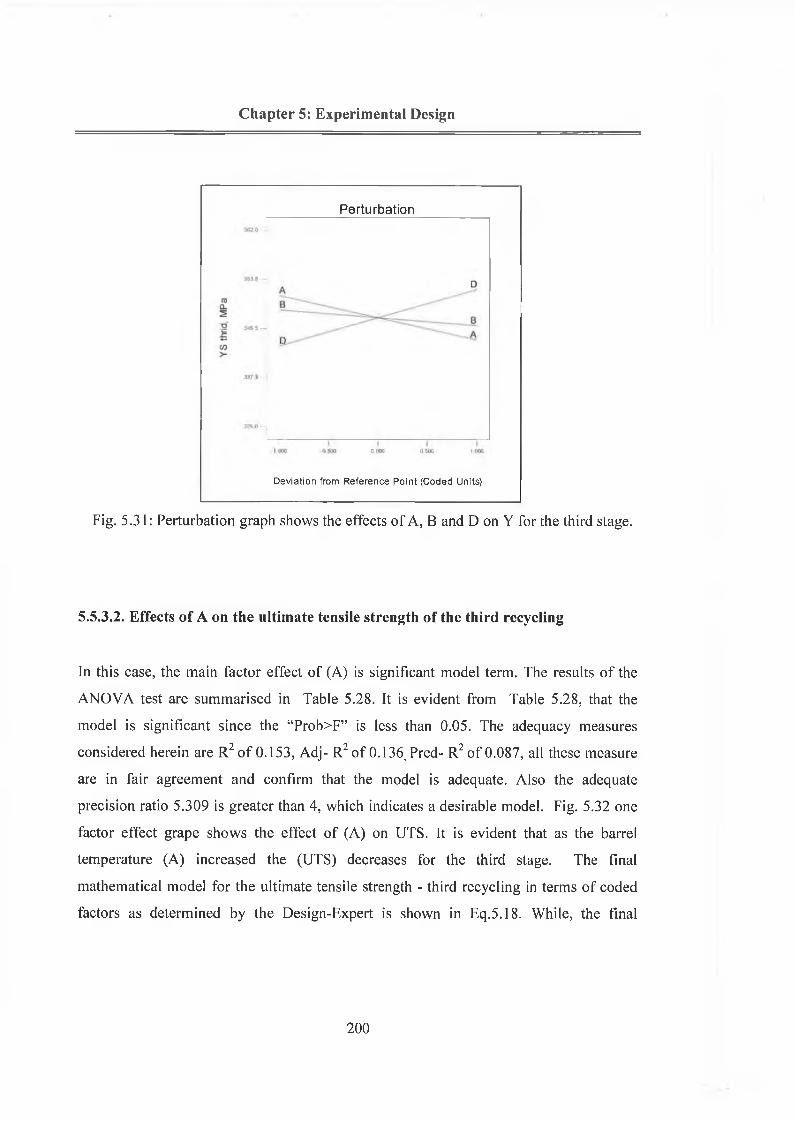
Chapter 5: Experimental Design
Perturbation
Deviation from Reference Point (Coded Units)
Fig. 5.31: Perturbation graph shows the effects of A, B and D on Y for the third stage.
5.5.3.2. Effects o f A on the ultim ate tensile strength of the th ird recycling
In this case, the main factor effect of (A) is significant model term. The results o f the
ANOVA test are summarised in Table 5.28. It is evident from Table 5.28, that the
model is significant since the “Prob>F” is less than 0.05. The adequacy measures
considered herein are R2 o f 0.153, Adj- R2 of 0.136, Pred- R2 of 0.087, all these measure
are in fair agreement and confirm that the model is adequate. Also the adequate
precision ratio 5.309 is greater than 4, which indicates a desirable model. Fig. 5.32 one
factor effect grape shows the effect of (A) on UTS. It is evident that as the barrel
temperature (A) increased the (UTS) decreases for the third stage. The final
mathematical model for the ultimate tensile strength - third recycling in terms of coded
factors as determined by the Design-Expert is shown in Eq.5.18. While, the final
2 0 0

Chapter 5: Experimental Design
mathematical model in terms of actual factors is presented in Eqs. 5.19: Table 5.29
shows cycle time of first, second and third recycling stage with mixed raw PP.
UTS- Third = 252.2036 - 0.53704 A (5.18)
UTS- Third= 269.8888 - 0.0786 * Barrel Temp (5.19)
Table 5.28: ANOVA analysis for UTS o f the model in the 3rd stage mixed material.
SourceSum of Squares Df
MeanSquare F Value Prob > F
Model 450.382 1 450.382 9.395 0.0034 SignificantA-Barrel Temp 450.382 1 450.382 9.395 0.0034
Residual 2492.641 52 47.935Cor Total 2943.024 53
R2 = 0.153 Adj. R2 = 0.136Pred. R¿= 0.087 Adeq .Precision= 5.309
One Factor269 0 —
260 a -
ro j
■p■= 252 5 —
c/>=) T
244.3 —
236 0 -
i i i i ilaooo 202 50 225 00 247,50 270 00
A: Barrel Temp, degree, C
Fig. 5.32: Interaction grape show the effect o f C on UTS at third stage.
201

Chapter 5: Experimental Design
Table 5.29: Cycle time of first, second and third recycling stage with mixed raw PP.
202

Chapter 5: Experimental Design
5.6. O perating cost calculation
Recycling operating cost can be estimated as Euro per hour or Euro per sample for
particular injection moulding machine type HM7, The barrel and nozzle- changed after
10 years, barrel temperature max 400°C, nozzle temperature max 400°C. Also oil
heraldic uses 17 litres changed after three years or after 1,000,000 samples as mention in
Table 5.1 chapter 5. The total approximated operating cost per hour or per sample as a
function of the output power can be estimated by Eq.5. 20 and Eq.5.21. Table 5. 30
show the elements of operating costs of the injection moulding HM7.
Table 5.30: Operating costs break down.
No. Elements of cost Calculi) tions Operatingcost €Vh
1 Machine power cost 1.5 [kW]*€ 0.104/[kWh] 0.156002 Barrel 0.76 [kWh]* (€ 0 .104/[kWh])* Tb/400 0.0001976*Tb
1" 3 Nozzle 0.07 [kWh]* (€ 0.104/[kWh])* Tn/400 0.0000182*Tnf ' 4 Replacing the screw € 2050/ 10 years*52 w/y*5days/w*24h/day 0.03285
! 5 Replacing the barrel 6 1880/ 10 years*52 w/y*5days/w*24h/day f 0.030136 ' Replacing the nozzle € 330/ 10 years*52 w/y*5days/w*24h/day j 0.004817 Labour cost (8h/62400h) *€ 400/8h j ' 0.006418 Oil heraldic price (€ 20/litre)* 171itre/(3y*52w/y*7*days/w*24h/day) 0.01297
f 9 Mould Cost € 2000/(1000000 sample* t h/sample) 0.002 * t
OC [€/h] = (0.24317 + 0.000l976*Tb + 0.0000182*Tn + 0.002 * t) (5.20)
OC [€/sample] - (0.24317 + 0.0001976*Tb + 0.0000182*Tn + 0.002 * t)*t (5.21)
Where:
Tb- is the barrel temperature.
Tn- is the nozzle temperature.
203

Chapter 5: Experimental Design
5.6.1. Effects o f A, B and C on the operating cost
In this case the main three factor effect of (A, B and C), are significant model terms. The
results of the ANOVA test are summarised in Table 5.31. It is obvious from Table
5.31, that the model is significant since the “Prob>F” is less than 0.05. The adequacy
measures considered herein are R2 of 0.996, Adj- R2 of 0.939, Pred- R2 of 0.934 all these
measure are in reasonable agreement and confirm that the model is adequate. Also the
adequate precaution ratio 41.221 is greater than 4, which indicates a desirable model.
Fig. 5.33 contours graph shows the effects of A and C on (OC), it is evident that as the
barrel temperature increases and the screw rotation decreases the operating cost
increases. Fig. 5.34 contours graph shows the effects of B and C on (OC), it is clear that
as the screw rotation decreases and the nozzle temperature increase the operating cost
increases. Fig. 5.35 perturbation graph shows the effects of three factors A, B and C on
the (OC), it is evident that as the screw rotation increases the operating cost decreases
sharply. The Final mathematical model for the operating cost in terms of coded factors
as determined by the Design-Expert is shown in Eq.5.22. While, the final mathematical
model in terms of actual factors is presented in Eqs. 5.23:
OC = 0.769378 +0.023465 A +0.002642 B - 0.14173 C (5.22)
OC =0.904945 +0.000521 Barrel Temp +4.8E - 05 Nozzle Temp-
0.00405 Screw rotation (5.23)
Table 5.31: ANOVA ana ysis for operating.
SourceSum of Squares df Mean
Square F Value Prob > F
A-Barrel Temp 0.7433 3 0.2477 276.7871 <0.0001 SignificantB-Nozzle Temp 0.0198 1 0.0198 22.1413 <0.0001
C-Screw rotation 0.0003 I 0.0003 0.4208 0.5195Residual 0.7231 1 0.7231 807.799 <0.0001Cor Total 0.0447 50 0.0008
0.7881 53R2 = 0.943 Adj. R2= 0.939
Pred. R2= 0.934 Adeq. Predsion= 41.221
204

Chapter 5: Experimental Design
operating cost Euro/500 sample270 00 -
U)03T3^ 225 00
8.<! 202 50 -
180.0030.00 47.50 65.00 82.50
C: Screw rotaion, rpm
100.00
Fig.5.33: Contours graph shows the effects of A and C on OC.
operating cost Euro/500 sample
[0079
1 (^ 0
I5
o
82.50 M fo .725l L —--------------------------------
65.00
Jolzg.
160
B: Nozzle Tem p, degree C
Fig. 5.34: Contours graph shows the effects o f B and C on OC.
205

Chapter 5: Experimental Design
Perturbation
Deviation from Reference Po int (Coded Units)
Fig. 5.35: Perturbation graph shows the effects of A, B and C on OC.
5.7. O ptim isation
5.7.1. F irst recycling
5.7.1.1. Num erical O ptim isation
In the numerical optimisation of PP plastic material for this stage, two optimization
criteria were implemented to produce sound recycling products at relatively low
operating cost as presented in Table 5.32. The first criterion goal is to reach maximum
yield strength and ultimate tensile strength at relatively low operating cost by using the
limitation listed in Table 5.32. Table 5.33 presents the optimal moulding conditions the
desirable optimal conditions would be achieved for second stage. However, for the first
criterion the barrel temperature has to be set between 180.02 and 184.24 °C with screw
rotation between 93.99 and 94.53 rpm, while the nozzle temperature has to be set to
between 160 and 161.54 °C and the percentage of raw material has to be around 35% to
achieve the maximum yield strength and ultimate tensile strength. Implementing these
moulding conditions would result in excellent mechanical properties of the first recycled
206

Chapter 5: Experimental Design
material, as presented in Table 5.33. Table 5.34 presents the optimal solution based
second optimisation criteria. The optimisation results clearly demonstrate that, the barrel
temperature has to be around 180 °C; the nozzle temperature has to be around 160 °C,
the screw rotation of about 100 rpm and raw material of 5% to achieve the maximum
yield strength and ultimate tensile strength. To optimise the yield strength and ultimate
tensile strength to be of about 343 MPa and 266 MPa respectively in the first criterion
the operating cost would be of about € 0.6259 per 500 samples as can seen in Table
5.32. While, maximise the responses to be of about 348 MPa and 257 MPa respectively
in the second criterion the operating cost should be around € 0.6015 per 500 samples as
can seen in Table 5.34.
5.7.1.2. G raphical O ptim isation
In the graphical optimisation, the range of each response has been selected from the
numerical optimisation results. The ranges obtained from the two criteria which were
proposed in the numerical optimisation were brought into graphical optimisation as well.
The green area on overly plot Fig. 5.36 and Fig. 5.37, which are the region that meet
the first and the second criterion of the first recycling at D= 35% of raw material for the
first criteria and for the second criteria D= 5% of raw material respectively.
Table 5.32: Optimisation criteria used for the first stage.
Parameter or Response
Limits
Importance First criterion SecondcriterionLower Upper
Barrel Temp 180 270 3 Is in range minimiseNozzle Temp 160 270 3 Is in range is in rangeScrew rotation 30 100 3 Is in range maximise
% of RM. 5 35 3 Is in range minimiseY First 310.778 382.888 5 maximize maximise
UTS First 233 286 5 maximize maximiseOC for 500
samples 0.6259 0.9629 5 minimize Minimise
207

Chapter 5: Experimental Design
Table 5.33: Optimal bases on the First criterion for the first stage
No.BarrelTemp
NozzleTemp
Screwrotation
% o fRM. Y First UTS
First
OC for 500
samplesDesirability
1 180.04 160.01 93.99 34.99 343.18 265.79 0.625908 0.65262 180.55 160 94.06 35 343.17 265.80 0.625897 0.65263 180.89 160 94.1 35 343.16 265.80 0.625910 0.65254 181.65 160 94.19 35 343.14 265.81 0.625910 0.65245 180.02 160.25 93.99 34.83 343.20 265.74 0.625911 0.65246 180.17 160.98 94.01 35 343.17 265.76 0.625910 0.65237 183.05 160 94.37 35 343.10 265.82 0.625908 0.65238 180.03 161.54 94 35 343.18 265.73 0.625911 0.65229 183.82 160 94.47 35 343.08 265.83 0.625909 0.652210 184.24 160.16 94.53 34.98 343.07 265.82 0.625906 0.6521
Table 5.34: Optimal solution bases on the second criterion for the first stage.
No.BarrelTemp
NozzleTemp
Screwrotation
% o fRM. Y First UTS
First
OC for 500
samplesDesirability
1 180 160.03 100 5 348.04 257.51 0.601541 0.74212 180 160.08 99.99 5.21 348.00 257.56 0.601593 0.74163 180.44 160 100 5.14 348.01 257.55 0.601770 0.74134 180.01 160 99.67 5.03 347.99 257.49 0.602898 0.74125 180.9 160 100 5 348.04 257.51 0.602010 0.74116 180 160 100 5.61 347.92 257.69 0.601548 0.74087 180 165.31 100 5 348.04 257.23 0.601794 0.74038 181.79 160 99.98 5 348.04 257.51 0.602537 0.74029 180.01 160 99.13 5 347.91 257.45 0.605059 0.740010 180.01 160 100 6.02 347.83 257.81 0.601548 0.7399
208
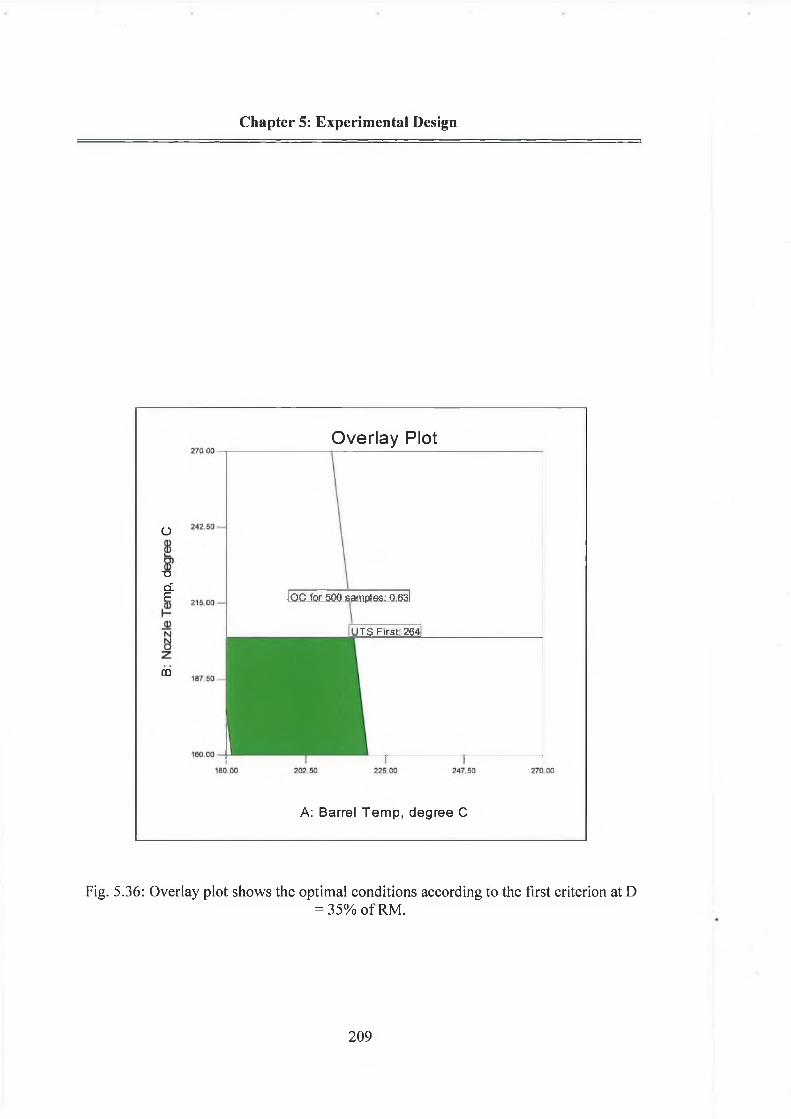
Chapter 5: Experimental Design
Overlay Plot
o
~ocLE
DQ
I PC for 500 samples: 0.631
TS Firs: 264
A: Barrel Temp, degree C
Fig. 5.36: Overlay plot shows the optimal conditions according to the first criterion at D= 35% of RM.
209

Chapter 5: Experimental Design
Overlay Plot
oÜO)CD■o
0)H0N
8
m
loc for 500 samples: 0.621
I UTS First: 2561
A: Barrel Temp, degree C
Fig. 5.37: Overlay plot shows the optimal conditions according to the second criterionat D = 5% of RM.
210

C h ap ter 5: E x p er im en ta l D esign
5.7.2. Second recycling
5.7.2.1. N um erical O ptim isation
In the numerical optimisation of PP plastic material for this stage, two optimization
criteria were implemented to produce sound recycling products at relatively low
operating cost as presented in Table 5.35. The first criterion goal is to reach maximum
yield strength and ultimate tensile strength at relatively low operating cost by using the
limitation listed in Table 5.36. Table 5.37 presents the optimal moulding conditions the
desirable optimal conditions would be achieved for second stage. However, according to
the first creation for this stage the barrel temperature has to be set to 180 °C with screw
rotation between 94.63 to 99.88 rpm, while the nozzle temperature has to be set between
209.71 and 214.23 °C and the percentage of raw material has to be of about 30 % to
achieve the maximum yield strength and ultimate tensile strength. Implementing these
moulding conditions would result in excellent mechanical properties of the second
recycled, as presented in Table 5.36. Table 5.37 presents the optimal solution based
second optimisation criteria. The optimisation results clearly demonstrate that, the barrel
temperature has to be around 180 °C; the nozzle temperature has to be around 160 °C
and the screw rotation of about 100 rpm and percentage of raw material of around 20 %
to achieve the maximum yield strength and ultimate tensile strength. To optimise the
yield strength and ultimate tensile strength to be of about 354 MPa and 263 MPa
respectively in the first criterion the operating cost would be of about € 0.6250 per 500
samples as can seen in Table 5.36. While, maximise the responses to be of about 356
MPa and 257 MPa respectively in the second criterion the operating cost should be
around € 0.6042 per 500 samples as can seen in Table 5.37.
5.7.2.2. G raphical optim isation
In the graphical optimisation, the range of each response has been selected from the
numerical optimisation results. The ranges obtained from the two criteria, which were

Chapter 5: Experimental Design
proposed in the numerical optimisation, were brought into graphical optimisation as
well. Fig.5. 38 and Fig 5.39 show the green areas on overly plot, which are the region
that meet the first and the second criterion respectively of second recycling at D= 30%
for the first criteria and for the second criteria D= 20%.
Table 5.35: Optimisation criteria used for second stage.Parameter or
ResponseLimits Importance First criterion Second
criterionLower UpperBarrel Temp 180 270 3 is in range minimiseNozzle Temp 160 270 3 is in range minimiseScrew rotation 30 100 3 is in range maximise
% of RM. 20 30 3 is in range minimiseY First 329.999 367.111 5 Maximize maximise
UTS First 236.333 331.666 5 Maximize maximiseOC per 500
samples 0.6259 0.9629 5 Minimize minimise
Table 5.36: Optimal solution based on the first criterion for second stage.
No. BarrelTemp
NozzleTemp
Screwrotation
% o fRM.
YSecond UTS
Second
OC for 500
samples Desirability1 180 211.85 94.63 30 353.82 263.57 0.625907 0.56812 180 211.44 96.54 30 353.84 263.54 0.618196 0.56813 180 212.51 96.61 30 353.78 263.62 0.617922 0.56814 180 213 94.84 30 353.75 263.65 0.625068 0.56815 180 212.89 99.88 30 353.76 263.64 0.604661 0.56816 180 210.8 96.42 30 353.88 263.50 0.618692 0.56817 180 213.53 94.74 30 353.72 263.68 0.625480 0.56818 180 209.71 95.74 30 353.94 263.43 0.621421 0.56819 180 213.98 94.67 30 353.70 263.71 0.625758 0.568110 180 214.23 98.74 30 353.68 263.73 0.609280 0.5681
212

Chapter 5: Experimental Design
Table 5.37: Optimal solution based on the second criterion for second stage.
No.BarrelTemp
NozzleTemp
Screwrotation
% o fRM.
YSecond
UTSSecond
OC for 500
samplesDesirability
1 180.01 160 100 20 355.92 257.59 0.60418 0.70862 180 160 99.54 20 355.92 257.59 0.606050 0.70813 180.01 161.16 100 20 355.83 257.67 0.604188 0.70784 180.36 160.04 100 20 355.85 257.55 0.604371 0.70775 180.29 160.55 100 20 355.83 257.59 0.604330 0.70756 180 161.48 99.05 20.01 355.81 257.69 0.608029 0.70657 180.68 160.72 99.97 20 355.74 257.55 0.604663 0.70638 180 160 97.72 20 355.92 257.59 0.613412 0.70609 180.12 160 100 20.38 355.94 257.67 0.604245 0.706010 181.01 160.17 100 20 355.72 257.47 0.604707 0.7059
Overlay Plot
B: N ozzel T e m p , degree C
Fig. 5.38: Overlay plot shows the optimal according to the first criterion of the secondstage at D= 30% of RM.
213

Chapter 5: Experimental Design
82.50
Ee-cocu■e2 65 CX) —
£YS second: 355
30 00
Overlay PlotIOC / 500 samples: 0.6200l
160 00 187 50
B: Nozzel Temp, degree C
Fig. 5.39: Overlay plot shows the optimal according to the second criterion for secondrecycling at D = 20% of RM.
214

Chapter 5: Experimental Design
5.7.3. T h ird recycling
5.7.3.1. N um erical O ptim isation
In the numerical optimisation of PP plastic material for this stage, two optimization
criteria were implemented to produce sound recycling products at relatively low
operating cost as presented in Table 5.38. The first criterion goal is to reach maximum
yield strength and ultimate tensile strength at relatively low operating cost by using the
limitation listed in Table 5.39. Table 5.40 presents the optimal moulding conditions the
desirable optimal conditions would be achieved for third stage. However, according to
the first creation for this stage the barrel temperature has to be set to 180 °C with screw
rotation between 94.67 to 99.48 rpm, while the nozzle temperature has to be set of about
160 °C and percentage of raw material of about 50 % to achieve the maximum yield
strength and ultimate tensile strength. Implementing these moulding conditions would
result in excellent mechanical properties of the third recycled, as presented in Table
5.39. Table 5.40 presents the optimal solution based second optimisation criteria. The
optimisation results clearly demonstrate that, the barrel temperature has to be around 180
°C; the nozzle temperature has to be around 160 °C and the screw rotation of about 100
rpm and percentage of raw material of about 20 % to achieve the maximum yield
strength and ultimate tensile strength. To optimise the yield strength and ultimate tensile
strength to be of about 357 MPa and 255 MPa respectively in the first criterion the
operating cost would be of about € 0.8129 per 500 samples as can seen in Table 5.39.
While, maximise the responses to be of about 347 MPa and 255 MPa respectively in the
second criterion the operating cost should be around € 0.8129 per 500 samples as can
seen in Table 5.40.
215

Chapter 5: Experimental Design
5.7.3.2. Graphical Optimisation
In the graphical optimisation, the range of each response has been selected from the
numerical optimisation results. The ranges obtained from the two criteria, which were
proposed in the numerical optimisation, were brought into graphical optimisation as
well. Fig.5.40 and Fig 5.41 show the green/ shaded area on overly plot, which are the
region that meet the first and the second criterion respectively of third recycling at D=
50% for the first criteria and for the second criteria D= 21%.
Table 5.39: Optimisation criteria used in the third stage.Parameter or
ResponseLimits Importance First criterion Second
criterionLower UpperBarrel Temp 180 270 3 is in range minimiseNozzle Temp 160 270 3 is in range minimiseScrew rotation 30 100 3 is in range maximise
% of RM. 20 50 3 is in range minimiseY First 329.777 362 5 Maximise maximise
UTS First 236.777 268.777 5 Maximise MaximiseOC for 500
samples 0.6259 0.9629 5 minimise Minimise
Table 5.40: Optimal solution based on the first criterion for third stage.
No.BarrelTemp
NozzleTemp
Screwrotation
% o fRM.
YThird
UTSThird
OC for 500
samplesDesirability
1 180 160 98.07 50 357.09 255.74 0.61199 0.79482 180 160 95.85 50 357.09 255.74 0.620996 0.79483 180 160 94.67 50 357.09 255.74 0.625773 0.79484 180 160 99.16 50 357.09 255.74 0.607595 0.79485 180.01 160 97.59 50 357.09 255.74 0.613954 0.79486 180 160 95.52 49.98 357.08 255.74 0.622321 0.79487 180 160 98.48 49.97 357.08 255.74 0.61033 0.79478 180.01 160.7 98.69 50 357.07 255.74 0.609480 0.79479 180 160.9 99.48 50 357.07 255.74 0.606273 0.794610 180 161.12 96.88 50 357.06 255.74 0.616809 0.7946
216

Chapter 5: Experimental Design
Table 5.41: Optimal solution based on the second criterion for thirc
No.BarrelTemp
NozzleTemp
Screwrotation
% o fRM.
YThird
UTSThird
OC for 500
samplesDesirability
1 180 160 99.98 20.02 347.55 255.74 0.604259 0.81292 180 160 100 20.27 347.63 255.74 0.604181 0.81283 180 160 99.99 20.66 347.75 255.74 0.604205 0.81264 180 160 99.91 20.78 347.79 255.74 0.604542 0.81255 180.04 160 100 20.92 347.83 255.73 0.604201 0.81246 180 160.03 100 21.07 347.88 255.74 0.604181 0.81247 180 160.52 99.96 20 347.53 255.74 0.604346 0.81238 180 160.02 100 21.51 348.02 255.74 0.604181 0.81229 180.01 160 99.41 20 347.54 255.74 0.606563 0.812110 180.37 160 100 20.04 347.53 255.71 0.604372 0.8120
stage.
Overlay Plot
o c / 500samples Q.<?3Q0|
02 50 —
Co03Oi_5 65.00 —
oC/)
o
47 50 —
30.00 1 1 120.00 27.50 35 00 42 50 50.00
D: % of R. M.
Fig. 5.40: Overlay plot shows the optimal according to the first criterion for the thirdstage at D= 50% of RM.
217

Chapter 5: Experimental Design
Overlay Plot
«
oCOO
lYS thr d: 349]
D: % o f R. M
Fig. 5.41: Overlay plot shows the optimal according to the second criterion for the thirdrecycling at D= 21% of RM.
5.8. Validation of the developed models
In order to validate the model developed for the three recycling stages with mixing raw
material, some experiments were carried out using molding conditions selected from the
optimization results for each stage. These optimal conditions are within the range of this
experiment. An average of at least three experiments was calculated for each confirmation test
and compared with the predicted value by computing the percentage of error in prediction.
218

Chapter 5: Experimental Design
5.8.1 First stage
Table 5.42 presents the measured responses, predicted responses and the (OC). The
mathematical models for first recycling clearly demonstrate an outstanding agreement
between measured and estimated values of the mentioned response since the maximum error
in prediction is 5.428% as can be seen in Table 5.42.
Table 5.42: Confirmation experiments for first stage.
Exp.No.
BarrelTemp
NozzleTemp
Screwrotation
% o fRM.
YFirst
UTSFirst
OC for 500
samples
1 180.04 160.01 93.99 34.99
Actual 343.18 265.79 0.625908
Predicted 336.44 262.66 0.625908
Error % 1.964 1.178 0
2 180.01 160 99.67 5.03
Actual 347.99 257.49 0.625913
Predicted 329.10 260.22 0.602899
Error % 5.428 -1.060 3.677
5.8.2 Second stage
The results of the confirmation experiments for the second stage are presented in Table
5.43. It is clear that the models can explain the responses within the factors domain, as
the maximum error in prediction is 11.280 %, which indicates fair agreement.
Exp.No.
BarrelTemp
NozzleTemp
Screwrotation
% o fRM.
YSecond
UTSSecond
OC for 500
samples
1 180 211.44 96.54 30
Actual 353.84 263.54 0.627989
Predicted 318.66 258.44 0.618197
Error % 9.942 1.935 1.560
2 180.01 160 100 20
Actual 355.92 257.59 0.625913
Predicted 315.77 246.22 0.604188
Error % 11.280 4.414 3.471
219

Chapter 5: Experimental Design
5.8.3 Third stage
The results of the confirmation experiments for the third stage are presented in Table 5.44. It
is clear that the models can effectively explain responses within the factors domain, as the
maximum error in prediction is 8.833 %, which indicates good agreement.
Table 5.44: Confirmation experiments for third stage.
Exp.No.
BarrelTemp
NozzleTemp
Screwrotation
% o fRM.
YThird
UTSThird
OC for 500
samples
1 180 160 98.07 50
Actual 357.09 255.74 0.625909
Predicted 325.55 259.55 0.611996
Error % 8.833 -1.490 2.222
2 180 160 99.98 20.02
Actual 347.55 255.74 0.625909
Predicted 322.44 244.66 0.604259
Error % 7.224 4.333 3.460
5.9. C hapter SummaryIn this chapter, the author has emphasised the importance of commitment of the FD in
realising the success of recycling process and has highlighted the importance of linkage
of the recycled process in the frame work of response (Y) and (UTS), measurement as
quality criteria at each recycling stages and also he estimated the operating cost at each
stage. Based on the elements of the recycled by the injection mould HM7, the author has
formulated the recycle process which is a combination of recycled PP with raw material
in three stages all aspects of each recycling stage has three different percentages raw PP
give the direction for optimum quality and achieving its objective. The empirical data
findings were carrying out in this research by Design-Expert V7 software. The results
show significant models at each stage. The optimisation was used different ranges of
each response. Finally, the developed mathematical models and the optimal solutions are
validated in each recycling stages by selected some moulding setting from the numerical
optimisation.
220

CHAPTER 6
CONCLUSION AND FUTURE WORK

Chapter 6: Conclusion
6. Conclusions and Recommendations for Future Work6.1 In troduction
The principal findings o f the research and the proposed recommendations are
summarised in this chapter, followed by the thesis contribution and the
recommendations for future work. The following conclusions were drawn from
the results obtained and are applicable for the polypropylene plastic material
investigated in this work. The developed mathematical models and the optimal
solutions are valid in the moulding parameters ranges that were used for
developing them.
6.2 Conclusions for Survey Results
A comprehensive questions survey study has been presented on aspects of use
recycling plastic materials implementation in the plastic companies in republic of
Ireland and United Kingdom. There has been little or no substantial research
carried out in the aspect o f recycle process in the plastic industries in Ireland and
United Kingdom. This is therefore important as it addresses the need for this kind
of research in the plastics recycles process. The results indicate that in both
countries, the higher recycle level using, the more sophisticated mould
technologies are associated with recycled process. As such, more comprehensive
injection mould should be implemented, so that the improvement of performance
in the quality products can be achieved. The results also indicate that in both
countries the major problem encountered by the quality product is related to the
issue of process parameters, which are due to the lack of knowledge,
competencies and motivation. These can be overcome through the employee
development approach that leads to the improvement of quality products of the
plant availability and performance. These are up-to-date information to the body
o f knowledge and can provide new insight to current situation and guideline for
the recycle process department as far as Ireland and UK plastic industries are
concerned. In general, this study has contributed in the following manner:
222

Chapter 6: Conclusion
1. Through this research, a comparative study between three recycling stages
in the manufacturing plastic industry has been carried out in Ireland and
United Kingdom.
2. The study on the implementation of recycle process in the plastic
companies in both countries has been presented in this thesis. This study
has presented the relationship between recycling process and products
quality. Furthermore, most of recycling plastic is of the minimum and
medium employed level. A diversity of mould process has been used and
higher sales of recycled products also were mould.
3. The results show in both countries that the recycle process effort
contributes in good percentage in the improvement of sale products.
4. The recycle personnel team should consist of multi-skill personnel who are
able to solve the problems according to the plastic materials and process
used in the production plant. This requirement can be achieved by
manpower development, conducting an appropriate training and continuous
education to improve skills and recycled knowledge.
5. The first and second stages are very important in realizing the success of
recycle implementation.
6. The sales of recycled products for different plastic materials for a period of
four years were increased.
7. In the first recycling stage quality of the product could be maintained,
however, for the second and third stage the quality could be decreased.
8. For third stage a reduction in the price of the products would occur.
However, majority of companies used the sale of recycling products over
16 years.
9. The profits coming from the sale of recycled products in the majority of
companies’ equals 2 % from the company involved the sale from less than
2 years to over 16 years. However, the first recycling stage is the most
reliable to produce a profit.
223

Chapter 6: Conclusion
6.3 Conclusions for E xperim ental Design
The result of this study would contribute greatly to the understanding for the
development of recycling process in each stage. In general, this study has
contributed in the following manner:
1. The third stage of recycling often results in poor quality. However, in the
second experiment both material properties (Y and UTS) were enhanced by
the additional of raw polypropylene.
2. The main factors affecting the responses (Y) and (UTS) are the barrel
temperature and screw rotation. While, the nozzle temperature has slight
effect on the response.
3. The main and interactions effect of the three process parameters were
determined.
4. Good agreement between the measured and estimated values of the
response.
5. The optimal temperatures what ever the optimisation criteria are barrel
temperature around 180 °C and nozzle temperature of about 160 °C apart
form the one of the 2nd recycling stage with no restriction which is ranged
between 209.71 and 214.23 °C.
6. The optimal moulding conditions that would lead to the best products quality
in terms of its mechanical properties and at relatively low operating cost for
each stage are:
a. For the 1st stage, the percentage of raw material is 5 %, barrel
temperature of about 180°C, nozzle temperature o f about 160°C,
screw rotation 100 rpm and the operating cost is € 0.6015 per 500
samples.
b. For the 2nd stage, the percentage of raw material is 20 %, barrel
temperature of about 180°C, nozzle temperature of about 160°C,
224

Chapter 6: Conclusion
screw rotation of about 100 rpm and the operating cost is € 0.6042 per
500 samples.
c. For the 3rd stage, the percentage of raw material is 20 % Barrel
temperature about of 180°C, nozzle temperature of about 160°C,
screw rotation 100 rpm and the operating cost is € 0.6043 per 500
samples.
6.4 R ecom m endation for F u tu re W ork
The results of this study point to some further opportunities for research. Some
suggestions for future work are listed as follows:
1. Some fairly strong relationships were found between various parameters, this
study does not include the contribution of all process parameters. Further
investigation can be carried out on the recommended approach for recycle
process of PP in injection moulding, which will integrate the interest and the
needs of quality criteria.
2. It can be suggested to investigate mixing PP with other type of recycled
plastic materials to introduce the effect of percentage of recycled material on
the final product quality at different stages of recycling process and
determine which inputs parameters would affect the responses.
3. Apply this technique to optimise other plastic materials with different
percentage o f raw materials PP.
4. Extend this investigation and study more mechanical properties, at various
plastic material and processes of mould parameters.
225

Publications Arising From This work
C onference Papers:
1 - A study Effect of Recycling Process on the Productivity o f Plastic Materials,
22nd International Manufacturing Conference (IMC-22),31stAugust-2nd
September 2005, Institute of Technology Tallaght, Dublin ,Ireland.
2- The Relation Between Recycling Process and Products Quality of Plastic
Materials. The 16th International Conference on Flexible Automation and
Intelligent Manufacturing 26th -2 8 th June 2006, University of Limerick,
Ireland .
3- Effects of The Recycling Process on the Marketing o f Plastic Materials
Product, 23rd International Manufacturing Conference, 30lh August to 1st
September 2006, Belfast, UK.
4- Optimisation of the Moulding Process o f Recycled Plastic, Material Dvances
in Materials and Processing Technologies (AMPT 2006), 30th July to 3th
August 2006, Las Vages, USA.
5- Effect o f Moulding Parameters on Mechanical Properties of Polypropylene
Plastic Materials, Materials Energy Design (MED 2006), 14th -1 7 th March
2006, Institute of Technology, Dublin, Ireland.
6- Effects of Recycling Stages and Moulding Parameters on Yield Strength of
Polypropylene, 24th International Manufacturing conference (IMC-22), 29th
to 31st August, 2007, Institute o f Technology Waterford, Dublin, Ireland.
Jo u rn a ls :
1- Application of Factorial Design in Mixing the Virgin and Recycled
Polypropylene for Injection-Moulding, submitted to Journal o f Advances in
Engineering Software, 2007.
2- Effects o f Injection Moulding Conditions on the Mechanical Properties of
Polypropylene Plastic Material, submitted to Journal o f Simulation Modelling
Practice and Theory, 2007.
226

REFERENCE
[1] M.I.B. Tavares and C.G. Mothe, Material Characterisation Sold State Carbon-13 NMR, Study o f Structural Polymeric Industrial Rejects, Journal of Polymer Testing, 1998, Vol 17, PP 289-295.
[2] T. Goldman, Recycling as Economic Development: Toward a Framework for Strategic Materials Planning, Masters Thesis, Department of City and Regional Planning, University of California, Berkeley. January 1997.
[3] Information on Plastic and the Environment, American plastic council, March, 2004. Available online: http://www.Plasticsresource.coni/s plasticseresource/sec.asp.
[4] T.A. Vilhena and C.A Hemais, Reciprocal of rejects plastics, Brazil - aspects economics", 3 Congress Brassiere de Polymers, Rio de Janeiro, 1995, pp702-7 20.
[5] M .A. Martins, C.G Mothe and M.I.B Tavares, Journal of Polymer Testing, 1996, Vol 15, PP91-97.
[6] Reprocessing-Recycling and Transport of Nuclear Material, General Director for
Energy and Raw Materials Sub-directorate of Nuclear Industry, June 2006.
Available online: http://www.indtistrie.siouv.fr/eneraie/anizlais/pdI711che.pdt~.
[7] Information on the plastic and environmental, September 2003. Available online:http:// www.plasticsresourece.com/s plasticresource/index.asp.
[8] M .Bevis, Secondary Recycling o f Plastics, Journal of Materials in Engineering, Vol 3, 1982, PP 344-349.
[9] Plastics recycling information sheet, May, 2004. Available online:http:// www.wasteonline.org.uk/resources/infoimationsheets/plastics.htm.
[10J Information on the history of plastic, September 2003. Available online:http:// www.americanplasticscouncil.ore/s apc/index.asp .
[11] Introduction to Thermoplastic, Injection Moulding, December 2003. Available online:http:Avww.crclarke.Co.UK.
[12] S. Slater and J. Naver, Competitive Environment Moderate the Market Orientation- Performance Relationship, Journal o f Marketing, January 1994, pp 46-55.
[13] T. Pepelnjak, G.Gantar and K.K.uzman, Numerical Simulations in Optimisation of Products and forming Process, Journal of Materials Processing Technology, 2001, pp 122-126.
227
[14] F. P. L. Mantia and J.L .Gardette, Improvement of the Mechanical Properties o f Photo-Oxidized film after Recycling, Journal o f Polymer Degradation and Stability, Vol 75, 2002, PP 1-7.
[15] T.K. Boguski ,H .R. William ,General Mathematical Models for LCI Recycling Resources, Journal of Conservation and Recycling, 1994, Vol 12, pp 147-163.
[16] M. Patel, V.N. Thienen and E. Jochem, Recycling of Plastic in Germany Resources, Journal o f Conservation and Recycling, 2000, PP 25-90.
[17] General Directorate for Energy and Raw Materials Sub-Directorate of Nuclear Industry, Reprocessing- recycling and transport of nuclear material, France, July 2001.
[18] C.G. Mothe and M.I .B. Tavares, Study of Recycling and Biodegradability of Ethylene -Co-Vinyl Acetate Rejects by Thermal Analysis, Journal of Polymer Degradation an Stability, 1997, Vol 57, PP 183-186.
[19] C.G. Mothe and S.M. Castor, Recycling o f polymers, 1995, ppl-35.H[20] G. R. Adams and J. D. Schvaneveldt, “Understanding research methods”, (2nd Edition),
1991, New York, Longman.
[21] B. Blumberg, D. R. Cooper and P. S. Schindler, “Business Research Methods”, MC Graw Hill, Beckshire, 2005, UK.
[22] K. F. Punch, “Introduction to Social Research - Quantitative & Qualitative approach”, Sage Publication, 1998, London.
[23] S. Sarantakos, “Social research”, Macmillan Press Ltd, 1993, London.
[24] Introduction o f Recycle Plastic, October, 2003. Available online:http://web.info.com/infocom.us2/search/web.
[25] Introduction to Environmental and Recycling Programme (Honk Kong), November, 2003 Available online: http://www.epd.gov.hk/epd/eindex.html.
[26] R. J.Murphy, Florida Centre o f Solid and Hazardous Waste Management, 1990, Florida, USA.
[27] Plastics Division of the American Chemistry Council (ACC), May, 2003. Availableonline:http://www.americanplasticscouncil.org/benefits/about plastics/histor y .h tm l. September ,
[28] L. Kunstoffe, German plastic, Germany, 1978, pp 266-280.
[29] E.G.Leverkusen, Hydrolysis of Plastic Waste, 1999, pp 281-284.
228

[30] T. Czvikovszky and T. Czigany, Harmonization o f Plastics and the Environment in the 21-st century Budapest University o f Technology and Economics, Department of Polymer Engineering, 2001.
[31] Introduction of Recycling of Polymers, April, 2004. Available online: hUp://www.pcn.om/Technical%20Notes%20-%20Recyclel.htm.
[32] Plastics Recycling Background and Information on Municipal Recycling Programs, June 2005. Available online: http://wvvw.plasticsresource.cOm/s plasticsresource/doc.asp.
[33] R.D .Deanin, A. Amran, R. Saraogi and N. Matani, Recycle o f Polystirene.Journal of Polymer Preprints 1983, Vol 2, pp 430-431.
[34] D.A .Hoffman, Antec’94 Conference Proceedings, 1994, Vol 1, pp 883-883.
[35] B.Vosshenrich, Higher proportions of recycled material can beused. Journal ofKunststoffe Synthetics, 1993, Vol 5, pp 15-18.
[36] C. Voute , Recycling Council Annual Seminer Birmingham, 1994.
[37] T. Goldman, Recycling as Economic Development, Toward a Framework for Strategic Materials Planning, California at Berkeley, January 1997.
[38] PACIA, National Plastics Recycling Survey 2003 Main Survey Report, Australia, September, 2003.
[39] Report to the U.S. Environmental Protection Agency and the Plastic Redesign Project, Solid Waste Research Program, August 2004. Available online:http:/ www .plasticredesitzn .or»/iilcs/phasctw oreporthtm I .
[40] D. Bryce, Plastic Injection Moulding-Materials Selection and Product Design Fundamentals -Fundamentals of Injection Moulding Series, Society of Manufacturing Engineers, USA, 1996.
[41] D .Bryce, Plastic Injection Moulding-Materials Selection and Product Design Fundamentals -Fundamentals o f Injection Moulding Series, Society of Manufacturing Engineers,US A, 1996.
[42] R.J Crawford, Plastics Engineering, Butterworth Heinmann, 1998.
[43] V.J. Stokes, Thermoplastics as Engineering Materials, Journal of Materials Design Processing, Vol 117, 1995, pp 448-455.
[44] M. Crum, N. Buckley and C .Bucnall, Principles of Polymer Engineering, Oxford University Press, 1997.
[45] J. White, The Injection Moulding Process, 1983, pp 86-109.
229

46] Information Service of Recycling Plastics, May, 2004. Available online: http://www.itdg.org/docs/technical .
47] T.A. Osswald , L.S. Tumg and P.J. Gramann, “Injection Molding Handbook”, 2002, USA
48] B.R. Duffy , Injection Mouldig ,Design System, Theses of MSc, University CollegeDublin Ireland, Augest, 1994.
49] R.J. Crawford, Plastics Engineering, 2nd Edition, Pergamon Press, Oxford, 1989
50] Information to Mould Products, July, 2005. Available online:
http://www.alibaba.com/prodiictsearch/Mould.html.
51] Different type of Mould Products, July, 2005. Available online:http: //hengshenli .en.alibaba.com.
52] American Society Testing and Materials, standard Classification System for Carbon Blacks Used in Rubber Oroducts, 1999.
53] T. Osswald, L. Turng and P. Gramann, Injection Moulding Handbook, Hanser, 2002.
54] Manual Book of Injection Moulding Machine, Type HM7, Mechanical Engineering Workshop, Dublin City University, Ireland, 2005.
55] N. Moran , Computer Aide Engineering for Injection Mould cooling System Desgin, Theses o f MSc , School of Mechanical and Manufacturing Engineering in Dublin City University, Ireland , August, 1998.
56] D. Bryce, Plastic Injection Moulding -Manufacturing Process Fundamental, Vol 1,Fundamental o f Injection Moulding Series, Society of Manufacturing Engineering, USA, 1996.
57] M. Stevens, Polymer Chemistry University Press, 1990.
58] C. Austin, Filling o f Mould Cavities, Computer Aided Engineering for Injection Moulding, Edited by E. Bernhardt, Hanser Publications, 1983, pp 276-324.
59] J. Chabot, the Development o f Plastic Processing Machinery and Methods, John Wiley&Sons, 1992.
60] K. Singh, Mold Cooling, Computer Aide Engineering for Injection Moulding, Edited byE. Bernhard, Hanser Publications, 1983, pp326-347.
61] T. Kwon, Mold Cooling system Design using Boundary Element, 1988, Vol 110, pp384-394.
230

[62] A. J. Parker, the Economics of Technological Innovation in Recycling, October, 1999.
[63] Contains information about Bennet, August 2004. Available online: http:/ w w w .bem ieteurope.nl/bennet.html.
[64] O. Murakami, Technology for Recycling Plastic Materials, 2000,
[65] L .Mantia and F.P. Basic, Recycling o f PVC and Mixed plastic waste , ChemTecPublishing, Toronto, 1996.
[66] J .C. Anderson, K.D. Leaver, R.D. Rawlings and J.M. Alexander, Materials Science anNo strand Reinhold (UK), Molly Millars Lane, Wokingham, Berkshire, England, 1985 .
[67] Introduction o f Polystyrene, January 2003. Available online:http://www.dow.com/stvron/desian/guide/mechanical.htm.
[68] N.T. Dintcheva, F.P.LaMantia, R.Scaffaro, M.Paci, D.Acierno and G.Camino, Reprocessing and Restabilization of Greenhouse Films, Journal of Polymer Degradation and Stability, Vol 75, July 2002, pp 459-464.
[69] C. Javierre, I. Clavera, L.Ponz, J.Aisa and A.Femandez, Influence o f the Recycling Materal Percentage on the Rheological Behavour of HDPE for Injection Moulding Process, Waste Management, 2006.
[70] M .H.Martins and M.A.De paoli, Polypropylnee Compounding with Post-Consumer Material Reprocessing, Journal of Polymer Degradation and Stability, 2002, Vol 78, PP 491-495.
[71] A .K. Agrawal, and S .A.Utreja , Effects o f Hydroperoxid Decomposer and Slipping Agent on Recycling of Polypropylene, Journal of Applied Polymer Science ,Vol 92, 2004, PP 3247-3251.
[72] J. Aurrekoetxea, MA. Sarrionandia and I. Urrutibeascoa, Fracture Behaviour of Virginan Recycled Isotactic Polypropylene, Materials Science Journal, Vol 36,2001, pp 5073- 5078.
[73] L. Incarnato, P.Scarfato, G.Gorrasi, V.Vittoria and D.Acierno, Structural ModificationsInduced by Recycling of Polypropylene, Journal of Polymer Engineering and Science, 1999, Vol 39, P9.
[74] S .Tall, Aa.C.albertsson and S .Karlsson, Enhanced Rigidity of Recycled Polypropylenefrom Packaging Waste by compounding With Talc and High-Crystallinity Polypropylene, Polymer for Advaced Technologies Journal,2001,Vol 12 , PP 279- 284.
[75] C.J.Tsenoglou, C.N. Kartalis and C.D.Papaspyrides, Restabilization of Recycled Caco3-filled Polypropylene Assessment o f Reprocessing Induced Modifications and
231

processing Stabilizer Effectiveness, Advances in Polymer Technology Journal, 2002,Vol 21, PP 260-267.
[76] A. Espert, W.Camacho and S. Karlson, Termal and Thermo mechanical Properties of Biocomposites Made from Modified recycled Cellulose and Recycled polypropylene, Journal of Applied Polym3er Science, 2003, Vol 89, pp 2353-2360.
[77] B. E Tiganis , R. A. Shanks and Y. Long, Effects of processing on the microstructure, melting behavior, and equilibrium melting temperature of polypropylene, Journal of applied polymer science, 1996, Vol 59, pp 663-671.
[78] M. H. Martins and M.A .De Paoli, Polypropylene Compounding with Recycled Material, Statistical response surface analysis, Polymer Degradation and Stability Journal, Vol 71, 2001, pp 293-298.
[79] M.C.Bonelli, A.F. Martins, E ,B. Mano and C .L.Beatty, Effects of Recycled Polypropylene on polypropylene/High Density Polyethylene Blends, Journal of Applied Polymer Science,2001, Vol 80, pp 1305-1311.
[80] P. Phinyocheep, F.H. Axtell and T. Laosee, Influence o f Compatibilizers on Mechanical Properties, Crystallization and Morphology of Polyoproplene/Scrap Rubber Dust Blends, Journal of Applied Polymer Science, 2002, Vol 86, pp 148-159.
[81] S. Ross and D. Evans, The Environmental Effect o f Reusing and Recycling a Plastic -Based Packaging System, Journal o f Cleaner Production ,2003, Vol 11, pp 561— 571.
[82] A .Oromiehie and A. Mamizadeh, Recycling PET Beverage Bottles and ImprovingProperties, Journal of Polymer International, 2004, Vol 53 , pp 72-732.
[83] S. Bcrtin and J.J.Blends, Study and Characterization of Virgin and Recycled LDPE/PPBlends, European Polymer, 2002, Vol 38, pp 2255-2264.
[84] H.P. Blom and A.Rudin, PP/PE Blends .IV. Characterization and compatibilization ofBlends of Post Consumer Resin With Virgin PP and HDPE, Journal of AppliedPolymer Science, 1998, Vol 70, pp 2081-2095.
[85] N.T. Dintcheva, F.P.La Mantia, D. Acierno, L.D Maio, G Camino, F. Trotta, M.P.Luda, and M.Paci, Characterization and Reprocessing of Greenhouse Film, Polymer Degradation and Stability, 2001, Vol 72, p p l4 1-146.
[86] T. Kallel, V.M.Nageotte, M.Jaziri and J.F.Gerard, Compatibilzation of PE/PS and P/PP Beland .1 .Effect of rocessing Coditions and Formulation , Applied Polymer Science ,Vol 90,2003,PP 2475-2484.
[87] J.K. Kim, S.H. Lee and S.H. Hwang, Study on the Thermoplastic Vulcanízate Sing Ultrasonically Treated Rubber Powder, Journal o f Applied Polymer Scienceh, 2003, Vol 90, pp 2503-2507.
232

[88] P. Rachtanapun, S. E. M. Selke and L. M. Matuana, Effect of the High-Density Polyethylene Melt Index on the Microcellular Foaming of High-Density Polyethylene/Polypropylene Blends, Journal of Applied Polymer science , 2004, Vol 93, pp 364-371.
[89] S.H. Chang, H. Dongpark and W. Jei Cho, Recycling of Commingled Plastics by Cellulosic Reinforcement. Journal o f Applied Polymer Science, 1999, Vol. 74, pp 1531-1538.
[90] A.S.F. Santos, J.A.M. Agnelli, D.W. Trevisan and S.Manrich, Degradation and Stabilization of Polyolefins from Municipal Plastic Waste During Multiple Extrusions under Different Reprocessing Conditions, Polymer Degradation and Stability Journal, 2002, Vol 77, pp 441-447.
[91] G. Ragosta, P .Musto, e.Martuscellp and P. Russo,Recycling of Plastic Car Components, The Case o f Amultilayer Item Based on Polypropylene, Materials Science , 2000, Vol 35, pp 3741-3751.
[92] M. Mehrabzadeh and F .Faramand, Recycling of Commingled Plastic waste Containing Polypropylene, Polyethylene, and Paper, Journal of Applied Polymer Science, 2001, Vol 80, pp 2573-2577.
[93] M. Arroyo and M.Bell, Morphology Behavior Relationship and Recyclability of Composites Based on PP/EPDM Blends and Short Aramid Filbers, Journal of Applied Polymer Science, 2002, V ol 83, pp 2474-2484.
[94] P. Santos and S.H.Pezzin, Mechanical Propertis o f Polypropylene Reinforced with Recycled-Pet fibers, Materials Processing Technology, 2003, Vol 143, PP 517-520.
[95] N. Kukaleva, G.P.Simon and E.Kosior, Binary and Ternary Blends of Recycled High -Density polyethylene Contaiing Polypropylenes, Journal of Polymer Engineering and Science, 2003, Vol 43P2.
[96] C. Albano and G .Sanchez , Study of the Mechanical, thermal, and Thermodegraative Properties of Virgin PP with Recyled and Non-Recycled HDPE, Journal of Polymer Engineering and Science, 1999, Vol 39, P8.
[97] H. Ismail and Suryadiansyah , Thermopolis Elastomers based on polypropylene/ Natural Rubber and Polypropylene /Recycle Rubber Blends, Polymer Testing Journal, 2002, Vol 21, pp 389-395.
[98] J. Kuk, H.L. Sung and S. H. Hwang, Experimental Investigation of the Morphology Development and Mechancal Properties of Waste Ethylene Propylene Diene Monomer/ Polypropylene Blend in Modular Intermeshing Corotating Twin-Screw Extruder, Journal of Applied Polymer Science, 2002, Vol 85, pp 2276-2282.
233

[99] E .Vaccaro N .T.Dibenedetto and S J.Huang, Yield Strength of Low -Density Polyethylene Belnds , Polymer programme Journal,University of Connecticut John ,1997. *
[100] S.Tall, A .C.Albertsson and S. Karlsson, Recycling o f Mixed Plastic Fractions : Mechanical Proopertes o f Multicomponent Extruded Polyolefm Blends Using Response Surface Methodology, Experimental Investigation, Journal of Applied Polymer Scienceh, 1998, Vol 70, pp 2381-2390.
[101] H.P. Blom and A .Rudin, PP/PE Blends.IV.Characterizaion and Compatibilization of Blends of Postconsumer Resin with Virgin PP and HDPE, 1998,Vol 70, pp 2081 - 2095.
[102] C. Hsien and W.J. Liang, Effects o f Geometry and Injection-Molding Parameters on Weld-Line Strenght, Journal o f Polymer Engineering and Science, 2005, pp 1022- 1030.
[103] Y. Wyers, Y. Leterrier and J.A.E.Manson, Effect of Inclusions and Blendng on the Mechancal Performance of Recycled Multilayer PP/PET/So Films, Experimental Investigation, Journal of Applied Polymer Science, 2000, Vol 78, pp 910-918.
[104] E. Susan and M.Selke, Relationshi Between Cell Morphology and Impact Strength o f Microcellular Foamed High-Density Polyethlene/Polypropylene Blends, 2004, Vol 44, p8.
[105] N.T .Z. Dintcheva, F.P.LaMantia, R.Scaffaro, M.Paci, D.Aciemo and G.Camino, Reprocessing and Restabilization of Greenhouse Films, 2002, Vol 75, pp 459-464.
[106] P.D C. Jacob, A.K. Bhowmick and S.K.De, Recycling of EPDM Waste, Replacement of Virgin Rubber by Ground EPDM Vulcanizate in EPDM/PP Thermoplastic Elastomeric Compostion, Journal of Applied Polymer Science, 2001, Vol 82, pp 3304-3312.
[107] S. H. Chang, H. Dong Park and W.J. Cho, Compatibilizers for Rrecycling of the Plastic Mixure Wastes. The Effect of a Compatibilizer for Binary Blends on the Properties o f Ternary Blends, Journal of Applied Polymer Science, 2000, Vol 76, pp 1048-1053.
[108] M. Ruth, Campomans Santaa Manrich, Studies on Morphology and Mechanical Properties of Plypropylene/ High-Impact Plystyrene Blends from Postconsumer Plastic Waste, Journal o f Applied Polymer Science, 2003, Vol 88, pp 2861-2867.
[109] P .D. Marco,F.Charles and K.Eubanks,Compatibility Analysis of Product design for Recyclability and reuse,Columbus, February ,1994.
[110] J.K. Kim, S.H.Lee and S.H.Hwang, Study on the Thermoplastic Vulcanizate sing Ultrasonically Treated Rubber Powder, Journal of Applied Polymer Scienceh, 2003, Vol 90, pp 2503-2507.
234

[111] P. Santos and S.H.Pezzin, Mechanical Propertis of Polypropylene reinforced with Recycled -P et fibers, Journal of Materials Processing Technology, 2003, Vol 143, pp 517-520.
[112] H. Guang Leu, and H.L. Sheng, Cost-benefit Analysis o f Resource Material Recycling, Resources Conservation and Recycling, 1998, Vol 23, pp 183-192.
[113] K. Palmer and M, Walls, The Cost o f Reducing Municipal Solid Waste,Environmental Economics and Management, 1997, Vol 33, ppl28-150.
[114] K.S. Rebeiz and A.P. Craft , Conservation and Recycling Plastic Waste Management in Construction: Technological and Institutional Issues, Journal of Resources, Conservation and Recycling, 1995, Vol 15, pp 245-257.
[115] B. Hallberg , K. Aquilonius , Y. Lechon , H. Cabal and R.M. Sa'ez , Schneider c,S. Lepicard c, D. Ward d, T. Hamacher e, R. Korhonen , Studsvik Eco and Safety AB, External Costs of Material Recycling Strategies for Fusion Power Plants, Fusion Engineering and Design Journal, 2003, Vol 69, pp 699- 703.
[116] W. Reid Lea, Plastic Incineration Versus Recycling: a Comparison of Energy and Landfill Cost savings, Experimental Investigation Hazardous Materials, 1996 Vol 47,pp 295-302.
[117] E. Diamadopoulos, Y. Koutsantonakis and V. Zaglara, Conservation and Recycling Optimal Design of Municipal Solid Waste Recycling Systems, Resources, Conservation and Recycling Journal, 1995, Vol 14, pp 21-34.
[118] H. M. Raymond and D.C. Montgomery, Response Surface Methodology :Processand Product Optimization using Desigied Experment, Blacksburge Virginia Tempc ,Arizon Ju ly ,1995.
[119] N.N. Nawani and B.P. Kapadnis ,Optimization of Chitinase Production Using Statistics Based Experimental Designs, Experimental Investigation Process Biochemistry , 2005, Vol 40, pp 651-660.
[120] E.P George, Empirical Model Boilding and Response Surfaces (Wiley Series inProbability and Statistics), Canada, John, 1987.
[121] R .J. Whitman, Surveys for Starters an Introduction to Designing and ConductingManagement Survey, Survey Tools Corporation, USA, 2002.
[122] F. P. L. Mantia and J.L. Gardette, Improvement of the Mechanical Properties ofPhoto-Oxidized film after Recycling, Polymer Degradation and Stability, 2002,Vol 75, pp 1-7.
[123] B. Blumberg, D. R. Cooper and P. S. Schindler, “Business Research Methods”, MCGraw Hill, Beckshire, 2005, UK.
235

124] S. Sarantakos, “Social research”, 1993, Macmillan Press Ltd, London.
125] K. F. Punch, “Introduction to Social Research - Quantitative & QualitativeApproach”, 1998, Sage Publication, London.
126] M. Easterby-Smith, R. Thrope and A. Lowe, “Management research: Anintroduction”, Sage, 1991, London.
127] B. B. Flynn, S. Sakakibara, R. G. Schroeder, K. A. Bates and E. J. Flynn, “EmpiricalResearch Mmethods in Operation Management”, Journal of Operations Management, 1990, Vol 9, p 2.
128] H. F. Wolcott, “Posturing in qualitative inquiry”, in M.D. LeCompte, W.L. Millroyand J. Preissle (eds), “Handbook o f Qualitative Research in Education”, San Diego, CA, Academic Press, 1992, pp 3-52.
129] M. Hammersley, “Deconstructing the Qualitative-Quantitative Divide”, in J.Brannen , “Mixing methods: Qualitative and Quantitative Research”, Aldershot: Avebury, 1992, pp 39-55.
130] J. Brewer and A. Hunter, “Multimethod research: A synthesis of styles”, NewburyPark, CA, Sage, 1989.
131] Marshall, Catherine and B. Gretchen and Rossman , Designig Qualitative Research,1995, California, Sage Publications.
132] Ryan, Bob, W. Robert , Scapens and M. Theobald, 1992, Research Method andMethodology in Finance and Accounting, London ,Academic Press.
133] Press and Roy, Starting Research: An Introduction to Academic Research andDissertation Writing, 1994, London: Printer Publishers.
134] A. J. Maxwell, 1996, Qualitative Research design: An interactive Approach,California: Sage Publication.
135] A. Pinsonneault and K. L. Kraemer, “Survey Research Methodology in ManagementInformation System: An assessment”, Journal of Management InformationSystem, 1993, Vol 10, p 75-105.
136] A. Bryman , Quantity and Quality in Social Research , 1998, London: UnwinHyman.
137] R.G. Burgess, In the Field, 1984, London: Allen &Unwin.
138] Denzin and K.Norman.,The Research act, New Jersey:Prentice-Hall.
139] A. Simon, A. Sohal and A. Brown, Generative and case study research in qualitymanagement: part 1: Theoretical Considerations. Introduction Journal of Quality and Reliability Management, 1996, Vol 13, pp 32-43.
236

[140] F. N. Kerlinger, “Foundation o f behavioral research”, 3rd Edition, 1986, New York:Holt, Rinehart and Winston.
[141] M. J. Baker, “Selecting a research methodology”, The marketing review, 2001, Voll ,p p 373-397.
[142] S. Hart, “The Use of the Survey in Industrial Market Research”, Journal ofMarketing Management, 1987, Vol 3, pp 25-38.
[143] P. L. Alreck and R. B. Settle, “The Survey Research Handbook”, 1985, HomewoodIII.
[144] K.G. Diem, “Choosing a data Collection Method for Survey Research”, The StateUniversity of New Jersey, Desktop Publishing by RCE/Resource Centre Revised: February 2002.
[145] C. Moser and G. Kalton, Survey Methods in Social Investigation, 1971, HeinemannEducational.
[146] F. J. Fowler, “Survey Research Methods”, Beverly Hills, 1984, Sage Publication,Inc.
[147] Kompass Ireland, the Market Leader in Irish Business Databases, December 2003.Available online: http://www.kompass.ie/about-kompass/marketplace.html.
[148] Ireland and UK Business Companies, “KOMPASS” database Available online:http:// http://www.library.dcu.ie/.
[149] D. H. T. Walker, “Choosing an Appropriate Research Methodology”, ConstructionManagement and Economy, 1997, p 149-159.
[150] R. Czaja and J. Blair, “Designing survey”, Pine Forge Press, 1996.
[150] S. Sudman, “Asking Questions”, San Fracisco, Jossey-Bass Publishers, 1982.
[152] A. Fink, “How to Ask Survey Questions, 1995, London, Sage Publications, Inc.
[153] M.Y. Ismail, “Implementation o f Quality Management in the ManufacturingIndustry”, Phd Thesis, School o f Mechanical and Manufacturing Engineering in Dublin City University, Ireland, 1998.
[154] E.E Adam, P. M Swamidass, “Assessing Operations Management From A strategicPerspective”, Journal of Management, 1989, Vol 15, pp. 181-203
[155] S.K .Vickery, C. Droge and R.E. Markland, “Production Competence and BusinessStrategy: do they Affect Business Performance”, Decision Sciences, 1993, Vol 24, pp 435-455.
237

[156] B. M. Deros, S. M. Yusof, and A. M. Salleh, A survey on Benchmarking Perceptionsof Importance and Practices in Malaysian Companies”, ICAMT 2005 Proceedings, May 2004, Kuala Lumpur.
[157] G.S. Dangayacha and S.G. Deshmukhb, “An exploratory Study of ManufacturingStrategy Practices of Machinery Manufacturing Companies in India”, Omega, Article in press - available Online 25 December 2004.
[158] I. Miller and J.E. Freund, Probability and Statistics for Engineers, Franklin Institute1965, Vol 279, PP 474-475.
[159] W. L. Neuman, “Social Research Methods: Quantitative and Qualitativeapproaches”, 2nd edition, Boston: Allyn and Bacon, 1994.
[160] R.A. Zeller, “Validity” in J.P. Keeves (ed), Educational Research, Methodology andMeasurement: An International Handbook, 2nd Edition, Oxford: Elsevier, 1997, pp 822-829.
[161] Introduction to SPSS “Applied Technologies for Learning in the Arts & Sciences(ATLAS) (Revised September,)”, 2002, Available online:http://www.atlas.utiic.edLi/Stats/News%20and%20Resourccs/documcnts/SPSS-F102b.pdf.
[162] R. R. Pagano, “Understanding Statistics in the Behavioural Sciences”, FourthEdition, 1994, USA, West Publishing Company.
[163] C.C Ragin, “Constructing Social Research”, Thousnaf Oaks, CA: Pine Forge, 1994.
[164] P. Kline, “An easy Guide to Factor Analysis”, Routledge Publisher, 1994, London
[165] Module 24: C ross-Tabulation of Quantitative Data, March 2005. Available online:http://www.idrc.ca/en/ev-56452-201-l -DQ TOPIC.html.
[166 J.V Saraph, P.G Benson and R.G. Schroeder, “An Instrumant for measuring the critical factors of quality management”, Decision Science, 1989, Vol 20, pp 810- 829
[167] S. Rahman, “A comparative Study o f TQM Practice and Organisational Performanceof SMEs with and Without ISO 9000 Certification”, International Journal of Quality and Reliability Management, 2001, Vol 18, pp 35-49.
[168] D. George and P. Mallery, SPSS/PC step by step: A simple Guide and Reference,Wadsworth Publishing Co, 1995.
[169] J. Reilly, “Understanding Statistics and its Applications in Business, Science andEngineering”, 1997, Ireland, Folen Publisher.
[170] H. N. Norman, C. H. Hull, J. G. Jenkings, K. Steinbrenner and D. H. Bent,“Statistical Package for the Social Sciences (SPSS)”, McGraw-Hill, Inc, 1975.
[171] SPSS version 11 Course Tutorial Software, 2003.
238
[172] H.J. Motulsky, “Analysing Data with GraphPad Prism”, GraphPad Software Inc, SanDiego CA, 1999, pp. 135-153.
[173] J. Cohen, and P. Cohen, “Applied Multiple Regression/Correlation Analysis for theBehavioural Sciences”, Second Edition, Lawrence Erlbaum Associates (LEA), Publishers Hillsdale, New Jersey London, 1983, pp 25 - 79.
[174] H. McDonald and S. Adam, A comparison of Online and Postal Data CollectionMethodsin Marketing Research , Marketing Intelligence& Planning , 2003, Vol 21, pp 85-5.
[175] R. Mctronic and E. Sivadas, “Comparing Response Rate and Response Content inMail Versus Electronic Mail Survey”, Journal of Market Research Society , 1995,Vol 37, pp 29-39.
[176] D. Bachmann and J. Elfrink, Tracking the Progress of E-mail Versus Snal-Mail,Marketing Research, 1996, Vol 8, pp31-35.
[177] G. Keith and Diem, “Choosing a Dta Collection Method for Survey Research”, 2002.
[178] D.Shannon, E. Johnson, S.Searchy and A.Lott, Using Electronic Survey: AdviceForm Ssurvey Professionals, 2002.
[179] Introduction to the Application of Web-Based Survey, June 2004. Available onhttp//tps.dpi.state.nc.us/ncd/surveyweb/introduction on the application .him..
[180] M. Carbonaro, J. Bainbridge and B. Wolodko,”Using Internet Survey to Gather DataFrom Teachers:rials and Triblations”, Journal of Educational Tchnology, Australian, 2002, Vol 18, pp 275-292.
[181] L.Parker, “Collecting Data the E-Mail Way” Training and Development, 1992, pp52-54.
[182] Y.Zhang, “Using the Internet for Survey Research: A Case Study”, Journal of theAmerican Society for Information Science, 2002, Vol5, pp 57-68.
[183] Matthis / ’Conducting Research Survey via E-mail and the Web”, 2001.
[184] Introduction in “SPSS”, November 2003. Available on:http://www.utexas.edu/cc/stat/software/spss/.
[185] D.C.Montgomery, Desgin and Anlysis of Experiments.2ndEdition, JohnWiley&Sons, New York, 1984.
[186] Design-Expert Sofwer, V7, Users Guide, Technical Manual, Stat-Ease Inc, Minneapolis,MN, 2005.
239

[187] K. Y. Benyounis, Prediction And Optimization of Residual Stresses- Laser Weid, Thesis of PhD, School of Mechanical and Manufacturing Engineering in Dublin City University, Ireland, February 2007.
240

APPENDIX

SSty * .' V * ' rS IN N O .
SURVEY QUESTIONNAIRE
Study on the recycling of plastic materialsThis questionnaire is divided into three sections; Section A: Company profile; Section B: Recycling of plastic materials; Section C: Marketing and resale of Recycled products.All the information will be treated strictly confidential and thank you for your co-operation with this survey.
■ (Please note that ; this study concerns with plastic rejects arising as a result o f scrap or damaged products, sprues, runners )
& SECTION A: COMPANY PROFILE
A 1 -Ownership. (Tick as applicable). 1. riLocal 2. □ Mixed 3. n Foreign
A2-How many years has your company been manufacturing plastic products. (Tick)
n<5 □ 6 -9years □ 10-20 years □21-30years □>30
A3- Number of employees on site. (Tick)
□<50 □ 50-100 □100-200 □200-500 □500-1000 □ Over
A4- Approximately, how much did you spend training staff in recycling in recent years? (Tick as applicable).
N. Years € 0 €1-4999 € 5000- 9999
€10,000-24,999
€25,000-49,999
€50,000+
1. 2001 □ □ □ □ □ □
2. 2002 □ □ □ □ □3. 2003 □ n □ □ □4. 2004 □ □ □ □ □ □
A5-Which of the following methods o f processing plastics, are used in your company?
Core Business
Yes NoI. Injection Moulding □ □2. Extrusion Moulding □ □3. Blow Moulding □ □4. Others □ □
A -l

jet SECTIONS: RCYCLING OF PLASTIC MATERIALS
Bl - Does your company invest in the recycling of rejects. (Tick as applicable)□ Yes uNo
B2- If yes, how long has the company been carrying out recycling? (Tick as applicable)
L<2 .3-5 years C6-9 years 10-15 years >16
B3- On average what percentage of rejects come from the process products of fowling years in your company? (Tick as applicable)
N. Years <2% 3-5 % 6 -9 % 10-15% >16%1. 2001 □ 1 1 H2. 2002 1 □ □ □ □3, 2003 □ □ □ □ □4. 2004 ; I □ □
B4- Approximately, how many percentage of rejects come from the process of recycled products? (Tick as applicable)
N. Ton <2% 3-5 % 6 -9 % 10-15% >16%1. <200 □ □ 71 1 712. 200-800 □ □ □ 71 □3. 800-1500 □ □ n q D4. 1500-3000 □ □ □5. Over 3000 —1 . | □ □ □
B5- In which year was recycling introduced for the following plastic materials? (Tick as applicable).
[Scale: 1= None Recycled, 2= Recycled]
N. PlasticMaterial
2001 2002 2003 2004
1 2 1 2 1 2 1 21. PP n 71 □ 71 □ □ □ □2. PS □ □ □ 71 □ □ □3. PVC □ 71 □ d ; □ □ □4. HDPE 'T T " 0 □ 0 0 1 □ 7)5. LDPE □ 71 □ □ 1 □ □ □6. EPS □ "1 □ □ 0 □ 171 n7. ABS 71 7T □ □ □ .71 □ □8. PET a □ □ □ 1 □ □ □9. Other □ a □ □ 71 D □
B6- How many times does your company recycle the plastic materials? (Tick as applicable)
1.UFirst Recycling 3. □ Third Recycling2.D Second Recycling 4.nMore Recycling
A -l

B7- On average, in your company what percentage of each plastic material is recycled? (Please tick for each recycling stage).
[Scale: 1=0%, 2=1-5%, 3=6-9%, 4=10-15%, 5= >16%|
N. PlasticMaterial
First Recycling Second Recycling Third Recycling
1 2 3 4 5 1 2 3 4 5 1 2 3 4 5
1, PP n 71 □ □ n □ □ 1 □ □ □ □ 71
2. PS □ i □ 71 □ □ □ □ □ □ □ □ “I
3. PVC n □ n □ n □ □ n □ □ 1 □ □ □ □4. HDPE □ □ □ □ □ □ □ □ □ □ □ □ □ H □5. LDPE □ □ □ □ □ 1 □ □ □ □ □ 1 □ □ □6. EPS □ i □ □ □ □ n □ □ n □ 3 □ □ 17. ABS n □ i □ i □ □ □ n □ □ □ □ □8. PET n □ n □ n □ □ “i □ □ 1 □ n n □9. Other □ i □ ~l □ □ □ □ □ □ n □ □ □
B8- In your opinion, which o f the following input parameters reduce the quality of recycled products in your company? (Please tick for each recycling stage).
[Scale: 1= Process, 2= Materials, 3= Personnel skill]
N. PlasticMaterial
FirstRecycling
SecondRecycling
ThirdRecycling
1 2 3 1 2 3 1 2 3
1. PP □ □ □ □ □ □ □ □2. PS n □ n □ □ n □ □3. PVC □ n □ □ n n □ n4. HDPE i □ LI 71 □ □ 71 □5. LDPE n □ □ n □ □ □ □ □6. EPS □ □ □ □ □ n □ □7. ABS □ n □ □ n □ □ T8. PET □ □ □ “I □ □9. Other □ □ n □ □ □
B9-Please choose the specific reason(s) why recycling was not used in each year. (Where applicable).
N. Reason(s) 200 2002 2003 20041. Cost of recycling process □ □ □ □2. Inadequate personnel skills □ □ □ n3. Cheap Raw material □ □ □ n4. Inability to distribution marketing □ □ □ 715. Reduction in quality □ □ □ □6. Low price sales □ □ □ □7. Decreased market in recycled products n □ n □8. Decrease quantity of productivity n □ □ □9. Others □ □ □ □
A-l

BIO- In your opinion what are the economic benefits o f recycling plastic materials in your company. (For each year as appropriate).
N. Economic Benefits 2001 2002 2003 2004
1. Increased productivity □ n □ □2. Maximizes Sales □ □ □3. Reduce process cost □ II 1 □4. Low cost products □ □ 35. Maximizes profits □ □ □ 16. More Competitive n “I □7. Others n □ 1 □
B 11- For each plastic material, how is Cost affected by the recycling process? (Please tick for each recycling stage).
[Scale: l=Increased Cost, 2= Decreases Cost, 3= No change Cost]
N. PlasticMaterial
First recycling Second recycling Third recycling
1 2 3 1 2 3 1 2 31. PP □ 1 J □ □ □ II □ 'J2. PS □ □ □ □ □ □ II n II3. PVC n □ □ □ □ □ □ □ □4. HDPE □ □ □ □ □ □ ~1 □ □5. LDPE □ "1 D n □ n n □ □6. EPS □ 1 □ □ □ □ n D7. ABS □ 3 □ □ □ □ □ □8. PET □ □ 3 □ □ n n □ □9. Other n □ □ □ □ □ □ 1
B12- For each plastic material, how is Productivity affected by the recycling process? (Please tick for each recycling stage).
[Scale: 1= Increase Productivity, 2= Decrease Productivity]
N.Plastic
MaterialFirst
recyclingSecond
recyclingThird
recycling
1 2 1 2 1 21. PP □ □ □ □ □ □2. PS □ □ □ □ □ □3. PVC □ H □ □ □ □4. HDPE □ □ □ □ □ 35. LDPE □ □ n □ n □6. EPS □ □ □ □ □ □7. ABS □ □ □ □ □ □8. PET □ □ □ □ □ □9. Other □ □ n □ □ □
A -l

B13- For each plastic material, how is Quality affected by the recycling process? (Please tick foreach recycling stage).
[Scale: 1= Increases Quality, 2= Decreases Quality, 3= No Change Quality]
N.Plastic
Material
Firstrecycling
Secondrecycling
Thirdrecycling
1 2 3 1 2 3 1 2 3
1. PP □ □ □ □ □ □ □ □ □2. PS □ □ □ □ □ □ □3. PVC □ □ □ □ □ □ □ □ Ll4. HDPE □ □ n □ □ □ □ □ n5. LDPE □ □ I _□ 1 □ □ □ □ □6. EPS □ □ L □ ' □ D . □ □ □ 717. ABS □ □ ZD1 .. □ □ □ □ □ □8. PET 1 □ □ □ □ □ n □ □9. Other □ □ □ □ □ □ □
B14- When choosing a process, which one of the following has an impact on your choice?(Tick as applicable).
1. □ Screw speed 5. □ Venting 9. □ Cooling2. □ Barrel temperature 6. □ Injection pressure 10. □ Moving piston rod3. □ Mould Shaping 7. □ Nozzle temperature 11. □All of the above4. □ Mould temperature 8. □ Hydraulic
B15- In your opinion, which of process parameters reduces the quality of recycled products in your company. (Please tick for each recycling stage).
[Scale: 1= Screw Speed, 2= Barrel Temperature, 3= Mould Temperature]
First recycling Second recycling Third recycling
N. PlasticMaterial
1 2 3 4 1 2 3 4 1 2 3 4
1. PP □ □ □ □ □ 1 □ □ □ □ □ □2. PS □ □ □ □ □ n □ □ □ □ □3. PVC □ □ □ Ll □ □ n □ n □ □4. HDPE □ □ □ □ □ □ □ n □ □ □ 15. LDPE □ □ □ □ □ □ Ll Irn □ □ □ n6. EPS 111 il !ull □ n d □ □ □ □ □ □ □7. ABS □ . □ □ □ □ □ □ □ □ □ □ n8. PET □ □ □ □ n □ _o □ □ □ □9. Other □ □ □ □ □ □ □ □ □ □ □ □
A -l

SECTION C: MARKETING AND SALE OF RECYCLED PRODUCTS
Cl-Does your company sell recycled products. (Tick as applicable)
□ Yes □NoC2- If yes, how long has the company been involved in the sale of products.
(Tick as applicable)
□ <2 1 23-5 years □ 6-9 years □ 10-15years □ >16
C3- On average what percentage of profits come from the sale of recycled products? (Tick as applicable)
□ 2% [J5% □ 10% □ 15% C30% □45% □ MoreC4- How has the sale of recycled plastic materials affected sales, during the following
years in your company. (For each year as appropriate).
[Scale: 1= Increase, 2= Decrease]
N. PlasticMaterial
2001 2002 2003 2004
1 2 1 2 1 2 1 2
1. PP □ □ □ □ n □ □2. PS □ □ a □ □ □ 1 □ □3. PVC □ □ □ □ □ D 1 □ □4. HOPE □ □ □ □ □ O □ □5. LDPE □ □ □ □ □ □ □6. EPS □ □ □ □ □ □ □7. ABS □ □ □ □ □ _□ _ □ n8. PET □ □ □ □ □ □ □ □9. Other □ □ □ □ CL.. □ □
C5-What are the market benefits of recycling in your company. (For each year as appropriate)
N. Market Benefits 2001 2002 2003 2004
1. Low price □ □ □ □2. Consumer Satisfaction □ □ □ □3. Increased Productivity □ □ □ O4 Maximizes Sales □ □ □ □5. Financial diversity □ □ □ rr6. Reduced process cost □ □ □ □7. Maximize profits □ □ n □8. More Competitive n □ □ □9. Others □ n D □
A -l

C6-How would you rate the cost of each recycling process?[Scale: 1= Low Price, 2= Medium Price, 3= High Price]
PlasticMaterials
First recycling Second recycling Third recycling
1 2 3 1 2 3 1 2 3PP □ n □ □ □ □ □ □ "]
PVC □ □ □ □ □ □ □ □ □HDPE n □ □ □ □ □ n "1LDPE n □ □ □ □ □ □ 3EPS n □ 0 □ □ 3 3 □ABS i □ n □ 3 □ □
PS □ □ □ □ □ 3 □ □ 3PET 3 3 □ □ 11 □ □ n 3
Other n □ 3 □ □ □ 3
CMany thanks fo r your patience; your fiincC cooperation is very much appreciated.
RE- CONTACT
In case we need to get some further information on the above study, are you willing to be participate and be contacted again.
In.Yes 2n.N oIf yes, please specify.
In.E-mail-pleasespecify___________________________________________________________2 3 .Further questionnaire 3 □ .InterviewPlease add any further information you feel may be useful to this study in the space
provided below f
Please return (using the pre-addressed and stamped envelope) to:
School of Mechanical and Manufacturing Engineering, Dublin City University, Dublin 9, Ireland.
A -l

17 th Feb.2005
Dear Sir/Madam
Please find enclosed questionnaire for a recycling industry survey o f plastic processing companies. The school o f Mechanical and Manufacturing Engineering at Dublin City University is undertaking a study to determine the practice o f recycling plastic rejects practices in the Manufacturing plastic industry.I am studying the influence of investment incentives to promote the implementation of recycling manufacturing technology in the plastic industry in Ireland. It is for this reason this survey is directed to the manufacturing industry in Ireland. Your experience in recycling practices and contribute greatly to this research effort .we acknowledge that it is going to take some effort on your part to complete the whole questionnaire and in order to be sure that the questionnaire is understandable, to get any suggestion for improvements in this study or to avoid any difficulty and to observer that the instructions and question work as expected.
How to com plete this questionnaire:
I - Most of the questions and simply which require a tick.
2-When you have completed the questionnaire just slip it into the envelope provided and mail it direct to.
M r: L utfi Elgam m udiSchool o f M echanical and M anufactu ring Engineering D ublin City University G lasnevin, Dublin 9, Ireland
Please return it before 1st March.2005 if possible.
Thanking you in anticipation of your kind co-operation. Your support is greatly appreciated.
Yours faithfully
Prof. M.S.J. Hashmi
A-2

2 nd .March.2005
Please find enclosed questionnaire for a recycling industry survey o f plastic processing companies. The school o f Mechanical and Manufacturing Engineering at Dublin City University is undertaking a study to determine the practice o f recycling plastic rejects practices in the Manufacturing plastic industry.I am studying the influence of investment incentives to promote the implementation of recycling manufacturing technology in the plastic industry in Ireland; it is for this reason this survey is directed to the manufacturing industry in Ireland. Your experience in recycling practices and contribute greatly to this research effort .we acknowledge that it is going to take some effort on your part to complete the whole questionnaire.
How to com plete this questionnaire:1 -Most of the questions simply require a tick.2-When you have completed the questionnaire just slip it into the envelope provided
and mail it direct to.
M r: L utfi E lgam m udiSchool o f M echanical and M anufac tu ring Engineering D ublin C ity University G lasnevin, D ublin 9,Ireland
Please return it before 31st March.2005 and automatically qualify for a:Lucky Draw1 st Prize 200 cash2 nd Prize Dinner for two in a restaurant of your choice3 rd Prize Dinner for one in a restaurant of your choice
Please enclose self-addressed envelope, which will be used to notify you should you become one o f the lucky winners. Your response will be held in strict confidence. The five-digit code in the questionnaire will be computer generated and is used to ease our enormous administrative task.Thanking you in anticipation of your kind co-operation. Your support is greatly appreciated.
Yours faithfully
Dear Sir/Madam
Prof. M.S.J. Hashmi
A-3

15th June.2005
Dear Sir/Madam
This is just to remind you tat a survey questionnaire sent to you company on the 10th April 2005 may not have been addressed directly to you. If you have already completed the questionnaire and returned it to us we would like to thank you and please ignore this letter.
But if you have not done so yet owing to any reason, we would like to request you to kindly completed the questionnaire and return as to us soon as possible.
When you have completed the questionnaire just use the envelope provided and mail it direct to:
Mr: Lutfi ElgammudiSchool of Mechanical and Manufacturing Engineering Dublin City University Glasnevin, Dublin 9, Ireland
I would like to emphasize that is very important project we have undertaken and its
success will depend on good response from the industry.
We realize that we have nothing to offer you in return for our-operation other than our
appreciation and free participation I a Prize Draw (Dinner for 2- € 150), which will be
conducted by the middle of July 2005.
Your time and co-operation highly appreciated
Yours faithfully
Prof. M .S.J. Hashmi
A-4
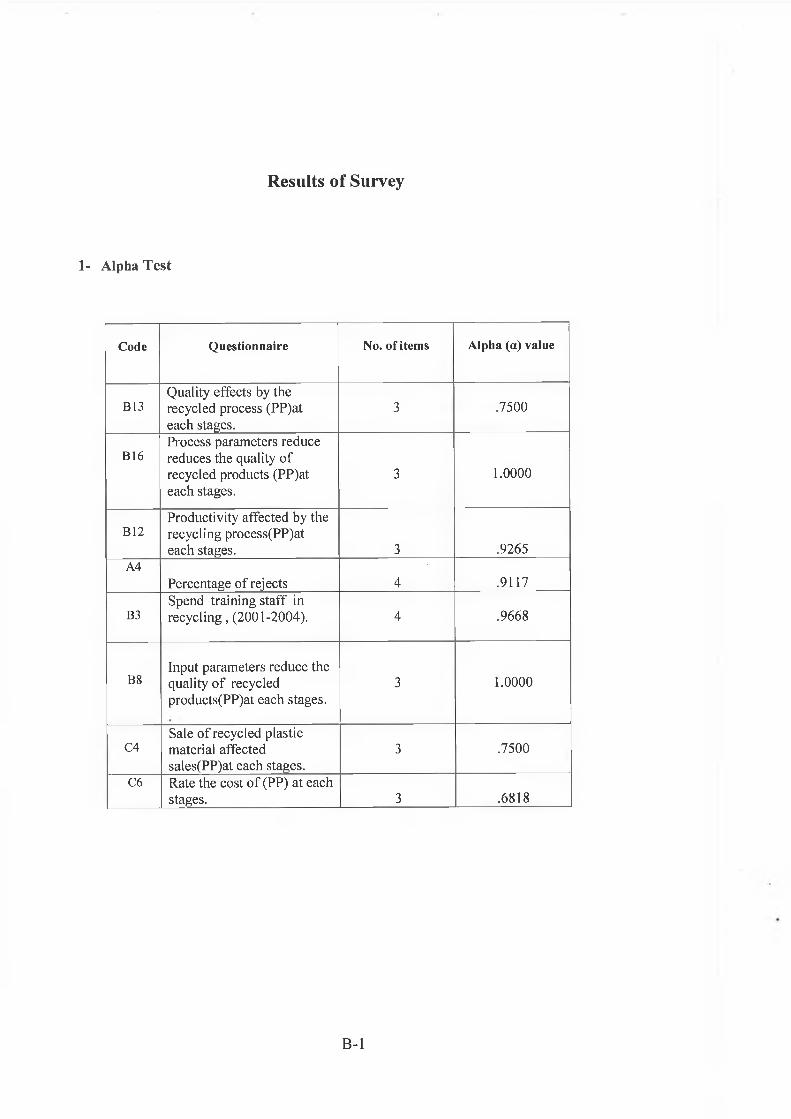
Results of Survey
1- Alpha T est
Code Questionnaire No. of items Alpha (a) value
B 13Quality effects by the recycled process (PP)at each stages.
3 .7500
B16Process parameters reduce reduces the quality of recycled products (PP)at each stages.
3 1.0000
B12Productivity affected by the recycling process(PP)at each stages. 3 .9265
A4Percentage of rejects 4 .9117
B3Spend training staff in recycling, (2001-2004). 4 .9668
B8Input parameters reduce the quality of recycled products(PP)at each stages.
3 1.0000
C4Sale of recycled plastic material affected sales(PP)at each stages.
3 .7500
C6 Rate the cost of (PP) at each stages. 3 .6818
B -l

2-Frequency
Table B3: Percentage o f rejects come from the process products?
■ <2%■ 3-5 %
0 6 -9 %
□ 10-15%
■ >16%__ |
<200 200-800 800-1500 1500-3000 Over 3000
Number of Tonnes
Table B5: recycling introduced for the following plastic materials?
-2001
! ■ R ecy c led
■ N o n cR ecy c led
P P PS P V C H D P E L D P E E P S A B S P E T O th e r
P e r c e n ta g e s o f M a te r ia l
-2002
%
P e rc e n ta g e s o f M ate r ia l
■ R ecycled
■ N o n e R ecycled
B-2
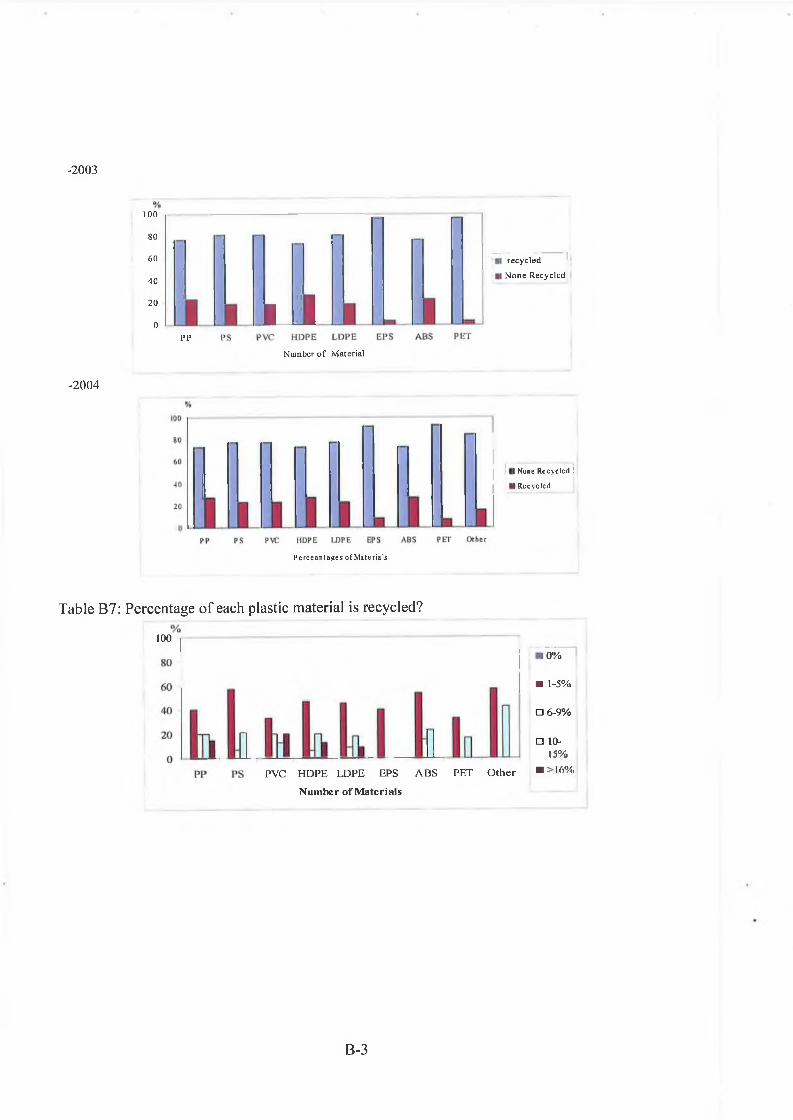
-2003
80
60
40
20
0
100
PP
□ II
I recycled
I None Recycled. !
Number o f Material
-2004
I None R e c y c l e d !
I R e c y c l e d
P e r c e a n t a g e s o f M a te r i a l s
Table B7: Percentage of each plastic material is recycled?
100
10%
■ 1-5%
O 6-9%
□ 10-
15%
PVC HDPE LDPE EPS ABS PET O ther ■ >16%
Number ofMaterials
B-3

Table B9: Specific reason(s) why recycling was not used in each year.
2001 2002 2003 2004
N u m b e r o f Y ea rs
■ Increase o f cost
□ inadequate personnel skills
□ C heap Raw material
■ Reduction in quality
■ D ecreased m arket in recycled products
■ D ecrease quantity o f productivity
□ O thers
Table BIO: Economic benefits of recycling plastic materials.
2001 2002 2003N um ber o f Y ears
2004
■ Low price
■ Increased Productivity
□ Maximizes Sales
□ Financial diversity
■ Reduced process cost
■ Maximize profits
■ More Competitive
□ Others
Table B12: Productivity affected by the recycling process?
- First Stage
%
■ IncreaæsProductivity
■ DecreaæS^oductivity
□ No change Ftoductivity
N umber o f M Sends
80
ill LilliLpp PS FVC HDPE LDFE Eps Abs PET other
B -4

-Second Stage
10080
60
40
20
0
%
! H Increases P roductiv ity I ■ D ecreases P roductiv ity | □ N o ch an g e P roduc tiv ity
PP PS PVC HDPE LDPE Eps A bs PET o th e r
N um ber o f materials
- Third Stage
! ■ I ncreaassProductivity ;
■ Decreæ ssProductivity 1
□ N o change P rodu ctiv ity ,
PP PS F V C H D P E LDPE Eps Abs P E T other
Table C3: profits come from the sale of recycled products?
Number of Profits
Table C4: Recycled plastic materials affected sales, during the following years.
-2001
%
PP P S P V C H D P E L D P E E p s A b s P E T o th e r
Number of Material
B-5

-2002
-2003
2004
% 100
80
„ 60
m 40
20
0
I In c rea se
I D ecrease
P P P S P V C H D P E L D P E E p s A b s P E T o th e r
Number of Material
100
□ Increase S Decrease
PVC HDPE LDPE Eps Abs PET other
Number o f Material
£3 Increase
■ D ecrease
P P PS PVC H D PE L D PE E ps A b s PET o th e r N u m b e r o f M a te ria l
Table C5: Market benefits of recycling.
2001 2002 2003
N u m b er o f Y e a r s
2004
■ L ow price
■ Increased Productivity
□ Maximizes Sales
□ Financial diversity
■ R educed process cost
■ Maximize profits
■ M ore Competitive|
□ O thers
B -6

2-C ross T abulation
Does yo u r com pany invest in th e recyc ling o f
re jec tsTotalYes No
O w nersh ip Loca l% o f Total 66.7% 7.4% 74.1%
Mixed% o f Total 7.4% 7.4%
Foreign% o f Total 14.8%
13.7% 18.5%
Total% o f Total 11 1% . 1,00 0%
D oes yo u r c recyc led
om panysellp roduc ts
TotalY e s NoO w n e rs h ip Loca l
% o f Total 37 .5% 37.5% 75.0%M ixed
% o f Total S.3% 8.3%Foreign
% o f Total 4 .2% 12.5% 16.7%Total
% o f Total 41 .7% 58.3% 100.0%
How many time does yourcompany r ecycle the plastic materials
TotalFirst RcycllngSecond
RecyclingMore
RecyclingOwnership Local
% of Total 66.7% 7.4% 74.1%
% of Total 3,7% 3.7% 7.4%Foreign
% of Total 14.8% 3 7% 18.5%
Total% of Total 85 2% 7.4% 7.4% 100.0%
B-7

How many time does yourcompany recycle the plastic materials
TotalFirst RevelingSecond
RecyclingMore
RecyclingApproximately ,wtiat *2%percentage of rejects % of Total 38,1% 9.5% 9.5% 5 7 1%ujnib from Ihe pruuexs 3_g% —<200 of recycled products
% oi Totsai 23.8% 23 8%6*3%
% of Total 4 8% 4 8%
10-15%% of Total 14.3% 14,3%
Total% of Total 81,0% 9.5% 9.5% 100.0%
How much did yiu spend trainig s ta ff Inrecycling,2001 years
Total«0 €1-4999 €5000-9999€25,000-4
9,999Number of <50employees on % o f Total 36.0% 20.0% 40% 600%Sllc 50-100
% of Total 4.0% 4.0% 80%100-200
% of Total 20.0% 4.0% 24.0%200-500
% of Total 4 0% 4 0% 80%Total
% o f Total 44 0% 480% 4.0% 4 0% 100.0%
How much did y'w spend trainig staff in recycling,2002 years
Total® €1-4999 65000-9999€10,000-2
4.999€25,000-4
9,999Number of <50employees on % o f Total 21.7% 26.1% 43% 43% 56.5%5je 50-100
% o f Total 8.7% 8.7%100-200
% of Total 17.4% 43% 4,3% 26.1%200-500
% of Total 4.3% 4.3% 87%
Total% of Total 26.1% 565% 8.7% 4.3% 43% 1000%
B-8
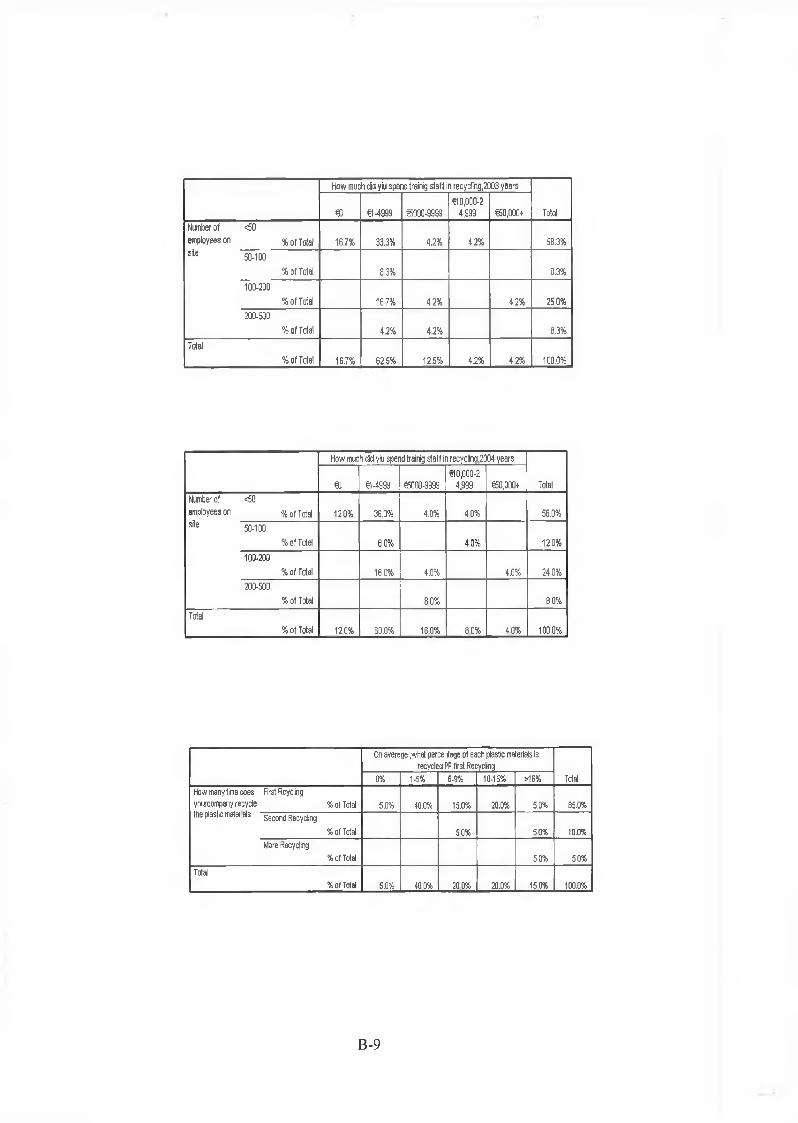
How much did yiu spend trainig sta ff in recycling,2003 years
Total€0 €1-4999 €5000-9999€10,000-2
4,999 60,000+
Number of <50employees on % of Total 16.7% 33.3% 4.2% 42% 58.3%
site 50-100% of Total 83% 8.3%
100-200% of Total 16.7% 42% 42% 25 0%
200-500% o f Total 4.2% 4.2% 8.3%
Total% o f Total 16.7% 625% 12.5% 4.2% 42% 100.0%
How much did yiu spend trainig sta ff in recycling,2004 years
Total€0 €14999 €5000-9999€10,000-2
4.999 €50,000+Number of <50employees on % of Total 120% 36.0% 4.0% 40% 56.0%
site 50-100% o f Total 8.0% 4.0% 12.0%
100-200% of Total 16.0% 4.0% 4.0% 24.0%
200-500% of Total 80% 80%
Total% o f Total 120% 80.0% 16.0% 80% 4 0% 1000%
On average ,whet percentage ol each plastic materials isrecycled PP .first Recycling
Total0% 1-5% 6-9% 10-15% >16%How many time does First Rcyciing yoiicompany recycle % of Toted 5.0% 40.0% 15.0% 20.0% 5.0% 85.0%thu plastic materials Second Recyctng
% of Total 50% 50% 10.0%More Recycling
% ot Total 50% 50%Total
% of Total 5.0% 400% 200% 20.0% 150% 100.0%
B-9

H o w bnn tws f f e compsnv been corryno o i i recyclngTola!¿2 3 -5 r iS fS B-9 yssis 10 -1 5 y e « »18
H o w irony years h i» s5your C M p a ry been % o f T ( M 3 8 % 3 9 %monulocturro pteEllc
f ' 0^ 5 ' % or r a n 7.7% 7 7%
10 -iO years% or Total 3.9% 11,5% 11% 23.1%
21.30 yea ia%ol TcW 3.8% 7.7% 7 7% 3.8% 11.5% 34,8%
?33f> o f Total 3 9 % 3 8 « 3 8 % 15? % 30 0%
Tolol% 0 fT « IV 7,7% 1 1 5 % ? a .i% 1 9 7 * 385% 100 H i
Does your c recycled
ompanyselloruducts
TotalYes NoHow many years has <5your company bsen % 0f Total 4.2% 4.2%manufacturing plastic 6 g „ ears
Pr" " % of Total 8.3% 3.3%10-20 years
% of Total 8.3% 16.7% 25 0%21-30 years
% o f Total 16.7% 16.7% 33.3%
>30% of Total 8.3% 20.8% 29.2%
Total% o f Total 41.7% 58.3% 100.0%
D*n average waht percentage o t profits come from the sale of recycled
productsTotal2% 5% 10%
if y e s ,how long has <2yearsthe company been % 0f Total 14 .3 % 1 4 3%Involved h iLhtt sale uf 3 .5years
% of Total 14 .3% 7 .1% 21.4%6-9years
% of Total 14 .3% 7 1 % 21.4 %10-1 Syears
% of Total 7 .1% 7 1 % 14 .3%> 16years
% of Total 7 .1% 14 .3% 7 .1% 28.6%Total
% of Total 3 5 7 % 7 1 % 100.0%
B-10

R e t o process costTotal200! 2002 2003 2004
Does your company invest Yesin the recycling of rejects % of Total 76.2% 4.8% 4.8% 4,8% 90.5%
No% of Total 4.8% 4.8% 3.5%
Total% of Total 81.0% 95% 4.8% 4.8% 1000%
Maximizes [io lisTotal20)1 2002 2003 2004
Does your company w est YesInthe recycling of rejects % of Total 750% 5.0% 10.0% 5.0% 95.0%
No% of Total 5.0% 5.0%
Total% of Total 00.0% 5.0% 10.0% 5.0% 100.0%
B - l l

3-C orrela tion
Correlations
How m any tim e does
yourcom pany recycle the
plastic m aterials
Reduceprocess cost
Kendall's tau_b How m any tim e does Correlation Coefficien 1 . 0 0 0 .386*yourcom pany recycle sig . (2 -tailed) .024the plastic m aterials ^ 38 29
Reduce process cost Correla tion Coefficien .386* 1 . 0 0 0
Sig. (2-tailed) .024
N 29 63*• Correlation is significant at the .05 level (2-tailed).
How m any tim e does
yourcom pa ny recycle the p lastic m ateria ls
M axim izesprofits
S pearm an 's rho How m any tim e does C orre la tion C oeffic ien t yourcom pany recycle s jg . (2 -ta iled) the p lastic m ateria ls N
1 . 0 0 0
38
.492*’
009
27
M axim izes profits C orre la tion C oeffic ien t
Sig. (2-tailed)
N
.492**
.009
27
1 . 0 0 0
6 6
**■ C orre la tion is s ign ifican t at the .01 level (2-tailed)
Does your com pany
invest in the recycling of
rejects
how is quality affectes by
the recycling process
Spearm an's rho Does your com pany inve: Correlation Coefficien in the recycling of rejects sig. (2 -tailed)
N
1 . 0 0 0
27
- 1 .0 0 0 *
. 0 0 0
17
how is quality affectes by Correlation Coefficien the recycling process s jg (2 -tailed)
N
- 1 .0 0 0 **
. 0 0 0
17
1 . 0 0 0
18
**• Correlation is s ignificant at the .01 level (2-tailed).
B-12
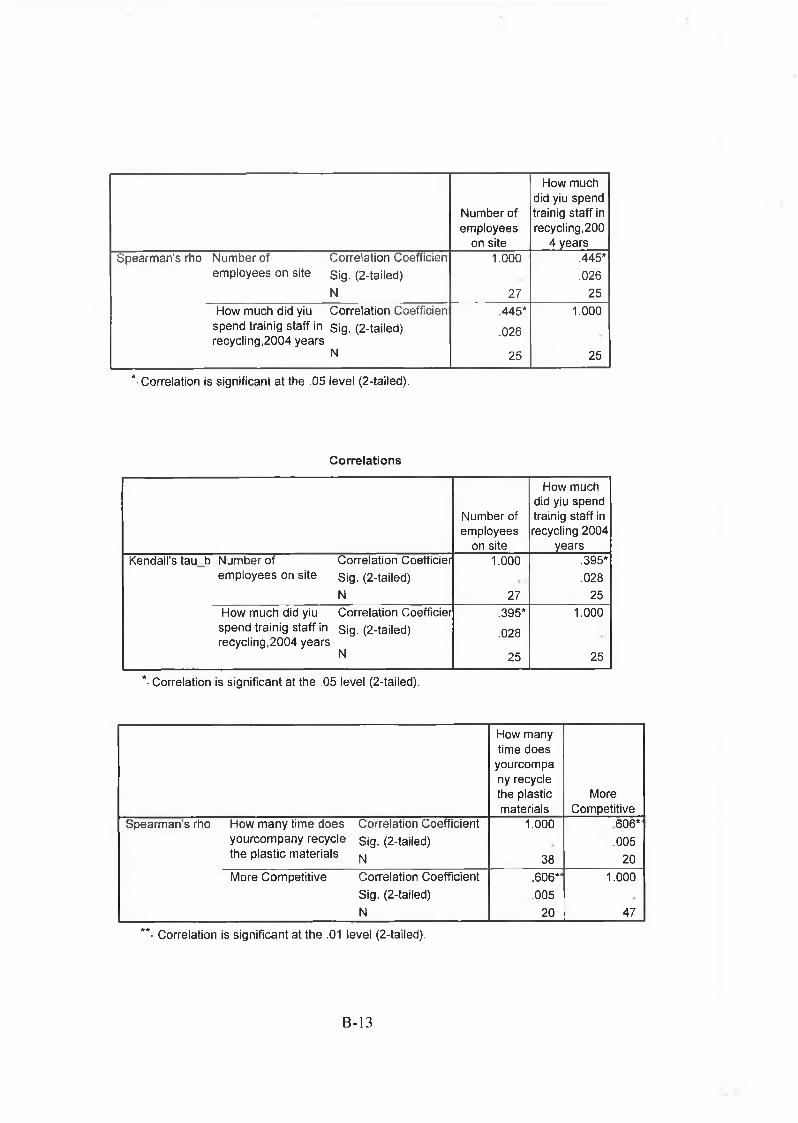
N um ber o f em ployees
on site
How much did yiu spend tra in ig s ta ff in recycling , 2 0 0
4 yearsS pearm an's rho N um ber o f C orre la tion C oeffic ien 1 . 0 0 0 .445*
em ployees on site Sig. (2-ta iled) .026
N 27 25
How m uch did yiu C orre la tion C oeffic ien .445* 1 . 0 0 0
spend tra in ig s ta ff in s ig . (2 -ta iled) recycling ,2004 years
.026
N 25 25
*■ Corre la tion is s ign ifican t a t the .05 leve l (2-tailed).
Correlations
N um ber of em ployees
on site
How much did yiu spend train ig s ta ff in recycling,2004
yearsKendall's tau b N um ber o f C orre la tion Coeffic ier 1 . 0 0 0 .395*
em ployees on site Sig. (2-ta iled) .028
N 27 25
How m uch did yiu C orre la tion Coefficier .395* 1 . 0 0 0
spend tra in ig s ta ff in Sig. (2-tailed) .028recycling ,2004 years
N 25 25
*• Corre la tion is s ign ifican t at the .05 level (2-tailed),
How m any tim e does
yourcom pa ny recycle the plastic m aterials
MoreC om petitive
Spearm an's rho How m any tim e does C orre la tion C oeffic ien t 1 . 0 0 0 606*'you rcom pany recycle Sig. (2-tailed) .005the p las tic m ateria ls N 38 2 0
M ore C om pe titive C orre la tion C oeffic ien t .606** 1 . 0 0 0
Sig. (2-tailed) .005
N 2 0 47
**• Corre la tion is s ign ifican t at the .01 level (2-tailed).
B-13

How many tim e does
yourcom pa ny recycle the plastic m ateria ls
Reduce process cost
Spearm an's rho How m any tim e does C orre la tion C oeffic ien t 1.000 .423*yourcom pany recycle S ig. (2-ta iled) . 0 2 2
the p las tic m ateria ls N 38 29
R educe process cos t C orre la tion C oeffic ien t .423* 1 . 0 0 0
Sig. (2-ta iled) . 0 2 2
N 29 63
*• Corre la tion is s ign ifican t at the .05 level (2-ta iled).
B-14

1- Wight of recycling samples
Table 1: First recycle weighting
No.
Weight in g Average
Weight1 2 3 4 5
1 0.79436 0.78721 0.7162 0.71995 0.72008 0.747562 0.80879 0.80996 0.79735 0.81029 0.80912 0.8071023 0.81925 0.8198 0.81878 0.81973 0.81952 0.8194164 0.80888 0.80872 0.80902 0.80867 0.8091 0.808878
5 0.81578 0.81533 0.81408 0.8153 0.8154 0.8151786 0.81088 0.80856 0.80988 0.80976 0.80949 0.8097147 0.81574 0.81646 0.81615 0.8162 0.81634 0.8161788 0.8109 0.8105 0.81096 0.81145 0.81028 0.8108189 0.81692 0.81637 0.81729 0.81759 0.81735 0.817104
1 0 0.81042 0.81061 0.81028 0.8106 0.81119 0.8106211 0.80929 0.80874 0.81026 0.80969 0.81019 0.8096341 2 0.81045 0.80994 0.81024 0.81002 0.80985 0.810113 0.8114 0.81122 0.8123 0.81143 0.8103 0.8113314 0.80874 0.80805 0.8084 0.80847 0.80822 0.80837615 0.81002 0.80955 0.80959 0.81014 0.81001 0.80986216 0.81127 0.8275 0.81233 0.81192 0.8106 0.81472417 0.81018 0.78983 0.81376 0.80889 0.78672 0.80187618 0.81372 0.78235 0.81374 0.81328 0.81326 0.8072719 0.81465 0.81397 0.81352 0.81401 0.81501 0.8142322 0 0.81444 0.81493 0.81356 0.81346 0.81382 0.814042
C-l

Table 2: Second recycling weighting
No.
Weight in g Average
Weight1 2 3 4 5
1 0.7945 0.7874 0.8161 0.8194 0.8201 0.80752 0.8087 0.8102 0.7972 0.8102 0.809 0.807063 0.8193 0.8195 0.8196 0.8199 0.8196 0.819584 0.809 0.8087 0.809 0.8087 0.8091 0.80895 0.8157 0.8153 0.8146 0.8151 0.8151 0.815166 0.8109 0.8087 0.8099 0.8096 0.8097 0.809767 0.8158 0.8165 0.8161 0.8161 0.8164 0.816188 0.8108 0.8104 0.8112 0.8115 0.8104 0.810869 0.8169 0.8165 0.8172 0.8177 0.8174 0.8171410 0.8103 0.8105 0.8102 0.8105 0.8109 0.8104811 0.8098 0.8103 0.8096 0.8098 0.8097 0.80984
12 0.8104 0.8099 0.808 0.8102 0.8093 0.8095613 0.8112 0.8113 0.8123 0.8114 0.8101 0.8112614 0.8088 0.808 0.8086 0.8083 0.808 0.8083415 0.8099 0.8092 0.8097 0.8101 0.8099 0.8097616 0.8113 0.7828 0.8124 0.812 0.8107 0.8058417 0.8104 0.7897 0.8139 0.8091 0.7867 0.8019618 0.8136 0.7824 0.8137 0.8132 0.8133 0.8072419 0.8138 0.8137 0.8136 0.814 0.8149 0.81420 0.8144 0.815 0.8136 0.8137 0.8139 0.81412
C-2

Table 3: Third recycle Weighting
No.
Weight in g Average
Weight1 2 3 4 5
1 0.82032 0.81877 0.81226 0.88079 0.82074 0.8305756
2 0.81047 0.81145 0.81146 0.81108 0.81236 0.811364
3 0.81846 0.82092 0.82094 0.81781 0.81813 0.819252
4 0.81121 0.80974 0.81001 0.81063 0.80956 0.81023
5 0.81285 0.81279 0.81542 0.81608 0.81525 0.814478
6 0.81286 0.80341 0.81181 0.8177 0.81264 0.811684
7 0.81581 0.81377 0.81445 0.81471 0.81302 0.814352
8 0.81108 0.81081 0.81089 0.81185 0.81119 0.811164
9 0.81601 0.81627 0.81392 0.81266 0.81683 0.815138
10 0.81141 0.81124 0.81256 0.81241 0.81198 0.81192
11 0.81217 0.81212 0.81238 0.81228 0.80913 0.811616
12 0.81263 0.81166 0.81252 0.81111 0.81452 0.812488
13 0.81327 0.81292 0.81309 0.81441 0.81401 0.81354
14 0.81173 0.81024 0.81102 0.81142 0.81169 0.81122
15 0.81381 0.81345 0.81297 0.81368 0.81353 0.813488
16 0.81123 0.81301 0.81405 0.81375 0.81245 0.812898
17 0.81438 0.81385 0.81444 0.81407 0.81411 0.81417
18 0.81379 0.81098 0.81069 0.81101 0.81168 0.81163
19 0.81074 0.81358 0.81313 0.81333 0.81292 0.81274
20 0.81185 0.81347 0.81131 0.81321 0.81362 0.812692
C-3