Embed Size (px)
Citation preview
Institute of Experimental and Clinical Pharmacology and Toxicology
Center for Experimental Medicine
University Medical Center Hamburg-Eppendorf
Investigation of molecular mechanisms regulating the
expression of cMyBP-C mutants in
familial hypertrophic cardiomyopathy
Dissertation
submitted to the
Department of Chemistry
Faculty of Mathematics, Informatics and Natural Sciences
University of Hamburg
for the degree
Doctor of Natural Sciences
by
Saskia Schlossarek
Hamburg 2008

1. Referee: Prof. Dr. Michael Korth
2. Referee: Prof. Dr. Thomas Eschenhagen
Day of the disputation: 07.03.2008
i
Table of contents
1 Introduction 1
1.1 The heart structure and function 1
1.2 The cardiac myosin-binding protein-C 4
1.3 Familial hypertrophic cardiomyopathy 7
1.4 Mutations and proposed pathophysiological hypotheses of FHC 9
1.5 Potential molecular mechanisms involved in the regulation of cMyBP-C mutants
10
1.5.1 The nonsense-mediated mRNA decay 10
1.5.2 The ubiquitin-proteasome system 13
1.6 Mouse models with MYBPC3 mutations 15
1.7 Aim of the thesis 18
2 Material and Methods 20
2.1 Material 20
2.1.1 Chemicals 20
2.1.2 Chemicals with risk (R-) and safety (S-) phrases 23
2.1.3 Antibodies 24
2.1.4 Bacterial strain 25
2.1.5 Kits 25
2.1.6 Oligonucleotides 25
2.1.7 Consumable material 26
2.1.8 Laboratory equipment 27
2.1.9 Animal models 28
2.1.9.1 The M7t mouse model 28
2.1.9.2 The cMyBP-C knock-in mouse model 33
2.1.9.3 The cMyBP-C knock-out mouse model 34
2.1.9.4 The UbG76V-GFP mouse model 35
2.1.9.5 The GFPdgn mouse model 36
2.2 Methods 37
2.2.1 Genotyping 37
2.2.1.1 Genotyping by Southern Blot 37
2.2.1.2 Genotyping by PCR 37
ii
2.2.2 Organ extraction 39
2.2.3 RNA analysis 39
2.2.3.1 RNA isolation 39
2.2.3.2 RNA concentration determination 39
2.2.3.3 Reverse transcription (RT) 40
2.2.3.4 Classical RT-PCR 40
2.2.3.5 Quantitative RT-PCR 41
2.2.4 Protein analysis 46
2.2.4.1 Protein extraction 46
2.2.4.2 Determination of the protein concentration 46
2.2.4.3 Western blot analysis 47
2.2.4.4 Measurement of the 20S proteasome activities 48
2.2.5 Cell isolation 51
2.2.5.1 Neonatal mouse cardiomyocytes 51
2.2.5.2 Adult mouse ventricular myocytes 51
2.2.5.3 Mouse fibroblasts 52
2.2.6 Treatments 53
2.2.6.1 Treatment of NMCM 53
2.2.6.2 Treatment of AMVM 53
2.2.6.3 Treatment of fibroblasts 53
2.2.6.4 Treatment of mice 54
2.2.7 Transfection 54
2.2.8 Immunofluorescence analysis 55
2.2.9 Echocardiography 55
2.2.10 Statistical analysis 56
3 Results 57
3.1 Generation and characterization of targeted cMyBP-C mouse models 57
3.1.1 Generation and characterization of the M7t mouse model 58
3.1.1.1 Generation of the M7t mouse model 58
3.1.1.2 Genotyping 58
3.1.1.3 Molecular characterization at the mRNA level 59
3.1.1.4 Molecular characterization at the protein level 62
3.1.1.5 Functional characterization 64
iii
3.1.2 Generation and characterization of the cMyBP-C knock-in mouse model
67
3.1.2.1 Generation of the cMyBP-C knock-in mouse model 67
3.1.2.2 Genotyping 67
3.1.2.3 Molecular characterization at the mRNA level 68
3.1.2.4 Molecular characterization at the protein level 70
3.1.2.5 Functional characterization 72
3.1.3 Summary 74
3.2 Analysis of the UPS involvement ex vivo 75
3.2.1 Inhibition of the UPS in M7t-TG mice 75
3.2.2 Inhibition of the UPS in KI mice 78
3.2.3 Summary 81
3.3 Investigation of the UPS function in vivo 82
3.3.1 Investigation of ubiquitination and degradation in myocardial tissue of M7t-TG and KI mice
82
3.3.1.1 Investigation of ubiquitination and degradation in the M7t-TG mice 82
3.3.1.2 Investigation of ubiquitination and degradation in the KI and KO mice 84
3.3.2 Investigation of the UPS reporter mouse models 92
3.3.2.1 Investigation of the UbG76V-GFP mouse model 92
3.3.2.2 Investigation of the GFPdgn mouse model 96
3.3.3 Investigation of the UPS function in the KI and KO mice crossed with UbG76V-GFP mice
99
3.3.3.1 Investigation of the UPS function in the KI mice crossed with UbG76V-GFP mice
100
3.3.3.2 Investigation of the UPS function in the KO mice crossed with UbG76V-GFP mice
102
3.3.4 Summary 104
3.4 Investigation of the nonsense-mediated mRNA decay 105
3.4.1 Investigation of the nonsense-mediated mRNA decay in the KI and Het mice
105
3.4.2 Summary 110
4 Discussion 111
5 Summary 128
6 References 135
iv
7 Appendix 147
7.1 Abbreviations 147
7.2 Standard amino acid abbreviations 152
7.3 Risk and safety phrases 152
7.4 Curriculum Vitae 158
7.5 Publications and congress participations 159
7.5.1 Publications 159
7.5.2 Congress participations 159
7.6 Declaration 163
7.7 Acknowledgement 164
Introduction
1
1 Introduction
1.1 The heart structure and function
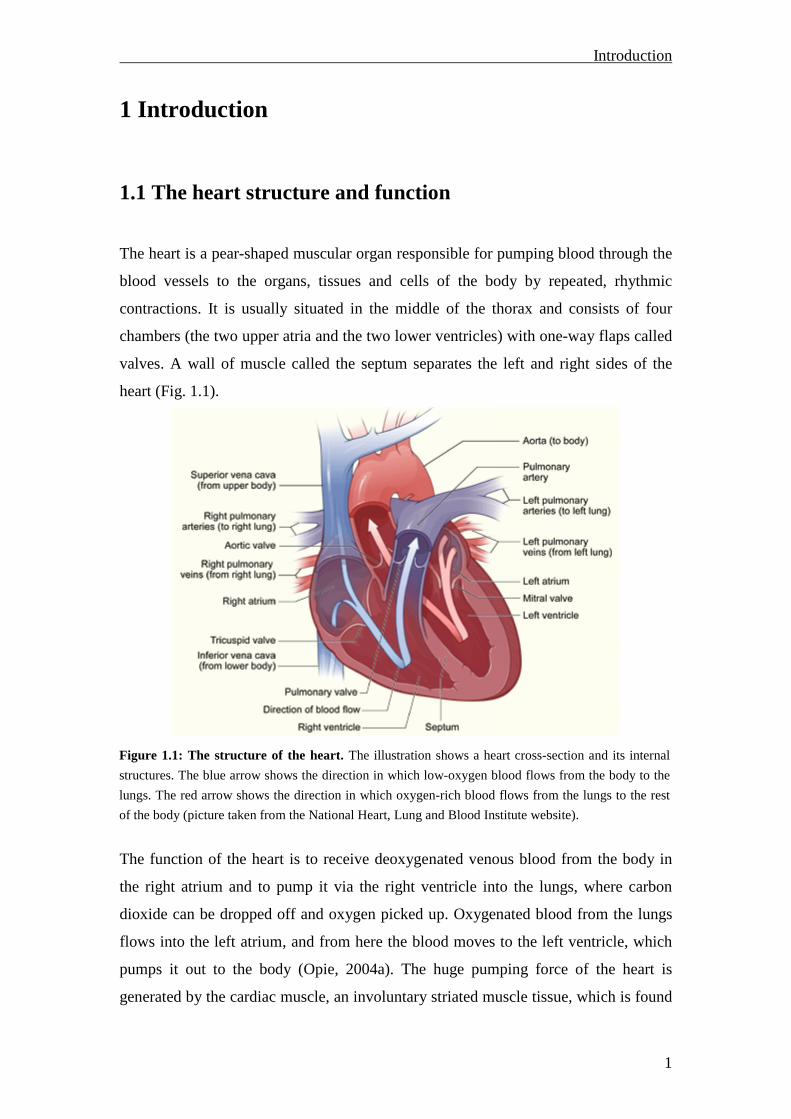
The heart is a pear-shaped muscular organ responsible for pumping blood through the
blood vessels to the organs, tissues and cells of the body by repeated, rhythmic
contractions. It is usually situated in the middle of the thorax and consists of four
chambers (the two upper atria and the two lower ventricles) with one-way flaps called
valves. A wall of muscle called the septum separates the left and right sides of the
heart (Fig. 1.1).
The function of the heart is to receive deoxygenated venous blood from the body in
the right atrium and to pump it via the right ventricle into the lungs, where carbon
dioxide can be dropped off and oxygen picked up. Oxygenated blood from the lungs
flows into the left atrium, and from here the blood moves to the left ventricle, which
pumps it out to the body (Opie, 2004a). The huge pumping force of the heart is
generated by the cardiac muscle, an involuntary striated muscle tissue, which is found
Figure 1.1: The structure of the heart. The illustration shows a heart cross-section and its internal
structures. The blue arrow shows the direction in which low-oxygen blood flows from the body to the
lungs. The red arrow shows the direction in which oxygen-rich blood flows from the lungs to the rest
of the body (picture taken from the National Heart, Lung and Blood Institute website).
Introduction
2
only within this organ. In the cardiac muscle, 20% of the cells are cardiomyocytes that
constitute 80% of the mass, and each cardiomyocyte is made up of many myofibrils,
which in turn consist of myofilaments. There are three types of myofilaments: titin,
the thin and the thick filaments. The classification of the latter ones is based on their
relatively lighter or darker appearance, when viewed through the light microscope
(Opie, 2004b). The thin filaments contain actin, which forms two intertwining helical
chains, α-tropomyosin, which forms a parallel coiled dimer binding to seven actin
monomers and troponin T, and the troponin complex, which is composed of the
troponins T, C and I and which occurs at regular intervals along the α-tropomyosin
(Redwood et al., 1999; Opie and Solaro, 2004; Fig. 1.3). The thick filaments consist
of myosin and are held in place by the third filament titin. Myosin itself is a hexamer
consisting of two heavy chains together with two regulatory light chains and two
essential light chains (Redwood et al., 1999). The thin and thick filaments have a
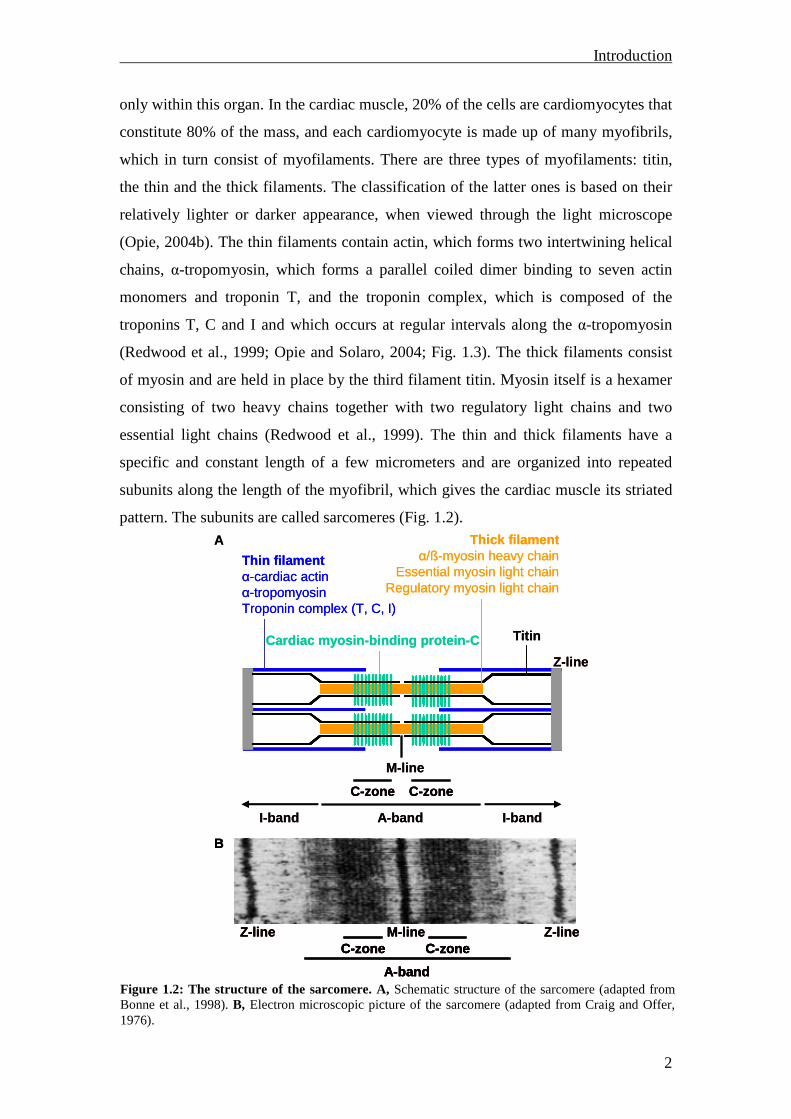
specific and constant length of a few micrometers and are organized into repeated
subunits along the length of the myofibril, which gives the cardiac muscle its striated
pattern. The subunits are called sarcomeres (Fig. 1.2).
Figure 1.2: The structure of the sarcomere. A, Schematic structure of the sarcomere (adapted from Bonne et al., 1998). B, Electron microscopic picture of the sarcomere (adapted from Craig and Offer, 1976).
Thin filamentα-cardiac actinα-tropomyosinTroponin complex (T, C, I)
Thick filamentα/ß-myosin heavy chain
Essential myosin light chainRegulatory myosin light chain
Z-line
Cardiac myosin-binding protein-C
M-line
Titin
C-zone C-zone
I-band A-band I-band
A
A-band
C-zone C-zone
B
Z-lineM-lineZ-line
Thin filamentα-cardiac actinα-tropomyosinTroponin complex (T, C, I)
Thick filamentα/ß-myosin heavy chain
Essential myosin light chainRegulatory myosin light chain
Z-line
Cardiac myosin-binding protein-C
M-line
Titin
C-zoneC-zone C-zoneC-zone
I-band A-band I-band
A
A-band
C-zone C-zone
B
Z-lineM-lineZ-line
A-bandA-band
C-zoneC-zone C-zoneC-zone
B
Z-lineM-lineZ-line
Introduction
3
Each sarcomere is delimited by two very dark colored bands called Z-lines.
Surrounding the Z-line is the region of the I-band and in contiguity to them the A-
band. Within the A-band, the thin M-line and the C-zones are located (Fig. 1.2). Actin
filaments are the major component of the I-band and extend into the A-band. Myosin
filaments extend throughout the A-band. The third filament titin tethers the myosin
filaments to the Z-line, thereby stabilizing the thick filaments (Opie and Solaro, 2004).
In the C-zones of the A-band, another sarcomeric protein is located - the cardiac
myosin-binding protein-C, which will be discussed in detail in the next chapter.
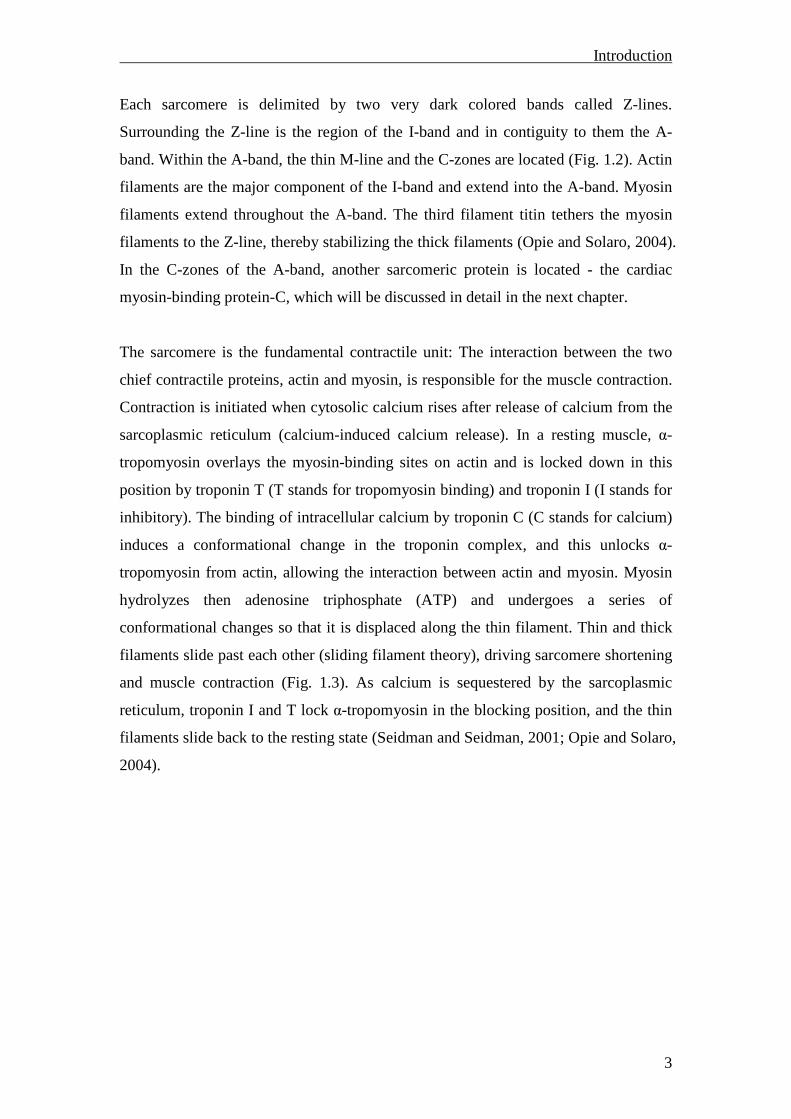
The sarcomere is the fundamental contractile unit: The interaction between the two
chief contractile proteins, actin and myosin, is responsible for the muscle contraction.
Contraction is initiated when cytosolic calcium rises after release of calcium from the
sarcoplasmic reticulum (calcium-induced calcium release). In a resting muscle, α-
tropomyosin overlays the myosin-binding sites on actin and is locked down in this
position by troponin T (T stands for tropomyosin binding) and troponin I (I stands for
inhibitory). The binding of intracellular calcium by troponin C (C stands for calcium)
induces a conformational change in the troponin complex, and this unlocks α-
tropomyosin from actin, allowing the interaction between actin and myosin. Myosin
hydrolyzes then adenosine triphosphate (ATP) and undergoes a series of
conformational changes so that it is displaced along the thin filament. Thin and thick
filaments slide past each other (sliding filament theory), driving sarcomere shortening
and muscle contraction (Fig. 1.3). As calcium is sequestered by the sarcoplasmic
reticulum, troponin I and T lock α-tropomyosin in the blocking position, and the thin
filaments slide back to the resting state (Seidman and Seidman, 2001; Opie and Solaro,
2004).
Introduction
4
1.2 The cardiac myosin-binding protein-C
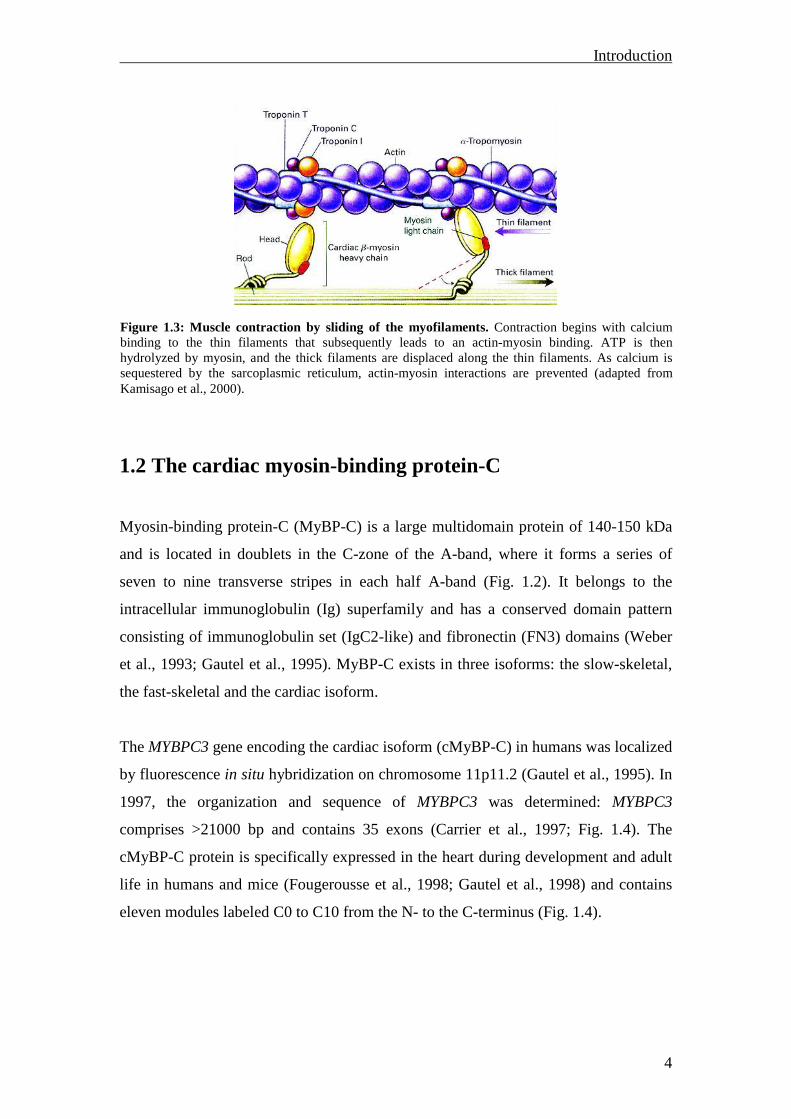
Myosin-binding protein-C (MyBP-C) is a large multidomain protein of 140-150 kDa
and is located in doublets in the C-zone of the A-band, where it forms a series of
seven to nine transverse stripes in each half A-band (Fig. 1.2). It belongs to the
intracellular immunoglobulin (Ig) superfamily and has a conserved domain pattern
consisting of immunoglobulin set (IgC2-like) and fibronectin (FN3) domains (Weber
et al., 1993; Gautel et al., 1995). MyBP-C exists in three isoforms: the slow-skeletal,
the fast-skeletal and the cardiac isoform.
The MYBPC3 gene encoding the cardiac isoform (cMyBP-C) in humans was localized
by fluorescence in situ hybridization on chromosome 11p11.2 (Gautel et al., 1995). In
1997, the organization and sequence of MYBPC3 was determined: MYBPC3
comprises >21000 bp and contains 35 exons (Carrier et al., 1997; Fig. 1.4). The
cMyBP-C protein is specifically expressed in the heart during development and adult
life in humans and mice (Fougerousse et al., 1998; Gautel et al., 1998) and contains
eleven modules labeled C0 to C10 from the N- to the C-terminus (Fig. 1.4).
Figure 1.3: Muscle contraction by sliding of the myofilaments. Contraction begins with calcium binding to the thin filaments that subsequently leads to an actin-myosin binding. ATP is then hydrolyzed by myosin, and the thick filaments are displaced along the thin filaments. As calcium is sequestered by the sarcoplasmic reticulum, actin-myosin interactions are prevented (adapted from Kamisago et al., 2000).
Introduction
5
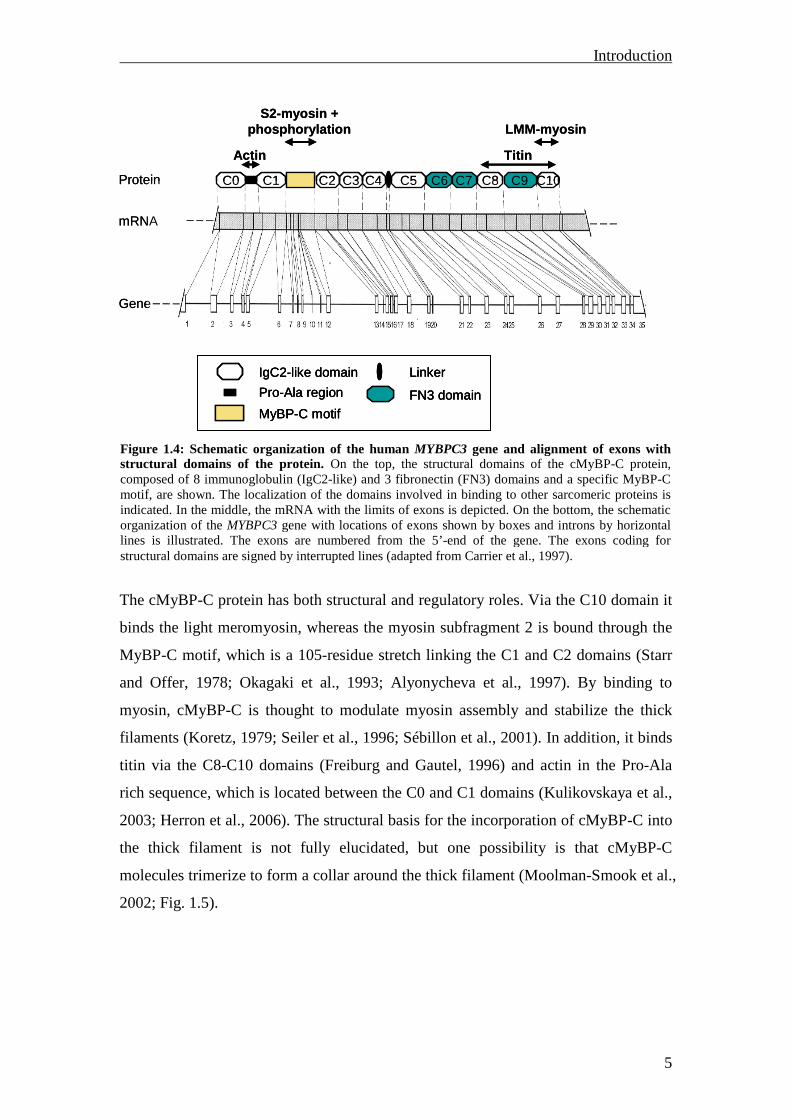
The cMyBP-C protein has both structural and regulatory roles. Via the C10 domain it
binds the light meromyosin, whereas the myosin subfragment 2 is bound through the
MyBP-C motif, which is a 105-residue stretch linking the C1 and C2 domains (Starr
and Offer, 1978; Okagaki et al., 1993; Alyonycheva et al., 1997). By binding to
myosin, cMyBP-C is thought to modulate myosin assembly and stabilize the thick
filaments (Koretz, 1979; Seiler et al., 1996; Sébillon et al., 2001). In addition, it binds
titin via the C8-C10 domains (Freiburg and Gautel, 1996) and actin in the Pro-Ala
rich sequence, which is located between the C0 and C1 domains (Kulikovskaya et al.,
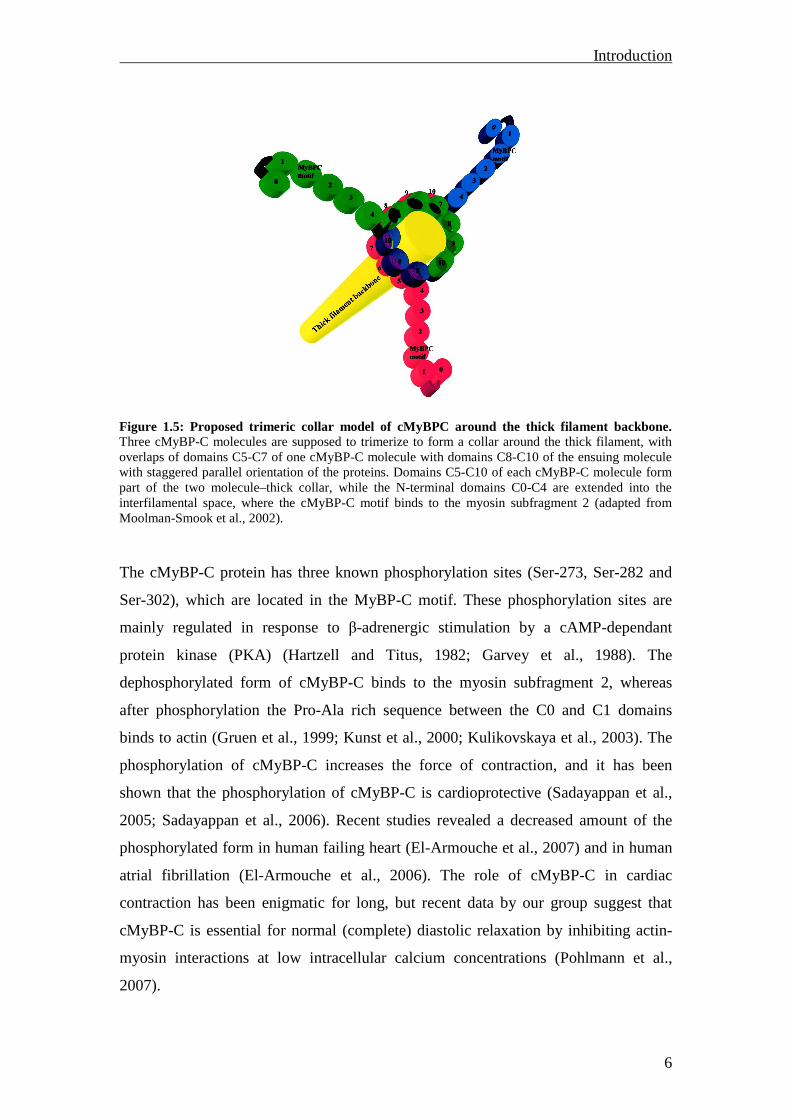
2003; Herron et al., 2006). The structural basis for the incorporation of cMyBP-C into
the thick filament is not fully elucidated, but one possibility is that cMyBP-C
molecules trimerize to form a collar around the thick filament (Moolman-Smook et al.,
2002; Fig. 1.5).
Figure 1.4: Schematic organization of the human MYBPC3 gene and alignment of exons with structural domains of the protein. On the top, the structural domains of the cMyBP-C protein, composed of 8 immunoglobulin (IgC2-like) and 3 fibronectin (FN3) domains and a specific MyBP-C motif, are shown. The localization of the domains involved in binding to other sarcomeric proteins is indicated. In the middle, the mRNA with the limits of exons is depicted. On the bottom, the schematic organization of the MYBPC3 gene with locations of exons shown by boxes and introns by horizontal lines is illustrated. The exons are numbered from the 5’-end of the gene. The exons coding for structural domains are signed by interrupted lines (adapted from Carrier et al., 1997).
LMM-myosin
Titin
S2-myosin +phosphorylation
Actin
C0 C1 C5C4C3C2 C8 C10C6 C7 C9
MyBP-C motif
IgC2-like domain
FN3 domainPro-Ala region
Linker
Protein
mRNA
Gene
LMM-myosin
Titin
S2-myosin +phosphorylation
Actin
C0 C1 C5C4C3C2 C8 C10C6 C7 C9
MyBP-C motif
IgC2-like domain
FN3 domainPro-Ala region
Linker
MyBP-C motif
IgC2-like domain
FN3 domainPro-Ala region
Linker
Protein
mRNA
Gene
Introduction
6
The cMyBP-C protein has three known phosphorylation sites (Ser-273, Ser-282 and
Ser-302), which are located in the MyBP-C motif. These phosphorylation sites are
mainly regulated in response to β-adrenergic stimulation by a cAMP-dependant
protein kinase (PKA) (Hartzell and Titus, 1982; Garvey et al., 1988). The
dephosphorylated form of cMyBP-C binds to the myosin subfragment 2, whereas
after phosphorylation the Pro-Ala rich sequence between the C0 and C1 domains
binds to actin (Gruen et al., 1999; Kunst et al., 2000; Kulikovskaya et al., 2003). The
phosphorylation of cMyBP-C increases the force of contraction, and it has been
shown that the phosphorylation of cMyBP-C is cardioprotective (Sadayappan et al.,
2005; Sadayappan et al., 2006). Recent studies revealed a decreased amount of the
phosphorylated form in human failing heart (El-Armouche et al., 2007) and in human
atrial fibrillation (El-Armouche et al., 2006). The role of cMyBP-C in cardiac
contraction has been enigmatic for long, but recent data by our group suggest that
cMyBP-C is essential for normal (complete) diastolic relaxation by inhibiting actin-
myosin interactions at low intracellular calcium concentrations (Pohlmann et al.,
2007).
Figure 1.5: Proposed trimeric collar model of cMyBPC around the thick filament backbone. Three cMyBP-C molecules are supposed to trimerize to form a collar around the thick filament, with overlaps of domains C5-C7 of one cMyBP-C molecule with domains C8-C10 of the ensuing molecule with staggered parallel orientation of the proteins. Domains C5-C10 of each cMyBP-C molecule form part of the two molecule–thick collar, while the N-terminal domains C0-C4 are extended into the interfilamental space, where the cMyBP-C motif binds to the myosin subfragment 2 (adapted from Moolman-Smook et al., 2002).
Introduction
7
1.3 Familial hypertrophic cardiomyopathy
To date, cardiovascular diseases are the most common cause of death, of which
cardiomyopathies play a decisive role. Cardiomyopathies are defined as diseases of
the myocardium with cardiac dysfunction (Richardson et al., 1996) and are classified
into four main distinct forms according to the type of anatomical and functional
impairment: dilated, hypertrophic, restrictive and arrhythmogenic right ventricular
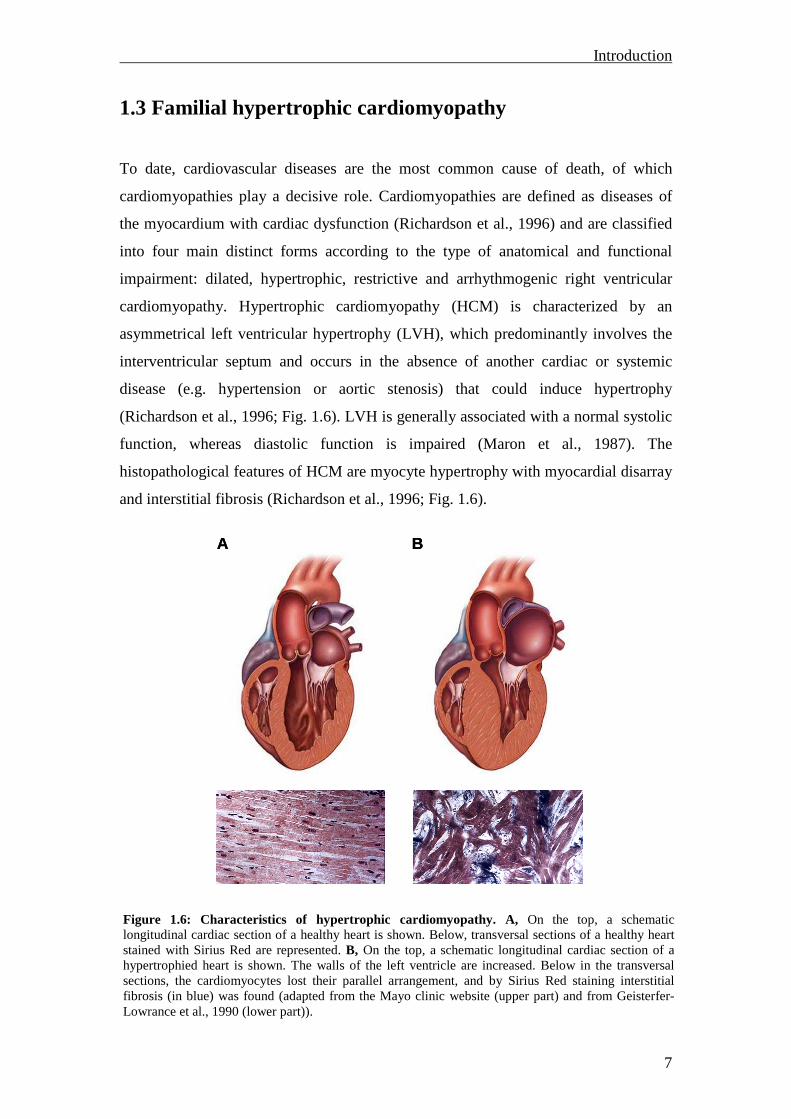
cardiomyopathy. Hypertrophic cardiomyopathy (HCM) is characterized by an
asymmetrical left ventricular hypertrophy (LVH), which predominantly involves the
interventricular septum and occurs in the absence of another cardiac or systemic
disease (e.g. hypertension or aortic stenosis) that could induce hypertrophy
(Richardson et al., 1996; Fig. 1.6). LVH is generally associated with a normal systolic
function, whereas diastolic function is impaired (Maron et al., 1987). The
histopathological features of HCM are myocyte hypertrophy with myocardial disarray
and interstitial fibrosis (Richardson et al., 1996; Fig. 1.6).
Figure 1.6: Characteristics of hypertrophic cardiomyopathy. A, On the top, a schematic longitudinal cardiac section of a healthy heart is shown. Below, transversal sections of a healthy heart stained with Sirius Red are represented. B, On the top, a schematic longitudinal cardiac section of a hypertrophied heart is shown. The walls of the left ventricle are increased. Below in the transversal sections, the cardiomyocytes lost their parallel arrangement, and by Sirius Red staining interstitial fibrosis (in blue) was found (adapted from the Mayo clinic website (upper part) and from Geisterfer-Lowrance et al., 1990 (lower part)).
A BA B
Introduction
8
The prevalence of the disease is approximately 1:500 in young adults and therefore
much more common than previously recognized (Maron et al., 1995). The
phenotypical pattern is highly heterogeneous: Many patients have no symptoms
during their whole life, but on the other hand in some cases, HCM may lead to severe
symptoms such as vertigo, chest pain, syncope or dyspnea, to severe heart failure, to
malignant arrhythmia or to sudden death. In fact, HCM remains the most prevalent
cause of sudden death in young athletes during exercise (Maron, 2002). Up to now, no
specific therapy is available for this disease, only symptomatic treatments for aspects
of the syndrome are possible (Roberts and Sigwart, 2001a; Roberts and Sigwart,
2001b).
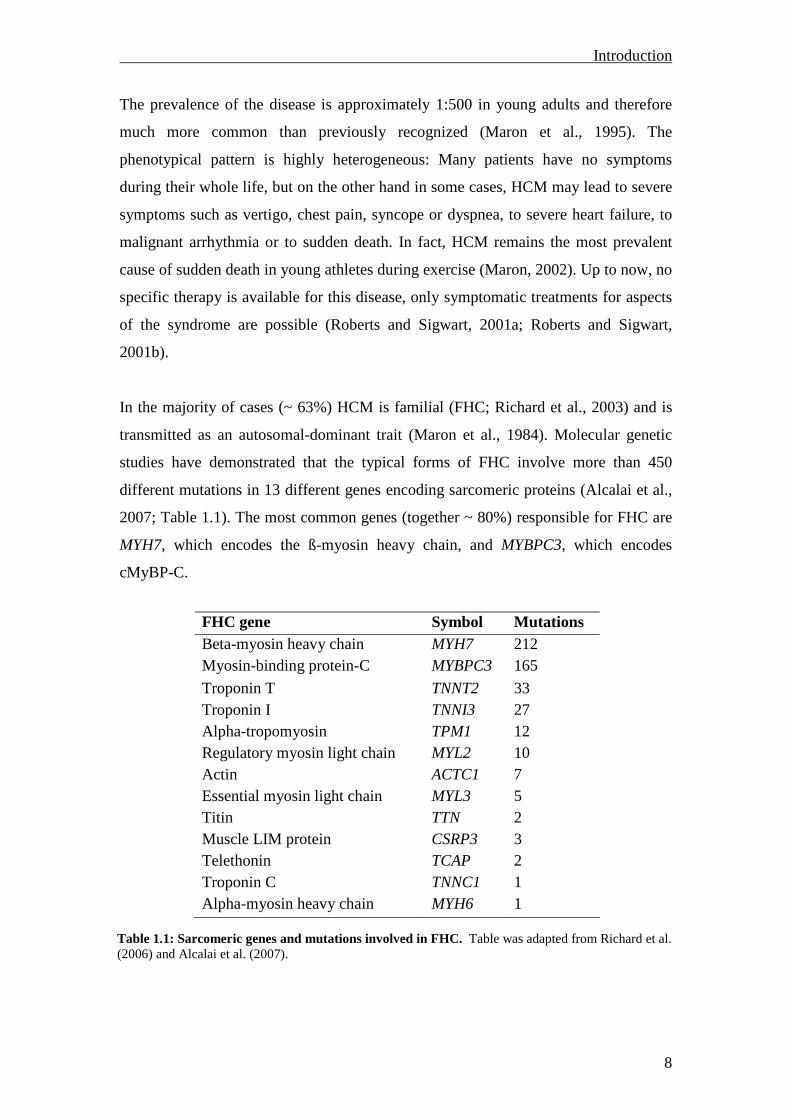
In the majority of cases (~ 63%) HCM is familial (FHC; Richard et al., 2003) and is
transmitted as an autosomal-dominant trait (Maron et al., 1984). Molecular genetic
studies have demonstrated that the typical forms of FHC involve more than 450
different mutations in 13 different genes encoding sarcomeric proteins (Alcalai et al.,
2007; Table 1.1). The most common genes (together ~ 80%) responsible for FHC are
MYH7, which encodes the ß-myosin heavy chain, and MYBPC3, which encodes
cMyBP-C.
FHC gene Symbol Mutations Beta-myosin heavy chain MYH7 212 Myosin-binding protein-C MYBPC3 165
Troponin T TNNT2 33 Troponin I TNNI3 27 Alpha-tropomyosin TPM1 12 Regulatory myosin light chain MYL2 10 Actin ACTC1 7 Essential myosin light chain MYL3 5 Titin TTN 2 Muscle LIM protein CSRP3 3 Telethonin TCAP 2 Troponin C TNNC1 1 Alpha-myosin heavy chain MYH6 1
Table 1.1: Sarcomeric genes and mutations involved in FHC. Table was adapted from Richard et al. (2006) and Alcalai et al. (2007).
Introduction
9
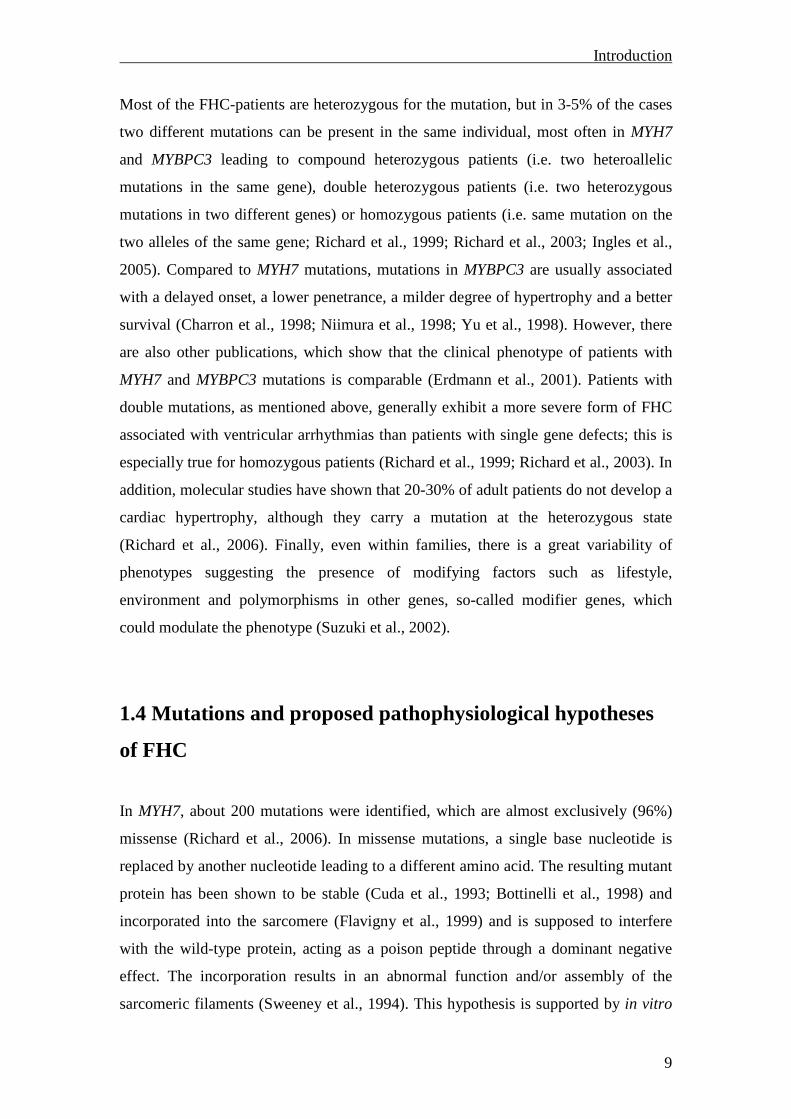
Most of the FHC-patients are heterozygous for the mutation, but in 3-5% of the cases
two different mutations can be present in the same individual, most often in MYH7
and MYBPC3 leading to compound heterozygous patients (i.e. two heteroallelic
mutations in the same gene), double heterozygous patients (i.e. two heterozygous
mutations in two different genes) or homozygous patients (i.e. same mutation on the
two alleles of the same gene; Richard et al., 1999; Richard et al., 2003; Ingles et al.,
2005). Compared to MYH7 mutations, mutations in MYBPC3 are usually associated
with a delayed onset, a lower penetrance, a milder degree of hypertrophy and a better
survival (Charron et al., 1998; Niimura et al., 1998; Yu et al., 1998). However, there
are also other publications, which show that the clinical phenotype of patients with
MYH7 and MYBPC3 mutations is comparable (Erdmann et al., 2001). Patients with
double mutations, as mentioned above, generally exhibit a more severe form of FHC
associated with ventricular arrhythmias than patients with single gene defects; this is
especially true for homozygous patients (Richard et al., 1999; Richard et al., 2003). In
addition, molecular studies have shown that 20-30% of adult patients do not develop a
cardiac hypertrophy, although they carry a mutation at the heterozygous state
(Richard et al., 2006). Finally, even within families, there is a great variability of
phenotypes suggesting the presence of modifying factors such as lifestyle,
environment and polymorphisms in other genes, so-called modifier genes, which
could modulate the phenotype (Suzuki et al., 2002).
1.4 Mutations and proposed pathophysiological hypotheses
of FHC
In MYH7, about 200 mutations were identified, which are almost exclusively (96%)
missense (Richard et al., 2006). In missense mutations, a single base nucleotide is
replaced by another nucleotide leading to a different amino acid. The resulting mutant
protein has been shown to be stable (Cuda et al., 1993; Bottinelli et al., 1998) and
incorporated into the sarcomere (Flavigny et al., 1999) and is supposed to interfere
with the wild-type protein, acting as a poison peptide through a dominant negative
effect. The incorporation results in an abnormal function and/or assembly of the
sarcomeric filaments (Sweeney et al., 1994). This hypothesis is supported by in vitro
Introduction
10
studies, engineered animal models and in vivo studies from explanted hearts from
FHC-patients (Bonne et al., 1998; Marian and Roberts, 2001). In MYBPC3, about 165
mutations were found, from which the majority (70%) are frameshift or nonsense
mutations (Richard et al., 2006; Alcalai et al., 2007). These mutations mainly result in
the appearance of a premature termination codon in the transcribed mRNA, which in
turn should produce C-terminal truncated cMyBP-Cs. The molecular mechanisms by
which nonsense mutations lead to FHC remain elusive. Truncated proteins were
consistently undetectable by Western blot in myocardial tissue from patients carrying
a frameshift mutation (Rottbauer et al., 1997; Moolman et al., 2000), and
overexpression of truncated human cMyBP-C mutants in rat cardiomyocytes
(Flavigny et al., 1999) or in transgenic mice (Yang et al., 1999) showed markedly less
expression than the wild-type protein. These data suggest that mutant mRNAs and/or
proteins are unstable and that nonsense mutations can act as “null alleles” potentially
leading to haploinsufficiency: The production of an insufficient amount of normal
cMyBP-C would produce an imbalance in the stoichiometry of the thick filament
components and this would be sufficient to alter the sarcomeric structure and function.
There are two known molecular mechanisms, which act as a quality control of the cell
and which could be responsible for the instability of cMyBP-C mutants leading to
haploinsufficiency: 1. the nonsense-mediated mRNA decay (NMD), which degrades
mutant transcripts and 2. the ubiquitin-proteasome system (UPS), which degrades
mutant proteins.
1.5 Potential molecular mechanisms involved in the
regulation of cMyBP-C mutants
1.5.1 The nonsense-mediated mRNA decay
An estimated ⅓ of inherited genetic disorders and many forms of cancer are caused by
frameshift or nonsense mutations, which result in the appearance of premature
termination codons (PTC). PTCs can arise in transcripts also naturally as a
Introduction
11
consequence of errors in transcription, faulty or alternative splicing or programmed
rearrangements (Culbertson, 1999; Frischmeyer and Dietz, 1999; Maquat, 2004;
Lejeune and Maquat, 2005). The majority of mRNAs that harbor such a PTC are
recognized and efficiently targeted for degradation by the cell via NMD. This
evolutionarily conserved pathway exists in all eukaryotes examined to date
(Culbertson, 1999) and is thought to protect the organism from the deleterious
dominant-negative or gain-of-function effects of truncated proteins, which would
result if PTC-containing transcripts were allowed to be translated. A general rule is
that NMD occurs when a PTC is located more than 50-55 nucleotides (nt) upstream
of the last exon-exon junction within the mRNA, whereas mRNAs with PTCs
downstream of this boundary are usually stable (Nagy and Maquat, 1998). But how
does NMD distinguish between premature and normal stop codons? The prevailing
opinion is that a second signal downstream of the stop codon dictates whether a stop
codon is premature or not. In mammalian cells, the second signal is somehow
delivered by an intron downstream of the stop codon (Carter et al., 1996). Therefore
normal stop codons, which are almost always found in the last exon (Nagy and
Maquat, 1998), intronless transcripts (Maquat and Li, 2001) or transfected cDNAs
containing a PTC are not subject to NMD. A second signal in mammals is the so-
called exon junction complex (EJC), which is deposited 20-24 nt upstream of every
exon junction during mRNA splicing and which remains bound even when it enters
the cytoplasm to be read by the ribosomes. The EJC contains at least ten proteins,
from which several are involved in NMD.
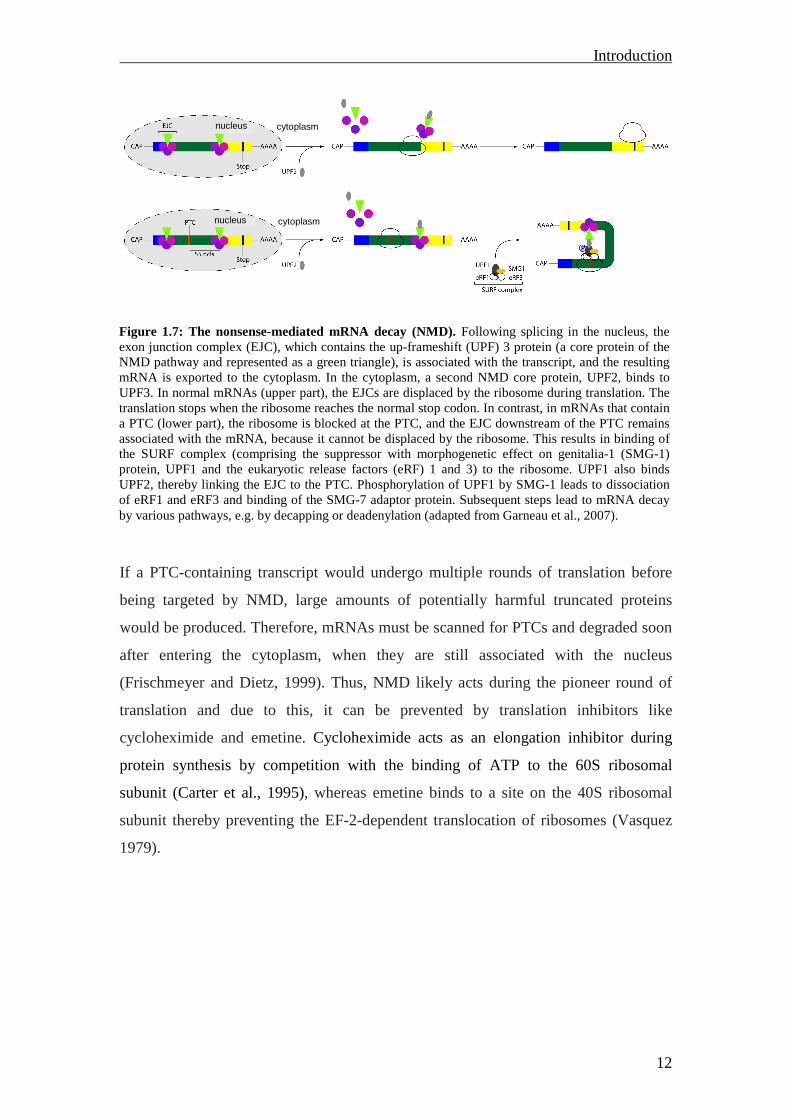
The exact mechanism of NMD is still not fully elucidated, but in Fig. 1.7 a possible
procedure is depicted. Briefly, normal transcripts escape NMD, because all of the
EJCs are removed by the ribosome during translation. On the contrary, an aberrant
transcript containing a stop codon in a premature position will have at least one EJC
downstream of the PTC. This remaining EJC is identified as a problem by NMD
factors and the mRNA is degraded.
Introduction
12
If a PTC-containing transcript would undergo multiple rounds of translation before
being targeted by NMD, large amounts of potentially harmful truncated proteins
would be produced. Therefore, mRNAs must be scanned for PTCs and degraded soon
after entering the cytoplasm, when they are still associated with the nucleus
(Frischmeyer and Dietz, 1999). Thus, NMD likely acts during the pioneer round of
translation and due to this, it can be prevented by translation inhibitors like
cycloheximide and emetine. Cycloheximide acts as an elongation inhibitor during
protein synthesis by competition with the binding of ATP to the 60S ribosomal
subunit (Carter et al., 1995), whereas emetine binds to a site on the 40S ribosomal
subunit thereby preventing the EF-2-dependent translocation of ribosomes (Vasquez
1979).
nucleus cytoplasm
cytoplasmnucleus
nucleus cytoplasm
cytoplasmnucleus
Figure 1.7: The nonsense-mediated mRNA decay (NMD). Following splicing in the nucleus, the exon junction complex (EJC), which contains the up-frameshift (UPF) 3 protein (a core protein of the NMD pathway and represented as a green triangle), is associated with the transcript, and the resulting mRNA is exported to the cytoplasm. In the cytoplasm, a second NMD core protein, UPF2, binds to UPF3. In normal mRNAs (upper part), the EJCs are displaced by the ribosome during translation. The translation stops when the ribosome reaches the normal stop codon. In contrast, in mRNAs that contain a PTC (lower part), the ribosome is blocked at the PTC, and the EJC downstream of the PTC remains associated with the mRNA, because it cannot be displaced by the ribosome. This results in binding of the SURF complex (comprising the suppressor with morphogenetic effect on genitalia-1 (SMG-1) protein, UPF1 and the eukaryotic release factors (eRF) 1 and 3) to the ribosome. UPF1 also binds UPF2, thereby linking the EJC to the PTC. Phosphorylation of UPF1 by SMG-1 leads to dissociation of eRF1 and eRF3 and binding of the SMG-7 adaptor protein. Subsequent steps lead to mRNA decay by various pathways, e.g. by decapping or deadenylation (adapted from Garneau et al., 2007).
Introduction
13
1.5.2 The ubiquitin-proteasome system
Like the NMD for aberrant mRNAs, the UPS is a quality control of the cell for
aberrant proteins. In mammalian cells, 80-90% of the intracellular proteins are
degraded via this pathway, whereas the majority of membrane proteins are degraded
by the lysosomes (Zolk et al., 2006). One major function of the UPS, which is present
in both the nucleus and cytosol, is to prevent the accumulation of damaged, misfolded
and mutant proteins, but it has been shown that this system is also involved in
intracellular signaling, transcriptional control or regulation of cell death (Zolk et al.,
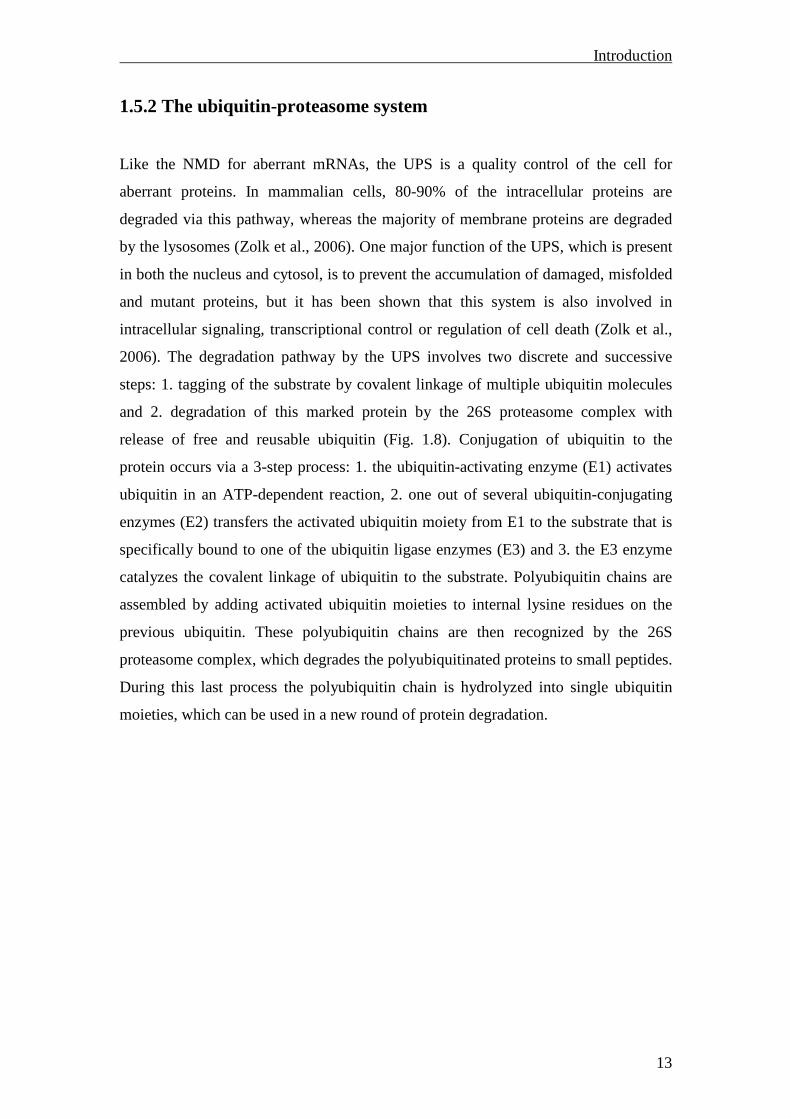
2006). The degradation pathway by the UPS involves two discrete and successive
steps: 1. tagging of the substrate by covalent linkage of multiple ubiquitin molecules
and 2. degradation of this marked protein by the 26S proteasome complex with
release of free and reusable ubiquitin (Fig. 1.8). Conjugation of ubiquitin to the
protein occurs via a 3-step process: 1. the ubiquitin-activating enzyme (E1) activates
ubiquitin in an ATP-dependent reaction, 2. one out of several ubiquitin-conjugating
enzymes (E2) transfers the activated ubiquitin moiety from E1 to the substrate that is
specifically bound to one of the ubiquitin ligase enzymes (E3) and 3. the E3 enzyme
catalyzes the covalent linkage of ubiquitin to the substrate. Polyubiquitin chains are
assembled by adding activated ubiquitin moieties to internal lysine residues on the
previous ubiquitin. These polyubiquitin chains are then recognized by the 26S
proteasome complex, which degrades the polyubiquitinated proteins to small peptides.
During this last process the polyubiquitin chain is hydrolyzed into single ubiquitin
moieties, which can be used in a new round of protein degradation.
Introduction
14
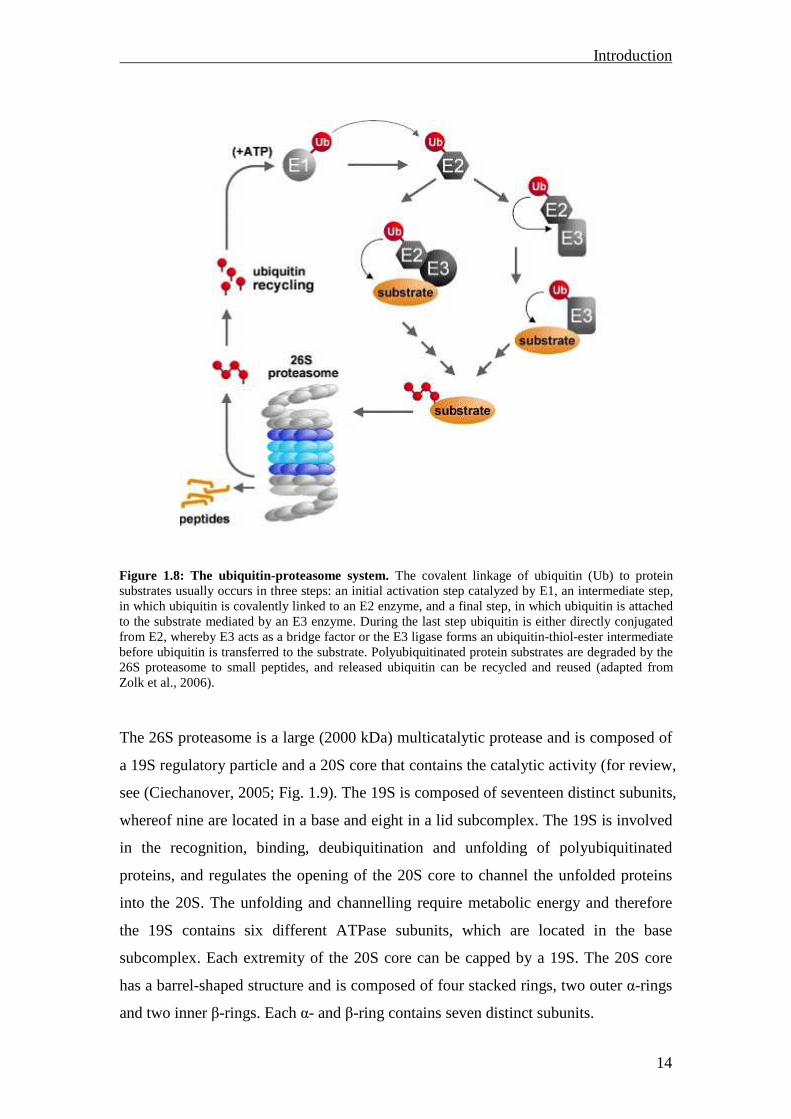
The 26S proteasome is a large (2000 kDa) multicatalytic protease and is composed of
a 19S regulatory particle and a 20S core that contains the catalytic activity (for review,
see (Ciechanover, 2005; Fig. 1.9). The 19S is composed of seventeen distinct subunits,
whereof nine are located in a base and eight in a lid subcomplex. The 19S is involved
in the recognition, binding, deubiquitination and unfolding of polyubiquitinated
proteins, and regulates the opening of the 20S core to channel the unfolded proteins
into the 20S. The unfolding and channelling require metabolic energy and therefore
the 19S contains six different ATPase subunits, which are located in the base
subcomplex. Each extremity of the 20S core can be capped by a 19S. The 20S core
has a barrel-shaped structure and is composed of four stacked rings, two outer α-rings
and two inner β-rings. Each α- and β-ring contains seven distinct subunits.
Figure 1.8: The ubiquitin-proteasome system. The covalent linkage of ubiquitin (Ub) to protein substrates usually occurs in three steps: an initial activation step catalyzed by E1, an intermediate step, in which ubiquitin is covalently linked to an E2 enzyme, and a final step, in which ubiquitin is attached to the substrate mediated by an E3 enzyme. During the last step ubiquitin is either directly conjugated from E2, whereby E3 acts as a bridge factor or the E3 ligase forms an ubiquitin-thiol-ester intermediate before ubiquitin is transferred to the substrate. Polyubiquitinated protein substrates are degraded by the 26S proteasome to small peptides, and released ubiquitin can be recycled and reused (adapted from Zolk et al., 2006).
Introduction
15
The unfolded protein is degraded in the cavity of the 20S by three major peptidase
activities: the chymotrypsin-like, the trypsin-like and the caspase-like activity, which
reside in the ß5-, ß2- and ß1-subunit, respectively, on the inner surface of the
ß-subunit rings. Each peptidase preferentially cleaves after different amino acids: The
peptidase of the ß1-subunit cleaves after acidic or small hydrophobic amino acids, the
peptidase of the ß2-subunit cuts after basic or small hydrophobic amino acids, while
the peptidase of the ß5-subunit hydrolyzes the peptide bond after hydrophobic
residues whether bulky or not. All three peptidase activities can be measured using
fluorogenic substrates, which are specifically cleaved and release a fluorescent
reporter after cleavage, whose fluorescence can be determined. It is also possible to
inhibit the three activities with reversible or irreversible proteasome inhibitors to
analyse the consequences of this blockage, e.g. the potential accumulation of a target
protein.
1.6 Mouse models with MYBPC3 mutations
One of the major problems in understanding FHC has been the difficulty in obtaining
cardiac specimens from affected patients. Thus, the development of animal models
has been started. The advantage of using murine models lies in the ease of genetic
Figure 1.9: The 26S proteasome. The 26S proteasome is composed of the 19S and the 20S subcomplex. The 19S regulatory particle has a lid and a base subunit, whereof the base contains all six proteasomal ATPases. The 20S core is made up of four heptameric rings, two outer α-rings and two inner β-rings. The β-rings are the residences for the three proteolytic activities (adapted from Ciechanover, 2005).
Lid
Base
α
β
β
α
19S
20S
26S
Polyubiquitinatedprotein substrate
Lid
Base
α
β
β
α
19S
20S
26S
Polyubiquitinatedprotein substrate
Introduction
16
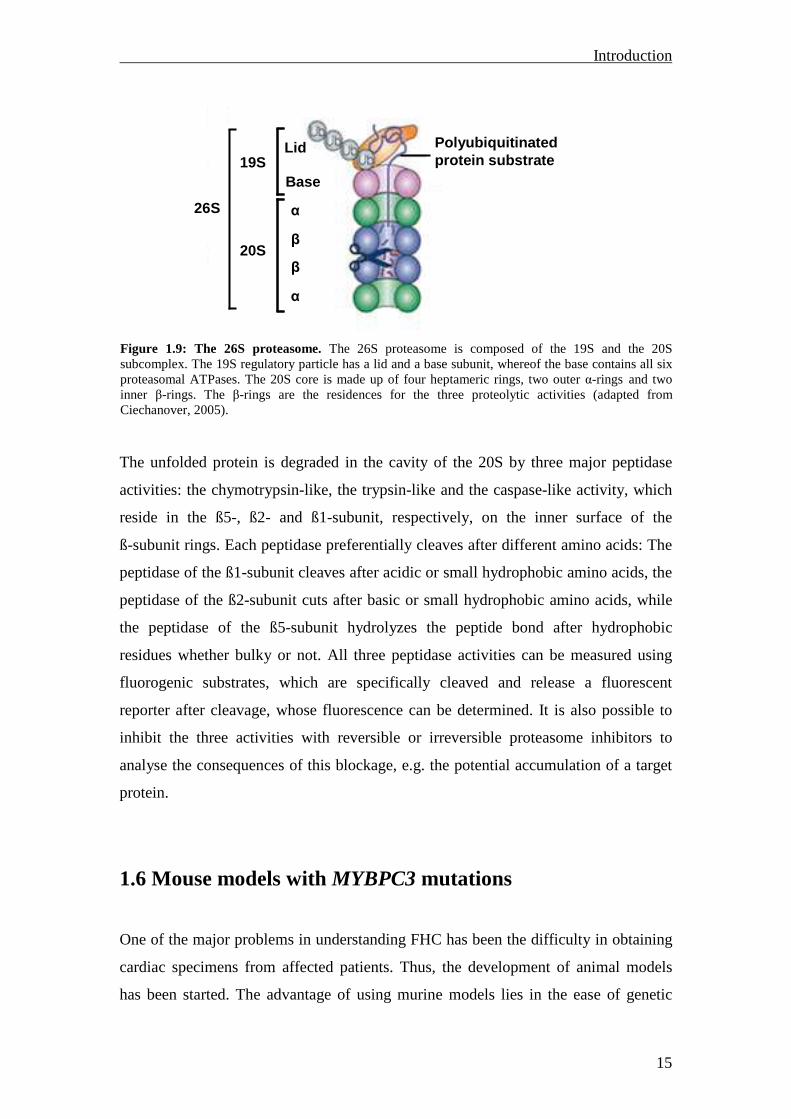
manipulation, short generation time and large number of offspring. To modify the
mammalian genome, two distinct but complementary approaches have been
developed: the additive and the targeted transgenesis (Fig. 1.10).
Until now, seven mouse models have been generated which carry a MYBPC3
mutation. Out of them, three were created by additive transgenesis. The first mouse
model expresses a mutant cMyBP-C lacking both the myosin and titin binding
A Additive transgenesis B Targeted transgenesisA Additive transgenesis B Targeted transgenesis
Figure 1.10: Additive and targeted transgenesis. A, The additive transgenesis is based on the microinjection of linear DNA sequences into the chromosomes of fertilized eggs. The foreign DNA must be integrated into the genome prior to the doubling of the genetic material that precedes the first cleavage, in order for the animal to be born with a copy of this new information in every cell. Insertion of the transgene is hereby random, and multiple copies of the transgene are added to the endogenous genetic material. B, The targeted transgenesis uses homologous recombination to insert modified DNA at a specific gene site leading to an inactivation or mutation and subsequently generation of animals deficient or with a mutation in that gene product. The modified DNA is hereby electroporated in embryonic stem (ES) cells and after subsequent selection and screening procedures, these genetically modified ES cells are microinjected into blastocysts (adapted from Expert Reviews in Molecular Medicine© 2001 Cambridge University Press).
Introduction
17
domains (Yang et al., 1998), whereas the second mouse model expresses a mutant
cMyBP-C lacking only the myosin binding site (Yang et al., 1999). The third mouse
model expresses a mutant cMyBP-C lacking the PKA-dependent phosphorylation site
(Yang et al., 2001). In all three mouse models, the mouse α-myosin heavy chain (α-
MHC) promoter was used to drive cardiac-specific overexpression of the transgene.
By targeted transgenesis, four mouse models were generated. Two of them are
cMyBP-C knock-out mouse models: One is a functional cMyBP-C knock-out, in
which exons 3 to 10 of the endogenous cMyBP-C were replaced by a neomycin
resistance gene (Harris et al., 2002). The other one was generated by targeted deletion
of exons 1 and 2 of the mouse MYBPC3 gene, which includes the transcription
initiation site, and is therefore a transcriptional knock-out (Carrier et al., 2004). In the
third mouse model created by targeted transgenesis, the insertion of a neomycin
resistance gene into exon 30 resulted in skipping of this exon leading to a C-terminal
truncated cMyBP-C (McConnell et al., 1999; McConnell et al., 2001). Finally, the
fourth mouse model expresses a N-terminal truncated cMyBP-C resulting from a
replacement of exons 3-6 by a neomycin resistance gene (Witt et al., 2001).
The present cMyBP-C mouse models do not exactly match a human mutation and can
therefore not be used to decipher the molecular mechanisms involved in FHC. For
instance, the mouse model from McConnell et al. (1999) was created by inserting the
neomycin resistance gene into exon 30, whereas the defective MYBPC3 gene found in
family “NN” contains a mutation in the splice donor sequence of intron 30 (Watkins
et al., 1995).
Introduction
18
1.7 Aim of the thesis
The aim of my thesis was to get insights into the molecular mechanisms involved in
the regulation of cMyBP-C mutant levels in the context of FHC. It has been recently
shown by adenoviral gene transfer of mutant human cDNAs in cardiomyocytes that
truncated cMyBP-C proteins are rapidly and quantitatively degraded by the UPS,
which was associated with an impairment of the UPS function (Sarikas et al., 2005).
Therefore, I investigated whether truncated cMyBP-C mutants are also subject to
degradation by the UPS in vivo and whether they alter this system. This was examined
in two new targeted cMyBP-C mouse models: the transgenic M7t mouse model and
the cMyBP-C knock-in mouse model. Both models are based on the same human
MYBPC3 point mutation, but were differently generated. The transgenic M7t mouse
model was created by additive transgenesis and represents the appropriate mouse
model to verify the data obtained by Sarikas et al. (2005) in vivo, because the same
mutant cDNA construct was used for the generation of the mouse line as well as for
the recombinant adenovirus. In contrast, the cMyBP-C knock-in mouse model was
generated by targeted transgenesis, and the heterozygous mice of this model represent
the first mice, which mimic exactly a situation found in humans. The point mutation is
a G>A transition on the last nucleotide of exon 6 and is associated with a severe
phenotype and a poor prognosis in humans (Richard et al., 2003). The molecular
consequences of this mutation were not known, except that mutant mRNA deleted of
exon 6 has been found in lymphocytes from one patient (“illegitimate transcription”)
(Andersen et al., 2004), which suggested an exon skipping as a mechanism to produce
a PTC and protein truncation. However, no data were obtained from myocardial tissue.
My work consisted in the development of the transgenic M7t mouse model, in the
characterization of its phenotype and in the analysis of the cMyBP-C expression at the
mRNA and protein level. Concerning the cMyBP-C knock-in mouse model, which
was developed in Paris by Nicolas Vignier and Lucie Carrier, I participated in the
analysis of the cMyBP-C expression at mRNA and protein levels. In both mouse
models, I investigated ex vivo whether the mutant cMyBP-Cs were degraded by the
UPS and in vivo whether the mutants altered the function of this system. The in vivo
study included the use of so-called UPS reporter mice, which I initially evaluated to
Introduction
19
determine whether they were suitable to monitor the UPS function in the heart. Due to
the obtained results in the cMyBP-C knock-in mouse model, I additionally
investigated the involvement of NMD in the regulation of the cMyBP-C mutants at
mRNA level.
Material and Methods
20
2 Material and Methods
2.1 Material
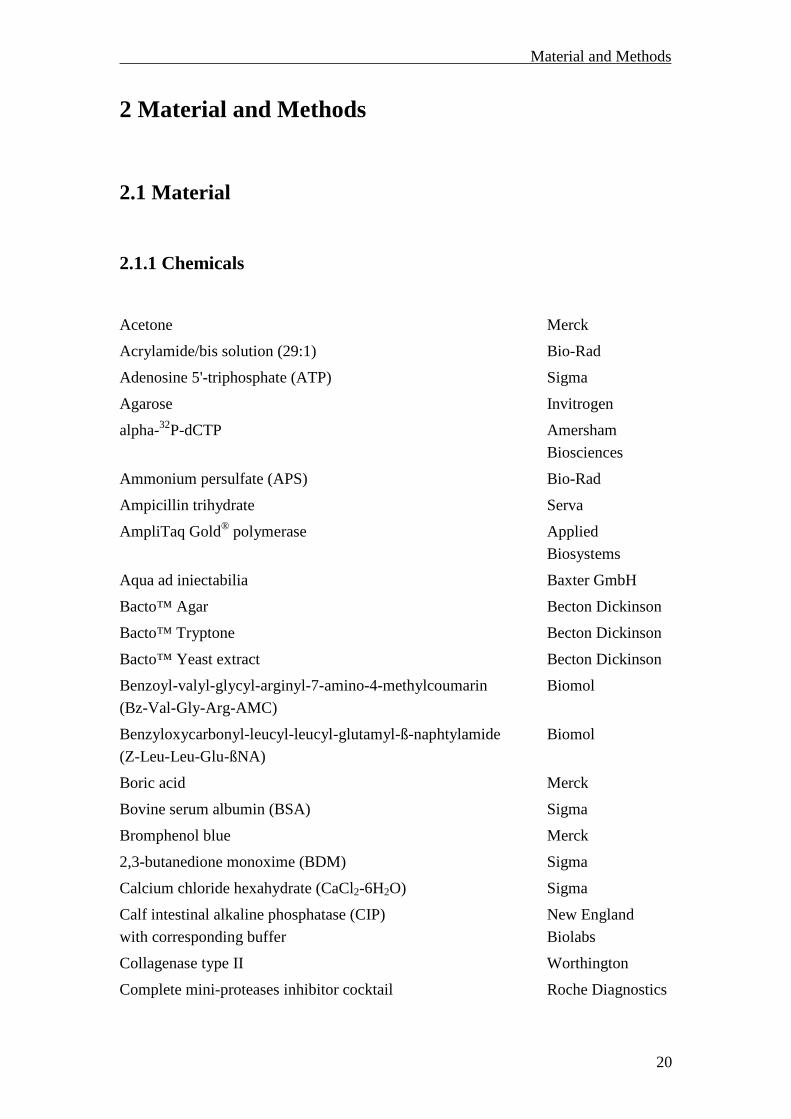
2.1.1 Chemicals
Acetone Merck
Acrylamide/bis solution (29:1) Bio-Rad
Adenosine 5'-triphosphate (ATP) Sigma
Agarose Invitrogen
alpha-32P-dCTP Amersham
Biosciences
Ammonium persulfate (APS) Bio-Rad
Ampicillin trihydrate Serva
AmpliTaq Gold® polymerase Applied
Biosystems
Aqua ad iniectabilia Baxter GmbH
Bacto™ Agar Becton Dickinson
Bacto™ Tryptone Becton Dickinson
Bacto™ Yeast extract Becton Dickinson
Benzoyl-valyl-glycyl-arginyl-7-amino-4-methylcoumarin
(Bz-Val-Gly-Arg-AMC)
Biomol
Benzyloxycarbonyl-leucyl-leucyl-glutamyl-ß-naphtylamide
(Z-Leu-Leu-Glu-ßNA)
Biomol
Boric acid Merck
Bovine serum albumin (BSA) Sigma
Bromphenol blue Merck
2,3-butanedione monoxime (BDM) Sigma
Calcium chloride hexahydrate (CaCl2-6H2O) Sigma
Calf intestinal alkaline phosphatase (CIP)
with corresponding buffer
New England
Biolabs
Collagenase type II Worthington
Complete mini-proteases inhibitor cocktail Roche Diagnostics
Material and Methods
21
Coomassie Brilliant Blue G-250 reagent Bio-Rad
Cycloheximide Sigma
Disodium hydrogen phosphate dihydrate (Na2HPO4-2H2O) Merck
DNA polymerase I large fragment (Klenow)
with corresponding buffer
New England
Biolabs
Deoxyribonucleotide triphosphate (dNTP) mix
(dATP, dCTP, dGTP, dTTP)
Applied
Biosystems
Depilatory cream elcamed Asid Bonz
Difco™ trypsin 250 Becton Dickinson
Dimethyl sulfoxide (DMSO) Sigma
Dithiothreitol (DTT) Sigma
DNA isolation reagent for genomic DNA AppliChem
Dulbecco's modified Eagle medium (DMEM)
with 4.5 g/L glucose and without pyruvate
Gibco
ECL plus Western blotting detection system Amersham
Biosciences
Emetine Sigma
Epoxomicin Calbiochem
Ethidium bromide Fluka
Ethylenediaminetetraacetic acid (EDTA) Sigma
ExpressHyb Hybridization solution Becton Dickinson
Fetal bovine or calf serum (FBS or FCS) Biochrom
Gene Ruler™ 100 bp DNA ladder Fermentas
Glucose Sigma
Glycerol Merck
Glycine Roth
Hank`s balanced salt solution (HBSS), calcium/magnesium-free Gibco
Heparin sodium (Liquemine®) Roche
Horse serum Biochrom
Hydrochloric acid (HCl) Merck
4-(2-hydroxyethyl)piperazine-1-ethanesulfonic acid (HEPES) Roth
Immunoglobulin G Sigma
Insulin/transferrin/selenium (ITS) Gibco
Isoflurane Abbott
Isotonic 0.9% sodium chloride solution Baxter GmbH
Material and Methods
22
Laminin Roche
Diagnostics
L-glutamine Gibco
Liberase Blendzyme 3
Roche
Diagnostics
Lipofectamine™ 2000 Invitrogen
Loading dye, 6x Fermentas
M199 with Earl`s salt and L-glutamine Gibco
Magnesium acetate tetrahydrate (Mg(CH3COO)2-4H2O) Merck
Magnesium chloride hexahydrate (MgCl2-6H2O) Roth
Magnesium sulfate heptahydrate (MgSO4-7H2O) Merck
MassRuler™ DNA ladder Fermentas
Methanol J. T. Baker
MG132 Calbiochem
MG262 Biomol
Milk powder Roth
Minimum essential medium (MEM)
with Hank`s salt and L-glutamine
Gibco
Mowiol 4-88 Hoechst
Penicillin-streptomycin Gibco
Phosphate buffered saline (PBS) Biochrom
Phosphocreatine Calbiochem
Phosphocreatinekinase Sigma
Ponceau S Serva
Potassium chloride (KCl) Merck
Potassium hydrogen carbonate (KHCO3) Merck
Potassium dihydrogen phosphate (KH2PO4) Merck
Power SYBR® Green PCR Master Mix Applied
Biosystems
Precision Plus Protein Standard™ Bio-Rad
Restriction enzymes (BamHI, EcoRI, NdeI, NheI, SalI, SfoI,
XhoI) with corresponding buffers (containing 1x BSA)
New England
Biolabs
Sodium chloride (NaCl) J. T. Baker
Sodium dodecyl sulfate (SDS) Roth
Sodium fluoride (NaF) Merck
Sodium hydrogen carbonate (NaHCO3) Merck
Material and Methods
23
Sodium hydroxide (NaOH) Merck
Succinyl-leucyl-leucyl-valyl-tyrosyl-7-amino-4-methylcoumarin
(SUC-Leu-Leu-Val-Tyr-AMC)
Calbiochem
SuperSignal® West Dura extended duration substrate Pierce
T4 DNA ligase with corresponding buffer New England
Biolabs
TaqMan® Universal PCR Master Mix Applied
Biosystems
Taurine Merck
Tetramethylethylenediamine (TEMED) Bio-Rad
ToPro3® Molecular Probes
Trishydroxymethylaminomethane (Tris) base Sigma
Tris hydrochloride (Tris-HCl) Promega
Trisodium citrate dihydrate Merck
Triton X-100 Sigma
Polyoxyethylene (20) sorbitan monolaurate (Tween® 20) Sigma
Ultrasound transmission gel Caesar & Loretz
2.1.2 Chemicals with risk (R-) and safety (S-) phrases
Acetone R: 11-36-66-67 S: 9-16-26
Acrylamide/bis solution R: 23/24/25-45-46-48 S: 36/37/39-45-60
ATP R: - S:22-24/25
APS R: 8-22-36/37/38-42/43 S: 22-24-26-37
Bromphenol blue R: - S:22-24/25
BDM R: - S:22-24/25
Calcium chloride hexahydrate
R: 36 S:22-24/25
Coomassie Brilliant Blue
G-250 reagent
R: 20/21/22-34-68 S: 26-36/37/39-45
Cycloheximide R: 28-52/53-61-68 S: 45-53
Disodium hydrogen phosphate dihydrate
R: - S:22-24/25
DMSO R: 36/37/38 S: 23-26-36
DTT R: 22-36/37/38 S: 26-36
Material and Methods
24
DNA isolation reagent for
genomic DNA
R: 20/21/22-32 S: 24/25
ECL plus Western blotting
detection system
R: 11-19-36/37-40-66 S: 16-23-36/37
Emetine R: 28-36/37/38 S: 26-28-36/37-45
Epoxomicin R: 36/38 S: 26
Ethidium bromide R: 23-68 S: 36/37-45
EDTA R: 36-52/53 S: 26-61
Glycine R: - S: 22-24/25
Hydrochloric acid R: 34-37 S: 26-36/37/39-45
Magnesium acetate tetrahydrate
R: - S: 22-24/25
Methanol R: 11-23/24/25-39 S: 7-16-36/37-45
MG132 R: 11-36/38 S: 24/25-26-29
PBS R: - S: 22-24/25
Ponceau S R: 36/37/38-51/53 S: 2-25-26-29/56-37-46-
57-60-64
Potassium chloride R: - S: 22-24/25
SDS R: 22-36/38 S: 22-24/25
Sodium fluoride R: 25-32-36/38 S: 22-36-45
Sodium hydroxide R: 35 S: 26-37/39-45
Taurine R: 36/37/38 S: 26-36
TEMED R: 11-20/22-34 S: 16-26-36/37/39-45-60
Tris base R: 36/37/38 S: 26-36
Tris hydrochloride R: 36/37/38 S: 26-36
Triton X-100 R: 22-41-51/53 S: 26-36/39-61
2.1.3 Antibodies
Anti-cMyBP-C
(C0C1-domains), polyclonal
Mathias Gautel, King's College London, London
Anti-α-actinin
(clone EA-53), monoclonal
Sigma
Anti-c-myc, monoclonal Invitrogen
Material and Methods
25
Anti-titin-Z1, polyclonal Siegfried Labeit, Mannheim University, Mannheim
Anti-ubiquitin (P4D1), monoclonal Santa Cruz Biotechnology
Anti-GFP (FL), polyclonal Santa Cruz Biotechnology
Alexa Fluor® 488 anti-mouse IgG Molecular Probes
Alexa Fluor® 546 anti-rabbit IgG Molecular Probes
Anti-rabbit IgG
Cy3 conjugate
Sigma
Anti-rabbit IgG peroxidase conjugate Sigma and Dianova
Anti-mouse IgG peroxidase conjugate Dianova
2.1.4 Bacterial strain
Escherichia coli (DH10B) cells Invitrogen
2.1.5 Kits
QIAGEN Plasmid Maxi Kit Qiagen
QIAquick gel extraction kit Qiagen
QIAquick PCR purification kit Qiagen
Rediprime™ II kit Amersham Biosciences
Extract-N-Amp™ Tissue PCR Kit Sigma
SV Total RNA Isolation Kit Promega
SuperScript™ III First-Strand Synthesis
System for RT-PCR
Invitrogen
2.1.6 Oligonucleotides
All primers and probes were designed using the Primer Express software or the
Primer3 program, which is online available, and purchased from the MWG Biotech
AG.
Material and Methods
26
2.1.7 Consumable material
Blotting paper (Whatman 3MM) Schleicher & Schuell
Cell scraper Sarstedt AG & Co.
Cell strainer Becton Dickinson
Coverslips (∅ 10 mm) Glaswarenfabrik Karl Hecht KG
Cuvettes (10 x 4 x 45 mm) Sarstedt AG & Co.
Culture flasks (T75) Sarstedt AG & Co.
Culture plates (6-well) Greiner Bio-One GmbH
Culture plates (12-well) Nalge Nunc International
Falcon tubes (15 and 50 ml) Sarstedt AG & Co.
Glassware Schott Duran
Hypodermic needles (Sterican® Gr.20) Braun
Insulin syringes
(BD Plastipak™ U-40 1 ml)
Becton Dickinson
Lab-Tek™ chambers Nalge Nunc International
Latex gloves Paul Hartmann AG
Microscope slides Paul Marienfeld GmbH
Micro tubes (1.5, 2.0 ml) Sarstedt AG & Co.
Multiple well plates (96-wells) Sarstedt AG & Co.
Nitrile gloves Ansell
Nitrocellulose membrane
(Protran® BA 85)
Schleicher & Schuell
Nylon membrane (Hybond N+) Amersham Biosciences
PCR tubes Sarstedt AG & Co.
Pipette tips
(for 10, 100 and 1000 µl pipettes)
Sarstedt AG & Co.
Phospho Imager plates Fuji
Serological pipettes (2, 5, 10 and 25 ml) Sarstedt AG & Co.
Serological pipettes (10 ml, wide tip) Becton Dickinson
Sterile filter (0.22 µm) Sarstedt AG & Co.
Material and Methods
27
2.1.8 Laboratory equipment
Accu-jet pipetting aid Brand GmbH
Analytical balance (GENIUS) Sartorius AG
Benchtop centrifuge Sarstedt AG & Co.
Blotting system (Mini Trans-Blot® cell) Bio-Rad
Centrifuge (5810 R) Eppendorf AG
Chemie Genius2 Bio imaging system
with Gene Tools software
Syngene
Electrophoresis system (Sub-Cell GT) Bio-Rad
Electrophoresis system
(Mini PROTEAN® 3 electrophoresis cell)
Bio-Rad
Ice machine Scotsman
Incubators (B 5050 E and Hera cell 240) Heraeus Instruments
Incubator shaker (C25 classic) New Brunswick Scientific
Magnetic stirrer (IKAMAG® RCT) Janke & Kunkel GmbH
Microplate reader (Tecan Safire2) Tecan
Microcentrifuge (5415 R) Eppendorf AG
Microscope (Axiovert 25) Zeiss
Microscope (Axiovert 200 M) with a
40x-oil objective and with a LSM 5
image system
Zeiss
Microwave Sharp
Neubauer chamber Glaswarenfabrik Karl Hecht KG
PCR cycler (GeneAmp® PCR system 9700)
Applied Biosystems
PCR sprint thermal cycler Thermo Hybaid
pH-meter Knick GmbH
Phospho Imager system (FLA-3000) Fuji
Pipettes (10, 100, 1000 µl) Eppendorf AG
Portable balance (Scout™ Pro) Ohaus
Power supply Bio-Rad
Precision balance (Precision Advanced) Ohaus
Rectal thermometer Physitemp
Spectrophotometer (Smart Spec™ 3000) Bio-Rad
Material and Methods
28
Sterile work bench (Lamin Air HB 2448) Heraeus Instruments
Surgical instruments Karl Hammacher GmbH
Taqman ABI Prism 7900HT sequence
detection system with ABI 7900HT SDS
2.2 software
Applied Biosystems
Tissue Lyser Qiagen
Thermomixer comfort Eppendorf AG
Ultra-pure water system Milli-Q plus Millipore
Ultrasonograph
(Visual Sonics Vevo 770®) with a
30-MHz central frequency transducer
Visual Sonics
Vortexer (Vibrofix VF1) Janke & Kunkel GmbH
Water bath GFL
2.1.9 Animal models
The investigations conform to the guide for the care and use of laboratory animals
published by the NIH (Publication No. 85-23, revised 1985).
2.1.9.1 The M7t mouse model
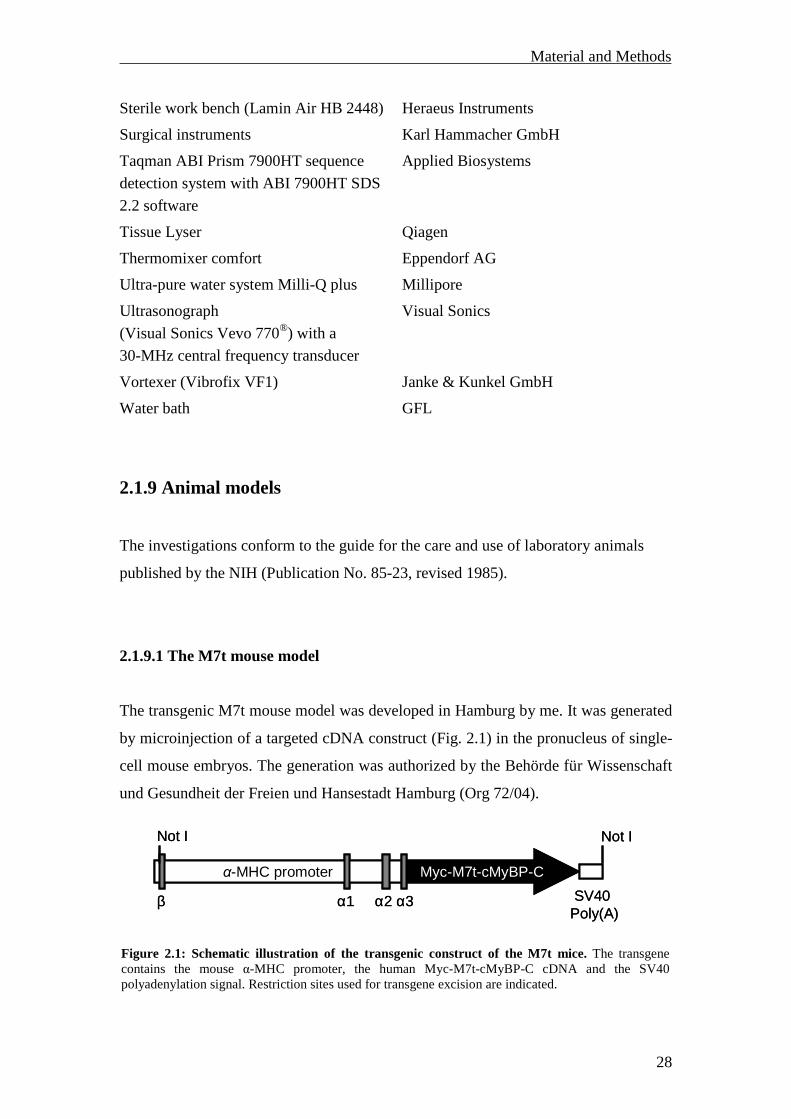
The transgenic M7t mouse model was developed in Hamburg by me. It was generated
by microinjection of a targeted cDNA construct (Fig. 2.1) in the pronucleus of single-
cell mouse embryos. The generation was authorized by the Behörde für Wissenschaft
und Gesundheit der Freien und Hansestadt Hamburg (Org 72/04).
Figure 2.1: Schematic illustration of the transgenic construct of the M7t mice. The transgene contains the mouse α-MHC promoter, the human Myc-M7t-cMyBP-C cDNA and the SV40 polyadenylation signal. Restriction sites used for transgene excision are indicated.
α-MHC promoter Myc-M7t-cMyBP-C
SV40 Poly(A)
β α1 α2 α3
Not I Not I
α-MHC promoter Myc-M7t-cMyBP-C
SV40 Poly(A)
β α1 α2 α3
Not I Not I
Material and Methods
29
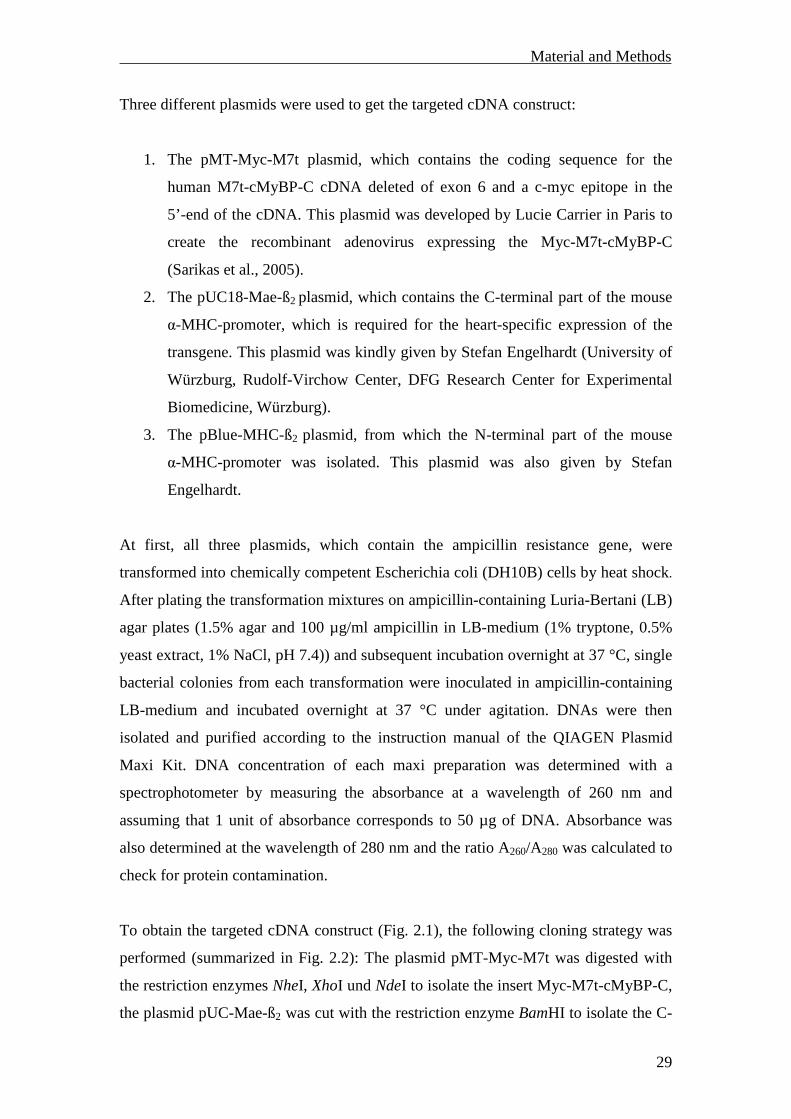
Three different plasmids were used to get the targeted cDNA construct:
1. The pMT-Myc-M7t plasmid, which contains the coding sequence for the
human M7t-cMyBP-C cDNA deleted of exon 6 and a c-myc epitope in the
5’-end of the cDNA. This plasmid was developed by Lucie Carrier in Paris to
create the recombinant adenovirus expressing the Myc-M7t-cMyBP-C
(Sarikas et al., 2005).
2. The pUC18-Mae-ß2 plasmid, which contains the C-terminal part of the mouse
α-MHC-promoter, which is required for the heart-specific expression of the
transgene. This plasmid was kindly given by Stefan Engelhardt (University of
Würzburg, Rudolf-Virchow Center, DFG Research Center for Experimental
Biomedicine, Würzburg).
3. The pBlue-MHC-ß2 plasmid, from which the N-terminal part of the mouse
α-MHC-promoter was isolated. This plasmid was also given by Stefan
Engelhardt.
At first, all three plasmids, which contain the ampicillin resistance gene, were
transformed into chemically competent Escherichia coli (DH10B) cells by heat shock.
After plating the transformation mixtures on ampicillin-containing Luria-Bertani (LB)
agar plates (1.5% agar and 100 µg/ml ampicillin in LB-medium (1% tryptone, 0.5%
yeast extract, 1% NaCl, pH 7.4)) and subsequent incubation overnight at 37 °C, single
bacterial colonies from each transformation were inoculated in ampicillin-containing
LB-medium and incubated overnight at 37 °C under agitation. DNAs were then
isolated and purified according to the instruction manual of the QIAGEN Plasmid
Maxi Kit. DNA concentration of each maxi preparation was determined with a
spectrophotometer by measuring the absorbance at a wavelength of 260 nm and
assuming that 1 unit of absorbance corresponds to 50 µg of DNA. Absorbance was
also determined at the wavelength of 280 nm and the ratio A260/A280 was calculated to
check for protein contamination.
To obtain the targeted cDNA construct (Fig. 2.1), the following cloning strategy was
performed (summarized in Fig. 2.2): The plasmid pMT-Myc-M7t was digested with
the restriction enzymes NheI, XhoI und NdeI to isolate the insert Myc-M7t-cMyBP-C,
the plasmid pUC-Mae-ß2 was cut with the restriction enzyme BamHI to isolate the C-
Material and Methods
30
terminal (Cter) part of the α-MHC-promoter (in the following named pUC-Mae), and
the plasmid pBlue-MHC-ß2 was digested with the restriction enzymes NdeI und SalI
to isolate the N-terminal (Nter) part of the α-MHC- promoter (in the following named
pBlue-MHC). All digestions were performed in appropriate buffers (containing 1x
BSA) overnight at 37 °C and then separated by electrophoresis on 1% agarose gels
(1% agarose and 0.4 µg/ml ethidium bromide in TBE buffer (45 mM Tris base, 45
mM boric acid, 1 mM EDTA, pH 8.0). The corresponding fragments were excised
from the gels and the contained DNAs were extracted and purified according to the
instruction manual of the QIAquick gel extraction kit. The isolated DNA fragments
were checked on a 1% agarose gel and DNA concentrations were determined with a
MassRuler™ DNA ladder, which was also loaded on the gel. A Klenow-reaction was
performed at 25 °C for 15 min with the isolated Myc-M7t-cMyBP-C and the isolated
pUC-Mae using the DNA polymerase I large fragment (Klenow, 5 U/µl) in
corresponding 1x buffer containing 33 µM dNTPs. Klenow reaction was stopped by
adding 10 mM EDTA and heating at 75 °C for 20 min. DNAs were then extracted and
purified with the QIAquick PCR purification kit, and DNA concentrations were
determined with the MassRuler™ DNA ladder on a 1% agarose gel. Following
Klenow reaction, pUC-Mae was dephosphorylated using the calf intestinal alkaline
phosphatase (CIP, 1 U/µl) in corresponding buffer at 37 °C for 30 min. Reaction was
stopped by adding 10 mM EDTA and heating at 65 °C for 15 min. DNA was
extracted and purified with the QIAquick PCR purification kit, and DNA
concentration was determined as described above. In the next step, Myc-M7t-cMyBP-
C (insert) was ligated in pUC-Mae (vector) by using a 1:3 vector to insert ratio and
the T4 DNA ligase (400 U/µl) in corresponding 1x buffer. Ligation was performed
overnight at 14 °C. The ligation reaction was transformed into chemically competent
Escherichia coli (DH10B) cells by heat shock and then plated on ampicillin-
containing LB agar plates. After incubation overnight at 37 °C, single bacterial
colonies were incubated in ampicillin-containing LB-medium overnight at 37 °C
under agitation. DNA was isolated and purified according to the instruction manual of
the QIAGEN Plasmid Maxi Kit. Positive pUC-M7t-clones (identified by digestion
with the restriction enzymes BamHI and XhoI) were cut with the restriction enzymes
NdeI and SalI in an appropriate buffer (containing 1x BSA) overnight at 37 °C to
isolate the part Cter-α-MHC-promoter + Myc-M7t-cMyBP-C. After separation by
electrophoresis on a 0.8% agarose gel, the corresponding fragment was excised from
Material and Methods
31
the gel, and the contained DNA was extracted and purified according to the
instruction manual of the QIAquick gel extraction kit. This freshly isolated fragment
was ligated in the isolated pBlue-MHC as described above. Following transformation,
DNA amplification and purification were also performed as described above.
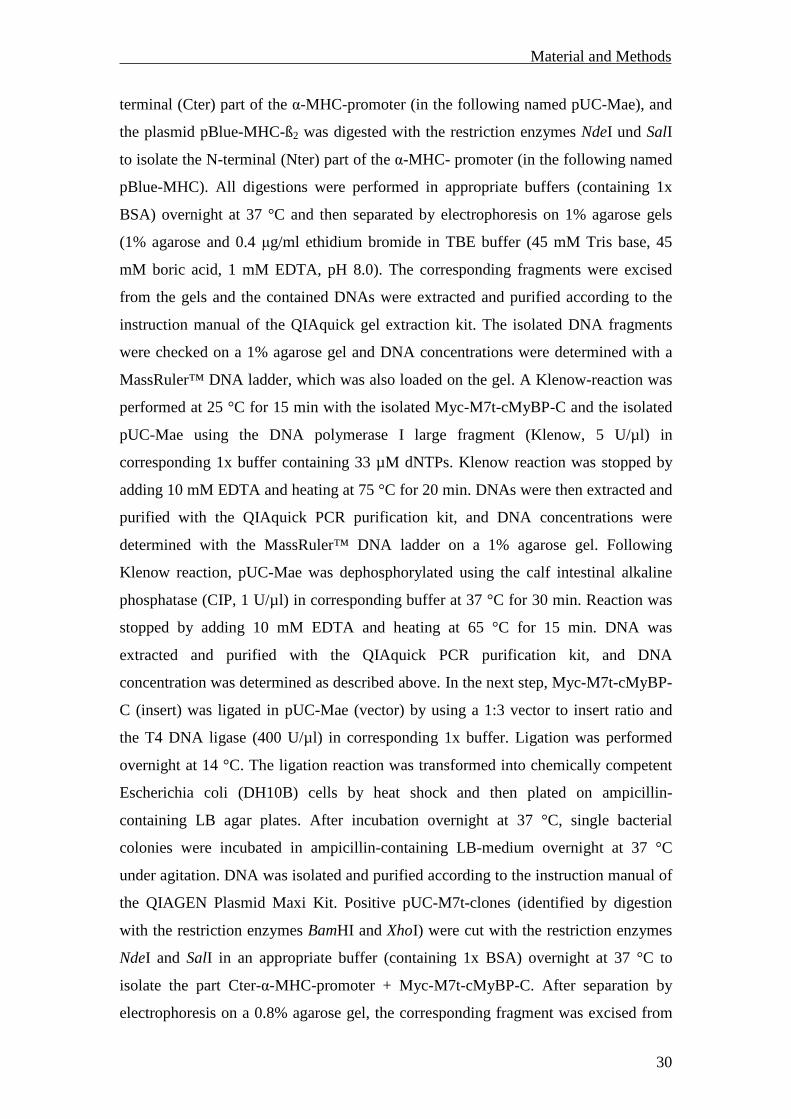
Figure 2.2: Cloning strategy to create the M7t mouse model. A, The plasmid pMT-Myc-M7t was
cut with the restriction enzymes NheI, XhoI und NdeI to isolate the insert Myc-M7t-cMyBP-C.
Afterwards, a Klenow-reaction was performed with the isolated Myc-M7t-cMyBP-C. B, The plasmid
pUC-Mae-ß2 was cut with the restriction enzyme BamHI to isolate the C-terminal part (Cter) of the
α-MHC-promoter (pUC-Mae). Afterwards, a Klenow-reaction was performed with the isolated pUC-
Mae followed by a dephosphorylation. C, The plasmid pBlue-MHC-ß2 was cut with the restriction
enzymes NdeI und SalI to isolate the N-terminal (Nter) part of the α-MHC- promoter (pBlue-MHC). D,
Myc-M7t-cMyBP-C was ligated in pUC-Mae. Positive pUC-M7t-clones were cut with the restriction
enzymes NdeI and SalI to isolate the part Cter-α-MHC-promoter + Myc-M7t-cMyBP-C. This isolated
part was then ligated in the isolated pBlue-MHC to get the final cDNA construct (Fig. 2.3).
NheI
XhoI
NdeI
Myc-M7t-cMyBP-C3.8 kb
pMT-Myc-M7t
BamHI
BamHI / SalI
NdeI
ß2ARpUC-Mae-ß2
Cter-αααα-MHC-promoter
1.1 kb
ß2AR
pBlue-MHC-ß2Cter-α-MHC-promoter
Nter-αααα-MHC-promoter
4.3 kb
SalI NotI
NdeI
NotI
BamHI
BamHI / SalI
NdeI
Cter-αααα-MHC-promoter
1.1 kb
Myc-M7t-cMyBP-C
3.8 kbpUC-M7t
A B
C D
NheI
XhoI
NdeI
Myc-M7t-cMyBP-C3.8 kb
pMT-Myc-M7t
NheI
XhoI
NdeI
Myc-M7t-cMyBP-C3.8 kb
pMT-Myc-M7t
BamHI
BamHI / SalI
NdeI
ß2ARpUC-Mae-ß2
Cter-αααα-MHC-promoter
1.1 kb
BamHI
BamHI / SalI
NdeI
ß2ARpUC-Mae-ß2
Cter-αααα-MHC-promoter
1.1 kb
ß2AR
pBlue-MHC-ß2Cter-α-MHC-promoter
Nter-αααα-MHC-promoter
4.3 kb
SalI NotI
NdeI
NotI
ß2AR
pBlue-MHC-ß2Cter-α-MHC-promoter
Nter-αααα-MHC-promoter
4.3 kb
SalI NotI
NdeI
NotI
BamHI
BamHI / SalI
NdeI
Cter-αααα-MHC-promoter
1.1 kb
Myc-M7t-cMyBP-C
3.8 kbpUC-M7t
BamHI
BamHI / SalI
NdeI
Cter-αααα-MHC-promoter
1.1 kb
Myc-M7t-cMyBP-C
3.8 kbpUC-M7t
A B
C D
Material and Methods
32
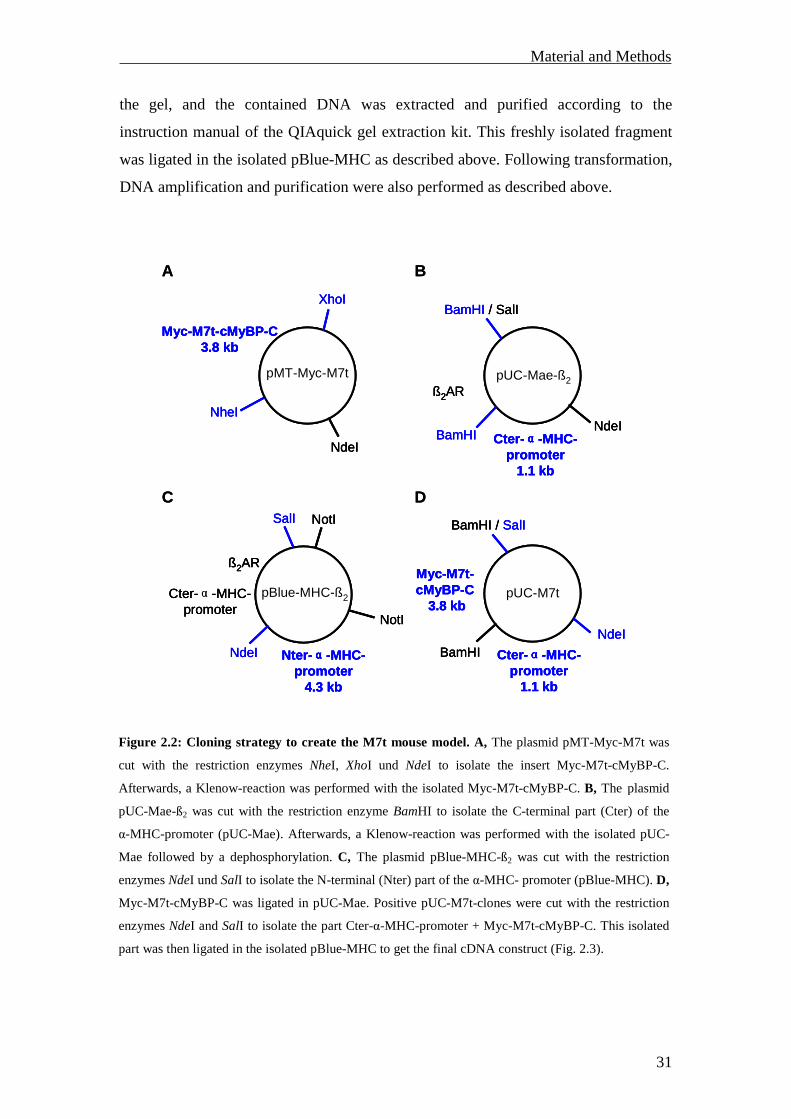
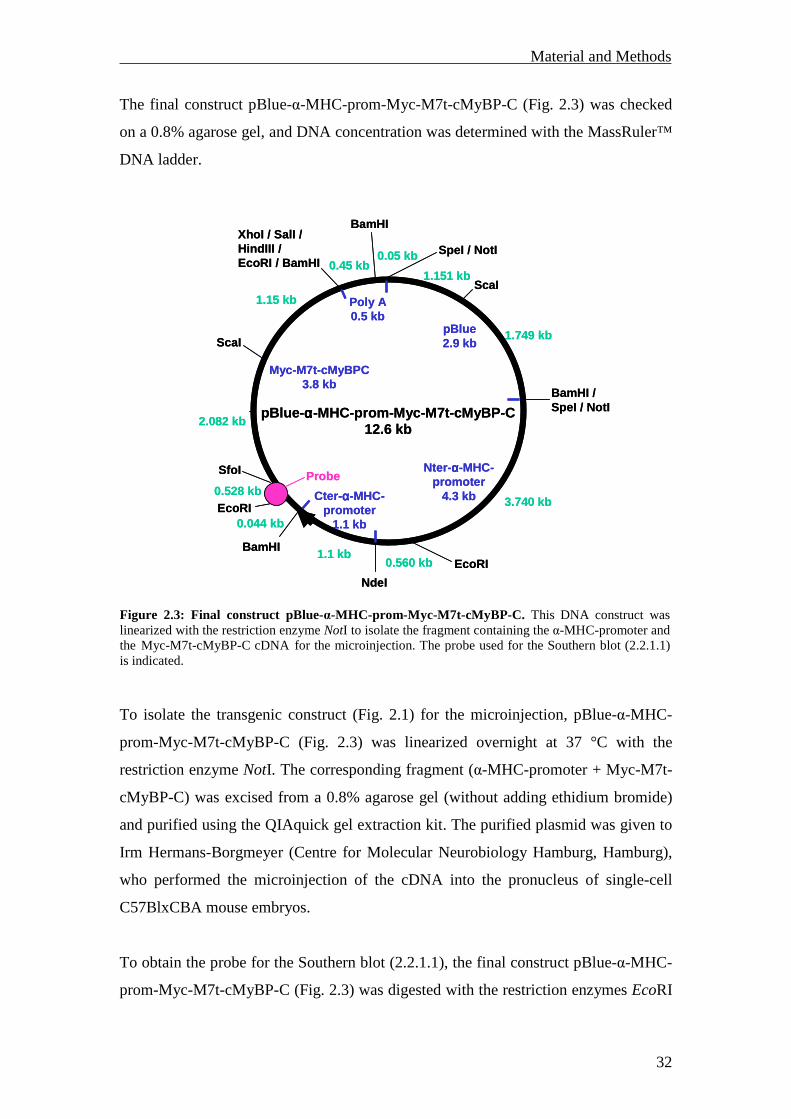
The final construct pBlue-α-MHC-prom-Myc-M7t-cMyBP-C (Fig. 2.3) was checked
on a 0.8% agarose gel, and DNA concentration was determined with the MassRuler™
DNA ladder.
To isolate the transgenic construct (Fig. 2.1) for the microinjection, pBlue-α-MHC-
prom-Myc-M7t-cMyBP-C (Fig. 2.3) was linearized overnight at 37 °C with the
restriction enzyme NotI. The corresponding fragment (α-MHC-promoter + Myc-M7t-
cMyBP-C) was excised from a 0.8% agarose gel (without adding ethidium bromide)
and purified using the QIAquick gel extraction kit. The purified plasmid was given to
Irm Hermans-Borgmeyer (Centre for Molecular Neurobiology Hamburg, Hamburg),
who performed the microinjection of the cDNA into the pronucleus of single-cell
C57BlxCBA mouse embryos.
To obtain the probe for the Southern blot (2.2.1.1), the final construct pBlue-α-MHC-
prom-Myc-M7t-cMyBP-C (Fig. 2.3) was digested with the restriction enzymes EcoRI
Figure 2.3: Final construct pBlue-α-MHC-prom-Myc-M7t-cMyBP-C. This DNA construct was linearized with the restriction enzyme NotI to isolate the fragment containing the α-MHC-promoter and the Myc-M7t-cMyBP-C cDNA for the microinjection. The probe used for the Southern blot (2.2.1.1) is indicated.
pBlue- αααα-MHC-prom-Myc-M7t-cMyBP-C12.6 kb
BamHI
BamHI / SpeI / NotI
XhoI / SalI / HindIII / EcoRI / BamHI
NdeI
BamHI
Myc-M7t-cMyBPC3.8 kb
Cter- αααα-MHC-promoter
1.1 kb
Nter- αααα-MHC-promoter
4.3 kb
pBlue2.9 kb
0.45 kbSpeI / NotI0.05 kb
ScaI
EcoRI
2.082 kb
0.044 kb
1.15 kb
1.749 kb
3.740 kb
1.1 kb
Poly A0.5 kb
ScaI1.151 kb
SfoI
0.528 kb
EcoRI0.560 kb
Probe
Material and Methods
33
and SfoI in an appropriate buffer overnight at 37 °C. The corresponding fragment was
excised from a 0.8% agarose gel and purified using the QIAquick gel extraction kit.
Probe concentration was determined with the MassRuler™ DNA ladder on a 1%
agarose gel.
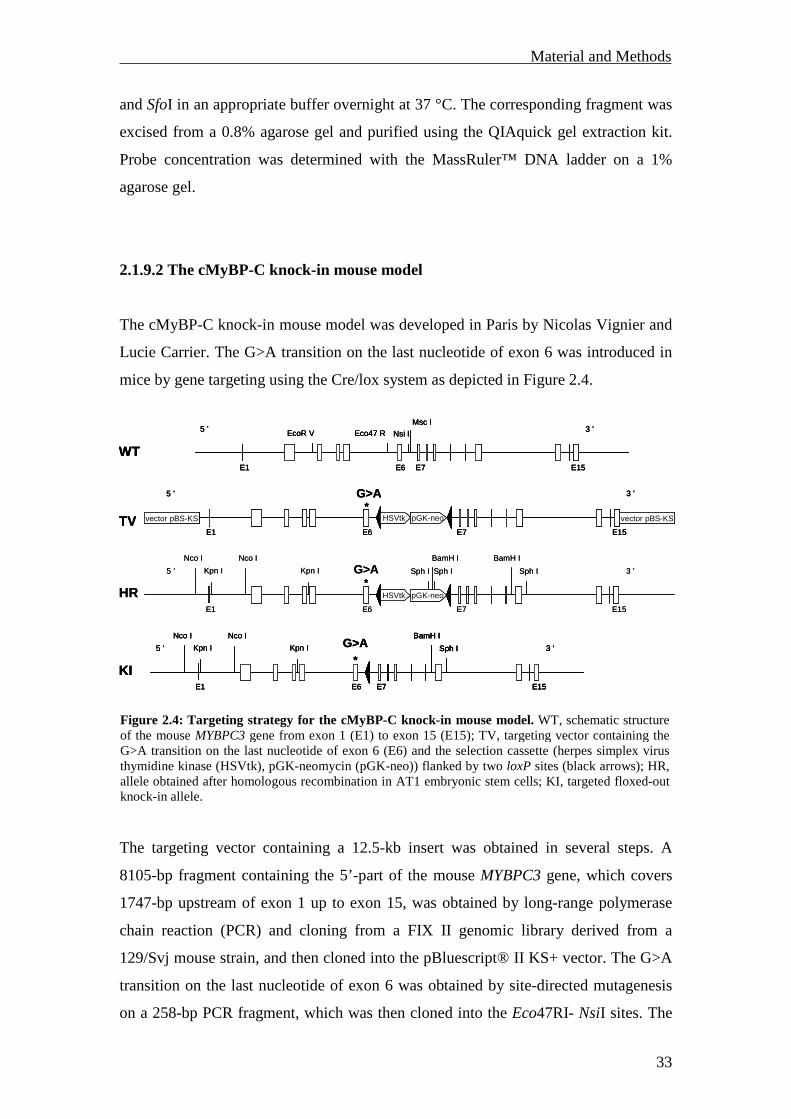
2.1.9.2 The cMyBP-C knock-in mouse model
The cMyBP-C knock-in mouse model was developed in Paris by Nicolas Vignier and
Lucie Carrier. The G>A transition on the last nucleotide of exon 6 was introduced in
mice by gene targeting using the Cre/lox system as depicted in Figure 2.4.
The targeting vector containing a 12.5-kb insert was obtained in several steps. A
8105-bp fragment containing the 5’-part of the mouse MYBPC3 gene, which covers
1747-bp upstream of exon 1 up to exon 15, was obtained by long-range polymerase
chain reaction (PCR) and cloning from a FIX II genomic library derived from a
129/Svj mouse strain, and then cloned into the pBluescript® II KS+ vector. The G>A
transition on the last nucleotide of exon 6 was obtained by site-directed mutagenesis
on a 258-bp PCR fragment, which was then cloned into the Eco47RI- NsiI sites. The
Figure 2.4: Targeting strategy for the cMyBP-C knock-in mouse model. WT, schematic structure of the mouse MYBPC3 gene from exon 1 (E1) to exon 15 (E15); TV, targeting vector containing the G>A transition on the last nucleotide of exon 6 (E6) and the selection cassette (herpes simplex virus thymidine kinase (HSVtk), pGK-neomycin (pGK-neo)) flanked by two loxP sites (black arrows); HR, allele obtained after homologous recombination in AT1 embryonic stem cells; KI, targeted floxed-out knock-in allele.
E1 E6
G>A*
Nco INco I
Kpn I Kpn I5 ’
E7 E15
BamH I
Sph I 3 ’
KI
E7E1 E6
G>A*
E15
5 ’ 3 ’
HSVtk pGK-neovector pBS-KS vector pBS-KSTV
E7E1 E6
G>A*
E15
BamH I BamH I
Sph ISph I Sph I
Nco INco I
Kpn I Kpn I5 ’ 3 ’
HSVtk pGK-neoHR
Msc I
E1 E6
5 ’
E7 E15
3 ’
WTNsi IEco47 REcoR V
E1 E6
G>A*
Nco INco I
Kpn I Kpn I5 ’
E7 E15
BamH I
Sph I 3 ’
KIE1 E6
G>A*
Nco INco I
Kpn I Kpn I5 ’
E7 E15
BamH I
Sph I 3 ’
E7 E15
BamH I
Sph I 3 ’
KI
E7E1 E6
G>A*
E15
5 ’ 3 ’
HSVtk pGK-neovector pBS-KS vector pBS-KSTVE7E1 E6
G>A*
E15
5 ’ 3 ’
HSVtk pGK-neovector pBS-KS vector pBS-KSTV
E7E1 E6
G>A*
E15
BamH I BamH I
Sph ISph I Sph I
Nco INco I
Kpn I Kpn I5 ’ 3 ’
HSVtk pGK-neoHR
Msc I
E1 E6
5 ’
E7 E15
3 ’
WTNsi IEco47 REcoR V
Msc I
E1 E6
5 ’
E7 E15
3 ’
WTNsi IEco47 REcoR V
Material and Methods
34
linearized targeting vector, which contained the mutation and a selection cassette
composed of the neomycin resistance and herpes simplex virus thymidine kinase
genes flanked by two loxP sites, was electroporated into AT1 embryonic stem cells
and proceeded for homologous recombination (Buchou et al., 2003). Genomic DNA
was extracted from G418 resistant clones and screened by long-range PCR to check
for 5’ and 3’ homologous recombination. Two clones with the correct recombination
event were used to obtain germ-line transmitting chimeras (Buchou et al., 2003). One
chimeric mouse was obtained and crossed with a Black-swiss wild-type mouse to
check for germline transmission. Two heterozygous cMyBP-C knock-in females were
crossed with a CD1 Sycp1-Cre transgenic male, which expressed the recombinase Cre
under the control of the Sycp-1 promoter (Vidal et al., 1998). After Cre-mediated
recombination, one loxP site remained in the DNA, which resulted in a 94-bp longer
PCR fragment. Heterozygous offsprings were further backcrossed to Black-swiss
mice. Pups were born in the expected Mendelian ratios of wild-type, heterozygous
and homozygous cMyBP-C knock-in mice. Both heterozygous and homozygous
cMyBP-C knock-in mice appeared normal and were viable up to two years. Further
characterization of this mouse model will be presented in the results.
2.1.9.3 The cMyBP-C knock-out mouse model
The cMyBP-C knock-out mouse model, developed by Lucie Carrier in Paris, is a
transcriptional knock-out (Carrier et al., 2004). It was generated by targeted deletion
of exons 1 and 2 of the mouse MYBPC3 gene, which included the transcription
initiation site. In homozygous cMyBP-C knock-out mice, no cMyBP-C mRNA and
protein were detected, validating the gene inactivation. These mice develop eccentric
left ventricular (LV) hypertrophy with decreased fractional shortening and a
significant increase of the LV mass to body weight ratio at the age of 3-4 months (mo)
compared to corresponding wild-type mice. In addition, histological examination at
this age exhibited myocardial disarray, increase of interstitial fibrosis and calcification
in the fibrotic areas.
Material and Methods
35
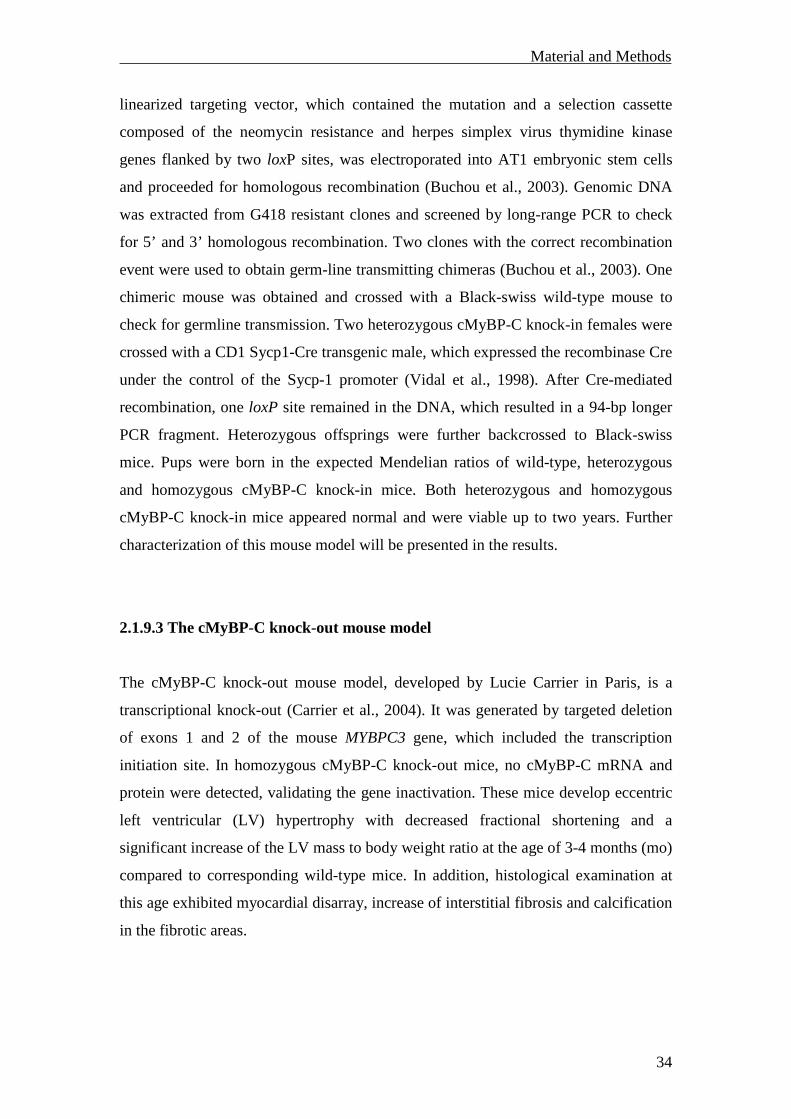
2.1.9.4 The UbG76V-GFP mouse model
The UbG76V-GFP mouse model was kindly given by Nico Dantuma (Microbiology
and Tumor Biology Center, Karolinska Institute, Stockholm). This mouse model
expresses an UbG76V-GFP reporter protein, which is a N-terminal ubiquitin mutant
(UbG76V) in frame with an green fluorescent protein (GFP) and which is widely
expressed at high levels by a chimeric cytomegalovirus immediate early (CMV-IE)
enhancer and a chicken β-actin promoter (Lindsten et al., 2003) (Fig. 2.5).
UbG76V-GFP transcripts were present in different tissues, with predominant expression
in skeletal muscle, heart, testis and cerebellum. The N-terminal-linked ubiquitin
molecule serves as an acceptor for polyubiquitin chains, through the canonical Lys48
and the less common Lys29. The G76V substitution prevents the removal of this
ubiquitin by cellular ubiquitin C-terminal hydrolases, leading to efficient
ubiquitination and proteasomal degradation of the UbG76V-GFP fusion protein.
Therefore, no GFP-fluorescence in any of the tissues was obtained in cryosections
from adult UbG76V-GFP mice by fluorescence microscopy under normal conditions. In
contrast, after treatment with different proteasome inhibitors, pronounced
accumulation of the UbG76V-GFP reporter was visualized in primary fibroblasts and
neonatal cardiomyocytes. The intraperitoneal (i.p.) injection of the proteasome
inhibitor MG262 (5 µmol/kg) in adult UbG76V-GFP mice resulted in a detectable GFP
fluorescence in the liver, small intestine, pancreas, kidney and to a lower extent in the
lung and spleen. No fluorescent cells could be observed in the brain, heart and skeletal
muscles (Lindsten et al., 2003).
Figure 2.5: Schematic illustration of the transgenic construct of the UbG76V-GFP mice. The transgene contains the CMV-IE enhancer, the chicken β-actin promoter, the UbG76V-GFP open reading frame and the SV40 polyadenylation signal. Restriction sites used for transgene excision are indicated (adapted from Lindsten et al., 2003).
Ub L GFP
G76V
AflII XmnI
Chicken β-actinpromoter
CMV-IEenhancer
SV40PA site
Ub L GFP
G76V
AflII XmnI
Chicken β-actinpromoter
CMV-IEenhancer
SV40PA site
Material and Methods
36
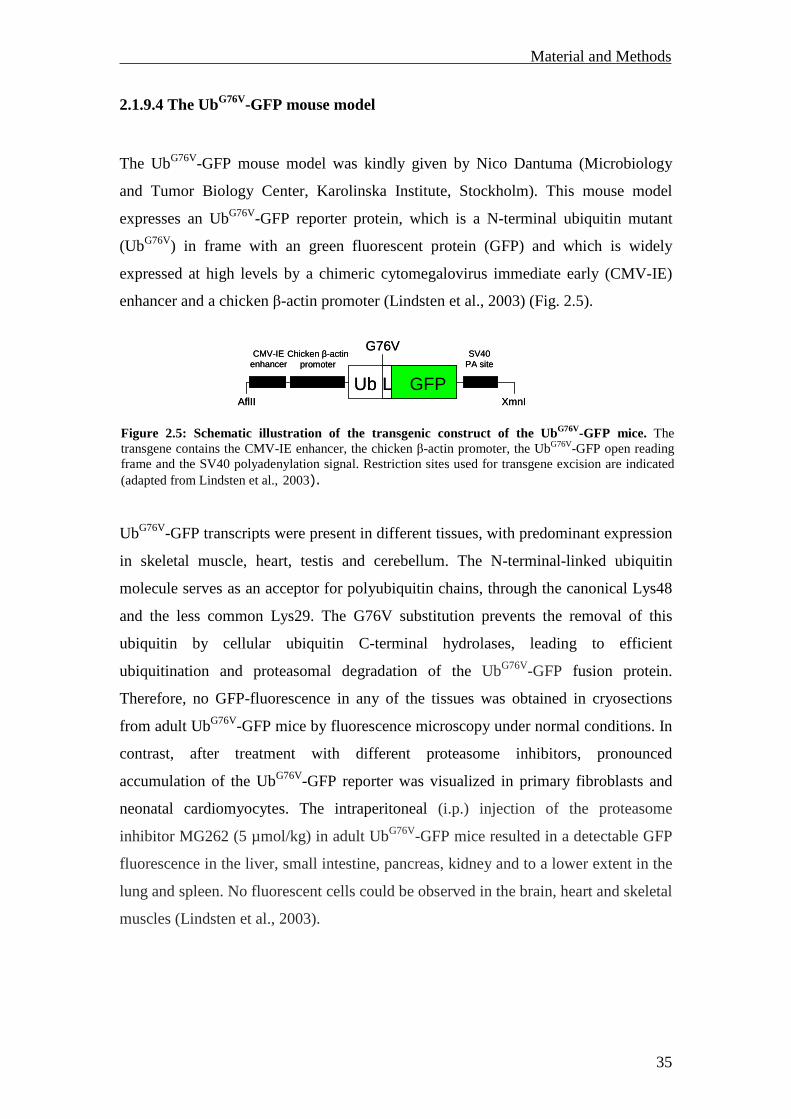
2.1.9.5 The GFPdgn mouse model
The GFPdgn mouse model was kindly provided by Xuejun Wang (Cardiovascular
Research Institute, University of South Dakota School of Medicine, South Dakota).
This mouse model was engineered by fusion of the CL1 degron, which is a consensus
ubiquitination signal sequence, to the C-terminus of the coding sequence of the GFP
(Kumarapeli et al., 2005). This modified GFP (GFPdgn) was placed behind a hybrid
promoter composed of the human CMV-IE enhancer and the chicken β-actin promoter
along with its first intron and in front of the rabbit β-globin poly-adenylation site (Fig.
2.6).
GFPdgn transcripts were expressed in all major organs. The GFPdgn protein was
detected by Western blot in the heart under normal conditions. Proteasome inhibition
with different proteasome inhibitors caused marked increase of the GFPdgn protein in
isolated adult cardiomyocytes analyzed by Western blot or fluorescence microscopy.
Systemic proteasomal inhibition by intravenous (i.v.) injection of MG262 (5 µmol/kg)
in adult GFPdgn mice revealed increased GFPdgn protein levels in all examined
organs (including the heart) analyzed by Western blot or confocal microscopy
(Kumarapeli et al., 2005).
Figure 2.6: Schematic illustration of the transgenic construct of the GFPdgn mice. The transgenic construct consists of the CMV-IE enhancer, the chicken β-actin promoter, the GFPdgn cDNA open reading frame and the polyadenylation sequence (Poly-A) from the rabbit β-globin gene. The 2 grey boxes represent noncoding exons of the chicken β-actin promoter. Restriction sites used for transgene excision are indicated (adapted from Kumarapeli et al., 2005).
Material and Methods
37
2.2 Methods
2.2.1 Genotyping
2.2.1.1 Genotyping by Southern Blot
Genomic DNA was extracted from mouse tails according to the instruction manual of
the DNA isolation reagent for genomic DNA, except that the DNA was dissolved in
TE buffer (1 M Tris-HCl, 0.5 M EDTA, pH 7.4) instead of 8 mM NaOH. Extracted
DNA was digested overnight with the restriction enzyme EcoR I at 37 °C and then
separated by electrophoresis at 130 V on a 0.8% agarose gel for 4.5 h. Afterwards, the
gel was first treated with 0.25 M HCl for 15 min to depurinate the DNA fragments
and then with 0.4 M NaOH for 15 min to denature the DNA. The DNA-gel was
transferred overnight to a positively charged nylon membrane by capillary action
under alkaline conditions (0.4 M NaOH). The dried membrane was exposed overnight
to a hybridization probe at 68 °C in a hybridization solution (ExpressHyb™). The
probe (see 2.1.1.1 and Fig. 2.3) was labeled before with α-32P-dCTP by random
primer labeling using the Rediprime™ II kit. After washing (75 mM NaCl, 7.5 mM
sodium citrate, 1% SDS, pH 7.0), the membrane was exposed overnight to a Phospho-
Imager plate. The pattern of hybridization was visualized using a Phospho-Imager-
System.
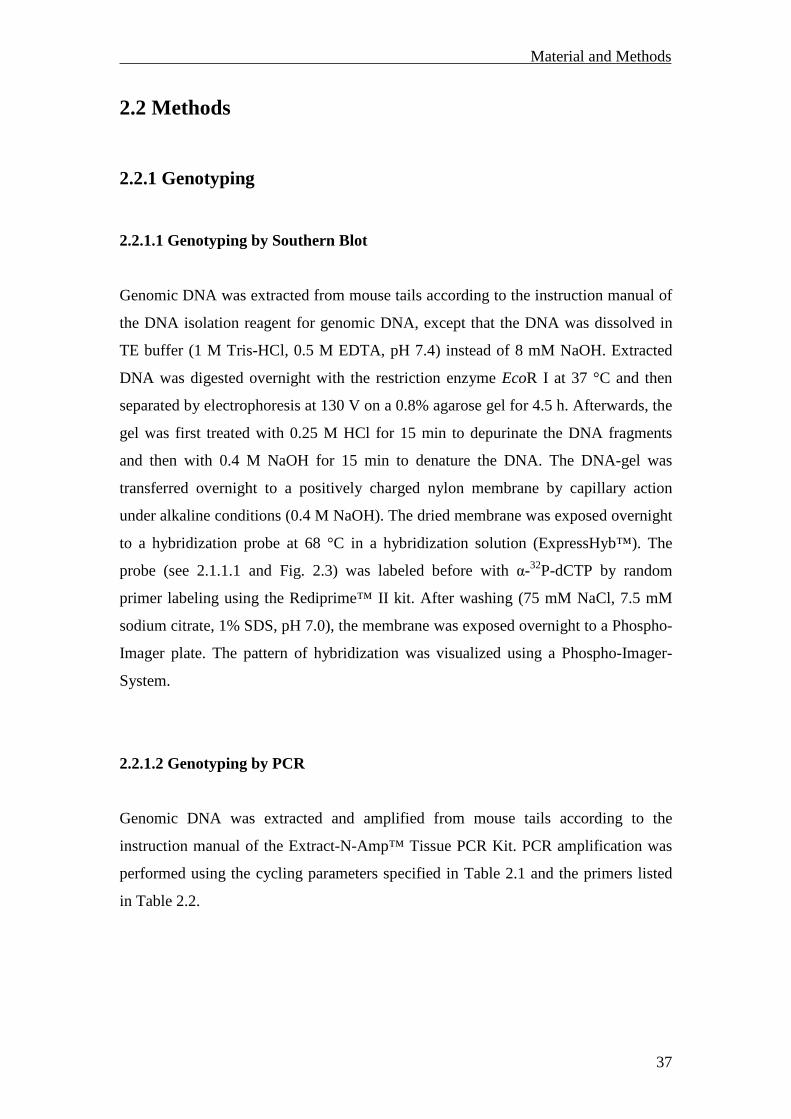
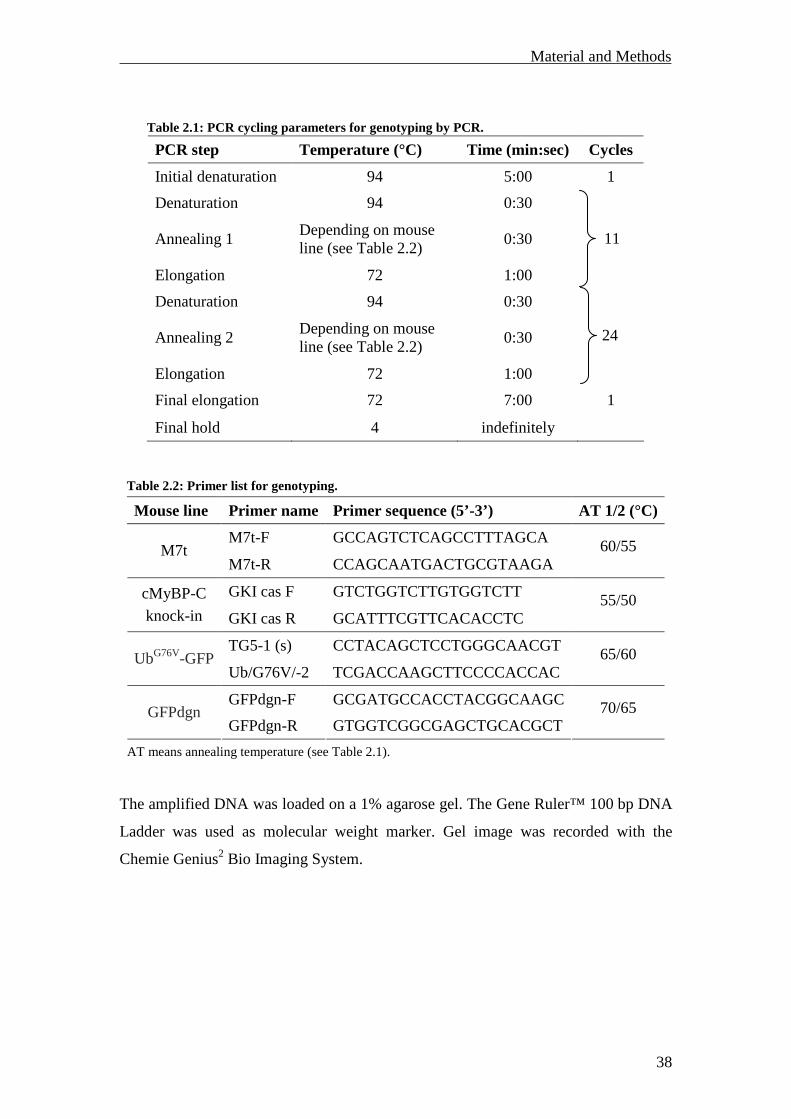
2.2.1.2 Genotyping by PCR
Genomic DNA was extracted and amplified from mouse tails according to the
instruction manual of the Extract-N-Amp™ Tissue PCR Kit. PCR amplification was
performed using the cycling parameters specified in Table 2.1 and the primers listed
in Table 2.2.
Material and Methods
38
Mouse line Primer name Primer sequence (5’-3’) AT 1/2 (°C)
M7t-F GCCAGTCTCAGCCTTTAGCA M7t
M7t-R CCAGCAATGACTGCGTAAGA 60/55
GKI cas F GTCTGGTCTTGTGGTCTT cMyBP-C
knock-in GKI cas R GCATTTCGTTCACACCTC 55/50
TG5-1 (s) CCTACAGCTCCTGGGCAACGT UbG76V-GFP
Ub/G76V/-2 TCGACCAAGCTTCCCCACCAC 65/60
GFPdgn-F GCGATGCCACCTACGGCAAGC GFPdgn
GFPdgn-R GTGGTCGGCGAGCTGCACGCT 70/65
The amplified DNA was loaded on a 1% agarose gel. The Gene Ruler™ 100 bp DNA
Ladder was used as molecular weight marker. Gel image was recorded with the
Chemie Genius2 Bio Imaging System.
PCR step Temperature (°C) Time (min:sec) Cycles
Initial denaturation 94 5:00 1
Denaturation 94 0:30
Annealing 1 Depending on mouse line (see Table 2.2)
0:30
Elongation 72 1:00
Denaturation 94 0:30
Annealing 2 Depending on mouse line (see Table 2.2)
0:30
Elongation 72 1:00
Final elongation 72 7:00 1
Final hold 4 indefinitely
24
11
Table 2.1: PCR cycling parameters for genotyping by PCR.
AT means annealing temperature (see Table 2.1).
Table 2.2: Primer list for genotyping.
Material and Methods
39
2.2.2 Organ extraction
Organ extraction was authorized by the Behörde für Soziales, Familie, Gesundheit
und Verbraucherschutz der Freien und Hansestadt Hamburg (Org 370). Mice were
sacrificed by cervical dislocation in light CO2 anesthesia and weighted. After median
thoracotomy, the hearts were extracted, rinsed in isotonic 0.9% NaCl solution, dried
and weighted. After removing the atria, the ventricular weights were determined. If
needed other organs like lung, liver and kidney were also excised and their weights
noted. After weighing, tissues were frozen in liquid nitrogen and stored at -80 °C until
utilization. To equally portion the ventricles for different preparations, frozen
ventricles were powdered with a steel mortar in liquid nitrogen. The tissue powder
was mainly divided in three portions and also stored at -80 °C until utilization.
2.2.3 RNA analysis
2.2.3.1 RNA isolation
Total RNA was extracted from ~ 30 mg frozen tissue powder (see 2.2.2) or 3.3 x 10⁵
cultured and treated isolated neonatal mouse cardiomyocytes (see 2.2.5.1) according
to the instruction manual of the SV Total RNA Isolation Kit. Total RNA was stored at
-80 °C until further utilization.
2.2.3.2 RNA concentration determination
RNA concentration was determined with a spectrophotometer by measuring the
absorbance at a wavelength of 260 nm and assuming that 1 unit of absorbance
corresponds to 40 µg of RNA. Absorbance was also determined at the wavelength of
280 nm, and the ratio A260/A280 was calculated to test for protein contamination.
Material and Methods
40
2.2.3.3 Reverse transcription (RT)
Total RNA (100 ng from cell preparations and 100 ng or 1 µg from tissue
preparations) was reverse transcribed into cDNA using oligo(dT)s according to the
instruction manual of the SuperScript™ III First-Strand Synthesis System for RT-
PCR. For the amplification of the cMyBP-C pre-mRNA, RT was performed using
random hexamers instead of oligo(dT)s.
2.2.3.4 Classical RT-PCR
To analyze the expression of the transgene in the M7t mouse model, corresponding
cDNAs were amplified according to the instruction manual of the Extract-N-Amp™
Tissue PCR Kit with the exception that 1 µl cDNA was applied instead of 4 µl. The
same cycling parameters as specified in Table 2.1 were used and the used primers are
listed in Table 2.3.
Mouse line Primer name Primer sequence (5’-3’) AT 1/2 (°C)
Myc-M7t-F TGGAGCTAGCATGGAGCAAA M7t
Myc-M7t-R CAGGCCGTACTTGTTGCTG 60/55
The amplified cDNA was loaded on a 1% agarose gel. The Gene Ruler™ 100 bp
DNA Ladder was used as molecular weight marker. Gel images were recorded with
the Chemie Genius2 Bio Imaging System.
To analyze the different cMyBP-C mRNA species in the cMyBP-C knock-in mouse
model, corresponding cDNAs were amplified according to the instruction manual of
the AmpliTaq Gold® polymerase using the cycling parameters specified in Table 2.1
and the primers listed in Table 2.4.
AT means annealing temperature (see Table 2.1).
Table 2.3: Primer list for classical RT-PCR in the M7t mouse model.
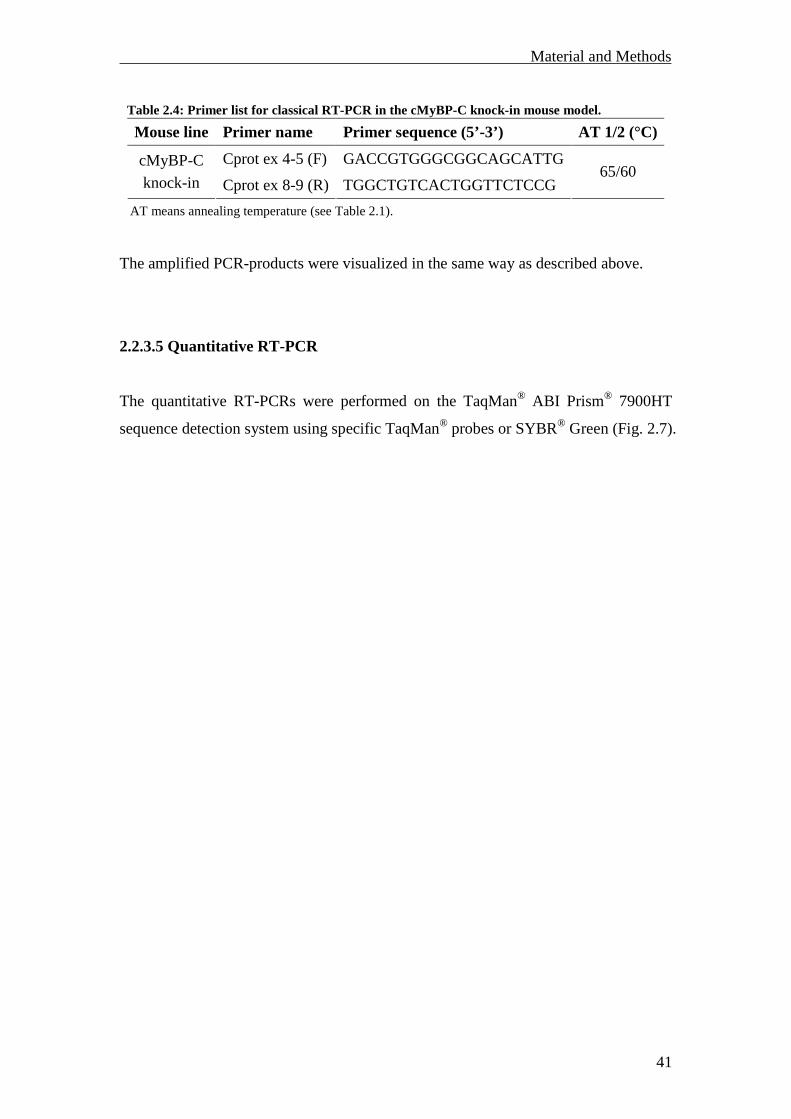
Material and Methods
41
Mouse line Primer name Primer sequence (5’-3’) AT 1/2 (°C)
Cprot ex 4-5 (F) GACCGTGGGCGGCAGCATTG cMyBP-C
knock-in Cprot ex 8-9 (R) TGGCTGTCACTGGTTCTCCG 65/60
The amplified PCR-products were visualized in the same way as described above.
2.2.3.5 Quantitative RT-PCR
The quantitative RT-PCRs were performed on the TaqMan® ABI Prism® 7900HT
sequence detection system using specific TaqMan® probes or SYBR® Green (Fig. 2.7).
AT means annealing temperature (see Table 2.1).
Table 2.4: Primer list for classical RT-PCR in the cMyBP-C knock-in mouse model.
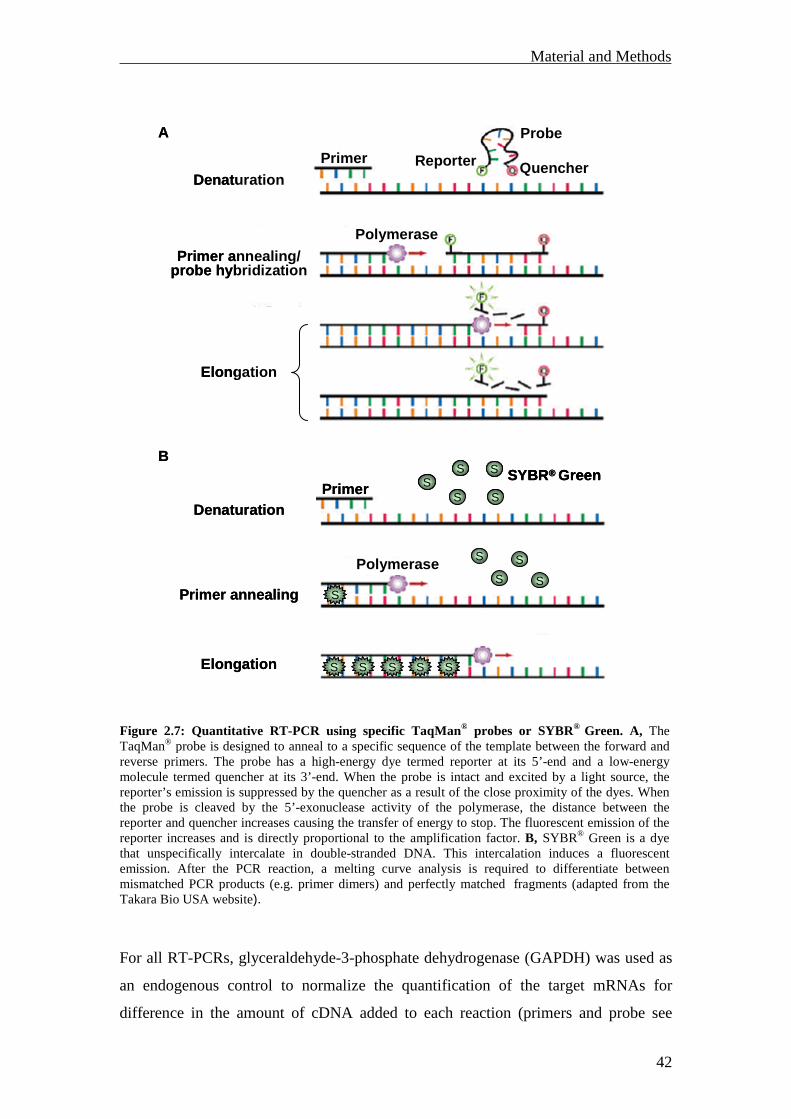
Material and Methods
42
For all RT-PCRs, glyceraldehyde-3-phosphate dehydrogenase (GAPDH) was used as
an endogenous control to normalize the quantification of the target mRNAs for
difference in the amount of cDNA added to each reaction (primers and probe see
Figure 2.7: Quantitative RT-PCR using specific TaqMan® probes or SYBR® Green. A, The TaqMan® probe is designed to anneal to a specific sequence of the template between the forward and reverse primers. The probe has a high-energy dye termed reporter at its 5’-end and a low-energy molecule termed quencher at its 3’-end. When the probe is intact and excited by a light source, the reporter’s emission is suppressed by the quencher as a result of the close proximity of the dyes. When the probe is cleaved by the 5’-exonuclease activity of the polymerase, the distance between the reporter and quencher increases causing the transfer of energy to stop. The fluorescent emission of the reporter increases and is directly proportional to the amplification factor. B, SYBR® Green is a dye that unspecifically intercalate in double-stranded DNA. This intercalation induces a fluorescent emission. After the PCR reaction, a melting curve analysis is required to differentiate between mismatched PCR products (e.g. primer dimers) and perfectly matched fragments (adapted from the Takara Bio USA website).
Primer Reporter Quencher
Polymerase
Probe
Denaturation
Primer annealing/probe hybridization
Elongation
Denaturation
Primer annealing
Elongation
A
B
PrimerSYBR® Green
Polymerase
S
SSS
SS
SS
SS
S S S S S
Primer Reporter Quencher
Polymerase
Probe
Denaturation
Primer annealing/probe hybridization
Elongation
Denaturation
Primer annealing
Elongation
A
B
PrimerSYBR® Green
Polymerase
S
SSS
SS
SS
SS
S S S S S
PrimerSYBR® Green
Polymerase
S
SSS
SS
SS
SS
S S S S S
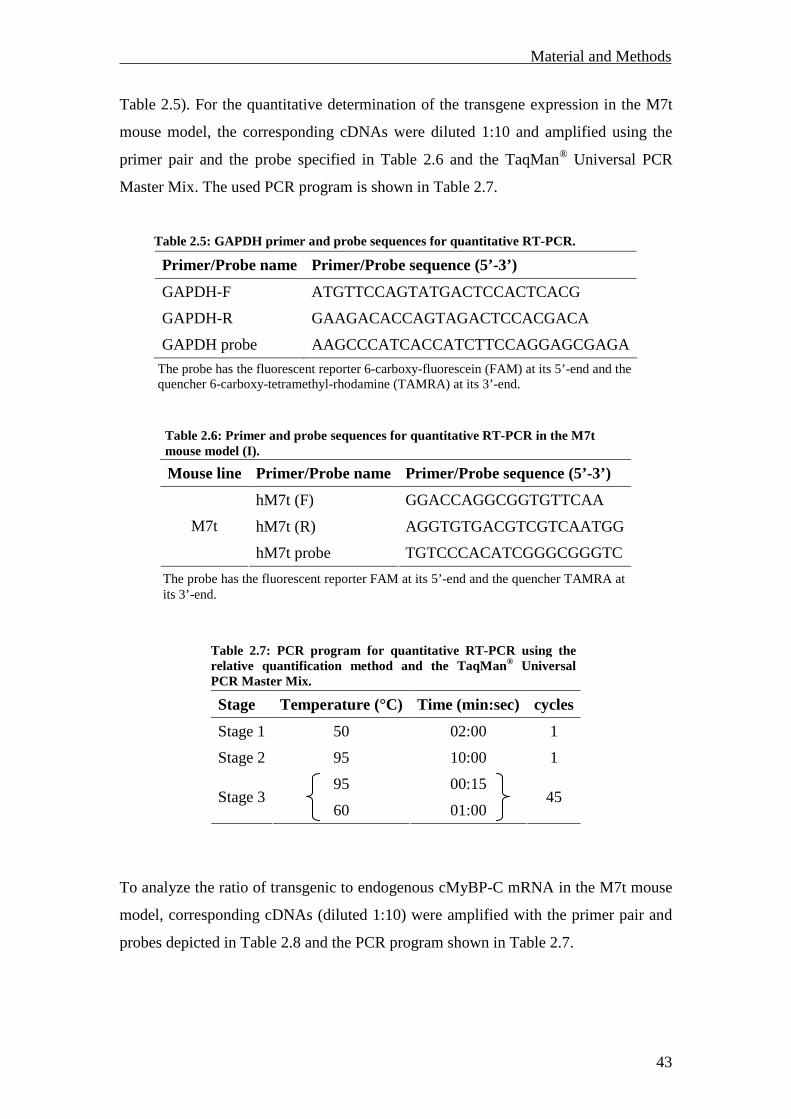
Material and Methods
43
Table 2.5). For the quantitative determination of the transgene expression in the M7t
mouse model, the corresponding cDNAs were diluted 1:10 and amplified using the
primer pair and the probe specified in Table 2.6 and the TaqMan® Universal PCR
Master Mix. The used PCR program is shown in Table 2.7.
Primer/Probe name Primer/Probe sequence (5’-3’)
GAPDH-F ATGTTCCAGTATGACTCCACTCACG
GAPDH-R GAAGACACCAGTAGACTCCACGACA
GAPDH probe AAGCCCATCACCATCTTCCAGGAGCGAGA
Mouse line Primer/Probe name Primer/Probe sequence (5’-3’)
hM7t (F) GGACCAGGCGGTGTTCAA
hM7t (R) AGGTGTGACGTCGTCAATGG M7t
hM7t probe TGTCCCACATCGGGCGGGTC
Stage Temperature (°C) Time (min:sec) cycles
Stage 1 50 02:00 1
Stage 2 95 10:00 1
95 00:15 Stage 3
60 01:00 45
To analyze the ratio of transgenic to endogenous cMyBP-C mRNA in the M7t mouse
model, corresponding cDNAs (diluted 1:10) were amplified with the primer pair and
probes depicted in Table 2.8 and the PCR program shown in Table 2.7.
The probe has the fluorescent reporter FAM at its 5’-end and the quencher TAMRA at its 3’-end.
Table 2.7: PCR program for quantitative RT-PCR using the relative quantification method and the TaqMan® Universal PCR Master Mix.
The probe has the fluorescent reporter 6-carboxy-fluorescein (FAM) at its 5’-end and the quencher 6-carboxy-tetramethyl-rhodamine (TAMRA) at its 3’-end.
Table 2.5: GAPDH primer and probe sequences for quantitative RT-PCR.
Table 2.6: Primer and probe sequences for quantitative RT-PCR in the M7t mouse model (I).
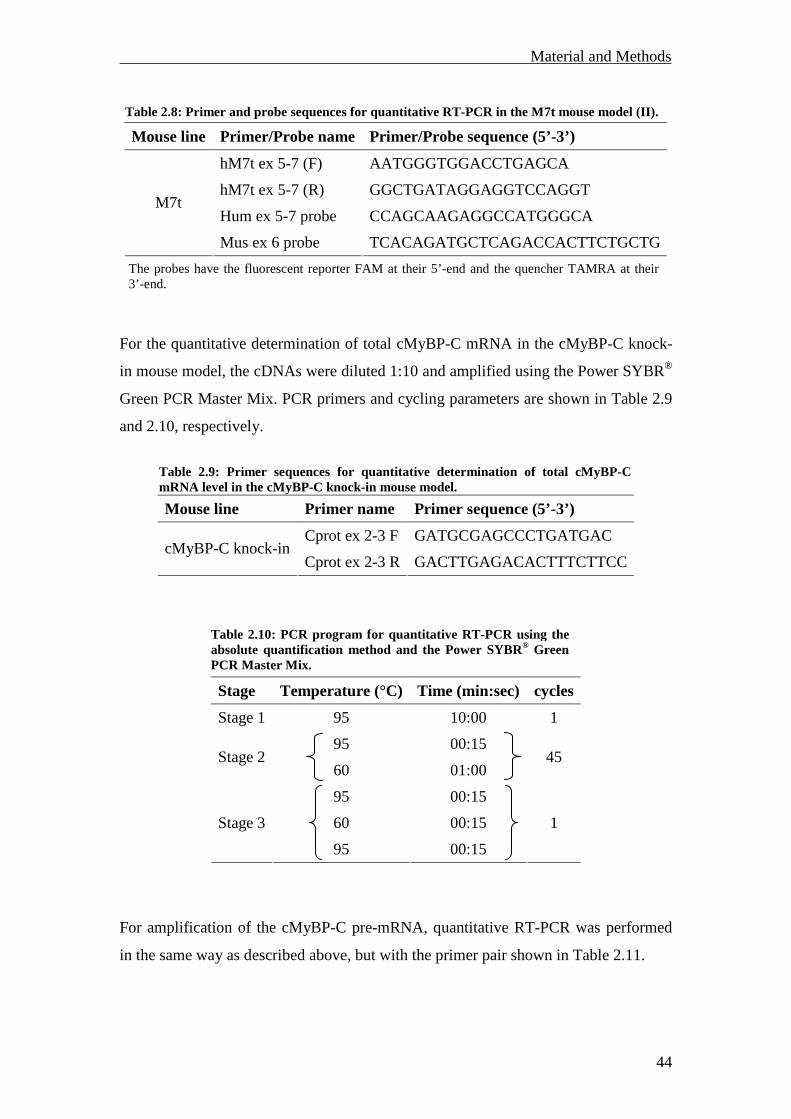
Material and Methods
44
Mouse line Primer/Probe name Primer/Probe sequence (5’-3’)
hM7t ex 5-7 (F) AATGGGTGGACCTGAGCA
hM7t ex 5-7 (R) GGCTGATAGGAGGTCCAGGT
Hum ex 5-7 probe CCAGCAAGAGGCCATGGGCA M7t
Mus ex 6 probe TCACAGATGCTCAGACCACTTCTGCTG
For the quantitative determination of total cMyBP-C mRNA in the cMyBP-C knock-
in mouse model, the cDNAs were diluted 1:10 and amplified using the Power SYBR®
Green PCR Master Mix. PCR primers and cycling parameters are shown in Table 2.9
and 2.10, respectively.
Mouse line Primer name Primer sequence (5’-3’)
Cprot ex 2-3 F GATGCGAGCCCTGATGAC cMyBP-C knock-in
Cprot ex 2-3 R GACTTGAGACACTTTCTTCC
Stage Temperature (°C) Time (min:sec) cycles
Stage 1 95 10:00 1
95 00:15 Stage 2
60 01:00 45
95 00:15
60 00:15 Stage 3
95 00:15
1
For amplification of the cMyBP-C pre-mRNA, quantitative RT-PCR was performed
in the same way as described above, but with the primer pair shown in Table 2.11.
The probes have the fluorescent reporter FAM at their 5’-end and the quencher TAMRA at their 3’-end.
Table 2.9: Primer sequences for quantitative determination of total cMyBP-C mRNA level in the cMyBP-C knock-in mouse model.
Table 2.10: PCR program for quantitative RT-PCR using the absolute quantification method and the Power SYBR® Green PCR Master Mix.
Table 2.8: Primer and probe sequences for quantitative RT-PCR in the M7t mouse model (II).
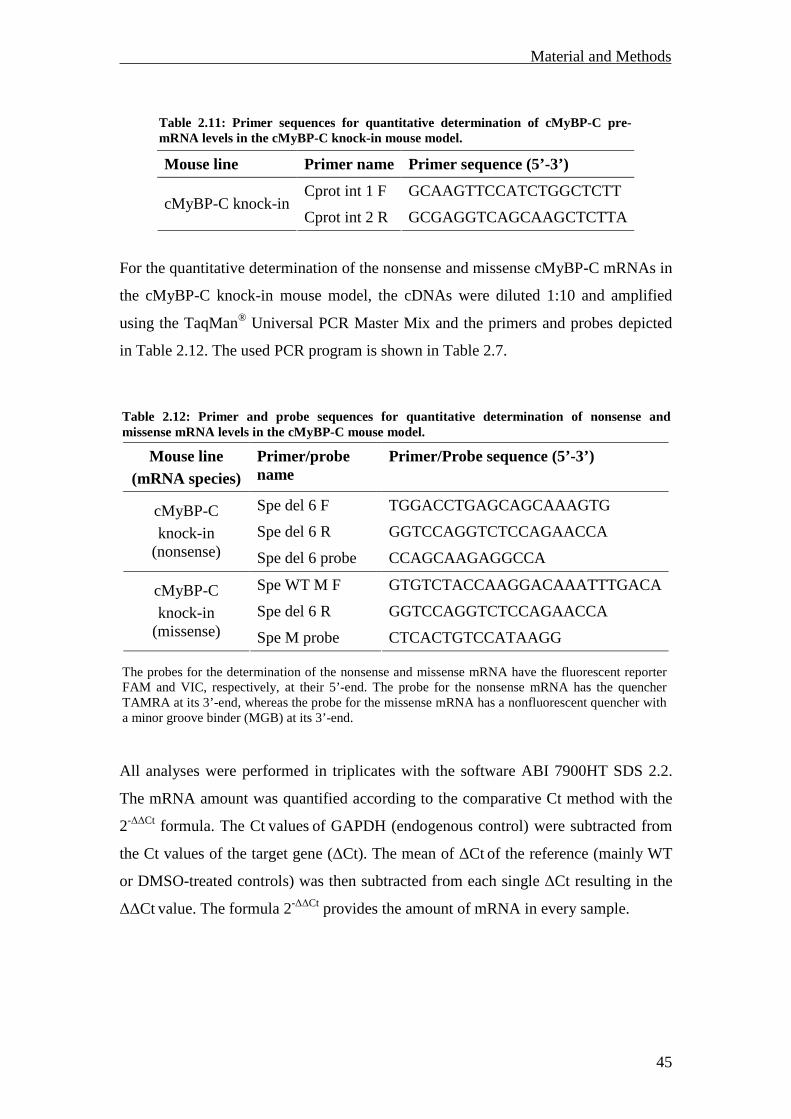
Material and Methods
45
Mouse line Primer name Primer sequence (5’-3’)
Cprot int 1 F GCAAGTTCCATCTGGCTCTT cMyBP-C knock-in
Cprot int 2 R GCGAGGTCAGCAAGCTCTTA
For the quantitative determination of the nonsense and missense cMyBP-C mRNAs in
the cMyBP-C knock-in mouse model, the cDNAs were diluted 1:10 and amplified
using the TaqMan® Universal PCR Master Mix and the primers and probes depicted
in Table 2.12. The used PCR program is shown in Table 2.7.
Mouse line (mRNA species)
Primer/probe name
Primer/Probe sequence (5’-3’)
Spe del 6 F TGGACCTGAGCAGCAAAGTG
Spe del 6 R GGTCCAGGTCTCCAGAACCA cMyBP-C
knock-in (nonsense) Spe del 6 probe CCAGCAAGAGGCCA
Spe WT M F GTGTCTACCAAGGACAAATTTGACA
Spe del 6 R GGTCCAGGTCTCCAGAACCA cMyBP-C
knock-in (missense) Spe M probe CTCACTGTCCATAAGG
All analyses were performed in triplicates with the software ABI 7900HT SDS 2.2.
The mRNA amount was quantified according to the comparative Ct method with the
2-∆∆Ct formula. The Ct values of GAPDH (endogenous control) were subtracted from
the Ct values of the target gene (∆Ct). The mean of ∆Ct of the reference (mainly WT
or DMSO-treated controls) was then subtracted from each single ∆Ct resulting in the
∆∆Ct value. The formula 2-∆∆Ct provides the amount of mRNA in every sample.
The probes for the determination of the nonsense and missense mRNA have the fluorescent reporter FAM and VIC, respectively, at their 5’-end. The probe for the nonsense mRNA has the quencher TAMRA at its 3’-end, whereas the probe for the missense mRNA has a nonfluorescent quencher with a minor groove binder (MGB) at its 3’-end.
Table 2.12: Primer and probe sequences for quantitative determination of nonsense and missense mRNA levels in the cMyBP-C mouse model.
Table 2.11: Primer sequences for quantitative determination of cMyBP-C pre-mRNA levels in the cMyBP-C knock-in mouse model.
Material and Methods
46
2.2.4 Protein analysis
2.2.4.1 Protein extraction
For Western blot analysis, about 30-50 mg tissue powder (see 2.2.2) were mixed with
5 volumes of lysis buffer I (3% SDS, 30 mM Tris base, pH 8.8, 5 mM EDTA, 30 mM
NaF, 10% glycerol) and homogenized with the Tissue Lyser twice for 30 sec at a
frequency of 30 Hz. After centrifugation (13200 rpm, 10 min, room temperature), the
supernatant was collected and its concentration was determined as described in the
next chapter. For protein extraction from cultured cells, 100 µl lysis buffer II (500
mM NaCl, 1% Triton X-100, 1 mM EDTA, 1 mM DTT, 50 mM Tris-HCl, pH 7.4, 1
tablet complete mini-proteases inhibitor cocktail (for 10 ml buffer)) were added to
~ 3.3 x 10⁵ cultured isolated neonatal mouse cardiomyocytes (see 2.2.5.1) or isolated
adult mouse cardiomyocytes (2.2.5.3). After homogenization by pipetting up and
down, the homogenate was centrifuged at 13200 rpm for 10 min at room temperature.
The supernatant was collected and its concentration was determined. For
measurement of the 20S activity, about 30-50 mg tissue powder (see 2.2.2) were
mixed with five volumes of lysis buffer III (1 tablet complete mini-proteases inhibitor
cocktail dissolved in 10 ml aqua ad iniectabilia). After three cycles of freezing (in
liquid nitrogen) and thawing (at room temperature), the samples were homogenized
with the Tissue Lyser as described above. After centrifugation (13200 rpm, 30 min, 4
°C), the supernatant was collected and its concentration was determined.
2.2.4.2 Determination of the protein concentration
The protein concentration was determined by the Bradford protein assay, which is a
dye-binding assay in which a differential color change of a dye occurs in response to
various concentrations of protein (Bradford, 1976). For determination, 5 µl of
supernatant of protein samples were added to 795 µl 0.1 M NaOH. After admixture of
200 µl Coomassie® Brilliant Blue G-250 reagent and incubation at room temperature
for 5 min, the absorbance at 595 nm was measured with a spectrophotometer.
Subtraction of the blank value (800 µl 0.1 M NaOH plus 200 µl Coomassie® Brilliant
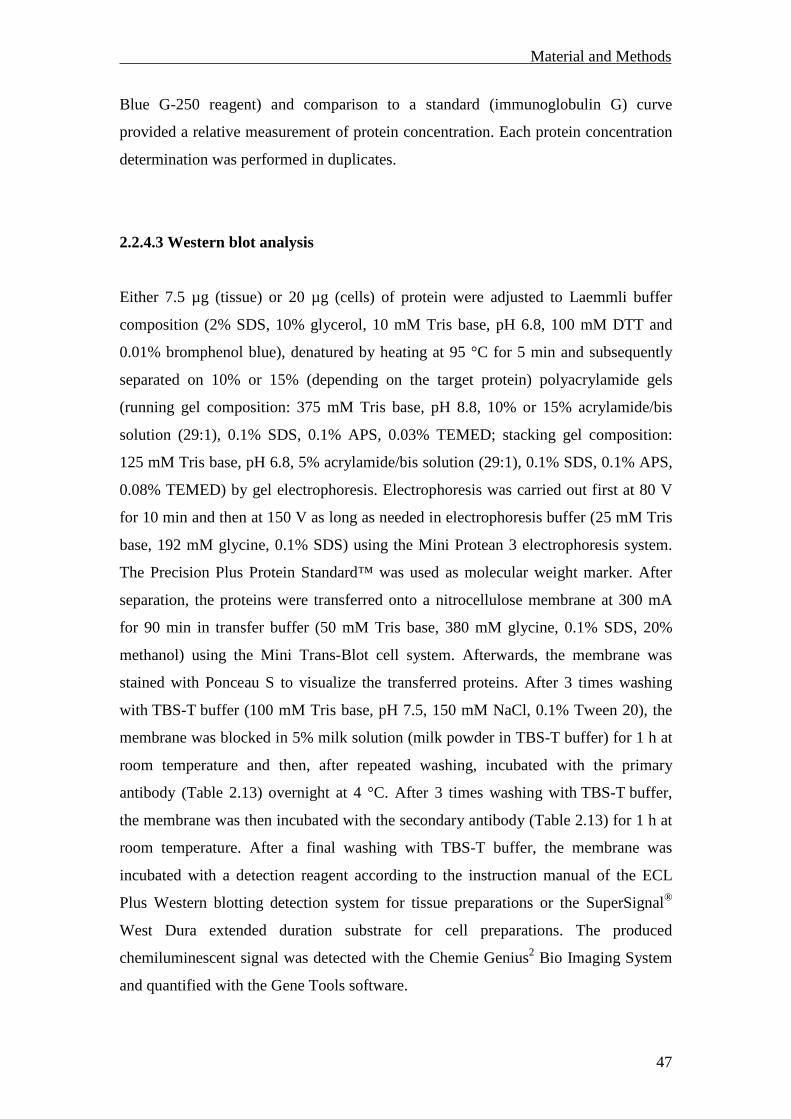
Material and Methods
47
Blue G-250 reagent) and comparison to a standard (immunoglobulin G) curve
provided a relative measurement of protein concentration. Each protein concentration
determination was performed in duplicates.
2.2.4.3 Western blot analysis
Either 7.5 µg (tissue) or 20 µg (cells) of protein were adjusted to Laemmli buffer
composition (2% SDS, 10% glycerol, 10 mM Tris base, pH 6.8, 100 mM DTT and
0.01% bromphenol blue), denatured by heating at 95 °C for 5 min and subsequently
separated on 10% or 15% (depending on the target protein) polyacrylamide gels
(running gel composition: 375 mM Tris base, pH 8.8, 10% or 15% acrylamide/bis
solution (29:1), 0.1% SDS, 0.1% APS, 0.03% TEMED; stacking gel composition:
125 mM Tris base, pH 6.8, 5% acrylamide/bis solution (29:1), 0.1% SDS, 0.1% APS,
0.08% TEMED) by gel electrophoresis. Electrophoresis was carried out first at 80 V
for 10 min and then at 150 V as long as needed in electrophoresis buffer (25 mM Tris
base, 192 mM glycine, 0.1% SDS) using the Mini Protean 3 electrophoresis system.
The Precision Plus Protein Standard™ was used as molecular weight marker. After
separation, the proteins were transferred onto a nitrocellulose membrane at 300 mA
for 90 min in transfer buffer (50 mM Tris base, 380 mM glycine, 0.1% SDS, 20%
methanol) using the Mini Trans-Blot cell system. Afterwards, the membrane was
stained with Ponceau S to visualize the transferred proteins. After 3 times washing
with TBS-T buffer (100 mM Tris base, pH 7.5, 150 mM NaCl, 0.1% Tween 20), the
membrane was blocked in 5% milk solution (milk powder in TBS-T buffer) for 1 h at
room temperature and then, after repeated washing, incubated with the primary
antibody (Table 2.13) overnight at 4 °C. After 3 times washing with TBS-T buffer,
the membrane was then incubated with the secondary antibody (Table 2.13) for 1 h at
room temperature. After a final washing with TBS-T buffer, the membrane was
incubated with a detection reagent according to the instruction manual of the ECL
Plus Western blotting detection system for tissue preparations or the SuperSignal®
West Dura extended duration substrate for cell preparations. The produced
chemiluminescent signal was detected with the Chemie Genius2 Bio Imaging System
and quantified with the Gene Tools software.
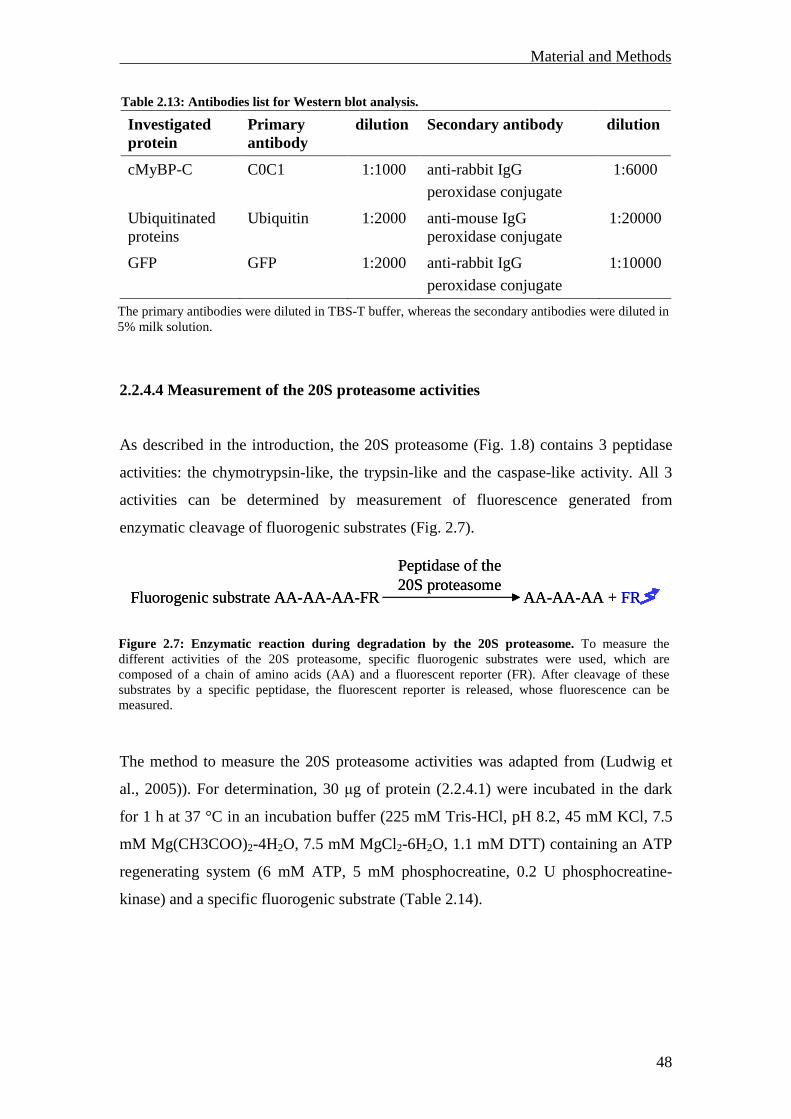
Material and Methods
48
Investigated protein
Primary antibody
dilution Secondary antibody dilution
cMyBP-C C0C1
1:1000 anti-rabbit IgG
peroxidase conjugate
1:6000
Ubiquitinated proteins
Ubiquitin 1:2000 anti-mouse IgG peroxidase conjugate
1:20000
GFP GFP 1:2000 anti-rabbit IgG
peroxidase conjugate 1:10000
2.2.4.4 Measurement of the 20S proteasome activities
As described in the introduction, the 20S proteasome (Fig. 1.8) contains 3 peptidase
activities: the chymotrypsin-like, the trypsin-like and the caspase-like activity. All 3
activities can be determined by measurement of fluorescence generated from
enzymatic cleavage of fluorogenic substrates (Fig. 2.7).
The method to measure the 20S proteasome activities was adapted from (Ludwig et
al., 2005)). For determination, 30 µg of protein (2.2.4.1) were incubated in the dark
for 1 h at 37 °C in an incubation buffer (225 mM Tris-HCl, pH 8.2, 45 mM KCl, 7.5
mM Mg(CH3COO)2-4H2O, 7.5 mM MgCl2-6H2O, 1.1 mM DTT) containing an ATP
regenerating system (6 mM ATP, 5 mM phosphocreatine, 0.2 U phosphocreatine-
kinase) and a specific fluorogenic substrate (Table 2.14).
The primary antibodies were diluted in TBS-T buffer, whereas the secondary antibodies were diluted in 5% milk solution.
Figure 2.7: Enzymatic reaction during degradation by the 20S proteasome. To measure the different activities of the 20S proteasome, specific fluorogenic substrates were used, which are composed of a chain of amino acids (AA) and a fluorescent reporter (FR). After cleavage of these substrates by a specific peptidase, the fluorescent reporter is released, whose fluorescence can be measured.
Table 2.13: Antibodies list for Western blot analysis.
Fluorogenic substrate AA-AA-AA-FR AA-AA-AA + FR
Peptidaseof the20S proteasome
Fluorogenic substrate AA-AA-AA-FR AA-AA-AA + FR
Peptidaseof the20S proteasome
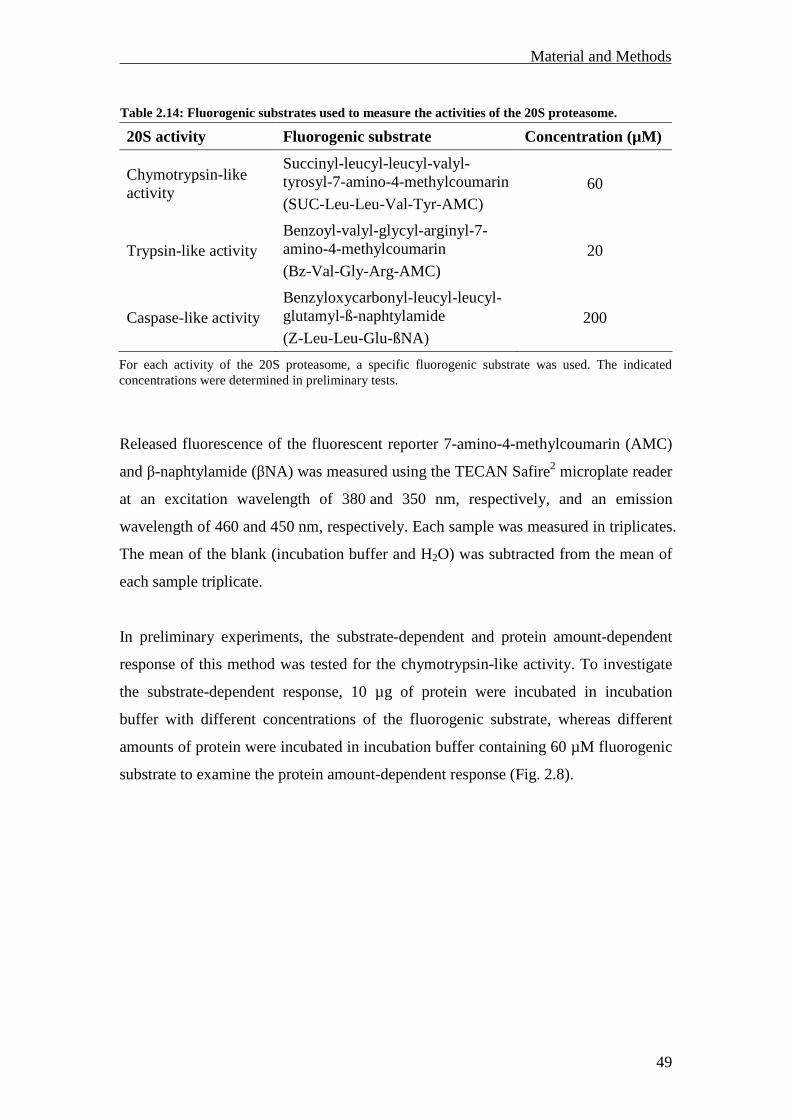
Material and Methods
49
20S activity Fluorogenic substrate Concentration (µM)
Chymotrypsin-like activity
Succinyl-leucyl-leucyl-valyl-tyrosyl-7-amino-4-methylcoumarin
(SUC-Leu-Leu-Val-Tyr-AMC) 60
Trypsin-like activity Benzoyl-valyl-glycyl-arginyl-7-amino-4-methylcoumarin
(Bz-Val-Gly-Arg-AMC) 20
Caspase-like activity Benzyloxycarbonyl-leucyl-leucyl-glutamyl-ß-naphtylamide
(Z-Leu-Leu-Glu-ßNA) 200
Released fluorescence of the fluorescent reporter 7-amino-4-methylcoumarin (AMC)
and β-naphtylamide (βNA) was measured using the TECAN Safire2 microplate reader
at an excitation wavelength of 380 and 350 nm, respectively, and an emission
wavelength of 460 and 450 nm, respectively. Each sample was measured in triplicates.
The mean of the blank (incubation buffer and H2O) was subtracted from the mean of
each sample triplicate.
In preliminary experiments, the substrate-dependent and protein amount-dependent
response of this method was tested for the chymotrypsin-like activity. To investigate
the substrate-dependent response, 10 µg of protein were incubated in incubation
buffer with different concentrations of the fluorogenic substrate, whereas different
amounts of protein were incubated in incubation buffer containing 60 µM fluorogenic
substrate to examine the protein amount-dependent response (Fig. 2.8).
For each activity of the 20S proteasome, a specific fluorogenic substrate was used. The indicated concentrations were determined in preliminary tests.
Table 2.14: Fluorogenic substrates used to measure the activities of the 20S proteasome.
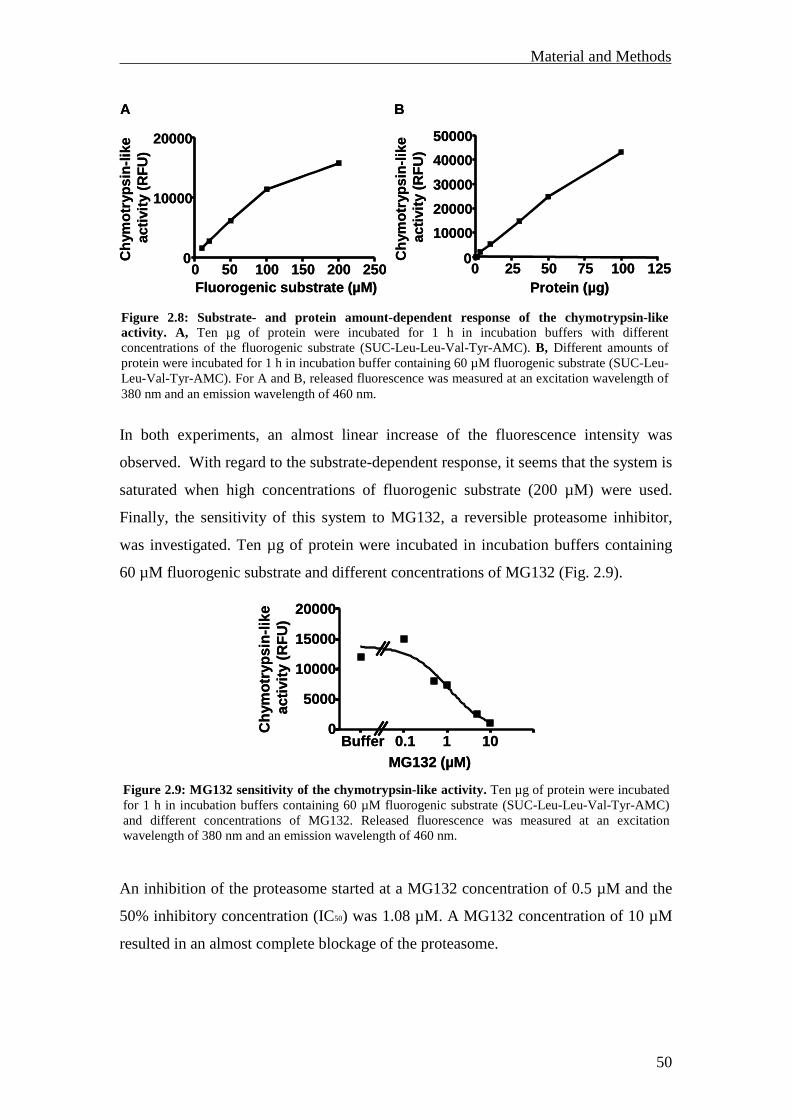
Material and Methods
50
In both experiments, an almost linear increase of the fluorescence intensity was
observed. With regard to the substrate-dependent response, it seems that the system is
saturated when high concentrations of fluorogenic substrate (200 µM) were used.
Finally, the sensitivity of this system to MG132, a reversible proteasome inhibitor,
was investigated. Ten µg of protein were incubated in incubation buffers containing
60 µM fluorogenic substrate and different concentrations of MG132 (Fig. 2.9).
An inhibition of the proteasome started at a MG132 concentration of 0.5 µM and the
50% inhibitory concentration (IC50) was 1.08 µM. A MG132 concentration of 10 µM
resulted in an almost complete blockage of the proteasome.
Figure 2.8: Substrate- and protein amount-dependent response of the chymotrypsin-like activity. A, Ten µg of protein were incubated for 1 h in incubation buffers with different concentrations of the fluorogenic substrate (SUC-Leu-Leu-Val-Tyr-AMC). B, Different amounts of protein were incubated for 1 h in incubation buffer containing 60 µM fluorogenic substrate (SUC-Leu-Leu-Val-Tyr-AMC). For A and B, released fluorescence was measured at an excitation wavelength of 380 nm and an emission wavelength of 460 nm.
Figure 2.9: MG132 sensitivity of the chymotrypsin-like activity. Ten µg of protein were incubated for 1 h in incubation buffers containing 60 µM fluorogenic substrate (SUC-Leu-Leu-Val-Tyr-AMC) and different concentrations of MG132. Released fluorescence was measured at an excitation wavelength of 380 nm and an emission wavelength of 460 nm.
0 50 100 150 200 2500
10000
20000
Fluorogenic substrate (µM)
Chy
mot
ryps
in-li
keac
tivity
(RF
U)
0 25 50 75 100 1250
10000
20000
30000
40000
50000
Protein (µg)
Chy
mot
ryps
in-li
keac
tivity
(RF
U)
A B
0 50 100 150 200 2500
10000
20000
Fluorogenic substrate (µM)
Chy
mot
ryps
in-li
keac
tivity
(RF
U)
0 25 50 75 100 1250
10000
20000
30000
40000
50000
Protein (µg)
Chy
mot
ryps
in-li
keac
tivity
(RF
U)
A B
Buffer 0.1 1 100
5000
10000
15000
20000
MG132 (µM)
Chy
mot
ryps
in-li
keac
tivity
(RF
U)
Buffer 0.1 1 100
5000
10000
15000
20000
MG132 (µM)
Chy
mot
ryps
in-li
keac
tivity
(RF
U)
Material and Methods
51
2.2.5 Cell isolation
2.2.5.1 Neonatal mouse cardiomyocytes
Neonatal mouse cardiomyocytes (NMCM) were isolated from at least 19 1-4 d-old
mice according to a procedure adapted from (Laugwitz et al., 2005). Organ extraction
from neonatal mice was authorized by the Behörde für Soziales, Familie, Gesundheit
und Verbraucherschutz der Freien und Hansestadt Hamburg (Org 366). Neonatal mice
were sacrificed by cervical dislocation. Mouse ventricles were removed aseptically,
kept in a Ca2+/Mg2+-free HBSS on ice, washed, minced into small fragments in HBSS,
and incubated overnight at 4 °C in 0.5 mg/ml trypsin-HBSS. This trypsin predigestion
was followed by five rounds of digestion with 240 U/ml collagenase type II in HBSS
solution at 37 °C for 9 min. Cells were collected in an equal volume of cold dark
medium (DMEM:M199 3:1, 10% horse serum, 5% FCS, 100 U/ml penicillin-
streptomycin, 1 mM HEPES, pH 7.4). The resulting mixture was centrifuged twice
(8 and 5 min) at 600 rpm at room temperature and the cells were resuspended in
20-25 ml of dark medium. To exclude nonmuscle cells, the isolated cells were pre-
plated twice in T75 flasks at 37 °C and 10% CO2 for 75 min. All unattached cells,
which were mainly cardiomyocytes, were transferred to a Falcon tube and spinned
again twice at 320 rpm for 5 min at room temperature before they were counted using
a Neubauer chamber. NMCM were plated on laminin-coated (0.01 mg/ml; in 1x PBS)
12-well dishes at a density of 105 cells/cm2 and incubated at 37 °C and 10% CO2 for
4 d in the dark medium before treatment (see 2.2.6.1).
2.2.5.2 Adult mouse ventricular myocytes
Adult mouse ventricular myocytes (AMVM) were isolated from 3-4 mo-old mice.
Heparinised (20000 U/kg) mice were sacrificed by cervical dislocation in light CO2
anesthesia. After median thoracotomy, hearts were excised, mounted on a
temperature-controlled modified Langendorff perfusion apparatus and retrogradely
perfused through the aorta with a Ca2+-free modified Tyrode’s solution (113 mM
NaCl, 4.7 mM KCl, 0.6 mM KH2PO4, 0.6 mM Na2HPO4-2H2O, 1.2 mM MgSO4-7H20,
Material and Methods
52
12 mM NaHCO3, 10 mM KHCO3, 10 mM HEPES, pH 7.4, 30 mM taurine, 5.5 mM
glucose, 10 mM 2,3-butanedione monoxime (BDM)) at 37 °C for 8 min at 3 ml/min.
This perfusion buffer was then switched to a digestion buffer containing the modified
Tyrode’s solution, 12.5 µM CaCl2 and 0.1 mg/ml Liberase Blendzyme 3 at 37 °C for
9-10 min. The ventricles were excised, minced with forceps and dissociated by gentle
pipetting. The collagenase activity was stopped by the addition of 10% FBS, and
CaCl2 was stepwise reintroduced up to a concentration of 1 mM. After resuspending
and counting with a Neubauer chamber, the isolated cells were plated on laminin-
coated (0.01 mg/ml in 1x PBS) Lab-Tek™ chambers or coverslips at a density of
20000 cells/ml in 1.8 mM Ca2+-plating medium (MEM supplemented with Hanks’
salts and 2 mM glutamine, 100 U/ml penicillin-streptomycin, 5% FBS, 10 mM BDM).
After 2 h pre-plating, the cells were either used immediately for immunofluorescence
analysis (see 2.2.7) or further cultured for treatment in culture medium (MEM
supplemented with Hanks’ salts and 2 mM glutamine, 0.1 mg/ml BSA, 10 mM BDM,
1% insulin/transferrin/selenium, 100 U/ml penicillin-streptomycin) at 37 °C and
5% CO2.
2.2.5.3 Mouse fibroblasts
Fibroblasts were isolated from a 9 mo-old UbG76V-GFP mouse. The mouse was
sacrificed by cervical dislocation in light CO2 anesthesia. After median thoracotomy,
a piece of the subcutis was excised, minced and cultured in a culture medium (DMEM
(4.5 g/l glucose), 10% FCS, 100 U/ml penicillin-streptomycin, 1% glutamine) in a
T75 flask at 37 °C and 5% CO2. After 6 d, the medium was changed and the
fibroblasts were further cultured. When 90% confluence was reached, the fibroblasts
were detached from the flask with a trypsin solution (0.25% trypsin in HEPES/EDTA
buffer) and split 1 to 2.
Material and Methods
53
2.2.6 Treatments
2.2.6.1 Treatment of NMCM
After 4 d of culture in dark medium (see 2.2.5.1), the medium was removed and
NMCM were treated with 10 µM MG132 for the times indicated in the results or with
500 nM epoxomicin (irreversible proteasome inhibitor) for 4 h in 0.1% DMSO-
containing dark medium at 37 °C and 10% CO2 for proteasome inhibition. For
nonsense-mediated mRNA decay (NMD) inhibition, the cells were treated with
100 µg/ml cycloheximide (CHX) or 300 µg/ml emetine in 0.1% DMSO-containing
dark medium for 4 h at 37 °C and 10% CO2. Total RNAs or proteins were extracted
from NMCM as described in 2.2.3.1 or 2.2.4.1, respectively.
2.2.6.2 Treatment of AMVM
After pre-plating, AMVM isolated either from a transgenic M7t mouse or a
homozygous cMyBP-C knock-in mouse were treated with 10 µM MG132 in culture
medium (see 2.2.5.2) for 15 h at 37 °C and 5% CO2. Afterwards proteins were
extracted as described in 2.2.4.1. AMVM isolated from UbG76V-GFP mice were
treated with 10 µM MG132, 100 nM MG262 (reversible proteasome inhibitor) or
500 nM epoxomicin in culture medium for 20 h at 37 °C and 5% CO2. Fluorescence
was analyzed by confocal microscopy using a Zeiss Axiovert 200 M microscope with
a 40x-oil objective. Confocal images were recorded with a Zeiss LSM 5 Image system.
AMVM isolated from GFPdgn mice were treated with 5 µM or 10 µM MG132 in
culture medium for 15 h at 37 °C and 5% CO2. Fluorescence was analyzed in the
same way as described above.
2.2.6.3 Treatment of fibroblasts
Cultured fibroblasts were plated on Lab-Tek™ chambers and treated either with
epoxomicin in a concentration of 5 nM, 50 nM, 500 nM or 5 µM or with MG262 in a
Material and Methods
54
concentration of 1 nM, 10 nM, 100 nM or 1 µM or with MG132 in a concentration of
0.1 µM, 1 µM or 10 µM in 0.1% DMSO-containing culture medium (2.2.5.3) for 15 h
at 37 °C and 5% CO2. Fluorescence was analyzed by confocal microscopy using a
Zeiss Axiovert 200 M microscope with a 40x-oil objective. Confocal images were
recorded with a Zeiss LSM 5 Image system.
2.2.6.4 Treatment of mice
Systemic application of the reversible proteasome inhibitor MG262 was performed
either by i.p. injection (9 µmol/kg in a 60% DMSO-NaCl-solution) or by i.v. injection
into the lateral tail vein (5 µmol/kg in a 38% DMSO-NaCl-solution). The application
was authorized by the Behörde für Wissenschaft und Gesundheit der Freien und
Hansestadt Hamburg (Org 72/04). Heart and liver were excised 24 h after i.p.
injection and 17 h after i.v. injection as described in 2.2.2 and further analyzed by
direct fluorescence microscopy using a Zeiss Axiovert 25 microscope and/or Western
blot. Systemic inhibition of NMD was performed by subcutaneous (s.c.) injection of
cycloheximide (120 mg/kg in a 60% DMSO-NaCl-solution) in the neck fold. The s.c.
injection was repeated once per hour four times. The hearts were excised 30 min after
the last injection as described in 2.2.2. Total RNA was isolated as described in 2.2.3.1.
All applications were performed by using hypodermic needles and insulin syringes.
As controls, mice were injected with a 60% or 38% DMSO-NaCl-solution.
2.2.7 Transfection
Transfection of the final construct pBlue-α-MHC-prom-Myc-M7t-cMyBP-C (Fig. 2.3)
into isolated neonatal rat cardiomyocytes (NRCM), which were kindly prepared by
Hiroshi Naito, was performed according to the instruction manual of Lipofectamine™
2000. Immunofluorescence analysis (2.2.8) was made 48 h after transfection.
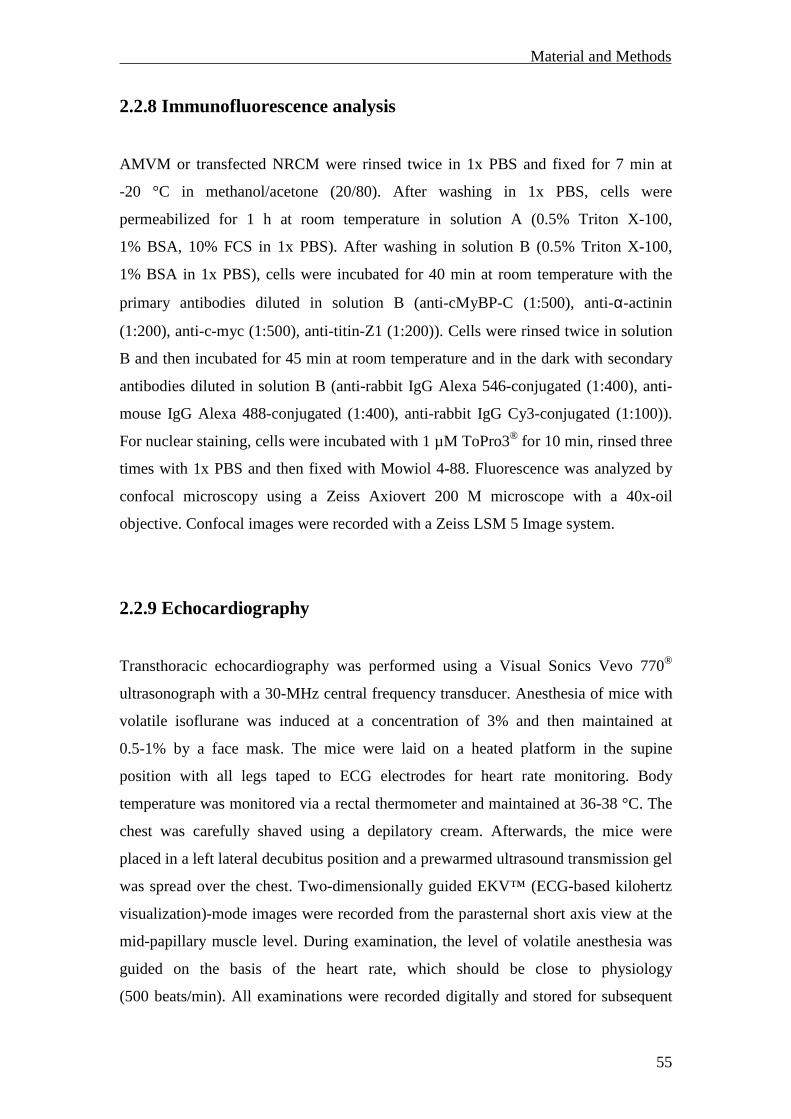
Material and Methods
55
2.2.8 Immunofluorescence analysis
AMVM or transfected NRCM were rinsed twice in 1x PBS and fixed for 7 min at
-20 °C in methanol/acetone (20/80). After washing in 1x PBS, cells were
permeabilized for 1 h at room temperature in solution A (0.5% Triton X-100,
1% BSA, 10% FCS in 1x PBS). After washing in solution B (0.5% Triton X-100,
1% BSA in 1x PBS), cells were incubated for 40 min at room temperature with the
primary antibodies diluted in solution B (anti-cMyBP-C (1:500), anti-α-actinin
(1:200), anti-c-myc (1:500), anti-titin-Z1 (1:200)). Cells were rinsed twice in solution
B and then incubated for 45 min at room temperature and in the dark with secondary
antibodies diluted in solution B (anti-rabbit IgG Alexa 546-conjugated (1:400), anti-
mouse IgG Alexa 488-conjugated (1:400), anti-rabbit IgG Cy3-conjugated (1:100)).
For nuclear staining, cells were incubated with 1 µM ToPro3® for 10 min, rinsed three
times with 1x PBS and then fixed with Mowiol 4-88. Fluorescence was analyzed by
confocal microscopy using a Zeiss Axiovert 200 M microscope with a 40x-oil
objective. Confocal images were recorded with a Zeiss LSM 5 Image system.
2.2.9 Echocardiography
Transthoracic echocardiography was performed using a Visual Sonics Vevo 770®
ultrasonograph with a 30-MHz central frequency transducer. Anesthesia of mice with
volatile isoflurane was induced at a concentration of 3% and then maintained at
0.5-1% by a face mask. The mice were laid on a heated platform in the supine
position with all legs taped to ECG electrodes for heart rate monitoring. Body
temperature was monitored via a rectal thermometer and maintained at 36-38 °C. The
chest was carefully shaved using a depilatory cream. Afterwards, the mice were
placed in a left lateral decubitus position and a prewarmed ultrasound transmission gel
was spread over the chest. Two-dimensionally guided EKV™ (ECG-based kilohertz
visualization)-mode images were recorded from the parasternal short axis view at the
mid-papillary muscle level. During examination, the level of volatile anesthesia was
guided on the basis of the heart rate, which should be close to physiology
(500 beats/min). All examinations were recorded digitally and stored for subsequent
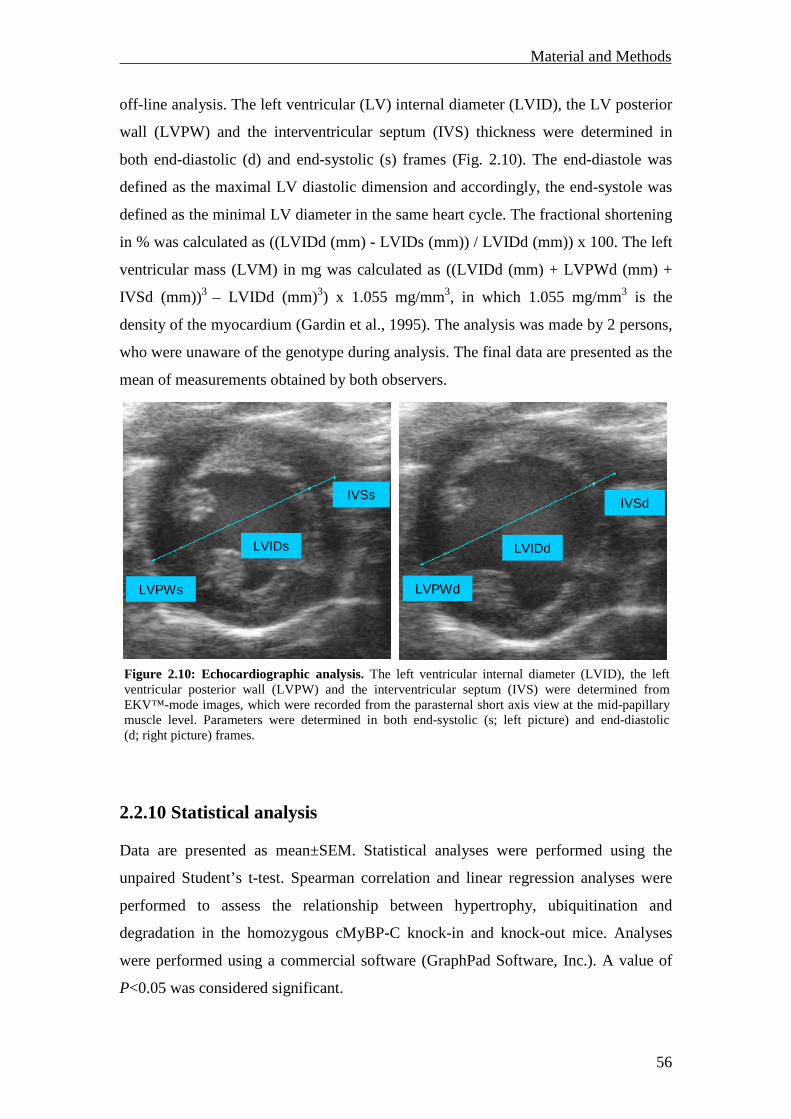
Material and Methods
56
off-line analysis. The left ventricular (LV) internal diameter (LVID), the LV posterior
wall (LVPW) and the interventricular septum (IVS) thickness were determined in
both end-diastolic (d) and end-systolic (s) frames (Fig. 2.10). The end-diastole was
defined as the maximal LV diastolic dimension and accordingly, the end-systole was
defined as the minimal LV diameter in the same heart cycle. The fractional shortening
in % was calculated as ((LVIDd (mm) - LVIDs (mm)) / LVIDd (mm)) x 100. The left
ventricular mass (LVM) in mg was calculated as ((LVIDd (mm) + LVPWd (mm) +
IVSd (mm))3 – LVIDd (mm)3) x 1.055 mg/mm3, in which 1.055 mg/mm3 is the
density of the myocardium (Gardin et al., 1995). The analysis was made by 2 persons,
who were unaware of the genotype during analysis. The final data are presented as the
mean of measurements obtained by both observers.
2.2.10 Statistical analysis Data are presented as mean±SEM. Statistical analyses were performed using the
unpaired Student’s t-test. Spearman correlation and linear regression analyses were
performed to assess the relationship between hypertrophy, ubiquitination and
degradation in the homozygous cMyBP-C knock-in and knock-out mice. Analyses
were performed using a commercial software (GraphPad Software, Inc.). A value of
P<0.05 was considered significant.
IVSs
LVIDs
LVPWs
IVSd
LVIDd
LVPWd
IVSs
LVIDs
LVPWs
IVSd
LVIDd
LVPWd
Figure 2.10: Echocardiographic analysis. The left ventricular internal diameter (LVID), the left ventricular posterior wall (LVPW) and the interventricular septum (IVS) were determined from EKV™-mode images, which were recorded from the parasternal short axis view at the mid-papillary muscle level. Parameters were determined in both end-systolic (s; left picture) and end-diastolic (d; right picture) frames.
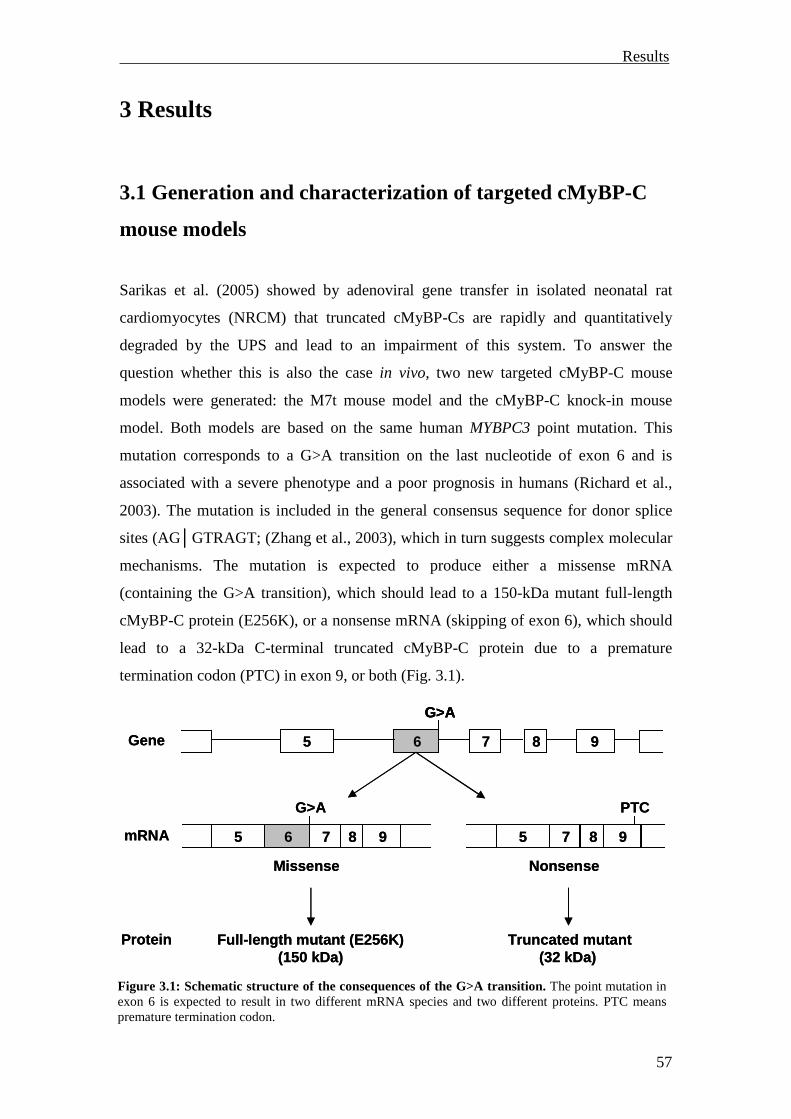
Results
57
3 Results
3.1 Generation and characterization of targeted cMyBP-C
mouse models
Sarikas et al. (2005) showed by adenoviral gene transfer in isolated neonatal rat
cardiomyocytes (NRCM) that truncated cMyBP-Cs are rapidly and quantitatively
degraded by the UPS and lead to an impairment of this system. To answer the
question whether this is also the case in vivo, two new targeted cMyBP-C mouse
models were generated: the M7t mouse model and the cMyBP-C knock-in mouse
model. Both models are based on the same human MYBPC3 point mutation. This
mutation corresponds to a G>A transition on the last nucleotide of exon 6 and is
associated with a severe phenotype and a poor prognosis in humans (Richard et al.,
2003). The mutation is included in the general consensus sequence for donor splice
sites (AG│GTRAGT; (Zhang et al., 2003), which in turn suggests complex molecular
mechanisms. The mutation is expected to produce either a missense mRNA
(containing the G>A transition), which should lead to a 150-kDa mutant full-length
cMyBP-C protein (E256K), or a nonsense mRNA (skipping of exon 6), which should
lead to a 32-kDa C-terminal truncated cMyBP-C protein due to a premature
termination codon (PTC) in exon 9, or both (Fig. 3.1).
Figure 3.1: Schematic structure of the consequences of the G>A transition. The point mutation in exon 6 is expected to result in two different mRNA species and two different proteins. PTC means premature termination codon.
Truncated mutant(32 kDa)
Full-length mutant (E256K)(150 kDa)
Gene
Protein
5 6 7 8 9
G>A
Missense Nonsense
mRNA 5 7 8 9
PTC
5 6 7 8 9
G>A
Truncated mutant(32 kDa)
Full-length mutant (E256K)(150 kDa)
Gene
Protein
5 6 7 8 9
G>AG>A
Missense Nonsense
mRNA 5 7 8 9
PTC
5 6 7 8 9
G>A
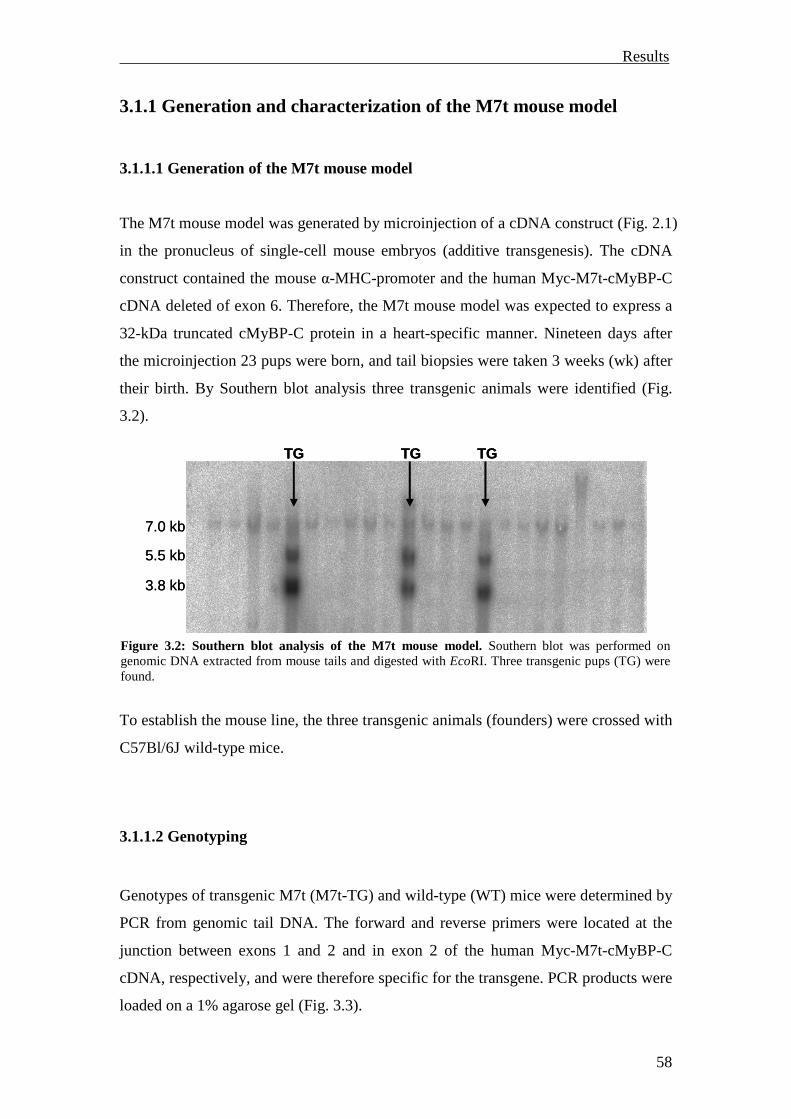
Results
58
3.1.1 Generation and characterization of the M7t mouse model
3.1.1.1 Generation of the M7t mouse model
The M7t mouse model was generated by microinjection of a cDNA construct (Fig. 2.1)
in the pronucleus of single-cell mouse embryos (additive transgenesis). The cDNA
construct contained the mouse α-MHC-promoter and the human Myc-M7t-cMyBP-C
cDNA deleted of exon 6. Therefore, the M7t mouse model was expected to express a
32-kDa truncated cMyBP-C protein in a heart-specific manner. Nineteen days after
the microinjection 23 pups were born, and tail biopsies were taken 3 weeks (wk) after
their birth. By Southern blot analysis three transgenic animals were identified (Fig.
3.2).
To establish the mouse line, the three transgenic animals (founders) were crossed with
C57Bl/6J wild-type mice.
3.1.1.2 Genotyping
Genotypes of transgenic M7t (M7t-TG) and wild-type (WT) mice were determined by
PCR from genomic tail DNA. The forward and reverse primers were located at the
junction between exons 1 and 2 and in exon 2 of the human Myc-M7t-cMyBP-C
cDNA, respectively, and were therefore specific for the transgene. PCR products were
loaded on a 1% agarose gel (Fig. 3.3).
Figure 3.2: Southern blot analysis of the M7t mouse model. Southern blot was performed on genomic DNA extracted from mouse tails and digested with EcoRI. Three transgenic pups (TG) were found.
TG TGTG
3.8 kb
5.5 kb
7.0 kb
TG TGTG
3.8 kb
5.5 kb
7.0 kb
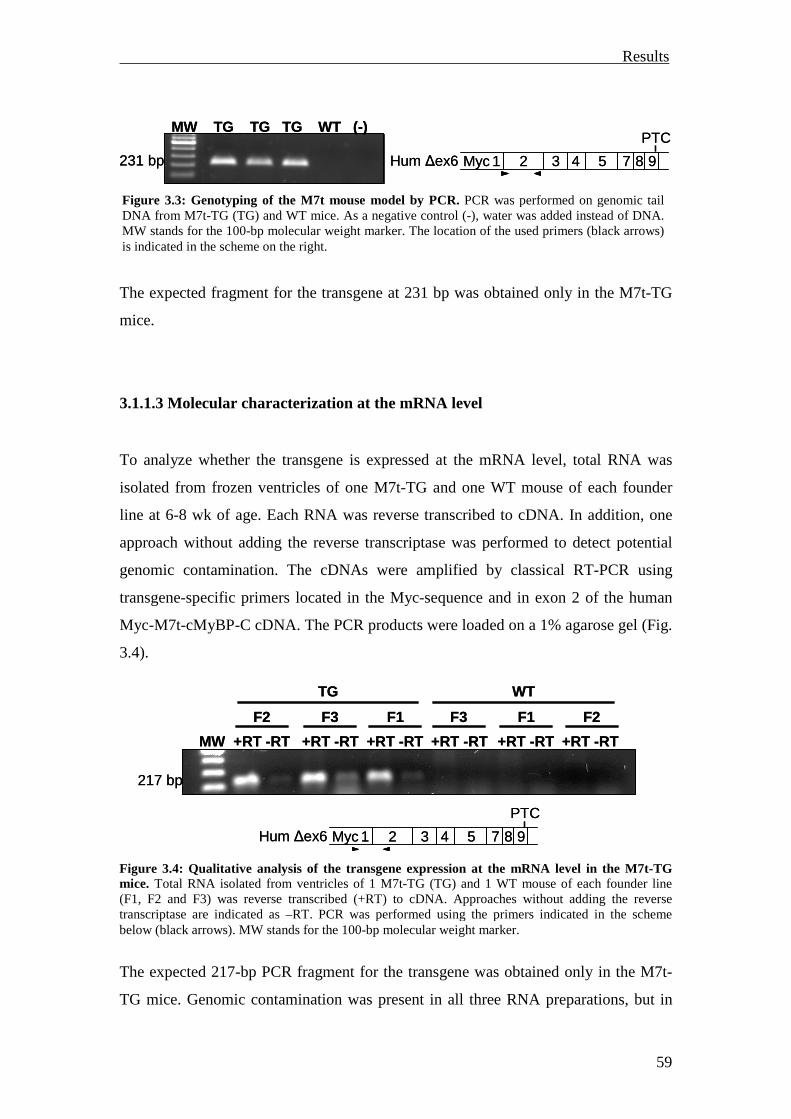
Results
59
The expected fragment for the transgene at 231 bp was obtained only in the M7t-TG
mice.
3.1.1.3 Molecular characterization at the mRNA level
To analyze whether the transgene is expressed at the mRNA level, total RNA was
isolated from frozen ventricles of one M7t-TG and one WT mouse of each founder
line at 6-8 wk of age. Each RNA was reverse transcribed to cDNA. In addition, one
approach without adding the reverse transcriptase was performed to detect potential
genomic contamination. The cDNAs were amplified by classical RT-PCR using
transgene-specific primers located in the Myc-sequence and in exon 2 of the human
Myc-M7t-cMyBP-C cDNA. The PCR products were loaded on a 1% agarose gel (Fig.
3.4).
The expected 217-bp PCR fragment for the transgene was obtained only in the M7t-
TG mice. Genomic contamination was present in all three RNA preparations, but in
Figure 3.3: Genotyping of the M7t mouse model by PCR. PCR was performed on genomic tail DNA from M7t-TG (TG) and WT mice. As a negative control (-), water was added instead of DNA. MW stands for the 100-bp molecular weight marker. The location of the used primers (black arrows) is indicated in the scheme on the right.
Figure 3.4: Qualitative analysis of the transgene expression at the mRNA level in the M7t-TG mice. Total RNA isolated from ventricles of 1 M7t-TG (TG) and 1 WT mouse of each founder line (F1, F2 and F3) was reverse transcribed (+RT) to cDNA. Approaches without adding the reverse transcriptase are indicated as –RT. PCR was performed using the primers indicated in the scheme below (black arrows). MW stands for the 100-bp molecular weight marker.
MW TG TG TG WT (-)
231 bp Hum ∆ex6
PTC
95 7 84321Myc
MW TG TG TG WT (-)
231 bp Hum ∆ex6
PTC
95 7 84321Myc
217 bp
+RT -RT +RT -RT +RT -RT +RT -RT +RT -RT+RT -RTMW
F2 F3 F1 F1F3 F2
TG WT
PTC
Hum ∆ex6 95 7 84321Myc
217 bp
+RT -RT +RT -RT +RT -RT +RT -RT +RT -RT+RT -RTMW
F2 F3 F1 F1F3 F2
TG WT
PTC
Hum ∆ex6 95 7 84321Myc
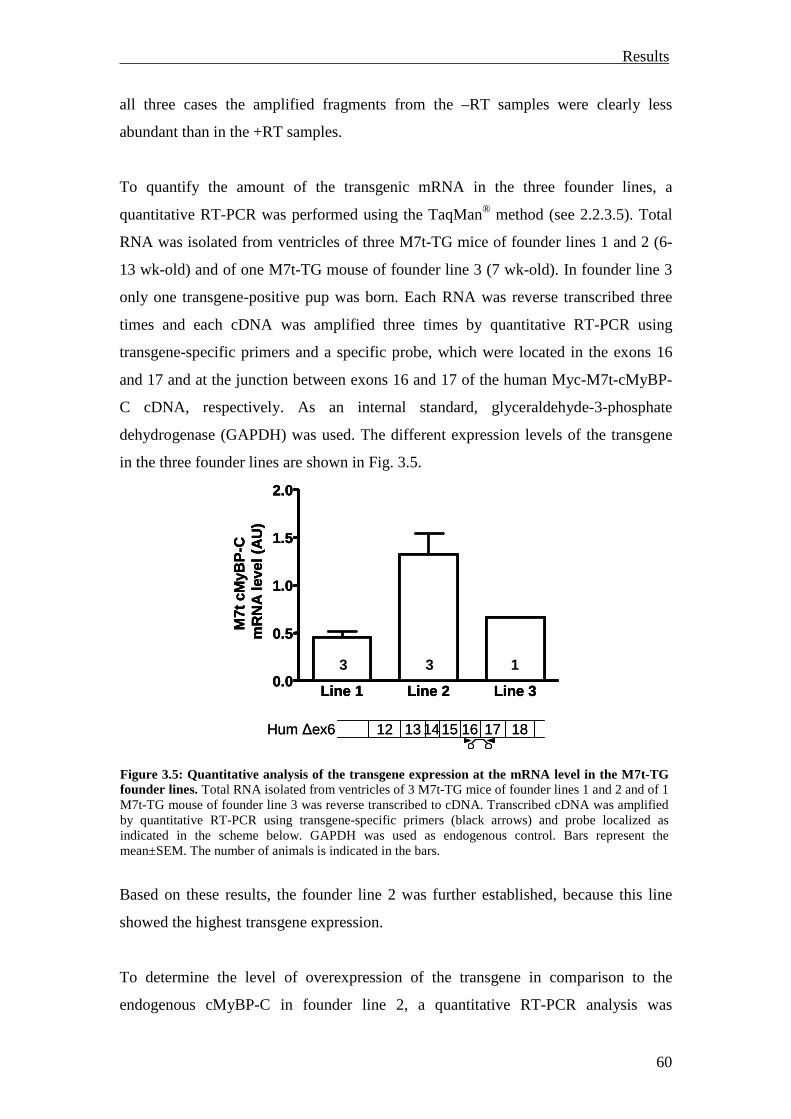
Results
60
all three cases the amplified fragments from the –RT samples were clearly less
abundant than in the +RT samples.
To quantify the amount of the transgenic mRNA in the three founder lines, a
quantitative RT-PCR was performed using the TaqMan® method (see 2.2.3.5). Total
RNA was isolated from ventricles of three M7t-TG mice of founder lines 1 and 2 (6-
13 wk-old) and of one M7t-TG mouse of founder line 3 (7 wk-old). In founder line 3
only one transgene-positive pup was born. Each RNA was reverse transcribed three
times and each cDNA was amplified three times by quantitative RT-PCR using
transgene-specific primers and a specific probe, which were located in the exons 16
and 17 and at the junction between exons 16 and 17 of the human Myc-M7t-cMyBP-
C cDNA, respectively. As an internal standard, glyceraldehyde-3-phosphate
dehydrogenase (GAPDH) was used. The different expression levels of the transgene
in the three founder lines are shown in Fig. 3.5.
Based on these results, the founder line 2 was further established, because this line
showed the highest transgene expression.
To determine the level of overexpression of the transgene in comparison to the
endogenous cMyBP-C in founder line 2, a quantitative RT-PCR analysis was
Figure 3.5: Quantitative analysis of the transgene expression at the mRNA level in the M7t-TG founder lines. Total RNA isolated from ventricles of 3 M7t-TG mice of founder lines 1 and 2 and of 1 M7t-TG mouse of founder line 3 was reverse transcribed to cDNA. Transcribed cDNA was amplified by quantitative RT-PCR using transgene-specific primers (black arrows) and probe localized as indicated in the scheme below. GAPDH was used as endogenous control. Bars represent the mean±SEM. The number of animals is indicated in the bars.
Line 1 Line 2 Line 30.0
0.5
1.0
1.5
2.0
3 3 1
M7t
cM
yBP
-Cm
RN
Ale
vel(
AU
)
Hum ∆ex6 12 13 1415 16 17 18
Line 1 Line 2 Line 30.0
0.5
1.0
1.5
2.0
3 3 1
M7t
cM
yBP
-Cm
RN
Ale
vel(
AU
)
Line 1 Line 2 Line 30.0
0.5
1.0
1.5
2.0
3 3 1
M7t
cM
yBP
-Cm
RN
Ale
vel(
AU
)
Hum ∆ex6 12 13 1415 16 17 18
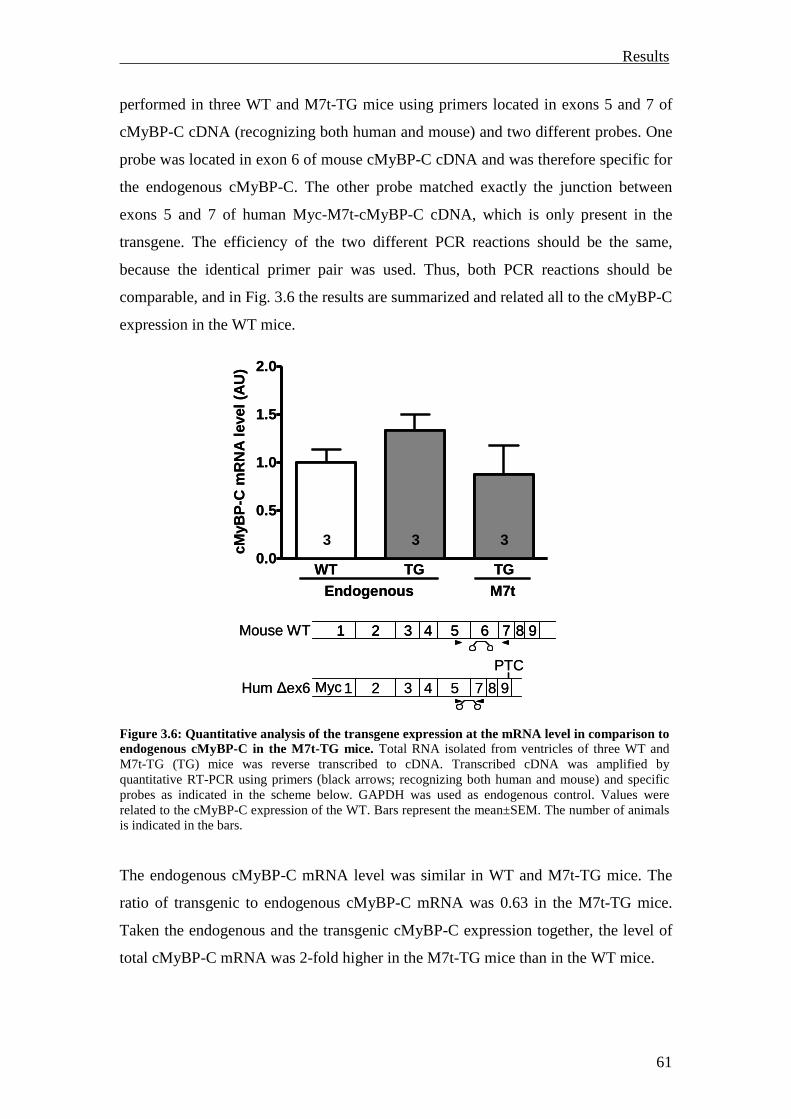
Results
61
performed in three WT and M7t-TG mice using primers located in exons 5 and 7 of
cMyBP-C cDNA (recognizing both human and mouse) and two different probes. One
probe was located in exon 6 of mouse cMyBP-C cDNA and was therefore specific for
the endogenous cMyBP-C. The other probe matched exactly the junction between
exons 5 and 7 of human Myc-M7t-cMyBP-C cDNA, which is only present in the
transgene. The efficiency of the two different PCR reactions should be the same,
because the identical primer pair was used. Thus, both PCR reactions should be
comparable, and in Fig. 3.6 the results are summarized and related all to the cMyBP-C
expression in the WT mice.
The endogenous cMyBP-C mRNA level was similar in WT and M7t-TG mice. The
ratio of transgenic to endogenous cMyBP-C mRNA was 0.63 in the M7t-TG mice.
Taken the endogenous and the transgenic cMyBP-C expression together, the level of
total cMyBP-C mRNA was 2-fold higher in the M7t-TG mice than in the WT mice.
Figure 3.6: Quantitative analysis of the transgene expression at the mRNA level in comparison to endogenous cMyBP-C in the M7t-TG mice. Total RNA isolated from ventricles of three WT and M7t-TG (TG) mice was reverse transcribed to cDNA. Transcribed cDNA was amplified by quantitative RT-PCR using primers (black arrows; recognizing both human and mouse) and specific probes as indicated in the scheme below. GAPDH was used as endogenous control. Values were related to the cMyBP-C expression of the WT. Bars represent the mean±SEM. The number of animals is indicated in the bars.
WT TG TG0.0
0.5
1.0
1.5
2.0
3 3 3
cMyB
P-C
mR
NA
leve
l(A
U)
Endogenous M7t
Mouse WT 95 7 84321 6
Hum ∆ex6 95 7 84321Myc
PTC
WT TG TG0.0
0.5
1.0
1.5
2.0
3 3 3
cMyB
P-C
mR
NA
leve
l(A
U)
Endogenous M7t
Mouse WT 95 7 84321 6 95 7 84321 6
Hum ∆ex6 95 7 84321Myc
PTC
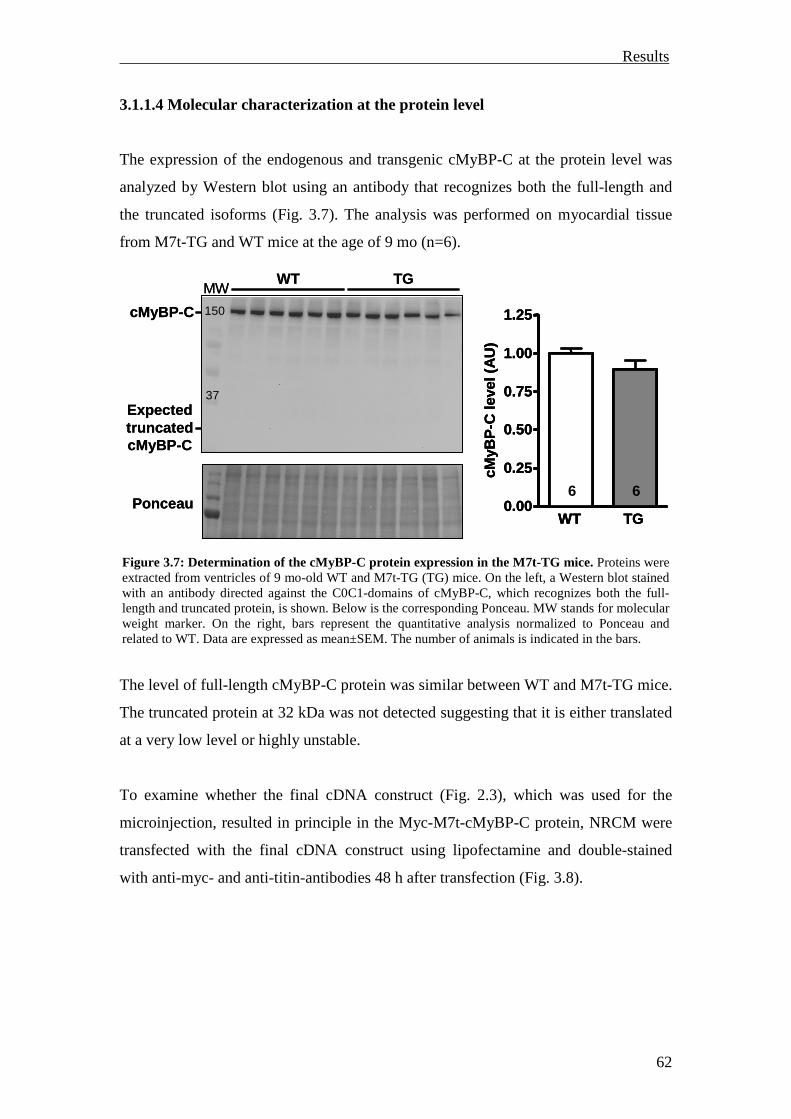
Results
62
3.1.1.4 Molecular characterization at the protein level
The expression of the endogenous and transgenic cMyBP-C at the protein level was
analyzed by Western blot using an antibody that recognizes both the full-length and
the truncated isoforms (Fig. 3.7). The analysis was performed on myocardial tissue
from M7t-TG and WT mice at the age of 9 mo (n=6).
The level of full-length cMyBP-C protein was similar between WT and M7t-TG mice.
The truncated protein at 32 kDa was not detected suggesting that it is either translated
at a very low level or highly unstable.
To examine whether the final cDNA construct (Fig. 2.3), which was used for the
microinjection, resulted in principle in the Myc-M7t-cMyBP-C protein, NRCM were
transfected with the final cDNA construct using lipofectamine and double-stained
with anti-myc- and anti-titin-antibodies 48 h after transfection (Fig. 3.8).
Figure 3.7: Determination of the cMyBP-C protein expression in the M7t-TG mice. Proteins were extracted from ventricles of 9 mo-old WT and M7t-TG (TG) mice. On the left, a Western blot stained with an antibody directed against the C0C1-domains of cMyBP-C, which recognizes both the full-length and truncated protein, is shown. Below is the corresponding Ponceau. MW stands for molecular weight marker. On the right, bars represent the quantitative analysis normalized to Ponceau and related to WT. Data are expressed as mean±SEM. The number of animals is indicated in the bars.
WT TG
cMyBP-C
ExpectedtruncatedcMyBP-C
MW
PonceauWT TG
0.00
0.25
0.50
0.75
1.00
1.25
6 6cM
yBP
-Cle
vel(
AU
)
150
37
WT TG
cMyBP-C
ExpectedtruncatedcMyBP-C
MW
PonceauWT TG
0.00
0.25
0.50
0.75
1.00
1.25
6 6cM
yBP
-Cle
vel(
AU
)
WT TG0.00
0.25
0.50
0.75
1.00
1.25
6 6cM
yBP
-Cle
vel(
AU
)
150
37
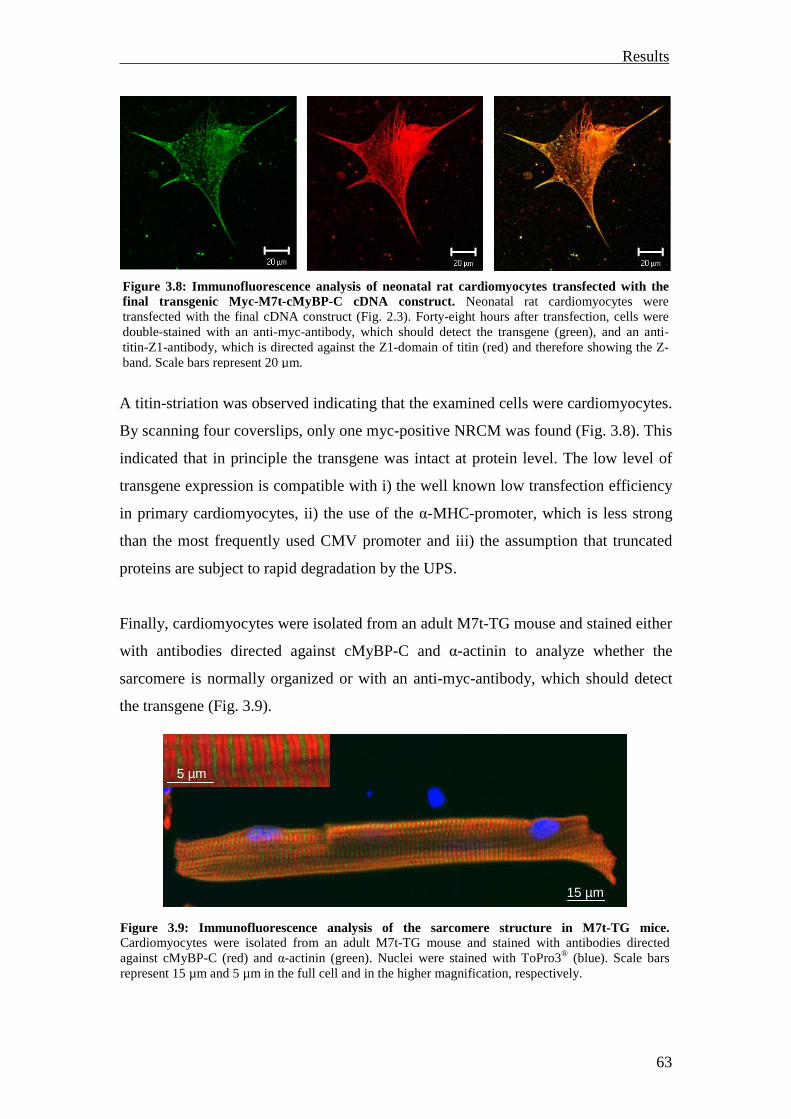
Results
63
A titin-striation was observed indicating that the examined cells were cardiomyocytes.
By scanning four coverslips, only one myc-positive NRCM was found (Fig. 3.8). This
indicated that in principle the transgene was intact at protein level. The low level of
transgene expression is compatible with i) the well known low transfection efficiency
in primary cardiomyocytes, ii) the use of the α-MHC-promoter, which is less strong
than the most frequently used CMV promoter and iii) the assumption that truncated
proteins are subject to rapid degradation by the UPS.
Finally, cardiomyocytes were isolated from an adult M7t-TG mouse and stained either
with antibodies directed against cMyBP-C and α-actinin to analyze whether the
sarcomere is normally organized or with an anti-myc-antibody, which should detect
the transgene (Fig. 3.9).
Figure 3.8: Immunofluorescence analysis of neonatal rat cardiomyocytes transfected with the final transgenic Myc-M7t-cMyBP-C cDNA construct. Neonatal rat cardiomyocytes were transfected with the final cDNA construct (Fig. 2.3). Forty-eight hours after transfection, cells were double-stained with an anti-myc-antibody, which should detect the transgene (green), and an anti-titin-Z1-antibody, which is directed against the Z1-domain of titin (red) and therefore showing the Z-band. Scale bars represent 20 µm.
Figure 3.9: Immunofluorescence analysis of the sarcomere structure in M7t-TG mice. Cardiomyocytes were isolated from an adult M7t-TG mouse and stained with antibodies directed against cMyBP-C (red) and α-actinin (green). Nuclei were stained with ToPro3® (blue). Scale bars represent 15 µm and 5 µm in the full cell and in the higher magnification, respectively.
5 µm
15 µm
5 µm5 µm
15 µm
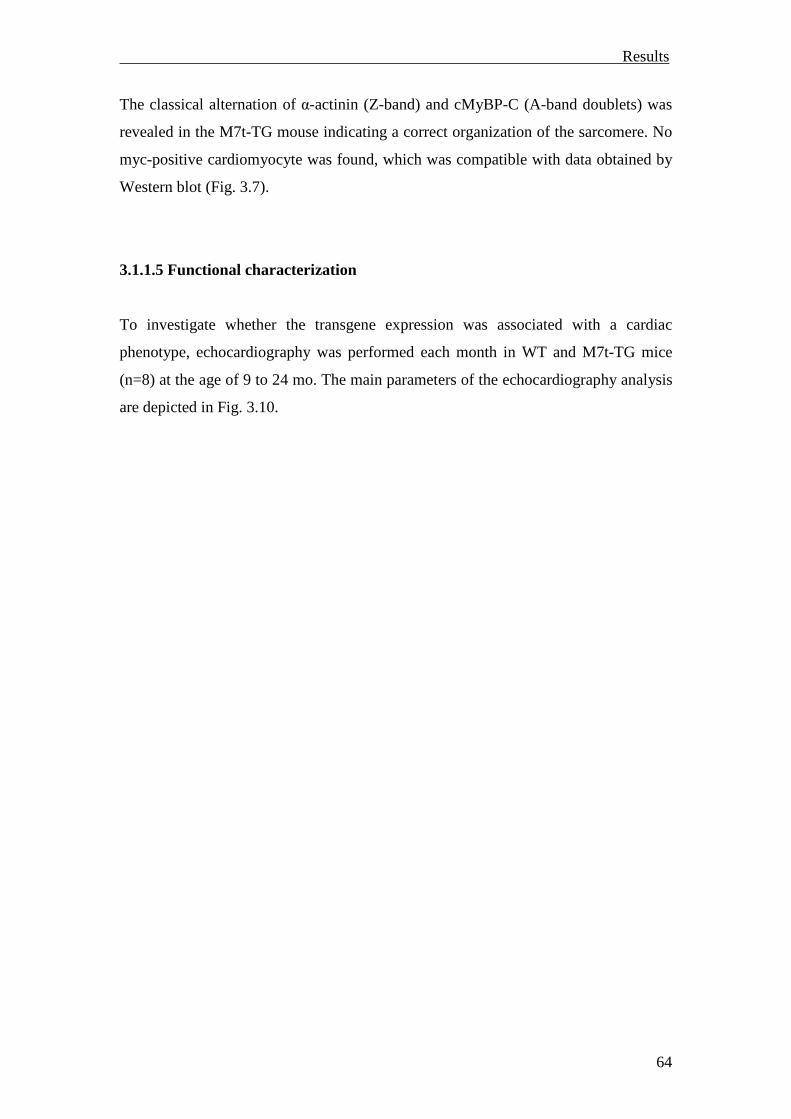
Results
64
The classical alternation of α-actinin (Z-band) and cMyBP-C (A-band doublets) was
revealed in the M7t-TG mouse indicating a correct organization of the sarcomere. No
myc-positive cardiomyocyte was found, which was compatible with data obtained by
Western blot (Fig. 3.7).
3.1.1.5 Functional characterization
To investigate whether the transgene expression was associated with a cardiac
phenotype, echocardiography was performed each month in WT and M7t-TG mice
(n=8) at the age of 9 to 24 mo. The main parameters of the echocardiography analysis
are depicted in Fig. 3.10.
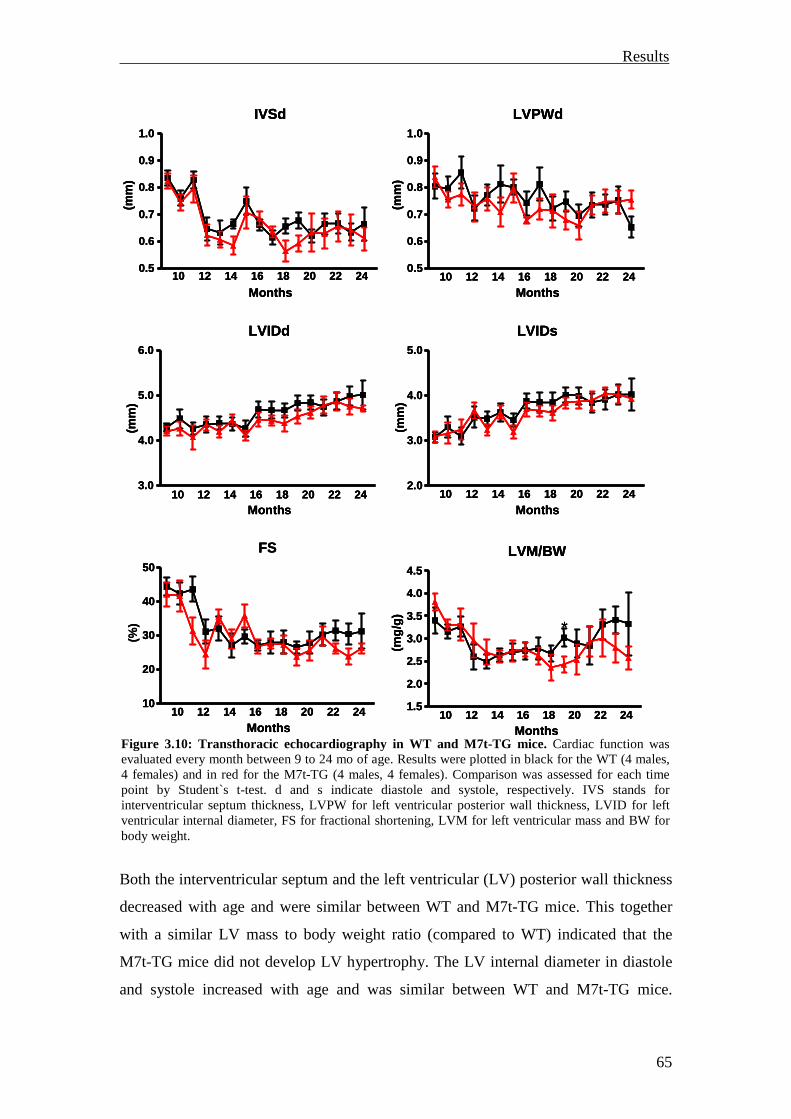
Results
65
Both the interventricular septum and the left ventricular (LV) posterior wall thickness
decreased with age and were similar between WT and M7t-TG mice. This together
with a similar LV mass to body weight ratio (compared to WT) indicated that the
M7t-TG mice did not develop LV hypertrophy. The LV internal diameter in diastole
and systole increased with age and was similar between WT and M7t-TG mice.
IVSd
10 12 14 16 18 20 22 240.5
0.6
0.7
0.8
0.9
1.0
Months
(mm
)LVPWd
10 12 14 16 18 20 22 240.5
0.6
0.7
0.8
0.9
1.0
Months
(mm
)
LVIDs
10 12 14 16 18 20 22 242.0
3.0
4.0
5.0
Months
(mm
)
LVIDd
10 12 14 16 18 20 22 243.0
4.0
5.0
6.0
Months
(mm
)
LVM/BW
10 12 14 16 18 20 22 241.5
2.0
2.5
3.0
3.5
4.0
4.5
*
Months
(mg/
g)
FS
10 12 14 16 18 20 22 2410
20
30
40
50
Months
(%)
IVSd
10 12 14 16 18 20 22 240.5
0.6
0.7
0.8
0.9
1.0
Months
(mm
)LVPWd
10 12 14 16 18 20 22 240.5
0.6
0.7
0.8
0.9
1.0
Months
(mm
)
LVIDs
10 12 14 16 18 20 22 242.0
3.0
4.0
5.0
Months
(mm
)
LVIDd
10 12 14 16 18 20 22 243.0
4.0
5.0
6.0
Months
(mm
)
LVM/BW
10 12 14 16 18 20 22 241.5
2.0
2.5
3.0
3.5
4.0
4.5
*
Months
(mg/
g)
FS
10 12 14 16 18 20 22 2410
20
30
40
50
Months
(%)
Figure 3.10: Transthoracic echocardiography in WT and M7t-TG mice. Cardiac function was evaluated every month between 9 to 24 mo of age. Results were plotted in black for the WT (4 males, 4 females) and in red for the M7t-TG (4 males, 4 females). Comparison was assessed for each time point by Student`s t-test. d and s indicate diastole and systole, respectively. IVS stands for interventricular septum thickness, LVPW for left ventricular posterior wall thickness, LVID for left ventricular internal diameter, FS for fractional shortening, LVM for left ventricular mass and BW for body weight.
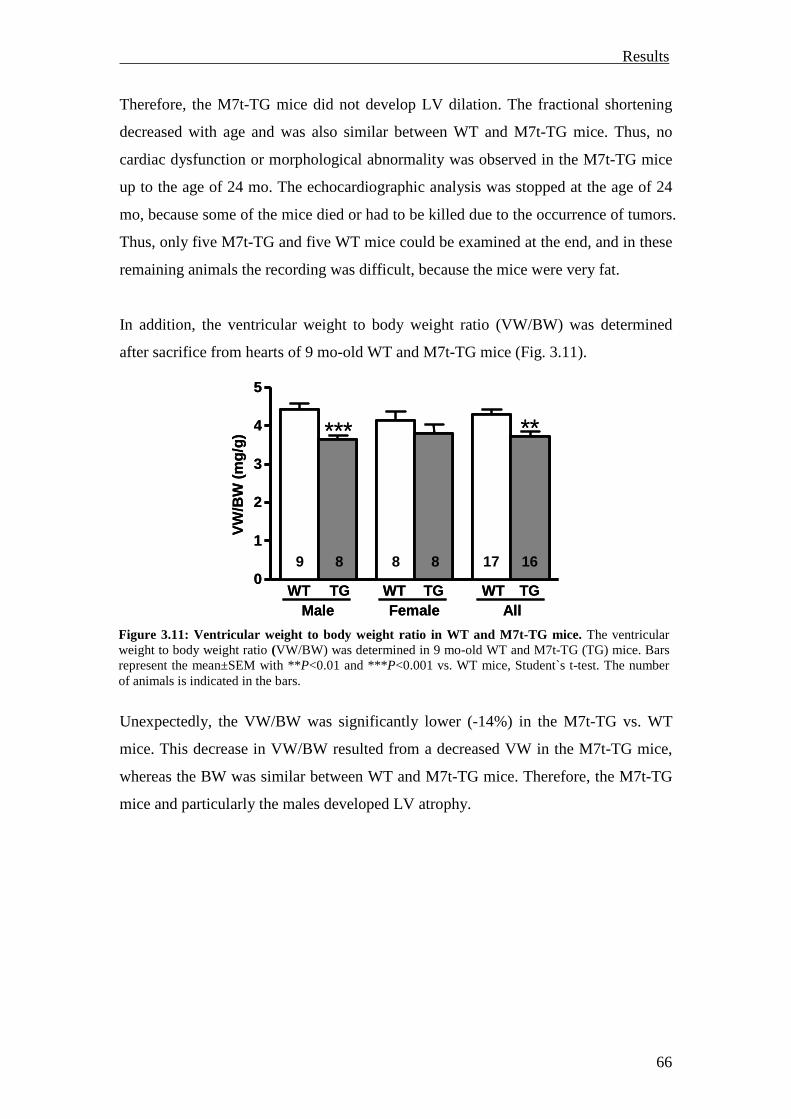
Results
66
Therefore, the M7t-TG mice did not develop LV dilation. The fractional shortening
decreased with age and was also similar between WT and M7t-TG mice. Thus, no
cardiac dysfunction or morphological abnormality was observed in the M7t-TG mice
up to the age of 24 mo. The echocardiographic analysis was stopped at the age of 24
mo, because some of the mice died or had to be killed due to the occurrence of tumors.
Thus, only five M7t-TG and five WT mice could be examined at the end, and in these
remaining animals the recording was difficult, because the mice were very fat.
In addition, the ventricular weight to body weight ratio (VW/BW) was determined
after sacrifice from hearts of 9 mo-old WT and M7t-TG mice (Fig. 3.11).
Unexpectedly, the VW/BW was significantly lower (-14%) in the M7t-TG vs. WT
mice. This decrease in VW/BW resulted from a decreased VW in the M7t-TG mice,
whereas the BW was similar between WT and M7t-TG mice. Therefore, the M7t-TG
mice and particularly the males developed LV atrophy.
Figure 3.11: Ventricular weight to body weight ratio in WT and M7t-TG mice. The ventricular weight to body weight ratio (VW/BW) was determined in 9 mo-old WT and M7t-TG (TG) mice. Bars represent the mean±SEM with **P<0.01 and ***P<0.001 vs. WT mice, Student`s t-test. The number of animals is indicated in the bars.
0
1
2
3
4
5
9 8 8 8 17 16
*** **
VW
/BW
(m
g/g)
WT WT WTTG TG TGMale Female All
0
1
2
3
4
5
9 8 8 8 17 16
*** **
VW
/BW
(m
g/g)
WT WT WTTG TG TGMale Female All
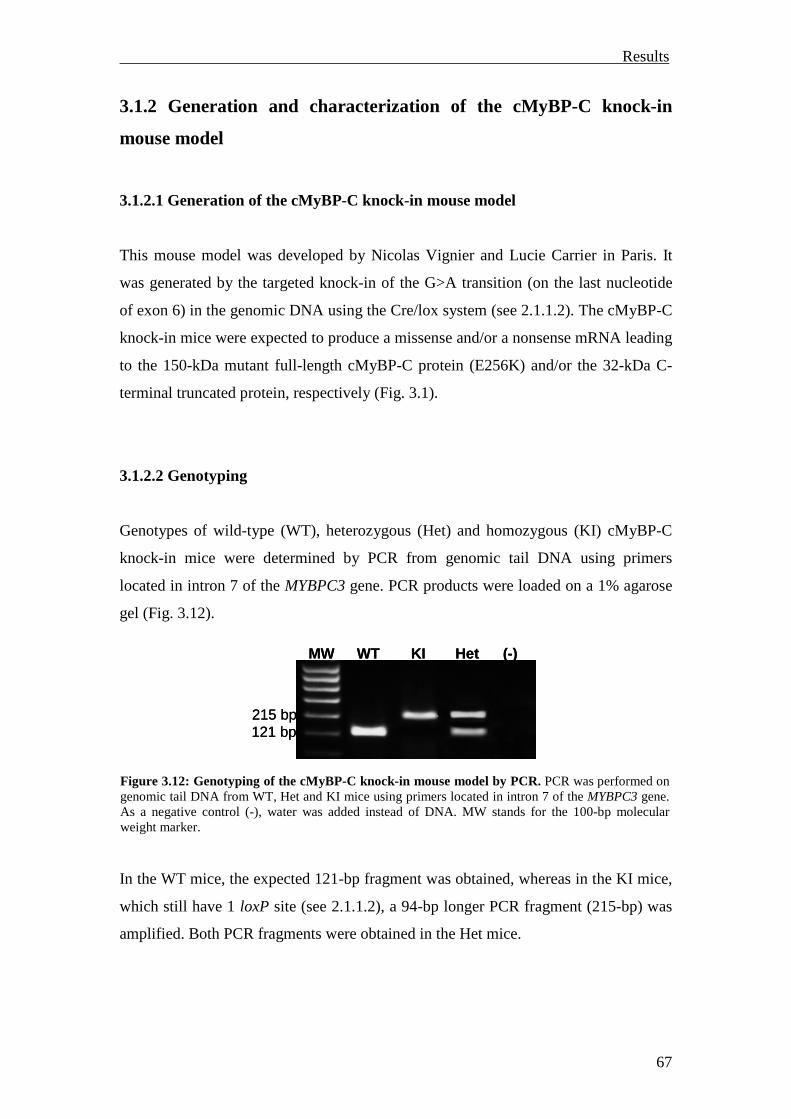
Results
67
3.1.2 Generation and characterization of the cMyBP-C knock-in
mouse model
3.1.2.1 Generation of the cMyBP-C knock-in mouse model
This mouse model was developed by Nicolas Vignier and Lucie Carrier in Paris. It
was generated by the targeted knock-in of the G>A transition (on the last nucleotide
of exon 6) in the genomic DNA using the Cre/lox system (see 2.1.1.2). The cMyBP-C
knock-in mice were expected to produce a missense and/or a nonsense mRNA leading
to the 150-kDa mutant full-length cMyBP-C protein (E256K) and/or the 32-kDa C-
terminal truncated protein, respectively (Fig. 3.1).
3.1.2.2 Genotyping
Genotypes of wild-type (WT), heterozygous (Het) and homozygous (KI) cMyBP-C
knock-in mice were determined by PCR from genomic tail DNA using primers
located in intron 7 of the MYBPC3 gene. PCR products were loaded on a 1% agarose
gel (Fig. 3.12).
In the WT mice, the expected 121-bp fragment was obtained, whereas in the KI mice,
which still have 1 loxP site (see 2.1.1.2), a 94-bp longer PCR fragment (215-bp) was
amplified. Both PCR fragments were obtained in the Het mice.
Figure 3.12: Genotyping of the cMyBP-C knock-in mouse model by PCR. PCR was performed on genomic tail DNA from WT, Het and KI mice using primers located in intron 7 of the MYBPC3 gene. As a negative control (-), water was added instead of DNA. MW stands for the 100-bp molecular weight marker.
MW WT KI Het (-)
215 bp121 bp
MW WT KI Het (-)
215 bp121 bp
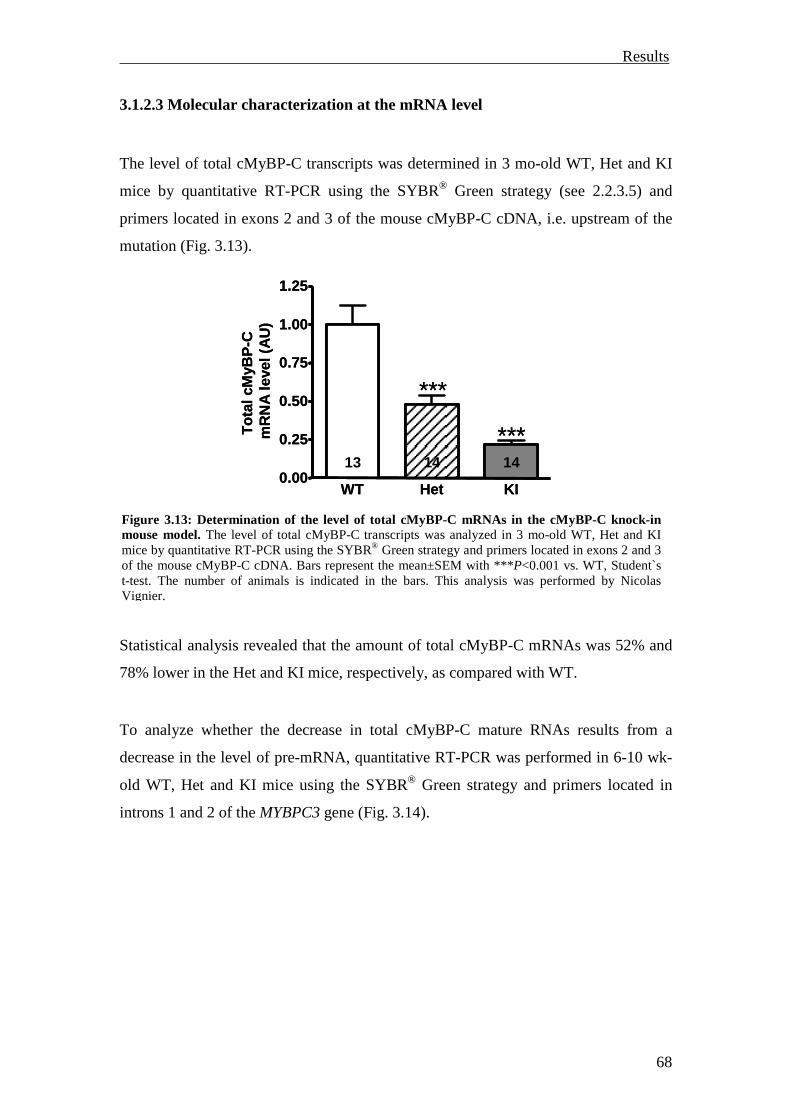
Results
68
3.1.2.3 Molecular characterization at the mRNA level
The level of total cMyBP-C transcripts was determined in 3 mo-old WT, Het and KI
mice by quantitative RT-PCR using the SYBR® Green strategy (see 2.2.3.5) and
primers located in exons 2 and 3 of the mouse cMyBP-C cDNA, i.e. upstream of the
mutation (Fig. 3.13).
Statistical analysis revealed that the amount of total cMyBP-C mRNAs was 52% and
78% lower in the Het and KI mice, respectively, as compared with WT.
To analyze whether the decrease in total cMyBP-C mature RNAs results from a
decrease in the level of pre-mRNA, quantitative RT-PCR was performed in 6-10 wk-
old WT, Het and KI mice using the SYBR® Green strategy and primers located in
introns 1 and 2 of the MYBPC3 gene (Fig. 3.14).
Figure 3.13: Determination of the level of total cMyBP-C mRNAs in the cMyBP-C knock-in mouse model. The level of total cMyBP-C transcripts was analyzed in 3 mo-old WT, Het and KI mice by quantitative RT-PCR using the SYBR® Green strategy and primers located in exons 2 and 3 of the mouse cMyBP-C cDNA. Bars represent the mean±SEM with *** P<0.001 vs. WT, Student`s t-test. The number of animals is indicated in the bars. This analysis was performed by Nicolas Vignier.
WT Het KI0.00
0.25
0.50
0.75
1.00
1.25
13 14 14
***
***Tot
al c
MyB
P-C
mR
NA
leve
l(A
U)
WT Het KI0.00
0.25
0.50
0.75
1.00
1.25
13 14 14
***
***Tot
al c
MyB
P-C
mR
NA
leve
l(A
U)
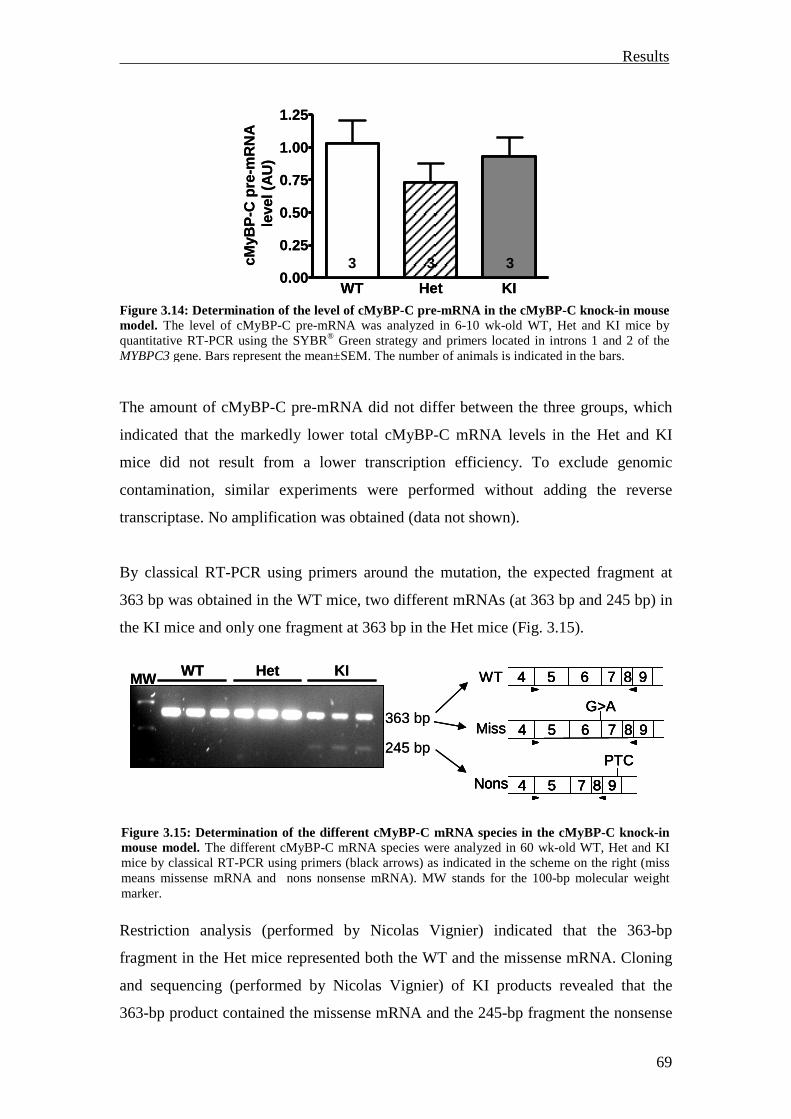
Results
69
The amount of cMyBP-C pre-mRNA did not differ between the three groups, which
indicated that the markedly lower total cMyBP-C mRNA levels in the Het and KI
mice did not result from a lower transcription efficiency. To exclude genomic
contamination, similar experiments were performed without adding the reverse
transcriptase. No amplification was obtained (data not shown).
By classical RT-PCR using primers around the mutation, the expected fragment at
363 bp was obtained in the WT mice, two different mRNAs (at 363 bp and 245 bp) in
the KI mice and only one fragment at 363 bp in the Het mice (Fig. 3.15).
Restriction analysis (performed by Nicolas Vignier) indicated that the 363-bp
fragment in the Het mice represented both the WT and the missense mRNA. Cloning
and sequencing (performed by Nicolas Vignier) of KI products revealed that the
363-bp product contained the missense mRNA and the 245-bp fragment the nonsense
Figure 3.14: Determination of the level of cMyBP-C pre-mRNA in the cMyBP-C knock-in mouse model. The level of cMyBP-C pre-mRNA was analyzed in 6-10 wk-old WT, Het and KI mice by quantitative RT-PCR using the SYBR® Green strategy and primers located in introns 1 and 2 of the MYBPC3 gene. Bars represent the mean±SEM. The number of animals is indicated in the bars.
Figure 3.15: Determination of the different cMyBP-C mRNA species in the cMyBP-C knock-in mouse model. The different cMyBP-C mRNA species were analyzed in 60 wk-old WT, Het and KI mice by classical RT-PCR using primers (black arrows) as indicated in the scheme on the right (miss means missense mRNA and nons nonsense mRNA). MW stands for the 100-bp molecular weight marker.
WT Het KI0.00
0.25
0.50
0.75
1.00
1.25
3 3 3cMyB
P-C
pre-
mR
NA
leve
l(A
U)
WT Het KI0.00
0.25
0.50
0.75
1.00
1.25
3 3 3cMyB
P-C
pre-
mR
NA
leve
l(A
U)
WT KIHetMW
363 bp
245 bp
WT 95 7 864
Miss
PTC
95 7 84Nons
95 7 864
G>A
WT KIHetMW
363 bp
245 bp
WT 95 7 864
Miss
PTC
95 7 84Nons
95 7 864
G>A
WT 95 7 864 95 7 864
Miss
PTC
95 7 84Nons
PTC
95 7 84 95 7 84Nons
95 7 864
G>A
95 7 864
G>A
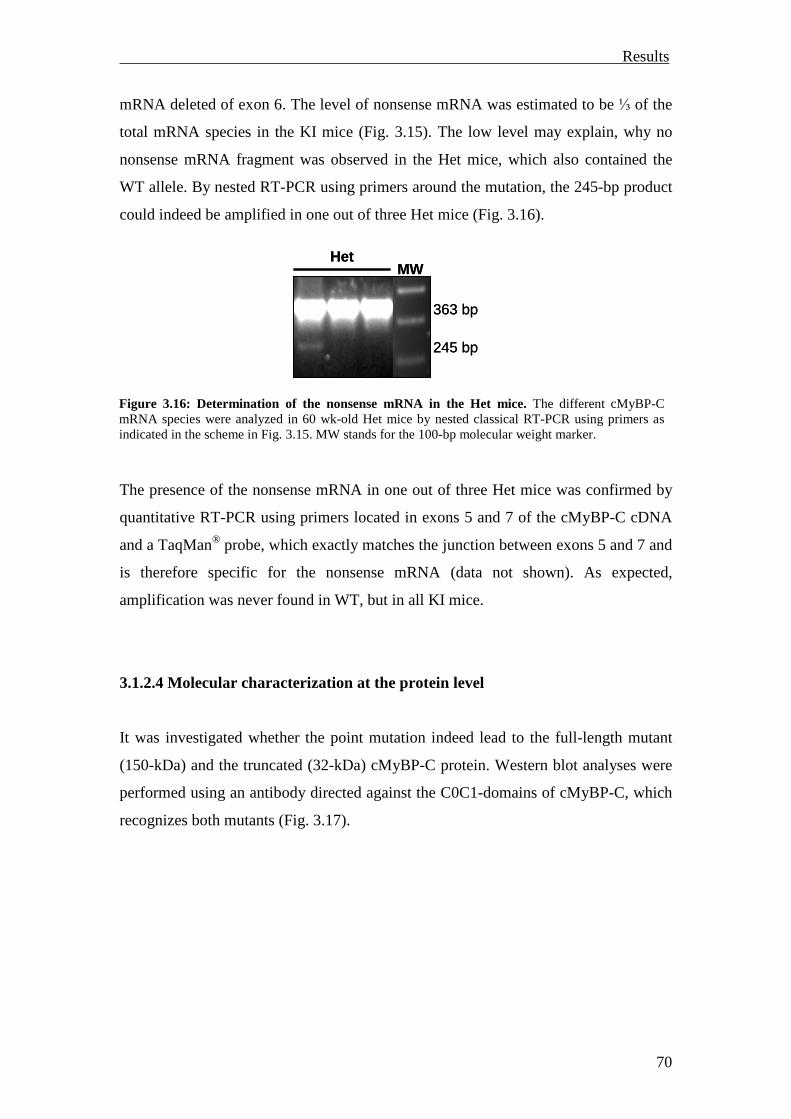
Results
70
mRNA deleted of exon 6. The level of nonsense mRNA was estimated to be ⅓ of the
total mRNA species in the KI mice (Fig. 3.15). The low level may explain, why no
nonsense mRNA fragment was observed in the Het mice, which also contained the
WT allele. By nested RT-PCR using primers around the mutation, the 245-bp product
could indeed be amplified in one out of three Het mice (Fig. 3.16).
The presence of the nonsense mRNA in one out of three Het mice was confirmed by
quantitative RT-PCR using primers located in exons 5 and 7 of the cMyBP-C cDNA
and a TaqMan® probe, which exactly matches the junction between exons 5 and 7 and
is therefore specific for the nonsense mRNA (data not shown). As expected,
amplification was never found in WT, but in all KI mice.
3.1.2.4 Molecular characterization at the protein level
It was investigated whether the point mutation indeed lead to the full-length mutant
(150-kDa) and the truncated (32-kDa) cMyBP-C protein. Western blot analyses were
performed using an antibody directed against the C0C1-domains of cMyBP-C, which
recognizes both mutants (Fig. 3.17).
Figure 3.16: Determination of the nonsense mRNA in the Het mice. The different cMyBP-C mRNA species were analyzed in 60 wk-old Het mice by nested classical RT-PCR using primers as indicated in the scheme in Fig. 3.15. MW stands for the 100-bp molecular weight marker.
HetMW
363 bp
245 bp
HetMW
363 bp
245 bp
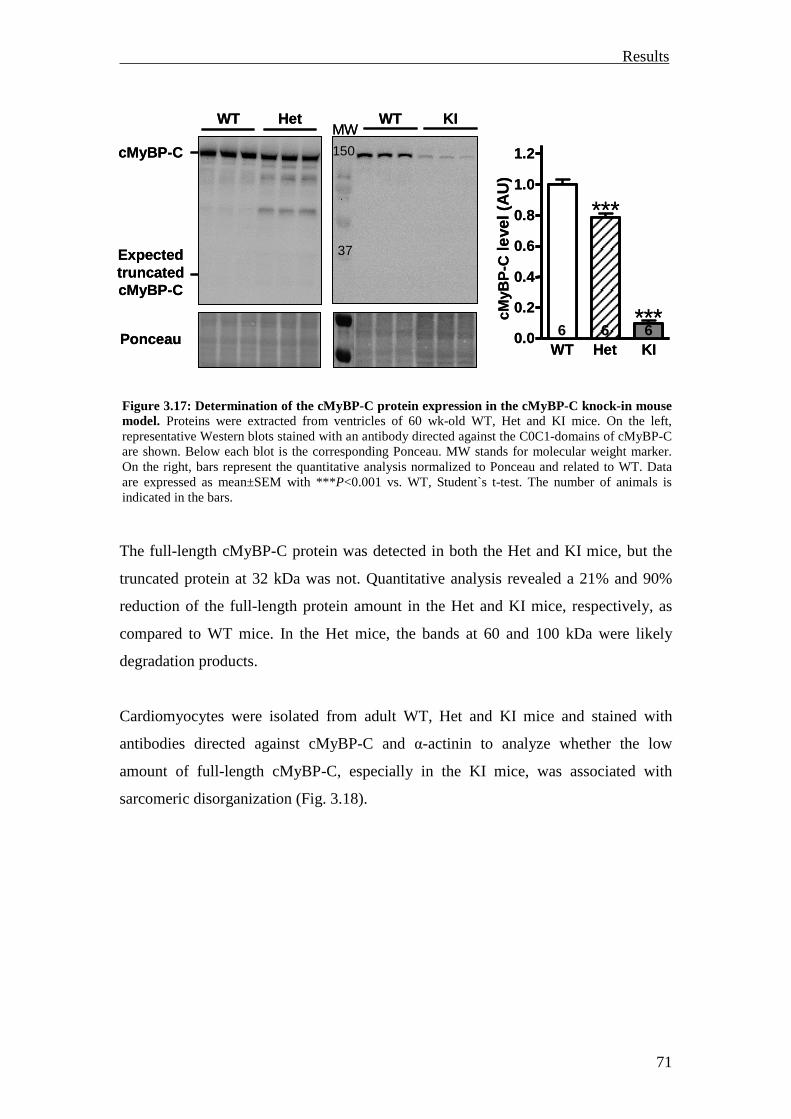
Results
71
The full-length cMyBP-C protein was detected in both the Het and KI mice, but the
truncated protein at 32 kDa was not. Quantitative analysis revealed a 21% and 90%
reduction of the full-length protein amount in the Het and KI mice, respectively, as
compared to WT mice. In the Het mice, the bands at 60 and 100 kDa were likely
degradation products.
Cardiomyocytes were isolated from adult WT, Het and KI mice and stained with
antibodies directed against cMyBP-C and α-actinin to analyze whether the low
amount of full-length cMyBP-C, especially in the KI mice, was associated with
sarcomeric disorganization (Fig. 3.18).
Figure 3.17: Determination of the cMyBP-C protein expression in the cMyBP-C knock-in mouse model. Proteins were extracted from ventricles of 60 wk-old WT, Het and KI mice. On the left, representative Western blots stained with an antibody directed against the C0C1-domains of cMyBP-C are shown. Below each blot is the corresponding Ponceau. MW stands for molecular weight marker. On the right, bars represent the quantitative analysis normalized to Ponceau and related to WT. Data are expressed as mean±SEM with ***P<0.001 vs. WT, Student`s t-test. The number of animals is indicated in the bars.
Ponceau
WT KI
150
MWWT Het
WT Het KI0.0
0.2
0.4
0.6
0.8
1.0
1.2
6 6 6
***
***cMyB
P-C
leve
l(A
U)
37ExpectedtruncatedcMyBP-C
cMyBP-C
Ponceau
WT KI
150
MWWT Het
WT Het KI0.0
0.2
0.4
0.6
0.8
1.0
1.2
6 6 6
***
***cMyB
P-C
leve
l(A
U)
37ExpectedtruncatedcMyBP-C
cMyBP-C
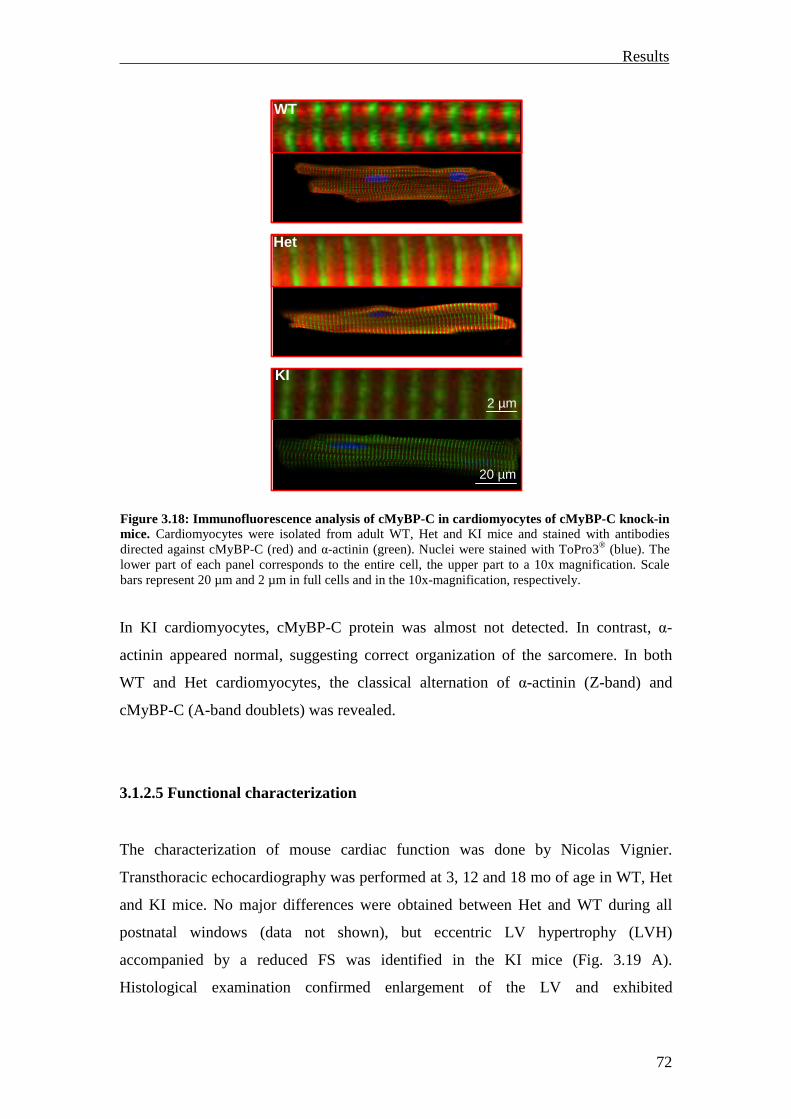
Results
72
In KI cardiomyocytes, cMyBP-C protein was almost not detected. In contrast, α-
actinin appeared normal, suggesting correct organization of the sarcomere. In both
WT and Het cardiomyocytes, the classical alternation of α-actinin (Z-band) and
cMyBP-C (A-band doublets) was revealed.
3.1.2.5 Functional characterization
The characterization of mouse cardiac function was done by Nicolas Vignier.
Transthoracic echocardiography was performed at 3, 12 and 18 mo of age in WT, Het
and KI mice. No major differences were obtained between Het and WT during all
postnatal windows (data not shown), but eccentric LV hypertrophy (LVH)
accompanied by a reduced FS was identified in the KI mice (Fig. 3.19 A).
Histological examination confirmed enlargement of the LV and exhibited
Figure 3.18: Immunofluorescence analysis of cMyBP-C in cardiomyocytes of cMyBP-C knock-in mice. Cardiomyocytes were isolated from adult WT, Het and KI mice and stained with antibodies directed against cMyBP-C (red) and α-actinin (green). Nuclei were stained with ToPro3® (blue). The lower part of each panel corresponds to the entire cell, the upper part to a 10x magnification. Scale bars represent 20 µm and 2 µm in full cells and in the 10x-magnification, respectively.
Het
KI
WT
20 µm
2 µm
Het
KI
WT
20 µm
2 µm
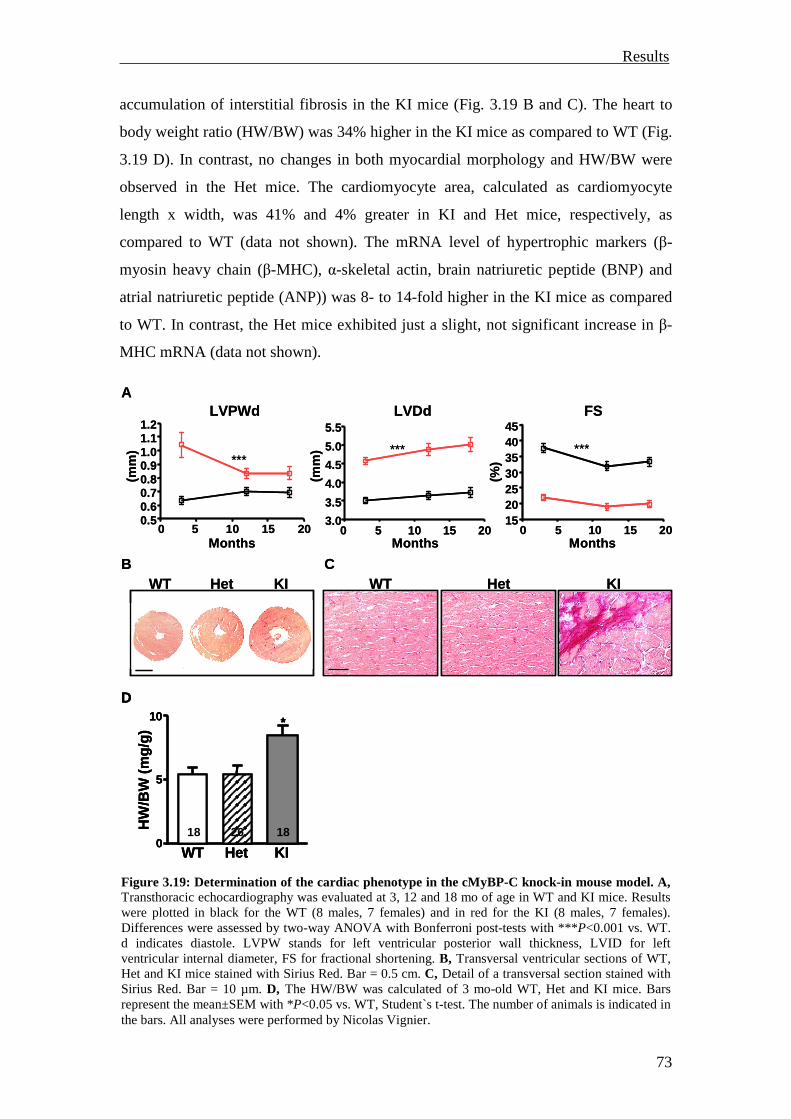
Results
73
accumulation of interstitial fibrosis in the KI mice (Fig. 3.19 B and C). The heart to
body weight ratio (HW/BW) was 34% higher in the KI mice as compared to WT (Fig.
3.19 D). In contrast, no changes in both myocardial morphology and HW/BW were
observed in the Het mice. The cardiomyocyte area, calculated as cardiomyocyte
length x width, was 41% and 4% greater in KI and Het mice, respectively, as
compared to WT (data not shown). The mRNA level of hypertrophic markers (β-
myosin heavy chain (β-MHC), α-skeletal actin, brain natriuretic peptide (BNP) and
atrial natriuretic peptide (ANP)) was 8- to 14-fold higher in the KI mice as compared
to WT. In contrast, the Het mice exhibited just a slight, not significant increase in β-
MHC mRNA (data not shown).
Figure 3.19: Determination of the cardiac phenotype in the cMyBP-C knock-in mouse model. A, Transthoracic echocardiography was evaluated at 3, 12 and 18 mo of age in WT and KI mice. Results were plotted in black for the WT (8 males, 7 females) and in red for the KI (8 males, 7 females). Differences were assessed by two-way ANOVA with Bonferroni post-tests with ***P<0.001 vs. WT. d indicates diastole. LVPW stands for left ventricular posterior wall thickness, LVID for left ventricular internal diameter, FS for fractional shortening. B, Transversal ventricular sections of WT, Het and KI mice stained with Sirius Red. Bar = 0.5 cm. C, Detail of a transversal section stained with Sirius Red. Bar = 10 µm. D, The HW/BW was calculated of 3 mo-old WT, Het and KI mice. Bars represent the mean±SEM with *P<0.05 vs. WT, Student`s t-test. The number of animals is indicated in the bars. All analyses were performed by Nicolas Vignier.
LVPWd
0 5 10 15 200.50.60.70.80.91.01.11.2
Months
(mm
)
***
WT Het KI WT Het KI
LVDd
0 5 10 15 203.0
3.5
4.0
4.5
5.0
5.5
Months
(mm
)
FS
0 5 10 15 2015202530354045
Months
***
(%)
***
A
B C
D
0
5
10
HW
/BW
(m
g/g)
*
WT Het KI18 1826
LVPWd
0 5 10 15 200.50.60.70.80.91.01.11.2
Months
(mm
)
***
WT Het KI WT Het KI
LVDd
0 5 10 15 203.0
3.5
4.0
4.5
5.0
5.5
Months
(mm
)
FS
0 5 10 15 2015202530354045
Months
***
(%)
***
A
B C
D
0
5
10
HW
/BW
(m
g/g)
*
WT Het KI18 1826
D
0
5
10
HW
/BW
(m
g/g)
*
WT Het KI18 1826
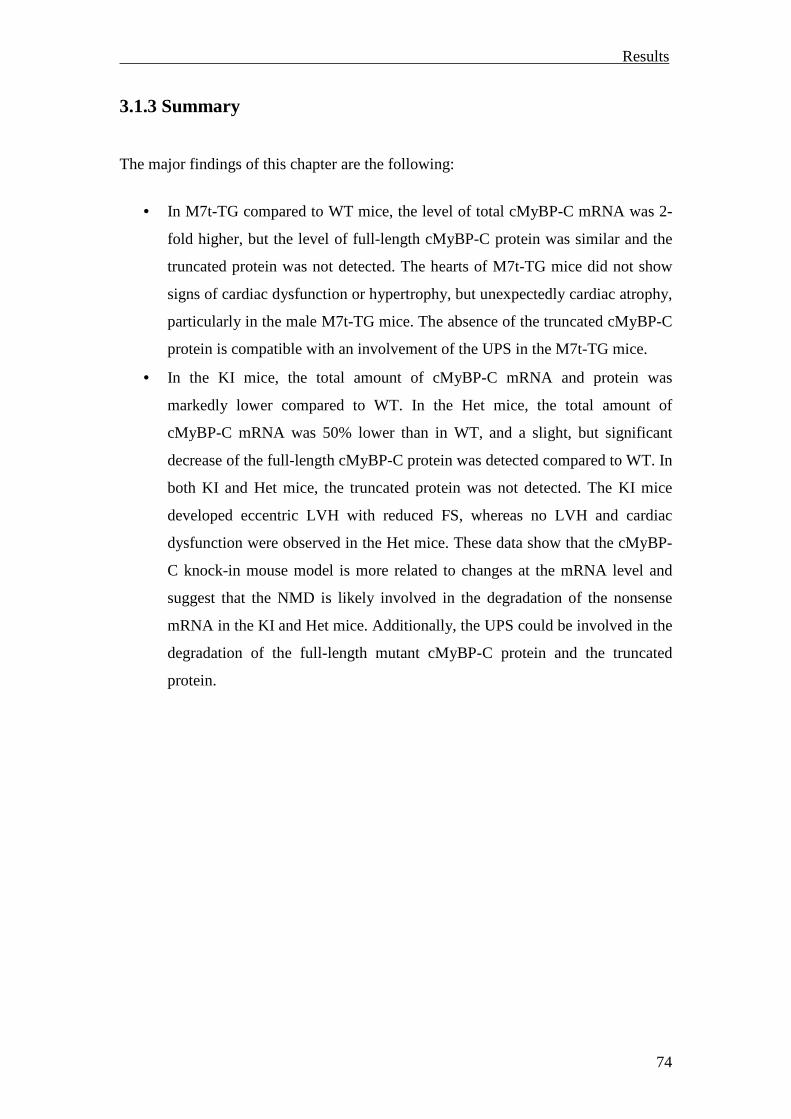
Results
74
3.1.3 Summary
The major findings of this chapter are the following:
• In M7t-TG compared to WT mice, the level of total cMyBP-C mRNA was 2-
fold higher, but the level of full-length cMyBP-C protein was similar and the
truncated protein was not detected. The hearts of M7t-TG mice did not show
signs of cardiac dysfunction or hypertrophy, but unexpectedly cardiac atrophy,
particularly in the male M7t-TG mice. The absence of the truncated cMyBP-C
protein is compatible with an involvement of the UPS in the M7t-TG mice.
• In the KI mice, the total amount of cMyBP-C mRNA and protein was
markedly lower compared to WT. In the Het mice, the total amount of
cMyBP-C mRNA was 50% lower than in WT, and a slight, but significant
decrease of the full-length cMyBP-C protein was detected compared to WT. In
both KI and Het mice, the truncated protein was not detected. The KI mice
developed eccentric LVH with reduced FS, whereas no LVH and cardiac
dysfunction were observed in the Het mice. These data show that the cMyBP-
C knock-in mouse model is more related to changes at the mRNA level and
suggest that the NMD is likely involved in the degradation of the nonsense
mRNA in the KI and Het mice. Additionally, the UPS could be involved in the
degradation of the full-length mutant cMyBP-C protein and the truncated
protein.
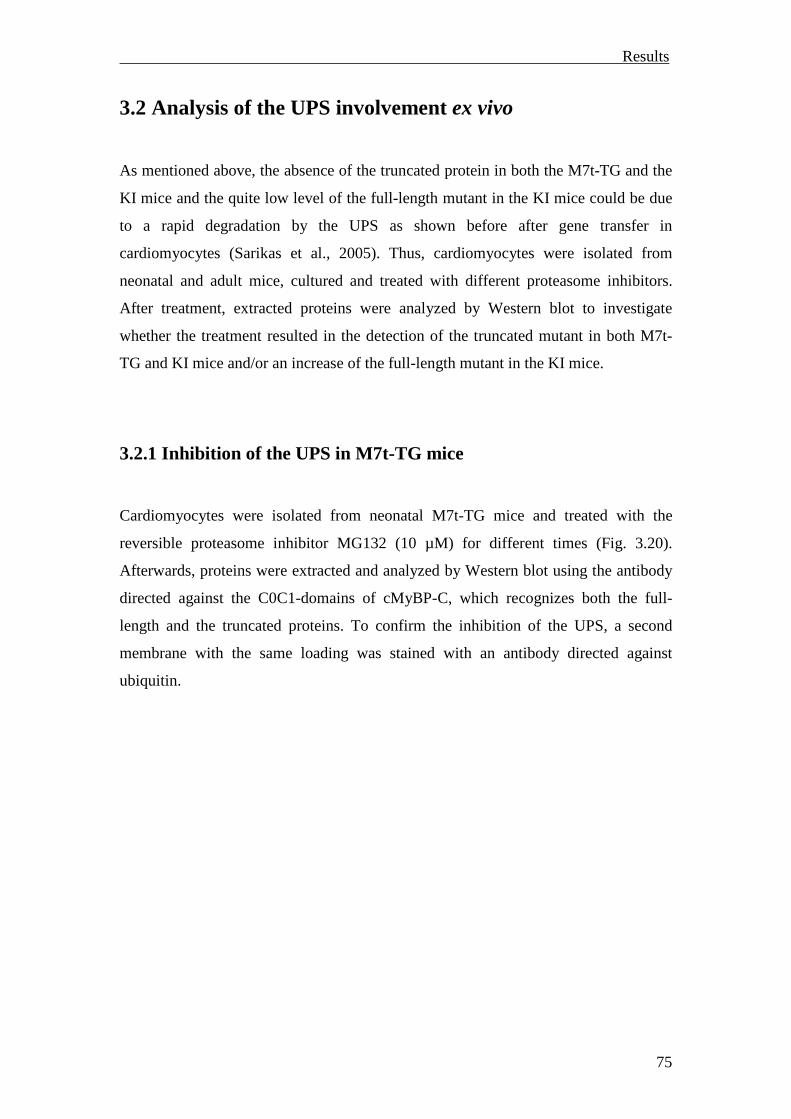
Results
75
3.2 Analysis of the UPS involvement ex vivo
As mentioned above, the absence of the truncated protein in both the M7t-TG and the
KI mice and the quite low level of the full-length mutant in the KI mice could be due
to a rapid degradation by the UPS as shown before after gene transfer in
cardiomyocytes (Sarikas et al., 2005). Thus, cardiomyocytes were isolated from
neonatal and adult mice, cultured and treated with different proteasome inhibitors.
After treatment, extracted proteins were analyzed by Western blot to investigate
whether the treatment resulted in the detection of the truncated mutant in both M7t-
TG and KI mice and/or an increase of the full-length mutant in the KI mice.
3.2.1 Inhibition of the UPS in M7t-TG mice
Cardiomyocytes were isolated from neonatal M7t-TG mice and treated with the
reversible proteasome inhibitor MG132 (10 µM) for different times (Fig. 3.20).
Afterwards, proteins were extracted and analyzed by Western blot using the antibody
directed against the C0C1-domains of cMyBP-C, which recognizes both the full-
length and the truncated proteins. To confirm the inhibition of the UPS, a second
membrane with the same loading was stained with an antibody directed against
ubiquitin.
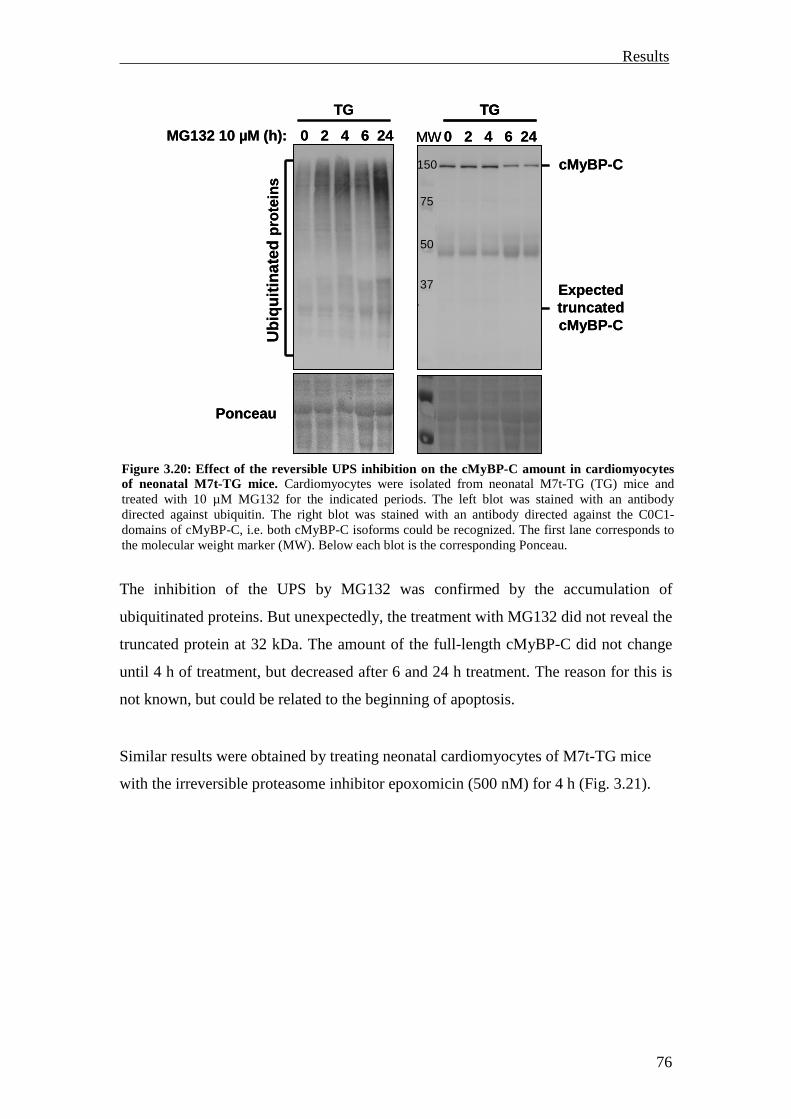
Results
76
The inhibition of the UPS by MG132 was confirmed by the accumulation of
ubiquitinated proteins. But unexpectedly, the treatment with MG132 did not reveal the
truncated protein at 32 kDa. The amount of the full-length cMyBP-C did not change
until 4 h of treatment, but decreased after 6 and 24 h treatment. The reason for this is
not known, but could be related to the beginning of apoptosis.
Similar results were obtained by treating neonatal cardiomyocytes of M7t-TG mice
with the irreversible proteasome inhibitor epoxomicin (500 nM) for 4 h (Fig. 3.21).
Figure 3.20: Effect of the reversible UPS inhibition on the cMyBP-C amount in cardiomyocytes of neonatal M7t-TG mice. Cardiomyocytes were isolated from neonatal M7t-TG (TG) mice and treated with 10 µM MG132 for the indicated periods. The left blot was stained with an antibody directed against ubiquitin. The right blot was stained with an antibody directed against the C0C1-domains of cMyBP-C, i.e. both cMyBP-C isoforms could be recognized. The first lane corresponds to the molecular weight marker (MW). Below each blot is the corresponding Ponceau.
MG132 10 µM (h): 0 2 4 6 24
TG
Ponceau
50
37
75
150
0 2 4 6 24
TG
cMyBP-C
ExpectedtruncatedcMyBP-C
MW
Ubi
quiti
nate
dpr
otei
ns
MG132 10 µM (h): 0 2 4 6 24
TG
Ponceau
50
37
75
150
0 2 4 6 24
TGTG
cMyBP-C
ExpectedtruncatedcMyBP-C
MW
Ubi
quiti
nate
dpr
otei
ns
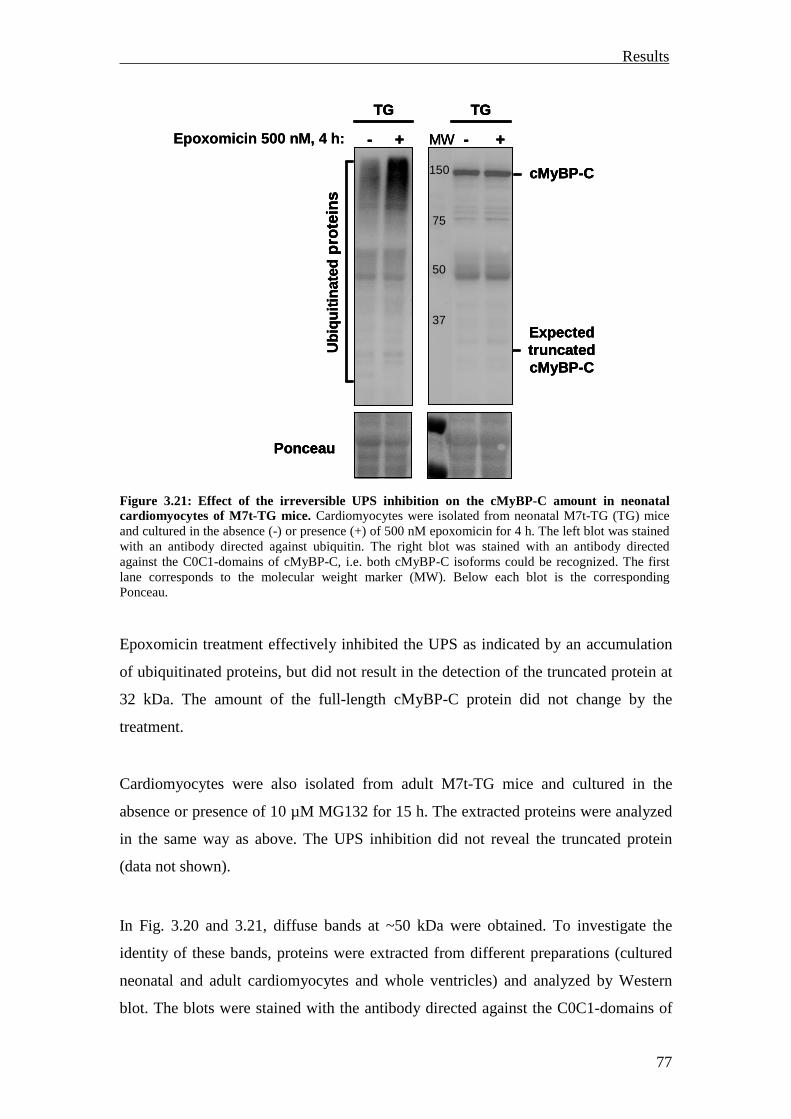
Results
77
Epoxomicin treatment effectively inhibited the UPS as indicated by an accumulation
of ubiquitinated proteins, but did not result in the detection of the truncated protein at
32 kDa. The amount of the full-length cMyBP-C protein did not change by the
treatment.
Cardiomyocytes were also isolated from adult M7t-TG mice and cultured in the
absence or presence of 10 µM MG132 for 15 h. The extracted proteins were analyzed
in the same way as above. The UPS inhibition did not reveal the truncated protein
(data not shown).
In Fig. 3.20 and 3.21, diffuse bands at ~50 kDa were obtained. To investigate the
identity of these bands, proteins were extracted from different preparations (cultured
neonatal and adult cardiomyocytes and whole ventricles) and analyzed by Western
blot. The blots were stained with the antibody directed against the C0C1-domains of
Figure 3.21: Effect of the irreversible UPS inhibition on the cMyBP-C amount in neonatal cardiomyocytes of M7t-TG mice. Cardiomyocytes were isolated from neonatal M7t-TG (TG) mice and cultured in the absence (-) or presence (+) of 500 nM epoxomicin for 4 h. The left blot was stained with an antibody directed against ubiquitin. The right blot was stained with an antibody directed against the C0C1-domains of cMyBP-C, i.e. both cMyBP-C isoforms could be recognized. The first lane corresponds to the molecular weight marker (MW). Below each blot is the corresponding Ponceau.
Epoxomicin 500 nM, 4 h: - + - +
50
37
75
150
TG TG
cMyBP-C
ExpectedtruncatedcMyBP-C
Ubi
quiti
nate
dpr
otei
ns
Ponceau
MWEpoxomicin 500 nM, 4 h: - + - +
50
37
75
150
TG TG
cMyBP-C
ExpectedtruncatedcMyBP-C
Ubi
quiti
nate
dpr
otei
ns
Ponceau
MW- + - +
50
37
75
150
TGTG TGTG
cMyBP-C
ExpectedtruncatedcMyBP-C
Ubi
quiti
nate
dpr
otei
ns
Ponceau
MW
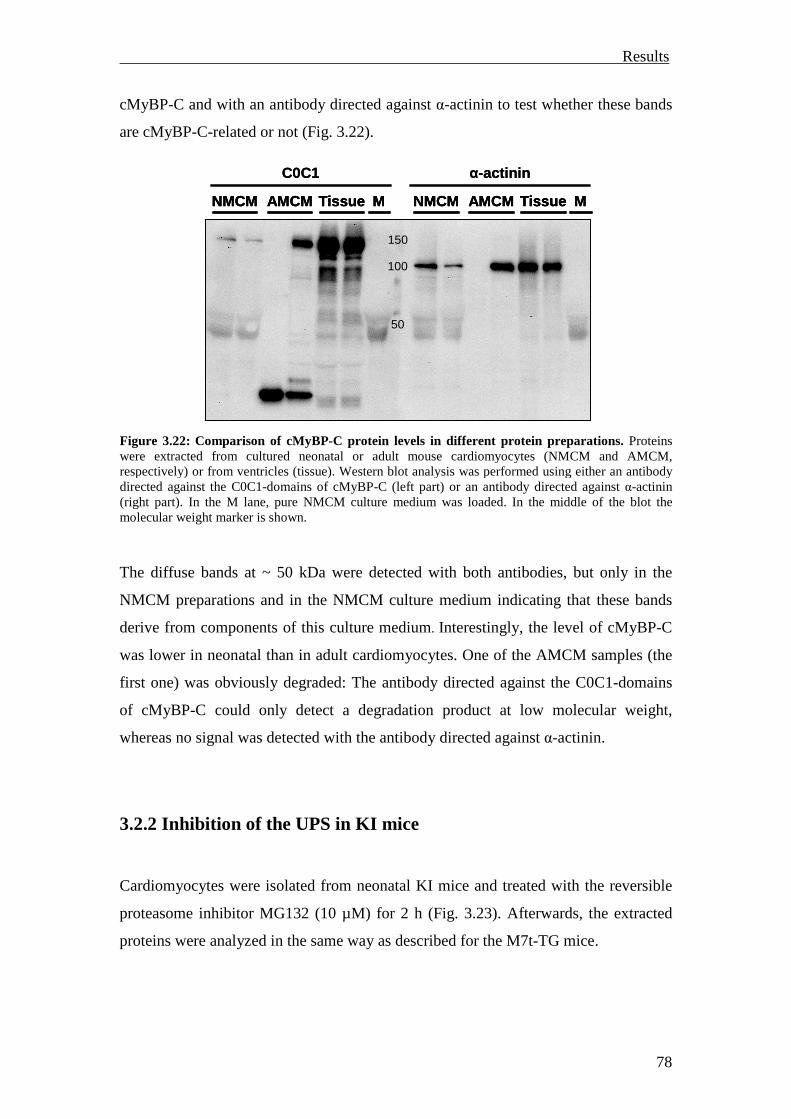
Results
78
cMyBP-C and with an antibody directed against α-actinin to test whether these bands
are cMyBP-C-related or not (Fig. 3.22).
The diffuse bands at ~ 50 kDa were detected with both antibodies, but only in the
NMCM preparations and in the NMCM culture medium indicating that these bands
derive from components of this culture medium. Interestingly, the level of cMyBP-C
was lower in neonatal than in adult cardiomyocytes. One of the AMCM samples (the
first one) was obviously degraded: The antibody directed against the C0C1-domains
of cMyBP-C could only detect a degradation product at low molecular weight,
whereas no signal was detected with the antibody directed against α-actinin.
3.2.2 Inhibition of the UPS in KI mice
Cardiomyocytes were isolated from neonatal KI mice and treated with the reversible
proteasome inhibitor MG132 (10 µM) for 2 h (Fig. 3.23). Afterwards, the extracted
proteins were analyzed in the same way as described for the M7t-TG mice.
Figure 3.22: Comparison of cMyBP-C protein levels in different protein preparations. Proteins were extracted from cultured neonatal or adult mouse cardiomyocytes (NMCM and AMCM, respectively) or from ventricles (tissue). Western blot analysis was performed using either an antibody directed against the C0C1-domains of cMyBP-C (left part) or an antibody directed against α-actinin (right part). In the M lane, pure NMCM culture medium was loaded. In the middle of the blot the molecular weight marker is shown.
C0C1 α-actinin
NMCM AMCM Tissue M NMCM AMCM Tissue M
50
100
150
C0C1 α-actinin
NMCM AMCM Tissue MNMCM AMCM Tissue M NMCM AMCM Tissue MNMCM AMCM Tissue M
50
100
150
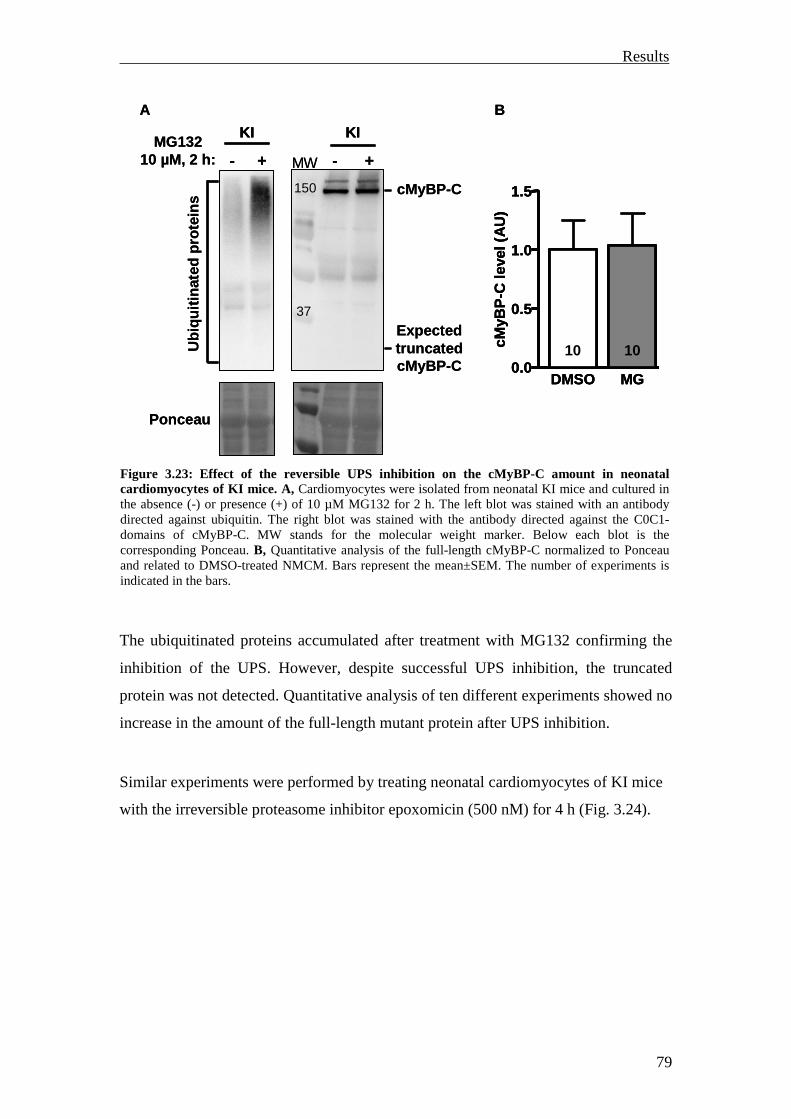
Results
79
The ubiquitinated proteins accumulated after treatment with MG132 confirming the
inhibition of the UPS. However, despite successful UPS inhibition, the truncated
protein was not detected. Quantitative analysis of ten different experiments showed no
increase in the amount of the full-length mutant protein after UPS inhibition.
Similar experiments were performed by treating neonatal cardiomyocytes of KI mice
with the irreversible proteasome inhibitor epoxomicin (500 nM) for 4 h (Fig. 3.24).
Figure 3.23: Effect of the reversible UPS inhibition on the cMyBP-C amount in neonatal cardiomyocytes of KI mice. A, Cardiomyocytes were isolated from neonatal KI mice and cultured in the absence (-) or presence (+) of 10 µM MG132 for 2 h. The left blot was stained with an antibody directed against ubiquitin. The right blot was stained with the antibody directed against the C0C1-domains of cMyBP-C. MW stands for the molecular weight marker. Below each blot is the corresponding Ponceau. B, Quantitative analysis of the full-length cMyBP-C normalized to Ponceau and related to DMSO-treated NMCM. Bars represent the mean±SEM. The number of experiments is indicated in the bars.
DMSO MG0.0
0.5
1.0
1.5
10 10cMyB
P-C
leve
l(A
U)
MG132 10 µM, 2 h:
Ponceau
- +
150
37
- +
cMyBP-C
ExpectedtruncatedcMyBP-C
MW
Ubi
quiti
nate
dpr
otei
ns
KI KI
A B
DMSO MG0.0
0.5
1.0
1.5
10 10cMyB
P-C
leve
l(A
U)
DMSO MG0.0
0.5
1.0
1.5
10 10cMyB
P-C
leve
l(A
U)
MG132 10 µM, 2 h:
Ponceau
- +
150
37
- +
cMyBP-C
ExpectedtruncatedcMyBP-C
MW
Ubi
quiti
nate
dpr
otei
ns
KIKI KIKI
A B
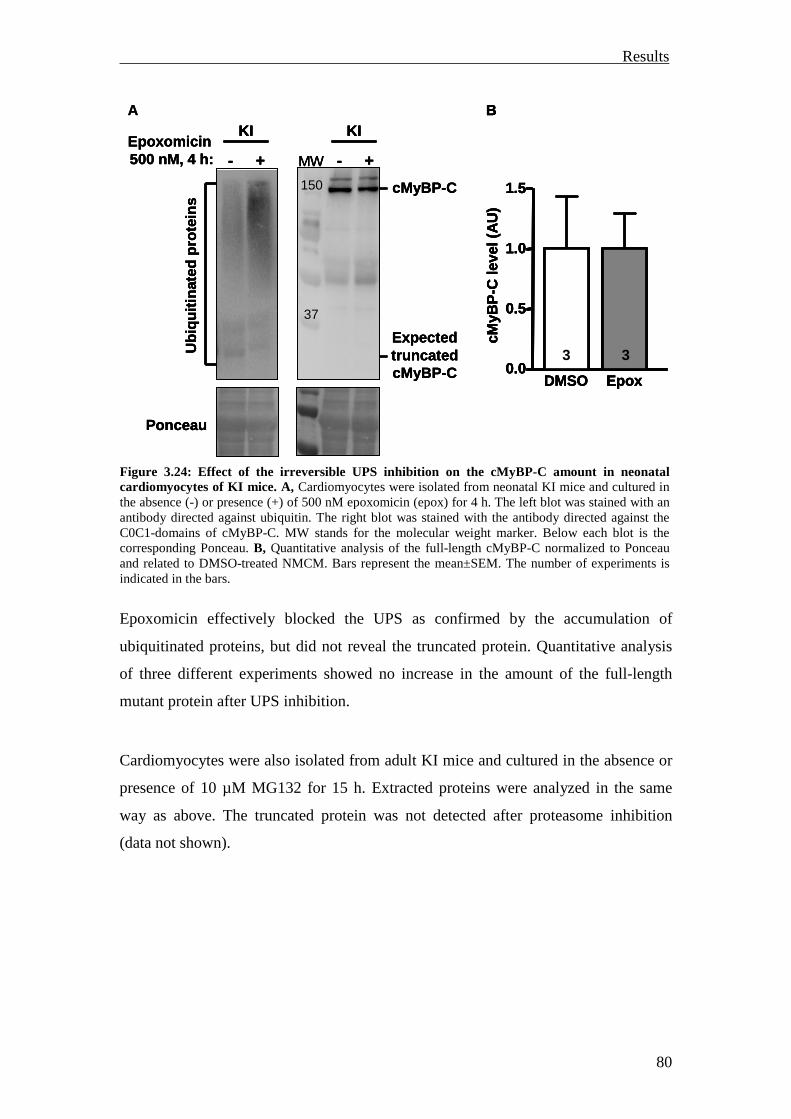
Results
80
Epoxomicin effectively blocked the UPS as confirmed by the accumulation of
ubiquitinated proteins, but did not reveal the truncated protein. Quantitative analysis
of three different experiments showed no increase in the amount of the full-length
mutant protein after UPS inhibition.
Cardiomyocytes were also isolated from adult KI mice and cultured in the absence or
presence of 10 µM MG132 for 15 h. Extracted proteins were analyzed in the same
way as above. The truncated protein was not detected after proteasome inhibition
(data not shown).
Figure 3.24: Effect of the irreversible UPS inhibition on the cMyBP-C amount in neonatal cardiomyocytes of KI mice. A, Cardiomyocytes were isolated from neonatal KI mice and cultured in the absence (-) or presence (+) of 500 nM epoxomicin (epox) for 4 h. The left blot was stained with an antibody directed against ubiquitin. The right blot was stained with the antibody directed against the C0C1-domains of cMyBP-C. MW stands for the molecular weight marker. Below each blot is the corresponding Ponceau. B, Quantitative analysis of the full-length cMyBP-C normalized to Ponceau and related to DMSO-treated NMCM. Bars represent the mean±SEM. The number of experiments is indicated in the bars.
A
- +150
37
Epoxomicin500 nM, 4 h:
Ponceau
- +
cMyBP-C
ExpectedtruncatedcMyBP-C
MW
KI KI
Ubi
quiti
nate
dpr
otei
ns
DMSO Epox0.0
0.5
1.0
1.5
3 3
cMyB
P-C
leve
l(A
U)
BA
- +150
37
Epoxomicin500 nM, 4 h:
Ponceau
- +
cMyBP-C
ExpectedtruncatedcMyBP-C
MW
KI KI
Ubi
quiti
nate
dpr
otei
ns
DMSO Epox0.0
0.5
1.0
1.5
3 3
cMyB
P-C
leve
l(A
U)
B
- +150
37
Epoxomicin500 nM, 4 h:
Ponceau
- +
cMyBP-C
ExpectedtruncatedcMyBP-C
MW
KIKI KIKI
Ubi
quiti
nate
dpr
otei
ns
DMSO Epox0.0
0.5
1.0
1.5
3 3
cMyB
P-C
leve
l(A
U)
B
DMSO Epox0.0
0.5
1.0
1.5
3 3
cMyB
P-C
leve
l(A
U)
B
Results
81
3.2.3 Summary
In contrast to the study of Sarikas et al. (2005), the inhibition of the proteasome with
both a reversible and an irreversible inhibitor did neither reveal the truncated protein
nor increased the level of the full-length protein in both M7t-TG and KI
cardiomyocytes. Thus, these data failed to show evidence for a major UPS
involvement in the M7t-TG or KI mice ex vivo.
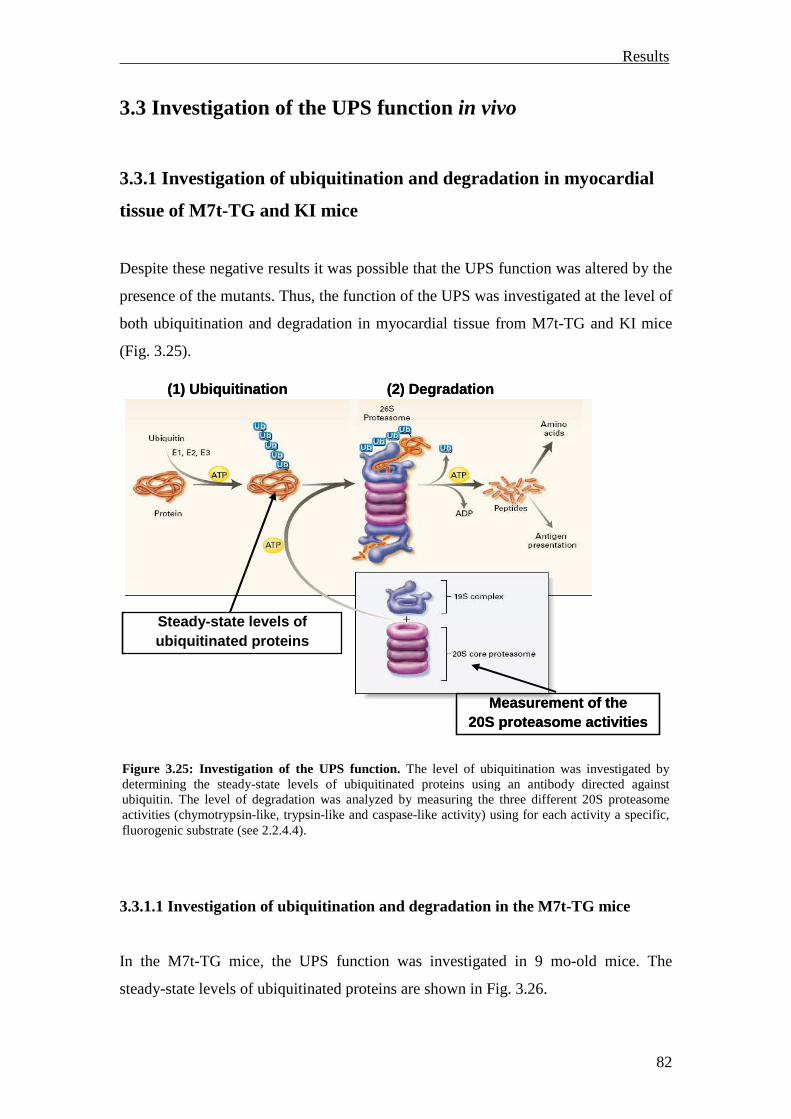
Results
82
3.3 Investigation of the UPS function in vivo
3.3.1 Investigation of ubiquitination and degradation in myocardial
tissue of M7t-TG and KI mice
Despite these negative results it was possible that the UPS function was altered by the
presence of the mutants. Thus, the function of the UPS was investigated at the level of
both ubiquitination and degradation in myocardial tissue from M7t-TG and KI mice
(Fig. 3.25).
3.3.1.1 Investigation of ubiquitination and degradation in the M7t-TG mice
In the M7t-TG mice, the UPS function was investigated in 9 mo-old mice. The
steady-state levels of ubiquitinated proteins are shown in Fig. 3.26.
Figure 3.25: Investigation of the UPS function. The level of ubiquitination was investigated by determining the steady-state levels of ubiquitinated proteins using an antibody directed against ubiquitin. The level of degradation was analyzed by measuring the three different 20S proteasome activities (chymotrypsin-like, trypsin-like and caspase-like activity) using for each activity a specific, fluorogenic substrate (see 2.2.4.4).
(1) Ubiquitination (2) Degradation
Steady-state levels of ubiquitinated proteins
Measurement of the20S proteasome activities
(1) Ubiquitination (2) Degradation
Steady-state levels of ubiquitinated proteins
Measurement of the20S proteasome activities
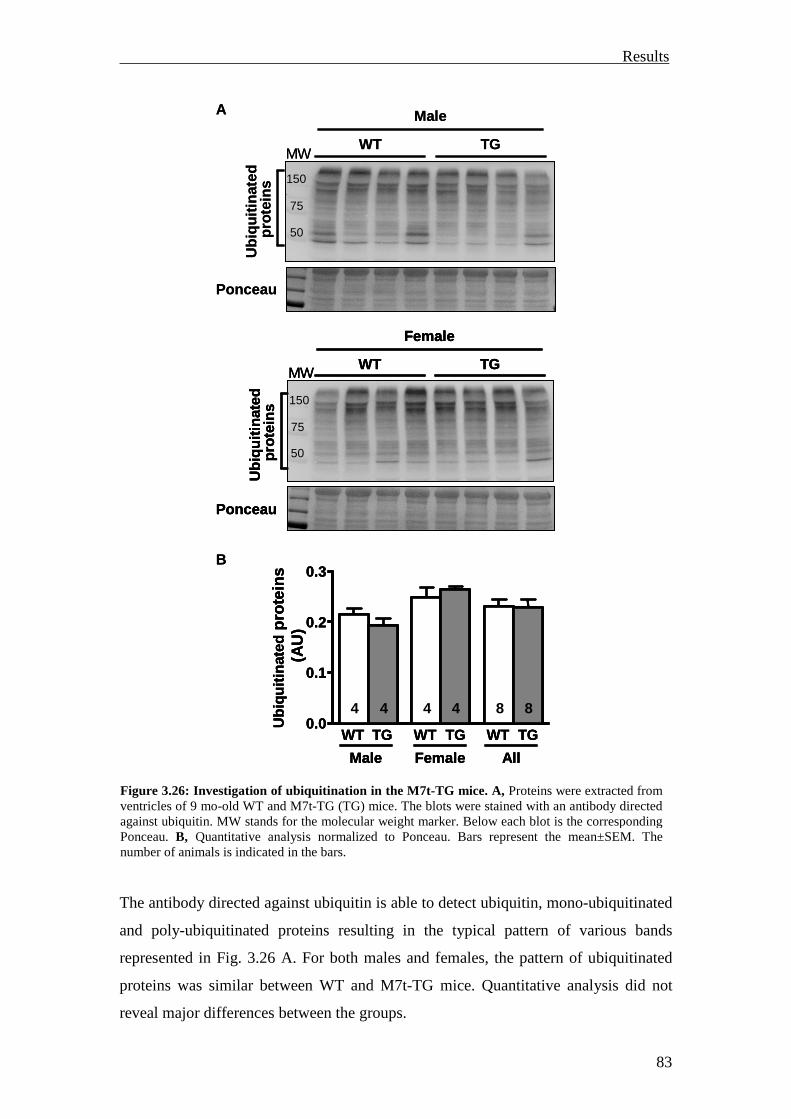
Results
83
The antibody directed against ubiquitin is able to detect ubiquitin, mono-ubiquitinated
and poly-ubiquitinated proteins resulting in the typical pattern of various bands
represented in Fig. 3.26 A. For both males and females, the pattern of ubiquitinated
proteins was similar between WT and M7t-TG mice. Quantitative analysis did not
reveal major differences between the groups.
Figure 3.26: Investigation of ubiquitination in the M7t-TG mice. A, Proteins were extracted from ventricles of 9 mo-old WT and M7t-TG (TG) mice. The blots were stained with an antibody directed against ubiquitin. MW stands for the molecular weight marker. Below each blot is the corresponding Ponceau. B, Quantitative analysis normalized to Ponceau. Bars represent the mean±SEM. The number of animals is indicated in the bars.
WT TG
Male
50
75
150
Ponceau
A
B
Ubi
quiti
nate
dpr
otei
ns
MW
WT TG
Female
50
75
150
Ponceau
Ubi
quiti
nate
dpr
otei
ns
MW
0.0
0.1
0.2
0.3
Ubi
quiti
nate
dpr
otei
ns(A
U)
WT WT WTTG TG TG
Male Female All
4 4 4 4 8 8
WT TG
Male
50
75
150
Ponceau
A
B
Ubi
quiti
nate
dpr
otei
ns
MW
WT TG
Female
50
75
150
Ponceau
Ubi
quiti
nate
dpr
otei
ns
MWWT TG
Female
50
75
150
Ponceau
Ubi
quiti
nate
dpr
otei
ns
MW
0.0
0.1
0.2
0.3
Ubi
quiti
nate
dpr
otei
ns(A
U)
WT WT WTTG TG TG
Male Female All
4 4 4 4 8 80.0
0.1
0.2
0.3
Ubi
quiti
nate
dpr
otei
ns(A
U)
WT WT WTTG TG TG
Male Female All
4 4 4 4 8 8
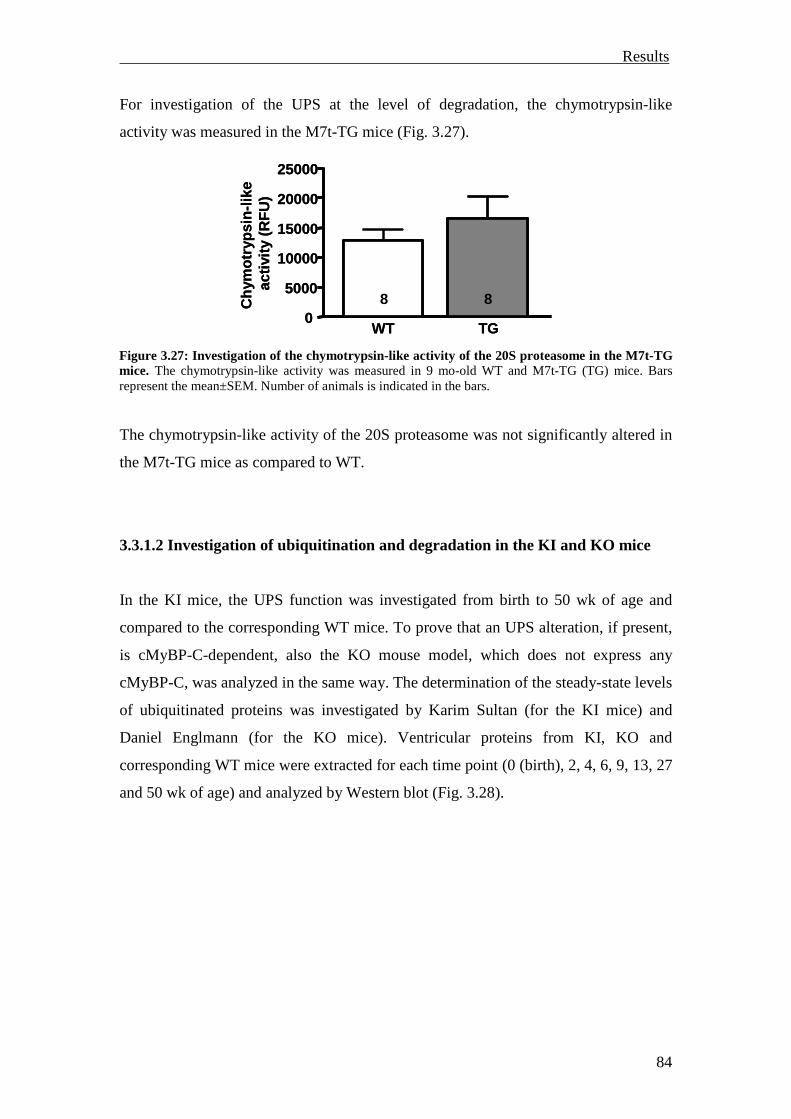
Results
84
For investigation of the UPS at the level of degradation, the chymotrypsin-like
activity was measured in the M7t-TG mice (Fig. 3.27).
The chymotrypsin-like activity of the 20S proteasome was not significantly altered in
the M7t-TG mice as compared to WT.
3.3.1.2 Investigation of ubiquitination and degradation in the KI and KO mice
In the KI mice, the UPS function was investigated from birth to 50 wk of age and
compared to the corresponding WT mice. To prove that an UPS alteration, if present,
is cMyBP-C-dependent, also the KO mouse model, which does not express any
cMyBP-C, was analyzed in the same way. The determination of the steady-state levels
of ubiquitinated proteins was investigated by Karim Sultan (for the KI mice) and
Daniel Englmann (for the KO mice). Ventricular proteins from KI, KO and
corresponding WT mice were extracted for each time point (0 (birth), 2, 4, 6, 9, 13, 27
and 50 wk of age) and analyzed by Western blot (Fig. 3.28).
Figure 3.27: Investigation of the chymotrypsin-like activity of the 20S proteasome in the M7t-TG mice. The chymotrypsin-like activity was measured in 9 mo-old WT and M7t-TG (TG) mice. Bars represent the mean±SEM. Number of animals is indicated in the bars.
WT TG0
5000
10000
15000
20000
25000
8 8Chy
mot
ryps
in-li
keac
tivity
(RF
U)
WT TG0
5000
10000
15000
20000
25000
8 8Chy
mot
ryps
in-li
keac
tivity
(RF
U)
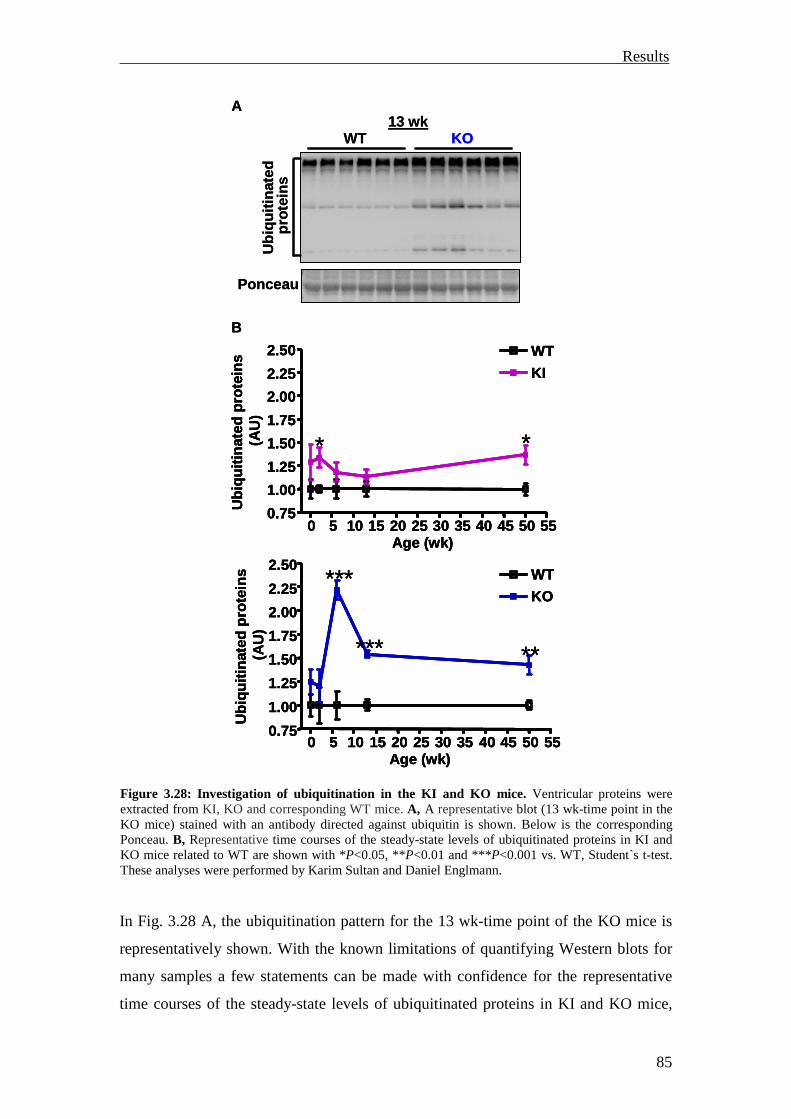
Results
85
In Fig. 3.28 A, the ubiquitination pattern for the 13 wk-time point of the KO mice is
representatively shown. With the known limitations of quantifying Western blots for
many samples a few statements can be made with confidence for the representative
time courses of the steady-state levels of ubiquitinated proteins in KI and KO mice,
Figure 3.28: Investigation of ubiquitination in the KI and KO mi ce. Ventricular proteins were extracted from KI, KO and corresponding WT mice. A, A representative blot (13 wk-time point in the KO mice) stained with an antibody directed against ubiquitin is shown. Below is the corresponding Ponceau. B, Representative time courses of the steady-state levels of ubiquitinated proteins in KI and KO mice related to WT are shown with *P<0.05, **P<0.01 and ***P<0.001 vs. WT, Student`s t-test. These analyses were performed by Karim Sultan and Daniel Englmann.
0 5 10 15 20 25 30 35 40 45 50 550.75
1.00
1.25
1.50
1.75
2.00
2.25
2.50***
*** **
Age (wk)
Ubi
quiti
nate
dpr
otei
ns(A
U)
KOWT13 wk
PonceauU
biqu
itina
ted
prot
eins
A
0 5 10 15 20 25 30 35 40 45 50 550.75
1.00
1.25
1.50
1.75
2.00
2.25
2.50
* *
Age (wk)
Ubi
quiti
nate
dpr
otei
ns(A
U)
WT
KI
WTKO
B
0 5 10 15 20 25 30 35 40 45 50 550.75
1.00
1.25
1.50
1.75
2.00
2.25
2.50***
*** **
Age (wk)
Ubi
quiti
nate
dpr
otei
ns(A
U)
0 5 10 15 20 25 30 35 40 45 50 550.75
1.00
1.25
1.50
1.75
2.00
2.25
2.50***
*** **
Age (wk)
Ubi
quiti
nate
dpr
otei
ns(A
U)
KOWT13 wk
PonceauU
biqu
itina
ted
prot
eins
A
0 5 10 15 20 25 30 35 40 45 50 550.75
1.00
1.25
1.50
1.75
2.00
2.25
2.50
* *
Age (wk)
Ubi
quiti
nate
dpr
otei
ns(A
U)
0 5 10 15 20 25 30 35 40 45 50 550.75
1.00
1.25
1.50
1.75
2.00
2.25
2.50
* *
Age (wk)
Ubi
quiti
nate
dpr
otei
ns(A
U)
WT
KI
WT
KI
WTKOWTKO
B
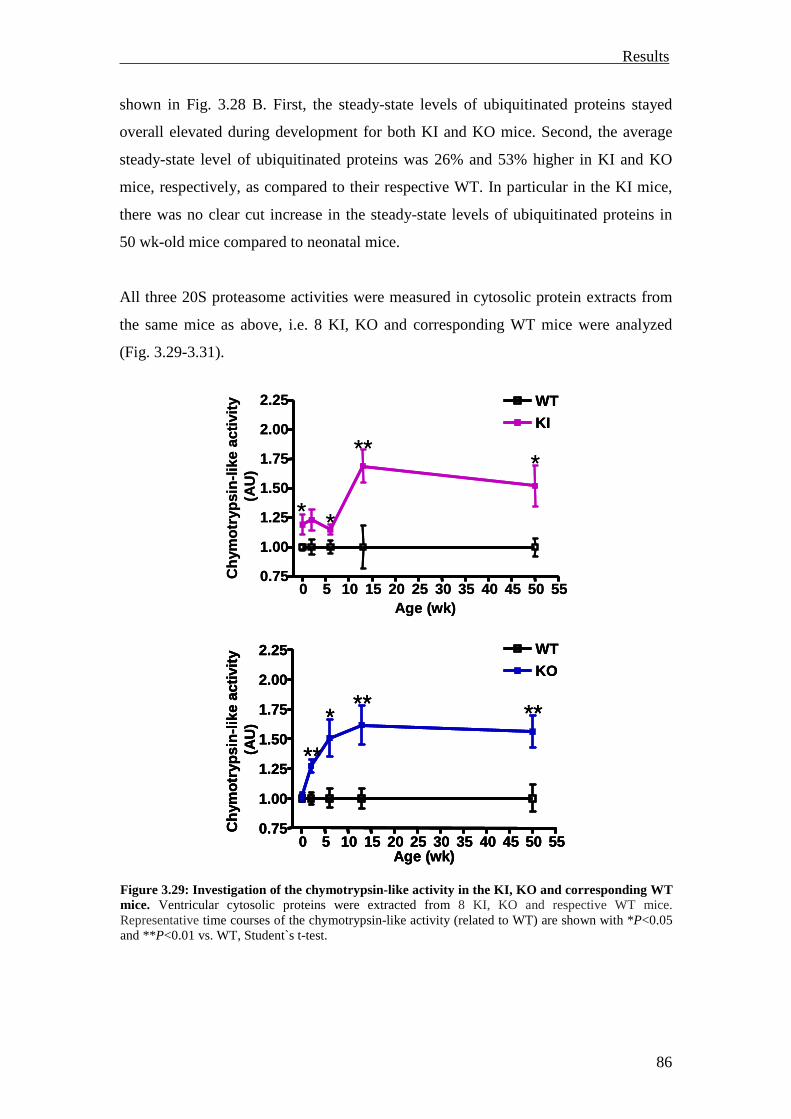
Results
86
shown in Fig. 3.28 B. First, the steady-state levels of ubiquitinated proteins stayed
overall elevated during development for both KI and KO mice. Second, the average
steady-state level of ubiquitinated proteins was 26% and 53% higher in KI and KO
mice, respectively, as compared to their respective WT. In particular in the KI mice,
there was no clear cut increase in the steady-state levels of ubiquitinated proteins in
50 wk-old mice compared to neonatal mice.
All three 20S proteasome activities were measured in cytosolic protein extracts from
the same mice as above, i.e. 8 KI, KO and corresponding WT mice were analyzed
(Fig. 3.29-3.31).
Figure 3.29: Investigation of the chymotrypsin-like activity in the KI, KO and corresponding WT mice. Ventricular cytosolic proteins were extracted from 8 KI, KO and respective WT mice. Representative time courses of the chymotrypsin-like activity (related to WT) are shown with *P<0.05 and **P<0.01 vs. WT, Student`s t-test.
0 5 10 15 20 25 30 35 40 45 50 550.75
1.00
1.25
1.50
1.75
2.00
2.25
* *
***
Age (wk)
Chy
mot
ryps
in-li
keac
tivity
(AU
)
0 5 10 15 20 25 30 35 40 45 50 550.75
1.00
1.25
1.50
1.75
2.00
2.25
*
**
** **
Age (wk)
Chy
mot
ryps
in-li
keac
tivity
(AU
)
WT
KI
WT
KO
0 5 10 15 20 25 30 35 40 45 50 550.75
1.00
1.25
1.50
1.75
2.00
2.25
* *
***
Age (wk)
Chy
mot
ryps
in-li
keac
tivity
(AU
)
0 5 10 15 20 25 30 35 40 45 50 550.75
1.00
1.25
1.50
1.75
2.00
2.25
*
**
** **
Age (wk)
Chy
mot
ryps
in-li
keac
tivity
(AU
)
0 5 10 15 20 25 30 35 40 45 50 550.75
1.00
1.25
1.50
1.75
2.00
2.25
*
**
** **
Age (wk)
Chy
mot
ryps
in-li
keac
tivity
(AU
)
WT
KI
WT
KI
WT
KO
WT
KO
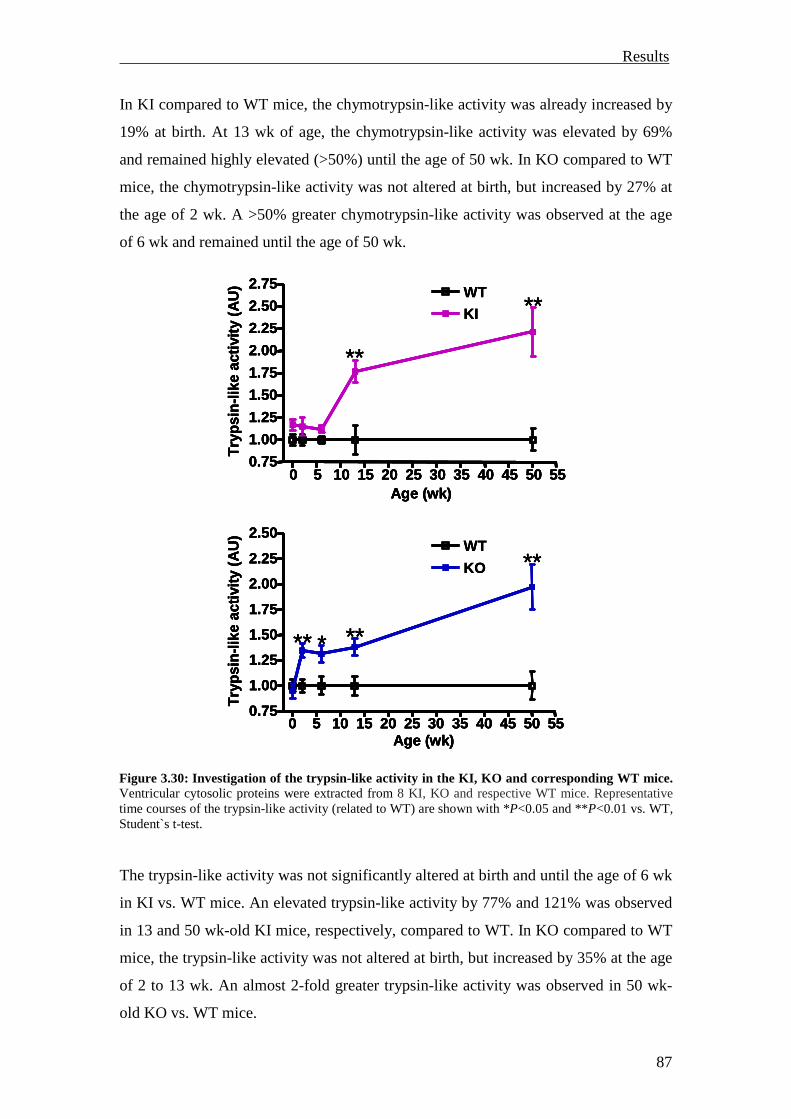
Results
87
In KI compared to WT mice, the chymotrypsin-like activity was already increased by
19% at birth. At 13 wk of age, the chymotrypsin-like activity was elevated by 69%
and remained highly elevated (>50%) until the age of 50 wk. In KO compared to WT
mice, the chymotrypsin-like activity was not altered at birth, but increased by 27% at
the age of 2 wk. A >50% greater chymotrypsin-like activity was observed at the age
of 6 wk and remained until the age of 50 wk.
The trypsin-like activity was not significantly altered at birth and until the age of 6 wk
in KI vs. WT mice. An elevated trypsin-like activity by 77% and 121% was observed
in 13 and 50 wk-old KI mice, respectively, compared to WT. In KO compared to WT
mice, the trypsin-like activity was not altered at birth, but increased by 35% at the age
of 2 to 13 wk. An almost 2-fold greater trypsin-like activity was observed in 50 wk-
old KO vs. WT mice.
Figure 3.30: Investigation of the trypsin-like activity in the KI, KO and corresponding WT mice. Ventricular cytosolic proteins were extracted from 8 KI, KO and respective WT mice. Representative time courses of the trypsin-like activity (related to WT) are shown with *P<0.05 and **P<0.01 vs. WT, Student`s t-test.
0 5 10 15 20 25 30 35 40 45 50 550.75
1.00
1.25
1.50
1.75
2.00
2.25
2.50
2.75
**
**
Age (wk)
Try
psin
-like
activ
ity(A
U)
0 5 10 15 20 25 30 35 40 45 50 550.75
1.00
1.25
1.50
1.75
2.00
2.25
2.50
** * **
**
Age (wk)
Try
psin
-like
activ
ity(A
U)
WTKI
WT
KO
0 5 10 15 20 25 30 35 40 45 50 550.75
1.00
1.25
1.50
1.75
2.00
2.25
2.50
2.75
**
**
Age (wk)
Try
psin
-like
activ
ity(A
U)
0 5 10 15 20 25 30 35 40 45 50 550.75
1.00
1.25
1.50
1.75
2.00
2.25
2.50
** * **
**
Age (wk)
Try
psin
-like
activ
ity(A
U)
0 5 10 15 20 25 30 35 40 45 50 550.75
1.00
1.25
1.50
1.75
2.00
2.25
2.50
2.75
**
**
Age (wk)
Try
psin
-like
activ
ity(A
U)
0 5 10 15 20 25 30 35 40 45 50 550.75
1.00
1.25
1.50
1.75
2.00
2.25
2.50
** * **
**
Age (wk)
Try
psin
-like
activ
ity(A
U)
0 5 10 15 20 25 30 35 40 45 50 550.75
1.00
1.25
1.50
1.75
2.00
2.25
2.50
2.75
**
**
Age (wk)
Try
psin
-like
activ
ity(A
U)
0 5 10 15 20 25 30 35 40 45 50 550.75
1.00
1.25
1.50
1.75
2.00
2.25
2.50
** * **
**
Age (wk)
Try
psin
-like
activ
ity(A
U)
WTKIWTKI
WT
KO
WT
KO
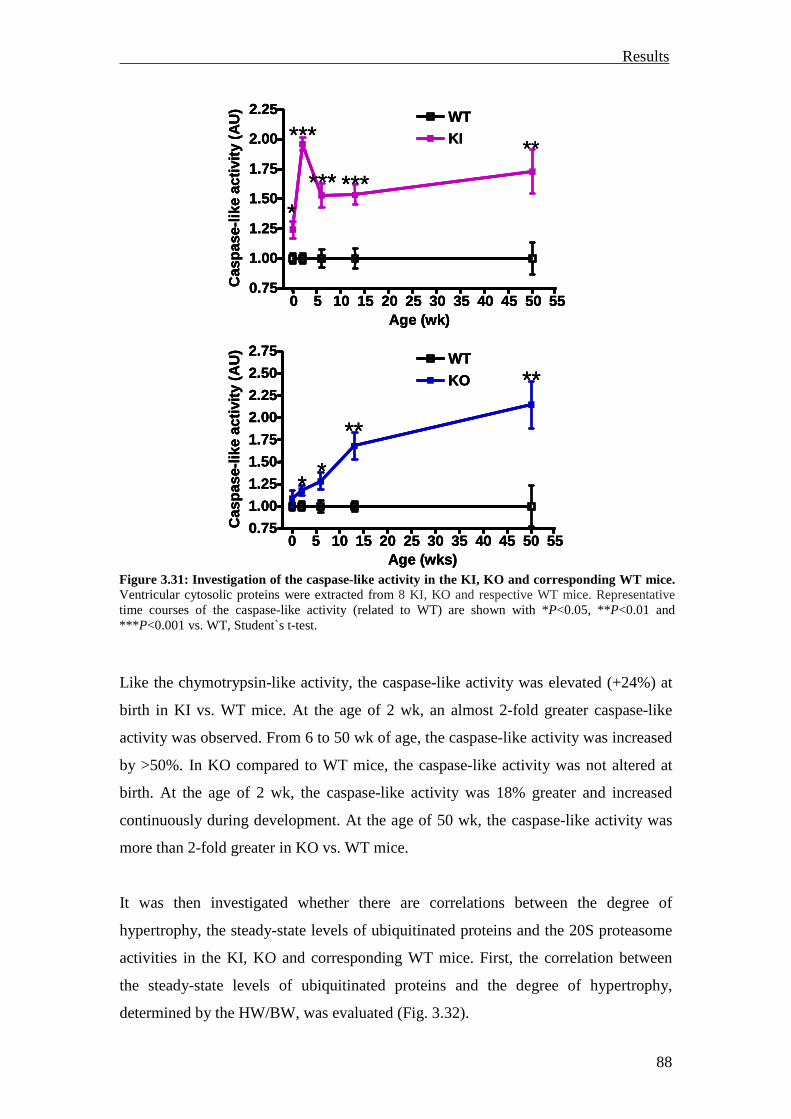
Results
88
Like the chymotrypsin-like activity, the caspase-like activity was elevated (+24%) at
birth in KI vs. WT mice. At the age of 2 wk, an almost 2-fold greater caspase-like
activity was observed. From 6 to 50 wk of age, the caspase-like activity was increased
by >50%. In KO compared to WT mice, the caspase-like activity was not altered at
birth. At the age of 2 wk, the caspase-like activity was 18% greater and increased
continuously during development. At the age of 50 wk, the caspase-like activity was
more than 2-fold greater in KO vs. WT mice.
It was then investigated whether there are correlations between the degree of
hypertrophy, the steady-state levels of ubiquitinated proteins and the 20S proteasome
activities in the KI, KO and corresponding WT mice. First, the correlation between
the steady-state levels of ubiquitinated proteins and the degree of hypertrophy,
determined by the HW/BW, was evaluated (Fig. 3.32).
Figure 3.31: Investigation of the caspase-like activity in the KI, KO and corresponding WT mice. Ventricular cytosolic proteins were extracted from 8 KI, KO and respective WT mice. Representative time courses of the caspase-like activity (related to WT) are shown with *P<0.05, **P<0.01 and *** P<0.001 vs. WT, Student`s t-test.
0 5 10 15 20 25 30 35 40 45 50 550.75
1.00
1.25
1.50
1.75
2.00
2.25
*
***
*** ***
**
Age (wk)
Cas
pase
-like
activ
ity(A
U)
0 5 10 15 20 25 30 35 40 45 50 550.75
1.00
1.25
1.50
1.75
2.00
2.25
2.50
2.75
* *
**
**
Age (wks)
Cas
pase
-like
activ
ity(A
U)
WTKI
WT
KO
0 5 10 15 20 25 30 35 40 45 50 550.75
1.00
1.25
1.50
1.75
2.00
2.25
*
***
*** ***
**
Age (wk)
Cas
pase
-like
activ
ity(A
U)
0 5 10 15 20 25 30 35 40 45 50 550.75
1.00
1.25
1.50
1.75
2.00
2.25
2.50
2.75
* *
**
**
Age (wks)
Cas
pase
-like
activ
ity(A
U)
0 5 10 15 20 25 30 35 40 45 50 550.75
1.00
1.25
1.50
1.75
2.00
2.25
*
***
*** ***
**
Age (wk)
Cas
pase
-like
activ
ity(A
U)
0 5 10 15 20 25 30 35 40 45 50 550.75
1.00
1.25
1.50
1.75
2.00
2.25
2.50
2.75
* *
**
**
Age (wks)
Cas
pase
-like
activ
ity(A
U)
WTKIWTKI
WT
KO
WT
KO
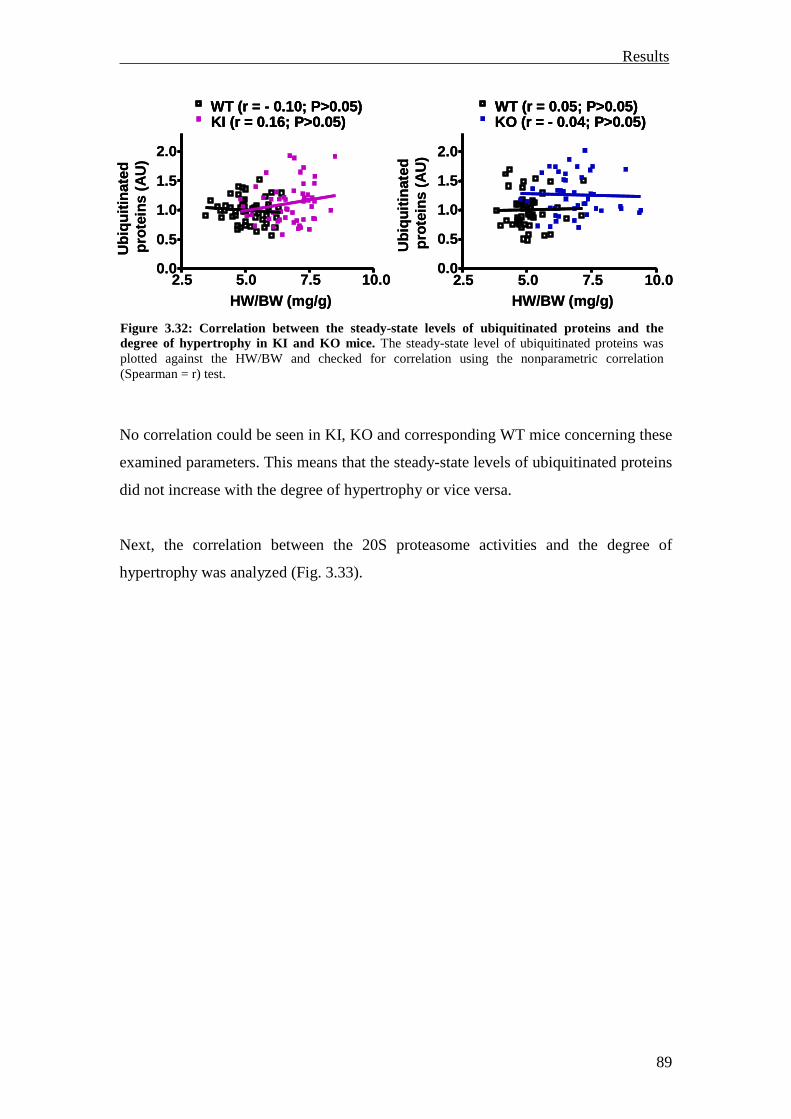
Results
89
No correlation could be seen in KI, KO and corresponding WT mice concerning these
examined parameters. This means that the steady-state levels of ubiquitinated proteins
did not increase with the degree of hypertrophy or vice versa.
Next, the correlation between the 20S proteasome activities and the degree of
hypertrophy was analyzed (Fig. 3.33).
Figure 3.32: Correlation between the steady-state levels of ubiquitinated proteins and the degree of hypertrophy in KI and KO mice. The steady-state level of ubiquitinated proteins was plotted against the HW/BW and checked for correlation using the nonparametric correlation (Spearman = r) test.
2.5 5.0 7.5 10.00.0
0.5
1.0
1.5
2.0
WT (r = - 0.10; P>0.05)KI (r = 0.16; P>0.05)
HW/BW (mg/g)
Ubi
quiti
nate
dpr
otei
ns(A
U)
2.5 5.0 7.5 10.00.0
0.5
1.0
1.5
2.0
WT (r = 0.05; P>0.05)KO (r = - 0.04; P>0.05)
HW/BW (mg/g)
Ubi
quiti
nate
dpr
otei
ns(A
U)
2.5 5.0 7.5 10.00.0
0.5
1.0
1.5
2.0
WT (r = - 0.10; P>0.05)KI (r = 0.16; P>0.05)WT (r = - 0.10; P>0.05)KI (r = 0.16; P>0.05)
HW/BW (mg/g)
Ubi
quiti
nate
dpr
otei
ns(A
U)
2.5 5.0 7.5 10.00.0
0.5
1.0
1.5
2.0
WT (r = 0.05; P>0.05)KO (r = - 0.04; P>0.05)WT (r = 0.05; P>0.05)KO (r = - 0.04; P>0.05)
HW/BW (mg/g)
Ubi
quiti
nate
dpr
otei
ns(A
U)
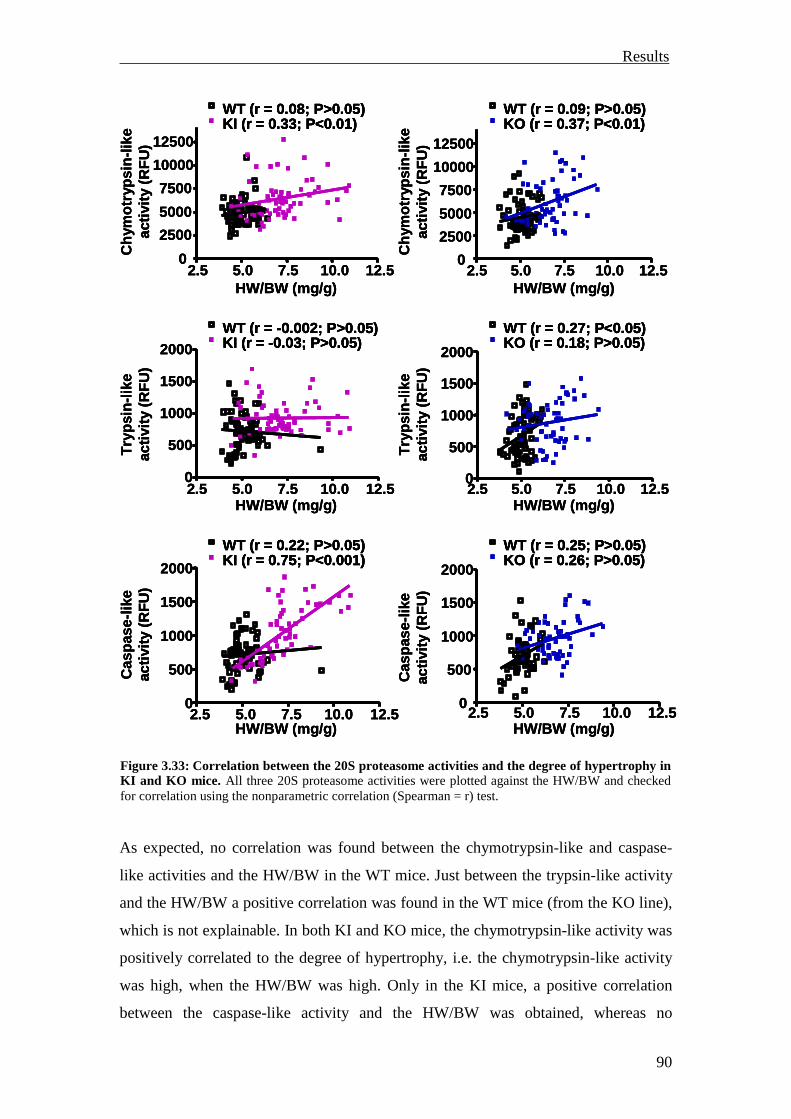
Results
90
As expected, no correlation was found between the chymotrypsin-like and caspase-
like activities and the HW/BW in the WT mice. Just between the trypsin-like activity
and the HW/BW a positive correlation was found in the WT mice (from the KO line),
which is not explainable. In both KI and KO mice, the chymotrypsin-like activity was
positively correlated to the degree of hypertrophy, i.e. the chymotrypsin-like activity
was high, when the HW/BW was high. Only in the KI mice, a positive correlation
between the caspase-like activity and the HW/BW was obtained, whereas no
Figure 3.33: Correlation between the 20S proteasome activities and the degree of hypertrophy in KI and KO mice. All three 20S proteasome activities were plotted against the HW/BW and checked for correlation using the nonparametric correlation (Spearman = r) test.
WT (r = 0.08; P>0.05)KI (r = 0.33; P<0.01)
2.5 5.0 7.5 10.0 12.50
2500
5000
7500
10000
12500
HW/BW (mg/g)
Chy
mot
ryps
in-li
keac
tivity
(RF
U)
2.5 5.0 7.5 10.0 12.50
2500
5000
7500
10000
12500
WT (r = 0.09; P>0.05)KO (r = 0.37; P<0.01)
HW/BW (mg/g)
Chy
mot
ryps
in-li
keac
tivity
(RF
U)
2.5 5.0 7.5 10.0 12.50
500
1000
1500
2000
HW/BW (mg/g)
Cas
pase
-like
activ
ity(R
FU
)
WT (r = 0.22; P>0.05)KI (r = 0.75; P<0.001)
2.5 5.0 7.5 10.0 12.50
500
1000
1500
2000
HW/BW (mg/g)
Cas
pase
-like
activ
ity(R
FU
)
WT (r = 0.25; P>0.05)KO (r = 0.26; P>0.05)
HW/BW (mg/g)2.5 5.0 7.5 10.0 12.50
500
1000
1500
2000
Try
psin
-like
activ
ity(R
FU
)
2.5 5.0 7.5 10.0 12.50
500
1000
1500
2000
HW/BW (mg/g)
Try
psin
-like
activ
ity(R
FU
)
WT (r = -0.002; P>0.05)KI (r = -0.03; P>0.05)
WT (r = 0.27; P<0.05)KO (r = 0.18; P>0.05)
WT (r = 0.08; P>0.05)KI (r = 0.33; P<0.01)
2.5 5.0 7.5 10.0 12.50
2500
5000
7500
10000
12500
HW/BW (mg/g)
Chy
mot
ryps
in-li
keac
tivity
(RF
U)
2.5 5.0 7.5 10.0 12.50
2500
5000
7500
10000
12500
WT (r = 0.09; P>0.05)KO (r = 0.37; P<0.01)
HW/BW (mg/g)
Chy
mot
ryps
in-li
keac
tivity
(RF
U)
WT (r = 0.08; P>0.05)KI (r = 0.33; P<0.01)WT (r = 0.08; P>0.05)KI (r = 0.33; P<0.01)
2.5 5.0 7.5 10.0 12.50
2500
5000
7500
10000
12500
HW/BW (mg/g)
Chy
mot
ryps
in-li
keac
tivity
(RF
U)
2.5 5.0 7.5 10.0 12.50
2500
5000
7500
10000
12500
WT (r = 0.09; P>0.05)KO (r = 0.37; P<0.01)WT (r = 0.09; P>0.05)KO (r = 0.37; P<0.01)
HW/BW (mg/g)
Chy
mot
ryps
in-li
keac
tivity
(RF
U)
2.5 5.0 7.5 10.0 12.50
500
1000
1500
2000
HW/BW (mg/g)
Cas
pase
-like
activ
ity(R
FU
)
WT (r = 0.22; P>0.05)KI (r = 0.75; P<0.001)
2.5 5.0 7.5 10.0 12.50
500
1000
1500
2000
HW/BW (mg/g)
Cas
pase
-like
activ
ity(R
FU
)
WT (r = 0.25; P>0.05)KO (r = 0.26; P>0.05)
2.5 5.0 7.5 10.0 12.50
500
1000
1500
2000
HW/BW (mg/g)
Cas
pase
-like
activ
ity(R
FU
)
WT (r = 0.22; P>0.05)KI (r = 0.75; P<0.001)WT (r = 0.22; P>0.05)KI (r = 0.75; P<0.001)
2.5 5.0 7.5 10.0 12.50
500
1000
1500
2000
HW/BW (mg/g)
Cas
pase
-like
activ
ity(R
FU
)
WT (r = 0.25; P>0.05)KO (r = 0.26; P>0.05)WT (r = 0.25; P>0.05)KO (r = 0.26; P>0.05)
HW/BW (mg/g)2.5 5.0 7.5 10.0 12.50
500
1000
1500
2000
Try
psin
-like
activ
ity(R
FU
)
2.5 5.0 7.5 10.0 12.50
500
1000
1500
2000
HW/BW (mg/g)
Try
psin
-like
activ
ity(R
FU
)
WT (r = -0.002; P>0.05)KI (r = -0.03; P>0.05)
WT (r = 0.27; P<0.05)KO (r = 0.18; P>0.05)
HW/BW (mg/g)2.5 5.0 7.5 10.0 12.50
500
1000
1500
2000
Try
psin
-like
activ
ity(R
FU
)
2.5 5.0 7.5 10.0 12.50
500
1000
1500
2000
HW/BW (mg/g)
Try
psin
-like
activ
ity(R
FU
)
WT (r = -0.002; P>0.05)KI (r = -0.03; P>0.05)WT (r = -0.002; P>0.05)KI (r = -0.03; P>0.05)
WT (r = 0.27; P<0.05)KO (r = 0.18; P>0.05)WT (r = 0.27; P<0.05)KO (r = 0.18; P>0.05)
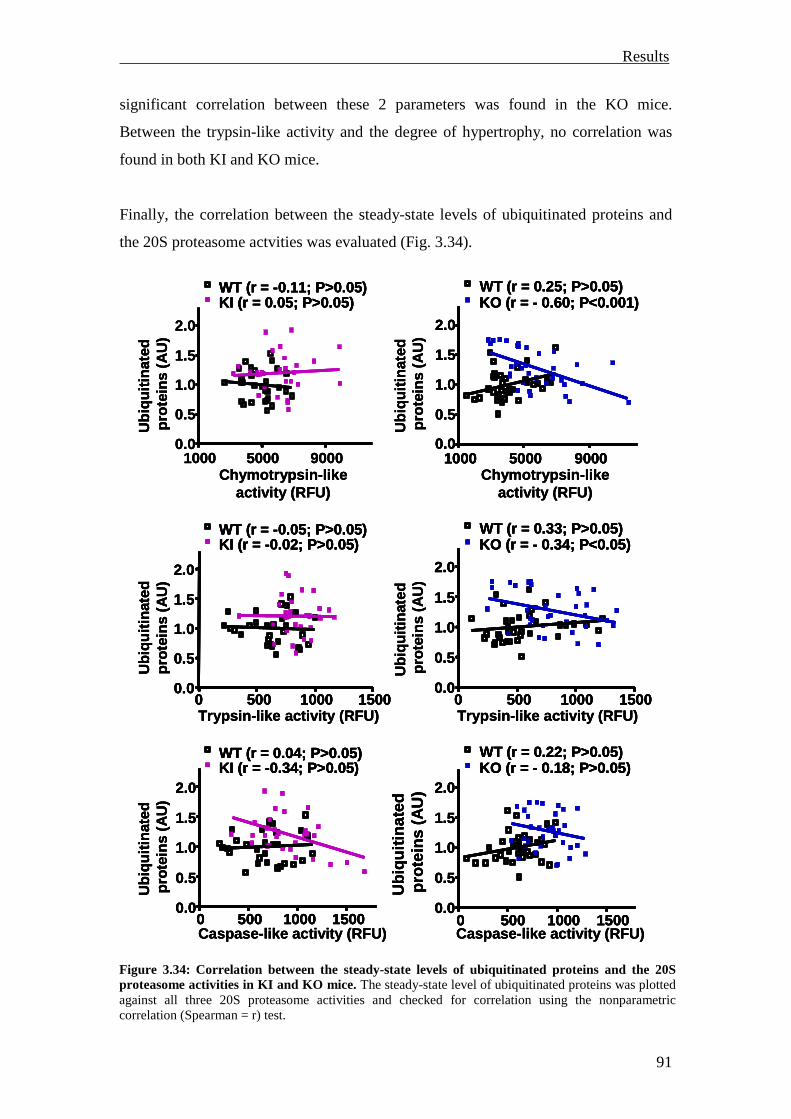
Results
91
significant correlation between these 2 parameters was found in the KO mice.
Between the trypsin-like activity and the degree of hypertrophy, no correlation was
found in both KI and KO mice.
Finally, the correlation between the steady-state levels of ubiquitinated proteins and
the 20S proteasome actvities was evaluated (Fig. 3.34).
Figure 3.34: Correlation between the steady-state levels of ubiquitinated proteins and the 20S proteasome activities in KI and KO mice. The steady-state level of ubiquitinated proteins was plotted against all three 20S proteasome activities and checked for correlation using the nonparametric correlation (Spearman = r) test.
WT (r = 0.25; P>0.05)KO (r = - 0.60; P<0.001)
1000 5000 90000.0
0.5
1.0
1.5
2.0
Chymotrypsin-likeactivity (RFU)
1000 5000 90000.0
0.5
1.0
1.5
2.0
Ubi
quiti
nate
dpr
otei
ns(A
U)
WT (r = -0.11; P>0.05)KI (r = 0.05; P>0.05)
Ubi
quiti
nate
dpr
otei
ns(A
U)
Chymotrypsin-likeactivity (RFU)
0 500 1000 15000.0
0.5
1.0
1.5
2.0
Trypsin-like activity (RFU)
Ubi
quiti
nate
dpr
otei
ns(A
U)
WT (r = 0.33; P>0.05)KO (r = - 0.34; P<0.05)
0 500 1000 15000.0
0.5
1.0
1.5
2.0
Trypsin-like activity (RFU)
Ubi
quiti
nate
dpr
otei
ns(A
U)
WT (r = -0.05; P>0.05)KI (r = -0.02; P>0.05)
0 500 1000 15000.0
0.5
1.0
1.5
2.0
Caspase-like activity (RFU)
Ubi
quiti
nate
dpr
otei
ns(A
U)
WT (r = 0.04; P>0.05)KI (r = -0.34; P>0.05)
0 500 1000 15000.0
0.5
1.0
1.5
2.0
Caspase-like activity (RFU)
Ubi
quiti
nate
dpr
otei
ns(A
U)
WT (r = 0.22; P>0.05)KO (r = - 0.18; P>0.05)
WT (r = 0.25; P>0.05)KO (r = - 0.60; P<0.001)
1000 5000 90000.0
0.5
1.0
1.5
2.0
Chymotrypsin-likeactivity (RFU)
1000 5000 90000.0
0.5
1.0
1.5
2.0
Ubi
quiti
nate
dpr
otei
ns(A
U)
WT (r = -0.11; P>0.05)KI (r = 0.05; P>0.05)
Ubi
quiti
nate
dpr
otei
ns(A
U)
Chymotrypsin-likeactivity (RFU)
WT (r = 0.25; P>0.05)KO (r = - 0.60; P<0.001)WT (r = 0.25; P>0.05)KO (r = - 0.60; P<0.001)
1000 5000 90000.0
0.5
1.0
1.5
2.0
1000 5000 90000.0
0.5
1.0
1.5
2.0
Chymotrypsin-likeactivity (RFU)
1000 5000 90000.0
0.5
1.0
1.5
2.0
Ubi
quiti
nate
dpr
otei
ns(A
U)
WT (r = -0.11; P>0.05)KI (r = 0.05; P>0.05)WT (r = -0.11; P>0.05)KI (r = 0.05; P>0.05)
Ubi
quiti
nate
dpr
otei
ns(A
U)
Chymotrypsin-likeactivity (RFU)
0 500 1000 15000.0
0.5
1.0
1.5
2.0
Trypsin-like activity (RFU)
Ubi
quiti
nate
dpr
otei
ns(A
U)
WT (r = 0.33; P>0.05)KO (r = - 0.34; P<0.05)
0 500 1000 15000.0
0.5
1.0
1.5
2.0
Trypsin-like activity (RFU)
Ubi
quiti
nate
dpr
otei
ns(A
U)
WT (r = -0.05; P>0.05)KI (r = -0.02; P>0.05)
0 500 1000 15000.0
0.5
1.0
1.5
2.0
0 500 1000 15000.0
0.5
1.0
1.5
2.0
Trypsin-like activity (RFU)
Ubi
quiti
nate
dpr
otei
ns(A
U)
WT (r = 0.33; P>0.05)KO (r = - 0.34; P<0.05)WT (r = 0.33; P>0.05)KO (r = - 0.34; P<0.05)
0 500 1000 15000.0
0.5
1.0
1.5
2.0
0 500 1000 15000.0
0.5
1.0
1.5
2.0
Trypsin-like activity (RFU)
Ubi
quiti
nate
dpr
otei
ns(A
U)
WT (r = -0.05; P>0.05)KI (r = -0.02; P>0.05)WT (r = -0.05; P>0.05)KI (r = -0.02; P>0.05)
0 500 1000 15000.0
0.5
1.0
1.5
2.0
Caspase-like activity (RFU)
Ubi
quiti
nate
dpr
otei
ns(A
U)
WT (r = 0.04; P>0.05)KI (r = -0.34; P>0.05)
0 500 1000 15000.0
0.5
1.0
1.5
2.0
Caspase-like activity (RFU)
Ubi
quiti
nate
dpr
otei
ns(A
U)
WT (r = 0.22; P>0.05)KO (r = - 0.18; P>0.05)
0 500 1000 15000.0
0.5
1.0
1.5
2.0
0 500 1000 15000.0
0.5
1.0
1.5
2.0
Caspase-like activity (RFU)
Ubi
quiti
nate
dpr
otei
ns(A
U)
WT (r = 0.04; P>0.05)KI (r = -0.34; P>0.05)WT (r = 0.04; P>0.05)KI (r = -0.34; P>0.05)
0 500 1000 15000.0
0.5
1.0
1.5
2.0
0 500 1000 15000.0
0.5
1.0
1.5
2.0
Caspase-like activity (RFU)
Ubi
quiti
nate
dpr
otei
ns(A
U)
WT (r = 0.22; P>0.05)KO (r = - 0.18; P>0.05)WT (r = 0.22; P>0.05)KO (r = - 0.18; P>0.05)
Results
92
As expected, no correlation was found between the steady-state level of ubiquitinated
proteins and all three 20S proteasome activities in the WT mice. Only in the KO mice,
the steady-state levels of ubiquitinated proteins correlated inversely with the
chymotrypsin-like and the trypsin-like activity, i.e. the steady-state levels of
ubiquitinated proteins were low, when the two activities were high or vice versa. No
correlation was found in the KI mice concerning these parameters. Between the
steady-state levels of ubiquitinated proteins and the caspase-like activity, no
correlation was observed in both KI and KO mice.
3.3.2 Investigation of the UPS reporter mouse models
Crossing mutant cMyBP-C mice with the so-called UPS reporter mice should provide
the opportunity to monitor the UPS function in vivo. Two different UPS reporter mice
were investigated: the UbG76V-GFP mice (Lindsten et al. 2003; see 2.1.1.4) and the
GFPdgn mice (Kumarapeli et al. 2005; see 2.1.1.5). Both mouse models ubiquitously
express a modified green fluorescent protein (GFP) that is constitutively targeted for
proteasomal degradation. This GFP reporter protein should be degraded at normal
UPS function. Administration of proteasome inhibitors should result in a substantial
accumulation of GFP, which could be investigated by Western blot or direct
fluorescence microscopy. Similarly, an impairment of the UPS by cMyBP-C mutants
should also lead to increased GFP levels. First, it was investigated whether the two
mouse models were suitable to monitor the UPS function in the heart.
3.3.2.1 Investigation of the UbG76V-GFP mouse model
Genotypes of transgenic UbG76V-GFP and corresponding WT mice were determined
by PCR from genomic tail DNA using primers, which were specific for the transgene.
PCR products were loaded on a 1% agarose gel (Fig. 3.35).
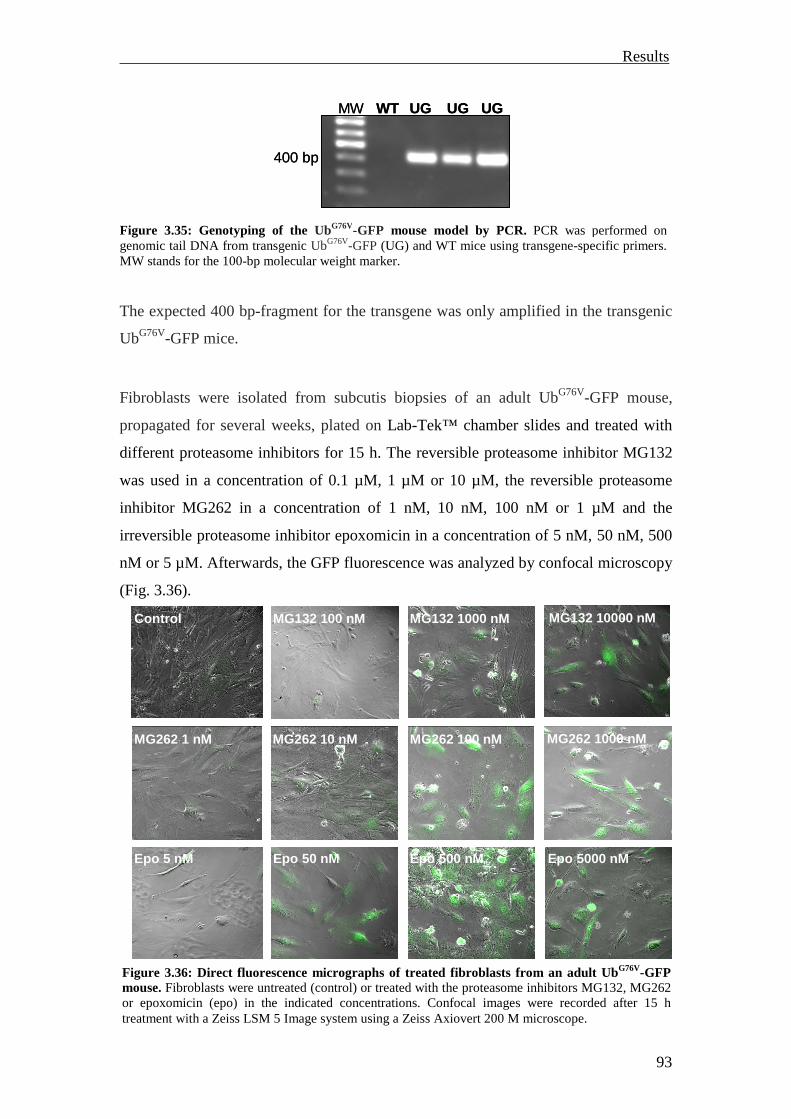
Results
93
The expected 400 bp-fragment for the transgene was only amplified in the transgenic
UbG76V-GFP mice.
Fibroblasts were isolated from subcutis biopsies of an adult UbG76V-GFP mouse,
propagated for several weeks, plated on Lab-Tek™ chamber slides and treated with
different proteasome inhibitors for 15 h. The reversible proteasome inhibitor MG132
was used in a concentration of 0.1 µM, 1 µM or 10 µM, the reversible proteasome
inhibitor MG262 in a concentration of 1 nM, 10 nM, 100 nM or 1 µM and the
irreversible proteasome inhibitor epoxomicin in a concentration of 5 nM, 50 nM, 500
nM or 5 µM. Afterwards, the GFP fluorescence was analyzed by confocal microscopy
(Fig. 3.36).
Figure 3.35: Genotyping of the UbG76V-GFP mouse model by PCR. PCR was performed on genomic tail DNA from transgenic UbG76V-GFP (UG) and WT mice using transgene-specific primers. MW stands for the 100-bp molecular weight marker.
Figure 3.36: Direct fluorescence micrographs of treated fibroblasts from an adult UbG76V-GFP mouse. Fibroblasts were untreated (control) or treated with the proteasome inhibitors MG132, MG262 or epoxomicin (epo) in the indicated concentrations. Confocal images were recorded after 15 h treatment with a Zeiss LSM 5 Image system using a Zeiss Axiovert 200 M microscope.
Control
Epo 5 nM
MG262 1 nM
MG132 100 nM
Epo 50 nM
MG262 10 nM
MG132 1000 nM
Epo 500 nM
MG262 100 nM
Epo 5000 nM
MG262 1000 nM
MG132 10000 nMControl
Epo 5 nMEpo 5 nM
MG262 1 nMMG262 1 nM
MG132 100 nM
Epo 50 nMEpo 50 nM
MG262 10 nMMG262 10 nM
MG132 1000 nM
Epo 500 nMEpo 500 nM
MG262 100 nMMG262 100 nM
Epo 5000 nMEpo 5000 nM
MG262 1000 nM
MG132 10000 nM
MW WT UG UG UG
400 bp
MW WT UG UG UG
400 bp
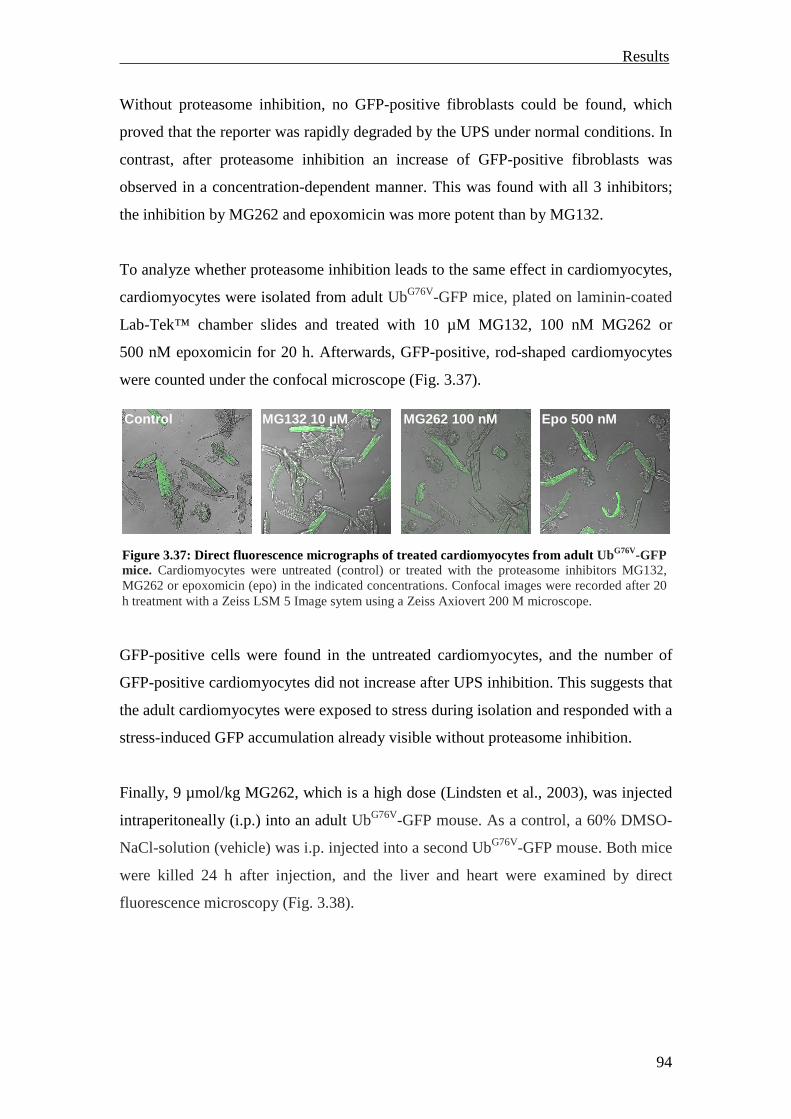
Results
94
Without proteasome inhibition, no GFP-positive fibroblasts could be found, which
proved that the reporter was rapidly degraded by the UPS under normal conditions. In
contrast, after proteasome inhibition an increase of GFP-positive fibroblasts was
observed in a concentration-dependent manner. This was found with all 3 inhibitors;
the inhibition by MG262 and epoxomicin was more potent than by MG132.
To analyze whether proteasome inhibition leads to the same effect in cardiomyocytes,
cardiomyocytes were isolated from adult UbG76V-GFP mice, plated on laminin-coated
Lab-Tek™ chamber slides and treated with 10 µM MG132, 100 nM MG262 or
500 nM epoxomicin for 20 h. Afterwards, GFP-positive, rod-shaped cardiomyocytes
were counted under the confocal microscope (Fig. 3.37).
GFP-positive cells were found in the untreated cardiomyocytes, and the number of
GFP-positive cardiomyocytes did not increase after UPS inhibition. This suggests that
the adult cardiomyocytes were exposed to stress during isolation and responded with a
stress-induced GFP accumulation already visible without proteasome inhibition.
Finally, 9 µmol/kg MG262, which is a high dose (Lindsten et al., 2003), was injected
intraperitoneally (i.p.) into an adult UbG76V-GFP mouse. As a control, a 60% DMSO-
NaCl-solution (vehicle) was i.p. injected into a second UbG76V-GFP mouse. Both mice
were killed 24 h after injection, and the liver and heart were examined by direct
fluorescence microscopy (Fig. 3.38).
Control MG132 10 µM MG262 100 nM Epo 500 nMControl MG132 10 µM MG262 100 nM Epo 500 nM
Figure 3.37: Direct fluorescence micrographs of treated cardiomyocytes from adult UbG76V-GFP mice. Cardiomyocytes were untreated (control) or treated with the proteasome inhibitors MG132, MG262 or epoxomicin (epo) in the indicated concentrations. Confocal images were recorded after 20 h treatment with a Zeiss LSM 5 Image sytem using a Zeiss Axiovert 200 M microscope.
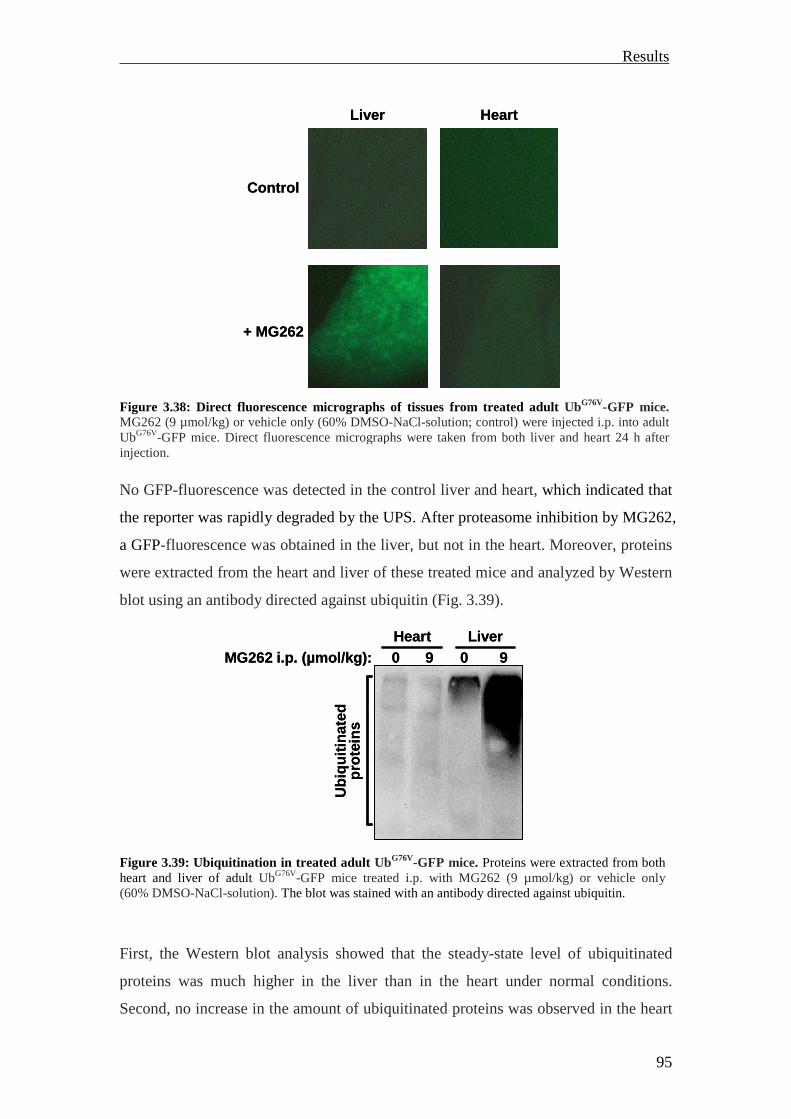
Results
95
No GFP-fluorescence was detected in the control liver and heart, which indicated that
the reporter was rapidly degraded by the UPS. After proteasome inhibition by MG262,
a GFP-fluorescence was obtained in the liver, but not in the heart. Moreover, proteins
were extracted from the heart and liver of these treated mice and analyzed by Western
blot using an antibody directed against ubiquitin (Fig. 3.39).
First, the Western blot analysis showed that the steady-state level of ubiquitinated
proteins was much higher in the liver than in the heart under normal conditions.
Second, no increase in the amount of ubiquitinated proteins was observed in the heart
Figure 3.38: Direct fluorescence micrographs of tissues from treated adult UbG76V-GFP mice. MG262 (9 µmol/kg) or vehicle only (60% DMSO-NaCl-solution; control) were injected i.p. into adult UbG76V-GFP mice. Direct fluorescence micrographs were taken from both liver and heart 24 h after injection.
Figure 3.39: Ubiquitination in treated adult UbG76V-GFP mice. Proteins were extracted from both heart and liver of adult UbG76V-GFP mice treated i.p. with MG262 (9 µmol/kg) or vehicle only (60% DMSO-NaCl-solution). The blot was stained with an antibody directed against ubiquitin.
+ MG262
HeartLiver
Control
+ MG262
HeartLiver
Control
MG262 i.p. (µmol/kg): 0 09 9Heart Liver
Ubi
quiti
nate
dpr
otei
ns
MG262 i.p. (µmol/kg): 0 09 9Heart Liver
Ubi
quiti
nate
dpr
otei
ns
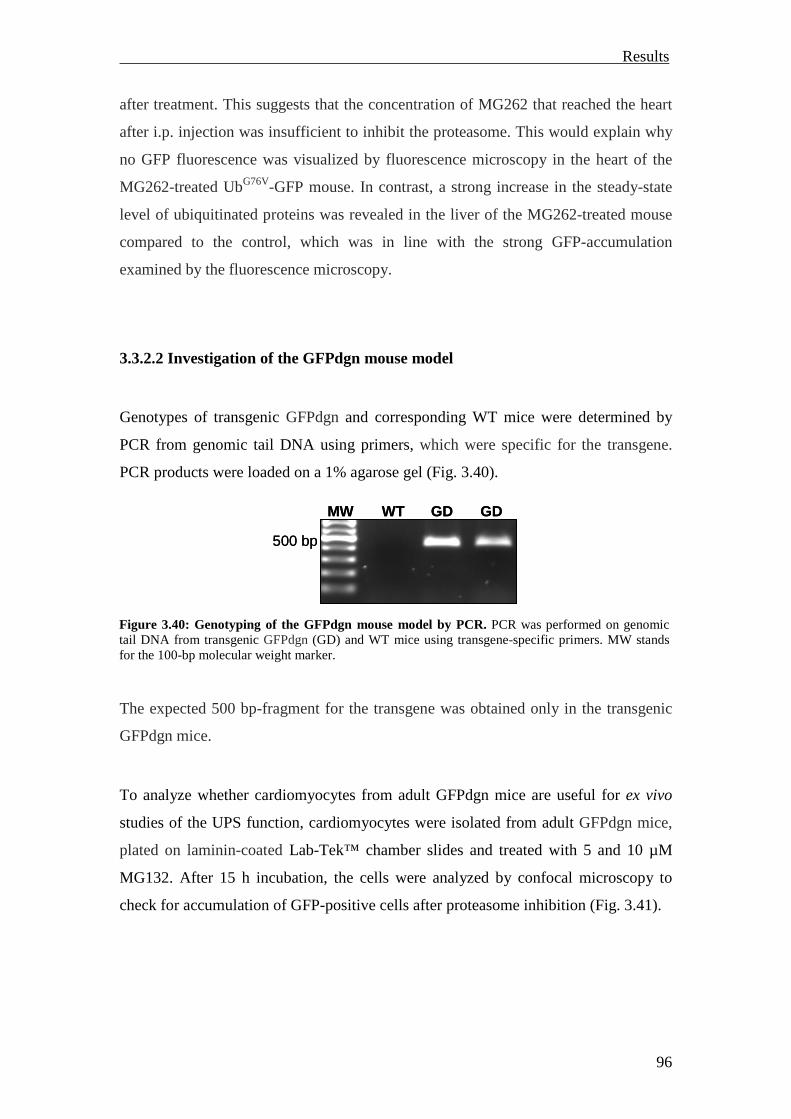
Results
96
after treatment. This suggests that the concentration of MG262 that reached the heart
after i.p. injection was insufficient to inhibit the proteasome. This would explain why
no GFP fluorescence was visualized by fluorescence microscopy in the heart of the
MG262-treated UbG76V-GFP mouse. In contrast, a strong increase in the steady-state
level of ubiquitinated proteins was revealed in the liver of the MG262-treated mouse
compared to the control, which was in line with the strong GFP-accumulation
examined by the fluorescence microscopy.
3.3.2.2 Investigation of the GFPdgn mouse model
Genotypes of transgenic GFPdgn and corresponding WT mice were determined by
PCR from genomic tail DNA using primers, which were specific for the transgene.
PCR products were loaded on a 1% agarose gel (Fig. 3.40).
The expected 500 bp-fragment for the transgene was obtained only in the transgenic
GFPdgn mice.
To analyze whether cardiomyocytes from adult GFPdgn mice are useful for ex vivo
studies of the UPS function, cardiomyocytes were isolated from adult GFPdgn mice,
plated on laminin-coated Lab-Tek™ chamber slides and treated with 5 and 10 µM
MG132. After 15 h incubation, the cells were analyzed by confocal microscopy to
check for accumulation of GFP-positive cells after proteasome inhibition (Fig. 3.41).
Figure 3.40: Genotyping of the GFPdgn mouse model by PCR. PCR was performed on genomic tail DNA from transgenic GFPdgn (GD) and WT mice using transgene-specific primers. MW stands for the 100-bp molecular weight marker.
MW WT GD GD
500 bp
MW WT GD GD
500 bp
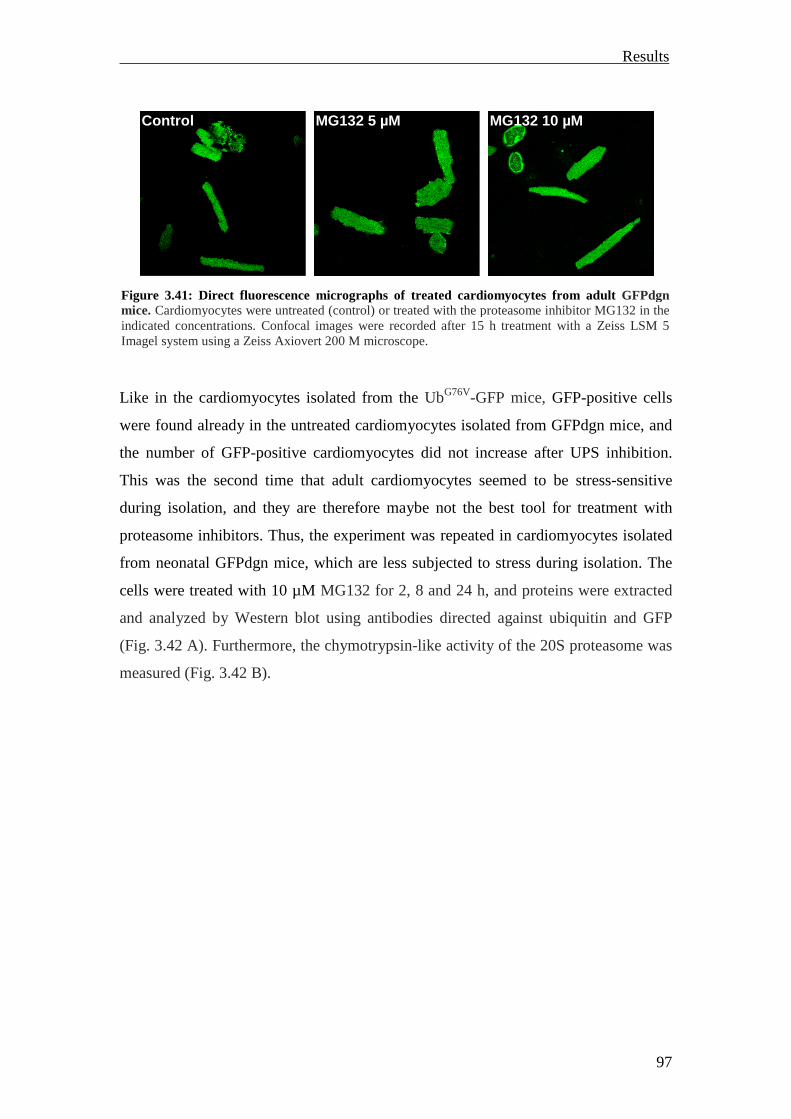
Results
97
Like in the cardiomyocytes isolated from the UbG76V-GFP mice, GFP-positive cells
were found already in the untreated cardiomyocytes isolated from GFPdgn mice, and
the number of GFP-positive cardiomyocytes did not increase after UPS inhibition.
This was the second time that adult cardiomyocytes seemed to be stress-sensitive
during isolation, and they are therefore maybe not the best tool for treatment with
proteasome inhibitors. Thus, the experiment was repeated in cardiomyocytes isolated
from neonatal GFPdgn mice, which are less subjected to stress during isolation. The
cells were treated with 10 µM MG132 for 2, 8 and 24 h, and proteins were extracted
and analyzed by Western blot using antibodies directed against ubiquitin and GFP
(Fig. 3.42 A). Furthermore, the chymotrypsin-like activity of the 20S proteasome was
measured (Fig. 3.42 B).
Figure 3.41: Direct fluorescence micrographs of treated cardiomyocytes from adult GFPdgn mice. Cardiomyocytes were untreated (control) or treated with the proteasome inhibitor MG132 in the indicated concentrations. Confocal images were recorded after 15 h treatment with a Zeiss LSM 5 Imagel system using a Zeiss Axiovert 200 M microscope.
Control MG132 5 µM MG132 10 µMControl MG132 5 µM MG132 10 µM
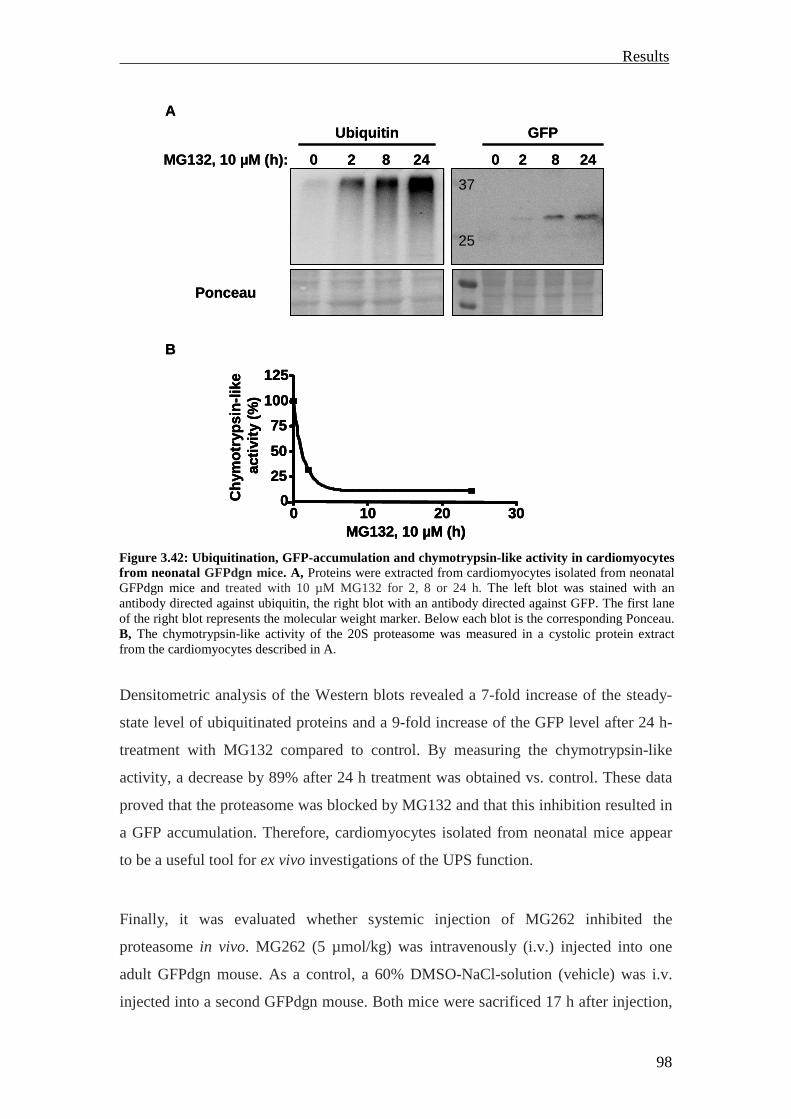
Results
98
Densitometric analysis of the Western blots revealed a 7-fold increase of the steady-
state level of ubiquitinated proteins and a 9-fold increase of the GFP level after 24 h-
treatment with MG132 compared to control. By measuring the chymotrypsin-like
activity, a decrease by 89% after 24 h treatment was obtained vs. control. These data
proved that the proteasome was blocked by MG132 and that this inhibition resulted in
a GFP accumulation. Therefore, cardiomyocytes isolated from neonatal mice appear
to be a useful tool for ex vivo investigations of the UPS function.
Finally, it was evaluated whether systemic injection of MG262 inhibited the
proteasome in vivo. MG262 (5 µmol/kg) was intravenously (i.v.) injected into one
adult GFPdgn mouse. As a control, a 60% DMSO-NaCl-solution (vehicle) was i.v.
injected into a second GFPdgn mouse. Both mice were sacrificed 17 h after injection,
Figure 3.42: Ubiquitination, GFP-accumulation and chymotrypsin-like activity in cardiomyocytes from neonatal GFPdgn mice. A, Proteins were extracted from cardiomyocytes isolated from neonatal GFPdgn mice and treated with 10 µM MG132 for 2, 8 or 24 h. The left blot was stained with an antibody directed against ubiquitin, the right blot with an antibody directed against GFP. The first lane of the right blot represents the molecular weight marker. Below each blot is the corresponding Ponceau. B, The chymotrypsin-like activity of the 20S proteasome was measured in a cystolic protein extract from the cardiomyocytes described in A.
25
37
GFP
B
MG132, 10 µM (h)
Chy
mot
ryps
in-li
keac
tivity
(%
)
0 10 20 300
25
50
75
100
125
MG132, 10 µM (h):
A
Ponceau
0 2 8 24 0 2 8 24
Ubiquitin
25
37
25
37
GFP
B
MG132, 10 µM (h)
Chy
mot
ryps
in-li
keac
tivity
(%
)
0 10 20 300
25
50
75
100
125
MG132, 10 µM (h)
Chy
mot
ryps
in-li
keac
tivity
(%
)
0 10 20 300
25
50
75
100
125
MG132, 10 µM (h):
A
Ponceau
0 2 8 24 0 2 8 24
Ubiquitin
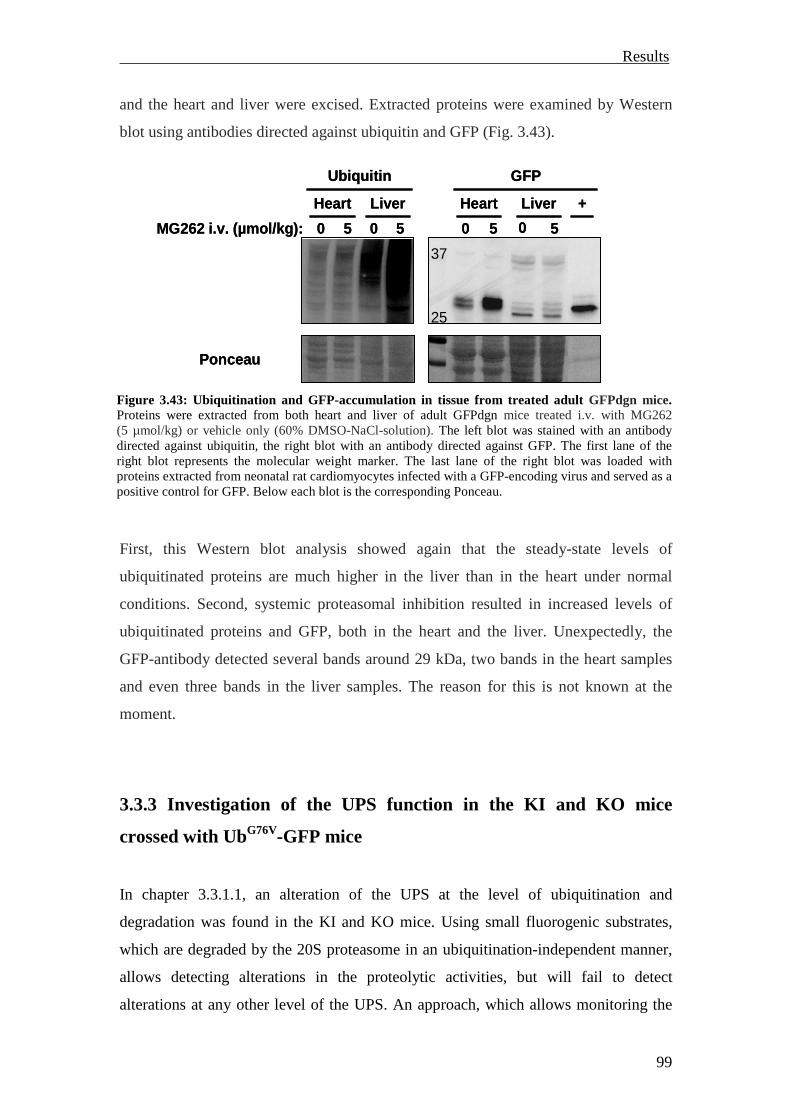
Results
99
and the heart and liver were excised. Extracted proteins were examined by Western
blot using antibodies directed against ubiquitin and GFP (Fig. 3.43).
First, this Western blot analysis showed again that the steady-state levels of
ubiquitinated proteins are much higher in the liver than in the heart under normal
conditions. Second, systemic proteasomal inhibition resulted in increased levels of
ubiquitinated proteins and GFP, both in the heart and the liver. Unexpectedly, the
GFP-antibody detected several bands around 29 kDa, two bands in the heart samples
and even three bands in the liver samples. The reason for this is not known at the
moment.
3.3.3 Investigation of the UPS function in the KI and KO mice
crossed with UbG76V-GFP mice
In chapter 3.3.1.1, an alteration of the UPS at the level of ubiquitination and
degradation was found in the KI and KO mice. Using small fluorogenic substrates,
which are degraded by the 20S proteasome in an ubiquitination-independent manner,
allows detecting alterations in the proteolytic activities, but will fail to detect
alterations at any other level of the UPS. An approach, which allows monitoring the
Figure 3.43: Ubiquitination and GFP-accumulation in tissue from treated adult GFPdgn mice. Proteins were extracted from both heart and liver of adult GFPdgn mice treated i.v. with MG262 (5 µmol/kg) or vehicle only (60% DMSO-NaCl-solution). The left blot was stained with an antibody directed against ubiquitin, the right blot with an antibody directed against GFP. The first lane of the right blot represents the molecular weight marker. The last lane of the right blot was loaded with proteins extracted from neonatal rat cardiomyocytes infected with a GFP-encoding virus and served as a positive control for GFP. Below each blot is the corresponding Ponceau.
MG262 i.v. (µmol/kg):
GFP
+
0 05 5
Heart Liver
Ponceau
0
0
5 5
Heart Liver
37
25
Ubiquitin
MG262 i.v. (µmol/kg):
GFP
+
0 05 5
Heart Liver
Ponceau
0
0
5 5
Heart Liver
37
25
Ubiquitin
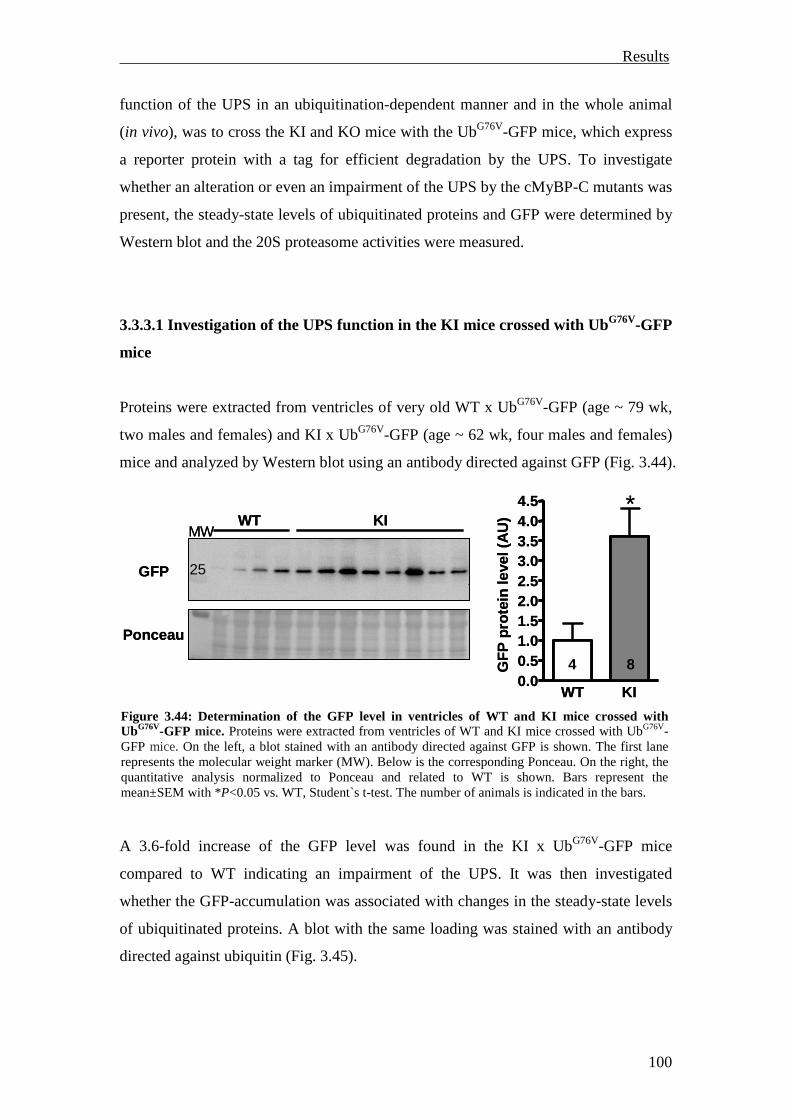
Results
100
function of the UPS in an ubiquitination-dependent manner and in the whole animal
(in vivo), was to cross the KI and KO mice with the UbG76V-GFP mice, which express
a reporter protein with a tag for efficient degradation by the UPS. To investigate
whether an alteration or even an impairment of the UPS by the cMyBP-C mutants was
present, the steady-state levels of ubiquitinated proteins and GFP were determined by
Western blot and the 20S proteasome activities were measured.
3.3.3.1 Investigation of the UPS function in the KI mice crossed with UbG76V-GFP
mice
Proteins were extracted from ventricles of very old WT x UbG76V-GFP (age ~ 79 wk,
two males and females) and KI x UbG76V-GFP (age ~ 62 wk, four males and females)
mice and analyzed by Western blot using an antibody directed against GFP (Fig. 3.44).
A 3.6-fold increase of the GFP level was found in the KI x UbG76V-GFP mice
compared to WT indicating an impairment of the UPS. It was then investigated
whether the GFP-accumulation was associated with changes in the steady-state levels
of ubiquitinated proteins. A blot with the same loading was stained with an antibody
directed against ubiquitin (Fig. 3.45).
Figure 3.44: Determination of the GFP level in ventricles of WT and KI mice crossed with UbG76V-GFP mice. Proteins were extracted from ventricles of WT and KI mice crossed with UbG76V-GFP mice. On the left, a blot stained with an antibody directed against GFP is shown. The first lane represents the molecular weight marker (MW). Below is the corresponding Ponceau. On the right, the quantitative analysis normalized to Ponceau and related to WT is shown. Bars represent the mean±SEM with *P<0.05 vs. WT, Student`s t-test. The number of animals is indicated in the bars.
WT KI
GFP
Ponceau
25
WT KI0.00.51.01.52.02.53.03.54.04.5
4 8
*G
FP
pro
tein
leve
l(A
U)MW
WT KI
GFP
Ponceau
25
WT KI0.00.51.01.52.02.53.03.54.04.5
4 8
*G
FP
pro
tein
leve
l(A
U)MW
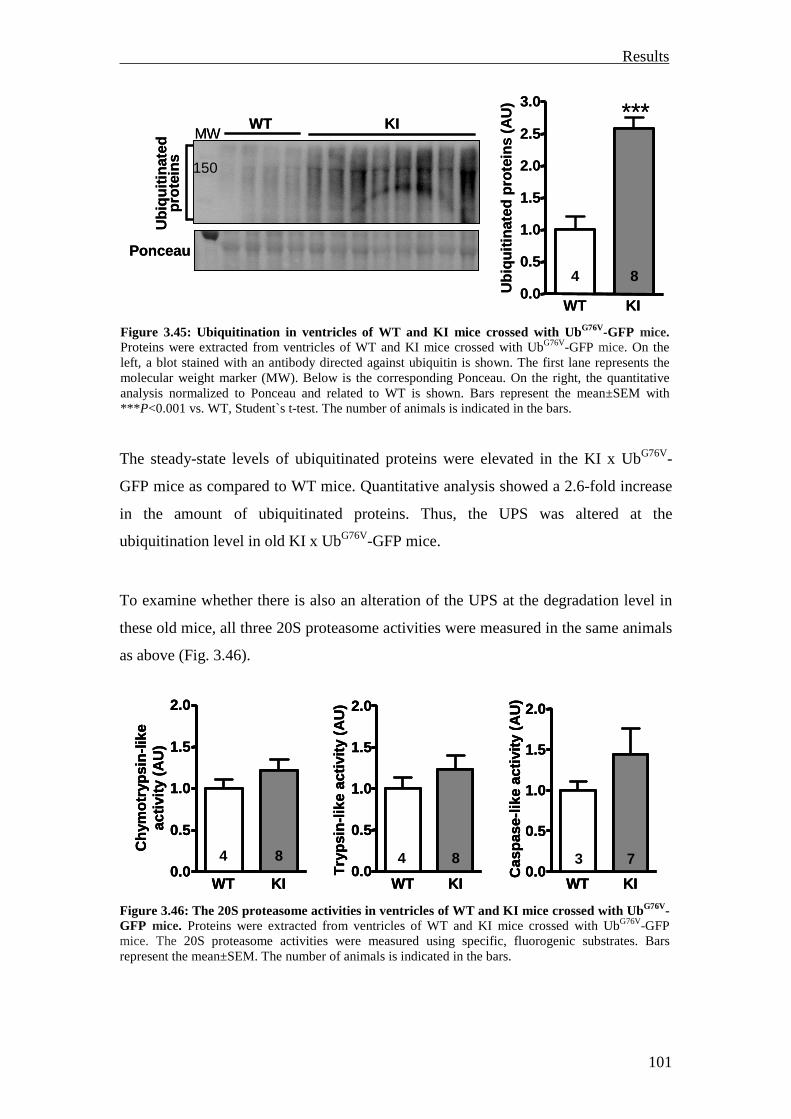
Results
101
The steady-state levels of ubiquitinated proteins were elevated in the KI x UbG76V-
GFP mice as compared to WT mice. Quantitative analysis showed a 2.6-fold increase
in the amount of ubiquitinated proteins. Thus, the UPS was altered at the
ubiquitination level in old KI x UbG76V-GFP mice.
To examine whether there is also an alteration of the UPS at the degradation level in
these old mice, all three 20S proteasome activities were measured in the same animals
as above (Fig. 3.46).
Figure 3.46: The 20S proteasome activities in ventricles of WT and KI mice crossed with UbG76V-GFP mice. Proteins were extracted from ventricles of WT and KI mice crossed with UbG76V-GFP mice. The 20S proteasome activities were measured using specific, fluorogenic substrates. Bars represent the mean±SEM. The number of animals is indicated in the bars.
Figure 3.45: Ubiquitination in ventricles of WT and KI mice crossed with UbG76V-GFP mice. Proteins were extracted from ventricles of WT and KI mice crossed with UbG76V-GFP mice. On the left, a blot stained with an antibody directed against ubiquitin is shown. The first lane represents the molecular weight marker (MW). Below is the corresponding Ponceau. On the right, the quantitative analysis normalized to Ponceau and related to WT is shown. Bars represent the mean±SEM with *** P<0.001 vs. WT, Student`s t-test. The number of animals is indicated in the bars.
WT KI
Ponceau
WT KI0.0
0.5
1.0
1.5
2.0
2.5
3.0
4 8
***
Ubi
quiti
nate
dpr
otei
ns(A
U)
MW
Ubi
quiti
nate
dpr
otei
ns 150
WT KI
Ponceau
WT KI0.0
0.5
1.0
1.5
2.0
2.5
3.0
4 8
***
Ubi
quiti
nate
dpr
otei
ns(A
U)
MW
Ubi
quiti
nate
dpr
otei
ns 150
WT KI0.0
0.5
1.0
1.5
2.0
4 8
Chy
mot
ryps
in-li
keac
tivity
(AU
)
WT KI0.0
0.5
1.0
1.5
2.0
4 8
Try
psin
-like
activ
ity(A
U)
WT KI0.0
0.5
1.0
1.5
2.0
3 7
Cas
pase
-like
activ
ity(A
U)
WT KI0.0
0.5
1.0
1.5
2.0
4 8
Chy
mot
ryps
in-li
keac
tivity
(AU
)
WT KI0.0
0.5
1.0
1.5
2.0
4 8
Chy
mot
ryps
in-li
keac
tivity
(AU
)
WT KI0.0
0.5
1.0
1.5
2.0
4 8
Try
psin
-like
activ
ity(A
U)
WT KI0.0
0.5
1.0
1.5
2.0
4 8
Try
psin
-like
activ
ity(A
U)
WT KI0.0
0.5
1.0
1.5
2.0
3 7
Cas
pase
-like
activ
ity(A
U)
WT KI0.0
0.5
1.0
1.5
2.0
3 7
Cas
pase
-like
activ
ity(A
U)
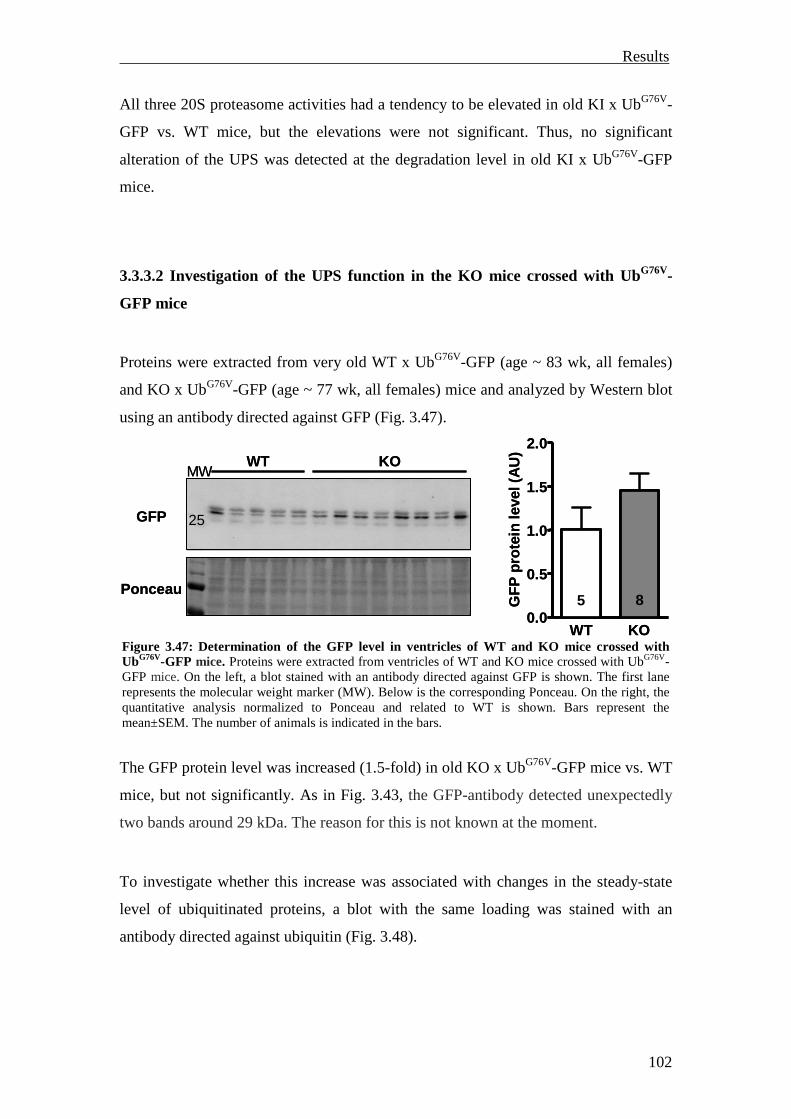
Results
102
All three 20S proteasome activities had a tendency to be elevated in old KI x UbG76V-
GFP vs. WT mice, but the elevations were not significant. Thus, no significant
alteration of the UPS was detected at the degradation level in old KI x UbG76V-GFP
mice.
3.3.3.2 Investigation of the UPS function in the KO mice crossed with UbG76V-
GFP mice
Proteins were extracted from very old WT x UbG76V-GFP (age ~ 83 wk, all females)
and KO x UbG76V-GFP (age ~ 77 wk, all females) mice and analyzed by Western blot
using an antibody directed against GFP (Fig. 3.47).
The GFP protein level was increased (1.5-fold) in old KO x UbG76V-GFP mice vs. WT
mice, but not significantly. As in Fig. 3.43, the GFP-antibody detected unexpectedly
two bands around 29 kDa. The reason for this is not known at the moment.
To investigate whether this increase was associated with changes in the steady-state
level of ubiquitinated proteins, a blot with the same loading was stained with an
antibody directed against ubiquitin (Fig. 3.48).
Figure 3.47: Determination of the GFP level in ventricles of WT and KO mice crossed with UbG76V-GFP mice. Proteins were extracted from ventricles of WT and KO mice crossed with UbG76V-GFP mice. On the left, a blot stained with an antibody directed against GFP is shown. The first lane represents the molecular weight marker (MW). Below is the corresponding Ponceau. On the right, the quantitative analysis normalized to Ponceau and related to WT is shown. Bars represent the mean±SEM. The number of animals is indicated in the bars.
MW25
WT KO
GFP
Ponceau
WT KO0.0
0.5
1.0
1.5
2.0
5 8GF
P p
rote
inle
vel(
AU
)
MW
MW2525
WT KO
GFP
Ponceau
WT KO0.0
0.5
1.0
1.5
2.0
5 8GF
P p
rote
inle
vel(
AU
)
MW
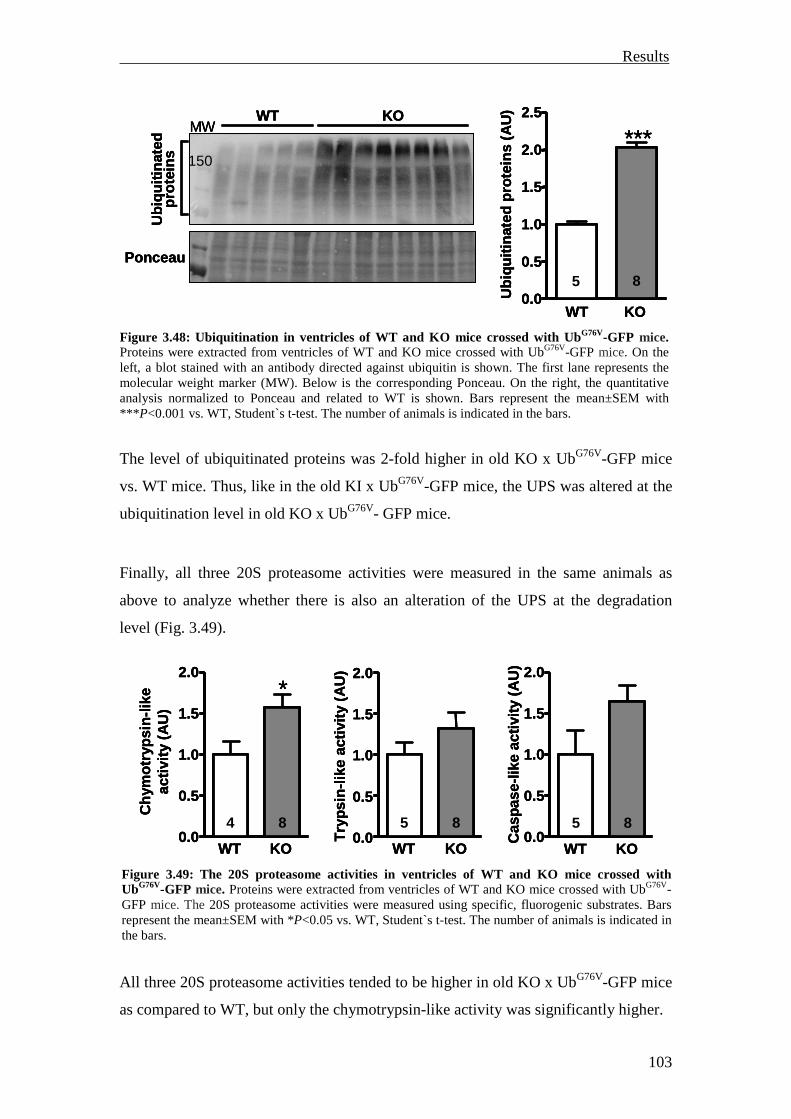
Results
103
The level of ubiquitinated proteins was 2-fold higher in old KO x UbG76V-GFP mice
vs. WT mice. Thus, like in the old KI x UbG76V-GFP mice, the UPS was altered at the
ubiquitination level in old KO x UbG76V- GFP mice.
Finally, all three 20S proteasome activities were measured in the same animals as
above to analyze whether there is also an alteration of the UPS at the degradation
level (Fig. 3.49).
All three 20S proteasome activities tended to be higher in old KO x UbG76V-GFP mice
as compared to WT, but only the chymotrypsin-like activity was significantly higher.
Figure 3.48: Ubiquitination in ventricles of WT and KO mice crossed with UbG76V-GFP mice. Proteins were extracted from ventricles of WT and KO mice crossed with UbG76V-GFP mice. On the left, a blot stained with an antibody directed against ubiquitin is shown. The first lane represents the molecular weight marker (MW). Below is the corresponding Ponceau. On the right, the quantitative analysis normalized to Ponceau and related to WT is shown. Bars represent the mean±SEM with *** P<0.001 vs. WT, Student`s t-test. The number of animals is indicated in the bars.
WT KO0.0
0.5
1.0
1.5
2.0
4 8
*
Chy
mot
ryps
in-li
keac
tivity
(AU
)
WT KO0.0
0.5
1.0
1.5
2.0
5 8
Try
psin
-like
activ
ity(A
U)
WT KO0.0
0.5
1.0
1.5
2.0
5 8
Cas
pase
-like
activ
ity(A
U)
WT KO0.0
0.5
1.0
1.5
2.0
4 8
*
Chy
mot
ryps
in-li
keac
tivity
(AU
)
WT KO0.0
0.5
1.0
1.5
2.0
4 8
*
Chy
mot
ryps
in-li
keac
tivity
(AU
)
WT KO0.0
0.5
1.0
1.5
2.0
5 8
Try
psin
-like
activ
ity(A
U)
WT KO0.0
0.5
1.0
1.5
2.0
5 8
Try
psin
-like
activ
ity(A
U)
WT KO0.0
0.5
1.0
1.5
2.0
5 8
Cas
pase
-like
activ
ity(A
U)
WT KO0.0
0.5
1.0
1.5
2.0
5 8
Cas
pase
-like
activ
ity(A
U)
Figure 3.49: The 20S proteasome activities in ventricles of WT and KO mice crossed with UbG76V-GFP mice. Proteins were extracted from ventricles of WT and KO mice crossed with UbG76V-GFP mice. The 20S proteasome activities were measured using specific, fluorogenic substrates. Bars represent the mean±SEM with *P<0.05 vs. WT, Student`s t-test. The number of animals is indicated in the bars.
WT KO
Ponceau
WT KO0.0
0.5
1.0
1.5
2.0
2.5
5 8
***
Ubi
quiti
nate
dpr
otei
ns(A
U)MW
Ubi
quiti
nate
dpr
otei
ns 150
WT KO
Ponceau
WT KO0.0
0.5
1.0
1.5
2.0
2.5
5 8
***
Ubi
quiti
nate
dpr
otei
ns(A
U)MW
Ubi
quiti
nate
dpr
otei
ns
WT KO
Ponceau
WT KO0.0
0.5
1.0
1.5
2.0
2.5
5 8
***
Ubi
quiti
nate
dpr
otei
ns(A
U)MW
Ubi
quiti
nate
dpr
otei
ns 150
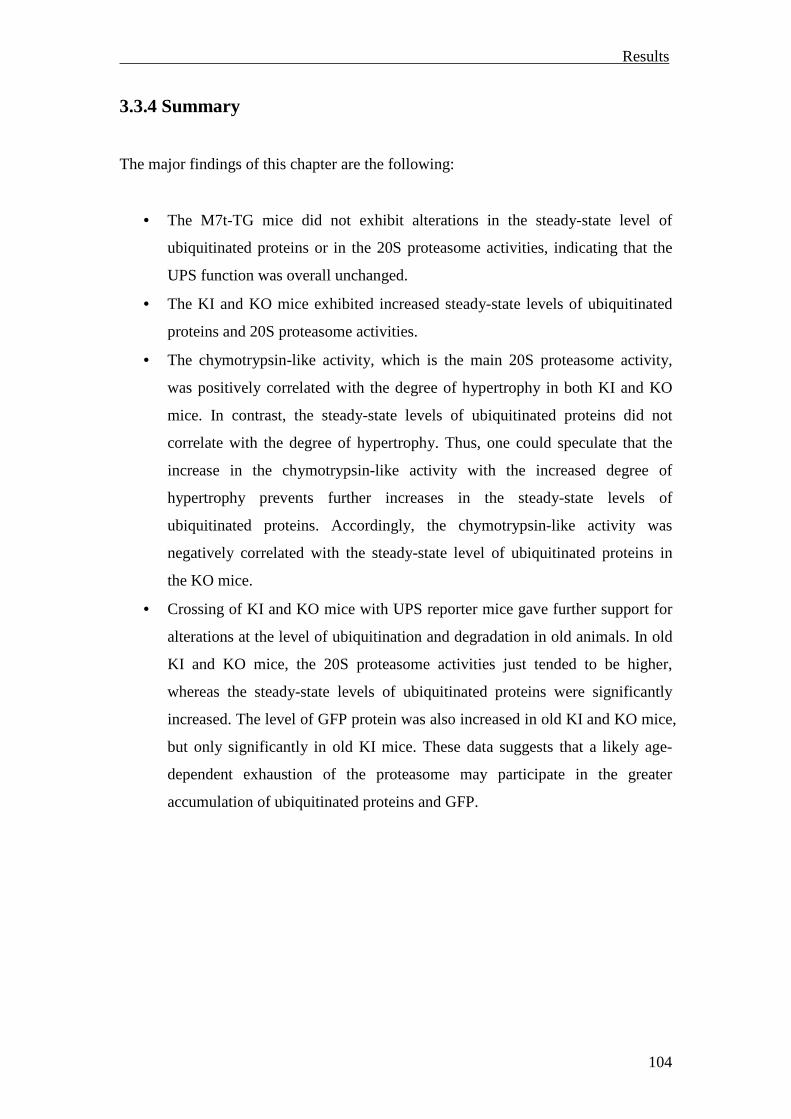
Results
104
3.3.4 Summary
The major findings of this chapter are the following:
• The M7t-TG mice did not exhibit alterations in the steady-state level of
ubiquitinated proteins or in the 20S proteasome activities, indicating that the
UPS function was overall unchanged.
• The KI and KO mice exhibited increased steady-state levels of ubiquitinated
proteins and 20S proteasome activities.
• The chymotrypsin-like activity, which is the main 20S proteasome activity,
was positively correlated with the degree of hypertrophy in both KI and KO
mice. In contrast, the steady-state levels of ubiquitinated proteins did not
correlate with the degree of hypertrophy. Thus, one could speculate that the
increase in the chymotrypsin-like activity with the increased degree of
hypertrophy prevents further increases in the steady-state levels of
ubiquitinated proteins. Accordingly, the chymotrypsin-like activity was
negatively correlated with the steady-state level of ubiquitinated proteins in
the KO mice.
• Crossing of KI and KO mice with UPS reporter mice gave further support for
alterations at the level of ubiquitination and degradation in old animals. In old
KI and KO mice, the 20S proteasome activities just tended to be higher,
whereas the steady-state levels of ubiquitinated proteins were significantly
increased. The level of GFP protein was also increased in old KI and KO mice,
but only significantly in old KI mice. These data suggests that a likely age-
dependent exhaustion of the proteasome may participate in the greater
accumulation of ubiquitinated proteins and GFP.
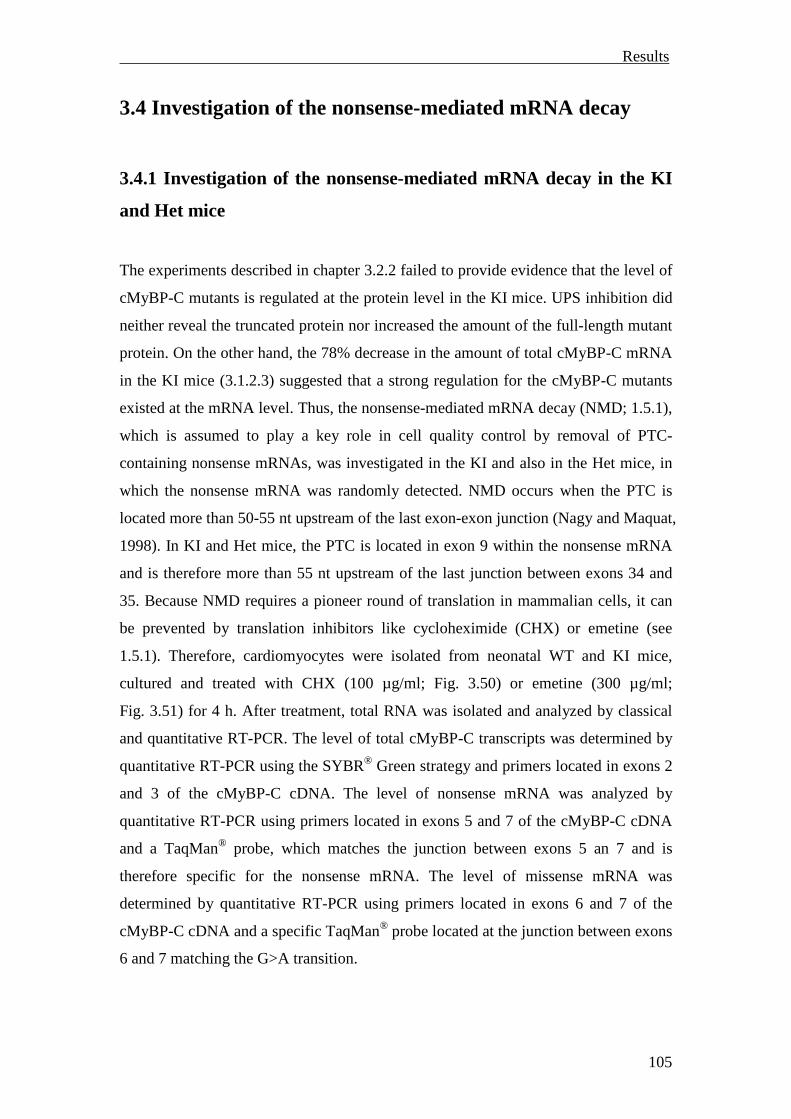
Results
105
3.4 Investigation of the nonsense-mediated mRNA decay
3.4.1 Investigation of the nonsense-mediated mRNA decay in the KI
and Het mice
The experiments described in chapter 3.2.2 failed to provide evidence that the level of
cMyBP-C mutants is regulated at the protein level in the KI mice. UPS inhibition did
neither reveal the truncated protein nor increased the amount of the full-length mutant
protein. On the other hand, the 78% decrease in the amount of total cMyBP-C mRNA
in the KI mice (3.1.2.3) suggested that a strong regulation for the cMyBP-C mutants
existed at the mRNA level. Thus, the nonsense-mediated mRNA decay (NMD; 1.5.1),
which is assumed to play a key role in cell quality control by removal of PTC-
containing nonsense mRNAs, was investigated in the KI and also in the Het mice, in
which the nonsense mRNA was randomly detected. NMD occurs when the PTC is
located more than 50-55 nt upstream of the last exon-exon junction (Nagy and Maquat,
1998). In KI and Het mice, the PTC is located in exon 9 within the nonsense mRNA
and is therefore more than 55 nt upstream of the last junction between exons 34 and
35. Because NMD requires a pioneer round of translation in mammalian cells, it can
be prevented by translation inhibitors like cycloheximide (CHX) or emetine (see
1.5.1). Therefore, cardiomyocytes were isolated from neonatal WT and KI mice,
cultured and treated with CHX (100 µg/ml; Fig. 3.50) or emetine (300 µg/ml;
Fig. 3.51) for 4 h. After treatment, total RNA was isolated and analyzed by classical
and quantitative RT-PCR. The level of total cMyBP-C transcripts was determined by
quantitative RT-PCR using the SYBR® Green strategy and primers located in exons 2
and 3 of the cMyBP-C cDNA. The level of nonsense mRNA was analyzed by
quantitative RT-PCR using primers located in exons 5 and 7 of the cMyBP-C cDNA
and a TaqMan® probe, which matches the junction between exons 5 an 7 and is
therefore specific for the nonsense mRNA. The level of missense mRNA was
determined by quantitative RT-PCR using primers located in exons 6 and 7 of the
cMyBP-C cDNA and a specific TaqMan® probe located at the junction between exons
6 and 7 matching the G>A transition.
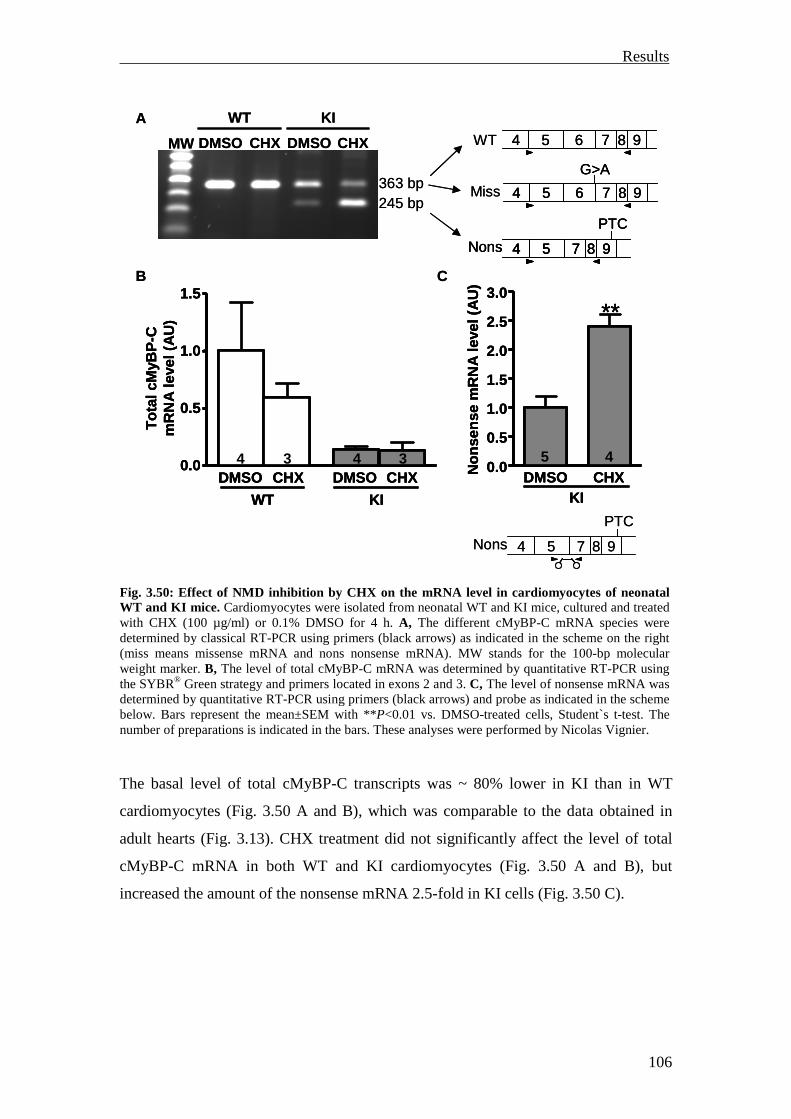
Results
106
The basal level of total cMyBP-C transcripts was ~ 80% lower in KI than in WT
cardiomyocytes (Fig. 3.50 A and B), which was comparable to the data obtained in
adult hearts (Fig. 3.13). CHX treatment did not significantly affect the level of total
cMyBP-C mRNA in both WT and KI cardiomyocytes (Fig. 3.50 A and B), but
increased the amount of the nonsense mRNA 2.5-fold in KI cells (Fig. 3.50 C).
Fig. 3.50: Effect of NMD inhibition by CHX on the mRNA level in cardiomyocytes of neonatal WT and KI mice. Cardiomyocytes were isolated from neonatal WT and KI mice, cultured and treated with CHX (100 µg/ml) or 0.1% DMSO for 4 h. A, The different cMyBP-C mRNA species were determined by classical RT-PCR using primers (black arrows) as indicated in the scheme on the right (miss means missense mRNA and nons nonsense mRNA). MW stands for the 100-bp molecular weight marker. B, The level of total cMyBP-C mRNA was determined by quantitative RT-PCR using the SYBR® Green strategy and primers located in exons 2 and 3. C, The level of nonsense mRNA was determined by quantitative RT-PCR using primers (black arrows) and probe as indicated in the scheme below. Bars represent the mean±SEM with **P<0.01 vs. DMSO-treated cells, Student`s t-test. The number of preparations is indicated in the bars. These analyses were performed by Nicolas Vignier.
A
DMSO CHX
WT KI
DMSO CHX
363 bp245 bp
WT 95 7 864
Miss
PTC
95 7 84Nons
95 7 864
G>A
MW
0.0
0.5
1.0
1.5
4 3 4 3
Tot
al c
MyB
P-C
mR
NA
leve
l(A
U)
DMSO DMSOCHX CHX
WT KI
B
0.0
0.5
1.0
1.5
2.0
2.5
3.0
5 4
**
Non
sens
em
RN
Ale
vel(
AU
)DMSO CHX
KI
C
PTC
95 7 84Nons
A
DMSO CHX
WT KI
DMSO CHX
363 bp245 bp
WT 95 7 864 95 7 864
Miss
PTC
95 7 84Nons
PTC
95 7 84 95 7 84Nons
95 7 864
G>A
95 7 864
G>A
MW
0.0
0.5
1.0
1.5
4 3 4 3
Tot
al c
MyB
P-C
mR
NA
leve
l(A
U)
DMSO DMSOCHX CHX
WT KI
0.0
0.5
1.0
1.5
4 3 4 3
Tot
al c
MyB
P-C
mR
NA
leve
l(A
U)
DMSO DMSOCHX CHX
WT KI
B
0.0
0.5
1.0
1.5
2.0
2.5
3.0
5 4
**
Non
sens
em
RN
Ale
vel(
AU
)DMSO CHX
KI
0.0
0.5
1.0
1.5
2.0
2.5
3.0
5 4
**
Non
sens
em
RN
Ale
vel(
AU
)DMSO CHX
KI
C
PTC
95 7 84Nons
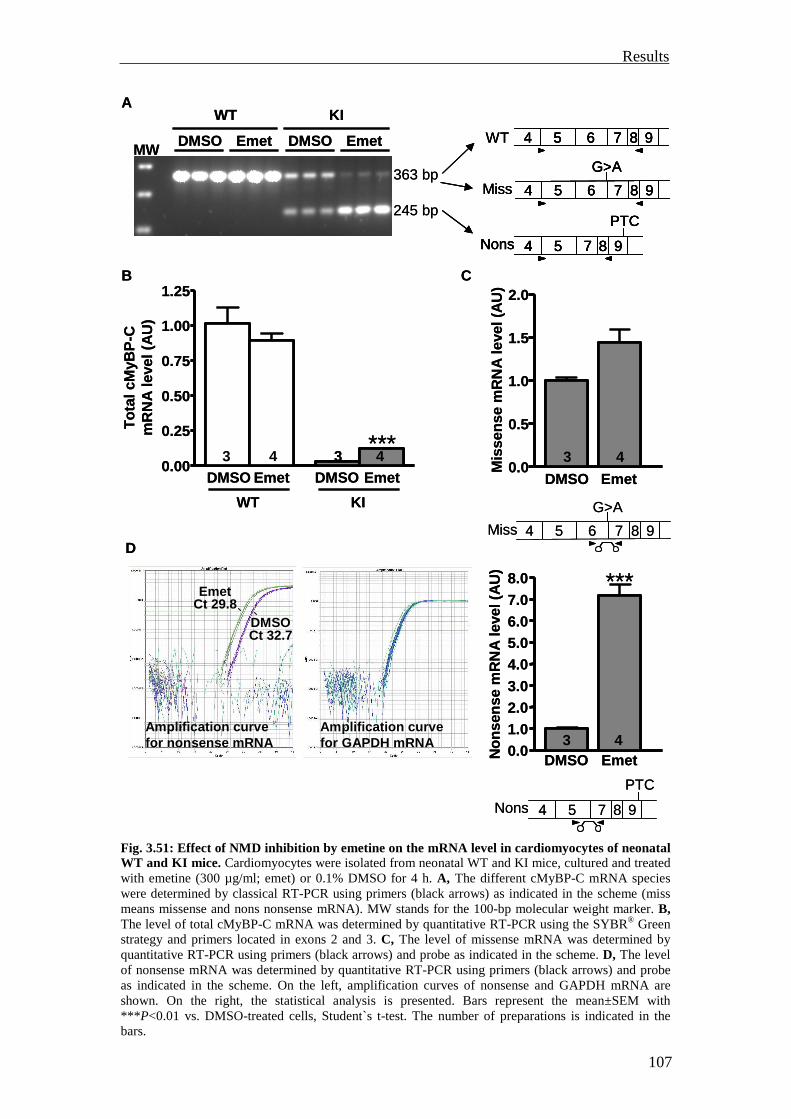
Results
107
Fig. 3.51: Effect of NMD inhibition by emetine on the mRNA level in cardiomyocytes of neonatal WT and KI mice. Cardiomyocytes were isolated from neonatal WT and KI mice, cultured and treated with emetine (300 µg/ml; emet) or 0.1% DMSO for 4 h. A, The different cMyBP-C mRNA species were determined by classical RT-PCR using primers (black arrows) as indicated in the scheme (miss means missense and nons nonsense mRNA). MW stands for the 100-bp molecular weight marker. B, The level of total cMyBP-C mRNA was determined by quantitative RT-PCR using the SYBR® Green strategy and primers located in exons 2 and 3. C, The level of missense mRNA was determined by quantitative RT-PCR using primers (black arrows) and probe as indicated in the scheme. D, The level of nonsense mRNA was determined by quantitative RT-PCR using primers (black arrows) and probe as indicated in the scheme. On the left, amplification curves of nonsense and GAPDH mRNA are shown. On the right, the statistical analysis is presented. Bars represent the mean±SEM with *** P<0.01 vs. DMSO-treated cells, Student`s t-test. The number of preparations is indicated in the bars.
B
DMSO
WT KIA
Emet DMSO EmetMW
363 bp
245 bp
WT 95 7 864
Miss
PTC
95 7 84Nons
95 7 864
G>A
0.00
0.25
0.50
0.75
1.00
1.25
***3 4 3 4
Tot
al c
MyB
P-C
mR
NA
leve
l(A
U)
WT KI
DMSO Emet DMSO Emet0.0
0.5
1.0
1.5
2.0
3 4
Mis
sens
em
RN
Ale
vel(
AU
)
C
DMSO Emet
Miss 95 7 864
G>A
D
EmetCt 29.8
DMSOCt 32.7
Amplification curvefor nonsense mRNA
Amplification curvefor GAPDH mRNA 0.0
1.02.03.04.05.06.07.08.0
3 4
***
Non
sens
em
RN
Ale
vel(
AU
)
PTC
95 7 84Nons
DMSO Emet
B
DMSO
WT KIA
Emet DMSO EmetMW
363 bp
245 bp
WT 95 7 864
Miss
PTC
95 7 84Nons
95 7 864
G>A
WT 95 7 864 95 7 864
Miss
PTC
95 7 84Nons
PTC
95 7 84 95 7 84Nons
95 7 864
G>A
95 7 864
G>A
0.00
0.25
0.50
0.75
1.00
1.25
***3 4 3 4
Tot
al c
MyB
P-C
mR
NA
leve
l(A
U)
WT KI
DMSO Emet DMSO Emet0.0
0.5
1.0
1.5
2.0
3 4
Mis
sens
em
RN
Ale
vel(
AU
)
C
DMSO Emet
Miss 95 7 864
G>A
D
EmetCt 29.8
DMSOCt 32.7
Amplification curvefor nonsense mRNA
Amplification curvefor GAPDH mRNA
EmetCt 29.8
DMSOCt 32.7
Amplification curvefor nonsense mRNA
Amplification curvefor GAPDH mRNA 0.0
1.02.03.04.05.06.07.08.0
3 4
***
Non
sens
em
RN
Ale
vel(
AU
)
PTC
95 7 84Nons
DMSO Emet
Results
108
Emetine did not change the level of total cMyBP-C mRNA in WT cells, but increased
the level of total cMyBP-C transcripts 4-fold in KI cells (Fig. 3.51 A and B).
Quantitative analysis of the nonsense mRNA level in KI cells revealed a 7-fold
increase after treatment with emetine as compared to DMSO (Fig. 3.51 D), whereas
the missense mRNA level was not significantly changed after treatment (Fig. 3.51 C).
Both CHX and emetine treatment seemed to decrease the missense mRNA level as
determined by the classical RT-PCR (Fig. 3.50 A and Fig. 3.51 A). However, this
effect was likely due to a competition in the PCR reaction, because the specific
TaqMan® assay showed that emetine rather increased the missense mRNA level than
decreased it (Fig. 3.51 C).
To analyze whether NMD is also involved in the degradation of the nonsense mRNA
in vivo, CHX (120 mg/kg) or DMSO were 4 times (once per hour) subcutaneously
injected in 3 WT, Het and KI mice. The animals were sacrificed 30 min after the last
injection. Total RNA was isolated from the ventricles and analyzed by qualitative and
quantitative RT-PCR (Fig. 3.52).
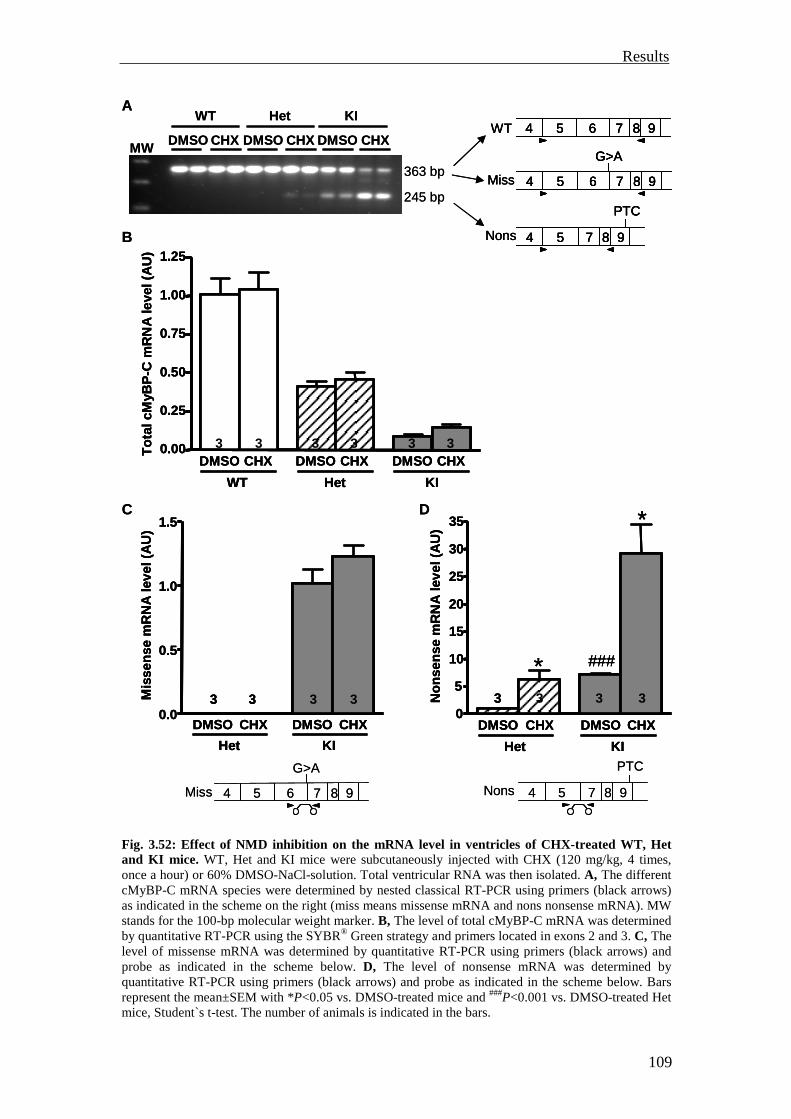
Results
109
Fig. 3.52: Effect of NMD inhibition on the mRNA level in ventricles of CHX-treated WT, Het and KI mice. WT, Het and KI mice were subcutaneously injected with CHX (120 mg/kg, 4 times, once a hour) or 60% DMSO-NaCl-solution. Total ventricular RNA was then isolated. A, The different cMyBP-C mRNA species were determined by nested classical RT-PCR using primers (black arrows) as indicated in the scheme on the right (miss means missense mRNA and nons nonsense mRNA). MW stands for the 100-bp molecular weight marker. B, The level of total cMyBP-C mRNA was determined by quantitative RT-PCR using the SYBR® Green strategy and primers located in exons 2 and 3. C, The level of missense mRNA was determined by quantitative RT-PCR using primers (black arrows) and probe as indicated in the scheme below. D, The level of nonsense mRNA was determined by quantitative RT-PCR using primers (black arrows) and probe as indicated in the scheme below. Bars represent the mean±SEM with *P<0.05 vs. DMSO-treated mice and ###P<0.001 vs. DMSO-treated Het mice, Student`s t-test. The number of animals is indicated in the bars.
DMSO CHX DMSO CHX DMSO CHX
WT KIHet
0.00
0.25
0.50
0.75
1.00
1.25
3 3 3 3 3 3
Tot
al c
MyB
P-C
mR
NA
leve
l(A
U)
DMSO CHX DMSO CHX DMSO CHX
WT Het KI
A
B
C D
363 bp
245 bp
WT
Miss
Nons
95 7 864
PTC
95 7 84
95 7 864
G>AMW
0
5
10
15
20
25
30
35
3 3 3 3
*
*
###
Non
sens
em
RN
Ale
vel(
AU
)
DMSO CHX
Het
DMSO CHX
KIPTC
95 7 84Nons
0.0
0.5
1.0
1.5
Mis
sens
em
RN
Ale
vel(
AU
)
3 3 3 3
DMSO CHX
Het
DMSO CHX
KI
Miss 95 7 864
G>A
DMSO CHX DMSO CHX DMSO CHX
WT KIHet
0.00
0.25
0.50
0.75
1.00
1.25
3 3 3 3 3 3
Tot
al c
MyB
P-C
mR
NA
leve
l(A
U)
DMSO CHX DMSO CHX DMSO CHX
WT Het KI
0.00
0.25
0.50
0.75
1.00
1.25
3 3 3 3 3 3
Tot
al c
MyB
P-C
mR
NA
leve
l(A
U)
DMSO CHX DMSO CHX DMSO CHX
WT Het KI
A
B
C D
363 bp
245 bp
WT
Miss
Nons
95 7 864
PTC
95 7 84
95 7 864
G>A
WT
Miss
Nons
95 7 864
PTC
95 7 84
95 7 864
G>A
95 7 864
PTC
95 7 84
95 7 864
G>AMW
0
5
10
15
20
25
30
35
3 3 3 3
*
*
###
Non
sens
em
RN
Ale
vel(
AU
)
DMSO CHX
Het
DMSO CHX
KI
0
5
10
15
20
25
30
35
3 3 3 3
*
*
###
Non
sens
em
RN
Ale
vel(
AU
)
DMSO CHX
Het
DMSO CHX
KIPTC
95 7 84Nons
0.0
0.5
1.0
1.5
Mis
sens
em
RN
Ale
vel(
AU
)
3 3 3 3
DMSO CHX
Het
DMSO CHX
KI
0.0
0.5
1.0
1.5
Mis
sens
em
RN
Ale
vel(
AU
)
3 3 3 3
DMSO CHX
Het
DMSO CHX
KI
Miss 95 7 864
G>A
Results
110
In vivo treatment with CHX did not significantly affect the level of total cMyBP-C
transcripts in the WT and Het mice, but induced a tendency towards an increase
(P=0.09) in the KI mice (Fig. 3.52 A and B). Quantitative analysis of the nonsense
mRNA level revealed a 4-fold increase in the KI and a 6-fold increase in the Het mice
after treatment with CHX as compared to the DMSO-treated mice (Fig. 3.52 D). Like
in cells, the level of the missense mRNA was not changed by CHX in the KI (Fig.
3.52 C). Surprisingly, the missense mRNA was not detectable in the Het mice by
TaqMan® analysis, which would suggest that its level was very low compared to the
WT mRNA (Fig. 3.52 C).
3.4.2 Summary
The major findings of this chapter are the following:
• NMD inhibition stabilized the nonsense mRNA level in cells and in vivo.
• The missense mRNA level was not changed by the treatment with NMD
inhibitors.
Thus, these data suggest that the low level of nonsense mRNA in cells and in vivo is
attributed to NMD in KI and Het mice.
Discussion
111
4 Discussion
The goal of this thesis was to investigate molecular mechanisms regulating the
expression of cMyBP-C mutants in FHC. Only two papers have analyzed so far the
consequences of cMyBP-C mutations in FHC-patients, and in both cases the truncated
cMyBP-C proteins were not detected although the aberrant mRNAs were present
(Rottbauer et al., 1997; Moolman et al., 2000). It has been recently shown by
adenoviral gene transfer of human mutant cDNAs in rat cardiomyocytes that truncated
cMyBP-C proteins were rapidly and quantitatively degraded by the UPS, which was
associated with an impairment of the proteolytic capacity of the UPS (Sarikas et al.,
2005). In addition, it was proposed that this impairment leads or contributes
subsequently to cardiac hypertrophy. The main question studied in this thesis was
whether truncated cMyBP-C proteins are also subject to degradation by the UPS in
vivo and whether this alters the function of the UPS. The analyses were performed in
two new targeted cMyBP-C mouse models: the M7t mouse model and the cMyBP-C
knock-in mouse model.
The transgenic M7t mouse model was generated to specifically express in the heart a
human truncated cMyBP-C. The Myc-M7t-cMyBP-C is deleted of exon 6 leading to a
premature termination codon in exon 9. The plasmid, which contains the sequence for
this transgene, was already used before by Sarikas et al. (2005) to create the
recombinant adenovirus expressing the Myc-M7t-cMyBP-C. Thus, the M7t mouse
model represents the appropriate in vivo model with regard to the ex vivo experiments
from Sarikas et al. (2005). But the transgenic M7t mouse model is of limited value for
directly comparing the consequences of FHC-causing mutations, because it is not
exactly mimicking the situation found in humans. FHC-patients are heterozygous for
the mutation, whereas the M7t-TG mice express the transgene in addition to two
healthy alleles. Therefore, to investigate the molecular mechanisms of FHC in a
genomic context as close to the human situation as possible, the cMyBP-C knock-in
mouse model was developed. This mouse model was generated by targeted knock-in
of the G>A transition on the last nucleotide of exon 6 and was expected to express the
missense and/or nonsense mRNA and the corresponding proteins.
Discussion
112
The expected 32-kDa truncated protein in both the M7t and the cMyBP-C knock-in
mouse model is not only lacking the titin and myosin binding sites but also the MyBP-
C motif, which contains the myosin subfragment 2 binding site and the three
phosphorylation sites. Previous interaction studies have shown that small cMyBP-C
mutants do not interact with β-MHC and suggested that in particular the C-terminal
domains are important for the correct localization of cMyBP-C in the sarcomere
(Gruen and Gautel, 1999; Flavigny et al., 2003). Thus, it was assumed that due to its
structural and functional deficits the truncated protein would be rapidly recognized
and degraded by the UPS in both the M7t and the cMyBP-C knock-in mouse model.
The fundamental assumptions for the M7t mouse model were the following: i) the
truncated protein is not or at a low level present under normal conditions due to its
rapid degradation by the UPS, ii) the truncated protein is detectable after UPS
inhibition, iii) impairment of the UPS occurs late in life and iv) cardiac hypertrophy
occurs late in life, possibly due to an impairment of the UPS.
The fundamental assumptions for the cMyBP-C knock-in mouse model were the
following: i) the missense as well as the nonsense (exon 6 skipped) mRNAs are
expressed, ii) the full-length E256K protein is present, but the truncated protein not or
only at a low level due to its rapid degradation by the UPS, iii) inhibition of the UPS
results in the detection of the truncated protein, iv) impairment of the UPS occurs
early in life in the KI and later in the Het mice and v) cardiac hypertrophy occurs
early in life in the KI and later in the Het mice.
Hypothesis 1: Truncated cMyBP-C proteins are rapidly and quantitatively
degraded by the UPS.
In the M7t-TG mice, the truncated protein was detected neither by Western blot nor
by immunofluorescence analysis, despite the presence of the transgene at mRNA level.
In the same way, the truncated protein was not detected in both the Het and KI mice.
These findings support the data obtained by adenoviral gene transfer of the Myc-M7t-
cMyBP-C cDNA in cardiomyocytes (Sarikas et al., 2005) and in human myocardial
tissue of FHC-patients with other frameshift mutations (Rottbauer et al., 1997;
Discussion
113
Moolman et al., 2000), in which the truncated cMyBP-C proteins were hardly or not
detected. Similar observations were also made in a transgenic mouse model
expressing a mutant cMyBP-C lacking the myosin binding site (MyBP-C.mut2-mice;
(Yang et al., 1999). Despite high expression levels of the transgene at the mRNA level
(1.5- to 5-fold of endogenous cMyBP-C), the level of the truncated MyBP-C.mut2
protein was very low.
In the Het and KI mice, a strong regulation of the cMyBP-C mutant levels was
observed already at the transcriptional level. The level of total cMyBP-C transcripts
was reduced by 52% and 78% in the Het and KI mice, respectively, compared to WT.
The level of nonsense mRNA was calculated to be ~7% (⅓ of 22%) in the KI mice
and therefore only low level of truncated protein could result. Similar levels of mutant
cMyBP-C transcripts as in the KI and Het mice were obtained in mice bearing a
neomycin resistance gene inserted in exon 30 of the MYBPC3 gene (McConnell et al.,
1999; McConnell et al., 2001). The insertion resulted in the skipping of exon 30 and
the production of a PTC. The level of cMyBP-C transcripts was reduced by 50% and
~86% in heterozygous cMyBP-Ct/+ (expressing mutant and WT mRNA) and
homozygous cMyBP-Ct/t (expressing only mutant mRNA) mice, respectively. In
contrast to the KI mice, the truncated (only 15 kDa smaller than full-length) protein
was detected in myofilament extracts in homozygous cMyBP-Ct/t mice and
represented 9.5% of the cMyBP-C amount found in WT mice (McConnell et al.,
1999). Interestingly, truncated cMyBP-C in total protein homogenates of cMyBP-Ct/t
mice was only 2.3% of the amount found in analogous WT extracts. Thus,
myofilament protein preparations should be analyzed in the KI mice to increase the
sensitivity and detect the truncated protein. But probably even this approach will fail
to detect the truncated protein in the KI mice. Since ~14% mutant transcripts lead to
~10% truncated protein in myofilament extracts of cMyBP-Ct/t mice, the ~7%
nonsense mRNA in the KI mice are expected to result in ~5% truncated protein in
myofilament extracts or even less, because it has also to be considered that the
truncated protein in the cMyBP-Ct/t mice is only 15 kDa smaller than the WT protein
and therefore expected to be more stable and functional than the truncated protein
resulting from the nonsense mRNA in the KI mice. In the Het mice, it will be even
more difficult to detect the truncated protein, because the nonsense mRNA is even
less expressed than in the KI mice.
Discussion
114
Taken together, both the data in the M7t and cMyBP-C knock-in mouse models are
compatible with the notion that truncated cMyBP-C proteins are rapidly degraded by
the UPS.
To analyze directly whether the UPS was indeed involved in the degradation of the
truncated protein, NMCM of M7t-TG and KI mice were isolated and treated with a
reversible or an irreversible proteasome inhibitor. It was expected that the proteasome
inhibtion resulted in the accumulation and detection of the truncated protein. But in
contrast to the study of Sarikas et al. (2005), this was not the case, despite the proof
for proteasome inhibition by the accumulation of ubiquitinated proteins. Thus, these
data failed to show evidence for a major UPS involvement in the degradation of
truncated proteins ex vivo.
The discrepancy to the cell culture data is maybe explainable by several facts. First, it
has to be noted that by adenoviral gene transfer in cardiomyocytes markedly higher
levels of mutant mRNAs are reachable than in transgenic mice for two reasons. First,
the CMV promoter is stronger than the α-MHC promoter used for the M7t-TG mice
or the endogenous cMyBP-C promoter. Second, adenoviral infection leads to several
copies of adeno-genomes in the infected cells. This becomes also clear by the fact that
the truncated proteins were detectable by Western blot in the adenovirally transfected
cardiomyocytes already without proteasome inhibition (Sarikas et al., 2005). In the
M7t-TG mice, the level of mutant mRNA was quite low when compared to the
adenoviral approach or even to the similar transgenic MyBP-C.mut2-mice. Related to
the considerations from above, it is not really surprising that the proteasome inhibition
in KI NMCM did not reveal the truncated protein in total protein extracts, because
even with proteasome inhibition the level of this protein was likely very low. A
second point is that the conditions, in which the experiments were performed, are
maybe not yet fully matured. For instance, the Western blot analysis was performed
on Triton X-100-extracts isolated from treated NMCM. In an attempt to increase
sensitivity, it could be helpful to analyze rather myofilament protein preparations like
it was done by McConnell et al. (1999) for the cMyBP-Ct/t mice and by Yang et al.
(1999) for the MyBP-C.mut2-mice. In addition, protein fractions from nuclear extract
and nuclear pellet should be analyzed, because a previous study showed that
proteasome inhibition could lead to translocation of proteins into specific subnuclear
Discussion
115
compartments (Sano et al., 2007). A third point, especially for the M7t-TG mice, is
that cardiomyocytes derived from neonatal mice may not be the optimal model to
study the involvement of the UPS. According to preliminary experiments with a
number of transgenic constructs, the group around Jeffrey Robbins found that 1-2 mo
is the earliest age, at which the maximal amount of transgenic protein is present in the
hearts (Yang et al., 1998). Thus, low expression levels will have further decreased the
sensitivity of the experiments performed in the neonatal M7t-Tg mice.
In contrast to the truncated protein, the full-length protein was detected in total protein
extracts of M7t-TG, Het and KI mice. The level of endogenous cMyBP-C protein was
not changed in the M7t-TG vs. WT mice, which was in line with the data obtained for
the MyBP-C.mut2-mice (Yang et al., 1999). In the Het (expressing wild-type and
E256K protein) and KI (expressing only E256K protein) mice, the level of full-length
cMyBP-C protein was reduced by 21% and 90%, respectively, compared to WT. Thus,
the estimated ~15% (⅔ of 22%) missense mRNA resulted in 10% full-length mutant
protein in total protein extracts of KI mice. In myofilament protein preparations, the
level of the E256K protein would be probably even higher. The E256K protein only
differs from the WT through one amino acid and therefore this protein is likely near-
normal and has not to be degraded by the proteasome.
In conclusion, these data failed to provide direct evidence that the UPS is involved in
the degradation of truncated cMyBP-C proteins, but they also did not provide
evidence against it. The results could indicate that the UPS only plays a role, when the
cell is overwhelmed with mutant cMyBP-C proteins as it was the case for the
adenoviral infection. Actually, the UPS remains the most likely involved system and
the performed analyses were just not sensitive enough to detect the truncated proteins.
Hypothesis 2: The degradation of the truncated proteins by the UPS is associated
with an impairment of this system.
Although the data failed to show evidence for an UPS involvement in the degradation
of the truncated protein, the UPS function was investigated in M7t-TG and KI mice to
analyze whether the UPS was altered by the presence of the truncated protein. In the
Discussion
116
M7t-TG mice, the UPS function was neither altered at the ubiquitination nor at the
degradation level. Thus, there was a discrepancy between these in vivo data and the ex
vivo data of Sarikas et al. (2005), who showed that the UPS function was impaired by
the truncated proteins. The discrepancy is likely again based on the strong difference
of the transgene expression at the mRNA level. By adenoviral gene transfer huge
amounts of mutant mRNA are reached that are translated in truncated proteins, which
in turn have to be degraded by the UPS. It is well conceivable that this finally leads to
exhaustion of this system and to accumulation and aggregate formation of the
truncated proteins. In contrast, there is a relatively low expression of the mutant
mRNA in the M7t-TG mice, and the UPS is apparently able to get completely rid of
the nascent truncated proteins. By measuring the chymotrypsin-like activity in 9-mo-
old M7t-TG mice a slight, but not significant increase was found vs. WT mice. This
could be a sign that there are indeed more proteins to be degraded in the M7t-TG mice,
namely the truncated ones, and this induces a compensatory increase in the
proteasome activity.
In KI mice, the UPS function was investigated from birth to 50 wk of age in
myocardial tissue. In the same way, KO mice, which served as a “negative control”
for cMyBP-C, were examined to analyze whether a potential UPS alteration is
cMyBP-C-dependent. The data provided evidence that the UPS was indeed altered at
the level of ubiquitination and degradation in both KI and KO mice. Several aspects
have to be pointed out. First, the proteolytic activities of the UPS were not impaired;
in contrast, all three activities were significantly increased up to the age of 50 wk. It
was originally expected that the truncated protein in the KI and Het mice is rapidly
and quantitatively degraded by the UPS, which in turn was expected to be associated
with an impairment of this system. But due to the strong regulation already at the
transcriptional level, only very low levels of truncated protein are being produced in
these mice. These low levels are likely not in a position to impair the proteasome.
However, the degradation pathway was activated in both KI and KO mice. Previous
studies showed both an increase (Depre et al., 2006) and a decrease (Tsukamoto et al.,
2006) in proteasome activity during cardiac hypertrophy in animal models, as well as
increases in gene expression of proteins regulating the UPS (Razeghi et al., 2006).
Discussion
117
Why, despite increased proteasome activities, the steady-state levels of ubiquitinated
proteins were still elevated in both KI and KO mice remains elusive. Using small
fluorogenic substrates, which are degraded by the 20S proteasome in a ubiquitination-
independent manner, allows to detect alterations in the proteolytic activities, but will
fail to detect alterations at any other level of the UPS such as availability of free
ubiquitin, polyubiquitination and recognition by the 19S subunit, which is responsible
for the deubiquitination, unfolding and channeling of the targeted proteins into the
20S core. For instance, the unfolding and channeling requires ATP. Thus, if an
excessive demand on the UPS proceeds with energy depletion, there is not enough
ATP for this step. Actually, HCM is known to be associated with myocardial energy
depletion: It was proposed that sarcomeric HCM mutations lead to an increased
energy demand owing to inefficient sarcomeric ATP utilization. This increased
demand compromises the capacity of the cardiomyocyte to maintain free energy
levels sufficient for contraction and critical homeostatic functions like the Ca2+ re-
uptake (Ashrafian et al., 2003). In a mouse model of intrasarcoplasmic amyloidosis,
which develops concentric cardiac hypertrophy with diastolic malfunction,
ubiquitinated proteins were progressively increased, whereby all three proteasomal
activities were significantly elevated like in the KI and KO mice (Chen et al., 2005).
The cause of proteasomal malfunction was an insufficient delivery of substrate
proteins into the 20S proteasome and depletion of key components of the 19S subunit.
Furthermore, in explanted hearts from patients with idiopathic dilated cardiomyopathy,
a downregulation of the deubiquitinating enzymes isopeptidase-T and ubiquitin-fusion
degradation system-1 (UFD-1) has been observed, which in conjunction with
unchanged proteasomal subunit levels and proteasomal activity resulted in massive
storage of ubiquitinated proteins and in autophagic cell death (Kostin et al., 2003).
They conclude that a disturbed balance between a high rate of ubiquitination and
inadequate degradation of ubiquitinated proteins may contribute to autophagic cell
death. Preliminary determination of the ubiquitin carboxyl-terminal hydrolase L1
(UCHL-1), a deubiquitinating enzyme, revealed a tendency to a decrease at
transcriptional level in 9 wk-old KI mice, but further analyses are needed. However,
accumulation of ubiquitinated proteins is a very common phenomenon in human
hearts with dilated or ischemic cardiomyopathies (Kostin et al., 2003; Weekes et al.,
2003) and in other diseases, such as neurodegenerative disorders (Ciechanover and
Brundin, 2003), cystic fibrosis or metabolic disorders (Golab et al., 2004). In addition,
Discussion
118
increased ubiquitin gene expression was obtained in dilated and ischemic human
failing hearts (Yang et al., 2000).
An approach, which allowed to monitor the degradation by the UPS in an
ubiquitination-dependent manner, was the crossbreeding between the KI and KO mice
and the UbG76V-GFP mice, which express a reporter protein with a tag for efficient
degradation by the UPS. As expected from the previous data, the steady-state levels of
ubiquitinated proteins were strongly increased in both the old KI (79 wk) and KO (83
wk) mice crossed with UbG76V-GFP mice compared to corresponding WT mice. Only
the chymotrypsin-like activity was still significantly elevated in the KO x UbG76V-
GFP mice, whereas the two other activities and in the KI x UbG76V-GFP mice all three
activities showed just a tendency to be elevated compared to corresponding WT mice.
It should be noted that the age of the examined crossed mice was much higher than 50
wk, which represented the last investigated time point from the previous study above.
Thus, the fact that the proteolytic activities were not highly elevated anymore could
indicate that the 20S proteasome is not anymore able to compensate for increased
demand in old age. It was reported that the proteasome activity is declining with age
and that the loss in proteasome activity during aging depends at least on three
different mechanisms: decreased overall proteasome content, alterations and/or
replacement of proteasome subunits and formation of inhibitory cross-linked proteins
(Carrard et al., 2002).
Examination of KI and KO mouse lines crossed with the UbG76V-GFP mouse line
gave the unique opportunity to determine the function of the UPS in a specific manner.
In contrast to the determination of steady-state levels of ubiquitinated proteins, which
monitors the balance between ubiquitination on the one hand and deubiquitination and
degradation on the other hand, the level of UbG76V-GFP protein indicates specifically
the degradation rate (Lindsten et al., 2003). This is because the UbG76V-GFP protein is
a direct target of the UPS, i.e. an accumulation of this protein indicates a problem in
its degradation. The GFP levels were 3.6-fold higher in the KI x UbG76V-GFP mice
and only 1.5-fold higher (n.s.) in the KO x UbG76V-GFP mice compared to
corresponding WT mice. This difference in GFP-increase could indicate a specific
defect in the KI mice. A likely reason is the presence of low level of mutant cMyBP-C,
which in addition to hypertrophic and other damaged proteins keeps the UPS more
Discussion
119
busy in these old mice. Interestingly, in a polyglutamine disease model crossed with
UbG76V-GFP mice, a significant increase in reporter protein was also observed late in
disease (Bowman et al., 2005). But the basis for this increase was explained by a
corresponding increase in UbG76V-GFP mRNA. An in vitro assay showed normal
(slightly increased) 20S activity, which confirmed that the increase in reporter protein
did not result from a reduction of proteasome activity. Thus, the expression of
UbG76V-GFP at transcriptional level should be determined in the old KI and KO mice
crossed with UbG76V-GFP mice.
In conclusion, the increases in 20S proteasome activities and in the steady-state level
of ubiquitinated proteins over the entire life span of both KI and KO mice provided
clear evidence that the UPS is altered in the hearts of both mouse lines. Most of these
alterations appear to be part of the general pathology related to the massive cardiac
hypertrophy present in both mouse strains and is in accordance with published data in
other animal models of cardiac hypertrophy. Whether the presence of truncated
cMyBP-C proteins or their respective transcripts play an own pathogenic role (the
initial hypothesis) remains to be further studied. Some evidence, however, supports
this notion. First, the chymotrypsin-like activity tended to be increased in 9-mo-old
M7t-TG mice (without any hypertrophy). Second, the expected negative correlation
between chymotrypsin-like activity and steady-state level of ubiquitinated proteins
was present in KO, but absent in KI mice. And finally, the increase in UbG76V-GFP
protein was much stronger (formally only present) in old KI crossed with the UbG76V-
GFP mice than in respective KO mice. Further analyses are needed to clarify this
question.
Hypothesis 3: UPS impairment leads or contributes subsequently to cardiac
hypertrophy.
It was originally expected that UPS impairment leads or contributes subsequently to
cardiac hypertrophy in the M7t-TG, Het and KI mice. Therefore, the cardiac
phenotype was investigated in these mice. By immunofluorescence analysis of M7t-
TG AMVM the classical alternation of endogenous cMyBP-C (A-band) and α-actinin
(Z-line) was obtained, which indicated a normal sarcomeric organization. In
Discussion
120
comparison, despite normal levels of endogenous cMyBP-C, significant changes in
the structure and ultrastructure of the heart were evident in the MyBP-C.mut2 mice
lacking the myosin binding site (Yang et al., 1999). These changes were likely caused
by the presence of the truncated protein, although it was expressed at a low level.
The M7t-TG mice also did not exhibit significant cardiac abnormalities when
analyzed by transthoracic echocardiography. Neither wall-thickening nor dilatation of
the left ventricle nor impaired cardiac function (determined by the FS) was found up
to the age of two years. A really striking observation was the decreased VW/BW
(-14%) in the M7t-TG mice at the age of 9 mo. The significance was caused by the
male mice, which exhibited a highly significant decrease of the VW/BW (-18%),
whereas the female mice just showed a tendency towards a decrease (-9%). The lower
VW/BW did not result from a higher BW in the M7t-TG mice, but indeed from a
lower VW. Interestingly, transgenic mice expressing a truncated cardiac troponin T
(cTnT) also exhibited a decreased HW/BW (-23%) vs. WT mice (Tardiff et al., 1998).
Full dissection of the heart and determination of the individual chamber weight-to-
BW-ratios in cTnT mice showed that the decrease in heart mass was restricted to the
left ventricle. Surprisingly, a small, but significant increase in atrial size was observed.
The decrease in cardiac mass was due to a primary loss of cardiomyocytes and a
decrease in cardiomyocyte cell size. These examinations were not performed in the
M7t-TG mice, but should be done in the future to identify the reason for the decreased
cardiac mass. Actually, nine independent founders were generated with the cTnT-
truncation construct, but only three of them expressed the transgene at the protein
level, and even then at low levels (<5%). Northern blot analysis showed that the
transgene was expressed at high mRNA levels. These findings are suggestive of UPS
involvement.
Immunofluorescence analysis of AMVM indicated a normal sarcomeric organization
in the KI mice. However, the KI mice exhibited myocyte and eccentric LV
hypertrophy with reduced FS and interstitial fibrosis at the age of 3 mo. The HW/BW
ratio was already increased at birth (data not shown). Similar results were obtained in
the cMyBP-Ct/t mice, which exhibited neonatal onset of a progressive dilated
cardiomyopathy with ventricular dysfunction, which continued throughout life and
was accompanied by progressive compensatory LV hypertrophy (McConnell et al.,
Discussion
121
1999). At 2-3 mo of age histological abnormalities including myocyte hypertrophy,
myofibrillar disarray, interstitial fibrosis and dystrophic calcification were observed in
the cMyBP-Ct/t mice. In contrast, the Het mice did not develop LV hypertrophy up to
the age of 18 mo, but exhibited slight myocyte hypertrophy and a higher, not
significant level of β-MHC mRNA at the age of 3 mo. In comparison, at the age of 12
mo only 32% of the cMyBP-Ct/+ mice had developed a cardiac hypertrophy
(McConnell et al., 2001). In >30-mo-old cMyBP-Ct/+ mice, LVAW and LVPW were
significantly greater than in WT mice, and significant increases in hypertrophic
markers (ANP and BNP) were found. Histological sections derived from >30-mo-old
cMyBP-Ct/+ mice demonstrated myocyte hypertrophy, interstitial fibrosis and
myofibrillar disarray in 50% of mutant animals. However, cardiac function in >30-
mo-old cMyBP-Ct/+ mice was indistinguishable from that of respective WT mice.
Taken together, the hypothesis that alterations in the UPS contribute to the
development of hypertrophy in cMyBP-C transgenic mice could not be substantiated.
In case of KI and KO mice, this is likely due to the massive cardiac phenotype due to
the complete absence (KO) or large reduction (KI) in cMyBP-C protein. The
absence/reduction in cMyBP-C protein by itself is likely a strong trigger for
hypertrophy, overriding any further contribution by other factors. It should be
mentioned in this respect that it is quite surprising that the KO mice survive the
absence of one of the major sarcormeric proteins at all. Moreover, one may argue that
the similarly severe phenotype in KI mice, expressing at least 10% of missense
cMyBP-C could be related to the affection of the UPS. But this idea needs further
studies. On the other hand, the atrophy in M7t-TG mice could argue for just the
opposite, namely that the stimulation of the proteasomal degradation machinery in
9-mo-old animals was causally related to atrophy. But this remains speculative at this
point.
NMD is involved in the regulation of cMyBP-C mutant levels in KI and Het mice.
Characterization of the cMyBP-C knock-in mouse model revealed that the level of
total cMyBP-C mature-mRNA, but not of the pre-mRNA, was markedly reduced in
both KI and Het mice compared to WT mice suggesting a specific regulation at the
Discussion
122
level of processing pre-mRNAs to mature-mRNAs. A known pathway that
specifically eliminates nonsense mRNAs is the NMD. NMD is activated in mRNAs
that contain a PTC located >50-55 nt upstream of the last exon-exon junction (Nagy
and Maquat, 1998). In the KI and Het mice, the PTC is located in exon 9 in the
nonsense mRNA and therefore far upstream of the last junction between exons 34-35
suggesting an involvement of the NMD. Indeed, two differently acting NMD
inhibitors, CHX and emetine, markedly increased the level of the nonsense mRNA,
but not of the missense mRNA in KI NMCM. This specificity for the nonsense
mRNA fits with the rule that NMD only targets aberrant mRNAs containing a PTC.
More importantly, CHX treatment in vivo resulted as well in increased levels of
nonsense mRNA in the KI and Het mice indicating that NMD is operational in the
intact whole animal heart. The reduction in missense mRNA points to an additional
mechanism, which is not yet known. As already mentioned above, similar expression
levels of mutant cMyBP-C transcripts as in the KI and Het mice were obtained in the
cMyBP-Ct/t and cMyBP-Ct/+ mice. The presence of a PTC together with the markedly
reduced levels of total cMyBP-C mRNA suggest a NMD involvement in these mice
like in the KI and Het mice.
Taken together, an important new result from these studies is that NMD participates
in the regulation of pathological cMyBP-C transcripts in the whole animal. On the
basis of the results obtained previously (Sarikas et al., 2005) a model can be proposed
that involves a two-step quality control. Transcripts are degraded by the NMD if they
comply with the NMD rules (PTC >50-55 nt upstream of the last exon-exon junction)
and the UPS comes into play if truncated proteins are being produced. The latter is the
main degradation system in cases where a cDNA is overexpressed that is devoid of an
exon-intron structure.
The lack of cMyBP-C is probably the main cause of hypertrophy, which in turn
activates the 20S proteasome activities.
As discussed above the present results suggest that the phenotype in Het, KI and also
KO mice is mainly attributed to an insufficient amount of normal cMyBP-C. The
expression of endogenous cMyBP-C was not altered in the M7t-TG mice compared to
Discussion
123
WT mice and probably therefore these mice did not develop cardiac hypertrophy up to
the age of two years. The Het mice expressed 79% full-length cMyBP-C (mutant and
normal) compared to WT mice and did not develop cardiac hypertrophy up to 18 mo
of age. But the reduced level of cMyBP-C protein together with myocyte hypertrophy,
the increased (not significant) level of β-MHC mRNA at 3 mo of age and the
published data in the >30-mo-old cMyBP-Ct/+ mice suggest that myocyte hypertrophy
precedes LV hypertrophy and that the Het mice will develop cardiac hypertrophy later
in life. Therefore, examination of >18 mo-old Het mice is absolutely necessary.
In contrast to the M7t-TG and Het mice, KI and KO mice did not express any normal
cMyBP-C and exhibited an increased HW/BW already at birth suggesting lack of
cMyBP-C as the disease mechanism leading to hypertrophy. The KI mice expressed
of course 10% full-length E256K protein, but whether the E256K mutant has a
function at all remains at the moment elusive.
If the sarcomere function would be altered or impaired due the insufficient amount of
cMyBP-C, the heart may try to compensate the functional deficits by increased
myocyte growth resulting in cardiac hypertrophy. When cardiac function remains
inadequate despite growth, other pathways are likely activated, as evidenced by an
altered gene expression (ANP, BNP, ß-MHC), myocyte death (apoptosis) and fibrosis.
In general, the UPS is involved in a broad range of cellular pathways, such as
apoptosis (Breitschopf et al., 2000; Li and Dou, 2000), cell cycle (King et al., 1996),
cell differentiation (Helin, 1998) and immune and stress response (Palombella et al.,
1994; Rock et al., 1994). In addition, a number of key regulatory pathways that
promote cardiac hypertrophy are either targets or components of the UPS. For
instance, it has been reported that several signaling proteins such as β-catenin and
calcineurin, which mediate cardiac growth (including pathological hypertrophy), are
degraded by the UPS (Glickman and Ciechanover, 2002; Li et al., 2004). Thus, the
UPS was likely activated in response to hypertrophy in KI and KO mice and the
increase in proteolytic activities was likely a compensatory mechanism against further
development of hypertrophy: the 20S proteasome worked more to get rid of the
hypertrophic, hypertrophy-promoting and proapoptotic proteins. This was also
indicated by the positive correlation between chymotryspin-like activity and
hypertrophy, which was observed in both KI and KO mice.
Discussion
124
Thus, these data as well as several recent other studies (Depre et al., 2006; Razeghi et
al., 2006) are compatible with the idea that cardiac hypertrophy is generally
accompanied by alterations in the UPS, mainly in the sense of increased turnover rate.
Our observation that the steady-state level of ubiquitinated proteins did not correlate
with the degree of cardiac hypertrophy (in both KI and KO mice) argues for the
notion that the system normally reacts to increased protein load by increased activity
to keep the steady-state level constant. Accordingly, a negative correlation existed
between chymotrypsin activity and the level of ubiquitinated proteins in the KO mice.
In other words, the better the proteasome works, the lower the steady-state level of
ubiquitinated proteins. Interestingly, this correlation was absent in KI mice,
suggesting a specific defect as discussed above. When interpreting these data, it is
important to keep in mind that the tests for proteasome activity are performed in vitro,
i.e. in the absence of any potentially inhibiting truncated protein, whereas the steady-
state level of ubiquitinated proteins is determined in the in vivo situation.
Outlook
For the future, some investigations and treatments are yet outstanding for the M7t-TG,
KI and Het mice. First, further experiments should be designed to stabilize and detect
the truncated protein. In the M7t-TG mice, the UPS is likely involved in the rapid
degradation of the truncated protein, although it could not be substantiated under the
used conditions. The i.v.-injection of MG132 or epoxomicin in adult (older than 2 mo)
M7t-TG mice followed by Western blot analysis of myofilament protein preparations
may result in the detection of the truncated protein. In contrast, NMD inhibition is
likely useless in the M7t-TG mice: NMD is likely not responsible for the low levels of
transgenic mRNA, because it requires at least 1 intron (Zhang et al., 1998) and is
therefore inactive towards transgenically expressed cDNAs. A cross between the M7t-
TG and KO mice would result in mice, which express only one functional cMyBP-C
allele and the NMD-resistant transgene. In contrast to the M7t-TG mice, these crossed
mice would mimic the human situation and would be probably better suitable to
investigate the UPS involvement in vivo for the following reasons: i) NMD cannot act,
which leads to a stable expression of the transgene at mRNA level and ii) the
endogenous cMyBP-C amount at mRNA and protein level would be reduced (due to
Discussion
125
the heterozygous state for cMyBP-C). To detect the truncated protein in the KI and
Het mice, the best approach may be to inhibit NMD, e.g. by siRNA-mediated
knockdown of SMG-1 or Upf1 (NMD key proteins), followed by blockage of the
proteasome by i.v.-injection of MG132 and final analysis of myofilament protein
preparations by Western blot. This strategy is only useful to detect the truncated
protein, but it will not rescue the phenotype in the KI mice. As already mentioned, the
truncated protein is not only lacking the myosin and titin binding site but also the
MyBP-C motif with the 3 phosphorylation sites, and is therefore probably not able to
play a beneficial structural or functional role. In contrast to NMD inhibition, the
treatment with gentamicin, an aminoglycoside, or PTC124 could be useful to rescue
the mutant phenotype in the KI mice. Suppression of the PTC in the nonsense mRNA
would lead to a mutant almost full-length cMyBP-C protein. Whether this protein
would have structural and functional properties at all is difficult to say, because it is at
least missing the exon 6, which leads to a frameshift.
A second point, which should be investigated in the future, is the UPS function in the
Het mice. The Het mice did not develop cardiac hypertrophy up to 18 mo of age and
therefore no altered UPS function is expected. But maybe there is already a tendency
towards an increase in both ubiquitination and degradation at this age, which proceeds
with age.
Finally, it would be interesting to investigate the stress response in the M7t-TG and
Het mice. A striking characteristic of FHC in humans is its preference to cause sudden
death, oftentimes during significant cardiac stress brought on by exercise (Maron et
al., 1980; Maron et al., 1996). But in general, the laboratory mouse is a sedentary
animal in a minimally stressful environment. Controlled regimens have been therefore
established to stress mice physically or pharmacologically: mice can be subject to
swimming (Kaplan et al., 1994; James et al., 1998) or treadmill exercise (Fewell et al.,
1997; James et al., 1998) or to chronic isoproterenol infusion (Kudej et al., 1997). It is
expected that phenotypes that may not be present at rest become apparent under these
controlled stress regimens. For instance, although the transgenic MyBP-C.mut2 mice
appeared overtly healthy, they were significantly compromised in their exercise
capacity and exhibited decreased heart rates in response to the treadmill exercise
(Yang et al., 1999). Thus, it should be investigated whether under significant
Discussion
126
conditions of stress overt cardiovascular abnormalities might become apparent in the
M7t-TG and Het mice.
Potential therapeutic approaches
When considering therapeutic interventions, it is important to keep in mind that FHC
is, in the vast majority, an autosomal-dominant disease, i.e. it occurs at the
heterozygous state. This is different from the mouse models for yet incompletely
understood reasons.
Assuming that the (partial) absence is the main cause of hypertrophy in cMyBP-C
mutations, putative therapeutic approaches should aim at increasing the amount of
full-length cMyBP-C protein. An estimated 70% of the 165 known MYBPC3
mutations (Richard et al., 2006; Alcalai et al., 2007) should result in a PTC located
>50-55 nt upstream of the last exon-exon junction and therefore involve NMD. Up to
date, only two papers have analyzed the consequences of frameshift MYBPC3
mutations in human myocardial tissue (Rottbauer et al., 1997; Moolman et al., 2000).
In one patient, an insertion of a single guanine resulted in a newly created splice
donor site in exon 25 and a PTC in exon 26 (Moolman et al., 2000). The level of
nonsense mRNA was 2-fold lower than the WT mRNA in this patient suggesting the
involvement of NMD. In general, NMD is a quality control of the cell and prevents
the production of nonfunctional or potentially harmful truncated proteins
(Frischmeyer and Dietz, 1999; Maquat, 2004). However, some truncated proteins
deleted for the C-terminal domains have been reported to support normal cell
functions (Sheppard et al., 1994; Kerr et al., 2001). In the case that a mutant protein
retains residual activity that can partially retain normal protein function, NMD might
augment the original defects (Cali and Anderson, 1998; Ainsworth, 2005). Thus, the
selective inhibition of NMD may provide a novel strategy to rescue the mutant
phenotype in PTC-related diseases, in which the mutant protein shows no dominant-
negative effect and compensates for the missing cellular functions. For example,
wortmannin, an inhibitor of the PI3-kinase-related protein SMG-1 that phosphorylates
Upf1 during NMD (Rehwinkel et al., 2006), or siRNA-mediated knockdown of SMG-
1 or Upf1 restored the level of PTC-containing collagen VI α2 mRNA and rescued the

Discussion
127
phenotype in fibroblasts of a patient with Ullrich disease (Usuki et al., 2004; Usuki et
al., 2006). But in this context it has to be noted that it is not known what kinds of
deleterious side effects may arise from a NMD inhibition in humans. For instance,
otherwise innocuous, recessive PTC-related mutations carried in heterozygous
condition as part of an individual’s genetic load could cause unpredictable, adverse
side effects. In addition, the accumulation of natural mRNAs could cause adverse side
effects.
Other studies have shown that treatment with aminoglycosides can also rescue the
mutant phenotype in PTC-related diseases by allowing a PTC read-through, thus
permitting the synthesis of a near-normal protein (Howard et al., 1996; Barton-Davis
et al., 1999). Aminoglycosides bind to the decoding site of ribosomes and promote the
incorporation of an amino acid at the PTC by a near-cognate aminoacylated transfer
(t)RNA (Rospert et al., 2005). They have been already used in human patients to
suppress PTCs within transcripts associated with cystic fibrosis (Kuzmiak and Maquat,
2006). Unfortunately, long-term use of these antibiotics in humans can cause
nephrotoxicity and ototoxicity. The recent development of a new drug, PTC124,
which promotes amino acid incorporation at PTCs by an unknown mechanism
(Ainsworth, 2005) and which did not evoke kidney failure or deafness in phase I of
safety trials, is a promising perspective.
Whether UPS inhibition is a useful strategy to prevent hypertrophy, is depending on
the cMyBP-C mutation. If the cMyBP-C mutation results in a nonsense mRNA
containing a PTC located <50-55 nt upstream of the last exon-exon junction and leads
to the production of a truncated protein, which retains residual activity, UPS
inhibition would result in an useful stabilization of this protein. The proteasome
inhibitor bortezomib is already in clinical use for the therapy of multiple myeloma
(Richardson and Anderson, 2003) and, until now, appears to have a favorable safety
profile that does not include cardiac toxicity.
Summary
128
5 Summary
Mutations in the MYBPC3 gene encoding cardiac myosin-binding protein-C
(cMyBP-C) are frequent causes of familial hypertrophic cardiomyopathy (FHC).
MYBPC3 mutations mainly result in a frameshift and a premature termination codon
(PTC). However, truncated cMyBP-C mutants were undetectable in myocardial tissue
of FHC patients with frameshift mutations. Recent data using adenoviral gene transfer
in cultured cardiomyocytes showed that truncated cMyBP-C proteins are rapidly and
quantitatively degraded by the ubiquitin-proteasome system (UPS). Furthermore, they
suggested that the rapid degradation of truncated cMyBP-C mutants saturates the UPS
function which, by itself, could play a role in causing hypertrophy. It was the aim of
the present thesis to investigate (1) whether the UPS is also responsible for the
degradation of truncated cMyBP-C mutants in the whole animal and (2) whether
alterations of the UPS that may be secondary to its overuse by truncated cMyBP-C
mutants could play an own pathogenetic role in the development of myocardial
hypertrophy in vivo. As a model system the experiments focused on a cMyBP-C
mutant that corresponds to a G>A transition on the last nucleotide of exon 6 and has
been found to be associated with poor prognosis in patients. This mutation, when
introduced into an exogenous cMyBP-C cDNA, gives rise to a largely truncated
mutant and, in the genomic context of the whole animal, is expected to result either in
a full-length, missense protein or a truncated protein resulting from exon 6 skipping
and a PTC or both.
Two mouse models were developed and characterized. One is a transgenic model
expected to overexpress a myc-tagged cMyBP-C cDNA deleted of exon 6 under the
control of the α-myosin heavy chain promoter. No cardiac hypertrophy, but an
unexpected cardiac atrophy was observed in the transgenic mice. The level of full-
length cMyBP-C protein was similar in transgenic and wild-type (WT) mice, but the
truncated protein was undetectable, despite the presence of transgenic mRNA.
Whereas this observation is compatible with rapid degradation of the truncated protein
by the UPS, inhibition of the proteasome in cultured cardiomyocytes did not result in
measurable amounts of truncated protein. Moreover, no evidence was obtained
indicating alterations of the UPS, neither in terms of steady-state level of
Summary
129
ubiquitinated proteins nor degradation activity. These data may point to alternative
mechanisms such as reduced translational efficiency of mutant mRNAs, but on the
basis of the former in vitro data involvement of the UPS still appears to be most likely
and the apparent absence of the truncated protein may just reflect insufficient
sensitivity of the present assay conditions. Further experiments are necessary to solve
this issue.
The second mouse model was generated by targeted knock-in of the G>A transition.
The homozygous (KI) mice developed myocyte and left ventricular hypertrophy with
reduced fractional shortening and interstitial fibrosis, whereas the heterozygous (Het)
mice developed only mild myocyte hypertrophy. Both missense and nonsense (exon 6
skipped) mRNAs were present, but the level of total cMyBP-C mRNA was markedly
lower in the Het and KI mice vs. WT mice. Inhibition of the nonsense-mediated
mRNA decay (NMD) in cardiomyocytes or in vivo increased the level of nonsense
mRNA several fold. The missense mRNA level was not changed by treatment with
NMD inhibitors. The truncated protein was not detected in both the KI and Het mice,
even after proteasome inhibition in cardiomyocytes. The amount of the full-length
protein was 90% and 21% lower in the KI and Het mice, respectively. These data
suggest that, in the whole animal and intact genomic context, the main regulation of
the mutant cMyBP-C takes already place at the mRNA level and partially involves
NMD.
To investigate the second hypothesis, namely that mutant cMyBP-C cause saturation
of the UPS, homozygous KI mice were compared with homozygous cMyBP-C
deficient mice (KO). The latter were not expected to have any specific affection of the
UPS, because the MYBPC3 gene was simply inactivated. Both models showed
marked cardiac hypertrophy and an increase in the steady-state level of ubiquitinated
proteins throughout the life span of the animals. In parallel, the 20S proteasome
activities, measured by fluorogenic substrates ex vivo, were greater and positively
correlated with the degree of hypertrophy. Whereas the steady-state level of
ubiquitinated proteins was negatively correlated with the 20S proteasome activity in
KO, it was not in KI mice. To specifically monitor the degradation capacity of the
UPS in vivo, KO and KI mice were crossed with a UPS reporter mouse strain
expressing a green fluorescent protein (GFP) linked to a modified ubiquitin. In these
Summary
130
mice, accumulation of GFP indicates compromised UPS function. Indeed, old KI
mice showed 4-fold higher GFP levels than WT littermates, but KO mice not or to a
lower extent. These data are compatible with the hypothesis that in the KI mice the
UPS is specifically affected in addition to a more general effect of cardiac
hypertrophy. But this interpretation needs further substantiation.
In conclusion, both the NMD and the UPS result in cMyBP-C haploinsufficiency, and
this is likely a major cause of cardiac hypertrophy. The data also suggest that cardiac
hypertrophy as such goes along with an increase in UPS activity, which is likely
compensatory and triggered by increased protein turnover. The marked increase in
GFP in old KI crossed with the UPS reporter mice may, in accordance with the initial
hypothesis, point to a specific impairment of the UPS in mice which express truncated
cMyBP-C. These data contribute to an improved understanding of the molecular
mechanisms of FHC associated with frameshift mutations and maybe also to the
development of new therapeutic strategies.
Summary
131
5 Zusammenfassung
Mutationen des MYBPC3 Gens, das kardiales Myosin-bindendes Protein-C
(cMyBP-C) kodiert, sind häufig Ursachen der familiären hypertrophen
Kardiomyopathie (FHC). Die meisten MYBPC3 Mutationen resultieren in einer
Verschiebung des Leserasters und einem vorzeitigen Terminatorcodon (PTC) und
lassen C-terminal trunkierte Proteine erwarten. Trunkierte cMyBP-C Proteine waren
jedoch nicht in messbaren Mengen im Myokardgewebe von FHC-Patienten mit einer
Frameshift Mutation vorhanden. Eine kürzlich abgeschlossene Versuchsserie, in der
verschiedene cMyBP-C Proteine über einen adenoviralen Ansatz in kultivierten
Kardiomyozyten überexprimiert wurden, hat gezeigt, dass trunkierte cMyBP-C
Proteine rasch und quantitativ durch das Ubiquitin-Proteasom-System (UPS)
abgebaut werden. Ebenso ließen die Daten darauf schließen, dass der rasche Abbau
der trunkierten cMyBP-C Proteine die proteolytische Leistungsfähigkeit des UPS
beeinträchtigt, was an sich Hypertrophie verursachen könnte. Das Ziel dieser
Doktorarbeit war es zu untersuchen, ob (1) das UPS auch im ganzen Tier, also in vivo,
für den Abbau der trunkierten cMyBP-C Proteine verantwortlich ist und (2)
Veränderungen des UPS, die zusätzlich zu seinem übermäßigem Gebrauch durch
trunkierte cMyBP-C Proteine auftreten könnten, eine eigene pathogene Rolle in der
Entwicklung myokardialer Hypertrophie in vivo spielen. In dieser Doktorarbeit
wurden speziell die molekularen Auswirkungen einer MYBPC3 Mutation untersucht,
die mit einer schlechten Prognose in FHC-Patienten einhergeht. Es handelt sich dabei
um eine G>A Mutation an dem letzten Nukleotid des Exon 6. Die Mutation hat ein
stark trunkiertes cMyBP-C Protein zur Folge, wenn sie in eine exogene cMyBP-C
cDNA eingebracht wird. Wird die Mutation durch homologe Rekombination gezielt
in das Genom eingebracht, sollten entweder ein ungekürztes, mutiertes Protein oder
ein stark trunkiertes cMyBP-C Protein, welches durch das Überspringen von Exon 6
und dem Auftreten eines PTC in Exon 9 entsteht, oder beide exprimiert werden.
Zwei Mausmodelle wurden entwickelt und charakterisiert. Ein Modell ist ein
transgenes Mausmodell, welches eine humane myc-markierte cMyBP-C cDNA, in
welcher das Exon 6 entfernt wurde, herzspezifisch unter der Kontrolle des α-Myosin-
Schwere-Kette-Promoter überexprimieren sollte. Es wurde keine kardiale
Summary
132
Hypertrophie, sondern unerwartet eine kardiale Atrophie in diesen transgenen Mäusen
festgestellt. Die Expression des endogenen, ungekürzten cMyBP-C Protein war
ähnlich in transgenen und Wildtyp (WT)-Mäusen; das trunkierte cMyBP-C Protein
war jedoch nicht in nachweisbarer Menge vorhanden, obwohl das Transgen auf
mRNA-Ebene exprimiert wurde. Während dieses Ergebnis mit dem raschen Abbau
der trunkierten Proteine durch das UPS vereinbar ist, führte eine Hemmung des UPS
durch UPS-Inhibitoren nicht zu messbaren Mengen des trunkierten Proteins in
kultivierten Kardiomyozyten. Ebenso fand sich kein Hinweis für eine Veränderung
des UPS, weder in Bezug auf die Steady-State-Level ubiquitinierter Proteine noch in
Bezug auf die 20S-Proteasom-Aktivitäten, welche mit Hilfe von fluorogenen
Substraten ex vivo gemessen wurden. Diese Ergebnisse könnten auf alternative
Mechanismen hinweisen, wie z.B. eine reduzierte Translationseffizienz von mutierten
mRNAs. Basierend auf den früheren Daten scheint jedoch eine Beteiligung des UPS
am wahrscheinlichsten, und die scheinbare Abwesenheit des trunkierten Proteins ist
wahrscheinlich eher auf eine unzureichende Sensitivität zurückzuführen.
Weiterführende Experimente sind notwendig, um dies zu klären.
Das zweite Mausmodell wurde durch gezieltes Einbringen der G>A Mutation in das
Genom generiert. Die homozygoten (KI) Mäuse entwickelten eine Myozyten- und
linksventrikuläre Hypertrophie, eine reduzierte Verkürzungsfraktion des linken
Ventrikels und interstitielle Fibrose, während die heterozygoten (Het) Mäuse lediglich
eine leichte Myozyten-Hypertrophie zeigten. Es wurde sowohl die Missense (G>A
Transition)- als auch die Nonsense (Überspringen von Exon 6)-mRNA in KI- und
Het-Mäusen nachgewiesen; die Gesamtmenge an cMyBP-C mRNA war jedoch
deutlich geringer in KI- und Het-Mäusen als in WT-Mäusen. Die Hemmung des
nonsense-vermittelten mRNA Abbaus (NMD) durch NMD-Inhibitoren erhöhte die
Menge an Nonsense-mRNA mehrfach sowohl in kultivierten Kardiomyozyten als
auch in vivo. Die Menge an Missense-mRNA wurde durch die Behandlung mit NMD-
Inhibitoren nicht verändert. Das trunkierte cMyBP-C Protein konnte selbst nach
Proteasom-Hemmung weder in den KI- noch in den Het-Mäusen nachgewiesen
werden. Die Menge an ungekürztem cMyBP-C Protein war um 90% bzw. 21%
geringer in den KI- und Het-Mäusen gegenüber WT-Mäusen. Diese Ergebnisse legen
nahe, dass die Regulierung der G>A Transition im ganzen Tier und im intakten
Summary
133
genomischen Kontext hauptsächlich schon auf mRNA-Ebene stattfindet und teilweise
NMD mit einschließt.
Um der zweiten Hypothese nachzugehen, nämlich dass trunkierte cMyBP-C Proteine
eine Veränderung der UPS-Funktion hervorrufen, wurden die KI-Mäuse mit
homozygoten cMyBP-C-defizienten (KO) Mäusen verglichen. Beide Mausmodelle
zeigten eine deutliche kardiale Hypertrophie und einen Anstieg der Steady-State-
Level ubiquitinierter Proteine über ihre gesamte Lebensdauer. Die 20S-Proteasom-
Aktivitäten waren ebenso erhöht und korrelierten positiv mit dem Grad der
Hypertrophie. Während die Steady-State-Level ubiquitinierter Proteine in den KO-
Mäusen negativ mit den 20S-Proteasom-Aktivitäten korrelierten, taten sie dies in den
KI-Mäusen nicht. Um spezifisch die Abbau-Leistung des UPS in vivo zu verfolgen,
wurden die KI- and KO-Mäuse mit UPS-Reportermäusen gekreuzt. Diese UPS-
Reportermäuse exprimieren ein grün fluoreszierendes Protein (GFP), welches
wiederum mit einem mutierten Ubiquitinmolekül verbunden ist. Eine GFP-
Akkumulierung würde daher auf eine beeinträchtigte UPS-Funktion in diesen Mäusen
hindeuten. In alten KI-Mäusen (gekreuzt mit den UPS-Reportermäusen) wurde
tatsächlich eine 4-fach höhere GFP-Menge detektiert im Vergleich zu WT-Mäusen; in
den KO-Mäusen jedoch nicht bzw. in geringerem Ausmaß. Diese Ergebnisse sind
vereinbar mit der Annahme, dass das UPS in den KI-Mäusen spezifisch verändert ist,
und zwar zusätzlich zu einem generellen Auftreten kardialer Hypertrophie. Diese
Interpretation benötigt jedoch weitere Analysen.
Zusammenfassend kann festgestellt werden, dass sowohl der NMD als auch das UPS
in einer cMyBP-C Haploinsuffizienz resultieren könnten, die wiederum
wahrscheinlich eine Hauptursache für kardiale Hypertrophie darstellt. Die Ergebnisse
lassen ebenso vermuten, dass eine kardiale Hypertrophie an sich mit einer
gesteigerten UPS-Aktivität einhergeht, welche wahrscheinlich kompensatorisch ist
und durch einen gesteigerten Protein-Umsatz ausgelöst wird. Der deutliche Anstieg
von GFP-Protein in den alten KI-Mäusen (gekreuzt mit den UPS-Reportermäusen)
könnte, im Einklang mit der ursprünglichen Hypothese, auf eine spezifische
Beeinträchtigung des UPS in Mäusen, die trunkierte cMyBP-C Proteine exprimieren,
hindeuten. Die Ergebnisse tragen zu einem verbesserten Verständnis der molekularen

Summary
134
Mechanismen bei, die über Frameshift Mutationen zu FHC führen, und ermöglichen
eventuell neue therapeutische Ansätze.
References
135
6 References
Ainsworth C. 2005. Nonsense mutations: running the red light. Nature. 438:726-8. Alcalai R, Seidman JG, and Seidman CE. 2007. Genetic Basis of Hypertrophic
Cardiomyopathy: From Bench to the Clinics. J Cardiovasc Electrophysiol. 18:1-7.
Alyonycheva TN, Mikawa T, Reinach FC, and Fischman DA. 1997. Isoform-specific
interaction of the myosin-binding proteins (MyBPs) with skeletal and cardiac myosin is a property of the C-terminal immunoglobulin domain. J Biol Chem. 272:20866-20872.
Andersen PS, Havndrup O, Bundgaard H, Larsen LA, Vuust J, Pedersen AK,
Kjeldsen K, and Christiansen M. 2004. Genetic and phenotypic characterization of mutations in myosin-binding protein C (MYBPC3) in 81 families with familial hypertrophic cardiomyopathy: total or partial haploinsufficiency. Eur J Hum Genet. 12:673-7.
Ashrafian H, Redwood C, Blair E, and Watkins H. 2003. Hypertrophic
cardiomyopathy:a paradigm for myocardial energy depletion. Trends Genet. 19:263-8.
Barton-Davis ER, Cordier L, Shoturma DI, Leland S, and Sweeney HL. 1999.
Aminoglycoside antibiotics restore dystrophin function to skeletal muscles in mdx mice. J. Clin. Invest. 104:375-381.
Bonne G, Carrier L, Richard P, Hainque B, and Schwartz K. 1998. Familial
hypertrophic cardiomyopathy: from mutations to functional defects. Circ Res. 83:579-593.
Bottinelli R, Coviello DA, Redwood CS, Pellegrino MA, Maron BJ, Spirito P,
Watkins H, and Reggiani C. 1998. A mutant tropomyosin that causes hypertrophic cardiomyopathy is expressed in vivo and associated with an increased calcium sensitivity. Circ. Res. 82:106-115.
Bowman AB, Yoo SY, Dantuma NP, and Zoghbi HY. 2005. Neuronal dysfunction in
a polyglutamine disease model occurs in the absence of ubiquitin-proteasome system impairment and inversely correlates with the degree of nuclear inclusion formation. Hum Mol Genet. 14:679-91.
Bradford MM. 1976. A rapid and sensitive method for the quantitation of microgram
quantities of protein utilizing the principle of protein-dye binding. Anal Biochem. 72:248-54.
Breitschopf K, Zeiher AM, and Dimmeler S. 2000. Ubiquitin-mediated degradation of
the proapoptotic active form of bid. A functional consequence on apoptosis induction. J Biol Chem. 275:21648-52.
References
136
Buchou T, Vernet M, Blond O, Jensen HH, Pointu H, Olsen BB, Cochet C, Issinger OG, and Boldyreff B. 2003. Disruption of the regulatory beta subunit of protein kinase CK2 in mice leads to a cell-autonomous defect and early embryonic lethality. Mol Cell Biol. 23:908-15.
Cali BM, and Anderson P. 1998. mRNA surveillance mitigates genetic dominance in
Caenorhabditis elegans. Mol Gen Genet. 260:176-84. Carrard G, Bulteau AL, Petropoulos I, and Friguet B. 2002. Impairment of
proteasome structure and function in aging. Int J Biochem Cell Biol. 34:1461-74.
Carrier L, Bonne G, Bährend E, Yu B, Richard P, Niel F, Hainque B, Cruaud C, Gary
F, Labeit S, Bouhour JB, Dubourg O, Desnos M, Hagège AA, Trent RJ, Komajda M, and Schwartz K. 1997. Organization and sequence of human cardiac myosin binding protein C gene (MYBPC3) and identification of mutations predicted to produce truncated proteins in familial hypertrophic cardiomyopathy. Circ Res. 80:427-434.
Carrier L, Knoell R, Vignier N, Keller DI, Bausero P, Prudhon B, Isnard R,
Ambroisine ML, Fiszman M, Ross J, Jr., Schwartz K, and Chien KR. 2004. Asymmetric septal hypertrophy in heterozygous cMyBP-C null mice. Cardiovasc Res. 63:293-304.
Carter MS, Doskow J, Morris P, Li S, Nhim RP, Sandstedt S, and Wilkinson MF.
1995. A regulatory mechanism that detects premature nonsense codons in T-cell receptor transcripts in vivo is reversed by protein synthesis inhibitors in vitro. J Biol Chem. 270:28995-9003.
Carter MS, Li S, and Wilkinson MF. 1996. A splicing-dependent regulatory
mechanism that detects translation signals. Embo J. 15:5965-75. Charron P, Dubourg O, Desnos M, Bennaceur M, Carrier L, Camproux AC, Isnard R,
Hagège A, Langlard JM, Bonne G, Richard P, Hainque B, Bouhour JB, Schwartz K, and Komajda M. 1998. Clinical features and prognostic implications of familial hypertrophic cardiomyopathy related to cardiac myosin binding protein C gene. Circulation. 97:2230-2236.
Chen Q, Liu JB, Horak KM, Zheng H, Kumarapeli AR, Li J, Li F, Gerdes AM,
Wawrousek EF, and Wang X. 2005. Intrasarcoplasmic amyloidosis impairs proteolytic function of proteasomes in cardiomyocytes by compromising substrate uptake. Circ Res. 97:1018-26.
Ciechanover A, and Brundin P. 2003. The ubiquitin proteasome system in
neurodegenerative diseases: sometimes the chicken, sometimes the egg. Neuron. 40:427-46.
Ciechanover A. 2005. Proteolysis: from the lysosome to ubiquitin and the proteasome.
Nat Rev Mol Cell Biol. 6:79-87.
References
137
Craig R, and Offer G. 1976. The localization of C-protein in rabbit skeletal muscle. Proc. Royal. Soc. Lond. B192:451-454.
Cuda G, Fananapazir L, Zhu WS, Seller JR, and Epstein NE. 1993. Skeletal muscle
expression and abnormal function of β-myosin in hypertrophic cardiomyopathy. J. Clin. Invest. 91:2861-2865.
Culbertson MR. 1999. RNA surveillance. Unforeseen consequences for gene
expression, inherited genetic disorders and cancer. Trends Genet. 15:74-80. Depre C, Wang Q, Yan L, Hedhli N, Peter P, Chen L, Hong C, Hittinger L, Ghaleh B,
Sadoshima J, Vatner DE, Vatner SF, and Madura K. 2006. Activation of the cardiac proteasome during pressure overload promotes ventricular hypertrophy. Circulation. 114:1821-8.
El-Armouche A, Boknik P, Eschenhagen T, Carrier L, Knaut M, Ravens U, and
Dobrev D. 2006. Molecular determinants of altered Ca2+ handling in human chronic atrial fibrillation. Circulation. 114:670-80.
El-Armouche A, Pohlmann L, Schlossarek S, Starbatty J, Yeh YH, Nattel S, Dobrev
D, Eschenhagen T, and Carrier L. 2007. Decreased phosphorylation levels of cardiac myosin-binding protein-C in human and experimental heart failure. J Mol Cell Cardiol. 43:223-9.
Erdmann J, Raible J, Maki-Abadi J, Hummel M, Hammann J, Wollnik B, Frantz E,
Fleck E, Hetzer R, and Regitz-Zagrosek V. 2001. Spectrum of clinical phenotypes and gene variants in cardiac myosin- binding protein C mutation carriers with hypertrophic cardiomyopathy. J Am Coll Cardiol. 38:322-30.
Fewell JG, Osinska H, Klevitsky R, Ng W, Sfyris G, Bahrehmand F, and Robbins J.
1997. A treadmill exercise regimen for identifying cardiovascular phenotypes in transgenic mice. Am J Physiol. 273:H1595-605.
Flavigny J, Souchet M, Sébillon P, Berrebi-Bertrand I, Hainque B, Mallet A, Bril A,
Schwartz K, and Carrier L. 1999. COOH-terminal truncated cardiac myosin-binding protein C mutants resulting from familial hypertrophic cardiomyopathy mutations exhibit altered expression and/or incorporation in fetal rat cardiomyocytes. J Mol Biol. 294:443-456.
Flavigny J, Robert P, Camelin J, Schwartz K, Carrier L, and Berebbi-Bertrand I. 2003.
Biomolecular interactions between human recombinant β-MyHC and cMyBP-Cs implicated in familial hypertrophic cardiomyopathy. Cardiovasc Res. 60:388-396.
Fougerousse F, Delezoide AL, Fiszman MY, Schwartz K, Beckmann JS, and Carrier
L. 1998. Cardiac myosin binding protein C gene is specifically expressed in heart during murine and human development. Circ Res. 82:130-133.
References
138
Freiburg A, and Gautel M. 1996. A molecular map of the interactions between titin and myosin-binding protein C. Implications for sarcomeric assembly in familial hypertrophic cardiomyopathy. Eur J Biochem. 235:317-326.
Frischmeyer PA, and Dietz HC. 1999. Nonsense-mediated mRNA decay in health and
disease. Hum Mol Genet. 8:1893-900. Gardin JM, Siri FM, Kitsis RN, Edwards JG, and Leinwand LA. 1995.
Echocardiographic assessment of left ventricular mass and systolic function in mice. Circ Res. 76:907-14.
Garneau NL, Wilusz J, and Wilusz CJ. 2007. The highways and byways of mRNA
decay. Nat Rev Mol Cell Biol. 8:113-26. Garvey JL, Kranias EG, and Solaro RJ. 1988. Phosphorylation of C-protein, troponin
I and phospholamban in isolated rabbit hearts. Biochem. J. 249:709-714. Gautel M, Zuffardi O, Freiburg A, and Labeit S. 1995. Phosphorylation switches
specific for the cardiac isoform of myosin binding protein C: a modulator of cardiac contraction? EMBO J. 14:1952-1960.
Gautel M, Fürst DO, Cocco A, and Schiaffino S. 1998. Isoform transitions of the
myosin-binding protein C family in developing human and mouse muscles. Lack of isoform transcomplementation in cardiac muscle. Circ. Res. 82:124-129.
Geisterfer-Lowrance AA, Kass S, Tanigawa G, Vosberg HP, McKenna W, Seidman
CE, and Seidman JG. 1990. A molecular basis for familial hypertrophic cardiomyopathy: a β cardiac myosin heavy chain gene missense mutation. Cell. 62:999-1006.
Glickman MH, and Ciechanover A. 2002. The ubiquitin-proteasome proteolytic
pathway: destruction for the sake of construction. Physiol Rev. 82:373-428. Golab J, Bauer TM, Daniel V, and Naujokat C. 2004. Role of the ubiquitin-
proteasome pathway in the diagnosis of human diseases. Clin Chim Acta. 340:27-40.
Gruen M, and Gautel M. 1999. Mutations in beta-myosin S2 that cause familial
hypertrophic cardiomyopathy (FHC) abolish the interaction with the regulatory domain of myosin binding protein-C. J Mol Biol. 286:933-949.
Gruen M, Prinz H, and Gautel M. 1999. cAPK-phosphorylation controls the
interaction of the regulatory domain of cardiac myosin binding protein C with myosin-S2 in an on-off fashion. FEBS Lett. 453:254-259.
Harris SP, Bartley CR, Hacker TA, McDonald KS, Douglas PS, Greaser ML, Powers
PA, and Moss RL. 2002. Hypertrophic cardiomyopathy in cardiac myosin binding protein-C knockout mice. Circ Res. 90:594-601.
References
139
Hartzell HC, and Titus L. 1982. Effects of cholinergic and adrenergic agonists on phosphorylation of a 165,000-dalton myofibrillar protein in intact cardiac muscle. J. Biol. Chem. 257:2111-2120.
Helin K. 1998. Regulation of cell proliferation by the E2F transcription factors. Curr
Opin Genet Dev. 8:28-35. Herron TJ, Rostkova E, Kunst G, Chaturvedi R, Gautel M, and Kentish JC. 2006.
Activation of myocardial contraction by the N-terminal domains of myosin binding protein-C. Circ Res. 98:1290-8.
Howard M, Frizzell RA, and Bedwell DM. 1996. Aminoglycoside antibiotics restore
CFTR function by overcoming premature stop mutations. Nat Med. 2:467-9. Ingles J, Doolan A, Chiu C, Seidman J, Seidman C, and Semsarian C. 2005.
Compound and double mutations in patients with hypertrophic cardiomyopathy: implications for genetic testing and counselling. J Med Genet. 42:e59.
James JF, Hewett TE, and Robbins J. 1998. Cardiac physiology in transgenic mice.
Circ Res. 82:407-15. Kamisago M, Sharma SD, DePalma SR, Solomon S, Sharma P, McDonough B,
Smoot L, Mullen MP, Woolf PK, Wigle ED, Seidman JG, Seidman CE, Jarcho J, and Shapiro LR. 2000. Mutations in Sarcomere Protein Genes as a Cause of Dilated Cardiomyopathy. N. Engl. J. Med. 343:1688-1696.
Kaplan ML, Cheslow Y, Vikstrom K, Malhotra A, Geenen DL, Nakouzi A, Leinwand
LA, and Buttrick PM. 1994. Cardiac adaptations to chronic exercise in mice. Am J Physiol. 267:H1167-73.
Kerr TP, Sewry CA, Robb SA, and Roberts RG. 2001. Long mutant dystrophins and
variable phenotypes: evasion of nonsense-mediated decay? Hum Genet. 109:402-7.
King RW, Deshaies RJ, Peters JM, and Kirschner MW. 1996. How proteolysis drives
the cell cycle. Science. 274:1652-9. Koretz JF. 1979. Effects of C-protein on synthetic myosin filament structure. Biophys.
J. 27:433-446. Kostin S, Pool L, Elsasser A, Hein S, Drexler HC, Arnon E, Hayakawa Y,
Zimmermann R, Bauer E, Klovekorn WP, and Schaper J. 2003. Myocytes die by multiple mechanisms in failing human hearts. Circ Res. 92:715-24.
Kudej RK, Iwase M, Uechi M, Vatner DE, Oka N, Ishikawa Y, Shannon RP, Bishop
SP, and Vatner SF. 1997. Effects of chronic beta-adrenergic receptor stimulation in mice. J Mol Cell Cardiol. 29:2735-46.
References
140
Kulikovskaya I, McClellan G, Flavigny J, Carrier L, and Winegrad S. 2003. Effect of MyBP-C binding to actin on contractility in heart muscle. J Gen Physiol. 122:1-15.
Kumarapeli AR, Horak KM, Glasford JW, Li J, Chen Q, Liu J, Zheng H, and Wang X.
2005. A novel transgenic mouse model reveals deregulation of the ubiquitin-proteasome system in the heart by doxorubicin. Faseb J. 19:2051-3.
Kunst G, Kress KR, Gruen M, Uttenweiler D, Gautel M, and Fink RHA. 2000.
Myosin binding protein C, a phosphorylation-dependent force regulator in muscle that controls the attachment of myosin heads by its interaction with myosin S2. Circ Res. 86:51-58.
Kuzmiak HA, and Maquat LE. 2006. Applying nonsense-mediated mRNA decay
research to the clinic: progress and challenges. Trends Mol Med. 12:306-16. Laugwitz KL, Moretti A, Lam J, Gruber P, Chen Y, Woodard S, Lin LZ, Cai CL, Lu
MM, Reth M, Platoshyn O, Yuan JX, Evans S, and Chien KR. 2005. Postnatal isl1+ cardioblasts enter fully differentiated cardiomyocyte lineages. Nature. 433:647-53.
Lejeune F, and Maquat LE. 2005. Mechanistic links between nonsense-mediated
mRNA decay and pre-mRNA splicing in mammalian cells. Curr Opin Cell Biol. 17:309-15.
Li B, and Dou QP. 2000. Bax degradation by the ubiquitin/proteasome-dependent
pathway: involvement in tumor survival and progression. Proc Natl Acad Sci U S A. 97:3850-5.
Li HH, Kedar V, Zhang C, McDonough H, Arya R, Wang DZ, and Patterson C. 2004.
Atrogin-1/muscle atrophy F-box inhibits calcineurin-dependent cardiac hypertrophy by participating in an SCF ubiquitin ligase complex. J Clin Invest. 114:1058-71.
Lindsten K, Menendez-Benito V, Masucci MG, and Dantuma NP. 2003. A transgenic
mouse model of the ubiquitin/proteasome system. Nature Biotechnology. 21:897-902.
Ludwig A, Friedel B, Metzkow S, Meiners S, Stangl V, Baumann G, and Stangl K.
2005. Effect of statins on the proteasomal activity in mammalian endothelial and vascular smooth muscle cells. Biochem Pharmacol. 70:520-6.
Maquat LE, and Li X. 2001. Mammalian heat shock p70 and histone H4 transcripts,
which derive from naturally intronless genes, are immune to nonsense-mediated decay. Rna. 7:445-56.
Maquat LE. 2004. Nonsense-mediated mRNA decay: splicing, translation and mRNP
dynamics. Nat Rev Mol Cell Biol. 5:89-99.
References
141
Marian AJ, and Roberts R. 2001. The molecular genetic basis for hypertrophic cardiomyopathy. J Mol Cell Cardiol. 33:655-670.
Maron B, Shirani J, Poliac L, Mthenge R, Roberts W, and Mueller F. 1996. Sudden
death in young competitive athletes. Clinical, demographic, and pathological profiles. JAMA. 276:199-204.
Maron BJ, Roberts WC, McAllister HA, Rosing DR, and Epstein SE. 1980. Sudden
death in young athletes. Circulation. 62:218-29. Maron BJ, Nichols PF, Pickle LW, Wesley YE, and Mulvihill JJ. 1984. Patterns of
inheritance in hypertrophic cardiomopathy. Assessment by M-mode and two-dimensional echocardiography. Am. J. Cardiol. 53:1087-1094.
Maron BJ, Spirito P, Green KJ, Wesley YE, Bonow RO, and Arce J. 1987.
Noninvasive assessment of left ventricular diastolic function by pulsed Doppler echocardiography in patients with hypertrophic cardiomyopathy. J Am Coll Cardiol. 10:733-42.
Maron BJ, Gardin JM, Flack JM, Gidding SS, Kurosaki TT, and Bild DE. 1995.
Prevalence of hypertrophic cardiomyopathy in a general population of young adults: echocardiographic analysis of 4111 subjects in the CARDIA study. Circulation. 92:785-789.
Maron BJ. 2002. Hypertrophic cardiomyopathy: a systematic review. Jama.
287:1308-20. McConnell BK, Jones KA, Fatkin D, Arroyo LH, Lee RT, Aristizabal O, Turnbull DH,
Georgakopoulos D, Kass D, Bond M, Niimura H, Schoen FJ, Conner D, Fishman DH, Seidman CE, and Seidman JG. 1999. Dilated cardiomyopathy in homozygous myosin-binding protein-C mutant mice. J Clin Invest. 104:1235-1244.
McConnell BK, Fatkin D, Semsarian C, Jones KA, Georgakopoulos D, Maguire CT,
Healey MJ, Mudd JO, Moskowitz IPG, Conner DA, Giewat M, Wakimoto H, Berul CI, Schoen FJ, Kass DA, Seidman CE, and Seidman JG. 2001. Comparison of two murine models of familial hypertrophic cardiomyopathy. Circ Res. 88:383-389.
Moolman JA, Reith S, Uhl K, Bailey S, Gautel M, Jeschke B, Fisher C, Ochs J,
McKenna WJ, Klues H, and Vosberg HP. 2000. A newly created splice donor site in exon 25 of the MyBP-C gene is responsible for inherited hypertrophic cardiomyopathy with incomplete disease penetrance. Circulation. 101:1396-1402.
Moolman-Smook J, Flashman E, de Lange W, Li Z, Corfield V, Redwood C, and
Watkins H. 2002. Identification of novel interactions between domains of Myosin binding protein-C that are modulated by hypertrophic cardiomyopathy missense mutations. Circ Res. 91:704-11.
References
142
Nagy E, and Maquat LE. 1998. A rule for termination-codon position within intron-containing genes: when nonsense affects RNA abundance. Trends Biochem Sci. 23:198-9.
Niimura H, Bachinski LL, Sangwatanaroj S, Watkins H, Chudley AE, McKenna W,
Kristinsson A, Roberts R, Sole M, Maron BJ, Seidman JG, and Seidman CE. 1998. Mutations in the gene for cardiac myosin-binding protein C and late-onset familial hypertrophic cardiomyopathy. N. Engl. J. Med. 338:1248-1257.
Okagaki T, Weber FE, Fischman DA, Vaughan KT, Mikawa T, and Reinach FC.
1993. The major myosin-binding domain of skeletal muscle MyBP-C (C protein) resides in the COOH-terminal, immunoglobulin C2 motif. J. Cell. Biol. 123:619-626.
Opie LH. 2004a. Introductory cardiovascular concepts. In Heart Physiology: From
cell to circulation. Vol. Fouth Edition. L.H. Opie, editor. Lippincott Williams & Wilkins, Philadelphia, PA. 3-15.
Opie LH. 2004b. Heart cells and organelles. In Heart Physiology: From cell to
circulation. Vol. Fouth Edition. L.H. Opie, editor. Lippincott Williams & Wilkins, Philadelphia, PA. 42-69.
Opie LH, and Solaro RJ. 2004. Myocardial contraction and relaxation. In Heart
Physiology: From cell to circulation. Vol. Fouth Edition. L.H. Opie, editor. Lippincott Williams & Wilkins, Philadelphia, PA. 221-246.
Palombella VJ, Rando OJ, Goldberg AL, and Maniatis T. 1994. The ubiquitin-
proteasome pathway is required for processing the NF-kappa B1 precursor protein and the activation of NF-kappa B. Cell. 78:773-85.
Pohlmann L, Kroger I, Vignier N, Schlossarek S, Kramer E, Coirault C, Sultan KR,
El-Armouche A, Winegrad S, Eschenhagen T, and Carrier L. 2007. Cardiac myosin-binding protein C is required for complete relaxation in intact myocytes. Circ Res. 101:928-38.
Razeghi P, Baskin KK, Sharma S, Young ME, Stepkowski S, Essop MF, and
Taegtmeyer H. 2006. Atrophy, hypertrophy, and hypoxemia induce transcriptional regulators of the ubiquitin proteasome system in the rat heart. Biochem Biophys Res Commun. 342:361-4.
Redwood CS, Moolman-Smook JC, and Watkins H. 1999. Properties of mutant
contractile proteins that cause hypertrophic cardiomyopathy. Cardiovasc. Res. 44:20-36.
Rehwinkel J, Raes J, and Izaurralde E. 2006. Nonsense-mediated mRNA decay:
Target genes and functional diversification of effectors. Trends Biochem Sci. 31:639-46.
References
143
Richard P, Isnard R, Carrier L, Dubourg O, Donatien Y, Mathieu B, Bonne G, Gary F, Charron P, Hagège A, Komajda M, Schwartz K, and Hainque B. 1999. Double heterozygosity for mutations in the beta myosin heavy chain and in the cardiac myosin binding protein C genes in a family with hypertrophic cardiomyopathy. J. Med. Genet. 36:542-545.
Richard P, Charron P, Carrier L, Ledeuil C, Cheav T, Pichereau C, Benaiche A,
Isnard R, Dubourg O, Burban M, Gueffet JP, Millaire A, Desnos M, Schwartz K, Hainque B, and Komajda M. 2003. Hypertrophic Cardiomyopathy: Distribution of disease genes, spectrum of mutations and implications for molecular diagnosis strategy. Circulation. 107:2227-2232.
Richard P, Villard E, Charron P, and Isnard R. 2006. The genetic bases of
cardiomyopathies. J Am Coll Cardiol. 48:A79-89. Richardson P, McKenna W, Bristow M, Maish B, Mautner B, O'Connell J, Olsen E,
Thiene G, Goodwin J, Gyarfas I, Martin I, and Nordet P. 1996. Report of the 1995 World Health Organisation/International Society and Federation of Cardiology task force on the definition and classification of cardiomyopathies. Circulation. 93:841-842.
Richardson PG, and Anderson KC. 2003. Bortezomib: a novel therapy approved for
multiple myeloma. Clin Adv Hematol Oncol. 1:596-600. Roberts R, and Sigwart U. 2001a. New concepts in hypertrophic cardiomyopathies,
part II. Circulation. 104:2249-52. Roberts R, and Sigwart U. 2001b. New concepts in hypertrophic cardiomyopathies,
part I. Circulation. 104:2113-6. Rock KL, Gramm C, Rothstein L, Clark K, Stein R, Dick L, Hwang D, and Goldberg
AL. 1994. Inhibitors of the proteasome block the degradation of most cell proteins and the generation of peptides presented on MHC class I molecules. Cell. 78:761-71.
Rospert S, Rakwalska M, and Dubaquie Y. 2005. Polypeptide chain termination and
stop codon readthrough on eukaryotic ribosomes. Rev Physiol Biochem Pharmacol. 155:1-30.
Rottbauer W, Gautel M, Zehelein J, Labeit S, Franz WM, Fischer C, Vollrath B, Mall
G, Dietz R, Kübler W, and Katus HA. 1997. Novel splice donor site mutation in the cardiac myosin-binding protein-C gene in familial hypertrophic cardiomyopathy. Characterization of cardiac transcript and protein. J Clin Invest. 100:475-482.
Sadayappan S, Gulick J, Osinska H, Martin LA, Hahn HS, Dorn GW, 2nd, Klevitsky
R, Seidman CE, Seidman JG, and Robbins J. 2005. Cardiac myosin-binding protein-C phosphorylation and cardiac function. Circ Res. 97:1156-63.
References
144
Sadayappan S, Osinska H, Klevitsky R, Lorenz JN, Sargent M, Molkentin JD, Seidman CE, Seidman JG, and Robbins J. 2006. Cardiac myosin binding protein c phosphorylation is cardioprotective. Proc Natl Acad Sci U S A. 103:16918-23.
Sano M, Tokudome S, Shimizu N, Yoshikawa N, Ogawa C, Shirakawa K, Endo J,
Katayama T, Yuasa S, Ieda M, Makino S, Hattori F, Tanaka H, and Fukuda K. 2007. Intramolecular control of protein stability, subnuclear compartmentalization, and coactivator function of peroxisome proliferator-activated receptor gamma coactivator 1alpha. J Biol Chem. 282:25970-80.
Sarikas A, Carrier L, Schenke C, Doll D, Flavigny J, Lindenberg KS, Eschenhagen T,
and Zolk O. 2005. Impairment of the ubiquitin-proteasome system by truncated cardiac myosin binding protein C mutants. Cardiovasc Res. 66:33-44.
Sébillon P, Bonne G, Flavigny J, Venin S, Rouche A, Fiszman M, Vikstrom K,
Leinwand L, Carrier L, and Schwartz K. 2001. COOH-terminal truncated human cardiac MyBP-C alters myosin filament organization. C. R. Acad. Sci. 324:251-260.
Seidman JG, and Seidman CE. 2001. The genetic basis for cardiomyopathy: from
mutation identification to mechanistic paradigms. Cell. 104:557-567. Seiler SH, Fischman DA, and Leinwand LA. 1996. Modulation of myosin filament
organization by C-protein family members. Mol. Biol. Cell. 7:113-127. Sheppard DN, Ostedgaard LS, Rich DP, and Welsh MJ. 1994. The amino-terminal
portion of CFTR forms a regulated Cl- channel. Cell. 76:1091-8. Starr R, and Offer G. 1978. The interaction of C-protein with heavy meromyosin and
subfragment-2. Biochem. J. 171:813-816. Suzuki M, Carlson KM, Marchuk DA, and Rockman HA. 2002. Genetic modifier loci
affecting survival and cardiac function in murine dilated cardiomyopathy. Circulation. 105:1824-9.
Sweeney HL, Straceski AJ, Leinwand LA, Tikunov BA, and Faust L. 1994.
Heterologous expression of a cardiomyopathic myosin that is defective in its actin interaction. J. Biol. Chem. 269:1603-1605.
Tardiff JC, Factor SM, Tompkins BD, Hewett TE, Palmer BM, Moore RL, Schwartz
S, Robbins J, and Leinwand LA. 1998. A truncated cardiac troponin T molecule in transgenic mice suggests multiple cellular mechanisms for familial hypertrophic cardiomyopathy. J. Clin. Invest. 101:2800-2811.
References
145
Tsukamoto O, Minamino T, Okada K, Shintani Y, Takashima S, Kato H, Liao Y, Okazaki H, Asai M, Hirata A, Fujita M, Asano Y, Yamazaki S, Asanuma H, Hori M, and Kitakaze M. 2006. Depression of proteasome activities during the progression of cardiac dysfunction in pressure-overloaded heart of mice. Biochem Biophys Res Commun. 340:1125-33.
Usuki F, Yamashita A, Higuchi I, Ohnishi T, Shiraishi T, Osame M, and Ohno S.
2004. Inhibition of nonsense-mediated mRNA decay rescues the phenotype in Ullrich's disease. Ann Neurol. 55:740-4.
Usuki F, Yamashita A, Kashima I, Higuchi I, Osame M, and Ohno S. 2006. Specific
inhibition of nonsense-mediated mRNA decay components, SMG-1 or Upf1, rescues the phenotype of Ullrich disease fibroblasts. Mol Ther. 14:351-60.
Vidal F, Sage J, Cuzin F, and Rassoulzadegan M. 1998. Cre expression in primary
spermatocytes: a tool for genetic engineering of the germ line. Mol Reprod Dev. 51:274-80.
Watkins H, Conner D, Thierfelder L, Jarcho JA, MacRae C, McKenna WJ, Maron BJ,
Seidman JG, and Seidman CE. 1995. Mutations in the cardiac myosin binding protein-C gene on chromosome 11 cause familial hypertrophic cardiomyopathy. Nature Genet. 11:434-437.
Weber FE, Vaughan KT, Reinach FC, and Fischman DA. 1993. Complete sequence
of human fast-type and slow-type muscle myosin-binding-protein C (MyBP-C). Differential expression, conserved domain structure and chromosome assignment. Eur. J. Biochem. 216:661-669.
Weekes J, Morrison K, Mullen A, Wait R, Barton P, and Dunn MJ. 2003.
Hyperubiquitination of proteins in dilated cardiomyopathy. Proteomics. 3:208-16.
Witt CC, Gerull B, Davies MJ, Centner T, Linke WA, and Thierfelder L. 2001.
Hypercontractile properties of cardiac muscle fibers in a knock-in mouse model of cardiac myosin-binding protein-C. J Biol Chem. 276:5353-5359.
Yang J, Moravec CS, Sussman MA, DiPaola NR, Fu D, Hawthorn L, Mitchell CA,
Young JB, Francis GS, McCarthy PM, and Bond M. 2000. Decreased SLIM1 expression and increased gelsolin expression in failing human hearts measured by high-density oligonucleotide arrays. Circulation. 102:3046-52.
Yang Q, Sanbe A, Osinska H, Hewett TE, Klevitsky R, and Robbins J. 1998. A
mouse model of myosin binding protein C human familial hypertrophic cardiomyopathy. J. Clin. Invest. 102:1292-1300.
Yang Q, Sanbe A, Osinska H, Hewett TE, Klevitsky R, and Robbins J. 1999. In vivo
modeling of myosin binding protein C familial hypertrophic cardiomyopathy. Circ Res. 85:841-847.
References
146
Yang Q, Hewett TE, Klevitsky R, Sanbe A, Wang X, and Robbins J. 2001. PKA-dependent phosphorylation of cardiac myosin binding protein C in transgenic mice. Cardiovasc. Res. 51:80-88.
Yu B, French JA, Carrier L, Jeremy RW, McTaggart DR, Nicholson MR, Hambly B,
Semsarian C, Richmond DR, Schwartz K, and Trent RJ. 1998. Molecular pathology of familial hypertrophic cardiomyopathy caused by mutations in the cardiac myosin binding protein C gene. J Med Genet. 35:205-10.
Zhang J, Sun X, Qian Y, LaDuca JP, and Maquat LE. 1998. At least one intron is
required for the nonsense-mediated decay of triosephosphate isomerase mRNA: a possible link between nuclear splicing and cytoplasmic translation. Mol Cell Biol. 18:5272-83.
Zhang XH, Heller KA, Hefter I, Leslie CS, and Chasin LA. 2003. Sequence
information for the splicing of human pre-mRNA identified by support vector machine classification. Genome Res. 13:2637-50.
Zolk O, Schenke C, and Sarikas A. 2006. The ubiquitin-proteasome system: focus on
the heart. Cardiovasc Res. 70:410-21.
Appendix
147
7 Appendix
7.1 Abbreviations
AA amino acids
AMC 7-amino-4-methylcoumarin
α-MHC α-myosin heavy chain
AMVM adult mouse ventricular myocytes
ANP atrial natriuretic peptide
APS ammonium persulfate
AT annealing temperature
ATP adenosine 5'-triphosphate
AU arbitrary unit
β2AR β2 adrenergic receptor
BDM 2,3-butanedione monoxime
β-MHC β-myosin heavy chain
βNA β-naphtylamide
BNP brain natriuretic peptide
bp base pairs
BSA bovine serum albumin
BW body weight
°C degree Celsius
cAMP cyclic adenosine monophosphate
cDNA complementary deoxyribonucleic acid
CHX cycloheximide
CMV-IE cytomegalovirus immediate early
Ct threshold cycle
cter COOH-terminus
cTnT cardiac troponin T
d diastole
Da dalton
dCTP deoxycytidine triphosphate
DMEM Dulbecco’s modified Eagle medium
Appendix
148
DMSO dimethyl sulfoxide
DNA deoxyribonucleic acid
dNTP deoxynucleoside triphosphate
DTT dithiothreitol
E1 ubiquitin-activating enzyme
E2 ubiquitin-conjugating enzyme
E3 ubiquitin ligase enzyme
ECG electrocardiogram
ECL enhanced chemiluminescence
EDTA ethylenediaminetetraacetic acid
EF-2 elongation factor 2
e.g. exempli gratia (for example)
EJC exon junction complex
Emet emetine
Epo epoxomicin
eRF eukaryotic release factor
ES embryonic stem
et al. et alii (and others)
F founder line
FAM 6-carboxy-fluorescein
FBS fetal bovine serum
FCS fetal calf serum
FHC familial hypertrophic cardiomyopathy
Fig. figure
FN fibronectin
FR fluorescent reporter
FS fractional shortening
g gram
GAPDH glyceraldehyde-3-phosphate dehydrogenase
GD GFPdgn
GFP green fluorescent protein
h hours
HBSS Hank’s balanced salt solution
HCM hypertrophic cardiomyopathy
HEPES 4-(2-hydroxyethyl)piperazine-1-ethanesulfonic acid
Appendix
149
Het heterozygous cMyBP-C knock-in
HR homologous recombination
HSVtk herpes simplex virus thymidine kinase
hum human
HW heart weight
Hz hertz
IC50 half maximal inhibitory concentration
i.e. id est (that is)
IgG immunoglobulin G
Inc. incorporation
i.p. intraperitonal
i.v. intravenous
IVS interventricular septum
kb kilobase
kDa kilodalton
kg kilogram
KI homozygous cMyBP-C knock-in
KO homozygous cMyBP-C knock-out
LB Luria-Bertani
LMM light meromyosin
LSM laser scanning microscopy
LV left ventricular
LVH left ventricular hypertrophy
LVID left ventricular internal diameter
LVM left ventricular mass
LVPW left ventricular posterior wall
M molar
mA milliampere
MEM minimum essential medium
mg milligram
MGB minor groove binder
MHz megahertz
min minutes
ml milliliter
mM millimolar
Appendix
150
µg microgram
µl microliter
µM micromolar
Miss missense
mo months
MW molecular weight (marker)
mRNA messenger ribonucleic acid
MyBP-C myosin-binding protein-C
cMyBP-C cardiac myosin-binding protein-C
n number
ng nanogram
NIH National Institutes of Health
nm nanometer
nM nanomolar
NMCM neonatal mouse cardiomyocytes
NMD nonsense-mediated mRNA decay
No. number
Nons nonsense
NRCM neonatal rat cardiomyocytes
nt nucleotides
Nter amino-terminus
oligo(dT) oligodeoxythymidylic acid
P probability
PA polyadenylation
PBS phosphate buffered saline
PCR polymerase chain reaction
pGK phosphoglycerate kinase
PKA protein kinase A (also known as cAMP-dependent protein kinase)
PTC premature termination codon
r Spearmen value
RFU relative fluorescence unit
RNA ribonucleic acid
rpm rotation per minute
RT reverse transcription
s systole
Appendix
151
S2 subfragment 2
s.c. subcutaneous
SDS sodium dodecyl sulfate
sec seconds
SEM standard error of the mean
SMG suppressor with morphogenetic effect on genitalia
Suc succinyl
SV40 Simian vacuolating virus 40
Sycp-1 synatonemal complex protein 1
TAMRA 6-carboxy-tetramethyl-rhodamine
TBE Tris borate EDTA
TBS-T Tris buffered saline with Tween® 20
TE Tris-HCl EDTA
TEMED tetramethylethylenediamine
TG transgenic M7t
Tris Trishydroxymethylaminomethane
TV targeting vector
U unit
Ub ubiquitin
UG UbG76V-GFP
UPF1-3 up-frameshift protein 1-3
UPS ubiquitin-proteasome system
V volt
vs. versus
VW ventricular weight
wk weeks
WT wild-type
Appendix
152
7.2 Standard amino acid abbreviations
Alanine Ala A
Arginine Arg R
Asparagine Asn N
Aspartic acid Asp D
Cysteine Cys C
Glutamic acid Glu E
Glutamine Gln Q
Glycine Gly G
Histidine His H
Isoleucine Ile I
Leucine Leu L
Lysine Lys K
Methionine Met M
Phenylalanine Phe F
Proline Pro P
Serine Ser S
Threonine Thr T
Trypthophan Trp W
Tyrosine Tyr Y
Valine Val V
7.3 Risk and safety phrases
Risk (R-) and safety (S-) phrases are an essential guideline for labeling dangerous
chemicals to ensure their safe use. R-phrases display a general description of the
physio-chemical, environmental and health hazards of a substance. S-phrases provide
information on safe storage, handling, disposal, first-aid and employee protection. R-
and S-phrases must be given if the preparation contains at least one substance
classified as dangerous to man or the environment or if the preparation is otherwise
regarded as dangerous.
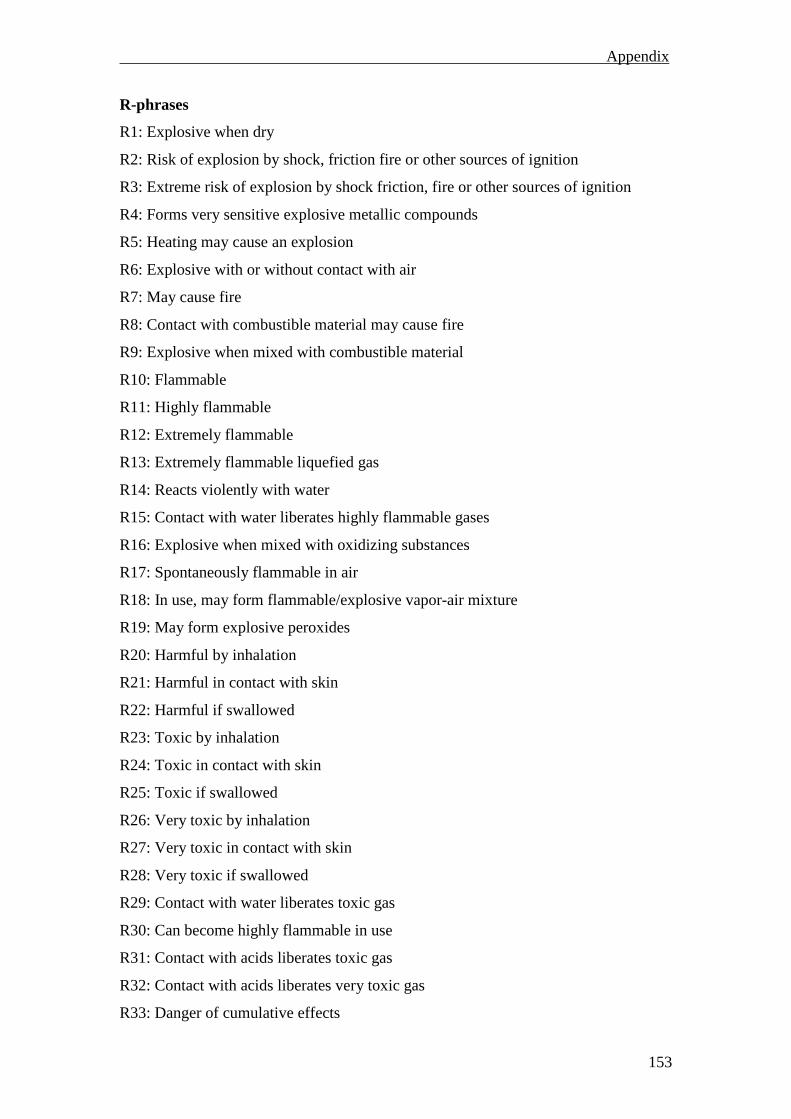
Appendix
153
R-phrases
R1: Explosive when dry
R2: Risk of explosion by shock, friction fire or other sources of ignition
R3: Extreme risk of explosion by shock friction, fire or other sources of ignition
R4: Forms very sensitive explosive metallic compounds
R5: Heating may cause an explosion
R6: Explosive with or without contact with air
R7: May cause fire
R8: Contact with combustible material may cause fire
R9: Explosive when mixed with combustible material
R10: Flammable
R11: Highly flammable
R12: Extremely flammable
R13: Extremely flammable liquefied gas
R14: Reacts violently with water
R15: Contact with water liberates highly flammable gases
R16: Explosive when mixed with oxidizing substances
R17: Spontaneously flammable in air
R18: In use, may form flammable/explosive vapor-air mixture
R19: May form explosive peroxides
R20: Harmful by inhalation
R21: Harmful in contact with skin
R22: Harmful if swallowed
R23: Toxic by inhalation
R24: Toxic in contact with skin
R25: Toxic if swallowed
R26: Very toxic by inhalation
R27: Very toxic in contact with skin
R28: Very toxic if swallowed
R29: Contact with water liberates toxic gas
R30: Can become highly flammable in use
R31: Contact with acids liberates toxic gas
R32: Contact with acids liberates very toxic gas
R33: Danger of cumulative effects
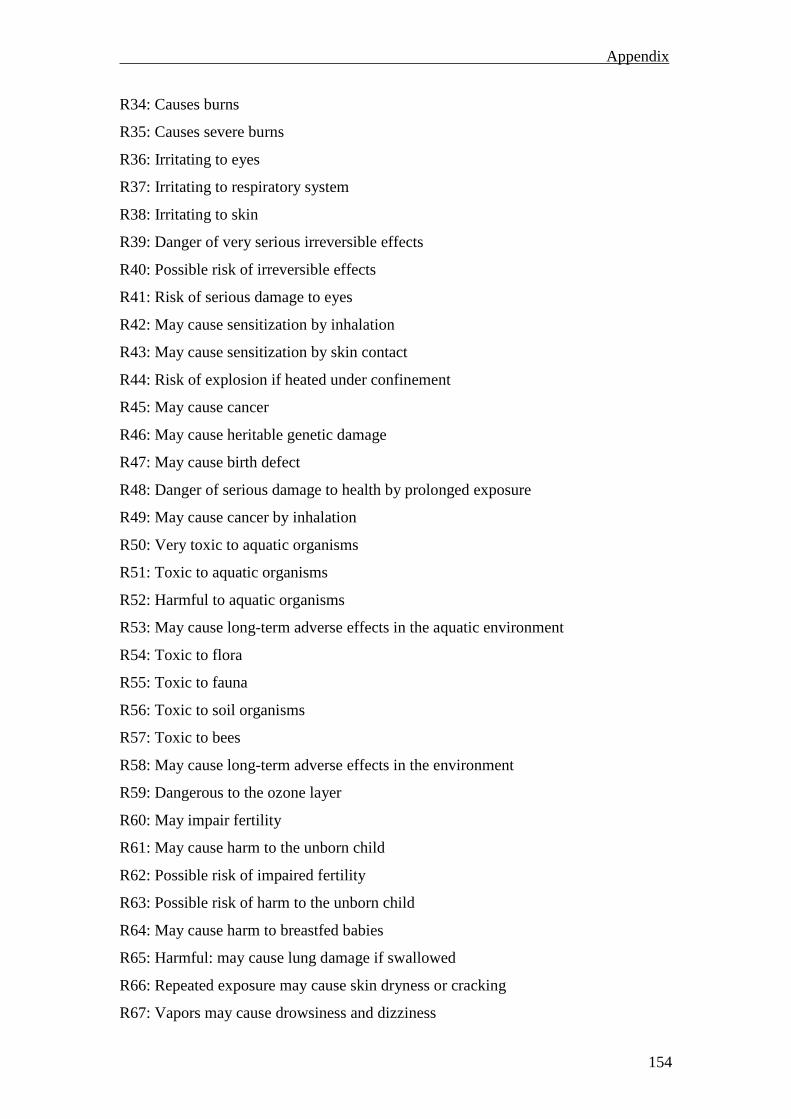
Appendix
154
R34: Causes burns
R35: Causes severe burns
R36: Irritating to eyes
R37: Irritating to respiratory system
R38: Irritating to skin
R39: Danger of very serious irreversible effects
R40: Possible risk of irreversible effects
R41: Risk of serious damage to eyes
R42: May cause sensitization by inhalation
R43: May cause sensitization by skin contact
R44: Risk of explosion if heated under confinement
R45: May cause cancer
R46: May cause heritable genetic damage
R47: May cause birth defect
R48: Danger of serious damage to health by prolonged exposure
R49: May cause cancer by inhalation
R50: Very toxic to aquatic organisms
R51: Toxic to aquatic organisms
R52: Harmful to aquatic organisms
R53: May cause long-term adverse effects in the aquatic environment
R54: Toxic to flora
R55: Toxic to fauna
R56: Toxic to soil organisms
R57: Toxic to bees
R58: May cause long-term adverse effects in the environment
R59: Dangerous to the ozone layer
R60: May impair fertility
R61: May cause harm to the unborn child
R62: Possible risk of impaired fertility
R63: Possible risk of harm to the unborn child
R64: May cause harm to breastfed babies
R65: Harmful: may cause lung damage if swallowed
R66: Repeated exposure may cause skin dryness or cracking
R67: Vapors may cause drowsiness and dizziness
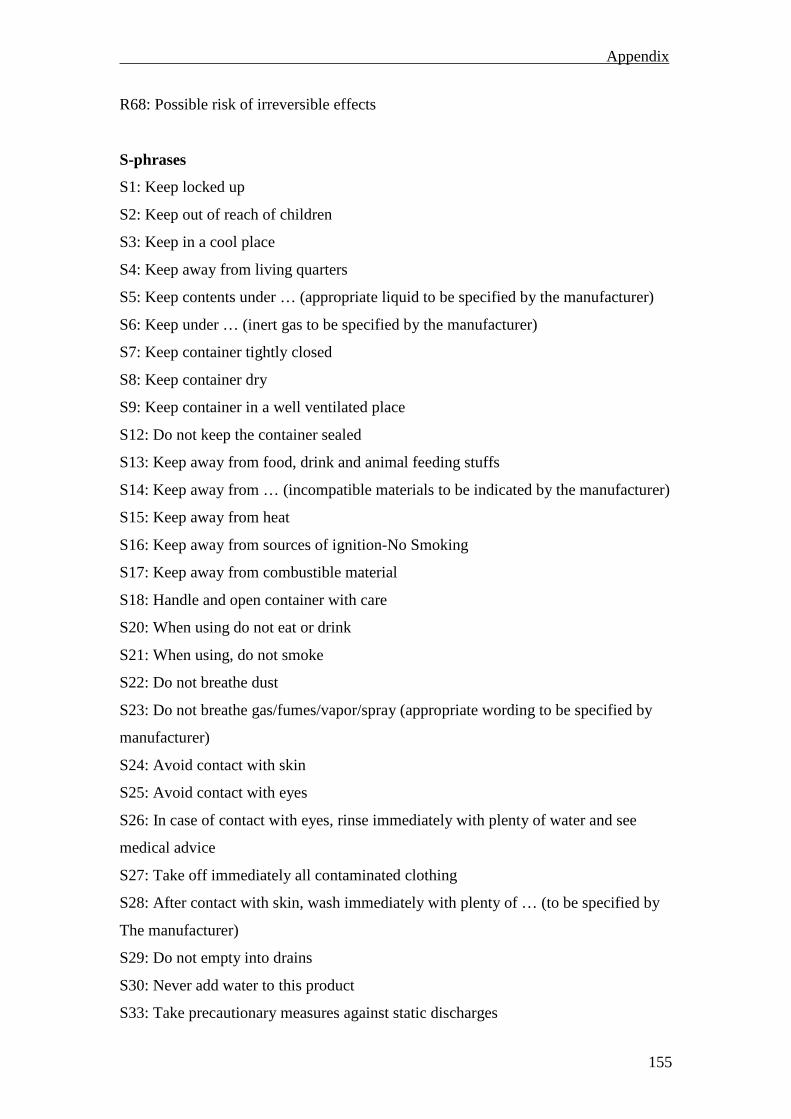
Appendix
155
R68: Possible risk of irreversible effects
S-phrases
S1: Keep locked up
S2: Keep out of reach of children
S3: Keep in a cool place
S4: Keep away from living quarters
S5: Keep contents under … (appropriate liquid to be specified by the manufacturer)
S6: Keep under … (inert gas to be specified by the manufacturer)
S7: Keep container tightly closed
S8: Keep container dry
S9: Keep container in a well ventilated place
S12: Do not keep the container sealed
S13: Keep away from food, drink and animal feeding stuffs
S14: Keep away from … (incompatible materials to be indicated by the manufacturer)
S15: Keep away from heat
S16: Keep away from sources of ignition-No Smoking
S17: Keep away from combustible material
S18: Handle and open container with care
S20: When using do not eat or drink
S21: When using, do not smoke
S22: Do not breathe dust
S23: Do not breathe gas/fumes/vapor/spray (appropriate wording to be specified by
manufacturer)
S24: Avoid contact with skin
S25: Avoid contact with eyes
S26: In case of contact with eyes, rinse immediately with plenty of water and see
medical advice
S27: Take off immediately all contaminated clothing
S28: After contact with skin, wash immediately with plenty of … (to be specified by
The manufacturer)
S29: Do not empty into drains
S30: Never add water to this product
S33: Take precautionary measures against static discharges
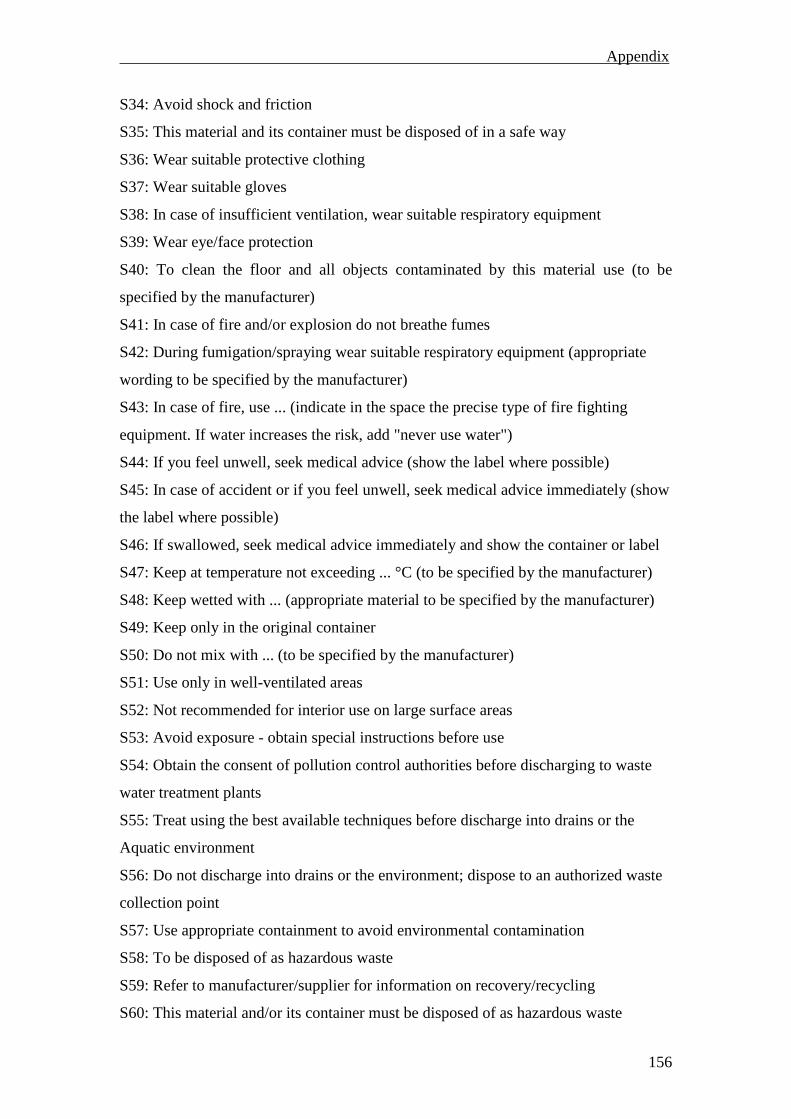
Appendix
156
S34: Avoid shock and friction
S35: This material and its container must be disposed of in a safe way
S36: Wear suitable protective clothing
S37: Wear suitable gloves
S38: In case of insufficient ventilation, wear suitable respiratory equipment
S39: Wear eye/face protection
S40: To clean the floor and all objects contaminated by this material use (to be
specified by the manufacturer)
S41: In case of fire and/or explosion do not breathe fumes
S42: During fumigation/spraying wear suitable respiratory equipment (appropriate
wording to be specified by the manufacturer)
S43: In case of fire, use ... (indicate in the space the precise type of fire fighting
equipment. If water increases the risk, add "never use water")
S44: If you feel unwell, seek medical advice (show the label where possible)
S45: In case of accident or if you feel unwell, seek medical advice immediately (show
the label where possible)
S46: If swallowed, seek medical advice immediately and show the container or label
S47: Keep at temperature not exceeding ... °C (to be specified by the manufacturer)
S48: Keep wetted with ... (appropriate material to be specified by the manufacturer)
S49: Keep only in the original container
S50: Do not mix with ... (to be specified by the manufacturer)
S51: Use only in well-ventilated areas
S52: Not recommended for interior use on large surface areas
S53: Avoid exposure - obtain special instructions before use
S54: Obtain the consent of pollution control authorities before discharging to waste
water treatment plants
S55: Treat using the best available techniques before discharge into drains or the
Aquatic environment
S56: Do not discharge into drains or the environment; dispose to an authorized waste
collection point
S57: Use appropriate containment to avoid environmental contamination
S58: To be disposed of as hazardous waste
S59: Refer to manufacturer/supplier for information on recovery/recycling
S60: This material and/or its container must be disposed of as hazardous waste

Appendix
157
S61: Avoid release to the environment. Refer to special instructions / safety data sheet
S62: If swallowed, do not induce vomiting: seek medical advice immediately and
Show the container label
S63: In case of accident by inhalation: remove casualty to fresh air and keep at rest
S64: If swallowed, rinse mouth with water (only if the person is conscious)
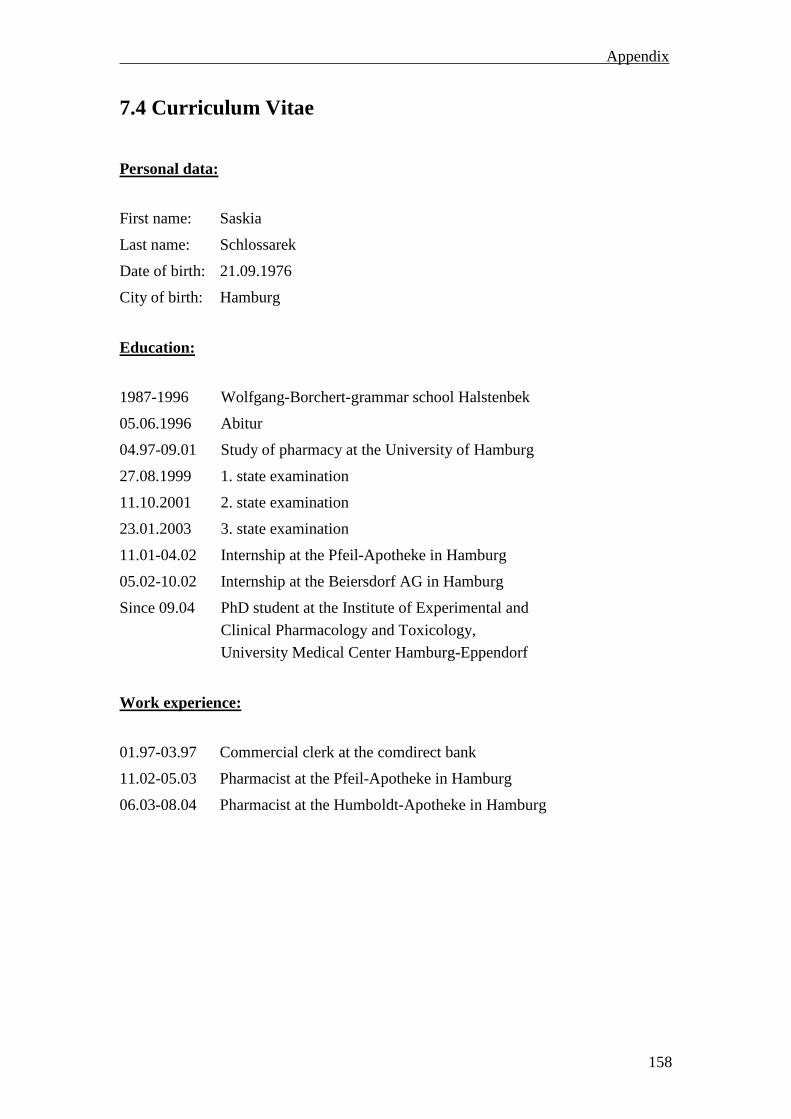
Appendix
158
7.4 Curriculum Vitae
Personal data:
First name: Saskia
Last name: Schlossarek
Date of birth: 21.09.1976
City of birth: Hamburg
Education:
1987-1996 Wolfgang-Borchert-grammar school Halstenbek
05.06.1996 Abitur
04.97-09.01 Study of pharmacy at the University of Hamburg
27.08.1999 1. state examination
11.10.2001 2. state examination
23.01.2003 3. state examination
11.01-04.02 Internship at the Pfeil-Apotheke in Hamburg
05.02-10.02 Internship at the Beiersdorf AG in Hamburg
Since 09.04 PhD student at the Institute of Experimental and
Clinical Pharmacology and Toxicology,
University Medical Center Hamburg-Eppendorf
Work experience:
01.97-03.97 Commercial clerk at the comdirect bank
11.02-05.03 Pharmacist at the Pfeil-Apotheke in Hamburg
06.03-08.04 Pharmacist at the Humboldt-Apotheke in Hamburg
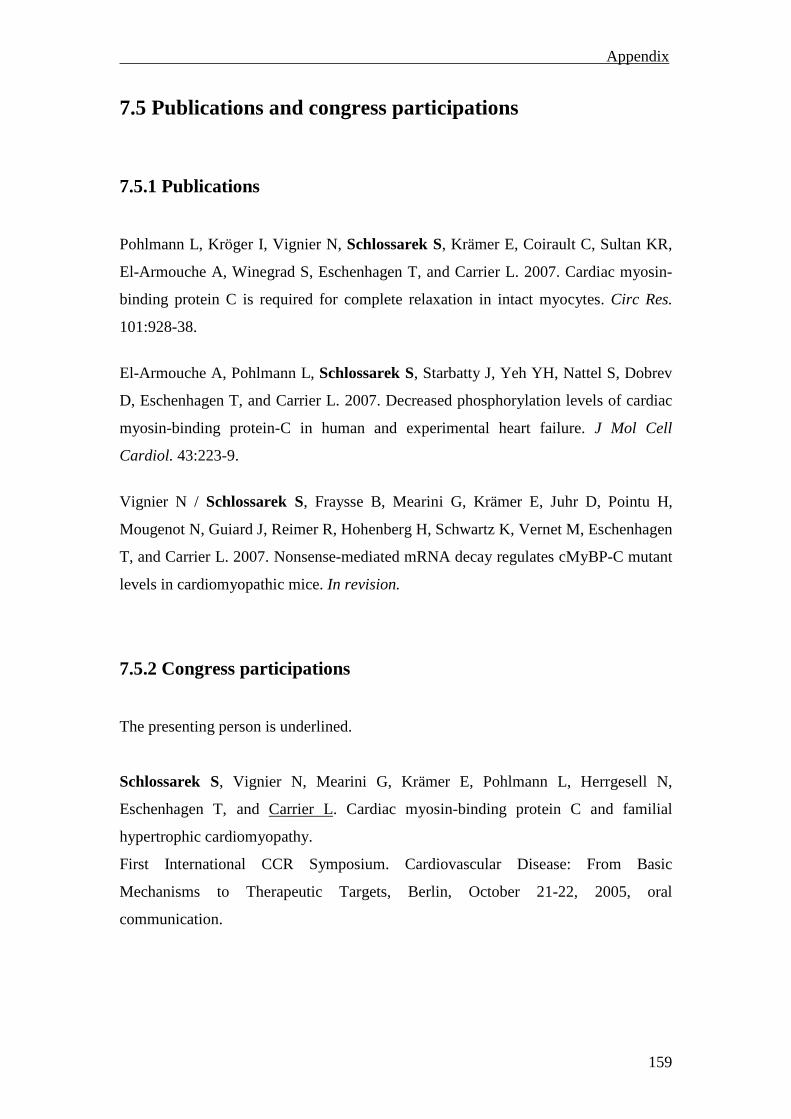
Appendix
159
7.5 Publications and congress participations
7.5.1 Publications
Pohlmann L, Kröger I, Vignier N, Schlossarek S, Krämer E, Coirault C, Sultan KR,
El-Armouche A, Winegrad S, Eschenhagen T, and Carrier L. 2007. Cardiac myosin-
binding protein C is required for complete relaxation in intact myocytes. Circ Res.
101:928-38.
El-Armouche A, Pohlmann L, Schlossarek S, Starbatty J, Yeh YH, Nattel S, Dobrev
D, Eschenhagen T, and Carrier L. 2007. Decreased phosphorylation levels of cardiac
myosin-binding protein-C in human and experimental heart failure. J Mol Cell
Cardiol. 43:223-9.
Vignier N / Schlossarek S, Fraysse B, Mearini G, Krämer E, Juhr D, Pointu H,
Mougenot N, Guiard J, Reimer R, Hohenberg H, Schwartz K, Vernet M, Eschenhagen
T, and Carrier L. 2007. Nonsense-mediated mRNA decay regulates cMyBP-C mutant
levels in cardiomyopathic mice. In revision.
7.5.2 Congress participations
The presenting person is underlined.
Schlossarek S, Vignier N, Mearini G, Krämer E, Pohlmann L, Herrgesell N,
Eschenhagen T, and Carrier L. Cardiac myosin-binding protein C and familial
hypertrophic cardiomyopathy.
First International CCR Symposium. Cardiovascular Disease: From Basic
Mechanisms to Therapeutic Targets, Berlin, October 21-22, 2005, oral
communication.
Appendix
160
Schlossarek S, Vignier N, Mearini G, Pohlmann L, Krämer E, Eschenhagen T, and
Carrier L. Instability of cardiac myosin-binding protein C mutant in mouse models of
familial hypertrophic cardiomyopathy: involvement of the ubiquitin-proteasome
system?
5th International Ascona Workshop on Cardiomyocyte Cell Biology: Differentiation,
Stability of Cytoarchitecture and Therapeutic Potential of Heart Muscle Cells, Monte
Verità, Ascona, April 2-6, 2006, oral communication.
Schlossarek S, Vignier N, Krämer E, Mearini G, Eschenhagen T, and Carrier L.
Instability of cardiac myosin-binding protein C mutant in two new mouse models of
familial hypertrophic cardiomyopathy: implication of the ubiquitin-proteasome
system?
72nd Annual Meeting of the German Society for Cardiology and Cardiovascular
Research, Mannheim, April 20-22, 2006, oral communication.
Schlossarek S, Vignier N, Krämer E, Mearini G, Eschenhagen T, and Carrier L.
Instability of cardiac myosin-binding protein C mutant in two new mouse models of
familial hypertrophic cardiomyopathy: implication of the ubiquitin-proteasome
system?
Les Printemps de la Cardiologie, Toulouse, May 10-13, 2006, oral communication.
Schlossarek S, Vignier N, Sultan K, Krämer E, Mearini G, Eschenhagen T, and
Carrier L. Evidence of alterations of the ubiquitin-proteasome system in mouse
models of familial hypertrophic cardiomyopathy. Circulation. 114:II_166.
American Heart Association (Scientific Sessions 2006), Chicago, IL, November 12-
15, 2006, oral communication.
Pohlmann L, Kröger I, Vignier N, Schlossarek S, Krämer E, Coirault C, El-
Armouche A, Winegrad S, Eschenhagen T, and Carrier L. Effects of cardiac myosin-
binding protein C knockout (KO) on intact isolated cardiac myocytes.
51st Annual Meeting of the Biophysical Society, Baltimore, MD, March 3-7, 2007.
Appendix
161
Schlossarek S, Vignier N, Mearini G, Eschenhagen T, and Carrier L. Nonsense-
mediated mRNA decay and ubiquitin-proteasome system regulate the level of
cMyBP-C mutants in cardiomyopathic mice.
73rd Annual Meeting of the German Society for Cardiology and Cardiovascular
Research, Mannheim, April 12-14, 2007, oral communication.
Englmann D, Sultan K, Schlossarek S, Vignier N, Eschenhagen T, and Carrier L.
Alterations of the ubiquitin-proteasome system in targeted cMyBP-C mice with
hypertrophic cardiomyopathy.
73rd Annual Meeting of the German Society for Cardiology and Cardiovascular
Research, Mannheim, April 12-14, 2007, oral communication.
Pohlmann L, Kröger I, Vignier N, Schlossarek S, Krämer E, Coirault C, El-
Armouche A, Winegrad S, Eschenhagen T, and Carrier L. Cardiac myosin-binding
protein C is required for complete sarcomere relaxation in intact myocytes: Evidence
from a knock-out mouse model.
73rd Annual Meeting of the German Society for Cardiology and Cardiovascular
Research., Mannheim, April 12-14, 2007, oral communication.
Vignier N, Schlossarek S, Pointu H, Mougenot N, Schwartz K, Vernet M, and Carrier
L. Nonsense-mediated mRNA decay regulates cMyBP-C mutant levels in
cardiomyopathic mice.
24th congress of GRRC, Biologie et Pathologie du Coeur et des vaisseaux, Tours,
April 25-27, 2007, oral communication.
Schlossarek S. Alteration of the ubiquitin-proteasome system in mouse models of
familial hypertrophic cardiomyopathy.
Marie Curie Symposium – The ubiquitin-proteasome system in cardiovascular disease,
Hamburg, June 8-9, 2007, oral communication.
Appendix
162
Decostre V, Arimura T, Muchir A, Khouzami L, Belus A, Schlossarek S, Varnous S,
Adamy C, Durand M, Guerchet N, Candiani G, Massart C, Pavlidis P, Herron AJ,
Fougerousse F, Poggesi C, Carrier L, Worman HJ, Pecker F, and Bonne G. Striated
muscle investigation of a KI-Lmna mouse model of Emery-Dreifuss muscular
dystrophy and effect of the N-acetyl-L-cysteine treatment.
7th Japanese-French Workshop on “Development of molecular therapy toward
muscular dystrophy”, Hayama, June 8-9, 2007, oral communication.
Schlossarek S, Vignier N, Mearini G, Guiard J, Schwartz K, Vernet M, Eschenhagen
T, and Carrier L. Nonsense-mediated mRNA decay degrades cMyBP-C mutants in
cardiomyopathic mice. J Mol Cell Cardiol. 42:S129-S130.
XIX World Congress of the ISHR, Bologna, June 22-26, 2007.
Sultan K, Schlossarek S, Englmann D, Vignier N, Eschenhagen T, and Carrier L.
Alterations of the ubiquitin-proteasome system in cardiomyopathic cMyBP-C mice. J
Mol Cell Cardiol. 42:S167.
XIX World Congress of the ISHR, Bologna, June 22-26, 2007.
Appendix
163
7.6 Declaration
I declare that the work reported in the dissertation submitted to the University of
Hamburg and entitled
Investigation of molecular mechanisms regulating the expression of cMyBP-C
mutants in familial hypertrophic cardiomyopathy
was realized in person in the Institute of Experimental and Clinical Pharmacology and
Toxicology under the supervision of Prof. Dr. Thomas Eschenhagen. All sources of
information as well as the results obtained in collaboration with other people are
pointed out.
The dissertation has not been submitted in whole or in part for a degree at any other
university.
Hamburg, January 2008
_____________________
Saskia Schlossarek
Appendix
164
7.7 Acknowledgement
I thank Prof. Dr. Thomas Eschenhagen for supervising and supporting me during my
thesis.
I thank Prof. Dr. Michael Korth for the supervision of my thesis in the Department of
Chemistry of the University of Hamburg.
I would like to express my sincere gratitude to Dr. Lucie Carrier for her committed
supervision and constant encouragement during all phases of my thesis. She
motivated me a lot and I would not have proceeded so far without her never-ending
energy and magnificent support.
Many thanks go to the staff members of the institute for the great working atmosphere.
In particular, I would like to thank Lisa Krämer for the assistance with the cloning and
many advices concerning the practical work in the lab, Birgit Geertz for the assistance
with the echocardiography, Lutz Pohlmann for the assistance with the isolation of the
AMVM, Denise Juhr for the assistance with the genotyping, Christina Gedicke for
proofreading this thesis, Dr. Karim Sultan, Dr. Felix Friedrich, Daniel Englmann and
Nessan Herrgesell. In addition, I thank Lisa, Birgit and Christina for the immense
mental support, which they provided to me not only in the lab, but also during
congress participations. My most sincere thanks are directed to Dr. Giulia Mearini.
When she started working in the institute, many things turned to be much easier for
me than before. She was always there for me and supported me in many theoretical
and practical issues. I’m very thankful that she proofread this thesis and that she was
my hotel room mate during quite all congresses.
I wish to thank all my friends for “remaining” friends throughout these difficult times
and for all the mental support outside the lab, especially Katrin Schwerin, Carolin
Jahnke and Dr. Vida Zohrabi-Kalantari, who went through the same “misery” as I.
Finally and especially, I wish to thank my parents Manfred and Regina, my brother
Simon, my cousin Petra and Rafael Vidal-López, who are the most important persons
in my life. They always believe in me and have to “bear” my self-doubts. Without
their confidence in me I would not be there where I am now.