Embed Size (px)
Citation preview

Atmos. Chem. Phys., 9, 1017–1036, 2009www.atmos-chem-phys.net/9/1017/2009/© Author(s) 2009. This work is distributed underthe Creative Commons Attribution 3.0 License.
AtmosphericChemistry
and Physics
Investigation of NOx emissions and NOx-related chemistry in EastAsia using CMAQ-predicted and GOME-derived NO2 columns
K. M. Han 1, C. H. Song1, H. J. Ahn1, R. S. Park1, J. H. Woo2, C. K. Lee1,3, A. Richter4, J. P. Burrows4, J. Y. Kim 5, andJ. H. Hong6
1Dept. of Environmental Science and Engineering, Gwangju Institute of Science and Technology (GIST), Gwangju, Korea2Department of Advanced Technology Fusion, Konkuk University, Seoul, Korea3Department of Physics and Atmospheric Science, Dalhousie University, Halifax, Nova Scotia, Canada4Institute of Environmental Physics, University of Bremen, Otto-Hahn-Allee 1, 28359, Bremen, Germany5Hazardous Substance Research Center, Korea Institute of Science and Technology (KIST), Seoul, Korea6Air Pollution Cap System Division, National Institute of Environmental Research (NIER), Incheon, Korea
Received: 21 July 2008 – Published in Atmos. Chem. Phys. Discuss.: 17 September 2008Revised: 17 December 2008 – Accepted: 7 January 2009 – Published: 11 February 2009
Abstract. In this study, NO2 columns from the US EPAModels-3/CMAQ model simulations carried out using the2001 ACE-ASIA (Asia Pacific Regional Aerosol Character-ization Experiment) emission inventory over East Asia werecompared with the GOME-derived NO2 columns. Therewere large discrepancies between the CMAQ-predicted andGOME-derived NO2 columns in the fall and winter seasons.In particular, while the CMAQ-predicted NO2 columns pro-duced larger values than the GOME-derived NO2 columnsover South Korea for all four seasons, the CMAQ-predictedNO2 columns produced smaller values than the GOME-derived NO2 columns over North China for all seasons withthe exception of summer (summer anomaly). It is believedthat there might be some error in the NOx emission esti-mates as well as uncertainty in the NOx chemical loss ratesover North China and South Korea. Regarding the latter, thisstudy further focused on the biogenic VOC (BVOC) emis-sions that were strongly coupled with NOx chemistry duringsummer in East Asia. This study also investigated whetherthe CMAQ-modeled NO2/NOx ratios with the possibly over-estimated isoprene emissions were higher than those withreduced isoprene emissions. Although changes in both theNOx chemical loss rates and NO2/NOx ratios from CMAQ-modeling with the different isoprene emissions affected theCMAQ-modeled NO2 levels, the effects were found to belimited, mainly due to the low absolute levels of NO2 in
Correspondence to:C. H. Song([email protected])
summer. Seasonal variations of the NOx emission fluxesover East Asia were further investigated by a set of sensi-tivity runs of the CMAQ model. Although the results stillexhibited the summer anomaly possibly due to the uncer-tainties in both NOx-related chemistry in the CMAQ modeland the GOME measurements, it is believed that consider-ation of both the seasonal variations in NOx emissions andthe correct BVOC emissions in East Asia are critical. Over-all, it is estimated that the NOx emissions are underestimatedby ∼57.3% in North China and overestimated by∼46.1% inSouth Korea over an entire year. In order to confirm the un-certainty in NOx emissions, the NOx emissions over SouthKorea and China were further investigated using the ACE-ASIA, REAS (Regional Emission inventory in ASia), andCAPSS (Clean Air Policy Support System) emission inven-tories. The comparison between the CMAQ-calculated andGOME-derived NO2 columns indicated that both the ACE-ASIA and REAS inventories have some uncertainty in NOxemissions over North China and South Korea, which can alsolead to some errors in modeling the formation of ozone andsecondary aerosols in South Korea and North China.
1 Introduction
Nitrogen oxides (NOx≡NO+NO2) emitted from anthro-pogenic sources, such as fossil fuel combustion and biomassburning, as well as natural sources, such as lightning andmicrobiological processes in soil, play important roles in
Published by Copernicus Publications on behalf of the European Geosciences Union.

1018 K. M. Han et al.: NOx emissions and NOx-related chemistry in East Asia
tropospheric ozone chemistry and secondary aerosol forma-tion. Several studies have focused on NOx emissions fromChina to determine their influence on air quality and aerosolradiative forcing in East Asia (e.g., Uno et al., 2007; Wanget al., 2007; Zhang et al., 2007). Recent studies using satel-lite measurements reported that NO2 columns (or NO2 ver-tical column density, VCD) have increased significantly inEast Asia since 2001 (Richter et al., 2005; van der A etal., 2006; He et al., 2007). Such increases in NOx emis-sions over China were confirmed partly by a bottom-up emis-sion inventory study (Zhang et al., 2007). In order to testthe accuracy of NOx emissions, several studies were car-ried out over East Asia comparing the 3-D model-predictedNO2 columns with satellite-derived NO2 columns (Kunhikr-ishnan et al., 2004; Ma et al., 2006; van Noije et al., 2006;Uno et al., 2007). The comparisons revealed large incon-sistencies between the NO2 columns from the 3-D CTM(Chemistry-Transport Model) simulations and the satellite-derived NO2 columns. For example, Uno et al. (2007) re-ported that the 3-D CTM-derived NO2 columns with theREAS (Regional Emission inventory in ASia) emission in-ventory were lower by a factor of 2–4 over polluted CentralEast China, compared with the GOME (Global Ozone Mon-itoring Experiment)-retrieved NO2 columns. In addition, Maet al. (2006) also reported that the 3-D CTM-derived NO2columns with the ACE-ASIA (Asia Pacific Regional AerosolCharacterization Experiment) emission inventory underesti-mated the NOx emissions over China during the summer forthe year 2000 by more than 50% compared with the GOME-derived NO2 columns. However, there has been no detailedinvestigation carried out as to how and why the NO2 columnsover China were under-predicted by 3-D CTM simulation us-ing the ACE-ASIA or REAS inventory. In addition, there areno reports on the possibly important seasonal (or monthly)variations in NOx emissions in East Asia and the relation-ship between the rates of NOx chemical loss and the fluxes ofbiogenic isoprene emissions in East Asia, even though theycould be important factors for evaluating NOx emissions.The latter (biogenic emissions) could be important becausethey can control the levels of OH radicals, which can affectthe NOx chemical loss rates.
On the other hand, an accurate estimation of NOx emis-sions in China is important because NOx emissions fromNorth China tend to persistently affect the air quality ofSouth Korea (e.g., Arndt et al., 1998). From 2003, the Ko-rean government began to implement an ambitious pollutionabatement policy that aimed at improving the air quality ofSeoul Metropolitan area, called the “Total Air Pollution LoadManagement System”, by reducing the levels of secondarypollutants, such as O3, PANs (Peroxy Acetyl Nitrates), andnitrate (Korean Ministry of Environment, 2006). This pol-icy included a specific plan to reduce the total anthropogenicNOx emissions from the Seoul Metropolitan area by 53%,from 309 387 Ton yr−1 to 145 412 Ton yr−1. The referenceand target years for the Total Air Pollution Load Manage-
ment System are 2001 and 2014, respectively. However, thecritical and largest uncertainty in implementing this policyis to evaluate and quantify accurately the influences of theemissions outside the policy domain on the air quality of theSeoul Metropolitan area. Due to the strong and persistentsource-receptor relationship between North China and SouthKorea, it is important to use accurate emission inventoriesfor both the source (“North China”) and the receptor regions(“Seoul Metropolitan area” or “South Korea”) for the refer-ence and target years, 2001 and 2014.
This study examined the accuracy of NOx emissions fromNorth China and South Korea using the CMAQ-simulatedand GOME-derived NO2 columns. In addition to the un-certainty in NOx emission itself, this paper also discussedthe possibly important uncertainty factors that could causeinconsistencies between the CMAQ-derived and GOME-derived NO2 columns. In particular, both seasonal varia-tions in the NOx emissions and the HOx-NOx-isoprene pho-tochemistry in East Asia were examined in detail on ac-count of its possibly strong relationship with the incon-sistency between the CMAQ-simulated and GOME-derivedNO2 columns in East Asia.
2 Experimental methods
In this study, three dimensional Eulerian CTM simulationsover East Asia were carried out in conjunction with theMeteorological fields generated from the PSU/NCAR MM5(Pennsylvania state University/National Center for Atmo-spheric Research Meso-scale Model 5) model in order tocompare the CTM-predicted NO2 columns with the satellite(GOME)-derived NO2 columns.
2.1 US EPA Models-3/CMAQ modeling
In this study, a 3-D Eulerian CTM, US EPA Models-3/CMAQ (Community Multi-scale Air Quality) model wasused in conjunction with the MET fields generated fromPSU/NCAR MM5 modeling over an approximately 3 weekperiod for four seasons: Late Fall (9–27 November 2001),Spring (25 March 2002–13 April 2002), Late Summer(24 August 2002–13 September 2002), and Winter (11–28February 2003) (Byun and Ching, 1999; Byun and Schere,2006). The details of the modeling conditions were re-ported by Song et al. (2008). For the MET fields, the2.5◦
×2.5◦ resolved re-analyzed National Centers for En-vironmental Prediction (NCEP) data with automated dataprocessing (ADP) of the global surface and upper air ob-servations were employed using four-dimensional data as-similation (FDDA) techniques (Stauffer and Seaman, 1990,1994). The MET fields were generated at “1-h intervals”during the four episode periods. The CMAQ modeling sys-tem then used the meteorological fields generated from thePSU/NCAR MM5 and emission fields. The schemes selected
Atmos. Chem. Phys., 9, 1017–1036, 2009 www.atmos-chem-phys.net/9/1017/2009/

K. M. Han et al.: NOx emissions and NOx-related chemistry in East Asia 1019
in CMAQ modeling are as follows: the piece-wise parabolicmethod (PPM) for advection (Collela and Woodward, 1984);4th generation carbon bond mechanism (CBM 4) for gasphase chemistry (Gery et al., 1989); the Carnegie-MellonUniversity (CMU) aqueous chemistry mechanism for cloudchemistry (Pandis and Seinfeld, 1989; Fahey and Pandis,2003); the AERO3 module for particulate dynamics andaerosol thermodynamics (Binkowski and Roselle, 2003); andthe Wesley scheme for the dry deposition of both gaseousand particulate species (Wesley, 1989). The 4th genera-tion carbon bond mechanism for gas-phase chemistry in-cluded explicit VOC species, such as ALD2 (higher alde-hyde, C>2), ETH (ethane), FORM (formaldehyde), ISOP(isoprene), OLE (olefin), PAR (paraffin), TOL (toluene), andXYL (xylene). As indicated above, far more detailed atmo-spheric chemistry and physical processes, aerosol dynam-ics, and thermodynamic gas-aerosol processes were consid-ered in these calculations than in other global and regionalchemistry-transport modeling studies in order to better con-sider the atmospheric fate of NOx. For example, in this studythe analysis was not restricted to “clear sky conditions”. Inother words, it fully considered cloud chemistry, wet scav-enging, and the effects of clouds on the photolysis reactionrates.
The horizontal domain of the CMAQ modeling shownin Fig. 1 covered the region from approximately 100◦ Eto 150◦ E and 20◦ N to 50◦ N, which included Korea,Japan, China, and parts of Mongolia and Russia with a108 km×108 km grid resolution. For vertical resolution, 24layers were used withσ -coordinates using the model-top at180 hPa. For comparison, NO2 vertical column loading wasintegrated from the surface to 250 hPa (approximately corre-sponding to∼10 km a.s.l. in these calculations). The CMAQ-modeled NO2 columns were averaged between 10:00 LSTand 12:00 LST because the GOME measurements were takenapproximately at 10:30 LST over East Asia. The total num-ber of the grid points in the CMAQ model calculations was36 432. Figure 1 also shows the four main study regionsused for the comparison studies: i) North China (Region A,30◦ N–42◦ N; 110◦ E–125◦ E); ii) South China (Region B,22◦ N–30◦ N; 108◦ E–122◦ E); iii) South Korea (Region C,33.5◦ N–40◦ N; 125◦ E to 130◦ E); and iv) Japan (Region D,31◦ N–40◦ N; 130◦ E–142◦ E). Here, the remote continentalareas in China were excluded from our analysis, partly be-cause they are remote areas, and the NO2 columns showeda similar order of magnitude of the absolute errors to theGOME measurements (∼1015 molecules cm−2).
2.2 Emissions
Emission is an important input parameter in a modelingstudy. Poor agreement between 3-D modeling studies andsatellite measurements is expected if the emission inven-tories incorrectly reflect the seasonal and spatial emissionfluxes from the various sources. In order to consider anthro-
Fig. 1. Modeling domain of the study. Four regions were defined:i) A: North China, ii) B: South China, iii) C: South Korea, and iv)D: Japan.
pogenic emissions, 1◦×1◦ resolved emission data for 9 majorspecies, including SO2, NOx, CO, NMVOCs (Non-MethaneVolatile Organic Compounds), CH4, NH3, CO2, BC, andOC, were obtained from the official ACE-ASIA and TRACE-P (Transport and Chemical Evaluation over Pacific) emissionweb site at the University of Iowa (http://www.cgrer.uiowa.edu/EMISSIONDATA/index.htm). Streets et al. (2003) pro-vided detailed information on the emission inventory (here-after, labeled the ACE-ASIA inventory) used in this study.The ACE-ASIA emission inventory included NOx emissionsfrom fossil fuels and bio-fuel combustion as well as biomass(vegetation) burning in East Asia. However, the inventorydid not consider the NOx emissions from lightning and mi-crobial activity in soil. In general, emission from lightning isbelieved to make a small contribution to the total NOx budget(Martin et al., 2003). On the other hand, Wang et al. (2007)reported that soil NOx emissions might be important, ac-counting for up to∼43% of the combustion source duringsummer in East Asia. In addition, the original ACE-ASIAemission inventory was built up for the year 2000. There-fore, the NOx emissions for East Asia were modified slightlyby multiplying a factor of 1.05 in order to account for an an-nual increase in NOx emissions from China for the year 2001(Zhang et al., 2007).
www.atmos-chem-phys.net/9/1017/2009/ Atmos. Chem. Phys., 9, 1017–1036, 2009
1020 K. M. Han et al.: NOx emissions and NOx-related chemistry in East Asia
Fig. 2. Three-day backward trajectory analysis for air masses arriving in Seoul, Korea in 2001. The trajectories are obtained at 1 km a.s.l.,and are shown at 1 h intervals:(a) January,(b) February,(c) March, (d) April, (e) May, (f) June,(g) July, (h) August,(i) September,(j)October,(k) November, and(l) December.
Anthropogenic NMVOC emissions were assumed to beconstant without any seasonal variation. In this study,chemical speciation (chemical species splitting) of the to-tal NMVOC emissions in East Asia was performed using
the SPECIATE database built up by the US EPA. The ma-jor biogenic 1◦×1◦ resolved emissions data of isoprene andmonoterpene were obtained from the Global Emissions In-ventory Activity (GEIA, http://geiacenter.org/presentData/
Atmos. Chem. Phys., 9, 1017–1036, 2009 www.atmos-chem-phys.net/9/1017/2009/

K. M. Han et al.: NOx emissions and NOx-related chemistry in East Asia 1021
Fig. 3. Seasonal variations in the CMAQ-derived NO2columns (unit:×1015molecules cm−2) in the first column andGOME-derived NO2 columns in the second column (unit:×1015molecules cm−2). The differences between the CMAQ-derived and GOME-derived NO2 columns are shown in the thirdcolumn.
nvoc.html), which was created as an activity of the Interna-tional Geosphere-Biosphere Program (IGBP).
2.3 NO2 retrieval algorithm from ESA/ERS-2GOME platform
GOME was launched on the ERS-2 satellite by EuropeanSpace Agency (ESA) in April 1995. It is a nadir-scanningdouble-monochromator, and obtains approximately 30 000radiance spectra each day covering the ultraviolet and visi-ble wavelengths from 240 to 790 nm at a moderate spectralresolution of 0.17 to 0.33 nm. Because GOME is a nadirviewing instrument, both tropospheric and stratospheric ab-sorptions contribute to the measured signals. The groundscene of GOME typically has a footprint of 320×40 km2.Total ground coverage is obtained within 3 days at the equa-tor with a 960 km wide track swath (4.5 s forward scan and1.5 s backward scan).
The NO2 analysis for GOME is based on a DifferentialOptical Absorption Spectroscopy (DOAS) retrieval method(Richter and Burrows, 2002; Richter et al., 2005). The wave-length range of 425–450 nm was used for the NO2 DOASfit because the differential absorption is large and interfer-ence by other species is small. In addition to the NO2 cross-
Fig. 4. As Fig. 3, except for closing in South Korea.
section (Burrows et al., 1998), the cross-sections of O3 (Bur-rows et al., 1999), O4 (Greenblatt et al., 1990), H2O (Roth-man et al., 1992), a synthetic Ring spectrum (Vountas et al.,1998), and an undersampling correction (Chance, 1998) wereincluded in the fit. In order to calculate the tropospheric NO2slant column, the stratospheric contribution of NO2 to themeasured slant column was removed by subtracting the slantcolumn taken on the same day at the same latitude in the180◦–230◦ longitude region from the total slant column us-ing the reference sector method (Richter and Burrows, 2002).Cloud screening was applied to remove measurements witha cloud fraction>0.3, as determined from the GOME mea-surements using the FRESCO (Fast Retrieval Scheme forClouds from the Oxygen A-band) algorithm (Koelemeijer etal., 2001). The tropospheric slant column was then convertedto a vertical tropospheric column using the appropriate airmass factor (AMF). The AMF is defined as the ratio of theobserved slant column to the vertical column and was calcu-lated with using the radiative transfer model (SCIATRAN)(Rozanov et al., 1997). The monthly averaged AMF on a2.5◦
×2.5◦ grid was determined using the NO2 vertical pro-files (shape facor) from a global chemical transport model,MOZART-2 (Model for Ozone and Related Tracers).
The error budget of satellite measurements of tropo-spheric NO2 columns from GOME has been discussedin detail (e.g. Richter and Burrows, 2002; Martin et al.,2003; Boersma et al., 2004; Richter et al., 2005; vanNoije et al., 2006). The main contributions to the error
www.atmos-chem-phys.net/9/1017/2009/ Atmos. Chem. Phys., 9, 1017–1036, 2009

1022 K. M. Han et al.: NOx emissions and NOx-related chemistry in East Asia
(a) SPRING
GOME (1015 molec cm-2)
0 5 10 15 20 25 30
CM
AQ (1
015
mol
ec c
m-2
)
0
5
10
15
20
25
30North ChinaSouth China South KoreaJapan
South Korea
North China
(b) SUMMER
GOME (1015 molec cm-2)
0 5 10 15 20 25 30
CM
AQ (1
015
mol
ec c
m-2
)
0
5
10
15
20
25
30
South Korea
North China
(c) FALL
GOME (1015 molec cm-2)
0 5 10 15 20 25 30
CM
AQ (1
015
mol
ec c
m-2
)
0
5
10
15
20
25
30
South Korea
North China
(d) WINTER
GOME (1015 molec cm-2)
0 5 10 15 20 25 30
CM
AQ (1
015
mol
ec c
m-2
)
0
5
10
15
20
25
30
South Korea
North China
(e) ALL SEASONS
GOME (1015 molec cm-2)
0 5 10 15 20 25 30
CM
AQ (1
015
mol
ec c
m-2
)
0
5
10
15
20
25
30
South Korea
North China
Fig. 5. Scatter plots between the CMAQ-derived and GOME-derived NO2 columns for(a) spring,(b) summer,(c) fall, (d) winter,and (e) all seasons. North China (red circles), South China (opencircles), South Korea (blue triangles), and Japan (green triangles).
are slant column fitting uncertainties, uncertainties relatedto the subtraction of the stratospheric contributions, un-certainties from residual clouds, and AMF. For an indi-vidual GOME pixel, the slant column fitting uncertain-ties were 2×10¹⁴
−4×10¹⁴ molecules cm−2 and the uncer-tainties in the subtraction of the stratospheric contribu-tion were<1×10¹⁵ molecules cm−2 (Richter and Burrows,2002). These values can be reduced further by averagingthe space or time. In remote regions, the retrieval errorswere dominated by uncertainties in the slant column fittingand the subtraction of the stratospheric contributions. How-ever, these uncertainties are relatively small in polluted re-gions. The total uncertainties in the retrieval of troposphericNO2 columns over continental polluted regions is largely de-termined by the AMF calculation due to surface reflectiv-ity, clouds, aerosols, and the trace gas profile (Richter et al.,2005; van Noije et al., 2006). An overall assessment of er-rors leads to 5×10¹⁴
−1×10¹⁵ molecules cm−2 for additiveerror and 40–60% for relative error for the monthly averagesover polluted areas (Richter and Burrows, 2002; Richter etal., 2005). More detailed error and uncertainty analysis ofthe GOME NO2 columns can be found in the previous pub-lications (Richter and Burrows, 2002; Martin et al., 2003;Boersma et al., 2004; Richter et al., 2005; van Noije et al.,2006).
3 Results and discussions
In order to properly determine the contributions from NorthChina emissions to air quality of South Korea, it is impor-tant to evaluate the accuracy of the NOx emission invento-ries over both regions and understand NOx-related gas-phasechemistry. Initially, 3-day backward trajectory analysis wasconducted (Sect. 3.1) to confirm the strong source-receptorrelationship between North China (A) and South Korea (C).Subsequently, the CMAQ-predicted NO2 columns are thenspatially and seasonally compared with the GOME-derivedNO2 columns (Sect. 3.2). The ACE-ASIA NOx emissions inNorth China (A, source region) and South Korea (C, recep-tor region) are then compared with other recently-releasedinventories such as, REAS, “date-back” ANL (Argonne Na-tional Laboratory) inventory, and CAPSS (Sect. 3.3).
3.1 Backward trajectory analysis
In this study, a 3-day backward trajectory analysis for eachmonth of 2001 was carried out using the NOAA HYSPLITmodel (Draxler, 1998) to confirm the persistent source (NorthChina, A)-receptor (South Korea, C) relationship, as well asto determine how frequently the air masses travel from NorthChina (A) to South Korea (C). Approximately 20 days permonth were selected. The trajectory ends at a point (37.5◦ N,127.0◦ E) at an altitude of 1 km under which Seoul is located.As shown in Fig. 2, the air masses traveled from North China(A) to South Korea (C) during almost the entire year. How-ever, in July, the air masses appear to be affected by the emis-sions from South China (B). In August and September, theair masses arrive in Seoul from the North, East, South (Au-gust) and the Northeast (September). Although air massesdo not always travel from North China (A) to Seoul duringJuly, August, and September, it is clear that the South Koreanair quality is most strongly and persistently affected by theemissions from North China (A) throughout almost the en-tire year. Therefore, in the framework of the source-receptorrelationship, this study focused particularly on the emissionsfrom two regions, North China (A) and South Korea (C).
3.2 CMAQ-predicted and GOME-derived NO2 columns,NOx emissions, and NOx-related chemistry inEast Asia
3.2.1 CMAQ-predicted vs. GOME-derived NO2 columns
Figure 3 shows the spatial distributions of the CMAQ-predicted NO2 columns and the GOME-derived NO2columns for four episodes over East Asia. Figure 4 showsa close-up of the area of South Korea for better visual-ization. There were large discrepancies between the twoquantities in the late fall and winter seasons (i.e. cold sea-sons), as well as strong seasonal variations, particularly inthe GOME-derived NO2 columns. Interestingly, the CMAQ-predicted NO2 columns were larger than the GOME-derived
Atmos. Chem. Phys., 9, 1017–1036, 2009 www.atmos-chem-phys.net/9/1017/2009/
K. M. Han et al.: NOx emissions and NOx-related chemistry in East Asia 1023
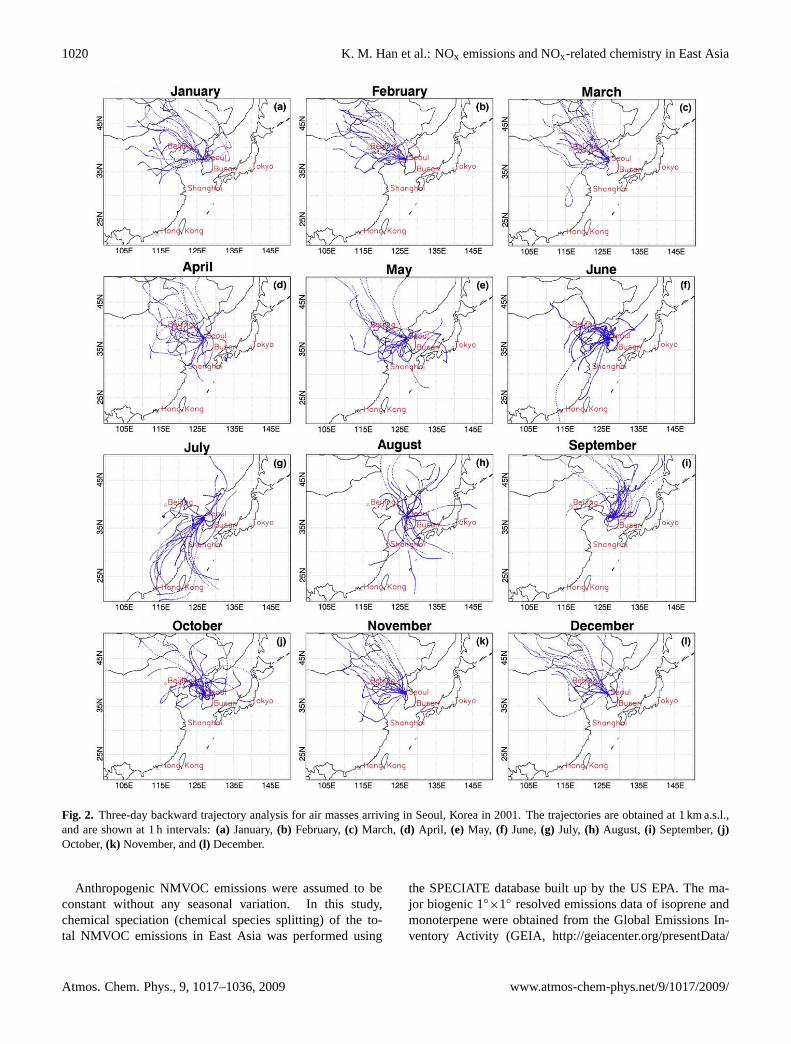
NO2 columns for all seasons over South Korea (C) (Fig. 4).On the other hand, the CMAQ-calculated NO2 columns overNorth China (A) were smaller than the GOME-derived NO2columns for all seasons except for summer (Fig. 3). Notethat the differences between the CMAQ-calculated and theGOME-derived NO2 columns in the third column in Figs. 3and 4 have negative values (“blue colors”) over North China(A) and positive values (“red-orange colors”) over SouthKorea (C). Scatter plots between the CMAQ-predicted andGOME-derived NO2 columns were also made for NorthChina (A), South China (B), South Korea (C), and Japan(D) for further confirmation. Figure 5 shows that there areno clear seasonal trends in South China (B) and Japan (D),whereas the CMAQ-predicted NO2 columns over South Ko-rea (C) are obviously larger than the GOME-derived NO2columns for all seasons. In addition, the CMAQ-predictedNO2 columns over North China (A) were clearly smaller thanthe GOME-derived NO2 columns for all seasons except forsummer. These results are further confirmed through statis-tical analyses (see Sect. 3.2.2). These results suggest thatthere are some errors in the estimations of NOx emissionsover North China (A) and South Korea (C) in the ACE-ASIANOx emission inventory. Of course, this inference shouldbe valid only when the following assumption is held: InCMAQ modeling, emission is the largest uncertainty, and theother atmospheric chemical and physical processes are rea-sonably accurate. In this study, we chose the GOME-derivedNO2 columns as reference values, although the GOME mea-surements also have uncertainties, as discussed in Sect. 2.3,mainly from the assumptions made in the radiative transfercalculations (Richter et al., 2005). In this study, we focusedon the highly polluted East Asian regions where the monthlyaverages of NO2 columns reach∼2×10¹⁶ molecules cm−2
(see Figs. 3, 4, and 5; also refer to van Noije et al., 2006and Uno et al., 2007). The NO2 columns are larger than themagnitudes of overall errors of the GOME NO2 column mea-surements, 0.5×10¹⁵
−1×10¹⁵ molecules cm−2. An attemptwas also made to determine why the difference between theCMAQ-predicted and GOME-derived NO2 columns becameminimal only during summer in Fig. 3. This issue is dis-cussed in detail in Sect. 3.2.3.
3.2.2 Statistical analysis
Table 1 shows the seasonal and regional statistical analy-ses between the CMAQ-predicted and GOME-derived NO2columns. The following four statistical parameters were in-troduced for statistical analyses: i) Root Mean Square Error(RMSE, absolute error); ii) Mean Normalized Gross Error(MNGE, relative error); iii) Mean Bias (MB, absolute bias);and iv) Mean Normalized Bias (MNB, relative bias). Thefour statistical parameters are defined in Eqs. (1) to (4):
RMSE=
√√√√ 1
N
N∑1
(NO2,CMAQ−NO2,GOME
)2 (1)
Table 1. Statistical analysis for the comparisons between theCMAQ-predicted and GOME-derived NO2 columns over East Asia.
RMSE1 MNGE2 MB1 MNB2
CMAQ vs. A SPRING 3.14 50.94 −1.99 −26.99GOME SUMMER 1.39 39.54 −1.00 −32.82
FALL 6.67 66.42 −5.73 −65.61WINTER 6.05 63.34 −4.43 −36.28
B SPRING 1.21 71.90 0.28 50.95SUMMER 1.65 41.65 −0.72 −24.05FALL 1.82 34.24 −0.53 −6.26WINTER3 – – – –
C SPRING 3.08 44.34 0.86 17.30SUMMER 2.54 48.59 0.81 24.70FALL 4.35 38.44 0.38 0.98WINTER 3.47 37.85 1.06 13.9
D SPRING 1.81 88.67 −0.00037 41.64SUMMER 1.04 51.88 −0.23 20.85FALL 3.04 50.88 −1.44 −29.47WINTER 2.23 63.76 −0.61 −1.67
A: North China; B: South China; C: South Korea; D: Japan1 Unit, ×1015molecules cm−2
2 Unit, %3 Due to missing values
MNGE=1
N
N∑1
(∣∣NO2,CMAQ−NO2,GOME∣∣
NO2,GOME
)×100 (2)
MB=1
N
N∑1
(NO2,CMAQ−NO2,GOME
)(3)
MNB=1
N
N∑1
(NO2,CMAQ−NO2,GOME
NO2,GOME
)× 100 (4)
In Table 1, RMSE analysis showed that the magnitudes of the“absolute” differences were much larger over North China(A) and South Korea (C) than over South China (B) andJapan (D) (These are denoted as “bold fonts” in Table 1).Large uncertainties are expected over North China (A) andSouth Korea (C). The MNGEs range from 39.6% to 66.4%over North China (A) and from 37.9% to 48.6% over SouthKorea (C). Bias analysis (MB and MNB) showed that theCMAQ-predicted NO2 columns tend to have positive biases,compared with the GOME-derived NO2 columns over SouthKorea (C). In contrast, over North China (A), the CMAQ-predicted NO2 columns tend to have negative biases. Thesestatistical analyses are also in line with the results reported inSect. 3.2.1.
3.2.3 Summer anomaly in NO2 columns over East Asia
The first and second columns in Fig. 3 show seasonalvariations of the NO2 columns over East Asia. TheCMAQ-derived NO2 columns show relatively weak sea-sonal variations in North China (Region A), whereas the
www.atmos-chem-phys.net/9/1017/2009/ Atmos. Chem. Phys., 9, 1017–1036, 2009
1024 K. M. Han et al.: NOx emissions and NOx-related chemistry in East Asia
Month
Aug Sept Oct Nov Dec Jan Feb Mar April May June July
Frac
tion
of A
nnua
l Em
issi
ons
0.00
0.05
0.10
0.15
0.20NOx SO2 BC Average
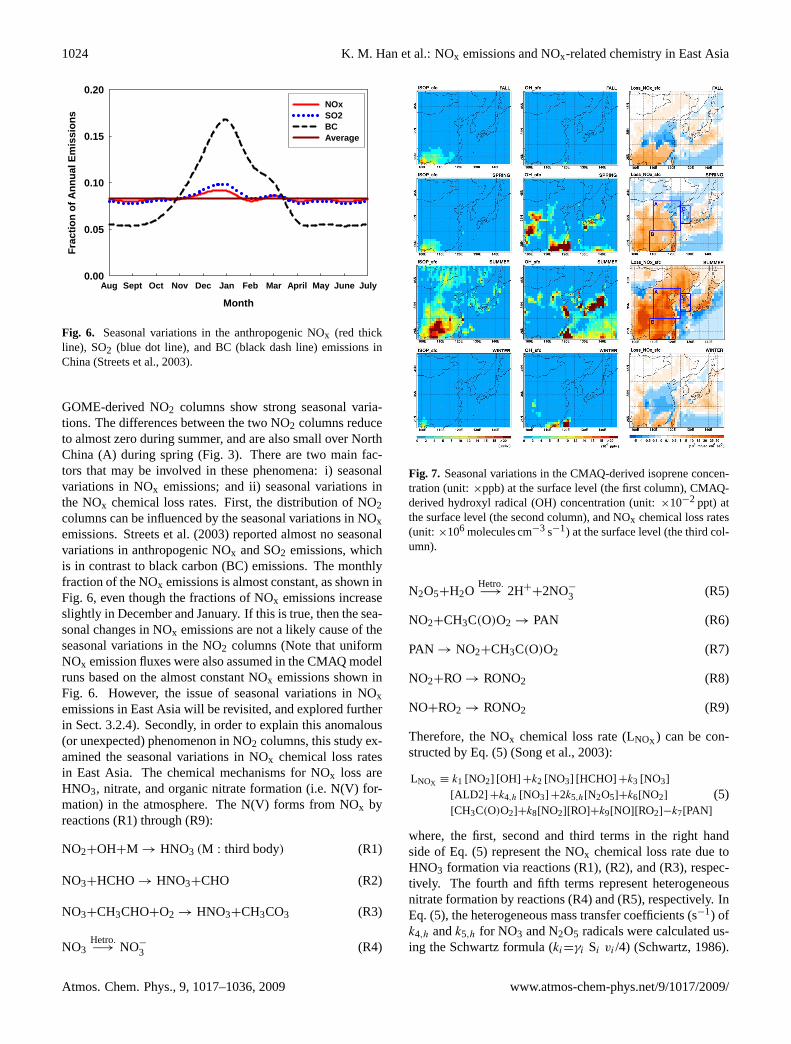
Fig. 6. Seasonal variations in the anthropogenic NOx (red thickline), SO2 (blue dot line), and BC (black dash line) emissions inChina (Streets et al., 2003).
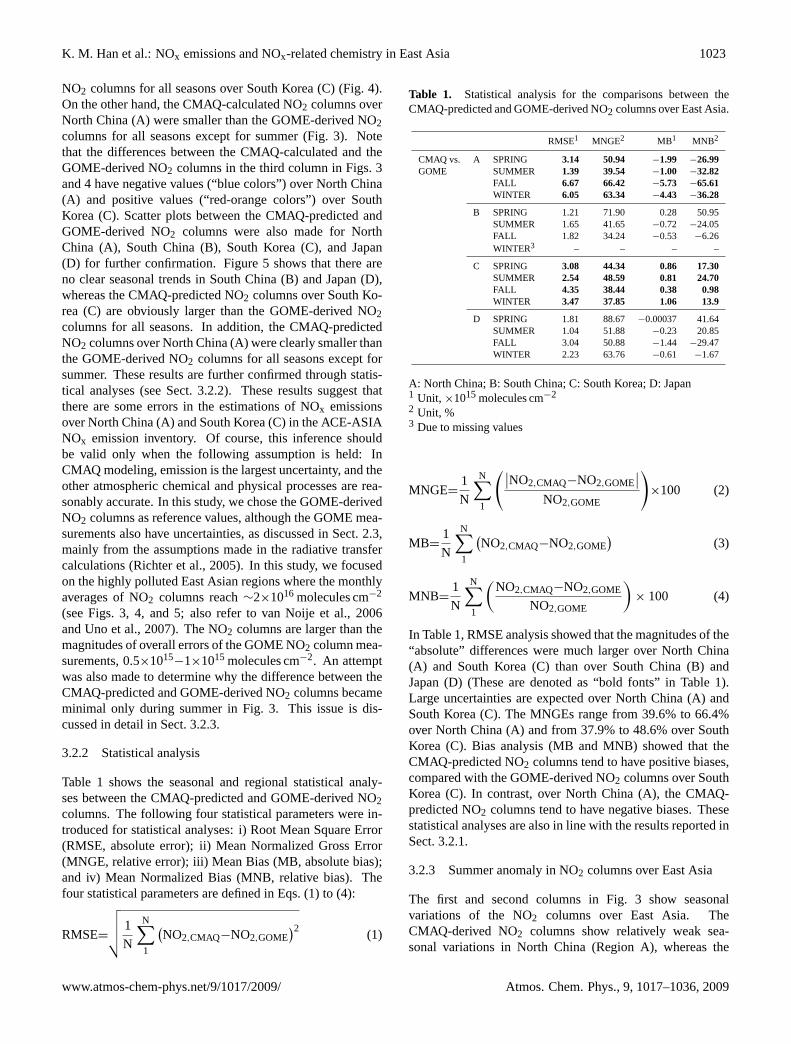
GOME-derived NO2 columns show strong seasonal varia-tions. The differences between the two NO2 columns reduceto almost zero during summer, and are also small over NorthChina (A) during spring (Fig. 3). There are two main fac-tors that may be involved in these phenomena: i) seasonalvariations in NOx emissions; and ii) seasonal variations inthe NOx chemical loss rates. First, the distribution of NO2columns can be influenced by the seasonal variations in NOxemissions. Streets et al. (2003) reported almost no seasonalvariations in anthropogenic NOx and SO2 emissions, whichis in contrast to black carbon (BC) emissions. The monthlyfraction of the NOx emissions is almost constant, as shown inFig. 6, even though the fractions of NOx emissions increaseslightly in December and January. If this is true, then the sea-sonal changes in NOx emissions are not a likely cause of theseasonal variations in the NO2 columns (Note that uniformNOx emission fluxes were also assumed in the CMAQ modelruns based on the almost constant NOx emissions shown inFig. 6. However, the issue of seasonal variations in NOxemissions in East Asia will be revisited, and explored furtherin Sect. 3.2.4). Secondly, in order to explain this anomalous(or unexpected) phenomenon in NO2 columns, this study ex-amined the seasonal variations in NOx chemical loss ratesin East Asia. The chemical mechanisms for NOx loss areHNO3, nitrate, and organic nitrate formation (i.e. N(V) for-mation) in the atmosphere. The N(V) forms from NOx byreactions (R1) through (R9):
NO2+OH+M → HNO3 (M : third body) (R1)
NO3+HCHO → HNO3+CHO (R2)
NO3+CH3CHO+O2 → HNO3+CH3CO3 (R3)
NO3Hetro.−→ NO−
3 (R4)
Fig. 7. Seasonal variations in the CMAQ-derived isoprene concen-tration (unit:×ppb) at the surface level (the first column), CMAQ-derived hydroxyl radical (OH) concentration (unit:×10−2 ppt) atthe surface level (the second column), and NOx chemical loss rates(unit: ×106 molecules cm−3 s−1) at the surface level (the third col-umn).
N2O5+H2OHetro.−→ 2H+
+2NO−
3 (R5)
NO2+CH3C(O)O2 → PAN (R6)
PAN → NO2+CH3C(O)O2 (R7)
NO2+RO → RONO2 (R8)
NO+RO2 → RONO2 (R9)
Therefore, the NOx chemical loss rate (LNOX ) can be con-structed by Eq. (5) (Song et al., 2003):
LNOX ≡ k1 [NO2] [OH] +k2 [NO3] [HCHO] +k3 [NO3][ALD2] +k4,h [NO3] +2k5,h[N2O5]+k6[NO2]
[CH3C(O)O2]+k8[NO2][RO]+k9[NO][RO2]−k7[PAN]
(5)
where, the first, second and third terms in the right handside of Eq. (5) represent the NOx chemical loss rate due toHNO3 formation via reactions (R1), (R2), and (R3), respec-tively. The fourth and fifth terms represent heterogeneousnitrate formation by reactions (R4) and (R5), respectively. InEq. (5), the heterogeneous mass transfer coefficients (s−1) ofk4,h andk5,h for NO3 and N2O5 radicals were calculated us-ing the Schwartz formula (ki=γi Si vi /4) (Schwartz, 1986).
Atmos. Chem. Phys., 9, 1017–1036, 2009 www.atmos-chem-phys.net/9/1017/2009/

K. M. Han et al.: NOx emissions and NOx-related chemistry in East Asia 1025
In the Schwartz formula,γi , Si , andvi represent the reactionprobability, aerosol surface density (µm2 cm−3), and molec-ular mean velocity (cm s−1) for species i, respectively. SincePAN is a temporary reservoir of NOx, both the productionand decomposition terms of PAN (i.e., R6 and R7) wereconsidered in Eq. (5). In addition, in summer organic ni-trate (denoted as RONO2 in the text and NTR in the CBM4mechanism of the CMAQ model) formation is important (R8and R9). Therefore, both reactions were taken into account.Here,R represents the organic functional group.
Among the eight pathways for removing NOx, LNOx is in-fluenced mainly by (R1), (R5), and (R9) in Eq. (5) (partic-ularly, (R1) and (R5) during winter and (R1) and (R9) dur-ing summer). The third column in Fig. 7 shows the model-predicted, spatial distributions of the NOx chemical loss ratesat the surface. As expected, the rates of NOx loss are muchfaster during summer than during the other seasons. How-ever, Fig. 7 shows an unexpected phenomenon. The OHlevels in spring are, on average, higher than those in sum-mer over China. It is believed that this may be caused byactive biogenic VOC (BVOC) emissions in summer (the an-thropogenic NMVOC emissions were kept constant in theCMAQ model runs for the four episodes without seasonalvariations). The first column in Fig. 7 shows the biogenicisoprene concentrations at the surface for the four episodes.The isoprene concentrations were highest during summer.The biogenic isoprene emissions influence the formation ofozone, and affect rates of NOx removal by controlling thelevels of hydroxyl radicals.
Hydroxyl radicals (OH) are produced by O1D+H2O reac-tion and HONO photo-dissociation. Hydroxyl radicals (OH)are converted to perhydroxyl radicals (HO2) or organic per-oxyl radicals (RO2) through reactions with CO, CH4, andVOCs. Formaldehydes (HCHO) are also an important sourceof hydroxyl radicals in that perhydroxyl radicals (HO2) areproduced by HCHO photo-dissociation and HCHO+OH re-action. Perhydroxyl radicals (HO2) or organic peroxyl radi-cals (RO2) convert NO to NO2, and are converted back to hy-droxyl radicals (OH). Figure 8 gives an illustration of theserelationships. Most importantly, the isoprene emissions cancreate a shift in the HOx cycle. Excessive amounts of iso-prene (C5H8) can deplete OH radicals, producing HO2 orRO2 through reaction with excessive isoprene. Subsequently,under the isoprene-abundant environment, HO2 and RO2 rad-icals are removed from the atmosphere producing two prod-ucts, hydrogen peroxides (H2O2) and organic hydroperox-ides (ROOH). Therefore, in summer, the modeled OH con-centrations at the surface are quite low in China, where theisoprene emissions are strong (check the anti-correlation be-tween the isoprene and OH radical concentrations duringsummer in Fig. 7). Therefore, if excessive biogenic isopreneemissions were used in the CMAQ modeling, it is possiblethat the modeled (or virtual) NOx levels could be higher thanthe actual NOx levels due to the underestimated LNOx . Inaddition to isoprene, monoterpenes also convert OH to RO2.
OHHO2RO2
O3 O*Primaryproduction
H2O
CO, Isoprene, monoterpenes HCHO
O3
NONO2
HNO3H2O2
ROOH
OHhv
hv
HONO
hv
HCHO
HOxfamily
Fig. 8. An illustration of the simplified HOx/RO2-NOx-biogenicVOC photochemistry.
However, the CMAQ “v4.3” model only considered the gas-phase isoprene chemistry.
As mentioned in Sect. 2.2, the GEIA emission inventorywas used in this study to consider the BVOC emissions inthe CMAQ modeling. In this inventory, an isoprene flux of20.0 Tg yr−1 over East Asia was estimated. However, Steineret al. (2002) estimated an isoprene flux of only 13.6 Tg yr−1
over East Asia, using the land-cover conditions derived fromthe AVHRR satellite. Furthermore, Fu et al. (2007) recentlyestimated an even lower isoprene flux of 10.8 Tg yr−1 overEast Asia from an inversion analysis of the GOME-retrievedHCHO columns. Overall, the isoprene flux used in this studymight be approximately 1.5 to 2 times larger than those re-ported by Steiner et al. (2002) and Fu et al. (2007). TheCMAQ-simulated HCHO (mostly, isoprene-derived in sum-mer) columns were also compared with the GOME-retrievedHCHO columns for the summer episode (not shown). It wasalso found that the former is 2.23 times larger than the latter.
As indicated by previous discussions, the rates of NOxchemical loss during summer in the CMAQ model simula-tions might be lower than expected, due to the low virtualOH concentrations from the use of possibly overestimatedisoprene emissions in the modeling study. The rates of NOxchemical loss were expected to be faster if the recent iso-prene emissions in East Asia estimated by Fu et al. (2007)were used. Therefore, a set of sensitivity simulations of theCMAQ model were carried out with 100%, 50%, 30%, and0% of the GEIA isoprene emissions in East Asia. The resultsfrom the sensitivity simulations are discussed at the end ofthis section.
In addition, the use of overestimated biogenic isopreneemissions in the CMAQ modeling can affect the NO2/NOxratios. It is generally believed that there is some confidencein the ability of CTMs to simulate the actual NO2/NOx ratios(Martin et al., 2003). The current analysis was also based onthe assumption that the actual NO2/NOx ratios could be suc-cessfully simulated by the CMAQ modeling (Note that the
www.atmos-chem-phys.net/9/1017/2009/ Atmos. Chem. Phys., 9, 1017–1036, 2009

1026 K. M. Han et al.: NOx emissions and NOx-related chemistry in East Asia
GOME platform only measures the NO2 columns, not theNOx columns). Therefore, the correct NO2 fractions are crit-ical in this analysis (Leue et al., 2001). The NO2/NO ratiosat a pseudo-steady state can be estimated by Eq. (6):
[NO2]
[NO]=
k [O3] +k′
[HO2] +k′′
[CH3O2] +k′′′
[RO2]
J1(6)
where J1 is the NO2 photolysis reaction constant (s−1); andk, k
′
, k′′
, andk′′′
(cm3 molecules−1 s−1) are the atmosphericreaction constants for the NO-to-NO2 conversion reactionsthrough NO+O3, NO+HO2, NO+CH3O2, and NO+RO2, re-spectively. The concentrations of HO2 and RO2 might alsobe overestimated if the biogenic isoprene levels are over-predicted using the overvalued isoprene emissions in theCMAQ modeling. This can lead to high NO2/NO ratios inEq. (6), which may result in incorrectly high NO2/NOx ra-tios in the CMAQ modeling.
Figure 9 shows the changes in the NOx chemical loss ratesand NO2/NOx ratios when 100%, 50%, 30%, and 0% ofGEIA isoprene emissions were used in CMAQ modeling. (InFig. 9, Cases I, II, III, and IV represent the CMAQ modelruns that use 100%, 50%, 30%, and 0% of the GEIA isopreneemissions, respectively). The first row shows the CMAQ-calculated NO2 levels at the surface. However, unexpect-edly, the NO2 levels at the surface increased with decreasingisoprene emissions (from Case I to IV). The second, thirdand fourth rows of Fig. 9 show the isoprene levels, OH rad-ical mixing ratios, and NO2/NOx ratios at the surface, re-spectively. As shown in Fig. 9, the isoprene levels decreasecontinuously from Case I to IV. The OH radical concentra-tions increase drastically and the NO2/NOx ratios decrease,as expected. However, the NO2 levels increase, as shown inFig. 9. This is due to the formation of organic nitrates. Thefifth and sixth rows show the CMAQ-estimated LNOx fromEq. (5), and the sum of the PAN and organic nitrate con-centrations. As shown, the sum of PAN and organic nitrateconcentrations (mostly, organic nitrates) decrease drasticallywith decreasing isoprene emissions, which contribute greatlyto the decreases in LNOx in the fifth row of Fig. 9. In otherwords, the increases in LNOx due to the large increase in OHradical concentrations are offset and even partly surpassed bythe decreases in LNOx due to the drastically reduced forma-tion of organic nitrates from Case I to IV. This results in thedecreasing LNOx (the fifth row) and thus the increasing NO2levels (the first row) from Case I to IV.
Here, it should be noted that the rates of organic nitrate for-mation in summer (particularly, “isoprene nitrate” formation)are highly uncertain. Many field, laboratory, and modelingstudies were carried out about the formation rates, yields,and recycling rates of isoprene nitrates in summer (cf. vonKuhlmann et al., 2004; Horowitz et al., 2007; more ref-erences therein). Although the CBM4 mechanism in thisstudy has limitation to deal with the organic nitrate forma-tion and recycling (e.g., CBM4 does not consider the recy-
cling reactions of organic nitrates to NO2), the above discus-sion has possibly important implications in comparison stud-ies between the CTM-calculated and satellite-derived NO2columns (e.g., Kunhikrishnan et al., 2004; Ma et al., 2006;van Noije et al., 2006; Uno et al., 2007). For example,van Noije et al. (2006) carried out 17 global CTM ensem-ble simulations of tropospheric NO2 columns, and comparedthe results with the GOME-retrieved NO2 columns for theyear 2000. They found similar levels and trends of the en-semble NO2 columns over East Asia to those of this studybut without considering the BVOC emissions over East Asia(at least, the coupled BVOC-NOx chemistry was not fullydiscussed). Although the NO2 levels do not vary consider-ably with decreasing BVOC emissions, as shown in the firstrow in Fig. 9, these results might be “completely coinciden-tal” due to the effect of a factor (e.g., organic nitrate forma-tion) offsetting that of another (e.g., OH radical concentra-tions). In the present sensitivity runs, van Noije et al.’s work(2006) corresponds to the fourth column in Fig. 9 (Case IV),whereas in reality, the most likely case would be the sec-ond column in Fig. 9 (Case II) according to Fu et al.’s sug-gestions (2007). Therefore, it should be noted that althoughthe CTM-calculated NO2 columns without BVOC emissions(e.g., Kunhikrishnan et al., 2004; Ma et al., 2006; van Noijeet al., 2006; Uno et al., 2007) are similar to those with BVOCemissions (e.g., this study), the detailed chemistry behind thesimilar CTM-derived NO2 levels would be completely differ-ent.
3.2.4 Monthly variations of NOx emissions in East Asia
The variations in the NOx chemical loss rates were examined.Despite considering the coupled BVOC-NOx chemistry,the largest and smallest differences between the CMAQ-simulated and GOME-retrieved NO2 columns were foundin winter and summer, respectively. This suggests seasonalvariations in NOx emissions in East Asia.
Several studies reported that NOx emissions from fossilfuel combustion in the United States and in East Asia arealmost aseasonal (e.g., Streets et al., 2003; Jaegle et al.,2005). Therefore, several 3-D global and regional CTM stud-ies were carried out with constant (aseasonal) NOx emis-sion fluxes, and were then compared with the GOME- and/orSCIAMACHY-derived NO2 columns (e.g., van Noije et al.,2005; Uno et al., 2007). On the other hand, several re-searchers recently reported that there should be monthly vari-ations in NOx emissions in East Asia (e.g., Kannari et al.,2007; Shin et al., 2008). In this study, the emission analy-sis data in East Asia was collected, and the monthly (or sea-sonal) variations in NOx emissions from four major emissionsectors (industry, power generation, transport, and residen-tial sectors) in China, South Korea, and Japan were investi-gated. Table 2 summarizes the methodologies used for esti-mating the monthly-varying NOx emissions in East Asia. Inparticular, in this study, the monthly variation factors from
Atmos. Chem. Phys., 9, 1017–1036, 2009 www.atmos-chem-phys.net/9/1017/2009/

K. M. Han et al.: NOx emissions and NOx-related chemistry in East Asia 1027
A C
Case IICase I Case IVCase III
Fig. 9. Results from the sensitivity runs of the CMAQ model with 100%, 50%, 30%, and 0% of GEIA isoprene emissions (Case I, II, III,and IV, respectively): NO2 concentrations at the surface (the first row); isoprene concentrations at the surface (the second row); OH radicalconcentrations (the third row); NO2-to-NOx ratios (the fourth row); NOx chemical loss rates (LNOx ) (the fifth row); and the sum of PAN andorganic nitrate concentration (the sixth row). All concentrations were averaged between 10:00 LST and 12:00 LST. The two white boxes onthe panels represent North China (A) and South Korea (C).
www.atmos-chem-phys.net/9/1017/2009/ Atmos. Chem. Phys., 9, 1017–1036, 2009

1028 K. M. Han et al.: NOx emissions and NOx-related chemistry in East Asia
Table 2. Seasonal allocation method for anthropogenic NOx emission fluxes in East Asia.
Region Emission source Reference Percentage of contribution of Remarkcategory the sectors to anthropogenic
NOx emission (%)
China Industry EDGAR inventory 25.8 Averaging industrialcombustion andindustrial process
Power Shin (2008) 44.1 Monthly NOx variationsResidential Streets et al. (2003) 5.6 –Transport Streets et al. (2003); 24.5 –
Wang et al. (2005)
South Korea Industry EDGAR inventory 15.9 Averaging industrialcombustion andindustrial process
Power Shin (2008) 18.7 Monthly NOx variationsResidential Kim (1998) 4.2 –Transport SMOKE factor 61.1 Road traffic survey
from Korean MLTM1
Japan Industry EDGAR inventory 28.2 Averaging industrialcombustion andindustrial process
Power EDGAR inventory 4.3 EDGAR temporal factor2
Residential Kim (1998) 3.7 –Transport Kannari et al. (2007) 63.9 –
1 MLTM: Ministry of Land, Transport, and Maritime;2 EDGAR temporal factors
the power generation sector were estimated from the multi-year NOx mixing ratios measured through the Tele-MeteringSystem (TMS: an automatic pollutant emission monitoringsystem) installed in the power plant (and large-scale pointsource) stacks (Shin, 2008). Figure 10 shows the estimatedmonthly variations in NOx emissions from China, South Ko-rea, and Japan. As shown in Fig. 10, NOx emissions fromChina exhibit strong monthly variations unlike the previousestimations shown in Fig. 6. Based on this, the monthlyvariation factors of the NOx emissions were applied to theModels-3/CMAQ model runs for the four seasonal episodes.
The first column of Fig. 11 shows the NO2 columns fromthe CMAQ model runs with the monthly variations in NOxemissions for the four seasonal episodes (in summer 50%of GEIA isoprene emissions were applied). The GOME-retrieved NO2 columns and the difference between the twoNO2 columns are shown in the second and third columnsin Fig. 11, respectively. As anticipated, the CMAQ-derivedNO2 columns in Fig. 11 show clearer seasonal variations thanthose in Fig. 3. Accordingly, the differences between thetwo NO2 columns decrease. However, the general trend re-mains similar compared with those in Fig. 3. In Table 3, morequantitative (statistical) analysis was carried out. For exam-ple, a comparison of the values in Table 3 with those in Ta-ble 1 shows that the RMSEs are reduced by 13.9%−19.5% in
Month
Jan. Feb. Mar. Apr. May Jun. Jul. Aug. Sep. Oct. Nov. Dec.
Frac
tion
of A
nnua
l NO
x em
issi
on
0.00
0.02
0.04
0.06
0.08
0.10
0.12
0.14
China South Korea Japan Average
Fig. 10. Monthly variations in anthropogenic NOx emissions inChina, South Korea, and Japan.
North China (except for summer), biases (MBs and MNBs)still exhibiting negative.
In spite of the clearer seasonal variations in the CMAQ-simulated NO2 columns, a summer anomaly can be stillfound. Unlike the cold seasons, the absolute levels of theGOME-derived NO2 columns were reported to be low over
Atmos. Chem. Phys., 9, 1017–1036, 2009 www.atmos-chem-phys.net/9/1017/2009/

K. M. Han et al.: NOx emissions and NOx-related chemistry in East Asia 1029
Fig. 11.As in Fig. 3, except for the CMAQ-model runs with 50% of GEIA isoprene emissions and monthly variations in anthropogenic NOxemissions in East Asia.
North China (A) in summer (2−6×10¹⁵ molecules cm−2),which is the actual and basic limitation in efforts to de-termine the same magnitudes of the differences betweenthe two NO2 columns in both the cold and warm seasonepisodes. Since the OMI- or SCIAMACHY-derived “sum-mer” NO2 columns in more recent years (2007 and 2008)showed much higher NO2 columns than those in the year2001 (<2×10¹⁶ molecules cm−2; not shown in this study)due to the rapid increases in NOx emissions over East Asia,the impacts of seasonal variations in NOx emissions on theNO2 columns would be larger and the effects of the reduced
isoprene emissions on the NO2 columns could be different.Hence, they should be re-evaluated for recent years in futurestudies.
3.2.5 Other factors affecting NO2 columns
Two factors (NOx chemical loss and monthly variationsof NOx emissions) that affect the CMAQ-modeled NO2columns were investigated. However, the GOME-derivedNO2 columns also have potential problems in the retrievalprocedures, particularly in winter due to the low sun, stableboundary layer, and large aerosol concentrations (van Noije
www.atmos-chem-phys.net/9/1017/2009/ Atmos. Chem. Phys., 9, 1017–1036, 2009

1030 K. M. Han et al.: NOx emissions and NOx-related chemistry in East Asia
Table 3. Statistical analysis comparing the CMAQ-simulatedand GOME-derived NO2 columns over East Asia. The CMAQ-simulated NO2 columns were obtained from the model runs with50% of GEIA isoprene emissions and the monthly-variations inNOx emissions over East Asia.
RMSE1 MNGE2 MB1 MNB2
CMAQ vs. A SPRING 2.64 53.08 −1.12 −5.73GOME SUMMER 1.70 50.47 −1.41 −46.58
FALL 5.74 57.26 −4.89 −56.33WINTER 4.87 55.50 −3.08 −19.64
B SPRING 1.56 94.48 0.55 75.47SUMMER 1.63 42.01 −0.87 −34.08FALL 1.54 28.97 −0.32 0.30WINTER3 – – – –
C SPRING 2.37 30.97 0.34 4.96SUMMER 2.18 46.13 0.79 24.79FALL 4.48 38.35 −0.30 −3.86WINTER 3.60 44.79 1.17 23.27
D SPRING 1.87 99.34 0.25 66.30SUMMER 0.82 46.67 −0.28 −22.70FALL 3.10 51.91 −1.16 −21.34WINTER 2.53 77.22 −0.05 27.11
A: North China; B: South China; C: South Korea; D: Japan1 Unit, ×1015molecules cm−2
2 Unit, %3 Due to missing values
et al., 2006). Also, in the ACE-ASIA NOx emission inven-tory, the NOx emissions from microbiological activity in soilwere not considered. On the other hand, according to a re-cent satellite observation-constrained top-down NOx inven-tory study reported by Wang et al. (2007), the soil NOx emis-sions can sometimes account for up to 43% of combustionsources during summer in China, depending on the applica-tion of fertilizers as well as seasonally variable temperaturesand precipitation. A consideration of the soil NOx emissionsover North China during summer could increase the CMAQ(or CTM)-derived NO2 levels.
Another important factor that can influence CMAQ (orCTM)-modeled NO2 levels is the magnitude of the reactionprobability of atmospheric N2O5 radicals (γN2O5). In CMAQmodeling,γN2O5 was determined between 0.02 and 0.002 ac-cording to Riemer et al.’s parameterizations (2003). How-ever, the magnitude ofγN2O5 is currently a “hotly-debatedissue”, ranging from 0.1 to 0.001 (Jacob, 2000; Riemer et al.,2003; Thornton et al., 2003; Evans and Jacob, 2005; Brownet al., 2006; Davis et al., 2008; more references therein).The magnitude ofγN2O5 is particularly important for winter-episode simulations. This is because in winter, the partition-ing between NO3 and N2O5 radicals shifts toward the N2O5formation during the nighttime. Depending on the magni-tudes ofγN2O5 and nighttime partitioning between NO3 andN2O5 radicals, the CTM-derived NO2 levels can vary by
7%∼50% (e.g. Dentener and Crutzen, 1993; Evans and Ja-cob, 2005; van Noije et al., 2006). Therefore, in order topredict the NOx levels more precisely, the issue of the mag-nitude ofγN2O5 requires further investigation.
3.3 Emission inventories in East Asia
3.3.1 NOx emission inventories for South Korea
As discussed previously, it was found that the CMAQ-predicted NO2 columns over South Korea (C) may be over-estimated by∼46.1% (based on MNGEs in Table 3) com-pared with the GOME-derived NO2 columns. This find-ing can be partly confirmed with the emission fluxes re-cently released from the NIER for South Korea: CAPSSinventory. The CAPSS emission inventory for South Ko-rea has been built up since 1999 as a part of the “To-tal Air Pollution Load Management System”. The CAPSSwas established following the SNAP 97 (Selected Nomen-clature for Air Pollution), which was used as the CORI-NAIR (CORe INventory of AIR emission) emission inven-tory system of the EEA (European Environment Agency).The CAPSS is an 1 km×1 km-resolved, very detailed emis-sion inventory that employs a hybrid approach (a combina-tion of bottom-up and top-down approaches), including in-tensive surveys on large-scale point sources (such as powerplants, smeltering facilities, and chemical & petrochemicalplants), mobile sources with different automobile categoriesand classes, area sources with regional fuel-type consump-tion statistics, and non-road mobile sources such as vessels,aviation, and construction equipment. In detail, the CAPSShas the following major 11 classification codes: i) electricgenerating utility (EGU) combustion, ii) non-electric gen-erating utility (NEGU) combustion, iii) industrial combus-tion, iv) industrial processes, v) storage and transport, vi)solvent utilization, vii) on-road mobile, viii) non-road mo-bile, ix) waste treatment, x) biogenic, and xi) agriculture(Heo et al., 2002; also, refer to http://airemiss.nier.go.kr/nape/introduction/methodology/classification.jsp#).
The annual NOx emission fluxes of the CAPSS inven-tory was compared with those of two other inventories avail-able for South Korea for 2001: ACE-ASIA and REAS. Theannual NOx emission fluxes of the REAS inventory wereobtained from the official REAS emission web site (http://www.jamstec.go.jp/frcgc/research/p3/emission.htm). Fig-ure 12 shows the distribution of the annual NOx emissionsof the ACE-ASIA, REAS, and CAPSS inventory for the year2001, showing high emission fluxes in metro-city areas suchas Seoul, Incheon and Busan (refer to Fig. 1, regarding thelocations of these cities). Table 4 shows the NOx emissionfluxes of the CAPSS, ACE-ASIA and REAS emission in-ventories. The comparison shows that the annual NOx emis-sion fluxes of the ACE-ASIA and REAS inventories were ap-proximately double that of the CAPSS inventory over Seouland Incheon, and were approximately 3 times larger over
Atmos. Chem. Phys., 9, 1017–1036, 2009 www.atmos-chem-phys.net/9/1017/2009/

K. M. Han et al.: NOx emissions and NOx-related chemistry in East Asia 1031
Table 4. Comparison of NOx emissions among the CAPSS, REAS,and ACE-ASIA inventories over South Korea for 2001.
Region ACE-ASIA REAS CAPSS ACE-ASIA/ REAS/(Ton yr−1) (Ton yr−1) (Ton yr−1) CAPSS CAPSS
Seoul 232 059 328 256 135 771 1.71 2.42Incheon 399 787 378 100 176 379 2.27 2.14Busan and Ulsan 361 520 496 088 129 188 2.80 3.84Daegu 115 438 106 483 103 422 1.12 1.03Other region 249 236 332 832 375 032 0.66 0.89Total 1 358 040 1 641 758 919 792 1.48 1.78
the Busan and Ulsan areas. This is in line with the conclu-sions drawn from a previous comparison study between theCMAQ-predicted and the GOME-derived NO2 columns, i.e.the NOx emission fluxes of the ACE-ASIA inventory overSouth Korea were overestimated. Therefore, in order to cor-rectly consider the emissions from South Korea (C), the NOxemissions from the ACE-ASIA and REAS inventory shouldbe replaced by the NOx emissions of the CAPSS inventory,and the monthly (or seasonal) variations in NOx emissionsdiscussed in Sect. 3.2.4 should be considered.
Figure 13 shows the CMAQ-predicted and GOME-derivedNO2 columns (the first and the second columns of Fig. 13)along with the differences between the two NO2 columns(the third column of Fig. 13) over South Korea (C). Here,50% of the GEIA isoprene emissions and the seasonal vari-ations in NOx emissions with the “CAPSS inventory” wereapplied to the CMAQ modeling. Based upon the compar-isons between the results in Fig. 13 and Fig. 4, the degree ofinconsistency become much smaller, particularly over Seoul.However, the CMAQ-simulated NO2 columns are still largerthan the GOME-derived NO2 columns over South Korea (C)during the entire year, which suggests that the CAPSS NOxemission fluxes can still be overestimated, particularly overthe Busan areas (the second largest city in South Korea, referto Fig. 1, regarding the location of Busan).
3.3.2 NOx emission inventories for China
There are several NOx emission inventories in China avail-able for 2001 including i) ACE-ASIA/TRACE-P inventory(Streets et al., 2003), ii) REAS (Ohara et al., 2007), iii)EDGAR (Emission Database for Global Atmospheric Re-search) (Olivier et al., 1999, 2002), and iv) GEIA. Here, theACE-ASIA and REAS inventories were used for a compari-son study of the NOx emission fluxes from China.
As discussed previously, when the ACE-ASIA inven-tory was used, the CMAQ-predicted NO2 columns overNorth China (A) were underestimated by∼57.3% (based onMNGEs in Table 3), compared with the GOME-derived NO2columns. In order to confirm this, the three emission inven-tories for China were inter-compared: ACE-ASIA, REAS,and “date-back” ANL inventory. Here, the “date-back” ANLinventory was estimated based on an emission inventory de-
Fig. 12. Annual NOx emission fluxes over South Korea:(a) ACE-ASIA, (b) REAS, and(c) CAPSS.
www.atmos-chem-phys.net/9/1017/2009/ Atmos. Chem. Phys., 9, 1017–1036, 2009

1032 K. M. Han et al.: NOx emissions and NOx-related chemistry in East Asia
Fig. 13.As in Fig. 4, except for the CMAQ-model runs with 50% of GEIA isoprene emissions and monthly variations in anthropogenic NOxemissions with the CAPSS inventory in South Korea.
veloped recently by Zhang et al. (2007) for 2006. The ANLinventory for 2006 is an “upgraded” and “updated” versionof the ACE-ASIA emission inventory. The former (“up-graded”) indicates that the ANL inventory was improved andmethodologically evolved (particularly by the considerationsof small-scale combustion sources in China). The latter (“up-dated”) means that the ANL inventory reflects the rapidly-growing NOx emissions from China (Zhang et al., 2007).The ANL inventory for 2006 also accounted for new emis-sion factors, technology renewal, and bottom-up approachesfor various emission sources. Since the ANL inventory is
only available for “2006”, an attempt was made to “date-back” the ANL inventory to “2001” by retaining the “up-graded” components of the ANL inventory but dating-backthe “updated” parts of the ANL inventory to 2001. For thiswork, the NOx emission shapes of the ANL inventory wereretained but the NOx emissions over China were reduced us-ing China’s statistical data as well as the increase in energyand fossil fuel consumption (Zhang et al., 2007).
Atmos. Chem. Phys., 9, 1017–1036, 2009 www.atmos-chem-phys.net/9/1017/2009/

K. M. Han et al.: NOx emissions and NOx-related chemistry in East Asia 1033
Fig. 14. Annual NOx emissions inventory over China:(a) ACE-ASIA, (b) “date-back” ANL, and(c) REAS. The differences between theannual NOx emission inventories are also shown in:(d) “date-back” ANL – ACE-ASIA,(e) REAS – ACE-ASIA, and(f) “date-back” ANL– REAS.
Table 5. Comparisons of NOx emission among ACE-ASIA, “date-back” ANL, and REAS inventories over China for 2001.
Region ACE-ASIA “date-back” ANL REAS “Date-back” ANL/ACE-ASIA REAS/ACE-ASIA(Ton yr−1) (Ton yr−1) (Ton yr−1)
North China (A) 6 063 087 6 586 730 5 995 179 1.09 0.99South China (B) 2 145 335 2 726 533 2 609 364 1.27 1.22Other region 2 790 983 3 521 353 2 889 506 1.26 1.04Total 10 999 405 12 834 616 11 494 050 1.17 1.04
Figure 14 shows the annual distribution of the NOx emis-sion fluxes of ACE-ASIA, “date-back” ANL, and REASinventories in the upper panels. The differences in theNOx emission fluxes are shown in the bottom panels ofFig. 14. While the differences between the REAS and ACE-ASIA inventories (Fig. 14e) were relatively small, the differ-ences between “date-back” ANL and ACE-ASIA inventories(Fig. 14d) and between the “date-back” ANL and REAS in-ventories (Fig. 14f) were relatively large. The annual NOxemission fluxes of the ACE-ASIA inventory are smaller thanthose of the “date-back” ANL inventory over North China(A). This was confirmed by analyzing the NOx emissionfluxes of the ACE-ASIA, “date-back” ANL and REAS emis-sion inventory in Table 5. The comparison shows that theNOx emission fluxes of the “date-back” ANL inventory were∼10% larger than those of the ACE-ASIA and REAS in-
ventory over North China (A), and were approximately 30%larger than that of the ACE-AISA inventory over South China(B). The total amount of NOx emission fluxes over NorthChina (A) were largest in the “date-back” ANL inventoryand smallest in the REAS inventory. Overall, the NOx emis-sion fluxes of the ACE-ASIA and REAS inventories wereprobably underestimated over North China (A), as was re-ported by Ma et al. (2006) and Uno et al. (2007). It is be-lieved that although the annual NOx emissions of the “date-back” ANL inventory may be the closest to the real situa-tions for 2001, the NOx emission fluxes of the “date-back”ANL inventory were still low based upon comparisons ofthe CMAQ-predicted and GOME-derived NO2 columns, inwhich there was∼57.3% underestimation in NOx emissionsover North China. Again, the correct emission inventory is acritical input for examining the source-receptor relationships.
www.atmos-chem-phys.net/9/1017/2009/ Atmos. Chem. Phys., 9, 1017–1036, 2009

1034 K. M. Han et al.: NOx emissions and NOx-related chemistry in East Asia
The importance of using the correct annual NOx emissionfluxes from North China for 2001 (“reference year” of thenew Korean environmental policy of the “Total Air Pollu-tion Load Management System”) to examine the impact ofChinese emissions (source) on South Korean (receptor) airquality cannot be overemphasized.
4 Summary and conclusions
This study reports on comprehensive comparisons betweenthe CMAQ-predicted and GOME-derived NO2 columns inorder to determine the accuracy of the NOx emission inven-tory over North China (A) and South Korea (C). Since bothregions have a strong source-receptor relationship, an accu-rate knowledge of the emissions over both the regions is vitalfor understanding the contributions of North China emissionsto South Korean air quality. When the ACE-ASIA emis-sion inventory for 2001 was used, the CMAQ-predicted NO2columns were low by∼57.3% over North China (A) and highby∼46.1% over South Korea (C) compared with the GOME-derived NO2 columns. This was further confirmed partlyby comparing several emission inventories. The ACE-ASIAand REAS emission inventories showed large uncertaintiesover North China (A) and South Korea (C). The NOx emis-sion fluxes of the ACE-ASIA inventory over South Koreaand North China were overestimated by∼50% and underes-timated by∼10%, respectively, compared with the CAPSSand “date-back” ANL inventories. Based on these analyses,the “date-back” ANL and CAPSS inventories appear to pro-vide a better estimation of the real situation over North China(A) and South Korea (C), respectively, even though the NOxemissions of the “date-back” ANL inventory is still low.
This study investigated two main issues: (i) HOx-NOx-isoprene photo-chemistry in East Asia and (ii) seasonal vari-ations of NOx emissions in East Asia. The former was exam-ined because isoprene chemistry is strongly coupled with theNOx chemical loss rates in North China (A) and South Ko-rea (C). In particular, the biogenic emissions of isoprene andmonoterpenes are the key parameter to control OH radicals,whose concentrations can sequentially control the NOx con-centrations through nitric acid and particulate nitrate forma-tion. Since recent studies reported lower BVOC emissionsin East Asia, this study examined the impact of the BVOCemissions on the NOx chemical loss rates (LNOx ) in East Asiaby relaxing the isoprene emission strengths. As expected,the OH levels increased drastically with decreasing isopreneemissions. Nevertheless, LNOx decreased slightly and theNO2 levels increased accordingly, even with the reduced iso-prene emissions. LNOx was retarded due to the less active or-ganic nitrate formation with decreasing isoprene emissions.In addition, monthly variations in the NOx emission fluxesover East Asia were also examined based on two facts: (i)the recent reports of monthly variations in NOx emissions inEast Asia; and (ii) the differences between CAMQ-modeled
and GOME-retrieved NO2 columns over North China (A) arethe largest in winter and smallest in summer. Although con-sideration of the monthly variations in NOx emission yieldedmore consistent results, many issues in NOx-related chem-istry and NOx emissions remain unclear, requiring furtherstudies.
The correct NOx (and BVOC) emission inventory andNOx-related chemistry are critical for examining source-receptor relationships. Using the corrected emission inven-tories including the monthly variations of the NOx emissionsfor North China (A) and South Korea (C), a one year-longModels-3/CMAQ modeling over East Asia is currently un-derway to examine and quantify more accurately the influ-ences of Chinese (source) emissions on the South Korean(receptor) air quality.
Acknowledgements.This study was funded mainly by the Ko-rea Ministry of Environment as an Eco-technopia 21 projectunder grant 121-081-055, and was also supported by the KoreaScience and Engineering Foundation (KOSEF) grant (MEST)(No. R17-2008-042-01001-0).
Edited by: R. Cohen
References
Arndt, R., Carmichael, G. R., and Roorda, J. M.: Seasonal source-receptor relationships in Asia, Atmos. Environ., 32, 1397–1406,1998.
Binkowski, F. S. and Roselle, S. J.: Models-3 CommunityMulti-scale Air Quality (CMAQ) model aerosol components:1. model description, J. Geophys. Res., 108(D6), 4183,doi:10.1029/2001JD001409, 2003.
Boersma, K. F., Eskes, H. J., and Brinksma, E. J.: Error Analysis forTropospheric NO2 retrieval from space, J. Geophys. Res., 109,D04311, doi:10.1029/2003JD003962, 2004.
Brown, S. S., Ryerson, T. B., Wollny, A. G., Brock, C. A., Peltier,R., Sullivan, A. P., Weber, R. J., Dube, W. P., Trainer, M.,Meagher, J. F., Fehsenfeld, F. C., and Ravishankara, A. R.: Vari-ability in nocturnal nitrogen oxide processing and its role in re-gional air quality, Science, 311, 67–70, 2006.
Burrows, J. P., Dehn, A., Himmelmann, S., Richter, A., Voigt,S., and Orphal, J.: Atmospheric remote-sensing reference datafrom GOME: Part 1. Temperature-dependent absorption cross-sections of NO2 in the 231–794 nm range, J. Quant. Spectrosc.Ra., 60, 1025–1031, 1998.
Burrows, J. P., Richter, A., Dehn, A., Deters, B., Himmelmann.S., Voigt, S., and Orphal, J.: Atmospheric remote-sensing refer-ence data from GOME: Part 2. Temperature-dependent absorp-tion cross-sections of O3 in the 231–794 nm range, J. Quant.Spectrosc. Ra., 61, 509–517, 1999.
Byun, D. W. and Ching, J. K. S.: Science algorithms of the EPAmodels-3 Community Multiscale Air Quality (CMAQ) modelingsystem, EPA/600/R-99/030, US EPA, Research Triangle Park,USA.
Byun, D. W. and Schere, K. L.: Review of the governing equations,computational algorithm, and other components of the Models-3
Atmos. Chem. Phys., 9, 1017–1036, 2009 www.atmos-chem-phys.net/9/1017/2009/

K. M. Han et al.: NOx emissions and NOx-related chemistry in East Asia 1035
Community Multi-scale Air Quality (CMAQ) Modeling system,Appl. Mech. Rev., 59(2), 51–77, 2006.
CAPSS (Clean Air Policy Support System): National Institute ofEnvironmental Research (NIER), Clean Air Policy Support Sys-tem 3rd final report, South Korea, 2003.
Chance, K.: Analysis of BrO measurements from the Global OzoneMonitoring Experiment, Geophys. Res. Lett., 27, 3335–3338,1998.
Colella, P. and Woodward, P. L.: The Piecewise Parabolic Method(PPM) for gas dynamical simulation, J. Comput. Phys., 54, 174–201, 1984.
Davis, J. M., Bhave, P. V., and Foley, K. M.: Parameterization ofN2O5 reaction probabilities on the surface of particles containingammonium, sulfate, and nitrate, Atmos. Chem. Phys., 8, 5295–5311, 2008, http://www.atmos-chem-phys.net/8/5295/2008/.
Dentener, F. J. and Crutzen, P. J.: Reaction of N2O5 on troposphericaerosols: Impact on the global distribution of NOx, O3, and OHlevels, J. Geophys. Res., 98, 7149–7163, 1993.
Draxler, R. R. and Hess, G. D.: An overview of the HYSPLIT-4 modeling system for trajectories, dispersion, and deposition,Aust. Meteorol. Mag., 17, 295–308, 1998.
Evans, M. J. and Jacob, D. J.: Impact of new laboratory studies ofN2O5 hydrolysis on global model budgets of tropospheric nitro-gen oxides, ozone, and OH, Geophys. Res. Lett., 32, L09813,doi:10.1029/2005GL022469, 2005.
Fahey, K. M. and Pandis, S. N.: Size-resolved aqueous-phase atmospheric chemistry in a three-dimensional chem-ical transport model, J. Geophys. Res., 108(D22), 4690,doi:10.1029/2003JD003564, 2003.
Fu, T., Jacob, D. J., Palmer, P. I., Chance, K., Wang, Y. X.,Barletta, B., Blake, D. R., Staton, J. C., and Pilling, M.J.: Space-based formaldehyde measurements as constrains onvolatile organic compound emissions in east and south Asiaand implications for ozone, J. Geophys. Res., 112, D06312,doi:10.1029/2006JD007853, 2007.
Gery, M. W., Whitten, G. Z., Killus, J. P., and Dodge, M. C.: Aphotochemical kinetics mechanism for urban and regional scalecomputer modeling, J. Geophys. Res., 94, 12 925–12 956, 1989.
Greenblatt, G. D., Orlando, J. J., Burkholder, J. B., and Ravis-hankara, A. R.: Absorption measurements of oxygen between330 and 1140 nm, J. Geophys. Res., 95, 18 577–18 582, 1990.
He, Y., Uno, I., Wang, Z., Ohara, T., Sugimoto, N., Shimizu, A.,Richter, A., and Burrow, J. P.: Variations of the increasing trendof tropospheric NO2 over central east China during the pastdecade, Atmos. Envrion., 41, 4865–4876, 2007.
Heo, J. S., Lee, D. K., Hong, J. H., Seok, K. S., Lee, D. G., and Eom,Y. S.: A proposal on the new air emission source categories, J.KOSAE, 18(3), 231–245, 2002.
Horowitz, L. W., Fiore, A. M., Milly, G. P., Cohen, R. C., Perring,A., Wooldridge, P. J., Hess, P. G., Emmons, L. K., and Lamar-que, J.-F.: Observational constraints on the chemistry of isoprenenitrates over the eastern United States, J. Geophys. Res., 112,D12S08, doi:10.1029/2006JD007747, 2007.
Jacob, D. J.: Heterogeneous chemistry and tropospheric ozone, At-mos. Environ., 34, 2131–2159, 2000.
Jaegle, L., Steinberger, L., Martin, R. V., and Chance, K.: Globalpartitioning of NOx sources using satellite observations: Relativeroles of fossil fuel combustion, biomass burning and soil emis-sions, Faraday Discuss., 130, 407–423, 2005.
Kannari, A., Tonooka, Y., Baba, T., and Murano, K.: Developmentof multi-species 1 km×km resolution hourly basis emissions in-ventory for Japan, Atmos. Environ., 41, 3428–3439, 2007.
Kato, N. and Akimoto, H.: Anthropogenic emissions of SO2 andNOx in Asia: Emission inventories, Atmos. Environ., 41, S171–S191, 2007.
Kim, D. Y.: Development of a grided, hourly and speciated air pol-lutant emission modeling system, Ph.D. thesis, Seoul NationalUniversity, Seoul, Korea, 1998.
Koelemeijer, R. B. A., Stammes, P., Hovenier, J. W., and de Haan,J. F.: A fast method for retrieval of cloud parameters using oxy-gen A band measurements from the Global Ozone MonitoringInstrument, J. Geophys. Res., 106(D4), 3475–3490, 2001.
Korean Ministry of Environment: Execution of special measure-ments to improve metropolitan atmospheric Environment, KoreaEnvironmental Policy Bulletin, IV(1), 1–15, 2006.
Kunhikrishnan, T., Lawrence, M. G., von Kuhlmann, R., Richter,A., Ladstatter-Weißenmayer, A., and Burrows, J. P.: Analysisof tropospheric NOx over Asia using the model of atmospherictransport and chemistry (MATCH-MPIC) and GOME-satelliteobservations, Atmos. Environ., 38, 581–596, 2004.
Leue, C., Wenig, M., Wagner, T., Klimm, O. Platt, U., and Jahne,B.: Quantitative analysis of NOx emissions from global OzoneMonitoring Experiment satellite mage sequences, J. Geophys.Res., 106(D6), 5493–5505, 2001.
Ma, J., Richter, A., Burrow, J. P., Nuß, H., and van Aardenne, J.A.: Comparison of simulated tropospheric NO2 over China withGOME satellite data, Atmos. Environ., 40, 593–604, 2006.
Martin, R. V., Jacob, D. J., Chance, K., Kurosu, T. P., Palmer, P.I., and Evans, M. J.: Global inventory of nitrogen oxide emis-sions constrained by space-based observation of NO2 columns,J. Geophys. Res., 108(D17), 4537, doi:10.1029/2003JD003453,2003.
Ohara, T., Akimoto, H., Kurokawa, J., Horii, N., Yamaji, K., Yan,X., and Hayasaka, T.: An Asian emission inventory of anthro-pogenic emission sources for the period 1980–2020, Atmos.Chem. Phys., 7, 4419–4444, 2007,http://www.atmos-chem-phys.net/7/4419/2007/.
Olivier, J. G. J., Bloos, J. P. J., Berdowski, J. J. M., Visschedijk, A.J. H., and Bouwman, A. F.: A 1990 global emission invenotryof anthropogenic sources of carbon monoxide on 1◦
×1◦ devel-oped in the framework of EDGAR/GEIA, Chemosphere, GlobalChange Science, 1, 1–17, 1999.
Olivier, J. G. J., Berdowski, J. J. M., Peters, J. A. H. W., Bakker,J., Visschedijk, A. J. H., and Bloos, J. P. J.: Applications ofEDGAR: emission database for global atmospheric research, Re-port on: 410.200.051. RIVM, The Netherlands, 1–142, 2002.
Pandis, S. N and Seinfeld, J. H.: Sensitivity Analysis of a chemicalmechanism for aqueous-phase atmospheric chemistry, J. Geo-phys. Res., 94(D1), 1105–1126, 1989.
Richter, A. and Burrows, J. P.: Retrieval of tropospheric NO2 fromGOME measurements, Advance in Space Research, 29, 16 673–16 683, 2002.
Richter, A., Burrows, J. P., Nuß, H., Granier, C., and Niemeier, U.:Increase in tropospheric nitrogen dioxide over China observedfrom space, Nature, 437, 129–132, 2005.
Riemer, N., Vogel, H., Vogel, B., Schell, B., Ackermann, I.,Kessler, C., and Hass, H.: Impact of the heterogeneous hy-drolysis of N2O5 on chemistry and nitrate aerosol formation in
www.atmos-chem-phys.net/9/1017/2009/ Atmos. Chem. Phys., 9, 1017–1036, 2009

1036 K. M. Han et al.: NOx emissions and NOx-related chemistry in East Asia
the lower troposphere under photosmog conditions, J. Geophys.Res., 108(D4), 4144, doi:10.1029/2002JD002436, 2003.
Rothman, L. S., Gamache, R. R., Tipping, R. H., Rinsland, C. P.,Smith, M. A. H., Benner, D. C., Devi, V. M., Flaud, J. M., Camy-Peyret, C., Perrin, A., Goldman, A., Massie, S. T., Brown, L. R.,and Toth, R. A.: The HITRAN molecular database: editions of1991 and 1992, J. Quant. Spectrosc. Ra., 48, 469–507, 1992.
Rozanov, V., Diebel, D., Spurr, R. J. D., and Burrows, J. P.: GOME-TRAN: A radiative transfer model for the satellite project GOME– the plane parallel version, J. Geophys. Res, 102, 16683–16695,1997.
Schwartz, S. E.: Mass transport considerations pertinent toaqueous-phase reactions of gases in liquid-water clouds, Chem-istry of Multiphase Atmospheric System, edited by: Jaeschke,W., Springer-Verlag, Berlin, 415–471, 1986.
Shin, W. G.: Impact analysis of emission estimation improvementsand emission reduction scenarios for large point sources in sup-port of Cap and Trade program of the Seoul Metropolitan Areas,Ph.D. thesis, Konkuk University, Seoul, Korea, 1–166, 2008.
Song, C. H., Chen, G., Hanna, S. R., Crawford, J., and Davis, D.D.: Dispersion and chemical evolution of ship plumes in the ma-rine boundary layer: Investigation of O3/NOy/HOx chemistry,J. Geophys. Res., 108(D4), 4143, doi:10.1029/2002JD002216,2003.
Song, C. H., Park, M. E., Lee, K. H., Ahn, H. J., Lee, Y., Kim,J. Y., Han, K. M., Kim, J., Ghim, Y. S., and Kim, Y. J.: Aninvestigation into seasonal and regional aerosol characteristicsin East Asia using model-predicted and remotely-sensed aerosolproperties, Atmos. Chem. Phys., 8, 6627–6654, 2008,http://www.atmos-chem-phys.net/8/6627/2008/.
Stauffer, D. R. and Seaman, N. L.: Use of four-dimensional dataassimilation in a limited-area mesoscale model. Part I: exper-iments with synoptic-scale data, Mon. Weather Rev., 118(6),1250–1277, 1990.
Stauffer, D. L. and Seaman, N. L., Multiscale four-dimensional dataassimilation, J. Appl. Meteorol., 33(3), 416–434, 1994.
Steiner, A., Luo, C., Huang, Y., and Chameides, W. L.: Past andpresent-day biogenic volatile organic compound emissions inEast Asia, Atmos. Environ., 36, 4895–4905, 2002.
Streets, D. G., Bond, T. C., Carmichael, G. R., Fernandes, S. D.,Fu, Q., He, D., Klimont, Z., Nelson, S. M., Tsai, N. Y, Wang, M.Q., Woo, J.-H., and Yarber, K. F.: An inventory of gaseous andprimary aerosol emissions in Asia in the year 2000, J. Geophys.Res., 108(D21), 8809, doi:10.1029/2002JD003093, 2003.
Thornton, J. A., Braban, C. F., and Abbatt, J. P. D.: N2O5 hydrol-ysis on submicron organic aerosol: The effect of relative humid-ity, particle phase, and particle size, Phys. Chem. Chem. Phys.,5(20), 4593–4603, 2003.
Uno, I., He, Y., Ohara, T., Yamaji, K., Kurokawa, J.-I., Katayama,M., Wang, Z., Noguchi, K., Hayashida, S., Richter, A., and Bur-rows, J. P.: Systematic analysis of interannual and seasonal varia-tions of model-simulated tropospheric NO2 in Asia and compar-ison with GOME-satellite data, Atmos. Chem. Phys., 7, 1671–1681, 2007, http://www.atmos-chem-phys.net/7/1671/2007/.
van Noije, T. P. C., Eskes, H. J., Dentener, F. J., Stevenson, D. S.,Ellingsen, K., Schultz, M. G., Wild, O., Amann, M., Atherton,C. S., Bergmann, D. J., Bey, I., Boersma, K. F., Butler, T., Co-fala, J., Drevet, J., Fiore, A. M., Gauss, M., Hauglustaine, D. A.,Horowitz, L. W., Isaksen, I. S. A., Krol, M. C., Lamarque, J.-F., Lawrence, M. G., Martin, R. V., Montanaro, V., Mller, J.-F.,Pitari, G., Prather, M. J., Pyle, J. A., Richter, A., Rodriguez, J.M., Savage, N. H., Strahan, S. E., Sudo, K., Szopa, S., and vanRoozendael, M.: Multi-model ensemble simulations of tropo-spheric NO2 compared with GOME retrievals for the year 2000,Atmos. Chem. Phys., 6, 2943–2979, 2006,http://www.atmos-chem-phys.net/6/2943/2006/.
von Kuhlmann, R., Lawrence, M. G., Poschl, U., and Crutzen, P. J.:Sensitivities in global scale modeling of isoprene, Atmos. Chem.Phys., 4, 1–17, 2004,http://www.atmos-chem-phys.net/4/1/2004/.
Vountas, M., Rozanov, V., and Burrows, J.: Ring effect: Impact ofrotational Raman scattering on radiative transfer in earth’s atmo-sphere, J. Quant. Spectrosc. Ra., 60, 943–961, 1998.
Wang, X., Mauzerall, D. L., Hu, Y., Russell, A. G., Larson, E. D.,Woo, J. H., Streets, D. G., and Guenther, D. G.: A high resolutionemission inventory for eastern China in 2000 and three scenariosfor 2020, Atmos. Environ., 39, 5917–5933, 2005.
Wang, Y., McElroy, M. B., Martic, R. V., Streets, D. G., Zhang,Q., and Fu, T. M.: Seasonal variability of NOx emissions overeast China constrained by satellite observations: Implicationsfor combustion and microbial sources, J. Geophys. Res, 112,D06301, doi:10.1029/2006JD007538, 2007.
Wesely, M. L.: Parameterization of surface resistances to gaseousdry deposition inregional-scale numerical models, Atmos. Envi-ron., 23, 1293–1304, 1989.
Zhang, Q., Streets, D. G., He, K., Wang, Y., Richter, A., Bur-rows, J. P., Uno, I., Jang, C. J., Chen, D., Yao, Z., and Lei, Y.:NOx emission trends for China, 1995–2004: The view from theground and the view from space, J. Geophys. Res, 112, D22306,doi:10.1029/2007JD008684, 2007.
Atmos. Chem. Phys., 9, 1017–1036, 2009 www.atmos-chem-phys.net/9/1017/2009/