Embed Size (px)
Citation preview
Jurnal Mekanikal
June 2014, No 37, 01 - 15
*Corresponding author: [email protected] 1
INVESTIGATION OF NOISE AND VIBRATION
CHARACTERISTICS OF AUTOMOTIVE DISC BRAKES IN THE
LOW FREQUENCY DOMAIN
Magaswaran, K
Phuman Singh, A.S. and Hassan, M.Z.
Department of Automotive,
Faculty of Mechanical Engineering,
Universiti Teknikal Malaysia Melaka,
Durian Tunggal, 76100 Melaka, Malaysia,
ABSTRACT
Noise and vibration characterisation is an important benchmark to reduce brake noise. Commonly
brake noise and vibration measurement is done on an actual vehicle or on a brake dynamometer.
Full scale brake dynamometer takes into account the attached mass which resembles the mass of
the quarter vehicle. This paper proposes a testing method which eliminates the need for attached
masses. This is achieved through the scaling of the brake system parameters to accommodate the
loss of mass and produce similar conditions as in actual braking. The measurement of noise and
vibration is measured simultaneously and a FFT is performed to identify the frequencies of noise
and vibration. An experimental modal analysis (EMA) is done to obtain the frequencies which the
brake system tends to produce as a validation to the proposed method. It is shown that through this
method the noise and vibration characteristics of the brake system and the unstable frequencies
could be identified.
Keywords : brake noise, brake vibration, brake dynamometer, scaling method, experimental modal
analysis
1.0 INTRODUCTION
The brake is an important safety feature in a vehicle. The introduction of hydraulically operated
disc brakes on a vehicle improves the amount stopping power required thus enhancing safety but
there is an issue of noise and vibration. This issue is considered serious by carmakers around the
world. In the North Americas alone, up to 1 billion dollars has been spent on warranty claims
regarding brake noise [1]. Brake noises are commonly classified into two categories based on its
frequencies. The first is the low frequency domain which is the noise below 1 kHz, second is the
high frequency domains which are the noise above 1 kHz. The low frequency domain contains the
noise types such as groan, moan, hum and judder where else the high frequency domain contains
the squeal type noise [2]. The low frequency noise types are generally caused by brake pad excited
by the brake rotor at the contact and it is coupled with other vehicle components [3]. Where else the
squeal noise is said to be a friction induced vibration combined with thermal and structural effects.
The understanding of the brake noise and vibration phenomena and the effort to control the
brake noise is a continuous challenge in the automotive braking industry. Generally the brake noise
is perceived as a fiction-induced forced vibration [4]. The characteristics of a braking event are
complicated as the input to the brake system varies with unlimited number of combinations and the
brake assembly itself is a set of multiple components connected with complex interfaces.The low
frequency brake noise which is below 1 kHz particularly is of important recently due to the
Jurnal Mekanikal June 2014
2
advances in the automotive technology in making the vehicle quieter. Thus testing of the brake
system is crucial at prototype stage itself. At prototype stage, a real vehicle for on the road testing
might not be available. Therefore, a brake dynamometer testing is the only option available. Tests
on brake dynamometer had been done by Rhee, Bryant and Hetzler [5, 6, 7] but those tests were full
scale which either included the vehicle mass or suspension components.
The approach of these tests is the causal approach which tries to identify the mechanism of
the produced sound. This approach is suitable to understand the mechanisms which lead to the noise.
The drawback is this method is unable to identify the noise and vibration characteristics of the
brake system in a broad frequency domain. The characteristics of the noise and vibration are
important to identify the unstable frequencies within the system due to the fact that the unstable
frequencies tend to produce noise. Furthermore, the experiment conducted should result as function
of brake pressure and wheel rotational speed. This is because the brake pressure and wheel
rotational speed are the local parameters in the brake system and the dynamics of the brake system
is highly influenced by these parameters. Such experiment was done by Lindberg et al. [8] but it
was done under laboratory conditions using a full vehicle. A full vehicle is only available after the
production of the vehicle and a full vehicle testing results would contain noise from the engine,
transmission, tire and various other disturbances.
The sound generated during braking is basically is a friction induced sound. Frictions play a
role to dissipate energy in the brake system but friction could also produce energy. When friction
produces more energy than it dissipates, sound is generated. In the disc brake system, the disc and
pad friction pair produces sound from such instability. The disc and pad contact are what produce
the friction force in turn causes in plane vibration of the disc [9,10]. This vibration exerts a periodic
force respect to disc motion on the edge of the pads as it vibrates. This would excite bending mode
vibration in within the pads. Consequently, it causes the contact of the pad in the disc to fluctuate
and excite the bending waves on the disc [11]. This phenomenon is referred to as geometric
coupling which is also called as geometric instability. As the pad exerts force on the disc, the disc
would tilt slightly [12]. This tilt has the potential to produce groan noise through stick and slip
mechanism [13]. All these factors gather to form a wide range of noise and vibration in a single
braking event which is expected in brake system noise and vibration characteristics identification
experiment.
The aim of the developed reduced scale brake dynamometer is to produce noise and
vibration characteristic of the disc brake system to identify vibration frequencies which is audibly
significant, in other words is to identify unstable frequencies which produce noise without the need
to consider the vehicle mass. The elimination of hardware such as vehicle suspension and attached
masses is done through calculative scaling. This reduces testing cost and eliminates attached mass
which enables the testing of various vehicle disc brakes without having extra cost or effort. The
objective of this paper is to investigate the low frequency brake noise and vibration characteristic
using a reduced scale brake dynamometer.
2.0 THE SCALING OF THE PARAMETERS
The goal of the testing is to identify the characteristic of the brake noise produced. The disc and pad
vibratory system are a complex interrelated forced vibration system. In a forced vibratory system,
there should be a periodic excitation force. In the brake system, the force is produced by the brake
pads but the periodic quality is produced by the rotation of the disc. Thus it is important to
implement the same rotational speed to reflect the real vehicle. The variable that causes the
excitation force is the brake pressure, thus it is to be scaled. The scaling of the pressure is necessary
to produce a desired deceleration. Implementation by applying brake pressure equal to a real vehicle
will stop the brake rotor abruptly; this makes observation and data collection to be more challenging.
Scaling of the excitation force will decrease the amplitude of the produced noise and vibration but
not the frequencies. Therefore, it is predicted that the results will show sound levels which are low
Jurnal Mekanikal June 2014
3
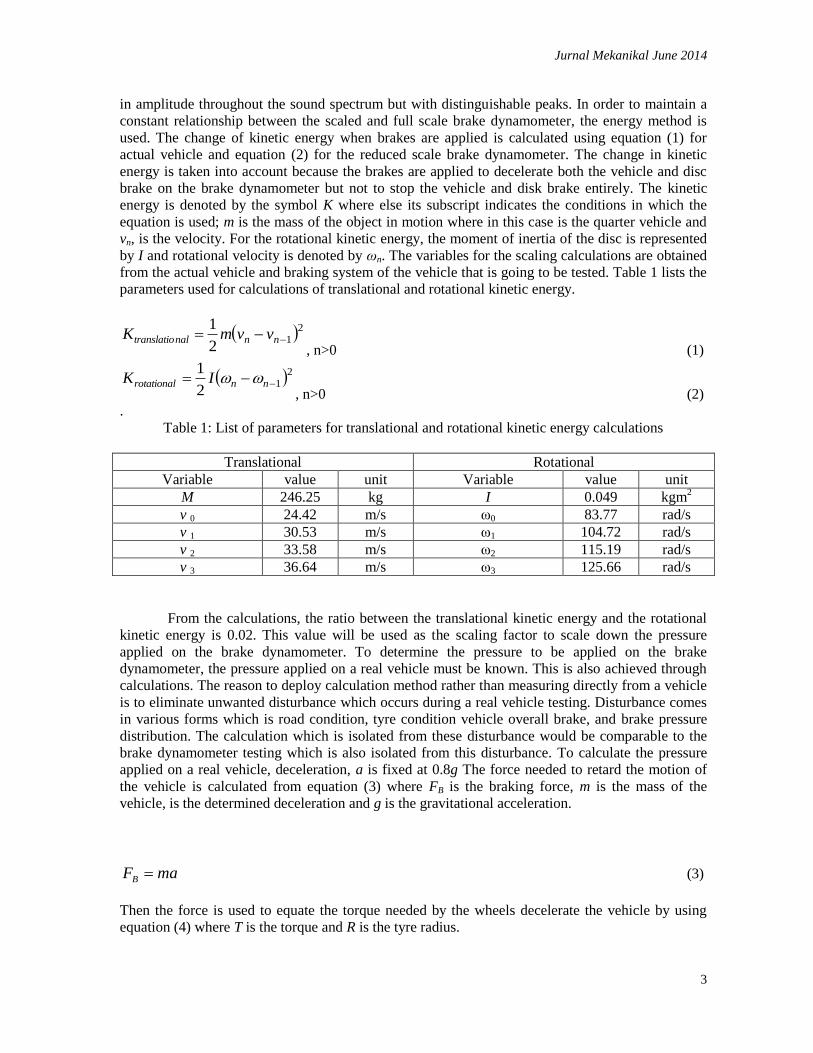
in amplitude throughout the sound spectrum but with distinguishable peaks. In order to maintain a
constant relationship between the scaled and full scale brake dynamometer, the energy method is
used. The change of kinetic energy when brakes are applied is calculated using equation (1) for
actual vehicle and equation (2) for the reduced scale brake dynamometer. The change in kinetic
energy is taken into account because the brakes are applied to decelerate both the vehicle and disc
brake on the brake dynamometer but not to stop the vehicle and disk brake entirely. The kinetic
energy is denoted by the symbol K where else its subscript indicates the conditions in which the
equation is used; m is the mass of the object in motion where in this case is the quarter vehicle and
vn, is the velocity. For the rotational kinetic energy, the moment of inertia of the disc is represented
by I and rotational velocity is denoted by ωn. The variables for the scaling calculations are obtained
from the actual vehicle and braking system of the vehicle that is going to be tested. Table 1 lists the
parameters used for calculations of translational and rotational kinetic energy.
212
1 nnnaltranslatio vvmK
, n>0 (1)
212
1 nnrotational IK
, n>0 (2)
.
Table 1: List of parameters for translational and rotational kinetic energy calculations
Translational Rotational
Variable value unit Variable value unit
M 246.25 kg I 0.049 kgm2
v 0 24.42 m/s ω0 83.77 rad/s
v 1 30.53 m/s ω1 104.72 rad/s
v 2 33.58 m/s ω2 115.19 rad/s
v 3 36.64 m/s ω3 125.66 rad/s
From the calculations, the ratio between the translational kinetic energy and the rotational
kinetic energy is 0.02. This value will be used as the scaling factor to scale down the pressure
applied on the brake dynamometer. To determine the pressure to be applied on the brake
dynamometer, the pressure applied on a real vehicle must be known. This is also achieved through
calculations. The reason to deploy calculation method rather than measuring directly from a vehicle
is to eliminate unwanted disturbance which occurs during a real vehicle testing. Disturbance comes
in various forms which is road condition, tyre condition vehicle overall brake, and brake pressure
distribution. The calculation which is isolated from these disturbance would be comparable to the
brake dynamometer testing which is also isolated from this disturbance. To calculate the pressure
applied on a real vehicle, deceleration, a is fixed at 0.8g The force needed to retard the motion of
the vehicle is calculated from equation (3) where FB is the braking force, m is the mass of the
vehicle, is the determined deceleration and g is the gravitational acceleration.
maFB (3)
Then the force is used to equate the torque needed by the wheels decelerate the vehicle by using
equation (4) where T is the torque and R is the tyre radius.
Jurnal Mekanikal June 2014
4
RFT B (4)
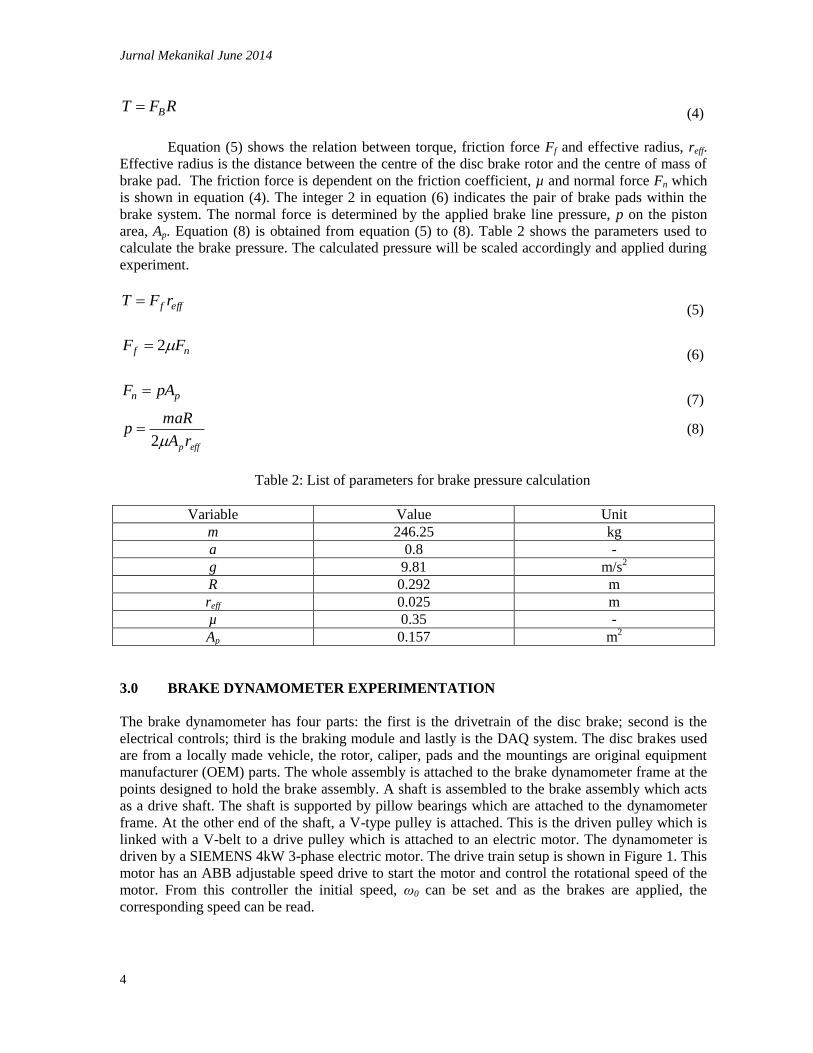
Equation (5) shows the relation between torque, friction force Ff and effective radius, reff.
Effective radius is the distance between the centre of the disc brake rotor and the centre of mass of
brake pad. The friction force is dependent on the friction coefficient, µ and normal force Fn which
is shown in equation (4). The integer 2 in equation (6) indicates the pair of brake pads within the
brake system. The normal force is determined by the applied brake line pressure, p on the piston
area, Ap. Equation (8) is obtained from equation (5) to (8). Table 2 shows the parameters used to
calculate the brake pressure. The calculated pressure will be scaled accordingly and applied during
experiment.
efff rFT (5)
nf FF 2 (6)
pn pAF (7)
effprA
maRp
2 (8)
Table 2: List of parameters for brake pressure calculation
Variable Value Unit
m 246.25 kg
a 0.8 -
g 9.81 m/s2
R 0.292 m
reff 0.025 m
µ 0.35 -
Ap 0.157 m2
3.0 BRAKE DYNAMOMETER EXPERIMENTATION
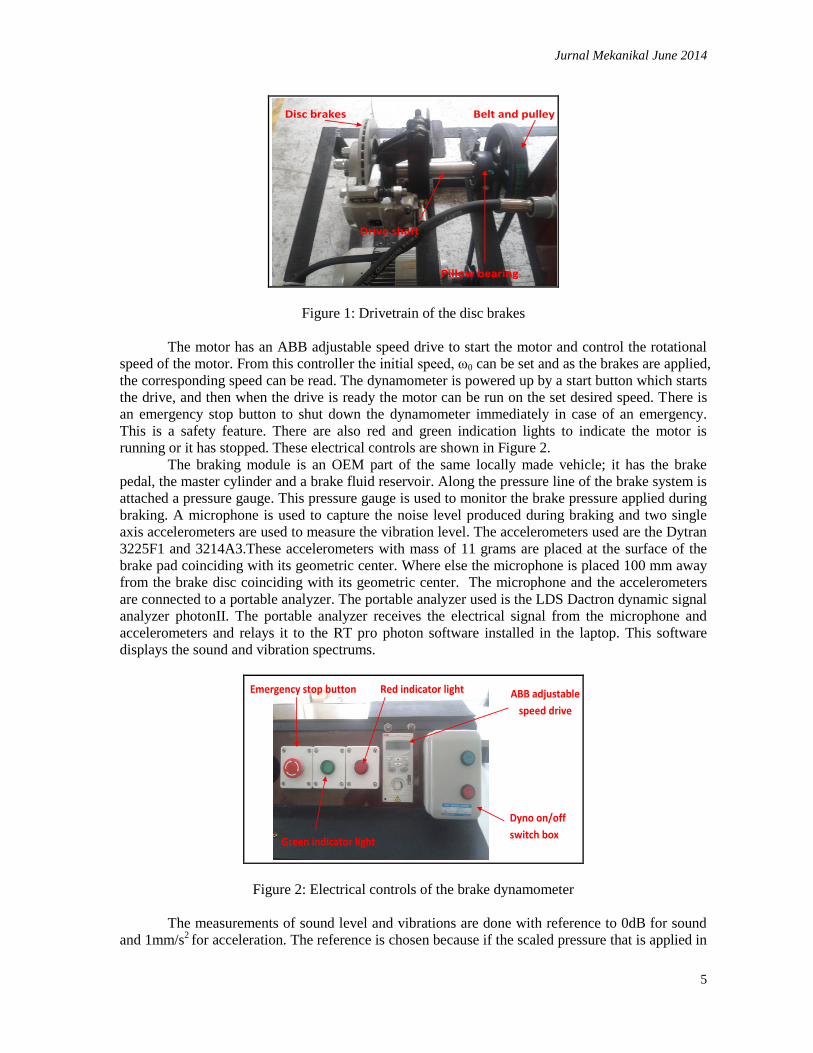
The brake dynamometer has four parts: the first is the drivetrain of the disc brake; second is the
electrical controls; third is the braking module and lastly is the DAQ system. The disc brakes used
are from a locally made vehicle, the rotor, caliper, pads and the mountings are original equipment
manufacturer (OEM) parts. The whole assembly is attached to the brake dynamometer frame at the
points designed to hold the brake assembly. A shaft is assembled to the brake assembly which acts
as a drive shaft. The shaft is supported by pillow bearings which are attached to the dynamometer
frame. At the other end of the shaft, a V-type pulley is attached. This is the driven pulley which is
linked with a V-belt to a drive pulley which is attached to an electric motor. The dynamometer is
driven by a SIEMENS 4kW 3-phase electric motor. The drive train setup is shown in Figure 1. This
motor has an ABB adjustable speed drive to start the motor and control the rotational speed of the
motor. From this controller the initial speed, ω0 can be set and as the brakes are applied, the
corresponding speed can be read.
Jurnal Mekanikal June 2014
5
Belt and pulley Disc brakes
Pillow bearing
Drive shaft
Figure 1: Drivetrain of the disc brakes
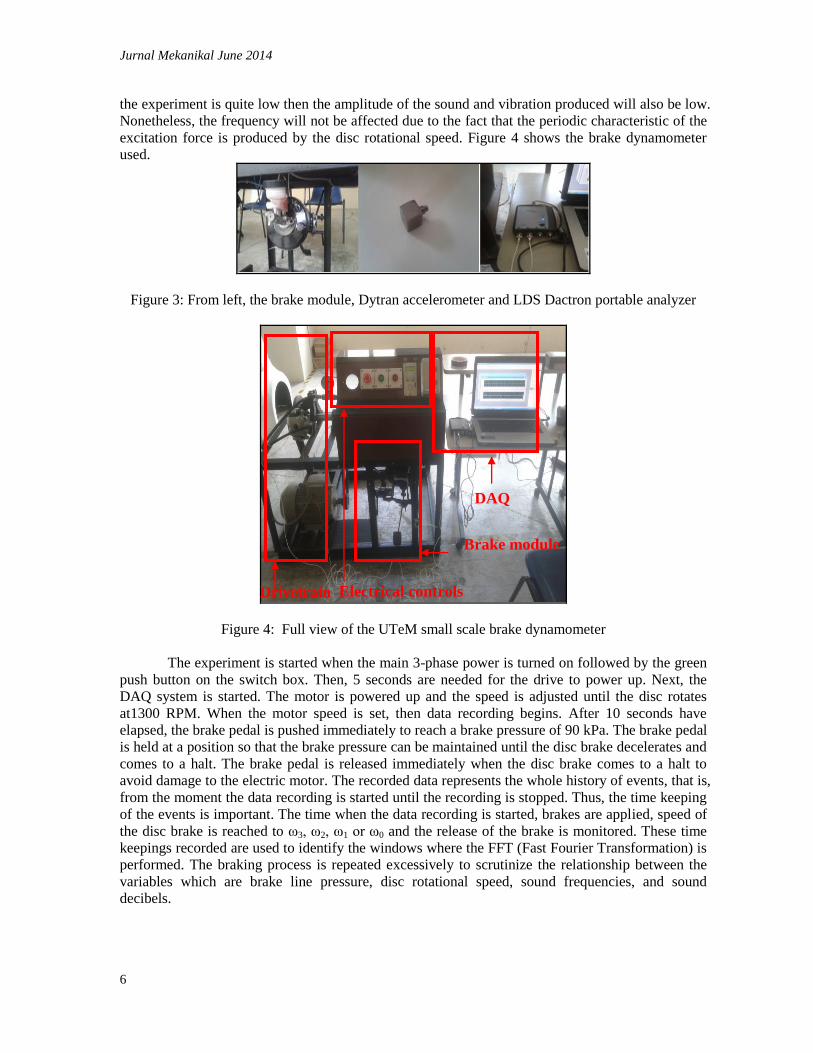
The motor has an ABB adjustable speed drive to start the motor and control the rotational
speed of the motor. From this controller the initial speed, ω0 can be set and as the brakes are applied,
the corresponding speed can be read. The dynamometer is powered up by a start button which starts
the drive, and then when the drive is ready the motor can be run on the set desired speed. There is
an emergency stop button to shut down the dynamometer immediately in case of an emergency.
This is a safety feature. There are also red and green indication lights to indicate the motor is
running or it has stopped. These electrical controls are shown in Figure 2.
The braking module is an OEM part of the same locally made vehicle; it has the brake
pedal, the master cylinder and a brake fluid reservoir. Along the pressure line of the brake system is
attached a pressure gauge. This pressure gauge is used to monitor the brake pressure applied during
braking. A microphone is used to capture the noise level produced during braking and two single
axis accelerometers are used to measure the vibration level. The accelerometers used are the Dytran
3225F1 and 3214A3.These accelerometers with mass of 11 grams are placed at the surface of the
brake pad coinciding with its geometric center. Where else the microphone is placed 100 mm away
from the brake disc coinciding with its geometric center. The microphone and the accelerometers
are connected to a portable analyzer. The portable analyzer used is the LDS Dactron dynamic signal
analyzer photonII. The portable analyzer receives the electrical signal from the microphone and
accelerometers and relays it to the RT pro photon software installed in the laptop. This software
displays the sound and vibration spectrums.
Emergency stop button
Green indicator light
Red indicator light ABB adjustable
speed drive
Dyno on/off
switch box
Figure 2: Electrical controls of the brake dynamometer
The measurements of sound level and vibrations are done with reference to 0dB for sound
and 1mm/s2 for acceleration. The reference is chosen because if the scaled pressure that is applied in
Jurnal Mekanikal June 2014
6
the experiment is quite low then the amplitude of the sound and vibration produced will also be low.
Nonetheless, the frequency will not be affected due to the fact that the periodic characteristic of the
excitation force is produced by the disc rotational speed. Figure 4 shows the brake dynamometer
used.
Figure 3: From left, the brake module, Dytran accelerometer and LDS Dactron portable analyzer
Figure 4: Full view of the UTeM small scale brake dynamometer
The experiment is started when the main 3-phase power is turned on followed by the green
push button on the switch box. Then, 5 seconds are needed for the drive to power up. Next, the
DAQ system is started. The motor is powered up and the speed is adjusted until the disc rotates
at1300 RPM. When the motor speed is set, then data recording begins. After 10 seconds have
elapsed, the brake pedal is pushed immediately to reach a brake pressure of 90 kPa. The brake pedal
is held at a position so that the brake pressure can be maintained until the disc brake decelerates and
comes to a halt. The brake pedal is released immediately when the disc brake comes to a halt to
avoid damage to the electric motor. The recorded data represents the whole history of events, that is,
from the moment the data recording is started until the recording is stopped. Thus, the time keeping
of the events is important. The time when the data recording is started, brakes are applied, speed of
the disc brake is reached to ω3, ω2, ω1 or ω0 and the release of the brake is monitored. These time
keepings recorded are used to identify the windows where the FFT (Fast Fourier Transformation) is
performed. The braking process is repeated excessively to scrutinize the relationship between the
variables which are brake line pressure, disc rotational speed, sound frequencies, and sound
decibels.
Drivetrain Electrical controls
Brake module
DAQ
Jurnal Mekanikal June 2014
7
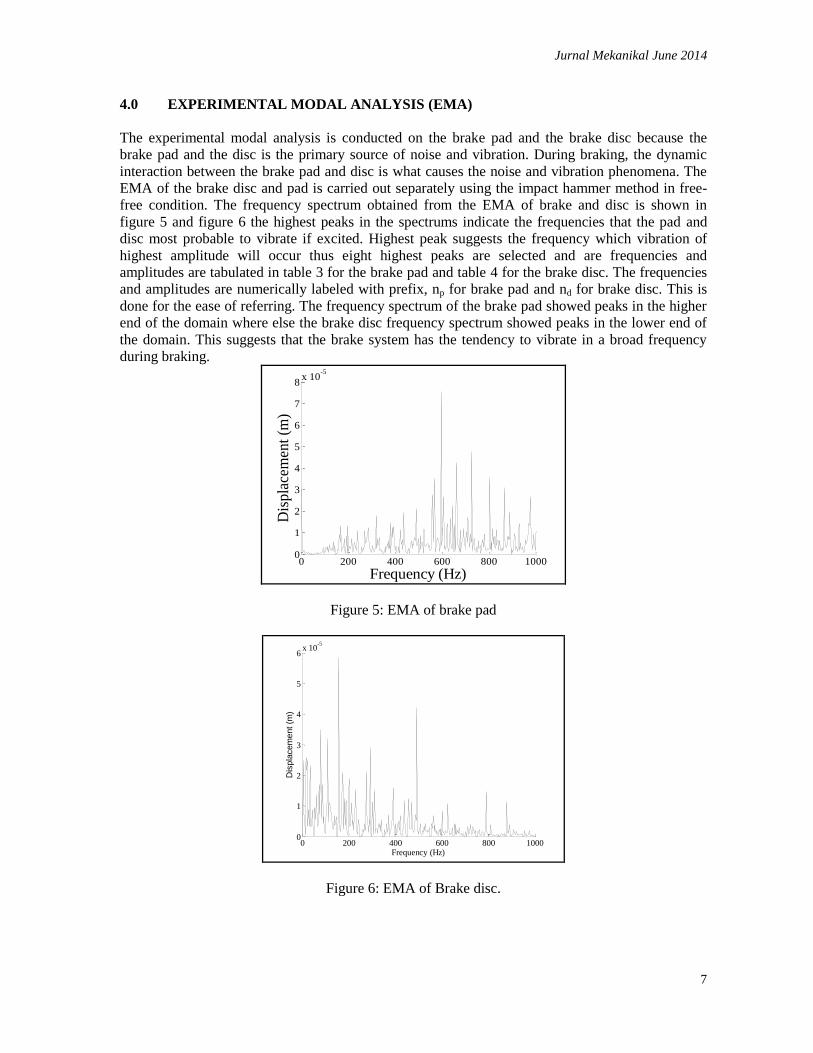
4.0 EXPERIMENTAL MODAL ANALYSIS (EMA)
The experimental modal analysis is conducted on the brake pad and the brake disc because the
brake pad and the disc is the primary source of noise and vibration. During braking, the dynamic
interaction between the brake pad and disc is what causes the noise and vibration phenomena. The
EMA of the brake disc and pad is carried out separately using the impact hammer method in free-
free condition. The frequency spectrum obtained from the EMA of brake and disc is shown in
figure 5 and figure 6 the highest peaks in the spectrums indicate the frequencies that the pad and
disc most probable to vibrate if excited. Highest peak suggests the frequency which vibration of
highest amplitude will occur thus eight highest peaks are selected and are frequencies and
amplitudes are tabulated in table 3 for the brake pad and table 4 for the brake disc. The frequencies
and amplitudes are numerically labeled with prefix, np for brake pad and nd for brake disc. This is
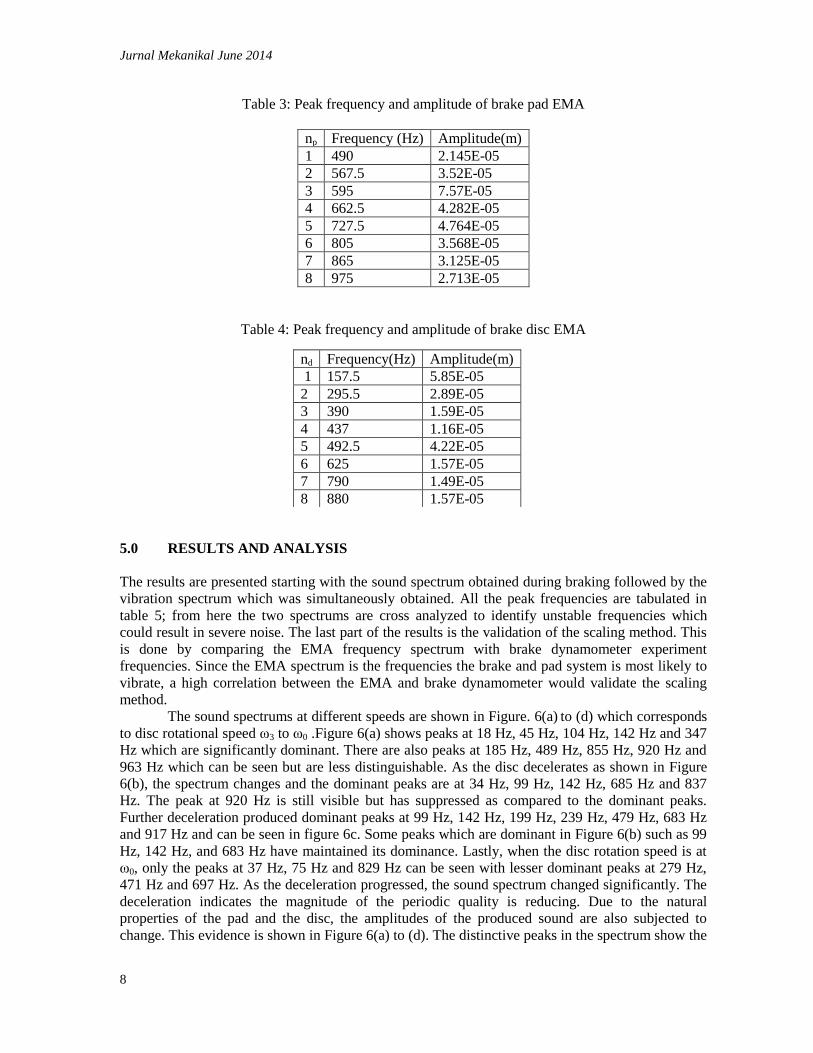
done for the ease of referring. The frequency spectrum of the brake pad showed peaks in the higher
end of the domain where else the brake disc frequency spectrum showed peaks in the lower end of
the domain. This suggests that the brake system has the tendency to vibrate in a broad frequency
during braking.
0 200 400 600 800 10000
1
2
3
4
5
6
7
8x 10
-5
Frequency (Hz)
Dis
pla
cem
ent
(m)
Figure 5: EMA of brake pad
0 200 400 600 800 10000
1
2
3
4
5
6x 10
-5
Frequency (Hz)
Dis
pla
cem
ent (m
)
Figure 6: EMA of Brake disc.
Jurnal Mekanikal June 2014
8
Table 3: Peak frequency and amplitude of brake pad EMA
np Frequency (Hz) Amplitude(m)
1 490 2.145E-05
2 567.5 3.52E-05
3 595 7.57E-05
4 662.5 4.282E-05
5 727.5 4.764E-05
6 805 3.568E-05
7 865 3.125E-05
8 975 2.713E-05
Table 4: Peak frequency and amplitude of brake disc EMA
5.0 RESULTS AND ANALYSIS
The results are presented starting with the sound spectrum obtained during braking followed by the
vibration spectrum which was simultaneously obtained. All the peak frequencies are tabulated in
table 5; from here the two spectrums are cross analyzed to identify unstable frequencies which
could result in severe noise. The last part of the results is the validation of the scaling method. This
is done by comparing the EMA frequency spectrum with brake dynamometer experiment
frequencies. Since the EMA spectrum is the frequencies the brake and pad system is most likely to
vibrate, a high correlation between the EMA and brake dynamometer would validate the scaling
method.
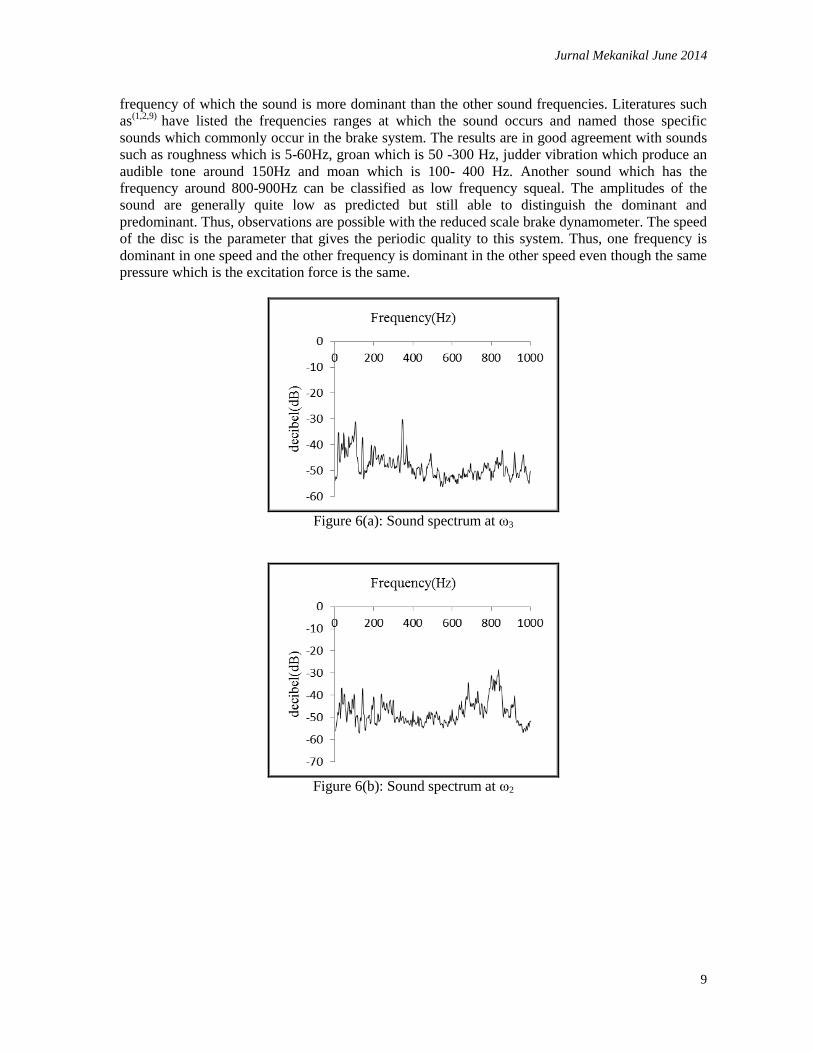
The sound spectrums at different speeds are shown in Figure. 6(a) to (d) which corresponds
to disc rotational speed ω3 to ω0 .Figure 6(a) shows peaks at 18 Hz, 45 Hz, 104 Hz, 142 Hz and 347
Hz which are significantly dominant. There are also peaks at 185 Hz, 489 Hz, 855 Hz, 920 Hz and
963 Hz which can be seen but are less distinguishable. As the disc decelerates as shown in Figure
6(b), the spectrum changes and the dominant peaks are at 34 Hz, 99 Hz, 142 Hz, 685 Hz and 837
Hz. The peak at 920 Hz is still visible but has suppressed as compared to the dominant peaks.
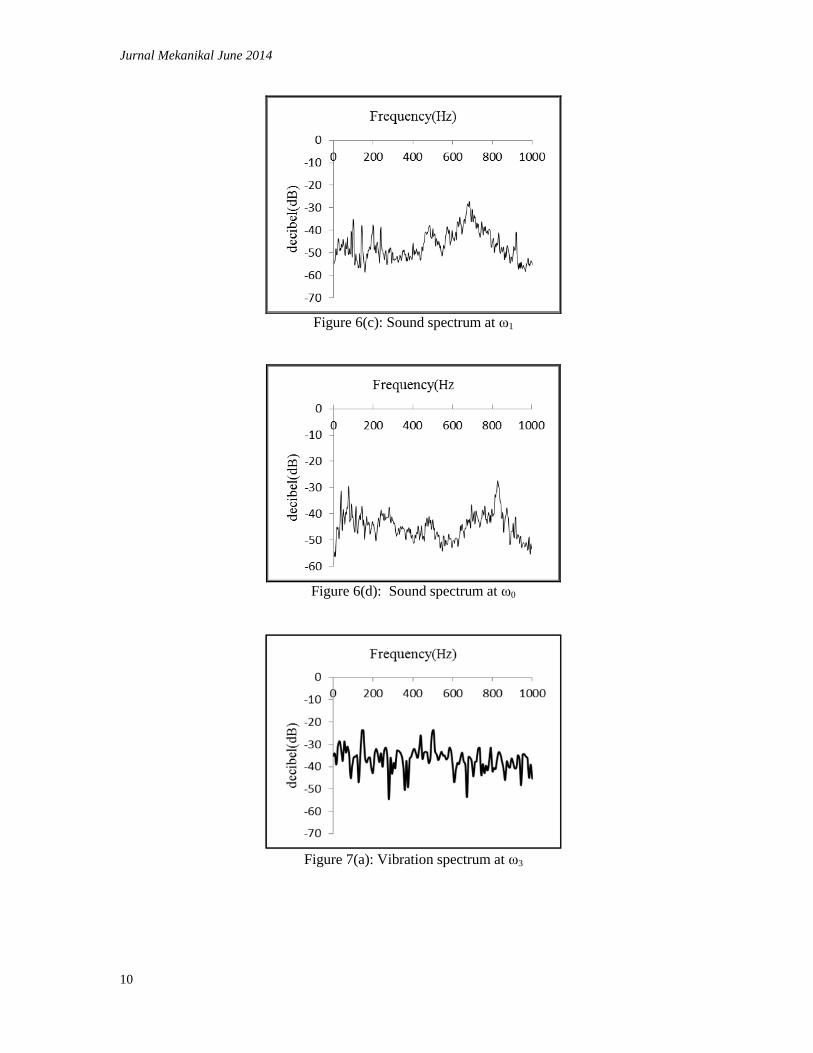
Further deceleration produced dominant peaks at 99 Hz, 142 Hz, 199 Hz, 239 Hz, 479 Hz, 683 Hz
and 917 Hz and can be seen in figure 6c. Some peaks which are dominant in Figure 6(b) such as 99
Hz, 142 Hz, and 683 Hz have maintained its dominance. Lastly, when the disc rotation speed is at
ω0, only the peaks at 37 Hz, 75 Hz and 829 Hz can be seen with lesser dominant peaks at 279 Hz,
471 Hz and 697 Hz. As the deceleration progressed, the sound spectrum changed significantly. The
deceleration indicates the magnitude of the periodic quality is reducing. Due to the natural
properties of the pad and the disc, the amplitudes of the produced sound are also subjected to
change. This evidence is shown in Figure 6(a) to (d). The distinctive peaks in the spectrum show the
nd Frequency(Hz) Amplitude(m)
1 157.5 5.85E-05
2 295.5 2.89E-05
3 390 1.59E-05
4 437 1.16E-05
5 492.5 4.22E-05
6 625 1.57E-05
7 790 1.49E-05
8 880 1.57E-05
Jurnal Mekanikal June 2014
9
frequency of which the sound is more dominant than the other sound frequencies. Literatures such
as(1,2,9)
have listed the frequencies ranges at which the sound occurs and named those specific
sounds which commonly occur in the brake system. The results are in good agreement with sounds
such as roughness which is 5-60Hz, groan which is 50 -300 Hz, judder vibration which produce an
audible tone around 150Hz and moan which is 100- 400 Hz. Another sound which has the
frequency around 800-900Hz can be classified as low frequency squeal. The amplitudes of the
sound are generally quite low as predicted but still able to distinguish the dominant and
predominant. Thus, observations are possible with the reduced scale brake dynamometer. The speed
of the disc is the parameter that gives the periodic quality to this system. Thus, one frequency is
dominant in one speed and the other frequency is dominant in the other speed even though the same
pressure which is the excitation force is the same.
Figure 6(a): Sound spectrum at ω3
Figure 6(b): Sound spectrum at ω2
Jurnal Mekanikal June 2014
10
Figure 6(c): Sound spectrum at ω1
Figure 6(d): Sound spectrum at ω0
Figure 7(a): Vibration spectrum at ω3
Jurnal Mekanikal June 2014
11
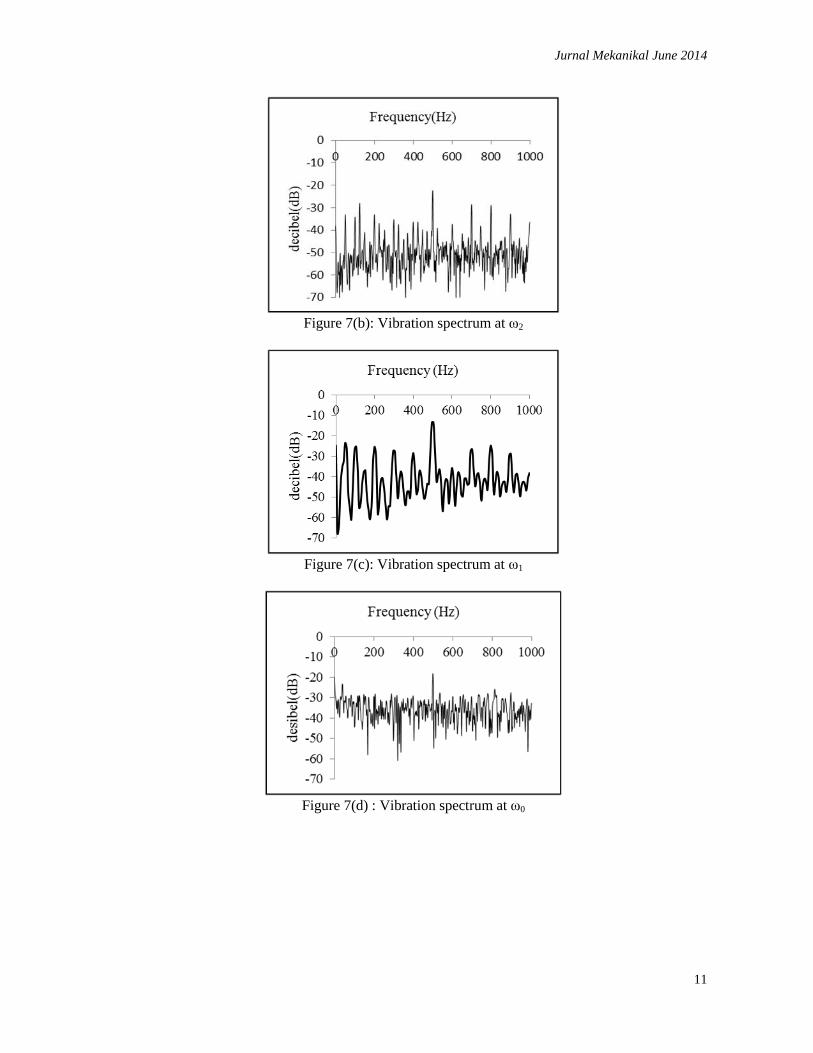
Figure 7(b): Vibration spectrum at ω2
Figure 7(c): Vibration spectrum at ω1
Figure 7(d) : Vibration spectrum at ω0
Jurnal Mekanikal June 2014
12
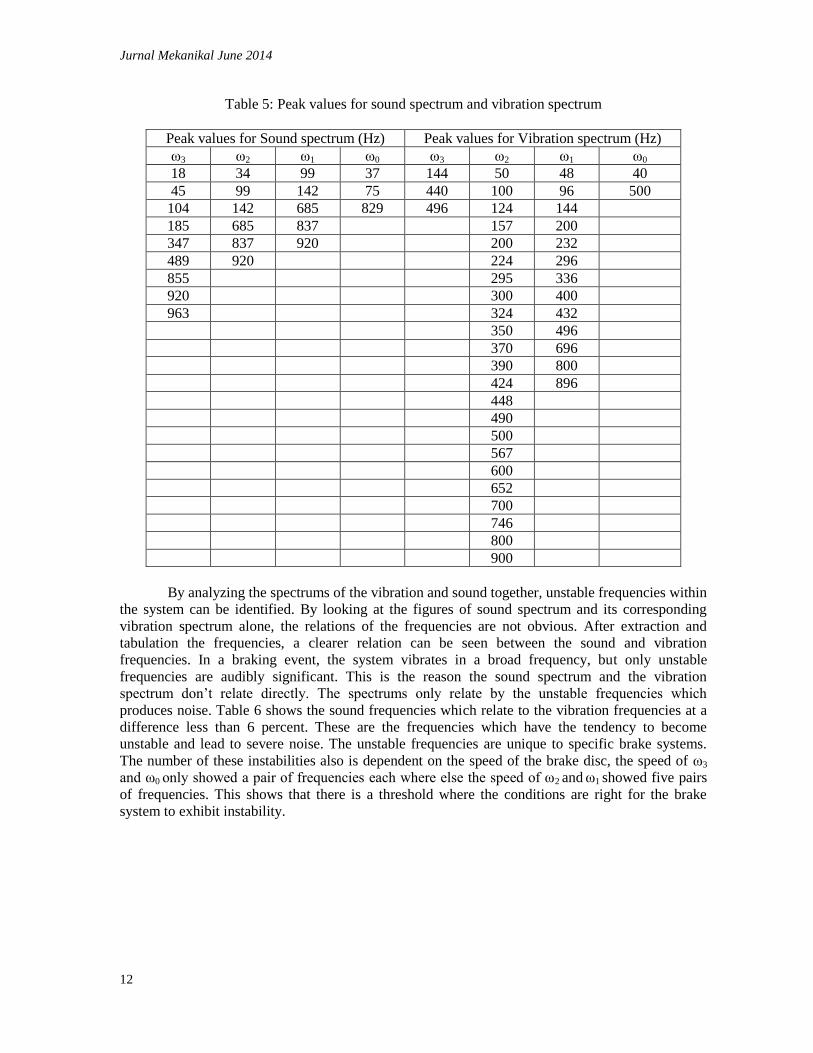
Table 5: Peak values for sound spectrum and vibration spectrum
Peak values for Sound spectrum (Hz) Peak values for Vibration spectrum (Hz)
ω3 ω2 ω1 ω0 ω3 ω2 ω1 ω0
18 34 99 37 144 50 48 40
45 99 142 75 440 100 96 500
104 142 685 829 496 124 144
185 685 837 157 200
347 837 920 200 232
489 920 224 296
855 295 336
920 300 400
963 324 432
350 496
370 696
390 800
424 896
448
490
500
567
600
652
700
746
800
900
By analyzing the spectrums of the vibration and sound together, unstable frequencies within
the system can be identified. By looking at the figures of sound spectrum and its corresponding
vibration spectrum alone, the relations of the frequencies are not obvious. After extraction and
tabulation the frequencies, a clearer relation can be seen between the sound and vibration
frequencies. In a braking event, the system vibrates in a broad frequency, but only unstable
frequencies are audibly significant. This is the reason the sound spectrum and the vibration
spectrum don’t relate directly. The spectrums only relate by the unstable frequencies which
produces noise. Table 6 shows the sound frequencies which relate to the vibration frequencies at a
difference less than 6 percent. These are the frequencies which have the tendency to become
unstable and lead to severe noise. The unstable frequencies are unique to specific brake systems.
The number of these instabilities also is dependent on the speed of the brake disc, the speed of ω3
and ω0 only showed a pair of frequencies each where else the speed of ω2 and ω1 showed five pairs
of frequencies. This shows that there is a threshold where the conditions are right for the brake
system to exhibit instability.
Jurnal Mekanikal June 2014
13
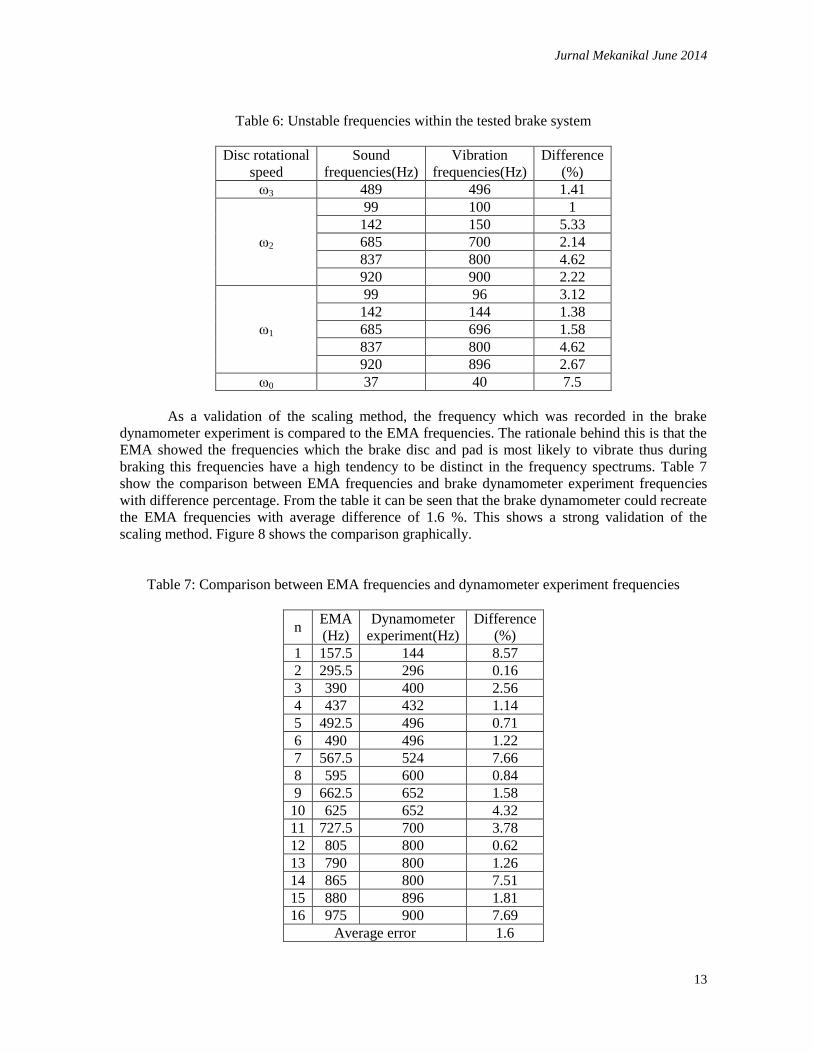
Table 6: Unstable frequencies within the tested brake system
Disc rotational
speed
Sound
frequencies(Hz)
Vibration
frequencies(Hz)
Difference
(%)
ω3 489 496 1.41
ω2
99 100 1
142 150 5.33
685 700 2.14
837 800 4.62
920 900 2.22
ω1
99 96 3.12
142 144 1.38
685 696 1.58
837 800 4.62
920 896 2.67
ω0 37 40 7.5
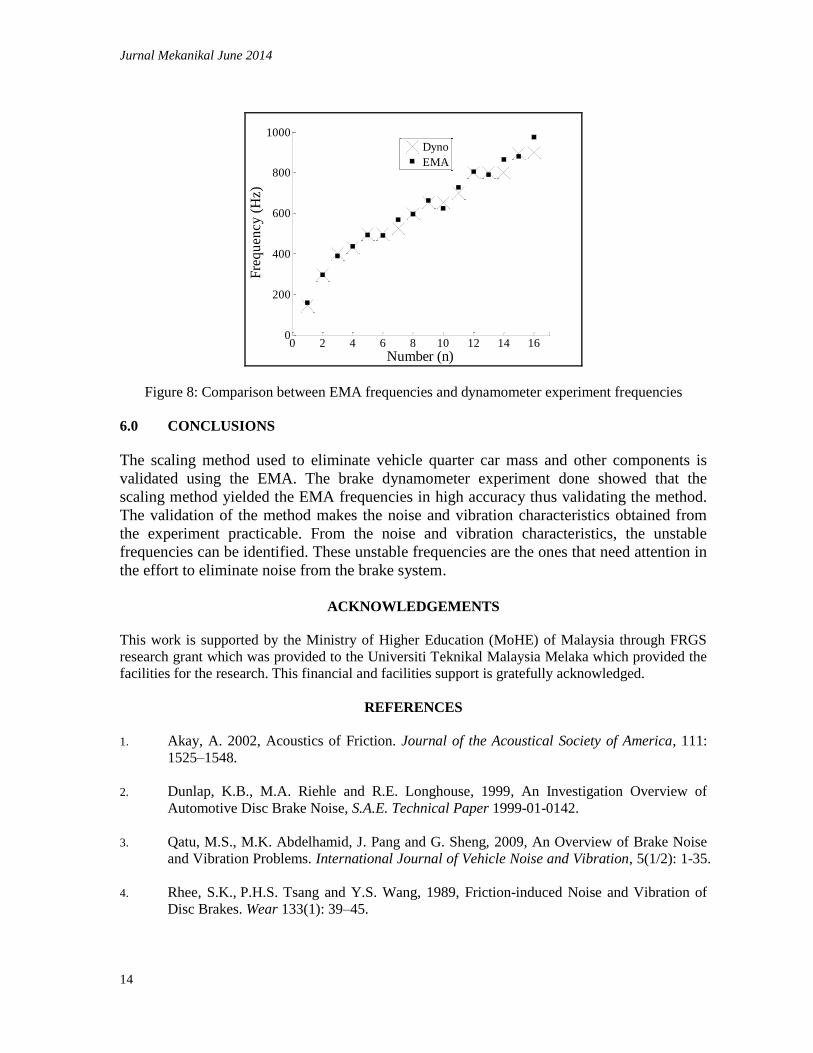
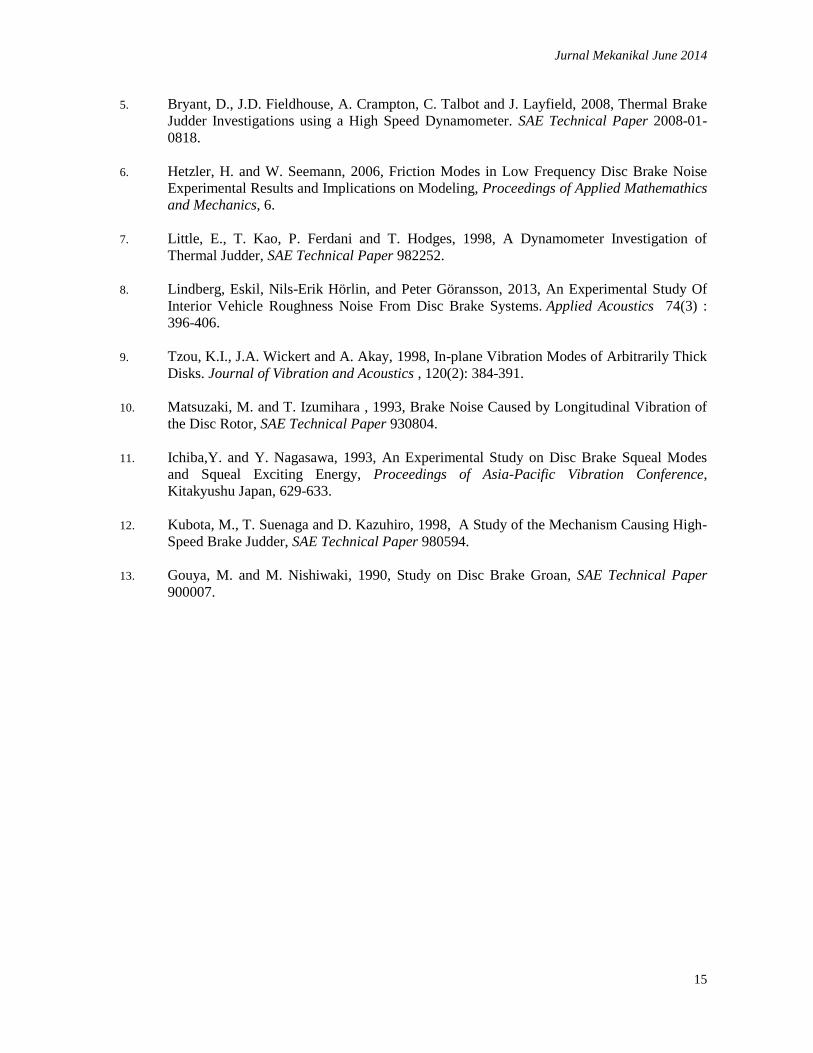
As a validation of the scaling method, the frequency which was recorded in the brake
dynamometer experiment is compared to the EMA frequencies. The rationale behind this is that the
EMA showed the frequencies which the brake disc and pad is most likely to vibrate thus during
braking this frequencies have a high tendency to be distinct in the frequency spectrums. Table 7
show the comparison between EMA frequencies and brake dynamometer experiment frequencies
with difference percentage. From the table it can be seen that the brake dynamometer could recreate
the EMA frequencies with average difference of 1.6 %. This shows a strong validation of the
scaling method. Figure 8 shows the comparison graphically.
Table 7: Comparison between EMA frequencies and dynamometer experiment frequencies
n EMA
(Hz)
Dynamometer
experiment(Hz)
Difference
(%)
1 157.5 144 8.57
2 295.5 296 0.16
3 390 400 2.56
4 437 432 1.14
5 492.5 496 0.71
6 490 496 1.22
7 567.5 524 7.66
8 595 600 0.84
9 662.5 652 1.58
10 625 652 4.32
11 727.5 700 3.78
12 805 800 0.62
13 790 800 1.26
14 865 800 7.51
15 880 896 1.81
16 975 900 7.69
Average error 1.6
Jurnal Mekanikal June 2014
14
0 2 4 6 8 10 12 14 160
200
400
600
800
1000
Number (n)
Fre
qu
ency
(H
z)
Dyno
EMA
Figure 8: Comparison between EMA frequencies and dynamometer experiment frequencies
6.0 CONCLUSIONS
The scaling method used to eliminate vehicle quarter car mass and other components is
validated using the EMA. The brake dynamometer experiment done showed that the
scaling method yielded the EMA frequencies in high accuracy thus validating the method.
The validation of the method makes the noise and vibration characteristics obtained from
the experiment practicable. From the noise and vibration characteristics, the unstable
frequencies can be identified. These unstable frequencies are the ones that need attention in
the effort to eliminate noise from the brake system.
ACKNOWLEDGEMENTS
This work is supported by the Ministry of Higher Education (MoHE) of Malaysia through FRGS
research grant which was provided to the Universiti Teknikal Malaysia Melaka which provided the
facilities for the research. This financial and facilities support is gratefully acknowledged.
REFERENCES
1. Akay, A. 2002, Acoustics of Friction. Journal of the Acoustical Society of America, 111:
1525–1548.
2. Dunlap, K.B., M.A. Riehle and R.E. Longhouse, 1999, An Investigation Overview of
Automotive Disc Brake Noise, S.A.E. Technical Paper 1999-01-0142.
3. Qatu, M.S., M.K. Abdelhamid, J. Pang and G. Sheng, 2009, An Overview of Brake Noise
and Vibration Problems. International Journal of Vehicle Noise and Vibration, 5(1/2): 1-35.
4. Rhee, S.K., P.H.S. Tsang and Y.S. Wang, 1989, Friction-induced Noise and Vibration of
Disc Brakes. Wear 133(1): 39–45.
Jurnal Mekanikal June 2014
15
5. Bryant, D., J.D. Fieldhouse, A. Crampton, C. Talbot and J. Layfield, 2008, Thermal Brake
Judder Investigations using a High Speed Dynamometer. SAE Technical Paper 2008-01-
0818.
6. Hetzler, H. and W. Seemann, 2006, Friction Modes in Low Frequency Disc Brake Noise
Experimental Results and Implications on Modeling, Proceedings of Applied Mathemathics
and Mechanics, 6.
7. Little, E., T. Kao, P. Ferdani and T. Hodges, 1998, A Dynamometer Investigation of
Thermal Judder, SAE Technical Paper 982252.
8. Lindberg, Eskil, Nils-Erik Hörlin, and Peter Göransson, 2013, An Experimental Study Of
Interior Vehicle Roughness Noise From Disc Brake Systems. Applied Acoustics 74(3) :
396-406.
9. Tzou, K.I., J.A. Wickert and A. Akay, 1998, In-plane Vibration Modes of Arbitrarily Thick
Disks. Journal of Vibration and Acoustics , 120(2): 384-391.
10. Matsuzaki, M. and T. Izumihara , 1993, Brake Noise Caused by Longitudinal Vibration of
the Disc Rotor, SAE Technical Paper 930804.
11. Ichiba,Y. and Y. Nagasawa, 1993, An Experimental Study on Disc Brake Squeal Modes
and Squeal Exciting Energy, Proceedings of Asia-Pacific Vibration Conference,
Kitakyushu Japan, 629-633.
12. Kubota, M., T. Suenaga and D. Kazuhiro, 1998, A Study of the Mechanism Causing High-
Speed Brake Judder, SAE Technical Paper 980594.
13. Gouya, M. and M. Nishiwaki, 1990, Study on Disc Brake Groan, SAE Technical Paper
900007.