Embed Size (px)
Citation preview

Portugaliae Electrochimica Acta 2011, 29(4), 233-251
DOI: 10.4152/pea.201104233
PORTUGALIAE
ELECTROCHIMICA
ACTA ISSN 1647-1571
Investigation of Passive Film Properties and Pitting
Resistance of AISI 316 in Aqueous Ethanoic Acid
Containing Chloride Ions using Electrochemical
Impedance Spectroscopy(EIS)
Neelima Mahato* and M.M. Singh
Department of Applied Chemistry, Institute of Technology, Banaras Hindu University,
Varanasi, 221 005, India
Received 14 February 2011; accepted 8 June 2011
Abstract
The structure and properties of the passive film formed on the surface of AISI 316
stainless steel in aqueous ethanoic acid have been investigated using EIS. Experiments
were carried out at 30 ºC in different concentrations of ethanoic acid. Effects on the film
properties due to the change of electrode potential, exposure durations and addition of
chloride ions to the electrolyte were also studied. Impedance parameters were
determined using simple model and equivalent electrical circuit. Results suggest the
formation of multilayered passive film on the steel surface. The film possessed dual
structure. Inner layers were thin and compact, whereas the outer layer was porous and
defective. The measured capacitive behavior was of non ideal nature and hence replaced
by constant phase element or CPE. Formation of the passive film and the change in its
structure has been explained using impedance parameters.
Keywords: Constant phase element, CPE factor, passive film, pseudo inductance,
pitting.
Introduction
AISI 316 austenitic stainless steels have been developed for their applicability
and extensive use in moderate to severe corrosive conditions. The steel exhibits
high corrosion resistance, primarily, due to the formation of a passive film on its
surface. Researchers [1-4] have reported that the passive film formed on stainless
steel surface responds to ac signals and a lot of information regarding film
properties, kinetics and mechanism of corrosion process can be provided by ac
impedance measurements. EIS has become a very powerful technique in
corrosion science. One of the principle advantages of EIS over traditional dc
* Corresponding author. E-mail address: [email protected]
N. Mahato & M.M. Singh / Port. Electrochim. Acta 29 (2011) 233-251
234
techniques is that EIS can be well performed in low solution conductivity, which
was a problem that may affect the electrochemical measurements of dc
techniques. Also EIS is a non destructive technique (small signal applied during
the measurements), so that EIS measurements can be repeated several times
using the same electrochemical cell without altering its electrochemical
properties [5].
Impedance investigations in aqueous mineral acid media have been reported
extensively till recent past, but, reports in organic acids are scanty. Ethanoic acid
is extensively used in processing, pharmaceutical, refinery and petrochemical
industries. Impedance behavior of AISI 316 SS in ethanoic acid exhibits a
variety of features owing to its alloy composition and therefore, a systematic
study provides valuable information regarding the properties of steel in organic
acid media. Since, the interpretation of results is the most important part of
impedance investigations and therefore, it is essential to pick the right model to
explain the results. The method employed in this communication is convenient to
apply in any other steel-organic acid system.
The commonly observed features during the impedance measurements of AISI
316 SS are depressed semicircle, non ideal capacitance and pseudo inductance.
Theoretically, in ideal cases, the Nyquist plot is a semicircle with its center on
the x-axis. Depressed semicircles are explained by a number of phenomena
depending on the nature of the system being investigated. Either some properties
of the system are not homogeneous, or there is distribution (dispersion) of the
values of the same feature at different locations over the electrode surface. This
causes requirement to incorporate a new element in the equivalent electrical
circuit, i.e., non ideal capacitance (defined as constant phase element CPE) in
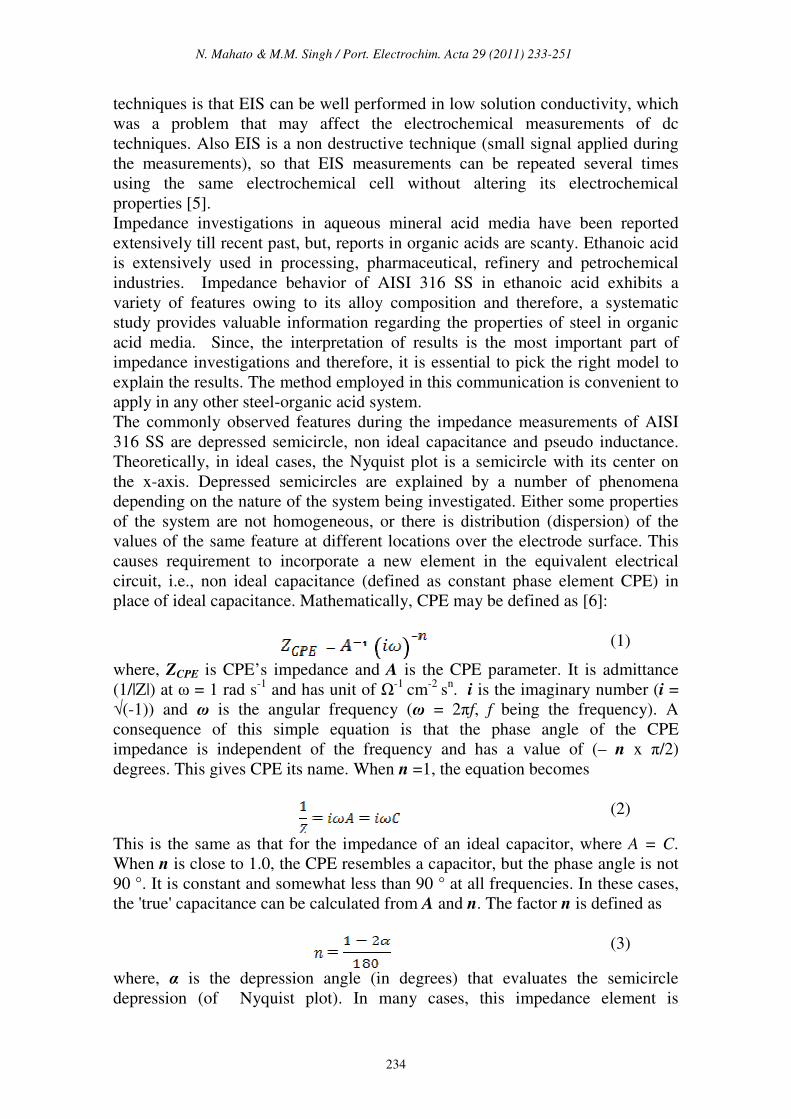
place of ideal capacitance. Mathematically, CPE may be defined as [6]:
(1)
where, ZCPE is CPE’s impedance and A is the CPE parameter. It is admittance
(1/|Z|) at ω = 1 rad s-1
and has unit of Ω-1 cm
-2 s
n. i is the imaginary number (i =
√(-1)) and ω is the angular frequency (ω = 2πf, f being the frequency). A
consequence of this simple equation is that the phase angle of the CPE
impedance is independent of the frequency and has a value of (– n x π/2)
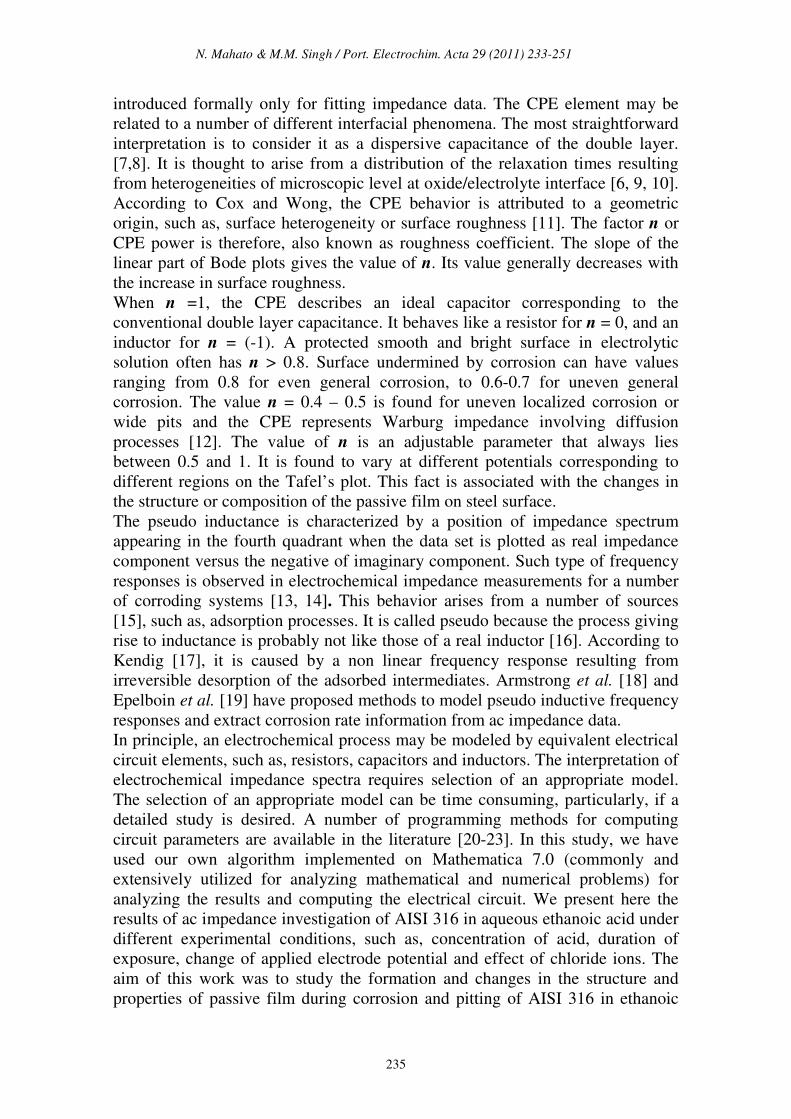
degrees. This gives CPE its name. When n =1, the equation becomes
(2)
This is the same as that for the impedance of an ideal capacitor, where A = C.
When n is close to 1.0, the CPE resembles a capacitor, but the phase angle is not
90 °. It is constant and somewhat less than 90 ° at all frequencies. In these cases,
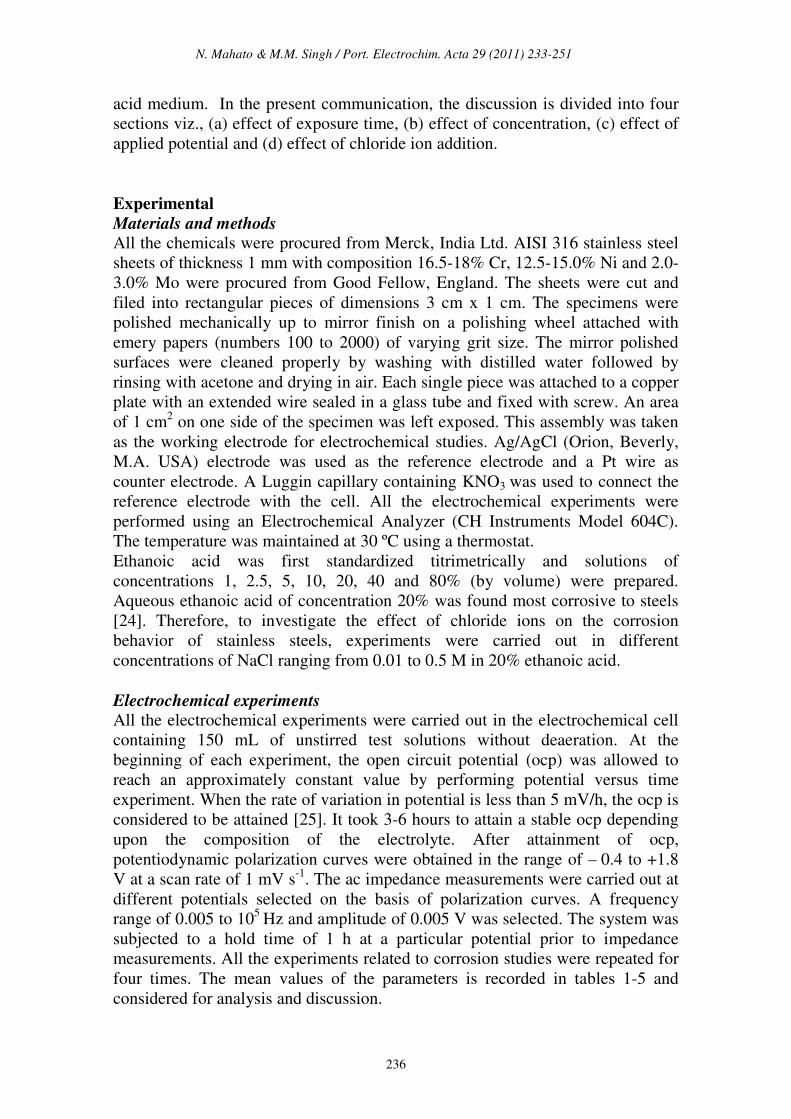
the 'true' capacitance can be calculated from A and n. The factor n is defined as
(3)
where, α is the depression angle (in degrees) that evaluates the semicircle
depression (of Nyquist plot). In many cases, this impedance element is
N. Mahato & M.M. Singh / Port. Electrochim. Acta 29 (2011) 233-251
235
introduced formally only for fitting impedance data. The CPE element may be
related to a number of different interfacial phenomena. The most straightforward
interpretation is to consider it as a dispersive capacitance of the double layer.
[7,8]. It is thought to arise from a distribution of the relaxation times resulting
from heterogeneities of microscopic level at oxide/electrolyte interface [6, 9, 10].
According to Cox and Wong, the CPE behavior is attributed to a geometric
origin, such as, surface heterogeneity or surface roughness [11]. The factor n or
CPE power is therefore, also known as roughness coefficient. The slope of the
linear part of Bode plots gives the value of n. Its value generally decreases with
the increase in surface roughness.
When n =1, the CPE describes an ideal capacitor corresponding to the
conventional double layer capacitance. It behaves like a resistor for n = 0, and an
inductor for n = (-1). A protected smooth and bright surface in electrolytic
solution often has n > 0.8. Surface undermined by corrosion can have values
ranging from 0.8 for even general corrosion, to 0.6-0.7 for uneven general
corrosion. The value n = 0.4 – 0.5 is found for uneven localized corrosion or
wide pits and the CPE represents Warburg impedance involving diffusion
processes [12]. The value of n is an adjustable parameter that always lies
between 0.5 and 1. It is found to vary at different potentials corresponding to
different regions on the Tafel’s plot. This fact is associated with the changes in
the structure or composition of the passive film on steel surface.
The pseudo inductance is characterized by a position of impedance spectrum
appearing in the fourth quadrant when the data set is plotted as real impedance
component versus the negative of imaginary component. Such type of frequency
responses is observed in electrochemical impedance measurements for a number
of corroding systems [13, 14]. This behavior arises from a number of sources
[15], such as, adsorption processes. It is called pseudo because the process giving
rise to inductance is probably not like those of a real inductor [16]. According to
Kendig [17], it is caused by a non linear frequency response resulting from
irreversible desorption of the adsorbed intermediates. Armstrong et al. [18] and
Epelboin et al. [19] have proposed methods to model pseudo inductive frequency
responses and extract corrosion rate information from ac impedance data.
In principle, an electrochemical process may be modeled by equivalent electrical
circuit elements, such as, resistors, capacitors and inductors. The interpretation of
electrochemical impedance spectra requires selection of an appropriate model.
The selection of an appropriate model can be time consuming, particularly, if a
detailed study is desired. A number of programming methods for computing
circuit parameters are available in the literature [20-23]. In this study, we have
used our own algorithm implemented on Mathematica 7.0 (commonly and
extensively utilized for analyzing mathematical and numerical problems) for
analyzing the results and computing the electrical circuit. We present here the
results of ac impedance investigation of AISI 316 in aqueous ethanoic acid under
different experimental conditions, such as, concentration of acid, duration of
exposure, change of applied electrode potential and effect of chloride ions. The
aim of this work was to study the formation and changes in the structure and
properties of passive film during corrosion and pitting of AISI 316 in ethanoic
N. Mahato & M.M. Singh / Port. Electrochim. Acta 29 (2011) 233-251
236
acid medium. In the present communication, the discussion is divided into four
sections viz., (a) effect of exposure time, (b) effect of concentration, (c) effect of
applied potential and (d) effect of chloride ion addition.
Experimental
Materials and methods
All the chemicals were procured from Merck, India Ltd. AISI 316 stainless steel
sheets of thickness 1 mm with composition 16.5-18% Cr, 12.5-15.0% Ni and 2.0-
3.0% Mo were procured from Good Fellow, England. The sheets were cut and
filed into rectangular pieces of dimensions 3 cm x 1 cm. The specimens were
polished mechanically up to mirror finish on a polishing wheel attached with
emery papers (numbers 100 to 2000) of varying grit size. The mirror polished
surfaces were cleaned properly by washing with distilled water followed by
rinsing with acetone and drying in air. Each single piece was attached to a copper
plate with an extended wire sealed in a glass tube and fixed with screw. An area
of 1 cm2 on one side of the specimen was left exposed. This assembly was taken
as the working electrode for electrochemical studies. Ag/AgCl (Orion, Beverly,
M.A. USA) electrode was used as the reference electrode and a Pt wire as
counter electrode. A Luggin capillary containing KNO3 was used to connect the
reference electrode with the cell. All the electrochemical experiments were
performed using an Electrochemical Analyzer (CH Instruments Model 604C).
The temperature was maintained at 30 ºC using a thermostat.
Ethanoic acid was first standardized titrimetrically and solutions of
concentrations 1, 2.5, 5, 10, 20, 40 and 80% (by volume) were prepared.
Aqueous ethanoic acid of concentration 20% was found most corrosive to steels
[24]. Therefore, to investigate the effect of chloride ions on the corrosion
behavior of stainless steels, experiments were carried out in different
concentrations of NaCl ranging from 0.01 to 0.5 M in 20% ethanoic acid.
Electrochemical experiments All the electrochemical experiments were carried out in the electrochemical cell
containing 150 mL of unstirred test solutions without deaeration. At the
beginning of each experiment, the open circuit potential (ocp) was allowed to
reach an approximately constant value by performing potential versus time
experiment. When the rate of variation in potential is less than 5 mV/h, the ocp is
considered to be attained [25]. It took 3-6 hours to attain a stable ocp depending
upon the composition of the electrolyte. After attainment of ocp,
potentiodynamic polarization curves were obtained in the range of – 0.4 to +1.8
V at a scan rate of 1 mV s-1
. The ac impedance measurements were carried out at
different potentials selected on the basis of polarization curves. A frequency
range of 0.005 to 105
Hz and amplitude of 0.005 V was selected. The system was
subjected to a hold time of 1 h at a particular potential prior to impedance
measurements. All the experiments related to corrosion studies were repeated for
four times. The mean values of the parameters is recorded in tables 1-5 and
considered for analysis and discussion.
N. Mahato & M.M. Singh / Port. Electrochim. Acta 29 (2011) 233-251
237
Determination of impedance parameters We have used our own algorithm implemented on Mathematica 7.0 to determine
circuit parameters rather than using the ones reported in the literature for
computing the circuit parameters. This gives us a better handle to restrict to a
single (or
few) circuit(s) for fitting to many data sets. We chose the goodness of fit (χ2) to
be
(4)
in place of the conventional chi square parameter. Here, Zth and ZE denote the
theoretical and experimental value of the impedance and index ‘I’ runs over all
the data points. This is because our impedance data vary over many orders (101
to 104). Moreover, the percentage errors occurring at higher orders weigh much
more compared to those occurring for lower values of impedances. So, we first
calculated the difference between unity and the ratio of theoretical value of
impedance versus that obtained from the experimental data. Then we took the
goodness of fit to be the sum of squares of the absolute values of these
differences. In other words, we computed the distance in complex impedance
plane between the experimental value of impedance and its theoretical value for a
given set of circuit parameters. The goodness of fit of a statistical model
describes how well it fits a set of observations. Measures of goodness of fit
typically summarize the discrepancy between observed values and the values
expected under the model in question. Goodness of fit is a method to measure the
error in curve fitting. A lower value of chi-square reflects better fitting of the
data.
We then normalized this distance by dividing it with the experimental data and
calculated its difference from unity. This was followed by computing the sum of
square of the absolute values of the differences between theoretical and
experimental values to obtain goodness of fit parameter as stated in Eq. 4 (Fig. 3).
After that, we determined the circuit parameters by minimizing the above
mentioned goodness of fit parameter using Wolfram Mathematica 7.0. The
corresponding program takes much less evaluation time if the iterative process to
adjust the CPE exponent(s) is done manually rather than allowing the program
itself to do so. Such a procedure seems to give much better fitting (as seen by
eye) of the curves in impedance plots. The Nyquist and Bode plots were fitted by
fixing the circuit parameters into the impedance equation in the programming
steps. The program was run over 20 to 500 iterations with different CPE
exponents in order to minimize the goodness of fit and get maximum fitting. In
the end, program yields results in the form of circuit parameters viz., solution
resistance (Rs), charge transfer resistance (Rt), non ideal capacitance in terms of
constant phase element (CPE), CPE exponent and inductance (L).
N. Mahato & M.M. Singh / Port. Electrochim. Acta 29 (2011) 233-251
238
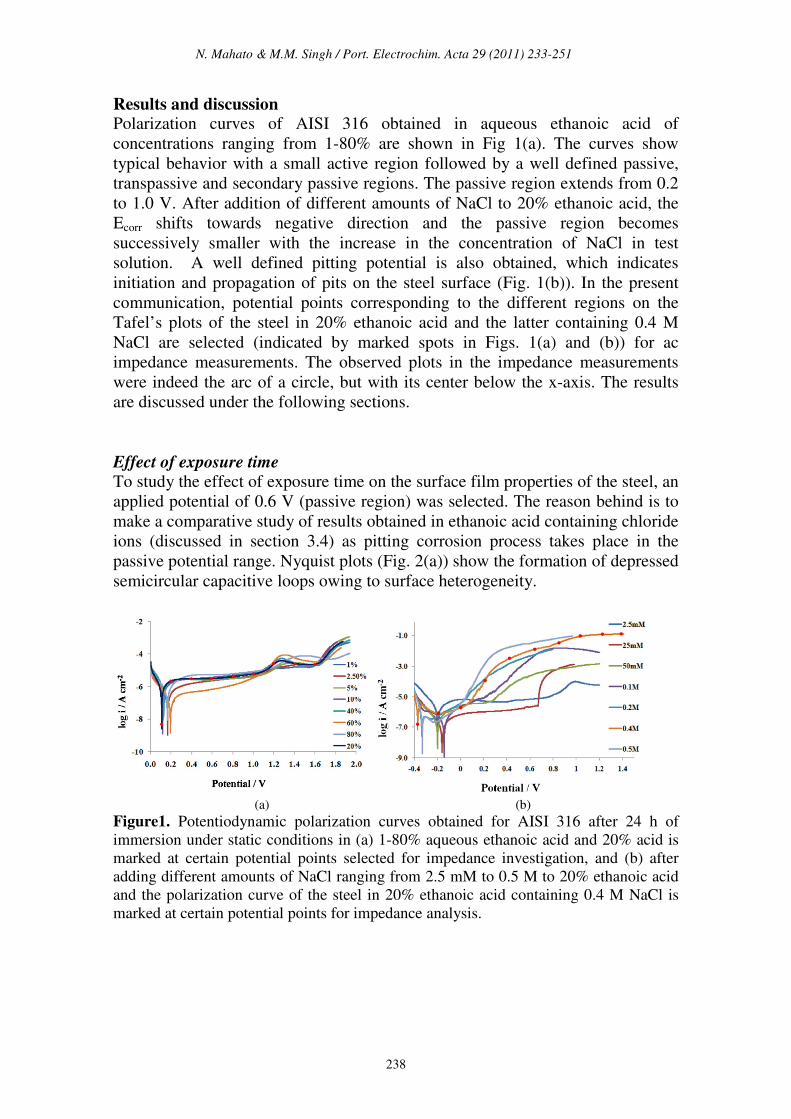
Results and discussion Polarization curves of AISI 316 obtained in aqueous ethanoic acid of
concentrations ranging from 1-80% are shown in Fig 1(a). The curves show
typical behavior with a small active region followed by a well defined passive,
transpassive and secondary passive regions. The passive region extends from 0.2
to 1.0 V. After addition of different amounts of NaCl to 20% ethanoic acid, the
Ecorr shifts towards negative direction and the passive region becomes
successively smaller with the increase in the concentration of NaCl in test
solution. A well defined pitting potential is also obtained, which indicates
initiation and propagation of pits on the steel surface (Fig. 1(b)). In the present
communication, potential points corresponding to the different regions on the
Tafel’s plots of the steel in 20% ethanoic acid and the latter containing 0.4 M
NaCl are selected (indicated by marked spots in Figs. 1(a) and (b)) for ac
impedance measurements. The observed plots in the impedance measurements
were indeed the arc of a circle, but with its center below the x-axis. The results
are discussed under the following sections.
Effect of exposure time To study the effect of exposure time on the surface film properties of the steel, an
applied potential of 0.6 V (passive region) was selected. The reason behind is to
make a comparative study of results obtained in ethanoic acid containing chloride
ions (discussed in section 3.4) as pitting corrosion process takes place in the
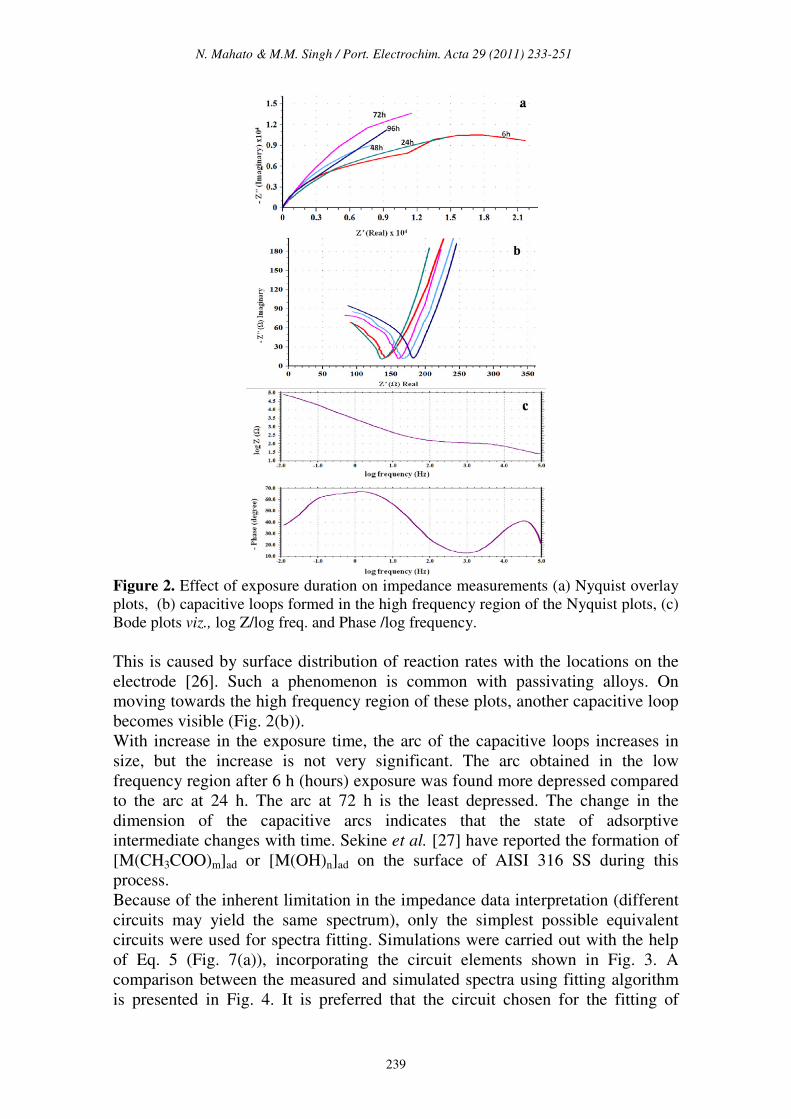
passive potential range. Nyquist plots (Fig. 2(a)) show the formation of depressed
semicircular capacitive loops owing to surface heterogeneity.
(a) (b)
Figure1. Potentiodynamic polarization curves obtained for AISI 316 after 24 h of
immersion under static conditions in (a) 1-80% aqueous ethanoic acid and 20% acid is
marked at certain potential points selected for impedance investigation, and (b) after
adding different amounts of NaCl ranging from 2.5 mM to 0.5 M to 20% ethanoic acid
and the polarization curve of the steel in 20% ethanoic acid containing 0.4 M NaCl is
marked at certain potential points for impedance analysis.
N. Mahato & M.M. Singh / Port. Electrochim. Acta 29 (2011) 233-251
239
Figure 2. Effect of exposure duration on impedance measurements (a) Nyquist overlay
plots, (b) capacitive loops formed in the high frequency region of the Nyquist plots, (c)
Bode plots viz., log Z/log freq. and Phase /log frequency.
This is caused by surface distribution of reaction rates with the locations on the
electrode [26]. Such a phenomenon is common with passivating alloys. On
moving towards the high frequency region of these plots, another capacitive loop
becomes visible (Fig. 2(b)).
With increase in the exposure time, the arc of the capacitive loops increases in
size, but the increase is not very significant. The arc obtained in the low
frequency region after 6 h (hours) exposure was found more depressed compared
to the arc at 24 h. The arc at 72 h is the least depressed. The change in the
dimension of the capacitive arcs indicates that the state of adsorptive
intermediate changes with time. Sekine et al. [27] have reported the formation of
[M(CH3COO)m]ad or [M(OH)n]ad on the surface of AISI 316 SS during this
process.
Because of the inherent limitation in the impedance data interpretation (different
circuits may yield the same spectrum), only the simplest possible equivalent
circuits were used for spectra fitting. Simulations were carried out with the help
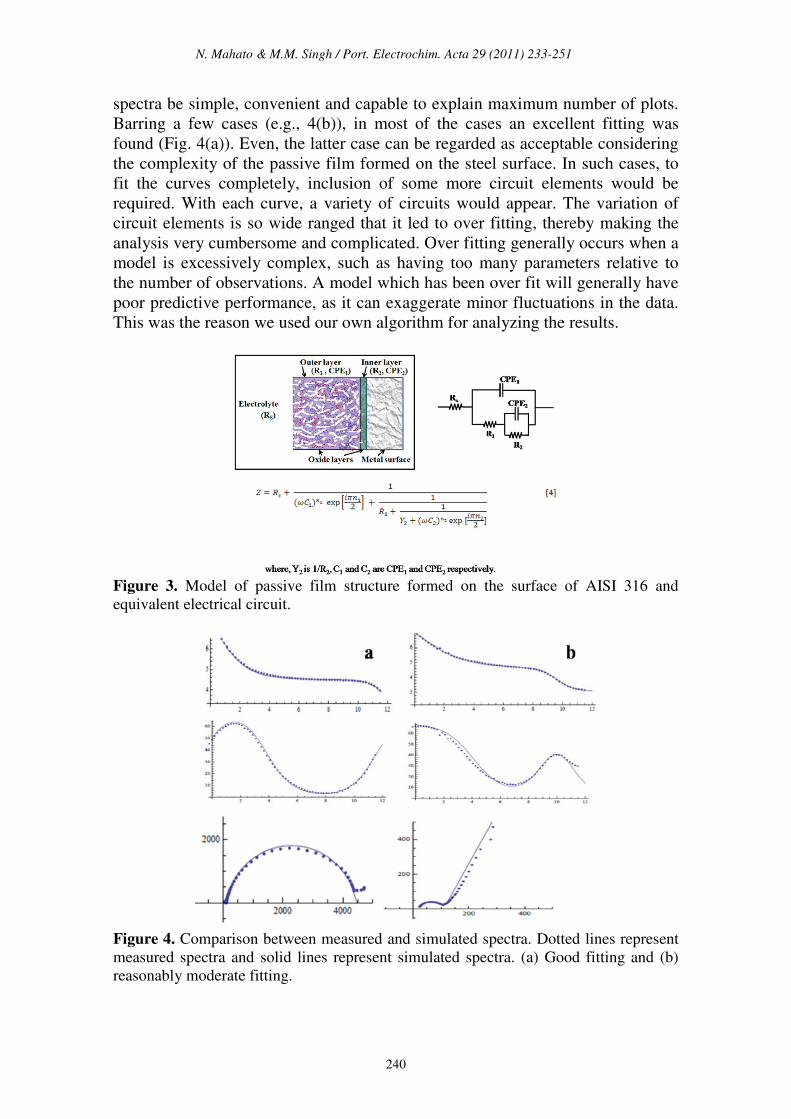
of Eq. 5 (Fig. 7(a)), incorporating the circuit elements shown in Fig. 3. A
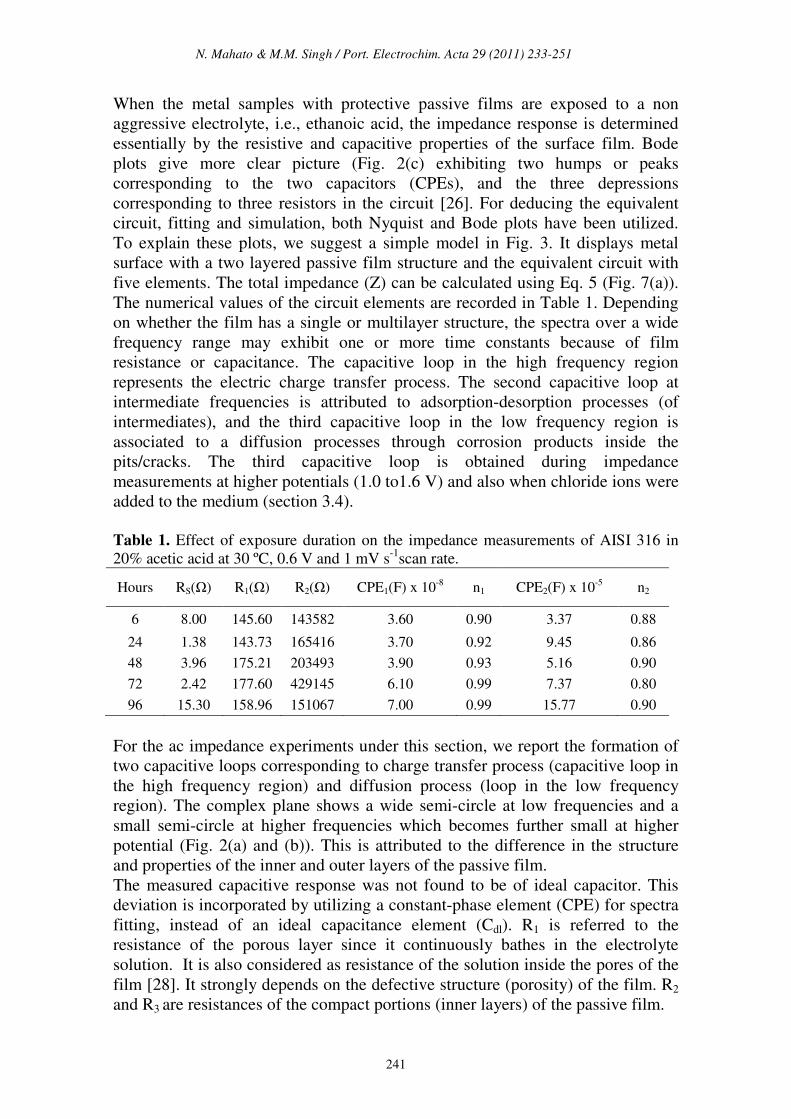
comparison between the measured and simulated spectra using fitting algorithm
is presented in Fig. 4. It is preferred that the circuit chosen for the fitting of
N. Mahato & M.M. Singh / Port. Electrochim. Acta 29 (2011) 233-251
240
spectra be simple, convenient and capable to explain maximum number of plots.
Barring a few cases (e.g., 4(b)), in most of the cases an excellent fitting was
found (Fig. 4(a)). Even, the latter case can be regarded as acceptable considering
the complexity of the passive film formed on the steel surface. In such cases, to
fit the curves completely, inclusion of some more circuit elements would be
required. With each curve, a variety of circuits would appear. The variation of
circuit elements is so wide ranged that it led to over fitting, thereby making the
analysis very cumbersome and complicated. Over fitting generally occurs when a
model is excessively complex, such as having too many parameters relative to
the number of observations. A model which has been over fit will generally have
poor predictive performance, as it can exaggerate minor fluctuations in the data.
This was the reason we used our own algorithm for analyzing the results.
Figure 3. Model of passive film structure formed on the surface of AISI 316 and
equivalent electrical circuit.
Figure 4. Comparison between measured and simulated spectra. Dotted lines represent
measured spectra and solid lines represent simulated spectra. (a) Good fitting and (b)
reasonably moderate fitting.
N. Mahato & M.M. Singh / Port. Electrochim. Acta 29 (2011) 233-251
241
When the metal samples with protective passive films are exposed to a non
aggressive electrolyte, i.e., ethanoic acid, the impedance response is determined
essentially by the resistive and capacitive properties of the surface film. Bode
plots give more clear picture (Fig. 2(c) exhibiting two humps or peaks
corresponding to the two capacitors (CPEs), and the three depressions
corresponding to three resistors in the circuit [26]. For deducing the equivalent
circuit, fitting and simulation, both Nyquist and Bode plots have been utilized.
To explain these plots, we suggest a simple model in Fig. 3. It displays metal
surface with a two layered passive film structure and the equivalent circuit with
five elements. The total impedance (Z) can be calculated using Eq. 5 (Fig. 7(a)).
The numerical values of the circuit elements are recorded in Table 1. Depending
on whether the film has a single or multilayer structure, the spectra over a wide
frequency range may exhibit one or more time constants because of film
resistance or capacitance. The capacitive loop in the high frequency region
represents the electric charge transfer process. The second capacitive loop at
intermediate frequencies is attributed to adsorption-desorption processes (of
intermediates), and the third capacitive loop in the low frequency region is
associated to a diffusion processes through corrosion products inside the
pits/cracks. The third capacitive loop is obtained during impedance
measurements at higher potentials (1.0 to1.6 V) and also when chloride ions were
added to the medium (section 3.4).
Table 1. Effect of exposure duration on the impedance measurements of AISI 316 in
20% acetic acid at 30 ºC, 0.6 V and 1 mV s-1
scan rate.
Hours RS(Ω) R1(Ω) R2(Ω) CPE1(F) x 10-8 n1 CPE2(F) x 10
-5 n2
6 8.00 145.60 143582 3.60 0.90 3.37 0.88
24 1.38 143.73 165416 3.70 0.92 9.45 0.86
48 3.96 175.21 203493 3.90 0.93 5.16 0.90
72 2.42 177.60 429145 6.10 0.99 7.37 0.80
96 15.30 158.96 151067 7.00 0.99 15.77 0.90
For the ac impedance experiments under this section, we report the formation of
two capacitive loops corresponding to charge transfer process (capacitive loop in
the high frequency region) and diffusion process (loop in the low frequency
region). The complex plane shows a wide semi-circle at low frequencies and a
small semi-circle at higher frequencies which becomes further small at higher
potential (Fig. 2(a) and (b)). This is attributed to the difference in the structure
and properties of the inner and outer layers of the passive film.
The measured capacitive response was not found to be of ideal capacitor. This
deviation is incorporated by utilizing a constant-phase element (CPE) for spectra
fitting, instead of an ideal capacitance element (Cdl). R1 is referred to the
resistance of the porous layer since it continuously bathes in the electrolyte
solution. It is also considered as resistance of the solution inside the pores of the
film [28]. It strongly depends on the defective structure (porosity) of the film. R2
and R3 are resistances of the compact portions (inner layers) of the passive film.
N. Mahato & M.M. Singh / Port. Electrochim. Acta 29 (2011) 233-251
242
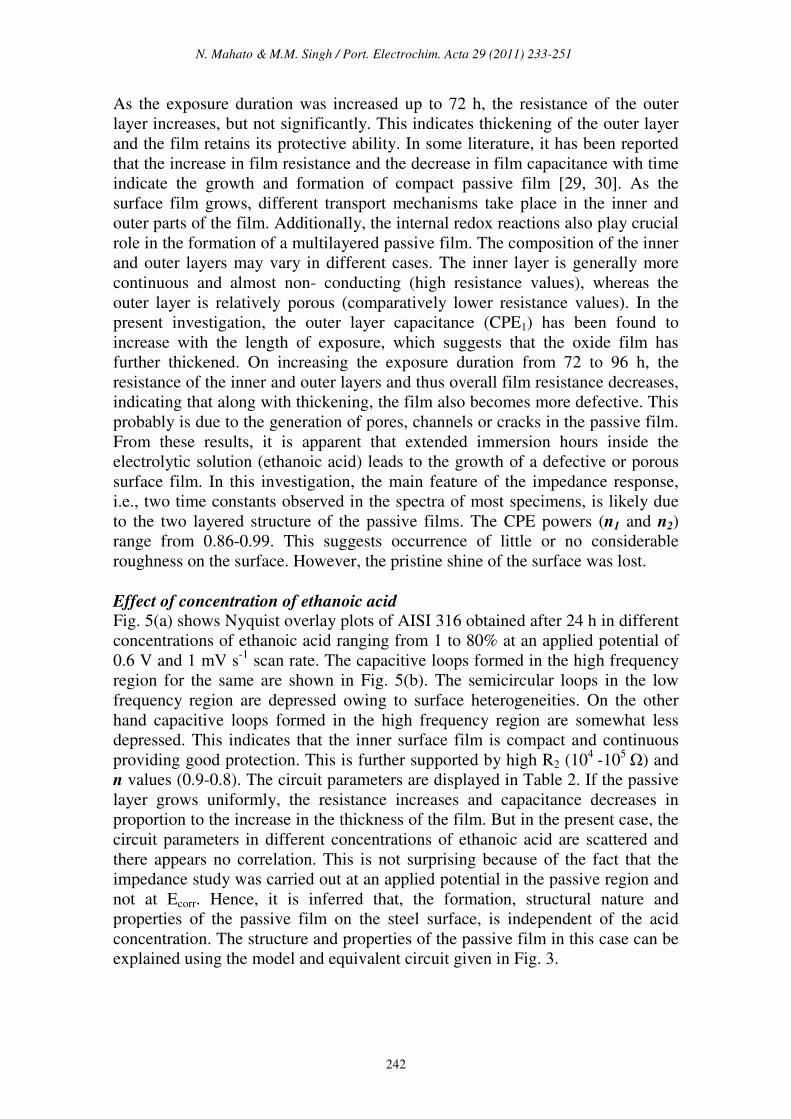
As the exposure duration was increased up to 72 h, the resistance of the outer
layer increases, but not significantly. This indicates thickening of the outer layer
and the film retains its protective ability. In some literature, it has been reported
that the increase in film resistance and the decrease in film capacitance with time
indicate the growth and formation of compact passive film [29, 30]. As the
surface film grows, different transport mechanisms take place in the inner and
outer parts of the film. Additionally, the internal redox reactions also play crucial
role in the formation of a multilayered passive film. The composition of the inner
and outer layers may vary in different cases. The inner layer is generally more
continuous and almost non- conducting (high resistance values), whereas the
outer layer is relatively porous (comparatively lower resistance values). In the
present investigation, the outer layer capacitance (CPE1) has been found to
increase with the length of exposure, which suggests that the oxide film has
further thickened. On increasing the exposure duration from 72 to 96 h, the
resistance of the inner and outer layers and thus overall film resistance decreases,
indicating that along with thickening, the film also becomes more defective. This
probably is due to the generation of pores, channels or cracks in the passive film.
From these results, it is apparent that extended immersion hours inside the
electrolytic solution (ethanoic acid) leads to the growth of a defective or porous
surface film. In this investigation, the main feature of the impedance response,
i.e., two time constants observed in the spectra of most specimens, is likely due
to the two layered structure of the passive films. The CPE powers (n1 and n2)
range from 0.86-0.99. This suggests occurrence of little or no considerable
roughness on the surface. However, the pristine shine of the surface was lost.
Effect of concentration of ethanoic acid Fig. 5(a) shows Nyquist overlay plots of AISI 316 obtained after 24 h in different
concentrations of ethanoic acid ranging from 1 to 80% at an applied potential of
0.6 V and 1 mV s-1
scan rate. The capacitive loops formed in the high frequency
region for the same are shown in Fig. 5(b). The semicircular loops in the low
frequency region are depressed owing to surface heterogeneities. On the other
hand capacitive loops formed in the high frequency region are somewhat less
depressed. This indicates that the inner surface film is compact and continuous
providing good protection. This is further supported by high R2 (104
-105 Ω) and
n values (0.9-0.8). The circuit parameters are displayed in Table 2. If the passive
layer grows uniformly, the resistance increases and capacitance decreases in
proportion to the increase in the thickness of the film. But in the present case, the
circuit parameters in different concentrations of ethanoic acid are scattered and
there appears no correlation. This is not surprising because of the fact that the
impedance study was carried out at an applied potential in the passive region and
not at Ecorr. Hence, it is inferred that, the formation, structural nature and
properties of the passive film on the steel surface, is independent of the acid
concentration. The structure and properties of the passive film in this case can be
explained using the model and equivalent circuit given in Fig. 3.

N. Mahato & M.M. Singh / Port. Electrochim. Acta 29 (2011) 233-251
243
Figure 5. Effect of concentration of ethanoic acid on the impedance measurements of
AISI 316. (a) Nyquist overlay plots and (b) capacitive loops of the same in the high
frequency region.
During the corrosion process of stainless steels in acidic electrolyte, the
composition, structure, and morphology of the passive film vary with
composition and time [28]. The dielectric constant may change according to the
variation in the film composition and structure. The effective area may also
increase significantly due to an increase in the surface roughness. In particular,
the resistivity may vary since it depends strongly upon the defective structure of
the passive film. If interconnecting pores, channels, or cracks are formed inside
the oxide film, they affect many properties of the film. Impedance of the whole
layer can be calculated using equivalent circuit based on the surface film (oxide
layer) model given in Fig. 3, but the details of individual pores, channels, or
cracks cannot be obtained. The total effect of pores, channels, or cracks on the
impedance response is reflected in the parameters of the outer layer (R1, CPE1
and n1) and possibly also in R2 when the defects extend into the barrier layer. R1
is a measure of general corrosion rates, but alone it is inadequate to characterize
uniform or localized corrosion. The surface roughness caused by corrosion
increases the real surface area and double layer capacitance, while decreasing n.
Although the coefficient n by itself suffices as a roughness indicator, a
combination of R1 and n gives more valuable information for the classification of
corrosion patterns. An accelerated corrosion decreases charge transfer resistance
and increases surface roughness. Hence both R1 and n decrease simultaneously.
In the event of severe localized corrosion, low values of R1 and n are expected.
When corrosion is subdued by uniform coverage of a passive film, as in the
present case, both R1 and n are high. This suggests that the surface is not affected
due to insignificant corrosion.
N. Mahato & M.M. Singh / Port. Electrochim. Acta 29 (2011) 233-251
244
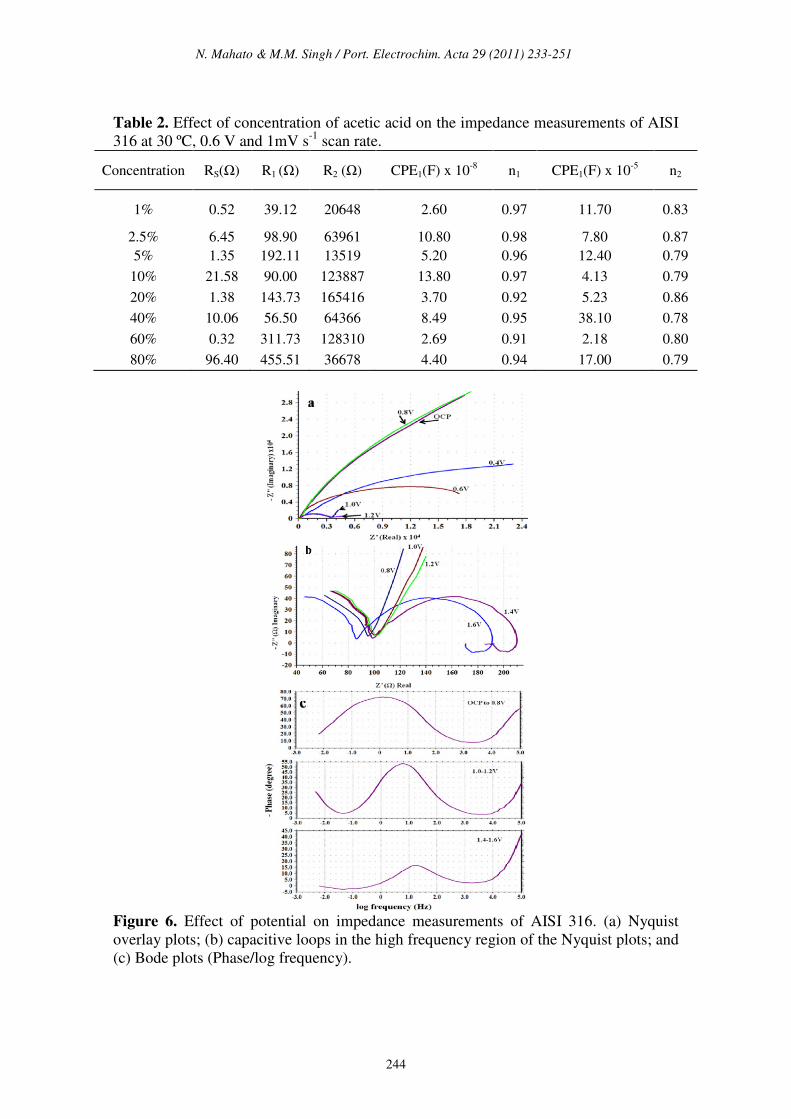
Table 2. Effect of concentration of acetic acid on the impedance measurements of AISI
316 at 30 ºC, 0.6 V and 1mV s-1
scan rate.
Concentration RS(Ω) R1 (Ω) R2 (Ω) CPE1(F) x 10-8 n1 CPE1(F) x 10
-5 n2
1% 0.52 39.12 20648 2.60 0.97 11.70 0.83
2.5% 6.45 98.90 63961 10.80 0.98 7.80 0.87
5% 1.35 192.11 13519 5.20 0.96 12.40 0.79
10% 21.58 90.00 123887 13.80 0.97 4.13 0.79
20% 1.38 143.73 165416 3.70 0.92 5.23 0.86
40% 10.06 56.50 64366 8.49 0.95 38.10 0.78
60% 0.32 311.73 128310 2.69 0.91 2.18 0.80
80% 96.40 455.51 36678 4.40 0.94 17.00 0.79
Figure 6. Effect of potential on impedance measurements of AISI 316. (a) Nyquist
overlay plots; (b) capacitive loops in the high frequency region of the Nyquist plots; and
(c) Bode plots (Phase/log frequency).
N. Mahato & M.M. Singh / Port. Electrochim. Acta 29 (2011) 233-251
245
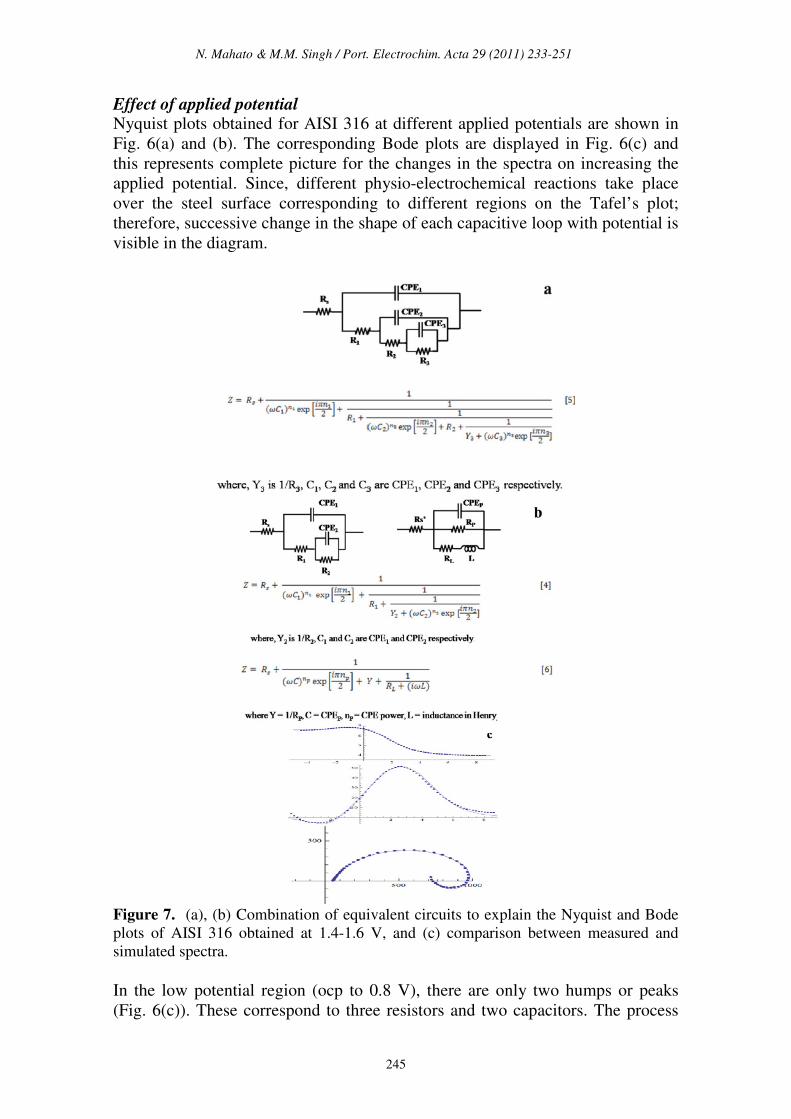
Effect of applied potential Nyquist plots obtained for AISI 316 at different applied potentials are shown in
Fig. 6(a) and (b). The corresponding Bode plots are displayed in Fig. 6(c) and
this represents complete picture for the changes in the spectra on increasing the
applied potential. Since, different physio-electrochemical reactions take place
over the steel surface corresponding to different regions on the Tafel’s plot;
therefore, successive change in the shape of each capacitive loop with potential is
visible in the diagram.
Figure 7. (a), (b) Combination of equivalent circuits to explain the Nyquist and Bode
plots of AISI 316 obtained at 1.4-1.6 V, and (c) comparison between measured and
simulated spectra.
In the low potential region (ocp to 0.8 V), there are only two humps or peaks
(Fig. 6(c)). These correspond to three resistors and two capacitors. The process
N. Mahato & M.M. Singh / Port. Electrochim. Acta 29 (2011) 233-251
246
can be explained by the model shown in Fig. 3. When the potential was increased
from 1.0 to 1.2 V, there appeared one more peak. It corresponds to the
introduction of a third capacitor in the equivalent circuit. There are now three
time constants in the equivalent electrical circuit as given in Fig. 7(a). The total
impedance can be calculated using Eq. 6 (Fig. 7b). On further increasing the
potential from 1.4 to 1.6 V, inductive loop in the low frequency region is formed
which appears in the fourth quadrant. In the Bode plot, this phenomenon appears
as a low frequency tail creeping below zero or negative quadrant Fig. 6(c). This
is due to the formation of adsorbed intermediates on the steel surface. To explain
the inductive loop formation in the case of AISI 316 (Fig. 6(b) and (c)) in single
attempt, the circuit becomes complicated. In order to simplify it, the circuit was
divided into two parts (Fig. 7(b)). For programming and simulation, the
experimental text data of the Nyquist and Bode plots were divided into two parts
and it was found that the algorithm for the above mentioned circuits runs
successfully.
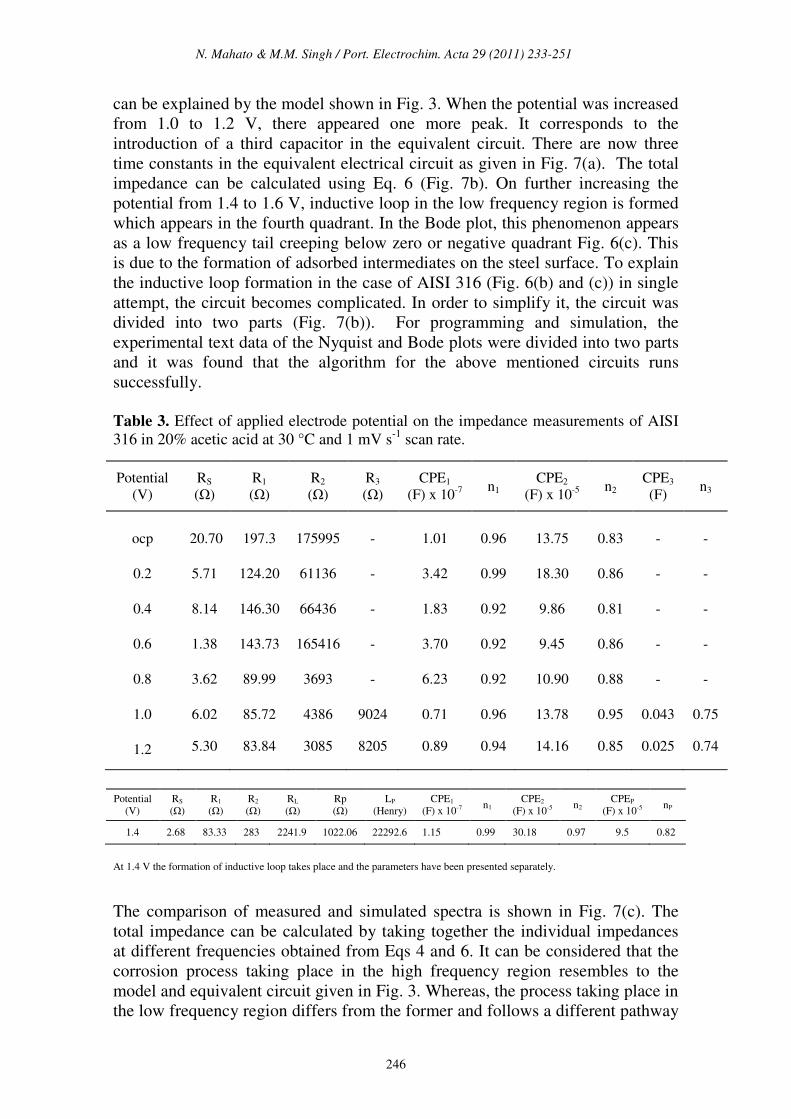
Table 3. Effect of applied electrode potential on the impedance measurements of AISI
316 in 20% acetic acid at 30 °C and 1 mV s-1
scan rate.
Potential
(V)
RS
(Ω)
R1
(Ω)
R2
(Ω)
RL
(Ω)
Rp
(Ω)
LP
(Henry)
CPE1
(F) x 10-7 n1
CPE2
(F) x 10-5 n2
CPEP
(F) x 10-5 nP
1.4 2.68 83.33 283 2241.9 1022.06 22292.6 1.15 0.99 30.18 0.97 9.5 0.82
At 1.4 V the formation of inductive loop takes place and the parameters have been presented separately.
The comparison of measured and simulated spectra is shown in Fig. 7(c). The
total impedance can be calculated by taking together the individual impedances
at different frequencies obtained from Eqs 4 and 6. It can be considered that the
corrosion process taking place in the high frequency region resembles to the
model and equivalent circuit given in Fig. 3. Whereas, the process taking place in
the low frequency region differs from the former and follows a different pathway
Potential
(V) RS
(Ω) R1
(Ω) R2
(Ω) R3
(Ω) CPE1
(F) x 10-7
n1 CPE2
(F) x 10-5
n2 CPE3
(F) n3
ocp 20.70 197.3 175995 - 1.01 0.96 13.75 0.83 - -
0.2 5.71 124.20 61136 - 3.42 0.99 18.30 0.86 - -
0.4 8.14 146.30 66436 - 1.83 0.92 9.86 0.81 - -
0.6 1.38 143.73 165416 - 3.70 0.92 9.45 0.86 - -
0.8 3.62 89.99 3693 - 6.23 0.92 10.90 0.88 - -
1.0 6.02 85.72 4386 9024 0.71 0.96 13.78 0.95 0.043 0.75
1.2 5.30 83.84 3085 8205 0.89 0.94 14.16 0.85 0.025 0.74
N. Mahato & M.M. Singh / Port. Electrochim. Acta 29 (2011) 233-251
247
involving formation of adsorbed intermediates on the surface. The inductance is
interpreted as originated mainly from the adsorption of the intermediates
(possibly Fe (CH3COO)ads). The parameters are displayed in Table 3. In this case,
when the inductive loop is not formed (i.e., 1.0 to 1.2 V), the number of circuit
elements increases to ten. It increases to twelve when inductive loop is there (at
potential 1.4 to 1.6 V). Due to large number of variables in the curve fitting, it
usually takes long hours to run it and the proper fitting becomes cumbersome.
Therefore, this complicated circuit was divided into two simple circuits for the
fitting and simulation purposes.
R1 arises due to the anodic interfacial process, possibly the charge transport
through the surface oxide layer and the rate of which is known to be independent
of the potential in a wide range. As a result, it remains almost constant in these
potential ranges. The composition of the metal phase changes during active
dissolution. This is responsible for a variation in R1 values. The passive film
formed on the surface governs the major part of chemical reactions occurring on
the surface. This controls the dissolution rate, overpotentials, enrichment of
alloying elements on the surface and provokes repassivation. Evidences of
enrichment of the alloying elements on the surface of steels have already been
reported by many workers. The passive films of AISI 316 were found to be
composed of a complex oxide and oxyhydroxide containing Cr3+
, Fe3+
, Ni2+
,
Mo4+
and Mo6+
ions. An increase in the thickness of the passive film with
increase in Mo content has been reported by Olefjord et al. [31]. By the virtue of
the alloying elements, there occurs formation of multi-layered passive film on the
surface. A two-layered film formed in the potential range of ocp to 0.8 V is
reflected in two CPEs in the equivalent circuit. Similarly, a three-layered film
formation in the potential range 1.0 to 1.6 V is reflected in three CPEs in the
equivalent electrical circuit. The impedance study reveals that the corrosion
phenomenon occurring in the stainless steel- ethanoic acid systems is very
complex because of the formation of multiple passive layers on the surface.
Effect of chloride ion addition Impedance measurements were carried out in 20% ethanoic acid containing
different quantities of NaCl at 30 °C after exposure duration of 24 h. Nyquist
plots were depressed semicircles with their center below the axis. Bode plots
show typical double peak features which indicate that the process involved two
CPEs. The parameters calculated using Eq. 5 are recorded in Table 4. From the
data, it is evident that the R1 and R2 values are lower compared to those in Tables
1-3. This indicates that the presence of chloride ions increases the conductivity of
the medium, and invades into the passive film to enhance its defects. The film
now contains more cracks, pores and channels. If defects are present inside the
passive film, the electrolyte will penetrate into the film and attack the surface at
the sites where the film is thin and weak. This leads to a decrease in the electrical
resistance.
N. Mahato & M.M. Singh / Port. Electrochim. Acta 29 (2011) 233-251
248
Table 4. Effect of salt concentration on the impedance measurements of AISI 316 in
20% acetic acid at 30 °C, 0.6 V and 1mV s-1
scan rate.
NaCl
concentration Rs(Ω) R1 (Ω) R3 (Ω)
CPE1(F) x 10
-7 n1
CPE2(F)
x 10-5
n2
0.01M 18.3 61.19 18792 4.1 0.98 29.3 0.95
0.025M 17.9 76.11 7744 3.2 0.98 19.98 0.95
0.05M 10.8 53.38 7102 3.97 0.98 27.33 0.91
0.1M 9.36 47.01 593 4.6 0.98 37.61 0.91
0.2M 6.19 21.3 119 7.3 0.98 30.11 0.97
0.5M 5.77 9.55 76 13.6 0.98 27.16 0.97
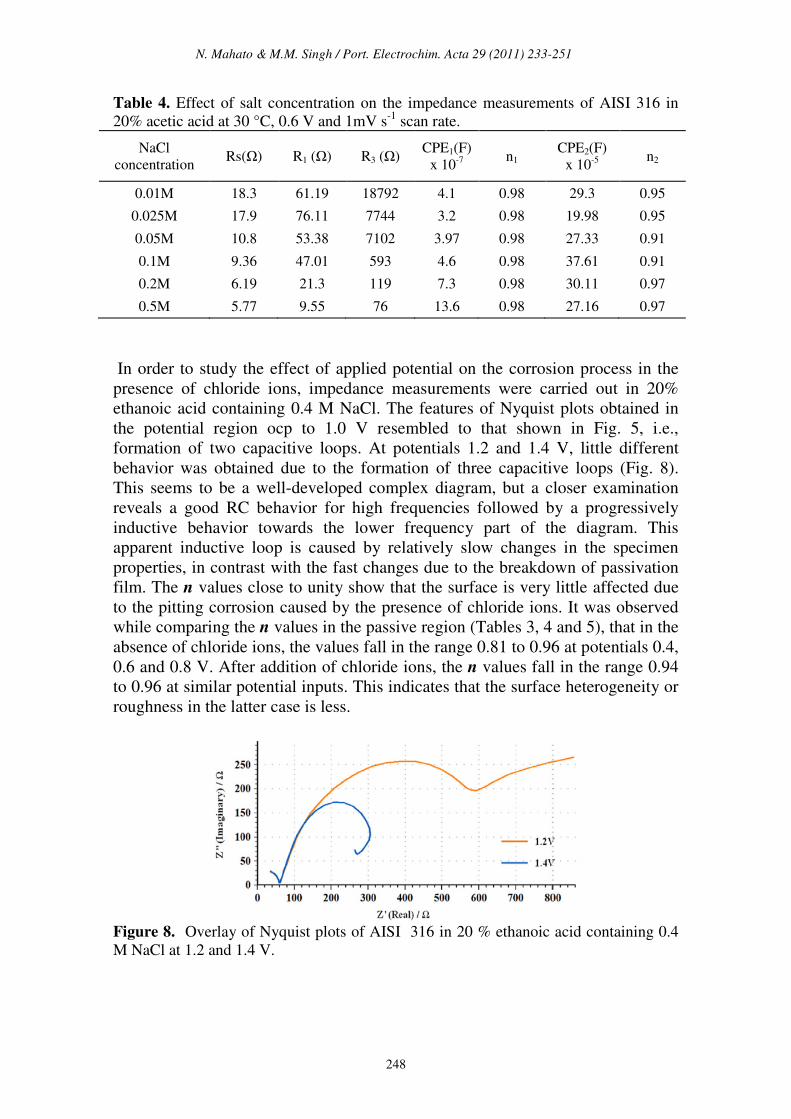
In order to study the effect of applied potential on the corrosion process in the
presence of chloride ions, impedance measurements were carried out in 20%
ethanoic acid containing 0.4 M NaCl. The features of Nyquist plots obtained in
the potential region ocp to 1.0 V resembled to that shown in Fig. 5, i.e.,
formation of two capacitive loops. At potentials 1.2 and 1.4 V, little different
behavior was obtained due to the formation of three capacitive loops (Fig. 8).
This seems to be a well-developed complex diagram, but a closer examination
reveals a good RC behavior for high frequencies followed by a progressively
inductive behavior towards the lower frequency part of the diagram. This
apparent inductive loop is caused by relatively slow changes in the specimen
properties, in contrast with the fast changes due to the breakdown of passivation
film. The n values close to unity show that the surface is very little affected due
to the pitting corrosion caused by the presence of chloride ions. It was observed
while comparing the n values in the passive region (Tables 3, 4 and 5), that in the
absence of chloride ions, the values fall in the range 0.81 to 0.96 at potentials 0.4,
0.6 and 0.8 V. After addition of chloride ions, the n values fall in the range 0.94
to 0.96 at similar potential inputs. This indicates that the surface heterogeneity or
roughness in the latter case is less.
Figure 8. Overlay of Nyquist plots of AISI 316 in 20 % ethanoic acid containing 0.4
M NaCl at 1.2 and 1.4 V.
N. Mahato & M.M. Singh / Port. Electrochim. Acta 29 (2011) 233-251
249
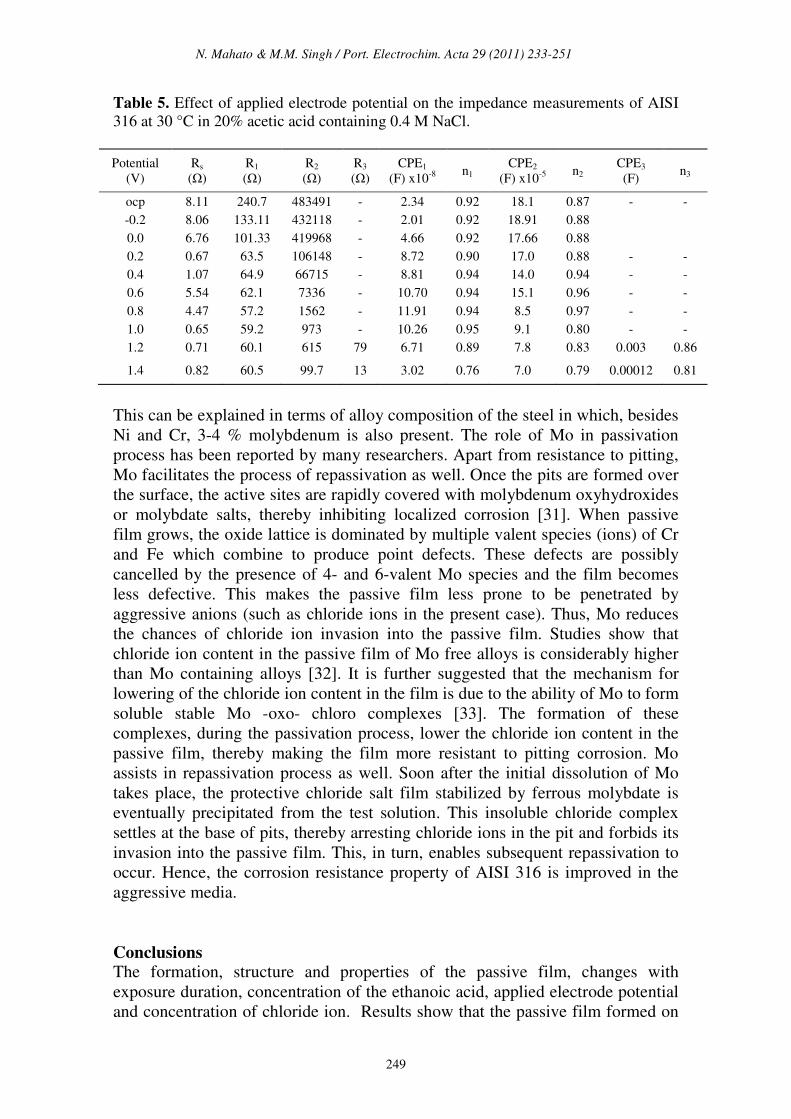
Table 5. Effect of applied electrode potential on the impedance measurements of AISI
316 at 30 °C in 20% acetic acid containing 0.4 M NaCl.
Potential
(V)
Rs
(Ω)
R1
(Ω)
R2
(Ω)
R3
(Ω)
CPE1
(F) x10-8
n1
CPE2
(F) x10-5
n2
CPE3
(F) n3
ocp 8.11 240.7 483491 - 2.34 0.92 18.1 0.87 - -
-0.2 8.06 133.11 432118 - 2.01 0.92 18.91 0.88
0.0 6.76 101.33 419968 - 4.66 0.92 17.66 0.88
0.2 0.67 63.5 106148 - 8.72 0.90 17.0 0.88 - -
0.4 1.07 64.9 66715 - 8.81 0.94 14.0 0.94 - -
0.6 5.54 62.1 7336 - 10.70 0.94 15.1 0.96 - -
0.8 4.47 57.2 1562 - 11.91 0.94 8.5 0.97 - -
1.0 0.65 59.2 973 - 10.26 0.95 9.1 0.80 - -
1.2 0.71 60.1 615 79 6.71 0.89 7.8 0.83 0.003 0.86
1.4 0.82 60.5 99.7 13 3.02 0.76 7.0 0.79 0.00012 0.81
This can be explained in terms of alloy composition of the steel in which, besides
Ni and Cr, 3-4 % molybdenum is also present. The role of Mo in passivation
process has been reported by many researchers. Apart from resistance to pitting,
Mo facilitates the process of repassivation as well. Once the pits are formed over
the surface, the active sites are rapidly covered with molybdenum oxyhydroxides
or molybdate salts, thereby inhibiting localized corrosion [31]. When passive
film grows, the oxide lattice is dominated by multiple valent species (ions) of Cr
and Fe which combine to produce point defects. These defects are possibly
cancelled by the presence of 4- and 6-valent Mo species and the film becomes
less defective. This makes the passive film less prone to be penetrated by
aggressive anions (such as chloride ions in the present case). Thus, Mo reduces
the chances of chloride ion invasion into the passive film. Studies show that
chloride ion content in the passive film of Mo free alloys is considerably higher
than Mo containing alloys [32]. It is further suggested that the mechanism for
lowering of the chloride ion content in the film is due to the ability of Mo to form
soluble stable Mo -oxo- chloro complexes [33]. The formation of these
complexes, during the passivation process, lower the chloride ion content in the
passive film, thereby making the film more resistant to pitting corrosion. Mo
assists in repassivation process as well. Soon after the initial dissolution of Mo
takes place, the protective chloride salt film stabilized by ferrous molybdate is
eventually precipitated from the test solution. This insoluble chloride complex
settles at the base of pits, thereby arresting chloride ions in the pit and forbids its
invasion into the passive film. This, in turn, enables subsequent repassivation to
occur. Hence, the corrosion resistance property of AISI 316 is improved in the
aggressive media.
Conclusions The formation, structure and properties of the passive film, changes with
exposure duration, concentration of the ethanoic acid, applied electrode potential
and concentration of chloride ion. Results show that the passive film formed on

N. Mahato & M.M. Singh / Port. Electrochim. Acta 29 (2011) 233-251
250
AISI 316 surface is multilayered and possesses dual structure. The film is made
up of a thin and compact internal part, and a thicker, porous external part.
Extended immersion hours inside the electrolytic solution (ethanoic acid) leads to
the growth of a defective or porous surface film. The formation, structure and
properties of the passive film are independent of the acid concentration. At
passivating potential ocp to 0.8 V, there is the formation of two capacitive loops,
and at higher potential input (1.0-1.2 V), formation of three capacitive loops
takes place. At higher potentials (1.4-1.6 V), the formation of an inductive loop
takes place owing to adsorbed intermediates. The capacitive behavior is of non
ideal nature and it is explained in terms of constant phase element. The CPE
power or n values show that surface roughness due to corrosion process becomes
less in 20% ethanoic acid containing 0.4 M NaCl than in absence of the latter,
owing to the repassivation role played by molybdenum and enabling the steel to
behave more resistant to pitting corrosion in aggressive medium.
Acknowledgements
Authors are pleased to thank Dr. Manavendra Nath, Department of Theoretical
Physics, Tata Institute of Fundamental Research, Colaba, Mumbai, for fruitful
discussion. Research grant (Senior Research Fellowship) provided by UGC-India
to one of the authors is gratefully acknowledged.
References
1. D.D. Macdonald, “Application of electrochemical impedance spectroscopy
in electrochemistry and corrosion science”, in: R. Varma, J.R. Selman
(Eds.), “Techniques for Characterization of Electrodes and Electrochemical
Processes”, John Wiley & Sons, NY, (1991). pp. 515-647.
2. I. Epelboin, C. Gabrielli, M. Keddam, K. Takenouti, “The study of the
passivation process by the electrode impedance analysis”, in: J.O’M
Bockris, B.E. Conway, E. Yeager, R.R.White (Eds.), “Comprehensive
Treatise of Electrochemistry”, Vol. 4, “Electrochemical Materials Science”,
Plenum Press, NY, (1981). pp. 151-188.
3. C. Gabrielli, “Identification of electrochemical processes by frequency
response analysis”, Technical Report 0004/83, Solartron Instruments
(1984). pp. 53-72.
4. P. Marcus, V. Maurice, “Structure of thin anodic oxide films formed on
single-crystal metal surfaces”, in: A. Wieckowski (Ed.), “Interfacial
Electrochemistry—Theory, Experiment and Application”, Marcel Dekker
Inc., NY, (1999). pp. 541-558.
5. A.M. Nagiub, Port. Electrochim. Acta 23 (2005) 301-314.
6. J.B. Jorcin, M.E. Orazem, N. Pebere, B. Tribollet, Electrochim. Acta 51
(2006) 1473-1479.
7. J. Flis, Y.Tobiyama, K. Mochizuki, C. Chiga, Corros. Sci. 39 (1997) 1757-
1770.
N. Mahato & M.M. Singh / Port. Electrochim. Acta 29 (2011) 233-251
251
8. A. Jimenez-Morales, J.C. Galvan Rodriguez, J.J. De Damborena, J. Appl.
Electrochem. 27 (1997) 550-557.
9. M.A. Ameer, M.A. Fekry, F. El-Taib Heakal, Electrochim. Acta 50 (2004)
43-49.
10. S.S. El-Egamy, W.A. Badaway, H. Shehata, Mat-wiss. u. Werkstofftech. 31
(2001) 737-744.
11. B. Cox, Y.M. Wong, J. Nucl. Mat. 218 (1995) 324-334.
12. M.A. Martini Emilsce, L. Muller Iduvirges, Corros. Sci. 42 (2000) 443-454.
13. I. Epelboin, M. Keddam, H. Takenouti, J. Appl. Electrochem. 2 (1972) 71-
79.
14. D.R. MacFariane and S.I. Smedley, J. Electrochem. Soc. 133 (1986) 2240-
2244.
15. D.C. Silverman, Corrosion NACE 45 (1989) 824-827.
16. W.J. Lorenz, F. Mansfeld, Corros. Sci. 21 (1981) 647-672.
17. M.J. Kendig, J. Electrochem. Soc. 131 (1984) 2777-2779.
18. R.D. Armstrong, M. Henderson, J. Electroanal. Chem. and Interfac.
Electrochem. 39 (1972) 81-90.
19. I. Epelboin, M. Keddam, J. Electrochem. Soc. 117 (1970) 1052-1056.
20. F. Mansfeld, Corrosion, NACE International 36 (1981) 301-307.
21. S.M. Gerchakov, L.R. Odey, F. Mansfeld, Corrosion, NACE International
37 (1981) 696-703.
22. F. Mansfeld, M.W. Kendig, Workstoff und Korrosion 34 (1983) 397-401.
23. M.W. Kendig, E.M. Meyer, G. Lindberg, F. Mansfeld, Corros. Sci. 23
(1983) 1007-1015.
24. N. Mahato, “Corrosion and pitting behavior of austenitic stainless steels in
ethanoic acid containing chloride ions”, Ph.D. thesis in Applied Chemistry,
Banaras Hindu University, Varanasi (2010).
25. R.G. Kelly, J.R. Scully, D.W. Shoesmith, R.G. Buchheit, “Electrochemical
Techniques in Corrosion Science and Engineering”, Marcel Dekker Inc.,
NY (2003).
26. G.W. Walter, Corros. Sci. 26 (1986) 681-703.
27. I. Sekine, A. Masuko, K. Senoo, Corrosion NACE International 43 (1987)
553-560.
28. J. Pan, C. Leygraf, R.F.A. Jargelius-Pettersson, Linden, Oxidation of
Metals 50 (1998) 431-455.
29. A. Baltat-Bazia, N. Celati, M. Keddam, H. Takenouti, R. Wiart, Mat. Sci.
Forum 111 (1992) 359-368.
30. N. Celati, S Catherine, M. Keddam, H. Takenouti, Mat. Sci. Forum 192
(1995) 335-344.
31. I. Olefjord, B. Brox, U. Jelvestam, J. Electrochem. Soc. 132 (1985) 2854-
2861.
32. L. Wegrelius, F. Falkenberg, I. Olefjord, J. Electrochem. Soc. 146 (1999)
1397-1406.
33. J.R. Ambrose, “Passivity of Metals”, (R. P. Frankenthal and J. Kruger,
eds.), Electrochem. Soc., Pennington NJ (1978). p. 740.
![Inhibition Mechanism of Pitting Corrosion of Nickel in Aqueous … · 2013-12-24 · many organic reactions is well recognized [1]. Although nickel is known as corrosion resistant](https://img.pdfslide.net/doc/110x75/5f5258f70cc56b0391142fd4/inhibition-mechanism-of-pitting-corrosion-of-nickel-in-aqueous-2013-12-24-many.jpg)