Embed Size (px)
Citation preview
University of Calgary
PRISM: University of Calgary's Digital Repository
Graduate Studies The Vault: Electronic Theses and Dissertations
2016
Investigation of Polymeric Composites with High
Aspect Ratio Nanoparticulates for Coatings
TabkhPaz Sarabi, Majid
TabkhPaz Sarabi, M. (2016). Investigation of Polymeric Composites with High Aspect Ratio
Nanoparticulates for Coatings (Unpublished doctoral thesis). University of Calgary, Calgary, AB.
doi:10.11575/PRISM/26658
http://hdl.handle.net/11023/3111
doctoral thesis
University of Calgary graduate students retain copyright ownership and moral rights for their
thesis. You may use this material in any way that is permitted by the Copyright Act or through
licensing that has been assigned to the document. For uses that are not allowable under
copyright legislation or licensing, you are required to seek permission.
Downloaded from PRISM: https://prism.ucalgary.ca
UNIVERSITY OF CALGARY
Investigation of Polymeric Composites with High Aspect Ratio Nanoparticulates for Coatings
by
Majid TabkhPaz Sarabi
A THESIS
SUBMITTED TO THE FACULTY OF GRADUATE STUDIES
IN PARTIAL FULFILMENT OF THE REQUIREMENTS FOR THE
DEGREE OF DOCTOR OF PHILOSOPHY
GRADUATE PROGRAM IN MECHANICAL AND MANUFACTURING ENGINEERING
CALGARY, ALBERTA
JUNE 2016
© Majid TabkhPaz Sarabi 2016
ii
ABSTRACT
To overcome some of the challenges associated with existing pipeline coatings, the use of
polymeric nanocomposites as coating materials are proposed in this research. By employing
novel inclusions such as hexagonal boron nitride (hBN) nanoplatelets, carbon nanotubes (CNTs),
graphene nanoplatelets (GNPs), and zinc particulates within a conventional polymer coating,
high-performance polymeric nanocomposites can be created for the purposes of pipeline
protection. The excellent performances of the proposed polymer-based composites are due to
unique mechanical, electrical, thermal, and anti-corrosive properties of the additives. The
addition of 2D nanoplatelets such as hBN and GNP to the pure polymers may result in the
fabrication of nanocomposites with lower coefficient of thermal expansion (CTE), high gas
barrier, high mechanical stability, and anti-corrosive performances. Application of CNTs and
zinc particles as hybrid compositions can also improve corrosion protection of the composite
coatings due to the synergistic effects of zinc particles as sacrificial material and CNTs as
connectors of an electrically conductive network.
This research is aimed at investigating the feasibility of using these nanocomposites as
coating materials. Initially, the effects of dispersion and geometry of CNTs on the final
properties of nanocomposites were examined. Then, two random walk models were developed to
study the effects of the addition of inclusions on the electrical and thermal conductivities of
nanocomposites. Finally, the selected nanoparticulates were added to polymers, and the coating
capabilities of composites were evaluated. From the tests and investigations conducted on the
developed composite coatings, it was observed that thermal expansion, gas barrier, mechanical
strength, adhesion, and corrosion protection performances were improved compared to the pure
polymeric coatings. The corroded area on the cathodic disbondment test specimens reduced

iii
down up to 90% for the composite with zinc (20 wt.%), MWCNTs (2 wt.%), and GNPs (2
wt.%), compared to a specimen coated with a pure polymer. It is seen that the presence of
nanoparticulates decreased gas penetration and thermal expansion of the matrix by 75% and
65%, respectively.
iv
ACKNOWLEDGEMENT
I am heartily grateful to my Ph.D. supervisor, Dr. Simon Park, for his academic guidance,
encouragement, and support. I also would like to thank my co-supervisor, Dr. Dong-Yeob Park,
from CanmetMATERIALS, Natural Resources Canada for his scientific guidance and support.
My parents deserve special mention for the encouragement and support they provided during my
stay in Calgary. I also would like to offer my gratitude to the supervisory committee members,
Prof. Uttandaraman Sundararaj and Prof. Simon Li who kindly agreed to review this Ph.D.
thesis.
I am very thankful to my colleagues, Dr. Mehdi Mahmoodi, Ms. Shaghayegh Shajari, and
Dr. Mohammad Arjmand for helping me with the experiments. I would also like to acknowledge
my colleagues, Mr. Chaneel Park, Mr. Pratyaksh Agarwal, Mr. Mehdi Sanati, Dr. Kaushik
Parmar, Mr. Allen Sandwell, Mr. Curtis Ewanchuk, Mr. Robin Chung, Ms. Hamsini Suresh, and
Dr. Majid Mehrpouya in the Micro Engineering, Dynamics and Automation Laboratory
(MEDAL). I am also very grateful to the technicians at the Schulich School of Engineering who
helped me with the experiments.
This research was funded by the Alberta Innovates Technology Futures (AITF)
Nanotechnology Scholarship and Natural Sciences and Engineering Research Council of Canada
(NSERC).

v
DEDICATION
To my beloved parents
vi
TABLE OF CONTENTS
Abstract ....................................................................................................................................... ii
Acknowledgement ..................................................................................................................... iv
Dedication ................................................................................................................................... v
Table of Contents ....................................................................................................................... vi
List of Tables .............................................................................................................................. x
List of Figures ............................................................................................................................ xi
List of Symbols ........................................................................................................................ xvi
CHAPTER 1. INTRODUCTION ............................................................................................. 1
1.1 Overview ............................................................................................................................... 1
1.2 Motivations ........................................................................................................................... 4
1.3 Objectives ............................................................................................................................. 6
1.4 Organization .......................................................................................................................... 9
CHAPTER 2. LITERATURE SURVEYS ............................................................................. 11
2.1 Introduction ......................................................................................................................... 11
2.2 Pipeline Coating .................................................................................................................. 12
2.2.1 Composite Coatings ..................................................................................................... 17
2.3 Nanomaterials and Nanocomposites ................................................................................... 20
2.4 Gas Permeability Modeling of Nanocomposites ................................................................ 27
2.5 Thermal Expansion Modeling of Nanocomposites............................................................. 30
2.6 Mixing Techniques ............................................................................................................. 33
vii
2.7 Nanocomposite Fabrication Techniques ............................................................................. 36
2.8 Summary ............................................................................................................................. 40
CHAPTER 3. EFFECTS OF MIXING ON PROPERTIES OF NANOCOMPOSITES ........ 41
3.1 Introduction ......................................................................................................................... 41
3.2 Experiments ........................................................................................................................ 44
3.2.1 Materials and Equipment ............................................................................................. 44
3.2.2 Chaotic Mixing Design ................................................................................................ 46
3.3 Design of Experiments ........................................................................................................ 49
3.3.1 Optimal Mixing Conditions ......................................................................................... 50
3.3.2 Influence of Processing Parameters ............................................................................. 53
3.3.3 Optical Observations .................................................................................................... 55
3.3.4 MWCNT Length Distribution...................................................................................... 58
3.4 Chaotic Mixer Comparative Results ................................................................................... 60
3.4.1 Electrical Resistivity .................................................................................................... 60
3.4.2 EMI Shielding .............................................................................................................. 63
3.5 Summary ............................................................................................................................. 66
CHAPTER 4. MODELING OF ELECTRICAL AND THERMAL BEHAVIOURS OF
NANOCOMPOSITES .................................................................................................................. 68
4.1 Introduction ......................................................................................................................... 68
4.2 Electrical Resistivity Modeling........................................................................................... 70
4.2.1 Introduction to Electrical Conductivity Modeling ....................................................... 70
viii
4.2.2 Electrical Conductivity Model Description ................................................................. 71
4.3 Thermal Conductivity Modeling......................................................................................... 82
4.3.1 Introduction to Thermal Conductivity Modeling ......................................................... 82
4.3.2 Description of the Thermal Conductivity Model ......................................................... 84
4.3.3 Effective Medium Approach (EMA) ........................................................................... 90
4.3.4 Experiments for Thermal Conductivity Modeling Validation ..................................... 95
4.3.5 Thermal Conductivity Model Comparison of CNT / PS Composites ....................... 101
4.3.6 Modeling of Thermal Conductivity of hBN / CNT / PS composites ......................... 107
4.6 Summary ........................................................................................................................... 110
CHAPTER 5. COATING PERFORMANCE OF NANOCOMPOSITES ........................... 112
5.1 Introduction ....................................................................................................................... 112
5.2 Experiments ...................................................................................................................... 113
5.2.1 Materials .................................................................................................................... 114
5.2.2 Test Methods and Equipment .................................................................................... 117
5.3 Results and Discussion ..................................................................................................... 127
5.3.1 Characterizations........................................................................................................ 128
5.3.2 Adhesion .................................................................................................................... 131
5.3.3 Gas Permeability ........................................................................................................ 134
5.3.4 Coefficient of Thermal Expansion (CTE).................................................................. 137
5.3.5 Cathodic Disbondment............................................................................................... 139
5.3.6 Scratch and Surface Hardness .................................................................................... 141
5.4 Summary ........................................................................................................................... 145
ix
CHAPTER 6. CONCLUSION AND FUTURE WORK ...................................................... 147
6.1 Conclusions and Novel Scientific Contributions .............................................................. 147
6.1.1 Effects of Mixing on Properties of Nanocomposites ................................................. 149
6.1.2 Development of Electrical and Thermal Conductivity Models for Nanocomposites 151
6.1.3 Feasibility of using Nanocomposites as Coating ....................................................... 153
6.2 Assumptions and Limitations ........................................................................................... 155
6.3 Future Work ...................................................................................................................... 157
References ............................................................................................................................... 159
Appendix ................................................................................................................................. 177
x
LIST OF TABLES
Table 3.1 Rotors Speeds in the Chaotic Mixing System .............................................................. 49
Table 3.2 Experimental Design Showing the Two-Level, Four-Factor Factorial Design ............ 50
Table 3.3 Levels (Set Points) of the Experiments......................................................................... 51
Table 4.1 The Simulation Parameters for Modeling ..................................................................... 88
Table 4.2RVE,CNTs,hBNs,andMatrix’sPropertiesusedinSimulation ................................. 88
Table 4.3 Parameters used in EMA .............................................................................................. 92
Table 4.4 Injection Moulding Processing Conditions................................................................... 96
Table 4.5 Summary of the Validation Experiments...................................................................... 97
Table 5.1 Representation of Details of the Components ............................................................ 116
Table 5.2 Description of Samples Illustrated in Figure 5.15 ...................................................... 140
xi
LIST OF FIGURES
Figure 2.1 Three-Layer Coating Protection with FBE and PE / PP [Guidetti et al. 1996] ........... 13
Figure 2.2 Three-Layer Coating Process with Epoxy, Adhesion Layer and PE / PP [Coeuille
2002] ............................................................................................................................................. 14
Figure 2.3 Coating Failure Types [Vencl et al. 2011] .................................................................. 16
Figure 2.4 Schematic Representation of the Path for Transport of Gases through Nanocomposites
with High Aspect Ratio Nanoparticulates [Simon et al. 2008] ..................................................... 19
Figure 2.5 Schematic Showing How a Graphene Sheet is Rolled to Create CNTs with Armchair
and Zig-zag Chiralities [Thostenson et al. 2001] .......................................................................... 21
Figure 2.6 Transmission Electron Microscopy Pictures of CNTs within a Polymeric Matrix (a)
without Agglomeration and (b) with Agglomeration ................................................................... 23
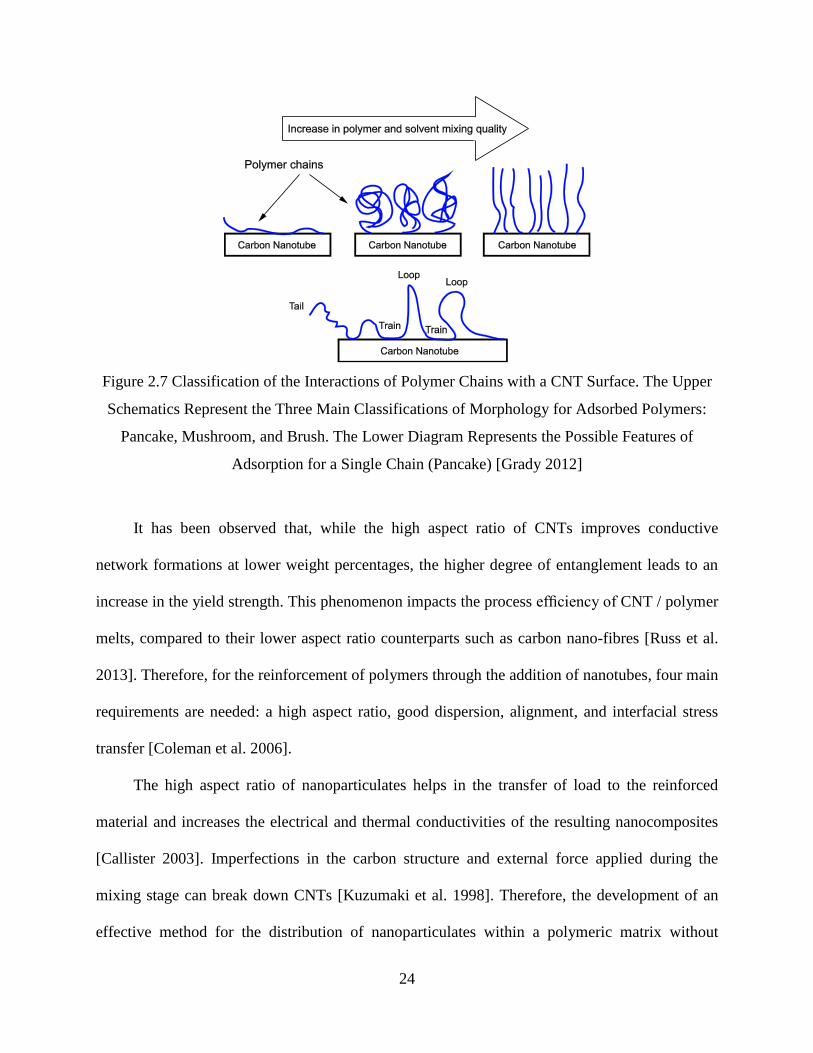
Figure 2.7 Classification of the Interactions of Polymer Chains with a CNT Surface. The Upper
Schematics Represent the Three Main Classifications of Morphology for Adsorbed Polymers:
Pancake, Mushroom, and Brush. The Lower Diagram Represents the Possible Features of
Adsorption for a Single Chain (Pancake) [Grady 2012] ............................................................... 24
Figure 2.8 Hexagonal Boron Nitride [Kopeliovich 2012] ............................................................ 26
Figure 2.9 Schematic of Gas Permeation in Different Composite Structures .............................. 28
Figure 2.10 Filler-Matrix Interaction ............................................................................................ 31
Figure 2.11 Mixing and Fabrication of Nanocomposite Specimens through Solution Mixing
Followed by Compression Moulding [Suhr et al. 2006]............................................................... 34
Figure 2.12 In Situ Synthesis of Nanocomposites ........................................................................ 35
Figure 2.13 Twin-Screw Mixer for Mixing with Roller Blade Shape Screws (Common Melt
Mixing) [CAPE 2010]................................................................................................................... 36
xii
Figure 2.14 Diagram of an Extrusion Process in Pipeline Coating [Vlachopoulos and Strutt 2003]
....................................................................................................................................................... 38
Figure 2.15 Stages of Spray Coating of a Pipe using Epoxy [PRD Inc. 2011] ............................ 40
Figure 3.1 Rotors used in (a) Chaotic Mixing and (b) Conventional Mixing............................... 45
Figure 3.2 (a) Schematics of the Mixing System, and (b) Fabricated Mixing Chamber and Rotors
....................................................................................................................................................... 47
Figure 3.3 Schematic Diagram of the Controlling Section ........................................................... 48
Figure 3.4 Volume Resistivity (with Standard Deviations) of Specimens Mixed in 16 Mixing
Conditions Based on Table 3.2 (0.3 vol.% MWCNTs) ................................................................ 51
Figure 3.5 EMI SE of Nanocomposites Mixed in 16 Mixing Conditions with the Chaotic Mixer
(0.3 vol.% MWCNTs and Sample Thickness of 1.8 mm) ............................................................ 52
Figure 3.6 Main Effects Plot of Volume Resistivity of the Chaotic-Mixed Nanocomposites ..... 54
Figure 3.7 Interaction Plots for Resistivity of the Chaotic-Mixed Nanocomposites .................... 55
Figure 3.8 Optical Micrographs of Thin Layers of Mixed 0.5 wt.% MWCNT / PS via HAAKE
Mixer (a, b, and c), Non-Optimized Chaotic Mixer with Exp. #12 (d, e, and f), and Optimized
Chaotic Mixer with Exp. #5 (g, h, and i) ...................................................................................... 56
Figure 3.9 TEM Pictures of 1 wt.% MWCNT / PS Mixed via HAAKE Mixer (a and b) and
Chaotic Mixer with Exp. #5 (c and d) ........................................................................................... 57
Figure 3.10 TEM of some MWCNTs Mixed via (a) Chaotic Mixer (Exp. #5 ) and (b) HAAKE
Mixer, (c) Measured Length for MWCNTs, and (d) Length Distribution of Pure MWCNTs
(Before Mixing), After Chaotic Mixing and Commercial HAAKE Mixer (Some Polymer are
Remained around MWCNTs) ....................................................................................................... 59
Figure 3.11 Percolation Curves for the Samples Mixed via Two Techniques ............................. 62
xiii
Figure 3.12 EMI Shielding Effectiveness of Specimens with 0.3 mm Thickness ........................ 64
Figure 3.13 (a) Real Part of Permittivity, (b) Imaginary Part of Permittivity of Nanocomposites
Mixed via Chaotic Mixer and Commercial HAAKE Mixer ......................................................... 65
Figure 4.1 Schematic of using the Random Walk Model for Measuring the Resistivity of CNT
Networks ....................................................................................................................................... 72
Figure 4.2 An Example for Histogram of 1340 Randomly Generated CNTs .............................. 74
Figure 4.3 Random Selection of the Start Point, Length and Angle of CNTs .............................. 74
Figure 4.4 RVE with CNTs, (a) Distributed CNTs, (b) Cut CNTs Passing the Boundaries (Shown
with Arrows), and (c) Eliminated CNTs without Connections (Bolded) ..................................... 75
Figure 4.5 Simple Circuit Representing a CNT Network ............................................................. 77
Figure 4.6 Circuit after Measuring Currents ................................................................................. 79
Figure 4.7 Illustration of the 8 Stages of Modeling with the Random Walk Method .................. 80
Figure 4.8 Effects of Different CNTs Average Lengths on Electrical Resistivity of
Nanocomposites using 3D Random Walk (RW) Model, Compared to Bao et al. (5 µm CNT
length) [2011] and Hu et al. (5 µm CNT length) [2008] .............................................................. 81
Figure 4.9 Schematics of Randomly Oriented (a) CNTs, (b) hBN, and (c) Hybrid Fillers within
RVE............................................................................................................................................... 85
Figure 4.10 (a) Modeling Stages and Schematic Illustration of (b) Randomly Distributed CNTs
and hBNs within the RVE and (c) Final Distribution of Walkers in the RVE ............................. 90
Figure 4.11 Alignment Characterization: TEM Images of (a) Semi-Aligned Injection Moulded
Composite (Injection Direction is Indicated with Large Arrows and Partially Aligned CNTs with
Small Arrows) and (b) Randomly-Dispersed CNTs in Compression Moulded Composite, (c)
Azimuthal Angles of CNTs Relative to the Flow Direction (Small Arrows Represent CNTs
xiv
Direction, and Straight Lines and the Large Arrow Indicate Direction of Injection), and (d)
Mean-Square Cosine Values of Semi-Aligned and Randomly Dispersed CNT Composites as a
Function of the CNT Loadings ..................................................................................................... 99
Figure 4.12 (a) Thermal Conductivity Measurement Device, (b) Thermal Impedance vs.
Thickness of Specimens .............................................................................................................. 101
Figure 4.13 Thermal Conductivity of Semi-aligned CNT Nanocomposite Specimens Obtained
from Experiments and Modeling (100 iterations) ....................................................................... 103
Figure 4.14 Thermal Conductivity of Randomly-dispersed CNT Nanocomposite Specimens
Obtained from Experiments and Modeling (100 iterations) ....................................................... 104
Figure 4.15 Schematic View of Two CNT Alignment Directions: (a) Parallel and (b) Transverse
to the Travel Direction of Walkers and (c) Comparison of Thermal Conductivities Computed for
Both Directions ........................................................................................................................... 107
Figure 4.16 Comparison of the Thermal Conductivity Results Obtained from EMA, Random
Walk Model, and Experiments ................................................................................................... 109
Figure 5.1 SEM Photos of (a) Zinc Particles, (b) CNTs, (c) hBNs, and (d) GNPs before Mixing
with Polymers ............................................................................................................................. 115
Figure 5.2 Design of the Hybrid Composite Coating ................................................................. 117
Figure 5.3 Adhesive Tester Device (a) Schematic and (b) Actual Illustration ........................... 120
Figure 5.4 Gas Permeability Device (a) Schematic and (b) Actual Representations (Samples are
also Shown) ................................................................................................................................. 121
Figure 5.5 Test Setup for Measuring Linear Thermal Expansion of Composites ...................... 123
Figure 5.6 Cathodic Disbondment Test Cell............................................................................... 125
xv
Figure 5.7 (a) CNC Machine used for Scratch Test (b) Schematic of Length and Depth of Scratch
Testing......................................................................................................................................... 126
Figure 5.8 Viscosity of Epoxy and Acrylic versus Shear Rate ................................................... 128
Figure 5.9 SEM of the Coating Layers (a) CNT and Zinc, (b) CNT and GNP, (c) hBN in the
Second Layer, (d) CNT, GNP and Zinc, and (e) EDS Spectrum of the Zinc Particle in (d) ...... 129
Figure 5.10 (a) Volume Electrical Resistivity of the First and the Second Layer of Coating and
(b) Thermal Conductivity of hBN Composites Compared with Random Walk (RW) Modeling
Results ......................................................................................................................................... 130
Figure 5.11 Pull-off Results for Different Specimens ................................................................ 132
Figure 5.12 (a), (b) Dolly under SEM, and (c) Crack Initiation and Propagation Points ........... 134
Figure 5.13 Permeability Measurement of Different Coatings Compared with Theoretical
Modeling ..................................................................................................................................... 136
Figure 5.14 CTE Values Measured using DMA and Compared with Model (a) Acrylic
Composites and (b) Epoxy Composites (Reference Point with 1 wt.% of Graphene Flakes) .... 138
Figure 5.15 Cathodic Disbondment on Coated Steel Plates ....................................................... 139
Figure 5.16 Scratch Test (a) Finding Lc from Observation (b) Repeatability of the Force
Measurement for a Specimen ...................................................................................................... 142
Figure 5.17 Scratch Resistance Test Results for Different Compositions .................................. 143
Figure 5.18 Hardness of Coatings with Different Compositions ................................................ 144

xvi
LIST OF SYMBOLS
A Strain concentration tensor
As Area of sample
a1 Radius of the carbon nanotubes in modeling
B Stress concentration tensor
C Polymeric matrix specific heat
Cf Stiffness tensor of filler
Ch Chiral vector of carbon nanotubes
Cm Stiffness tensor of matrix
Csm Velocity of sound in the polymeric matrix
cf Concentration of filler
cm Concentration of matrix
D Diameter of inclusions
Dm Polymeric matrix thermal diffusivity
d Shortest distance for permeation
d'
Actual distance for permeation
Ef
Elastic modulus of filler
EII Elastic modulus of composite in parallel direction
Em
Elastic modulus of matrix
e Electron charge
f Volume fraction of fillers
fe Excitation frequency
fi-j Probability of moving a walker from i to j
G Conductance matrix in random walk model
h Planck’sconstant
I Electrical current
It Identity tensor
Itotal Total current in representative volume element in random walk model
K Thermal conductivity of composite
xvii
Km Thermal conductivity of the polymeric matrix
L0 Distance between two clamps of dynamic mechanical analysis
L1 Initial length of coefficient of thermal expansion test sample
L2 Final length of coefficient of thermal expansion test sample
Lc Critical tangential force
LCNT Length of carbon nanotubes
Lf Length of inclusions
Lii Geometrical factor
LM Mean length of carbon nanotubes
M Number of conduction channels for carbon nanotubes
N Number of carbon nanotubes in random walk modeling
NS Number of inclusions in the layer stack
P Eshelby’stensor
Pc Permeability of composite
Pij Probability of choosing node j when a particle is on node i in random
walk model
Pm Permeability of matrix
Q Heat flow
Qg Volumetric flow rate of the gas
Rc Volume resistivity
Rbd Thermal boundary resistance of carbon nanotubes
Rbdm Thermal boundary resistance of hexagonal boron nitrides
RCNT Resistance of carbon nanotubes
Req Equivalent resistivity of representative volume element in random walk
model
Rtun Electrical tunneling resistance of carbon nanotubes
rand Random number between -1 and 1
S Compliance tensor
s Order parameter
TC Temperature of cold meter bar in thermal conductivity measurement
device
xviii
Tg Glass transition temperature
TH Temperature of hot meter bar in thermal conductivity measurement
device
Ti Time
t Thickness of inclusions
U Rotational speed
Vc Percolation threshold
Vtotal Total voltage applied to representative volume element in random walk
model
vc Volume of carbon nanotube and hexagonal boron nitride
Zthermal Thermal impedance
α1,2 Unit vector for carbonnanotube’s chiral vector
αf
Thermal expansion coefficient of filler
αII Thermal expansion coefficient of composite in parallel direction
αm Thermal expansion coefficient of matrix
Ω Rotor’sspeed
σCNT Electrical conductivity of carbon nanotubes
σIIf Stress applied on filler in parallel direction
σIIm
Stress applied on matrix in parallel direction
σs Standard deviation of the distribution in thermal conductivity random
walk model
ΔP Pressure drop
ΔL Linear expansion of coefficient of thermal expansion test sample
ΔT Temperature change
εII Total expansion in parallel direction
δ Thickness of the gas permeability specimen
η Dynamic viscosity of gas
Φ Angle between the penetrant direction and the normal direction of
inclusion
ϕ Phase lag
φm Polymeric matrix density
xix
θ Azimuthal angle of carbon nanotubes
<Cos2θ> Mean square cosine
ρ(θ) Statistical distribution of azimuthal angle of carbon nanotubes
ρf Volume resistivity of filler
ψv Viscous permeability coefficient
τ Tortuosity factor
τp Transmission probability of an electron to tunnel between carbon
nanotubes
ζ Critical exponent
1
CHAPTER 1. INTRODUCTION
1.1 OVERVIEW
It is estimated that there are 2.5 million kilometres of pipelines globally [Kennedy 1993,
Thompson and Saithala 2013]. Carbon steel based pipes are commonly used in the industry, for
their durability, safety, strength, and cost-effectiveness. These pipes are typically buried
underground and thus susceptible to corrosion. Nonetheless, this growing transportation method
suffers from issues that result in corrosion, leakage, and catastrophic damage of the pipelines
[Banach 2004]. There is demand for the development of coatings with superior properties and
performances to ensure long-term pipeline integrity. The ideal coating system should have high
adhesion to the pipe, high mechanical strength, low thermal expansion mismatch with the pipe
material, and high gas penetration resistance [Rahman et al. 2012].
One of the techniques for coating pipelines is the use of three-layer coats, which include a
first layer of fusion bonded epoxy (FBE) (good bonding to metals), a second layer of chemically
modified polyethylene or polypropylene (adhesive between the primer and the top layer), and a
final layer of polyethylene or polypropylene [Guidetti et al. 1996, Moosavi et al. 2006, Cole et
al. 2012, Thompson and Saithala 2013]. There is also another coating system, which includes
dual layer epoxy, first layer as the anti-corrosive coat, and second layer as the abrasion-resistant
overcoat. These methods are multistage processes that involve surface preparation, heating,
application, curing, and water quench [Thompson and Saithala 2013].
Some of the problems associated with the current coatings are heat blistering, mechanical
damage, and corrosion at areas of coating damage [Dennis et al. 2013]. As the main pipeline
coating material, polymeric coatings for metals have poor adhesion strength due to the lack of
2
molecular compatibility (between polymer chains and steel molecules), which can result in
catastrophic debonding upon exposure to a corrosive environment [Bellucci et al. 1992, Roy et
al. 2002, Schilling et al. 2002, Wielant et al. 2008]. High adhesion between the coating and the
pipe and high mechanical properties of the coatings can prevent detachment of the coating from
the substrate.
The utilization of coating materials with high mechanical strength can also minimize crack
generation and propagation within the coating. Cracking in a pipeline coating facilitates the
penetration of destructive elements to the substrate surface [Huttunen-Saarivirta et al. 2013].
Epoxy is widely used in the pipeline coating industry. However, there are some drawbacks for
epoxy coatings such as their brittleness, low resistance to crack generation and propagation, and
low impact strength [Fellahi et al. 2001]. The mechanical properties of thermosets can be
improved by addition of fillers such as electronegative aluminum, zinc powders, glass flakes,
phosphates, and oxides [Moloney et al. 1983, Spanoudakis et al. 1984, Srivastava et al. 1990,
Amdouni et al. 1992, Mardel et al. 2011, Huttunen-Saarivirta et al. 2013].
In addition to high mechanical properties, coating materials with low linear coefficients of
thermal expansion (CTE) are desirable, as they have lower CTE mismatch with the steel pipes
during temperature fluctuation [Rout et al. 2011]. CTE (linear) values for polymer coating
materials and steel are rather different. For instance, the CTEs of epoxy and carbon steel pipes
are 73×10-6
and 14×10-6
°C-1
, respectively [Tsukada et al. 1992, Yasmin et al. 2006]. When
operational temperatures fluctuate, a high CTE mismatch between coating and substrate may
lead to the development of stresses at the coating-metal interfaces. These stresses may cause
delamination and the growth of cracks within the coating material, which exposes the steel
substrate to corrosive environments [Olga et al. 2004, van den Bosch et al. 2008]. It has been
3
recently reported that by utilizing some novel nanoparticulates such as nano-clays within the
polymeric coatings, the CTE of polymers such as epoxy can be reduced up to 40%. The decrease
in the CTE, which is attributed to the high mixing quality and rigidity of high aspect ratio (width
to thickness) nanoparticulates in the matrix, can inhibit the expansion of polymer chains as the
temperature rises [Yasmin et al. 2004, Yasmin et al. 2006].
Another critical parameter of pipeline coating is gas and moisture permeation resistance.
Coating materials with high gas and moisture permeation resistance can provide the steel
substrate with a barrier against destructive elements and hinder the formation of an
electrochemical environment inducing corrosion [Yeh et al. 2006, Dong et al. 2008]. Several
attempts have been done on minimizing gas and liquid permeability of polymers through
different approaches. One of the methods is the deposit of metal or ceramic oxide layers on the
polymers. However, roughness and defects of the polymers limit their barrier performances in
this approach [Burrows et al. 2001].
The barrier performance of polymers can be increased by the incorporation of a second
phase miscible with the polymer, by decreasing the porosity and zig-zagging the diffusion path
for deleterious species [Shi et al. 2009]. The geometrical aspect ratio of inclusions has
remarkable effects on the barrier performance of the composites. Chang et al. compared barrier
performance and corrosion resistance of composites filled with graphene nanoplatelets (GNP)
and clays. They showed that the composites loaded with 0.1-0.5 wt.% GNPs have lower gas
permeations compared to clay composites due to the greater aspect ratio of GNPs [Chang et al.
2012].
All the properties mentioned above can enhance the corrosion protection of pipeline
coatings through increased adhesion and mechanical strength, prevention of corrosive elements
4
reaching the steel surface, and lowering of the thermal stresses between coating and steel
substrate. However, the corrosion resistance of the coating material itself can be improved by the
addition of anti-corrosion particulates, such as particles with sacrificial behaviour. Moreover, the
effectiveness of the corrosion resistant composite coatings can be increased through the addition
of inclusions with high electrical conductivities. Nanoparticulates with high electrical
conductivity values and very long aspect ratios can be employed as the electrical connectors for
the sacrificial particles within the coating layers.
In addition to the high aspect ratio geometry of fillers used in the polymers, another main
factor enhancing the performance of the composites is the mixing and dispersion level. In
general, to fabricate polymer composites with superior performances, inclusions with exceptional
geometries should be distributed within the polymer matrix through an efficient mixing method,
whichdoesnothavedestructiveeffectsonfillers’structure.Inthisregard,the interaction among
inclusions and the mixing quality of the composite coating are the key factors affecting coating
performances of composite materials [TabkhPaz et al. 2015].
1.2 MOTIVATIONS
The use of nanomaterials, such as multi-walled carbon nanotubes (MWCNTs), hexagonal
boron nitride (hBN), graphene nanoplatelets (GNPs) and sacrificial particulates, as fillers may
improve the mechanical and protective properties of coatings; however, the subject has not been
studied sufficiently. Nanoparticulates such as GNPs and MWCNTs with high mechanical, gas
barrier, and corrosion resistance performances can improve the properties of coatings if they are
used as inclusions [Praveen et al. 2007, Park and Chon 2015, Popov 2004, Terrones 2012, Yin et
al. 2011, Rahman and Ismail 2012]. Hexagonal boron nitride is another coating filler that has a
5
hydrophobic nature, high aspect ratio geometry, high thermal stability, strong mechanical
properties, high electrical resistivity, and remarkable corrosion resistance [Kho et al. 2000,
Haubner et al. 2002, Watanabe et al. 2009, Shi et al. 2010, Çamurlu et al. 2016].
GNPs and hBNs have two-dimensional (2D) nanoplatelet structures and can enhance the
gas barrier performance of polymeric coatings [Shi et al. 2009]. These fillers can also contribute
to decreasing the CTE by inhibiting the expansion of polymer chains as the temperature rises,
due to their high aspect ratio and mechanical rigidity [Li and Hsu 2010].
Zinc is also categorized as one of the major anti-corrosion fillers for composite coatings.
Coatings with zinc particles find a broad range of applications for the protection of steel in harsh
environments [Faidi et al. 1993, Naderi and Attar 2010]. The corrosion protection of zinc-filled
coatings comes from the galvanic protection of zinc particles [Pereira et al. 1990, Knudsen et al.
2005, Gergely et al. 2013, Jagtap et al. 2007]. Therefore, zinc-filled composites have a unique
capability to protect metals, even after slight mechanical damage to a coating [Marchebois et al.
2002].
To achieve high levels of corrosion protection from zinc-rich coatings, a large
concentration should be added to the matrix (up to 65-95 wt.%). These high contents of zinc are
necessary for the creation of a conductive network of zinc particles within the matrix. However,
high loadings of metallic fillers may lead to coating materials with poor mechanical properties,
high viscosity, difficulties in spraying, and poor surface leveling [Knudsen et al. 2005, Park and
Shon 2015]. Interestingly, the fabrication of hybrid compositions of MWCNTs and zinc can
reduce the required amount of zinc down to 10-30 wt.% and still provide the same level of
galvanic protection in zinc-rich primers [Drozdz et al. 2011, Park and Shon 2015].
6
In this study, initially, the effects of the addition and dispersion of the nanoparticulates on
the final properties of the composites are investigated through the developed models and
experiments. Then, a combination of the nanoparticulates in two-layer coating systems is
studied. It is assumed that the proposed coating system can meet the requirements of a high
performance protection system. It is also expected that the compositions of GNPs, MWCNTs,
hBN, and zinc particles within the coating layers, can result in coatings with higher levels of
protection compared to the materials without additives. For the first layer, contacting the steel
substrate, low thermal expansion, low gas penetration, higher mechanical properties, and anti-
corrosion properties are anticipated. For the second layer, hBN is added to create an external
layer with high gas barrier performance, low CTE, high mechanical strength, and electrically
insulation properties.
1.3 OBJECTIVES
The main objective of this study is to enhance coating performances of conventional
coating materials through using nanoparticulates as inclusions. Some of the critical coating
requirements such as CTE mismatch, gas permeation resistance, mechanical adhesion and
strength, and corrosion protection are needed to be changed. Since the CNTs are utilized as
electrical connectors within the coating layers (for sacrificial behaviour), before the coating
experiments, the effects of the addition and the aspect ratio of the CNTs on the electrical
properties of composites are studied through the development of a new mixing system. Electrical
and thermal conductivities of nanocomposites considering the concentration, length, orientations,
and synergistic effects of nanoparticulates are also investigated through the establishment of new
models and relevant experiments. MWCNTs, GNPs, hBN, and zinc particulates are added to
7
polymer to adjust its mechanical properties, gas permeation resistance, corrosion resistance, and
CTE mismatch. These aims, which are novel scientific contributions of this study, are defined
and presented in the following subsections.
i. Investigation into effects of mixing and geometry of nanoparticulates
One of the main requirements of the proposed coating system is the creation of an
electrical network within the coating layer for providing sacrificial performance from zinc
particles. CNTs are selected as the inclusions building a conductive network connecting the zinc
particles and the substrate. To attain high-performance CNT nanocomposites, the uniform
dispersion of the CNTs in a polymeric matrix is critical. However, due to van der Waals
interactions between the utilized nanoparticulates, their dispersion in polymers is a concern in the
fabrication stage. Moreover, mixing of the fillers without damaging them is a critical issue that
needs to be considered during mixing due to the importance of the geometry of the conductive
nanoparticulates. Therefore, mixing of nanoparticulates with polymers is studied through the
comparison of the developed chaotic mixing system with a commercial one. Through this
comparison, the effects of concentration, length, and dispersion of nanoparticulates on the
electrical performance of the nanocomposites are studied.
ii. Development of electrical and thermal conductivity modeling
Since the electrical and thermal behaviours of nanocomposites are critical in coatings,
these properties are studied through both experiments and modeling. Two models for predicting
electrical and thermal conductivities of composites are developed based on the random walk
method. Both models can use a single common cubic representative volume element (RVE),
8
which is filled with the desired nanoparticulates. Through the use of these models, electrical and
thermal conductivities of large networks can be calculated. Random walkers, mimicking
electrical and thermal particles electrons and phonons, are imported into the complex networks
from the highest potential nodes and exit from the nodes with the lowest potential. Effects of
geometry, alignment, content, and synergy among the nanoparticulates (one-dimensional and
2D) are investigated through the developed models and compared with previously published
models and experiments. It is seen that the both developed models can predict the electrical and
thermal behaviours of the composites close to experimentally measured ones. Additionally, two
developed models have a potential to be combined into a single comprehensive model for
calculating electrical and thermal conductivities of a shared RVE.
iii. Implementation of polymer nanocomposites for coating applications
Novel nanocomposites are fabricated and investigated for their applications as the coating
of steel plates. The coating system consists of two-layered composites with various
nanoparticulates as fillers in two different polymer matrices (acrylic and epoxy). The first layer,
which bonds to the steel plate, uses a combination of zinc particles, MWCNTs, and GNPs. hBN
is added to the polymer for the second layer, which is applied over the first layer. The physical
interactions among nanoparticulates are characterized using scanning electron microscopy
(SEM) and electrical conductivity measurements. Coating adhesion and corrosion protection
performances are evaluated through adhesion strength (pull-off) and cathodic disbondment tests,
respectively. The CTE, gas penetration, scratch resistance, and surface hardness of the coatings
are tested. From the tests and evaluations conducted on the composites, it is observed that the
9
addition of the selected nanoparticulates can enhance coating properties of the polymeric
matrices.
1.4 ORGANIZATION
This thesis contains six chapters. Chapter 2 reviews some critical pipeline coating
challenges, composite coatings, and protection performances of composite coatings. The
nanoparticulates utilized in this research are also described, and their effects on coating
performance are presented in this chapter. CTE and gas barrier performance of the composite
coatings are also described through two theoretical approaches. This section also contains a
description of different mixing and fabrication of nanocomposites.
The effects of geometry, concentrations, and dispersion of nanoparticulates on the final
properties of nanocomposites are studied through the comparison of two mixing systems in
Chapter 3. The development and optimization of a developed chaotic mixer are explained, and
the outcomes of the developed mixer are compared with those of a commercial mixer to
investigate the effects of different mixing methods. The fabricated nanocomposites are
characterized through transmission electron microscopy (TEM) and optical observations. Effects
of concentration, dispersion, and geometry of the inclusions on performances of the
nanocomposites are also investigated in this chapter.
Chapter 4 presents the description of the electrical and thermal conductivity models.
Effects of geometry and concentrations of CNTs are studied in the electrical conductivity model,
and the results are compared with previous research works. For the thermal conductivity model,
1D and 2D inclusions are considered, and the effects of concentrations, orientation, and hybrid
10
compositions are investigated. To verify the model, nanocomposites are fabricated, and the
experimental results are compared with those of the developed thermal conductivity model.
In Chapter 5, the methodology for the fabrication of nanocomposite coatings is introduced.
Coating structure, polymeric matrices, and nanoparticulates are described with their properties.
Methods and equipment for SEM observation, viscosity measurements, and electrical and
thermal conductivity of composites are represented. Devices and approaches for testing adhesion
strength, gas permeation resistance, CTE, cathodic disbondment, scratch resistance, and surface
hardness of the fabricated composite coatings are revealed in this chapter. This chapter also
presents the results of characterizations and tests conducted on the fabricated coatings. Effects of
different nanoparticulates, compositions, and loadings are studied and discussed in this section of
the thesis.
The last chapter of the thesis provides a summary of the research work, followed by
discussion and recommendations for future studies. The scientific contributions of this study are
also summarized in this section. Additionally, the limitations and assumptions of this study are
provided in this chapter.
11
CHAPTER 2. LITERATURE SURVEYS
2.1 INTRODUCTION
For more than seventy years, extensive attempts have been conducted on developing
coating materials with advanced protection performances. Initially, pure polymeric materials had
the significant share in pipeline industries due to their versatility, high mechanical properties,
and relatively low cost [Guidetti et al. 1996, Harris and Lorenz 1993]. However, the use of pure
polymeric coatings in harsh conditions such as marine environments, humidity, a wide range of
temperature, and UV exposure can influence their lifetime provoking the deterioration of their
physical and mechanical properties [Guermazi et al. 2008, Han and Nairn 2003]. In the recent
years, using polymer composites filled with various inclusions as coatings have attracted
immense importance. These composites are polymers filled with micro/nanoscale fillers, which
significantly improve the properties of the polymers coating materials [Ruhi et al. 2014].
In addition, to improve the durability of polymers, reinforcing agents can also advance
other critical requirements of the coating materials through improving the gas/liquid barrier
performance, mechanical adhesion to the substrate, and thermal stability. Furthermore, the
corrosion resistance of the composite coatings can be increased by using anti-corrosion
inclusions with sacrificial behaviour.
There are many factors affecting the performance of the composite coatings, which among
them, mechanical properties, geometry, and dispersion of fillers have the critical roles. High
protection levels of composite coatings can be obtained from composites filled with uniformly
dispersed inclusions with high aspect ratio. Numerous research efforts have been devoted to
12
investigating the performance of coating materials, which some relevant studies are reviewed in
this part of the thesis.
In this chapter, first, a review of standard pipeline coating methods is presented. The
challenges existing in the current coating methods and the research done on these issues are also
reviewed. The key features and components of some composites that can be used as protective
layers are described. Finally, the preparation and fabrication procedures for nanocomposite
production are explained.
2.2 PIPELINE COATING
Corrosion is the undesirable deterioration of a metal or alloy, i.e. an interaction of the
metal with its environment that adversely affects the properties of the metal to be preserved, and
is the main reason for protective coatings on pipelines. The most common metal used in the
pipeline industry is steel. When exposed to an industrial atmosphere, steel reacts to form rust
with an approximate composition of Fe2O3-H2O, which continues at a linear rate until the metal
is completely consumed [Shreir et al. 1993].
The use of the proper coating material is essential for long-term protection of pipework
from corrosion. An appropriate coating material requires the basic characteristics as cost-
effectiveness, chemical stability, thermal stability, low gas permeability, low thermal expansion
mismatch with substrate, high mechanical strength and high adhesion to steel [Rahman et al.
2012, Thompson and Saithala 2013]. Maintaining these properties can ensure a high level of
protection in pipelines. For instance, a lowmismatch in thermal expansion rates of steel and
coatingsresultsinfewercoatingdisbondmentsinenvironmentswithhightemperaturevariation
13
rates.Inaddition,highgaspenetrationresistancesmayresultinlesscorrosiveelementsreaching
thesteelsurface.
There have been three main generations of pipeline coating techniques since 1940. The
first wave of coating materials included coal tar enamel, asphalt, single- or two-layer
polyethylene (PE), cold applied tapes and heat shrink sleeves. In the next generation, a single
layer of fusion bonded epoxy (FBE) and a multi-component liquid were combined. In the third
generation, three layers of PE and polypropylene (PP) and a dual-layer of FBE were combined
for pipeline coating [Thompson and Saithala 2013].
One of the current technologies for coating of pipelines is the combined use of FBE and
polyolefin layers. It has been determined that FBE has good barrier performance and the ability
to maintain a high glass transition temperature (Tg), despite humid and hot surroundings. The
coating currently being used is composed of a thin layer of FBE, an intermediate layer, and a
polyolefin layer (PE or PP). The inner surface of the epoxy resin interacts with the steel and the
outer surface with the intermediate layer, which is a modified type of the polyolefin layer and
plays an adhesive role. The intermediate and outer layers are completely compatible, providing
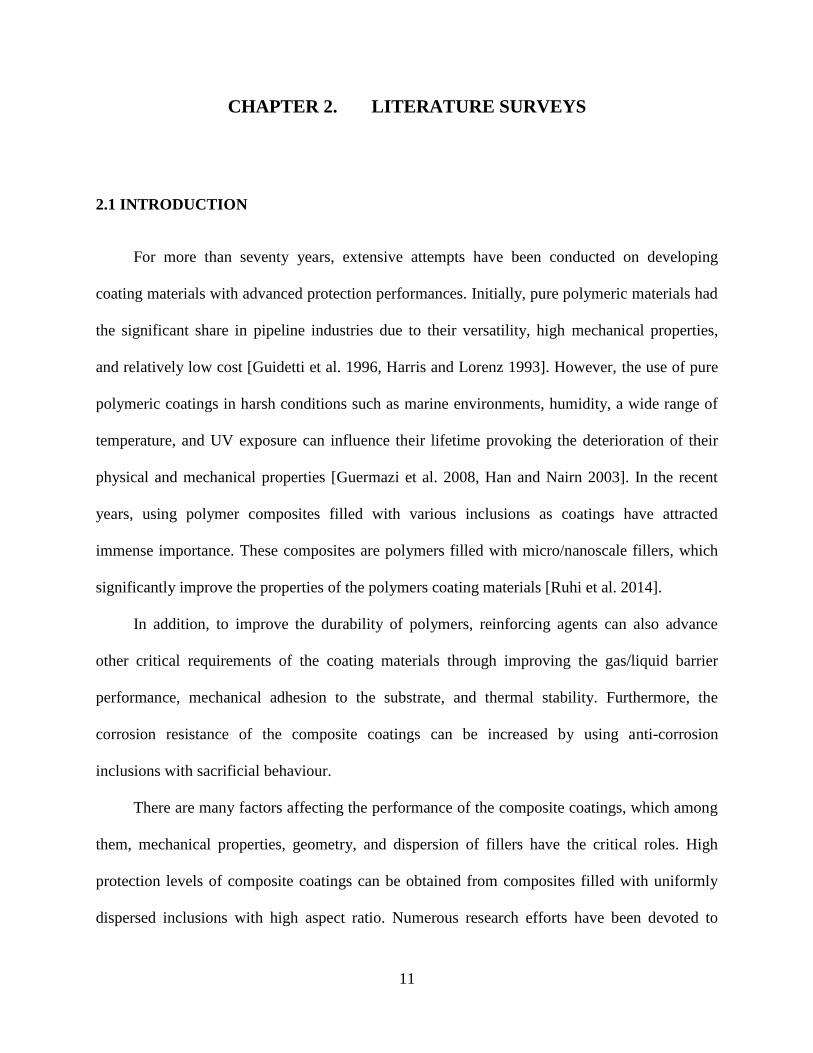
good adhesion between these layers [Guidetti et al. 1996]. A schematic of the current three-layer
coating is depicted in Figure 2.1.
Figure 2.1 Three-Layer Coating Protection with FBE and PE / PP [Guidetti et al. 1996]
14
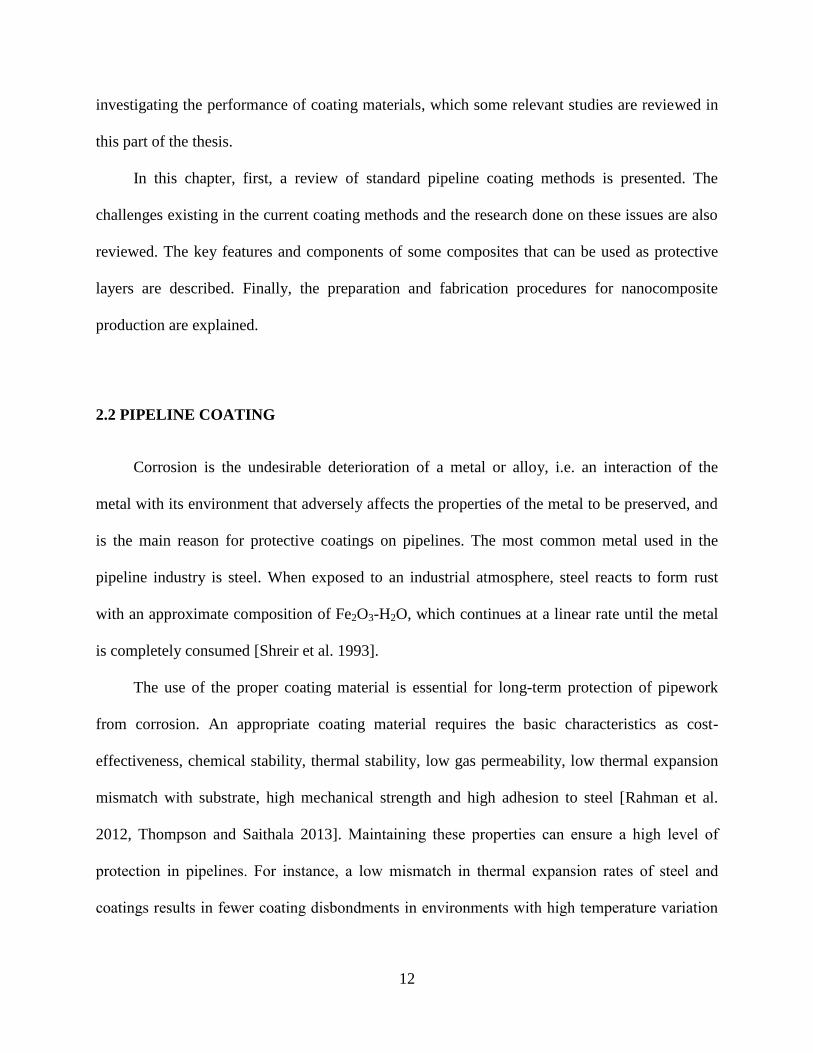
The three-layer coating is applied through the following steps. The first stage is good
surface preparation, which is the key to maintaining adhesion, and is usually based on chemical
pre-treatmentofblasted steel [Goldie2012].Thepipe’s surface is thenheated, and the epoxy
resin is sprayed on the surface of the pipe. The high temperature of pipe leads to the curing of the
FBE. The second (adhesive) and third (polyolefin) layers are then applied using extrusion
processes. A schematic of this coating process is depicted in Figure 2.2.
Figure 2.2 Three-Layer Coating Process with Epoxy, Adhesion Layer and PE / PP [Coeuille
2002]
Some problems associated with current coatings are heat blistering, mechanical damage,
and corrosion at areas of coating damage [Dennis et al. 2013]. Polymeric coating materials for
metal substrates have found limited use in industrial applications for preventing corrosion, due to
their overall poor adhesion to underlying substrates [Bellucci et al. 1992, Roy et al. 2002,
Schilling et al. 2002, Wielant et al. 2008]. Insufficient bonding between the protection coating
material and the steel can result in catastrophic debonding upon exposure to wet and corrosive
environments.
15
Many researchers have tried several methods to enhance polymer to steel adhesion such as
execute coating and polymerization processes simultaneously, mechanical interlocking, and
chemical modifications to the polymer [Voccia et al. 2004, Berry et al. 2005, Ramani and
Moriarty 1998]. However, the scope of their methods is limited by many factors such as tedious
synthesis of the polymers and texturing of the polymer surface [Claes et al. 2003, Grujicic et al.
2008].
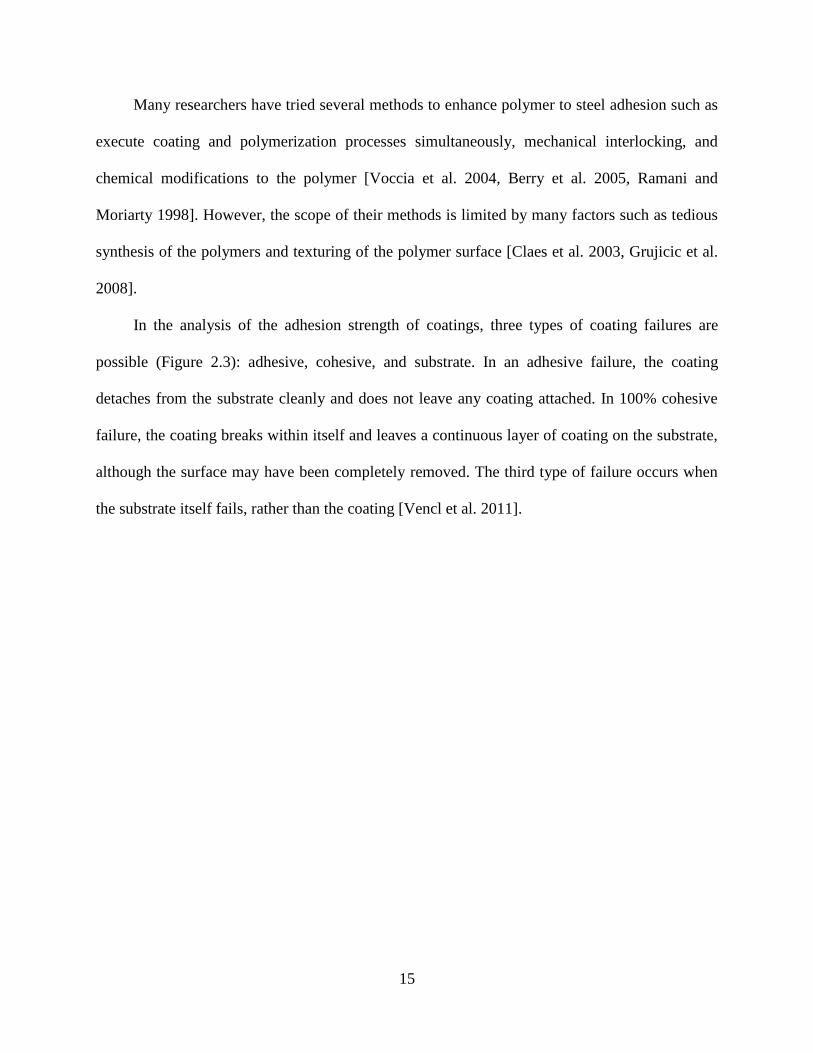
In the analysis of the adhesion strength of coatings, three types of coating failures are
possible (Figure 2.3): adhesive, cohesive, and substrate. In an adhesive failure, the coating
detaches from the substrate cleanly and does not leave any coating attached. In 100% cohesive
failure, the coating breaks within itself and leaves a continuous layer of coating on the substrate,
although the surface may have been completely removed. The third type of failure occurs when
the substrate itself fails, rather than the coating [Vencl et al. 2011].
16
Figure 2.3 Coating Failure Types [Vencl et al. 2011]
In addition to the lack of molecular compatibility, different thermal expansions can further
accelerate the loss of interfacial adhesion at the polymer/steel interface and give rise to
delamination of polymeric coatings [Rout et al. 2011]. Coefficient of thermal expansion (CTE)
values for polymer coating materials and steel are quite different, this mismatch results in
thermal stress at the interface. The differences in their expanded volume lead to eventual
delamination of the coating layers from the steel surface due to stress [Olga et al. 2004].
17
Delamination of the coatings causes pipes to have a greater opportunity for corrosion [van den
Bosch et al. 2008].
Stresses other than thermalexpansionmismatchappliedonthepipesmayresultinlayers’
delamination and, consequently, corrosion of the pipe metal. Stresses can result from internal
operating pressure (e.g. hoop stress) or from ground movement (e.g. significant longitudinal
strains). It has been established that applied stress and/or strain considerably increases the
corrosion of steel [Xu et al. 2013]. Therefore, control and minimization of the thermal expansion
of the coating materials and improving mechanical strength of the coating layers are essential for
an effective long-term protective coating for non-alloy steel pipelines.
Furthermore, gas and liquid barrier performance of coatings is a critical parameter to
enhance corrosion protection as water and other corrosive elements can penetrate into the coating
and reach the bare steel surface. This process would result in formation of an electrochemical
environment to support pipeline corrosion [Dong et al. 2008]. Therefore, very high gas and
liquid penetration resistances are also key factors for high-performance pipeline coating.
2.2.1 Composite Coatings
The main disadvantages associated with currently used epoxy coatings are their brittleness,
poor resistance to crack propagation, and low impact strength [Fellahi et al. 2001]. It has been
reported that the addition of toughening agents to thermosets leads to improvement of their
mechanical properties [Moloney et al. 1983, Spanoudakis et al. 1984, Srivastava et al. 1990,
Amdouni et al. 1992]. Epoxy cracking in a pipeline coating may facilitate the penetration of
corrosive elements to the substrate surface, thereby accelerating the corrosion process [Huttunen-
Saarivirta et al. 2013].
18
Fillers used for mixing with epoxy include a wide variety of materials, such as
electronegative aluminum powders, glass flakes, and oxides [Mardel et al. 2011, Huttunen-
Saarivirta et al. 2013]. Fabricating composite coatings through the addition of fillers, pigments or
other types of additives, such as corrosion inhibitors, to the polymeric coating layers can also
enhance the barrier performance and corrosion resistance of the epoxy [Rahman et al. 2012]. For
instance, the anti-corrosion effectiveness of epoxy coatings can be increased with the addition of
polyaniline and inorganic pigments [Kalendova et al. 2008].
In a recently published study on using composite coatings for steel protection, the addition
of hBN powder led to the improvement of anti-corrosion properties of poly(methyl methacrylate)
(PMMA) [Coan et al. 2013]. Zinc particles are also employed as anti-corrosive, anti-microbial,
and UV-absorber fillers within the steel coating systems [Nafchi et al. 2013]. Zinc powders in
contact with steel substrate initiate electrochemical reactions; they are often added to metal
coatingstoserveas“sacrificialanode” for cathodic protection of the substrate [Kalendova et al.
2015, Schaefer and Miszczyk 2013, Jalili et al. 2015]. Some researchers have studied the use of
self-healing epoxy composites as coating materials for metallic surfaces [Yin et al. 2007,
Sauvant-Moynot et al. 2008]. Based on their investigations, the utilization of these materials may
be a promising approach for the development of effective pipeline coatings. Moreover, the use of
nanostructured materials may present the possibility of developing smart coatings that can
release corrosion inhibitors on demand [Kendig et al. 2003].
The incorporation of nanoparticles offers environmentally benign solutions for improving
the integrity and durability of coatings, since the fine nanoparticles can fill cavities. They can
lead to crack bridging, deflection, bowing, and prevention of polymer disaggregation during
curing, resulting in a more homogeneous coating material [Dietsche et al. 2000, Shi et al. 2009].
19
It has also been shown that the addition of nanoclays within the epoxy enhances its corrosion
protection and mechanical properties [Huttunen-Saarivirta et al. 2013].
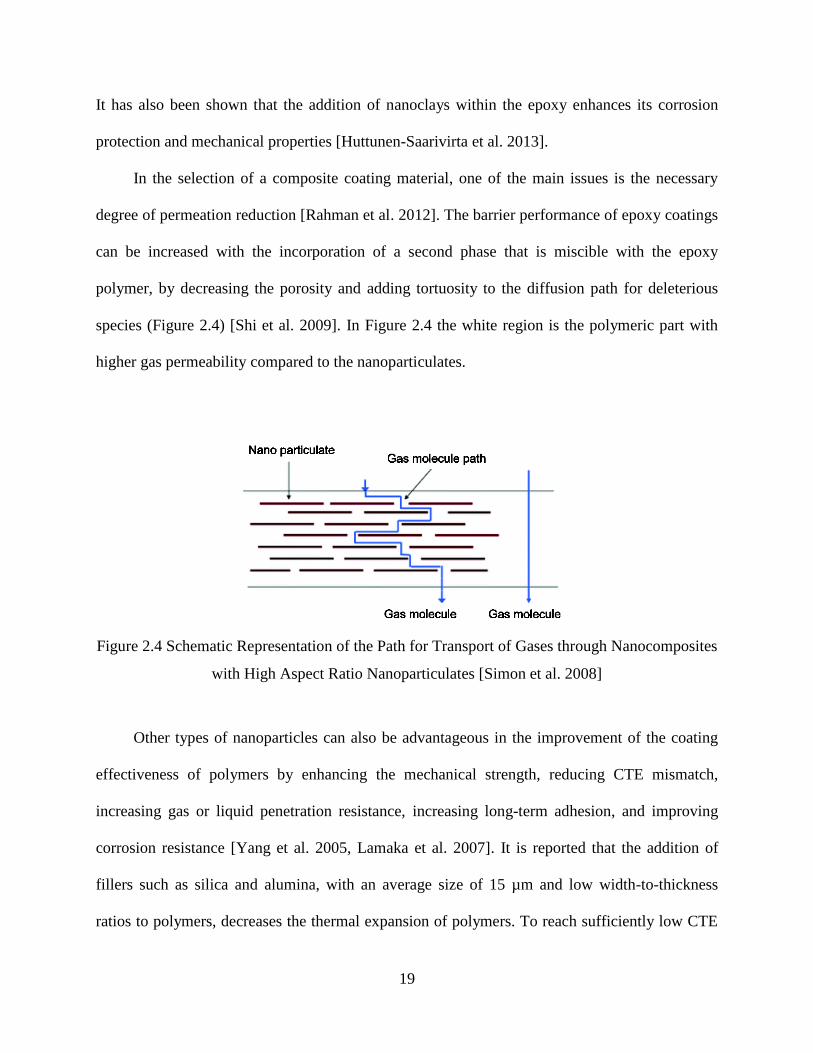
In the selection of a composite coating material, one of the main issues is the necessary
degree of permeation reduction [Rahman et al. 2012]. The barrier performance of epoxy coatings
can be increased with the incorporation of a second phase that is miscible with the epoxy
polymer, by decreasing the porosity and adding tortuosity to the diffusion path for deleterious
species (Figure 2.4) [Shi et al. 2009]. In Figure 2.4 the white region is the polymeric part with
higher gas permeability compared to the nanoparticulates.
Figure 2.4 Schematic Representation of the Path for Transport of Gases through Nanocomposites
with High Aspect Ratio Nanoparticulates [Simon et al. 2008]
Other types of nanoparticles can also be advantageous in the improvement of the coating
effectiveness of polymers by enhancing the mechanical strength, reducing CTE mismatch,
increasing gas or liquid penetration resistance, increasing long-term adhesion, and improving
corrosion resistance [Yang et al. 2005, Lamaka et al. 2007]. It is reported that the addition of
fillers such as silica and alumina, with an average size of 15 µm and low width-to-thickness
ratios to polymers, decreases the thermal expansion of polymers. To reach sufficiently low CTE
20
mismatches between the polymer and steel using these inclusions, high loadings of fillers are
required (more than 40 wt.%) [Wong et al. 1999]. Nevertheless, by the inclusion of nanoplatelets
into polymers even in less concentration, lower CTE values can be achieved [Wang et al. 2009,
Yasmin et al. 2004, Yasmin et al. 2006].
In the proposed study, some nanoparticulates with unique features are employed to
enhance protection efficiency of polymeric coatings. Properties of the utilized nanoparticulates
and their effects on performances of polymers are explained in the next section. Main criteria for
the selection of nanoparticulates are their effects on the gas barrier, galvanic protection,
mechanical, and thermal properties of the polymeric coatings.
2.3 NANOMATERIALS AND NANOCOMPOSITES
Carbon nanotubes (CNTs) are unique tubular structures with high aspect ratios (i.e. length
to diameter ratios). Multi-walled carbon nanotubes (MWCNTs) may consist of several layers of
concentric carbon atoms with an adjacent shell separation of about 0.34 nm. The carbon network
of the shells is closely related to the honeycomb arrangement of the carbon atoms in the graphite
sheets. The unique mechanical, electrical, and thermal properties of the nanotubes stem from
their quasi 1D structure and the graphite-like arrangement of the carbon atoms in the shells.
Thus, CNTs have high tensile strength, and electrical and thermal conductivities, making them
an excellent choice for composite materials with improved properties [Popov 2004].
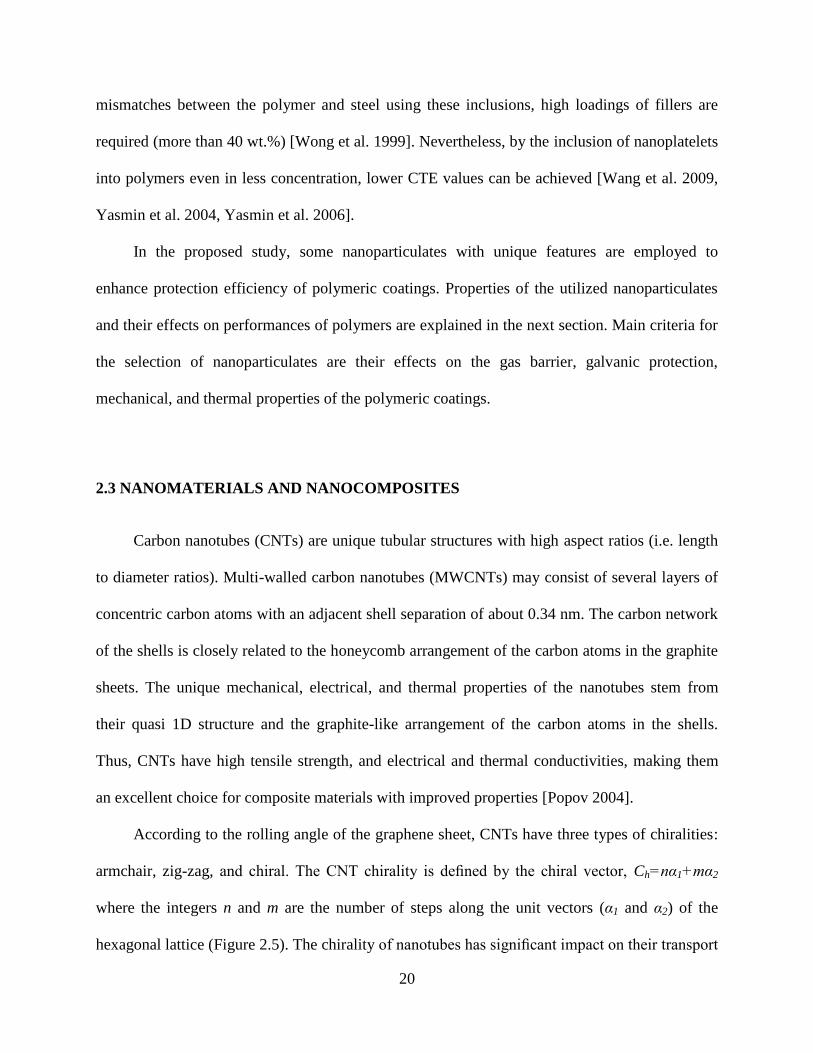
According to the rolling angle of the graphene sheet, CNTs have three types of chiralities:
armchair, zig-zag, and chiral.TheCNT chirality is definedby the chiral vector, Ch=nα1+mα2
where the integers n and m are the number of steps along the unit vectors (α1 and α2) of the
hexagonal lattice (Figure 2.5). The chirality ofnanotubeshassignificantimpactontheirtransport
21
properties, particularly the electronic properties. For a given (n, m) nanotube, if (2n + m) is a
multiple of 3, the nanotube is metallic; otherwise, the nanotube is a semiconductor [Thostenson
et al. 2001].
Figure 2.5 Schematic Showing How a Graphene Sheet is Rolled to Create CNTs with Armchair
and Zig-zag Chiralities [Thostenson et al. 2001]
Each MWCNT contains multiple layers of graphene, and each layer can have different
chiralities; therefore, the prediction of the physical properties of MWCNTs is more complicated
than that of single-walled carbon nanotubes (SWCNT) [Ma et al. 2010].
Graphene nanoplatelets (GNPs) are two-dimensional structures of covalently bonded
carbon atoms, as shown in Figure 2.5. With properties such as a very high aspect ratio (width to
thickness), high gas barrier performance [Chang et al. 2014], high mechanical strength [Terrones
2012], high hydrophobic behaviour [Shen et al. 2015], high anti-corrosive performance [Prasai et
al. 2012], GNPs have become one of the most important additives of advanced nanocomposites.
The addition of nano-fillers such as CNTs and GNPs can enhance the corrosion protection
properties of polymers [Singh et al. 2013, Chang et al. 2014, Kim and Oh 2011]. Their excellent
22
conductivity makes CNTs and GNPs ideal materials for the production of conductive polymer
composites that are able to dissipate electrostatic charges or shield devices from electromagnetic
radiation. Interestingly, the electrical properties of CNTs are dependent on the nanotube
diameter, the number of concentric shells and the chirality, which allows electrical or magnetic
properties to be conveniently tuned by selecting the proper parameters [Liang et al. 2006].
Nogales et al. [2004] prepared poly(butylenes terephthalate) / CNT nanocomposites and
reported a low CNT percolation threshold content of 0.2 wt.%. This threshold describes a critical
concentration that is required to form a continuous conductive network [Russ et al. 2013]. The
properties of fabricated nanocomposites are strongly influenced by the aspect ratios and
dispersion of nanoparticulates into the polymer matrix. Proper dispersion of nanoparticulates is
one of the biggest challenges in nanocomposite fabrication. The issue of dispersion is
particularly challenging in CNT nanocomposites. This can be attributed to poor interactions at
the CNT / polymer interface, strong van der Waals forces and the high aspect ratio of CNTs,
which may lead to agglomeration of the CNTs within the polymeric matrix (Figure 2.6) [Jimenez
et al. 2007, Zhbanov et al. 2010].
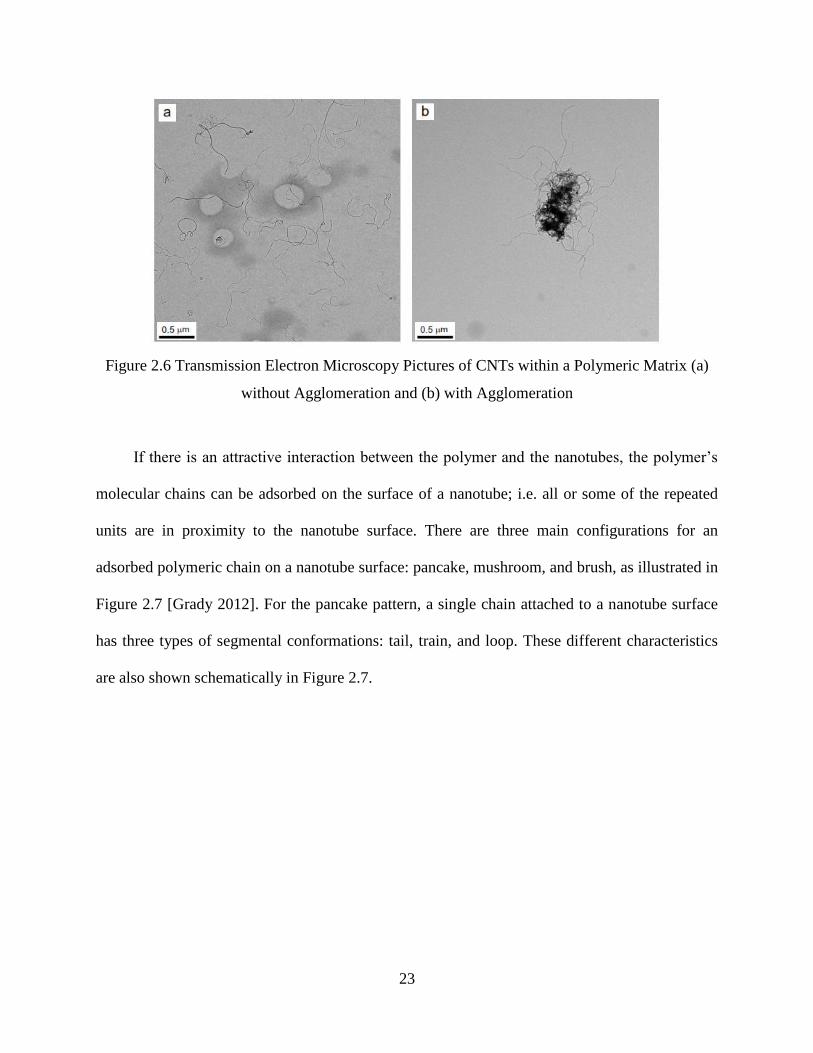
23
Figure 2.6 Transmission Electron Microscopy Pictures of CNTs within a Polymeric Matrix (a)
without Agglomeration and (b) with Agglomeration
Ifthereisanattractiveinteractionbetweenthepolymerandthenanotubes,thepolymer’s
molecular chains can be adsorbed on the surface of a nanotube; i.e. all or some of the repeated
units are in proximity to the nanotube surface. There are three main configurations for an
adsorbed polymeric chain on a nanotube surface: pancake, mushroom, and brush, as illustrated in
Figure 2.7 [Grady 2012]. For the pancake pattern, a single chain attached to a nanotube surface
has three types of segmental conformations: tail, train, and loop. These different characteristics
are also shown schematically in Figure 2.7.
24
Figure 2.7 Classification of the Interactions of Polymer Chains with a CNT Surface. The Upper
Schematics Represent the Three Main Classifications of Morphology for Adsorbed Polymers:
Pancake, Mushroom, and Brush. The Lower Diagram Represents the Possible Features of
Adsorption for a Single Chain (Pancake) [Grady 2012]
It has been observed that, while the high aspect ratio of CNTs improves conductive
network formations at lower weight percentages, the higher degree of entanglement leads to an
increase in the yield strength. This phenomenon impacts the process efficiencyof CNT / polymer
melts, compared to their lower aspect ratio counterparts such as carbon nano-fibres [Russ et al.
2013]. Therefore, for the reinforcement of polymers through the addition of nanotubes, four main
requirements are needed: a high aspect ratio, good dispersion, alignment, and interfacial stress
transfer [Coleman et al. 2006].
The high aspect ratio of nanoparticulates helps in the transfer of load to the reinforced
material and increases the electrical and thermal conductivities of the resulting nanocomposites
[Callister 2003]. Imperfections in the carbon structure and external force applied during the
mixing stage can break down CNTs [Kuzumaki et al. 1998]. Therefore, the development of an
effective method for the distribution of nanoparticulates within a polymeric matrix without
25
affecting the length and shape of the nanomaterials is a challenging issue in the fabrication
process of these nanocomposites.
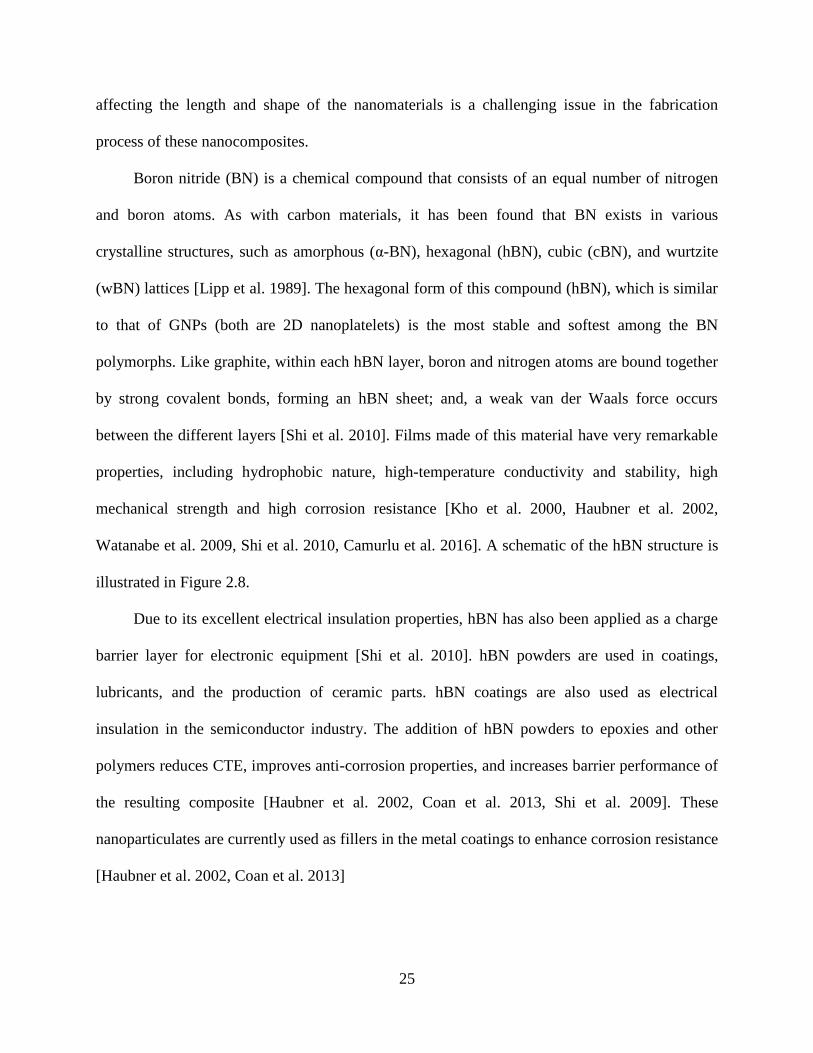
Boron nitride (BN) is a chemical compound that consists of an equal number of nitrogen
and boron atoms. As with carbon materials, it has been found that BN exists in various
crystalline structures, such as amorphous (α-BN), hexagonal (hBN), cubic (cBN), and wurtzite
(wBN) lattices [Lipp et al. 1989]. The hexagonal form of this compound (hBN), which is similar
to that of GNPs (both are 2D nanoplatelets) is the most stable and softest among the BN
polymorphs. Like graphite, within each hBN layer, boron and nitrogen atoms are bound together
by strong covalent bonds, forming an hBN sheet; and, a weak van der Waals force occurs
between the different layers [Shi et al. 2010]. Films made of this material have very remarkable
properties, including hydrophobic nature, high-temperature conductivity and stability, high
mechanical strength and high corrosion resistance [Kho et al. 2000, Haubner et al. 2002,
Watanabe et al. 2009, Shi et al. 2010, Camurlu et al. 2016]. A schematic of the hBN structure is
illustrated in Figure 2.8.
Due to its excellent electrical insulation properties, hBN has also been applied as a charge
barrier layer for electronic equipment [Shi et al. 2010]. hBN powders are used in coatings,
lubricants, and the production of ceramic parts. hBN coatings are also used as electrical
insulation in the semiconductor industry. The addition of hBN powders to epoxies and other
polymers reduces CTE, improves anti-corrosion properties, and increases barrier performance of
the resulting composite [Haubner et al. 2002, Coan et al. 2013, Shi et al. 2009]. These
nanoparticulates are currently used as fillers in the metal coatings to enhance corrosion resistance
[Haubner et al. 2002, Coan et al. 2013]
26
Figure 2.8 Hexagonal Boron Nitride [Kopeliovich 2012]
Among other fillers for composite coatings, zinc is of the established ones. Using zinc
within the coating leads to creation of high corrosion resistance coatings [Naderi and Attar
2010]. Zinc-rich primers or coatings find wide range applications in the protection of steel in
harsh environments [Faidi et al. 1993]. The mechanism behind this corrosion protection is
cathodic protection, which is related to intensity of sacrificial, and self-corrosion of zinc [Pereira
et al. 1990, Knudsen et al. 2005, Gergely et al. 2013, Chen et al. 2005]. The manufacturing of
zinc is atomization of molten zinc which may result in oxidation, and creation of zinc oxide
(ZnO). ZnO can also provide corrosion inhibiting and barrier performance [Jagtap et al. 2007].
Due to these properties, zinc filled composites have a unique capability to protect metals even
after instances of slight mechanical damage to the coating [Marchebois et al. 2002].
To achieve good corrosion protection from zinc-rich coatings, one should load the epoxy
matrix with 65-95 wt.% zinc metallic fillers. These high levels of loading are required for
creation of a conductive network of fillers within the matrix. However, it is shown that by
fabrication of hybrid compositions of MWCNT and zinc, the required amount of zinc could be
27
reduced down to 10-30 wt.% to provide the same level of galvanic protection in zinc-rich
primers [Drozdz et al. 2011]. In a study, Praveen et al. added MWCNT and zinc to epoxy and
showed a significant increase in corrosion resistance. They also reported that MWCNTs can
provide a physical barrier to the corrosion medium and additionally can fill the micro-holes of
the metal substrate, which are likely locations for corrosion initiation [Praveen et al. 2007].
Recently, Park and Shon prepared MWCNT / zinc / epoxy composites with different
compositions. They showed that high MWCNT contents lead to higher cathodic protection of
steel by zinc due to the higher electrical conductivity of the resulting composite [Park and Shon
2015]. They also reported that addition of MWCNTs results in higher adhesion of zinc epoxy
coatings.
2.4 GAS PERMEABILITY MODELING OF NANOCOMPOSITES
The effects of the addition of nanoparticulates on the gas permeability of polymers are
studied through a theoretical model in this section. The presented model is used for predicting
the permeability of nanocomposites in Chapter 5. The presence of impermeable plate shape
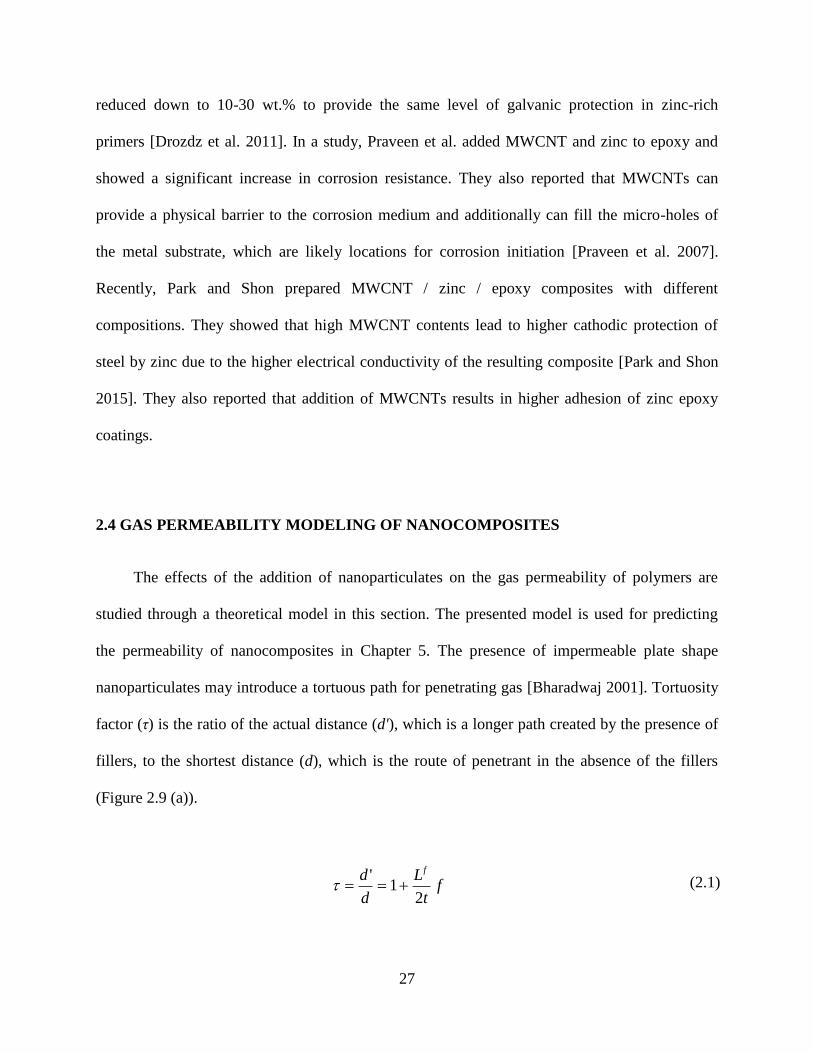
nanoparticulates may introduce a tortuous path for penetrating gas [Bharadwaj 2001]. Tortuosity
factor (τ) is the ratio of the actual distance (d'), which is a longer path created by the presence of
fillers, to the shortest distance (d), which is the route of penetrant in the absence of the fillers
(Figure 2.9 (a)).
f
t
L
d
d f
21
' (2.1)
28
where Lf, t, and f are length, thickness, and volume fraction of the nanoplatelets, respectively.
The effect of longer path on relative permeability of nanocomposites can be expressed as:
f
P
P
m
c
1 (2.2)
where Pc and Pm are permeability of composite and neat matrix, respectively.
Figure 2.9 Schematic of Gas Permeation in Different Composite Structures
The presented model is for composites with aligned nanoparticulates perpendicular to the
penetration direction. This arrangement of nanoparticulates may result in the highest tortuosity
for penetrant. In order to reflect the effects of orientation within the nanocomposites, order
parameter (s) is also presented and is defined as:
1cos3
2
1 2 s (2.3)
where Φ is the angle between the penetrant direction (n) and the normal direction of
nanoplatelets (Figure 2.9 (b)). s parameter can range from 1 (for Φ =0, representing the perfect
29
alignment) to -0.5 (for Φ =90°, representing perpendicular orientation). For random orientation
of nanoplatelets, s=0 is used. The angular brackets express averaging over all the sheets in the
nanocomposite. Furthermore, relative permeability of nanocomposites including nanoplatelets
orientation can be found by:
)2
1(
31
1
sft
L
f
P
Pf
m
c
(2.4)
In addition to the effects of random dispersion, nanoplatelets are agglomerated within the
nanocomposites unless they are exfoliated. Agglomeration of nanoplatelets can result in higher
permeability values for nanocomposites in comparison to the perfectly exfoliated ones [Cui et al.
2016]. Therefore, the effect of aggregation of nanoplatelets can be reflected into the relative
permeability of nanocomposites by modifying Equation (2.4) as [Choudalakis et al. 2009]:
)2
1(
31
1
sftN
L
f
P
P
s
f
m
c
(2.5)
where the added parameter, NS, is the number of layers in the layer stack. However, for the case
of this study, composites consisting inclusions with different geometries (first layer of the coats
with zinc particles, MWCNTs, and GNPs), relative permeability values could be found by
combining Equation (2.5) and one reported by Picard et al. [2007]:
30
2
2
3
)2
1(
1
1
i
f
i
S
i
i
f
i
S
i
m
c
t
LN
t
LN
sf
f
P
P
(2.6)
where i denotes to the ith category of inclusions. Using Equation (2.6), one can predict the
permeability value of a nanocomposite relative to its pure matrix. For the first layer coatings,
effects of addition of zinc particles and GNPs are theoretically studied through Equation (2.6).
The effects of CNTs on the gas permeability of nanocomposites are neglected since their effects
are not considerable [Ge et al. 2011]. However, considering the protecting performance of two
layer coats, the gas permeability of the second layer is more critical. In this study, experimental
results are compared with the theoretically predicted values in Chapter 5.
2.5 THERMAL EXPANSION MODELING OF NANOCOMPOSITES
In a two-phase composite system (i.e. filler and matrix interface), an increase in
temperature results in compressive stress in the element with higher expansion rate (matrix) and
tensile stress in the one with lower thermal expansion (nanoparticulate). As shown in
Figure 2.10, in the vertical direction (), both elements can expand freely and the expansion
coefficient can be calculated by summing the enlargement rates of each phase [Van Es 2001].
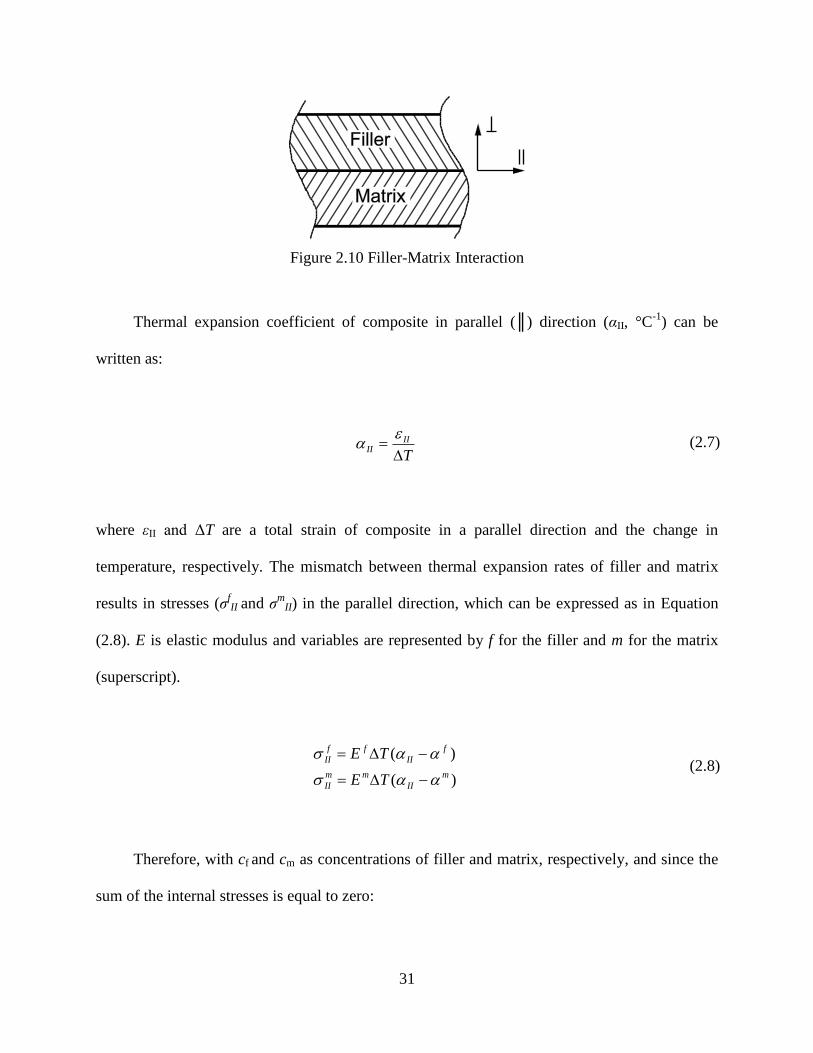
31
Figure 2.10 Filler-Matrix Interaction
Thermal expansion coefficient of composite in parallel () direction (αII, °C-1
) can be
written as:
(2.7)
where εII and ΔT are a total strain of composite in a parallel direction and the change in
temperature, respectively. The mismatch between thermal expansion rates of filler and matrix
results in stresses (σfII and σ
mII) in the parallel direction, which can be expressed as in Equation
(2.8). E is elastic modulus and variables are represented by f for the filler and m for the matrix
(superscript).
(2.8)
Therefore, with cf and cm as concentrations of filler and matrix, respectively, and since the
sum of the internal stresses is equal to zero:
T
IIII
0
)(
)(
m
IIm
f
IIfII
m
II
mm
II
f
II
ff
II
cc
TE
TE
32
(2.9)
Equation (2.8) and Equation (2.9) can be re-written as:
(2.10)
and αII can be obtained from:
(2.11)
Using cm=1-cf and EII as the effective elastic modulus of composite, Equation (2.11) can be
transformed to:
(2.12)
So for a simple combination of a filler and matrix, thermal expansion coefficient of the
composite can be found from Equation (2.12). Furthermore, for a general formula for thermal
expansion coefficient of composites, Equation (2.12) can be re-written as [Van Es 2001,
Christensen 2012, Aboudi 2013]:
0
)(
)(
m
IIm
f
IIfII
m
II
mm
II
f
II
ff
II
cc
TE
TE
0)()( m
II
m
m
f
II
f
f EcEc
m
m
f
fII
II
mm
m
ff
f
II
EcEcE
E
EcEc
m
m
II
mf
mf
IIEEEE
1111
)(
1
33
(2.13)
where α is the thermal expansion tensor (for 3D composites) and S is the compliance tensor
(inverse of stiffness tensor). Compliance tensor of composite can be obtained through Mori-
Tanaka approach [Mori et al. 1973]:
11
1
11
])([
)(
))((
tmfm
mf
rtmffmmcc
ICCPCA
CACB
BcIcBScScCS
(2.14)
where Cf and Cm represent stiffness tensor of filler and matrix, respectively. A is strain
concentration tensor and B is stress concentration tensor. P is theestablishedEshelby’stensor,
and It is the identity tensor. P is only dependent on elastic properties of the matrix and the
geometry of inclusions. Details of theoretical calculations can be found elsewhere [Van Es
2001]. This model is used for investigating the effects of concentration and geometry of
nanoparticulates on the CTE of composites. MATLAB software is employed for calculations and
the outcomes are compared with the experiments in Chapter 5.
2.6 MIXING TECHNIQUES
There are several methods for the mixing of nanotubes with polymers, such as solution
mixing, in situ polymerization, and melt mixing. In solution mixing methods, the polymer matrix
is dissolved in a liquid, such as chloroform and tetrahydrofuran; and, the nanotubes or other
m
ij
m
mnijmnij
m
klmn
f
klmn
m
kl
f
klij SSSS )())(( 1
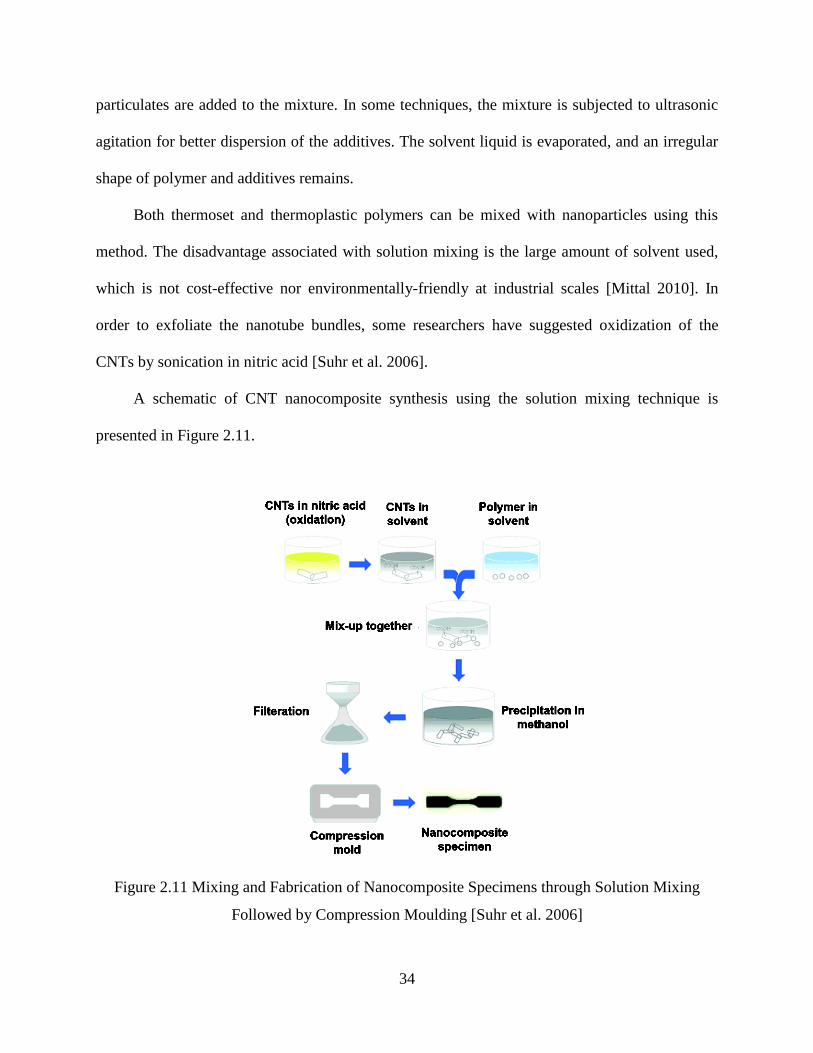
34
particulates are added to the mixture. In some techniques, the mixture is subjected to ultrasonic
agitation for better dispersion of the additives. The solvent liquid is evaporated, and an irregular
shape of polymer and additives remains.
Both thermoset and thermoplastic polymers can be mixed with nanoparticles using this
method. The disadvantage associated with solution mixing is the large amount of solvent used,
which is not cost-effective nor environmentally-friendly at industrial scales [Mittal 2010]. In
order to exfoliate the nanotube bundles, some researchers have suggested oxidization of the
CNTs by sonication in nitric acid [Suhr et al. 2006].
A schematic of CNT nanocomposite synthesis using the solution mixing technique is
presented in Figure 2.11.
Figure 2.11 Mixing and Fabrication of Nanocomposite Specimens through Solution Mixing
Followed by Compression Moulding [Suhr et al. 2006]
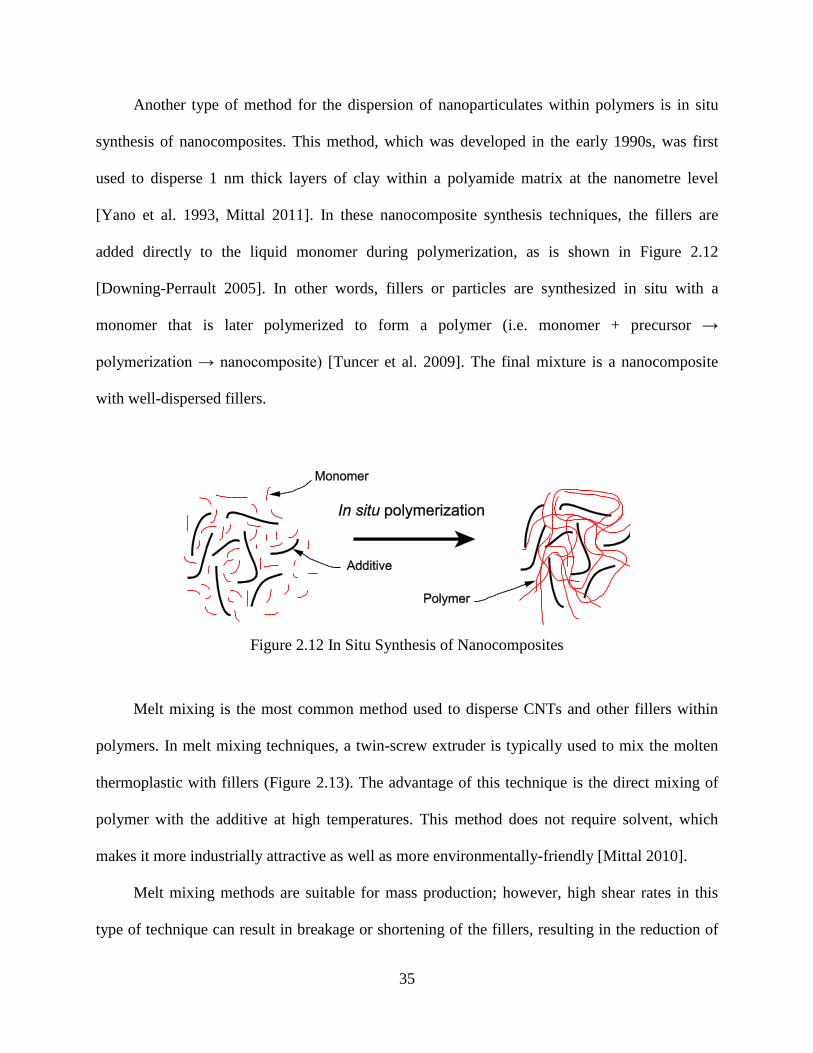
35
Another type of method for the dispersion of nanoparticulates within polymers is in situ
synthesis of nanocomposites. This method, which was developed in the early 1990s, was first
used to disperse 1 nm thick layers of clay within a polyamide matrix at the nanometre level
[Yano et al. 1993, Mittal 2011]. In these nanocomposite synthesis techniques, the fillers are
added directly to the liquid monomer during polymerization, as is shown in Figure 2.12
[Downing-Perrault 2005]. In other words, fillers or particles are synthesized in situ with a
monomer that is later polymerized to form a polymer (i.e. monomer + precursor →
polymerization→nanocomposite) [Tuncer et al. 2009]. The final mixture is a nanocomposite
with well-dispersed fillers.
Figure 2.12 In Situ Synthesis of Nanocomposites
Melt mixing is the most common method used to disperse CNTs and other fillers within
polymers. In melt mixing techniques, a twin-screw extruder is typically used to mix the molten
thermoplastic with fillers (Figure 2.13). The advantage of this technique is the direct mixing of
polymer with the additive at high temperatures. This method does not require solvent, which
makes it more industrially attractive as well as more environmentally-friendly [Mittal 2010].
Melt mixing methods are suitable for mass production; however, high shear rates in this
type of technique can result in breakage or shortening of the fillers, resulting in the reduction of
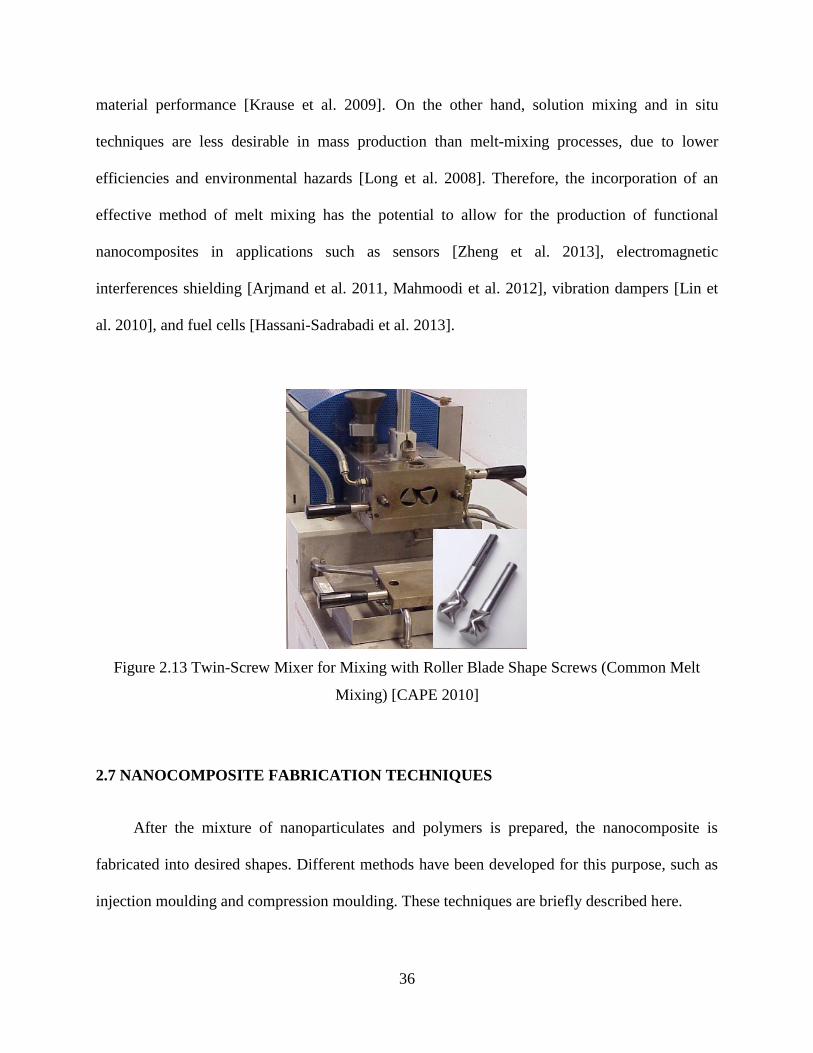
36
material performance [Krause et al. 2009]. On the other hand, solution mixing and in situ
techniques are less desirable in mass production than melt-mixing processes, due to lower
efficiencies and environmental hazards [Long et al. 2008]. Therefore, the incorporation of an
effective method of melt mixing has the potential to allow for the production of functional
nanocomposites in applications such as sensors [Zheng et al. 2013], electromagnetic
interferences shielding [Arjmand et al. 2011, Mahmoodi et al. 2012], vibration dampers [Lin et
al. 2010], and fuel cells [Hassani-Sadrabadi et al. 2013].
Figure 2.13 Twin-Screw Mixer for Mixing with Roller Blade Shape Screws (Common Melt
Mixing) [CAPE 2010]
2.7 NANOCOMPOSITE FABRICATION TECHNIQUES
After the mixture of nanoparticulates and polymers is prepared, the nanocomposite is
fabricated into desired shapes. Different methods have been developed for this purpose, such as
injection moulding and compression moulding. These techniques are briefly described here.
37
The injection moulding process is one of the main techniques for the production of plastic
based products in complex three-dimensional (3D) shapes at the industrial scale. This process
includes five stages [Rosato et al. 2000]:
a. The polymer is heated and melted in a barrel (plasticization).
b. The molten polymer is injected into the mould through the sprue, runners, and gates
with a controlled volume (injection).
c. After filling the mould, the injected polymer is maintained under high packing pressure
(compensation for shrinkage).
d. The injected polymer is cooled to a lower temperature to become sufficiently rigid.
e. The mould is opened, and the part is released.
The design of the mould plays an important role in the final properties of a part, since the
mould strongly influences the solidification, shrinkage, and accuracy of the part. The process
parameters, such as injection speed, injection and holding pressures, melt and mould
temperatures, flow rate, and holding and cooling times also have critical effects on the
dimensional stability of the fabricated parts. This has become particularly relevant with the
increasing demand for the production of complex shapes and large-sized components. The
temperature of the mould is usually raised above the room temperature, in order to promote easy
flow of the molten polymer and to minimize premature solidification [Mahmoodi 2013].
Compression moulding is another technique for creating 3D shaped products. To fabricate
the part, a bulk of polymeric material is located between two hot plates; and, the molten material
is assumed to fill the cavity. The main difference between nanocomposites fabricated with the
compression moulding method and those produced with the injection moulding technique is the
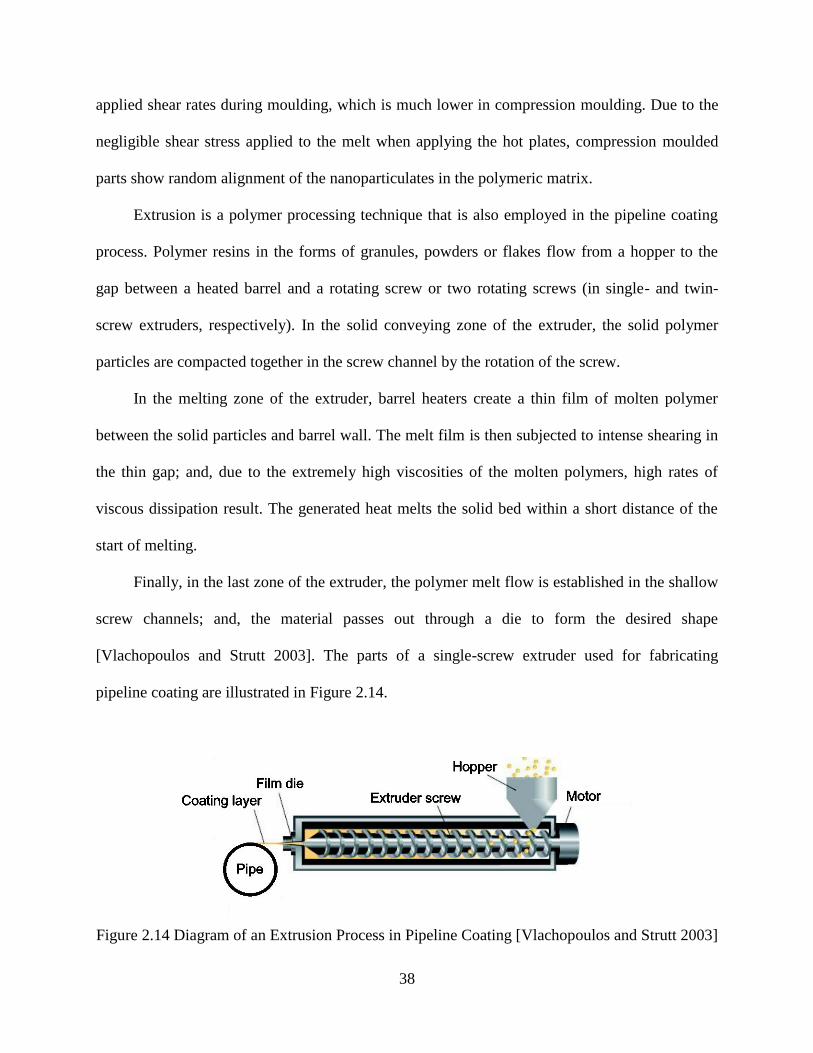
38
applied shear rates during moulding, which is much lower in compression moulding. Due to the
negligible shear stress applied to the melt when applying the hot plates, compression moulded
parts show random alignment of the nanoparticulates in the polymeric matrix.
Extrusion is a polymer processing technique that is also employed in the pipeline coating
process. Polymer resins in the forms of granules, powders or flakes flow from a hopper to the
gap between a heated barrel and a rotating screw or two rotating screws (in single- and twin-
screw extruders, respectively). In the solid conveying zone of the extruder, the solid polymer
particles are compacted together in the screw channel by the rotation of the screw.
In the melting zone of the extruder, barrel heaters create a thin film of molten polymer
between the solid particles and barrel wall. The melt film is then subjected to intense shearing in
the thin gap; and, due to the extremely high viscosities of the molten polymers, high rates of
viscous dissipation result. The generated heat melts the solid bed within a short distance of the
start of melting.
Finally, in the last zone of the extruder, the polymer melt flow is established in the shallow
screw channels; and, the material passes out through a die to form the desired shape
[Vlachopoulos and Strutt 2003]. The parts of a single-screw extruder used for fabricating
pipeline coating are illustrated in Figure 2.14.
Figure 2.14 Diagram of an Extrusion Process in Pipeline Coating [Vlachopoulos and Strutt 2003]
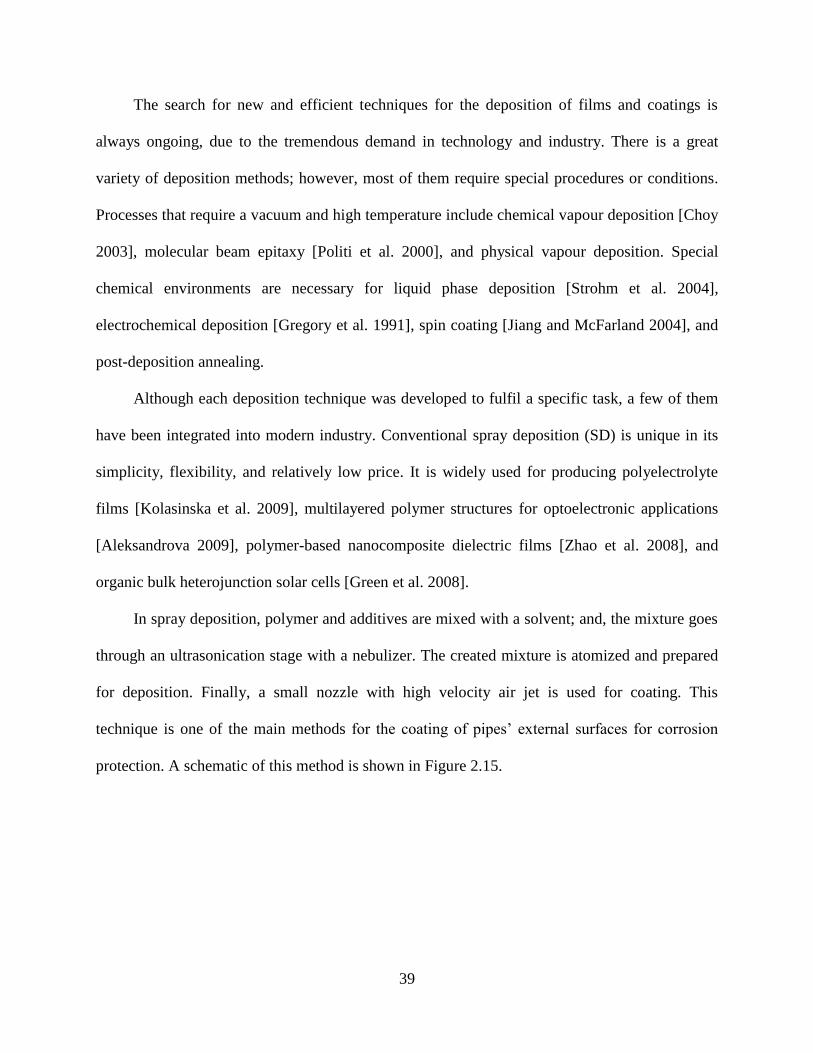
39
The search for new and efficient techniques for the deposition of films and coatings is
always ongoing, due to the tremendous demand in technology and industry. There is a great
variety of deposition methods; however, most of them require special procedures or conditions.
Processes that require a vacuum and high temperature include chemical vapour deposition [Choy
2003], molecular beam epitaxy [Politi et al. 2000], and physical vapour deposition. Special
chemical environments are necessary for liquid phase deposition [Strohm et al. 2004],
electrochemical deposition [Gregory et al. 1991], spin coating [Jiang and McFarland 2004], and
post-deposition annealing.
Although each deposition technique was developed to fulfil a specific task, a few of them
have been integrated into modern industry. Conventional spray deposition (SD) is unique in its
simplicity, flexibility, and relatively low price. It is widely used for producing polyelectrolyte
films [Kolasinska et al. 2009], multilayered polymer structures for optoelectronic applications
[Aleksandrova 2009], polymer-based nanocomposite dielectric films [Zhao et al. 2008], and
organic bulk heterojunction solar cells [Green et al. 2008].
In spray deposition, polymer and additives are mixed with a solvent; and, the mixture goes
through an ultrasonication stage with a nebulizer. The created mixture is atomized and prepared
for deposition. Finally, a small nozzle with high velocity air jet is used for coating. This
technique is one of the main methods for the coatingofpipes’ external surfaces for corrosion
protection. A schematic of this method is shown in Figure 2.15.
40
Figure 2.15 Stages of Spray Coating of a Pipe using Epoxy [PRD Inc. 2011]
2.8 SUMMARY
Conventional materials and methods for coating and protection of pipes were reviewed.
The challenges existing in the current technologies such as low mechanical properties, high CTE,
low gas permeability resistance, and difficulties facing employing zinc-rich coatings were
described. Properties of currently used composite coatings were characterized, and the effects of
different inclusions were explained. The effects of employing nanoscale inclusions on coating
performances of polymers were reviewed and compared with the effects of conventional fillers.
It was revealed that using proper nanoparticulates could enhance coating performance of
polymers. In addition, a theoretical model for predicting CTE of composites with
nanoparticulates was explained. This model is used in Chapter 5 for comparing with the
experimentally achieved results. For gas permeability measurements of the nanocomposites, a
model is also utilized, which was described in this chapter. Finally, conventional methods for the
mixing and fabrication of nanocomposites and polymeric parts were explained.
41
CHAPTER 3. EFFECTS OF MIXING ON PROPERTIES OF
NANOCOMPOSITES
3.1 INTRODUCTION
The dispersion quality of nanoparticulates within polymers is one of the most influential
factors in nanocomposite fabrication. The issue of dispersion is more challenging in
nanocomposites with high aspect ratio carbon nanotubes (CNTs) or nanofibres (CNFs) as
nanoparticulates, which can be attributed to poor interactions at the fibre-polymer interface, van
der Waals forces, and the high aspect ratio of particulates [Jimenez and Jana 2007, Zhbanov et
al. 2010]. Several research studies have been conducted to improve the dispersion of nano-fillers
within polymers, such as melt mixing in high shear rates [Jana et al. 2000, Lin et al. 2006,
Potschke et al. 2013].
Melt mixing is the most commonly used technique, due to its wide application range in
thermoplastic industry and the availability of a series of high shear mixing devices, such as
extruders and internal mixers [Jimenez and Jana 2007]. However, high shear rates in this
technique can result in fibre breakage and, consequently, reduction in the performance of the
nanocomposites [Krause et al. 2009].
To overcome these challenges in dispersing high aspect ratio nanoparticulates into
thermoplastics, chaotic mixing is envisaged as a viable option in the production of functional
nanocomposites for application in electromagnetic interferences (EMI) shielding [Mahmoodi et
al. 2012], sensors [Zheng et al. 2013, Parmar et al. 2013], vibration dampers [Lin and Lu 2010],
and fuel cells [Hasani-Sadrabadi et al. 2013].
42
Zumbrunnen et al. [1996] used chaotic mixing to disperse very fine scale particulates
within molten phases. Several investigations on the mixing of fillers in thermoplastics were
conducted by Jana and others [Jimenez and Jana 2007, Jana and Sau 2004, Jimenez and Jana
2009, Sau and Jana 2004, Dharaiya and Jana 2005, Tjahjadi and Ottino 1991, Khakhar and
Ottino 1987, Jana and Ottino 1992]. Based on the performance of chaotic-mixed composites,
they suggested that chaotic mixers could be used as highly efficient mixers for polymer
composites.
Carbon black particles were mixed with polymer melts in a chaotic mixer by Danescu and
Zumbrunen [2000], in order to increase the electrical conductivity of polystyrene (PS). They
obtained a lower percolation threshold than that obtained using common melt mixing techniques.
In another study, Jimenez and Jana [2007] reported that dispersed nanofibres in chaotic mixing
were less damaged due to low-shear conditions. Considering that reduced breakage of CNTs may
enhance the electrical propertiesofCNTcomposites,controloftheCNTs’aspectratioplaysa
key role in nanocomposite production [Wu et al. 2010, Ayatollahi et al. 2011].
In chaotic mixing, fluid elements separate from each other with time. Repeated folding of
the interfaces creates self-similar local microstructures, which are retained as the mixing
progresses, with finer scales continually added to them. This is contrary to turbulent mixing,
where mixing occurs primarily through the randomization of local microstructures. Moreover,
turbulent mixing is much less energy efficient than chaotic mixing [Jimenez and Jana 2007].
In immiscible polymers, development of the morphology occurs through transformation of
dispersed domain lamellae, fibrils, and droplets [Sundararaj et al. 1992, 1995, Lin et al. 2003, Li
and Sundararaj 2009]. During the mixing, the thickness of lamellae decreases until the lamellae
transform into fibrillar structures; and, some droplets are generated upon breakup of the fibrillar
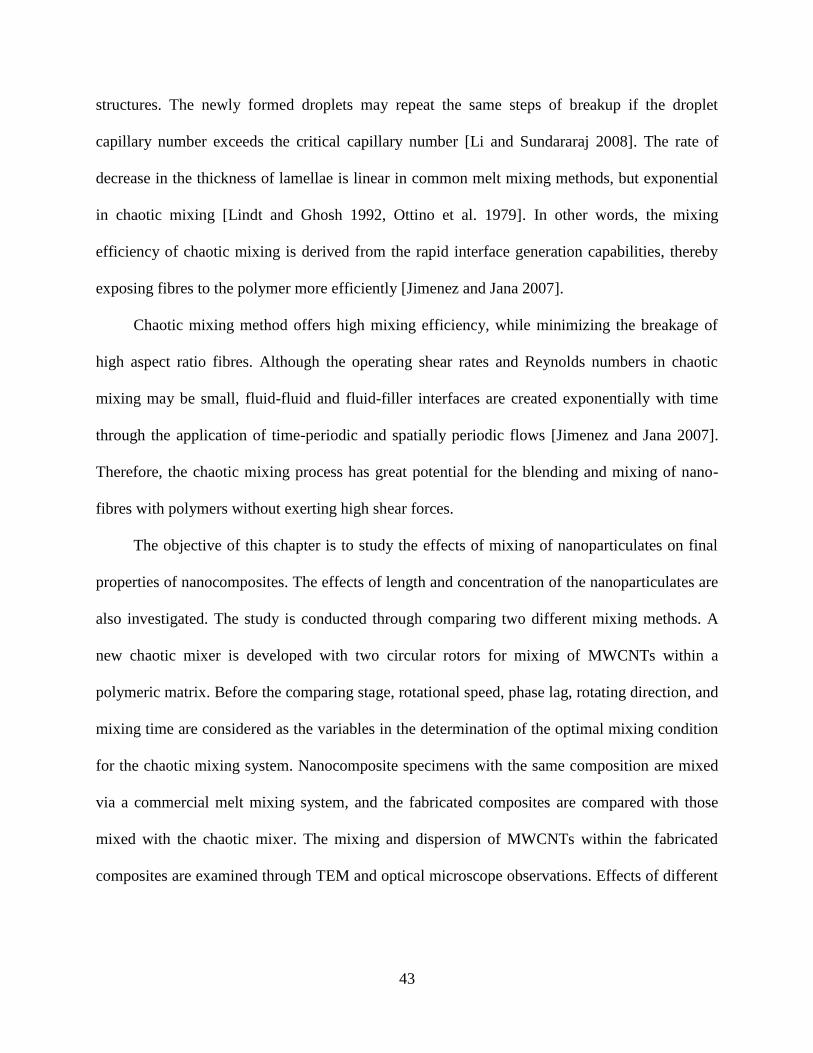
43
structures. The newly formed droplets may repeat the same steps of breakup if the droplet
capillary number exceeds the critical capillary number [Li and Sundararaj 2008]. The rate of
decrease in the thickness of lamellae is linear in common melt mixing methods, but exponential
in chaotic mixing [Lindt and Ghosh 1992, Ottino et al. 1979]. In other words, the mixing
efficiency of chaotic mixing is derived from the rapid interface generation capabilities, thereby
exposing fibres to the polymer more efficiently [Jimenez and Jana 2007].
Chaotic mixing method offers high mixing efficiency, while minimizing the breakage of
high aspect ratio fibres. Although the operating shear rates and Reynolds numbers in chaotic
mixing may be small, fluid-fluid and fluid-filler interfaces are created exponentially with time
through the application of time-periodic and spatially periodic flows [Jimenez and Jana 2007].
Therefore, the chaotic mixing process has great potential for the blending and mixing of nano-
fibres with polymers without exerting high shear forces.
The objective of this chapter is to study the effects of mixing of nanoparticulates on final
properties of nanocomposites. The effects of length and concentration of the nanoparticulates are
also investigated. The study is conducted through comparing two different mixing methods. A
new chaotic mixer is developed with two circular rotors for mixing of MWCNTs within a
polymeric matrix. Before the comparing stage, rotational speed, phase lag, rotating direction, and
mixing time are considered as the variables in the determination of the optimal mixing condition
for the chaotic mixing system. Nanocomposite specimens with the same composition are mixed
via a commercial melt mixing system, and the fabricated composites are compared with those
mixed with the chaotic mixer. The mixing and dispersion of MWCNTs within the fabricated
composites are examined through TEM and optical microscope observations. Effects of different
44
lengths distributions, concentrations, and dispersion of MWCNTs on electrical properties of
nanocomposites are investigated and compared.
The outcomes of this chapter are published in Macromolecular Materials and Engineering
Journal entitled“Investigation of Chaotic Mixing for MWCNT/Polymer Composites”.
3.2 EXPERIMENTS
In this study, polystyrene is utilized as the thermoplastic matrix due to low melting
temperature and relatively easy processing conditions. MWCNTs have aspect ratio of
approximately 150. Even though CNTs are considered to have extremely high strength,
imperfections in CNTs may cause breakage when high shear stress is applied [Jimenez 2007].
Two separate motor control systems are used to sinusoidally control the speed of cylindrical
rotors for the chaotic mixing system.
3.2.1 Materials and Equipment
Polystyrene (PS) (Styron® 610, American Styrenics LLC) with a density of 1.06 g/cm
3 is
used as the polymeric matrix. The multi-walled carbon nanotubes (MWCNTs, NC7000, Nanocyl
S.A.) are fabricated with chemical vapour deposition (CVD) and according to the manufacturer
have an average diameter of 10 nm and a length of 1.5 µm.
In addition to the developed chaotic mixer, a HAAKE mixer (Thermo HAAKE PolyLab
OS, Rheomix 600) (it is called the HAAKE mixer in this chapter) with two counter-rotating
roller rotors inside a dual-cylinder cavity is used. The mixer is connected to a Thermo HAAKE
RheoDrive 7 OS control panel. The rotational speed of the screws was adjusted to 50 rev/min,
and the materials were mixed for 20 minutes. These values are selected as optimized mixing
45
conditions for this mixing system considering previous mixing experiences on nanocomposite
mixings. For both methods of mixing, the temperature of the mixing chamber was kept at 210°C.
MWCNTs are dispersed within the polymeric matrix during the mixing stage. The rotors used in
chaotic mixer and HAAKE mixer are also depicted in Figure 3.1. As it can be seen, cylindrical
rotors used in chaotic mixer can create lower shear rates during mixing.
Figure 3.1 Rotors used in (a) Chaotic Mixing and (b) Conventional Mixing
Dispersion of the MWCNTs within the PS matrix is studied using optical microscopy
(Olympus, BX60). The mixing quality of nanoparticulates is determined using hot pressed
nanocomposite films observed in an optical microscope. For investigation of the MWCNTs
46
length distribution using a transmission electron microscopy (TEM), a procedure developed by
Krause et al. is used [Krause et al. 2011]. The evaluation of length distribution is conducted on
pure MWCNTs (as-received), HAAKE-mixed, and chaotic-mixed specimens (before
compression moulding). For this task, chloroform is utilized to dissolve the polystyrene matrix at
room temperature. The solutions are then treated with low energy ultrasonic equipment (Eumax,
Model UD50SH) for 5 minutes. A TEM setup is used to take images of the MWCNTs remaining
on the copper grid after the evaporation of chloroform. The lengths of the MWCNTs are
measured for 500 individual MWCNTs for each category using an image processing program
(ImageJ™software).
A compression moulding machine (CARVER, Model 4122) is used to fabricate rectangular
samples (30 × 20 × 1.8 mm) for characterization. Specimens were compression moulded for 10
minutes, while the temperature of platens and pressure were kept at 210°C and 38 MPa,
respectively. For each type of the composites, seven specimens were fabricated; and, electrical
resistivity and electromagnetic interference (EMI) shielding effectiveness (SE) measurements
were taken. The volume resistivity measurements were performed according to the ASTM 257-
75 standards using a DC resistivity meter (Mitsubishi, MCP-T610) connected to a four-pin
probe. The EMI SE and permittivity measurements of the samples were performed in the X-band
frequency range (8.2 to 12.4 GHz) utilizing a network analyzer (Agilent Technologies, E5071C).
3.2.2 Chaotic Mixing Design
The mixing chamber, rotors, and motors of the developed chaotic mixer are shown in
Figure 3.2.Thesystem’smixingchambercouldhandleapproximately30gofcomposites.Two
identical cylindrical rotors (40 mm diameter) are used because the cylindrical rotors provide low
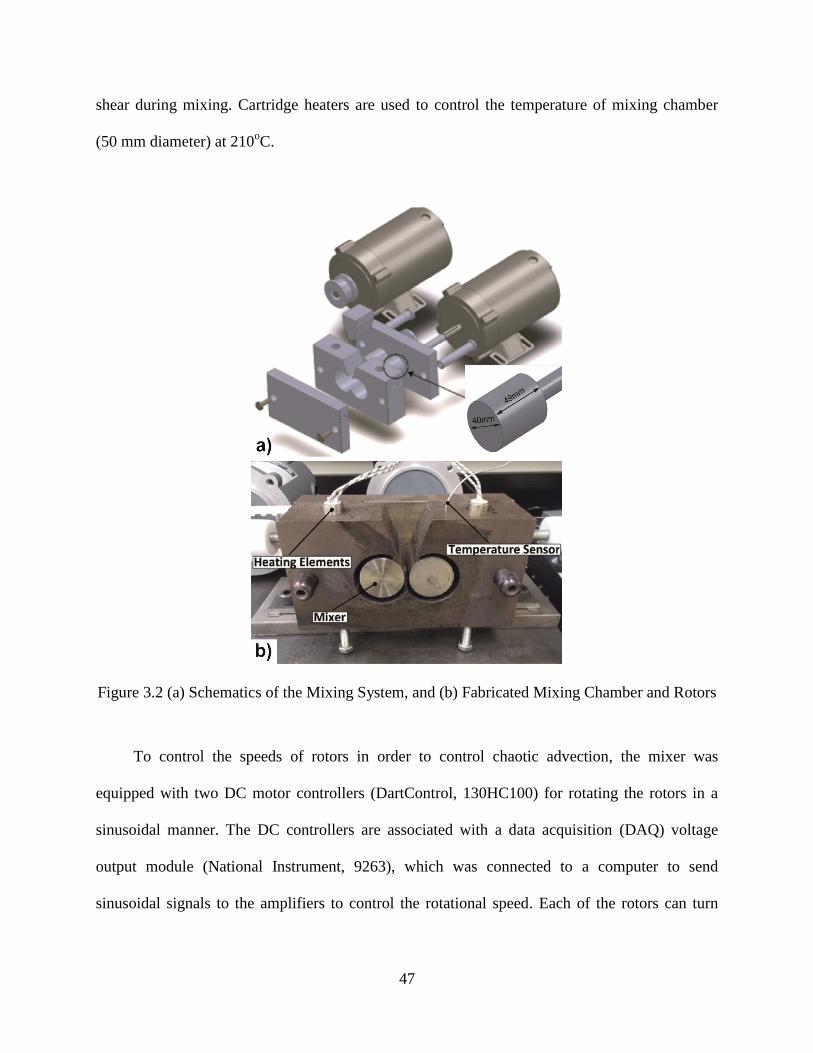
47
shear during mixing. Cartridge heaters are used to control the temperature of mixing chamber
(50 mm diameter) at 210oC.
Figure 3.2 (a) Schematics of the Mixing System, and (b) Fabricated Mixing Chamber and Rotors
To control the speeds of rotors in order to control chaotic advection, the mixer was
equipped with two DC motor controllers (DartControl, 130HC100) for rotating the rotors in a
sinusoidal manner. The DC controllers are associated with a data acquisition (DAQ) voltage
output module (National Instrument, 9263), which was connected to a computer to send
sinusoidal signals to the amplifiers to control the rotational speed. Each of the rotors can turn
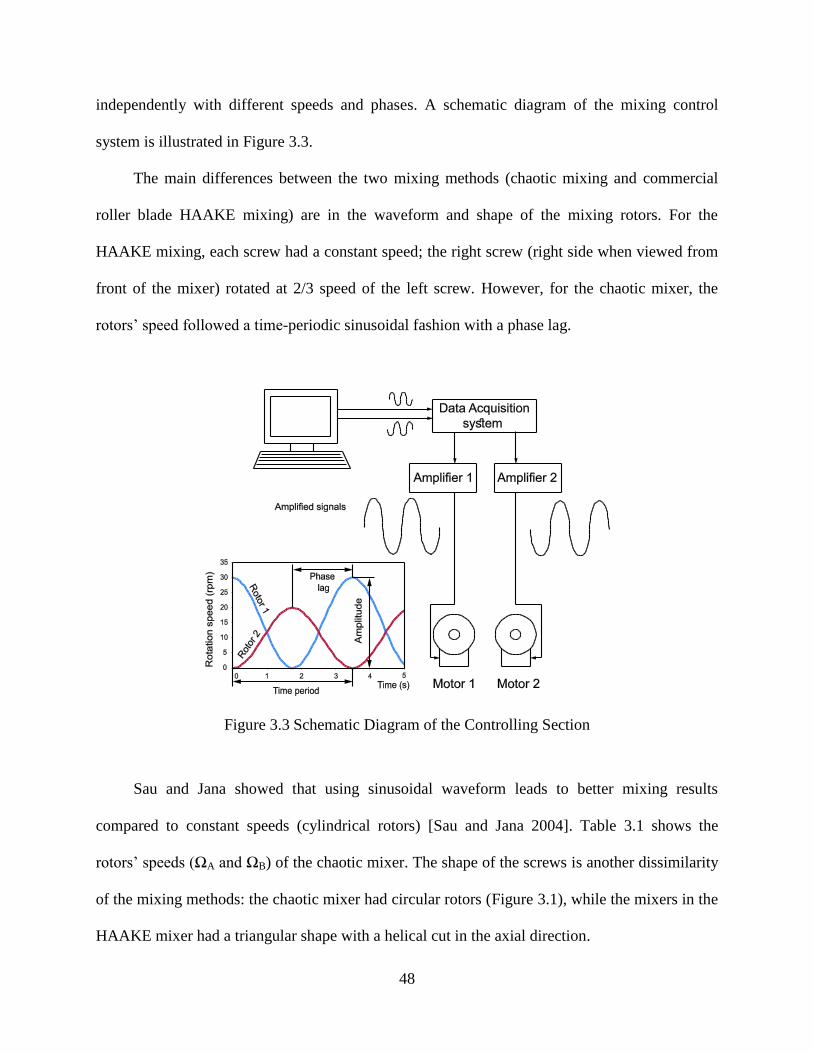
48
independently with different speeds and phases. A schematic diagram of the mixing control
system is illustrated in Figure 3.3.
The main differences between the two mixing methods (chaotic mixing and commercial
roller blade HAAKE mixing) are in the waveform and shape of the mixing rotors. For the
HAAKE mixing, each screw had a constant speed; the right screw (right side when viewed from
front of the mixer) rotated at 2/3 speed of the left screw. However, for the chaotic mixer, the
rotors’speedfollowedatime-periodic sinusoidal fashion with a phase lag.
Figure 3.3 Schematic Diagram of the Controlling Section
Sau and Jana showed that using sinusoidal waveform leads to better mixing results
compared to constant speeds (cylindrical rotors) [Sau and Jana 2004]. Table 3.1 shows the
rotors’speeds(ΩA andΩB) of the chaotic mixer. The shape of the screws is another dissimilarity
of the mixing methods: the chaotic mixer had circular rotors (Figure 3.1), while the mixers in the
HAAKE mixer had a triangular shape with a helical cut in the axial direction.
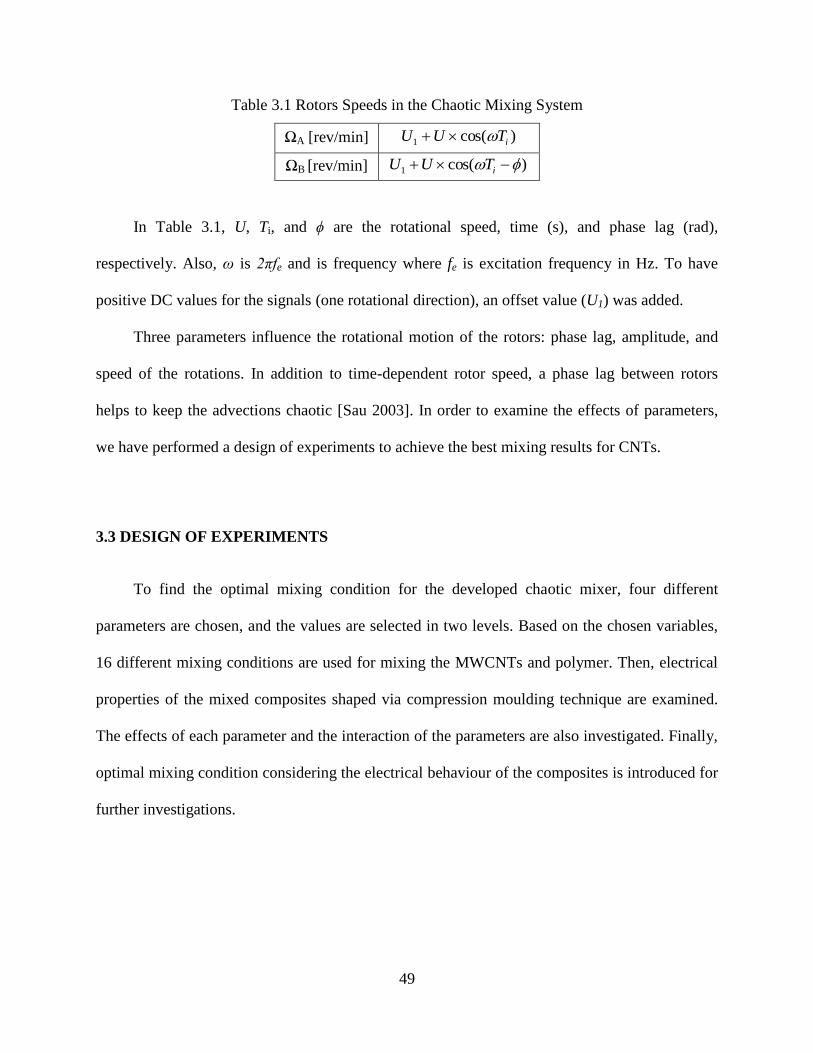
49
Table 3.1 Rotors Speeds in the Chaotic Mixing System
ΩA [rev/min] )cos(1 iTUU
ΩB [rev/min] )cos(1 iTUU
In Table 3.1, U, Ti, and ϕ are the rotational speed, time (s), and phase lag (rad),
respectively. Also, ω is 2πfe and is frequency where fe is excitation frequency in Hz. To have
positive DC values for the signals (one rotational direction), an offset value (U1) was added.
Three parameters influence the rotational motion of the rotors: phase lag, amplitude, and
speed of the rotations. In addition to time-dependent rotor speed, a phase lag between rotors
helps to keep the advections chaotic [Sau 2003]. In order to examine the effects of parameters,
we have performed a design of experiments to achieve the best mixing results for CNTs.
3.3 DESIGN OF EXPERIMENTS
To find the optimal mixing condition for the developed chaotic mixer, four different
parameters are chosen, and the values are selected in two levels. Based on the chosen variables,
16 different mixing conditions are used for mixing the MWCNTs and polymer. Then, electrical
properties of the mixed composites shaped via compression moulding technique are examined.
The effects of each parameter and the interaction of the parameters are also investigated. Finally,
optimal mixing condition considering the electrical behaviour of the composites is introduced for
further investigations.
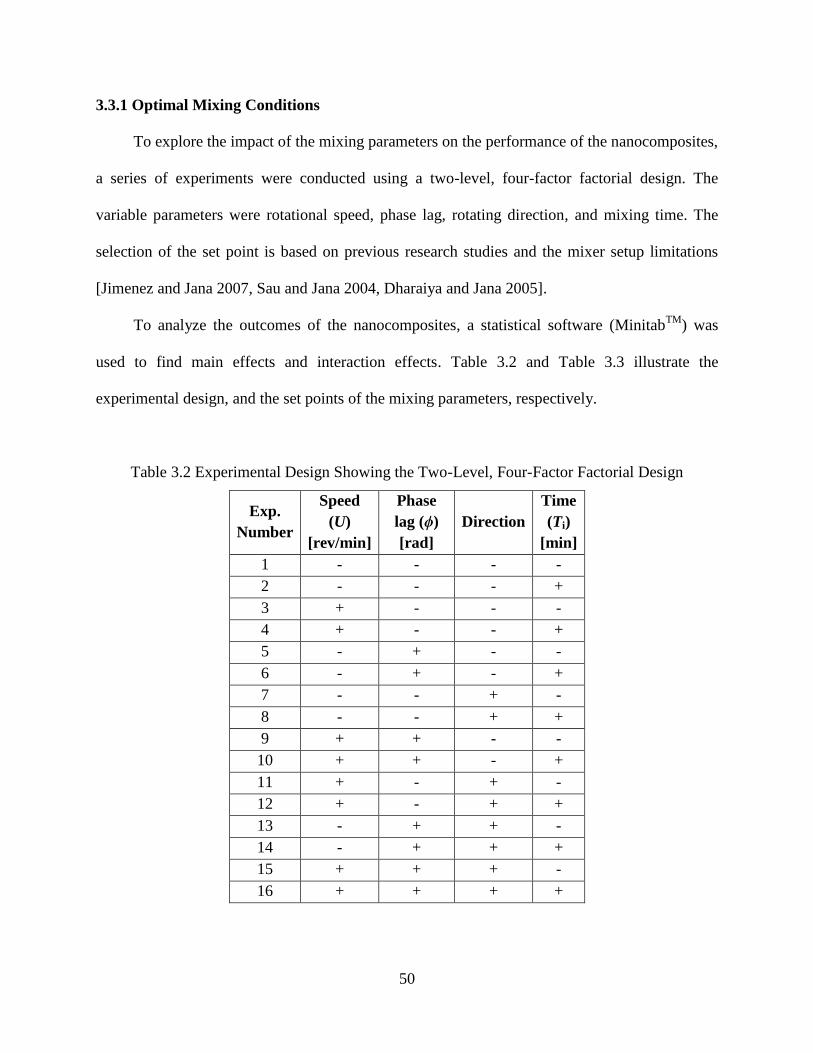
50
3.3.1 Optimal Mixing Conditions
To explore the impact of the mixing parameters on the performance of the nanocomposites,
a series of experiments were conducted using a two-level, four-factor factorial design. The
variable parameters were rotational speed, phase lag, rotating direction, and mixing time. The
selection of the set point is based on previous research studies and the mixer setup limitations
[Jimenez and Jana 2007, Sau and Jana 2004, Dharaiya and Jana 2005].
To analyze the outcomes of the nanocomposites, a statistical software (MinitabTM
) was
used to find main effects and interaction effects. Table 3.2 and Table 3.3 illustrate the
experimental design, and the set points of the mixing parameters, respectively.
Table 3.2 Experimental Design Showing the Two-Level, Four-Factor Factorial Design
Exp.
Number
Speed
(U)
[rev/min]
Phase
lag (ϕ)
[rad]
Direction
Time
(Ti)
[min]
1 - - - -
2 - - - +
3 + - - -
4 + - - +
5 - + - -
6 - + - +
7 - - + -
8 - - + +
9 + + - -
10 + + - +
11 + - + -
12 + - + +
13 - + + -
14 - + + +
15 + + + -
16 + + + +
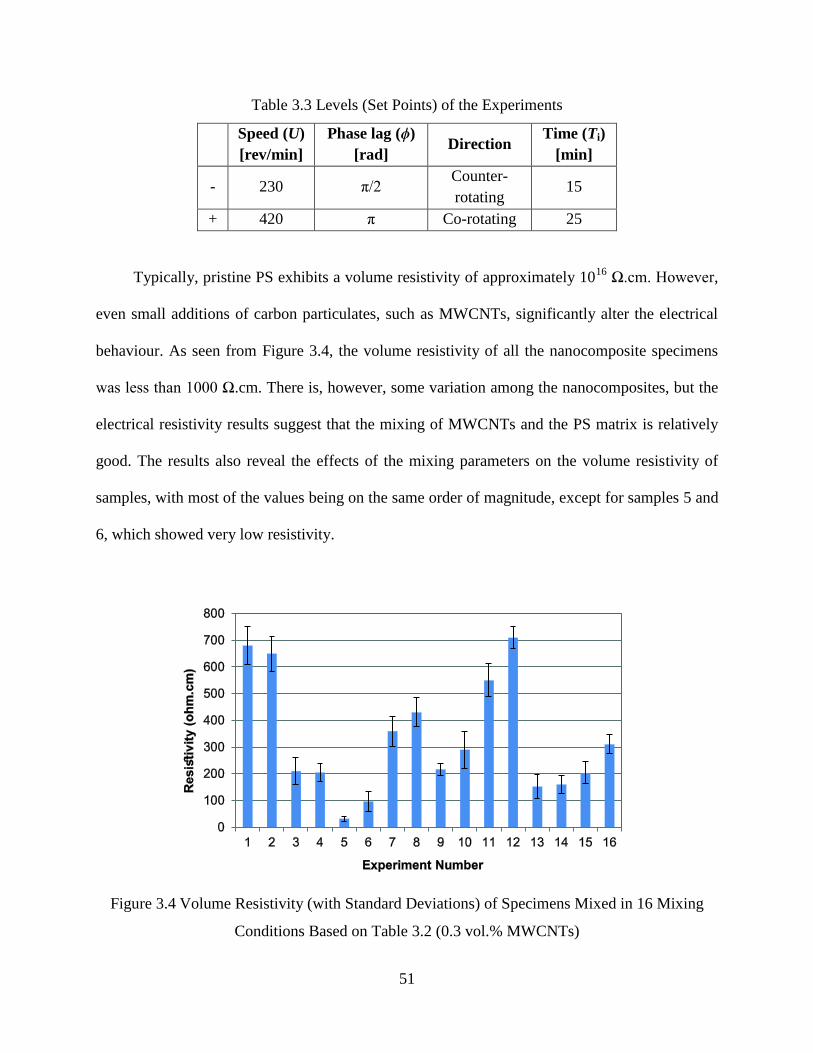
51
Table 3.3 Levels (Set Points) of the Experiments
Speed (U)
[rev/min]
Phase lag (ϕ)
[rad] Direction
Time (Ti)
[min]
- 230 π/2 Counter-
rotating 15
+ 420 π Co-rotating 25
Typically, pristine PS exhibits a volume resistivity of approximately 1016
Ω.cm.However,
even small additions of carbon particulates, such as MWCNTs, significantly alter the electrical
behaviour. As seen from Figure 3.4, the volume resistivity of all the nanocomposite specimens
waslessthan1000Ω.cm. There is, however, some variation among the nanocomposites, but the
electrical resistivity results suggest that the mixing of MWCNTs and the PS matrix is relatively
good. The results also reveal the effects of the mixing parameters on the volume resistivity of
samples, with most of the values being on the same order of magnitude, except for samples 5 and
6, which showed very low resistivity.
Figure 3.4 Volume Resistivity (with Standard Deviations) of Specimens Mixed in 16 Mixing
Conditions Based on Table 3.2 (0.3 vol.% MWCNTs)
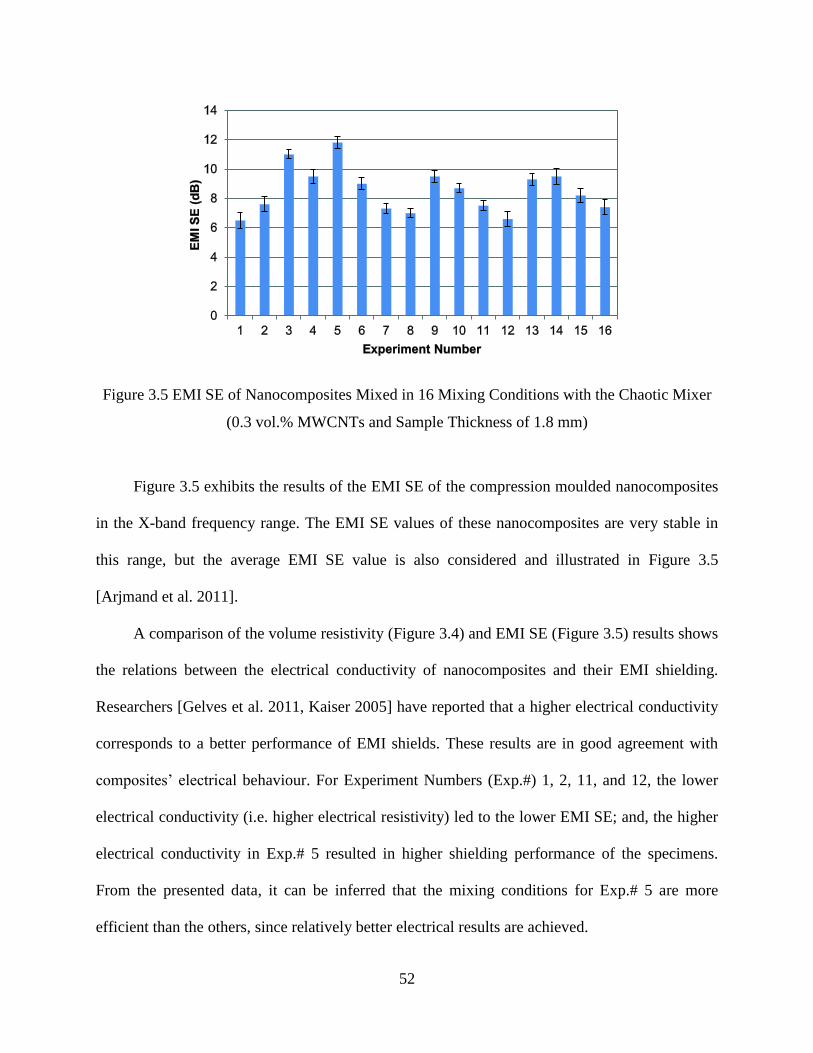
52
Figure 3.5 EMI SE of Nanocomposites Mixed in 16 Mixing Conditions with the Chaotic Mixer
(0.3 vol.% MWCNTs and Sample Thickness of 1.8 mm)
Figure 3.5 exhibits the results of the EMI SE of the compression moulded nanocomposites
in the X-band frequency range. The EMI SE values of these nanocomposites are very stable in
this range, but the average EMI SE value is also considered and illustrated in Figure 3.5
[Arjmand et al. 2011].
A comparison of the volume resistivity (Figure 3.4) and EMI SE (Figure 3.5) results shows
the relations between the electrical conductivity of nanocomposites and their EMI shielding.
Researchers [Gelves et al. 2011, Kaiser 2005] have reported that a higher electrical conductivity
corresponds to a better performance of EMI shields. These results are in good agreement with
composites’electricalbehaviour. For Experiment Numbers (Exp.#) 1, 2, 11, and 12, the lower
electrical conductivity (i.e. higher electrical resistivity) led to the lower EMI SE; and, the higher
electrical conductivity in Exp.# 5 resulted in higher shielding performance of the specimens.
From the presented data, it can be inferred that the mixing conditions for Exp.# 5 are more
efficient than the others, since relatively better electrical results are achieved.
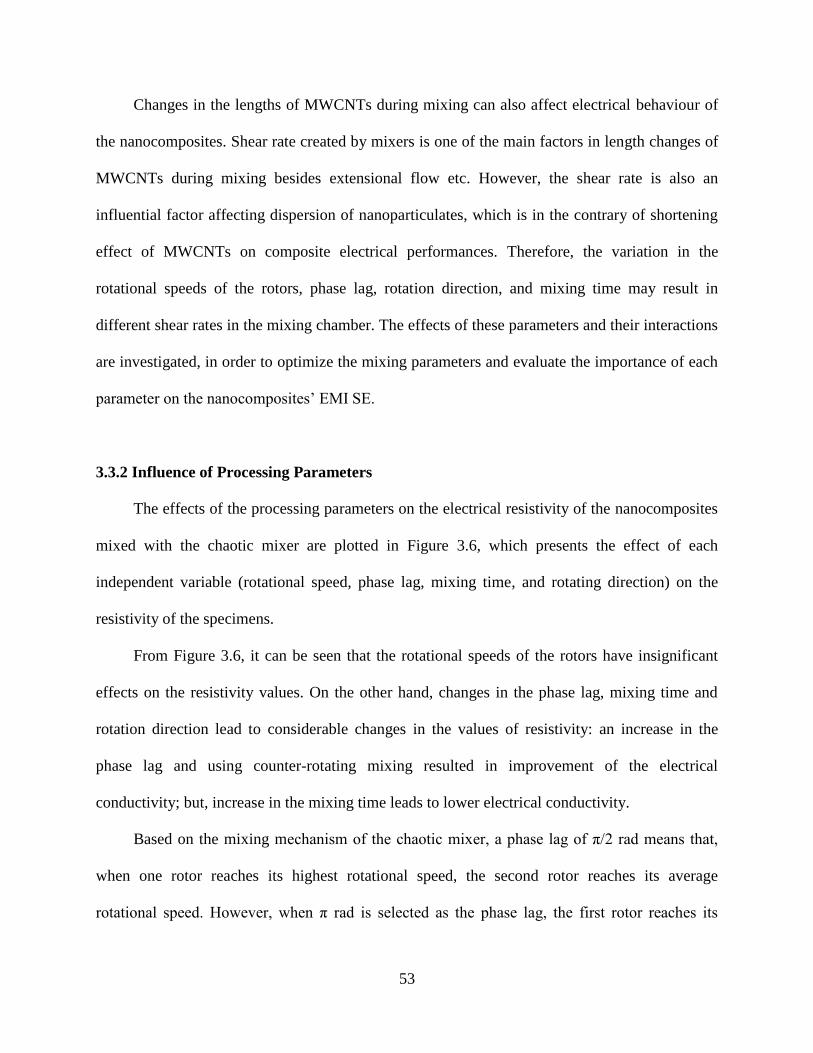
53
Changes in the lengths of MWCNTs during mixing can also affect electrical behaviour of
the nanocomposites. Shear rate created by mixers is one of the main factors in length changes of
MWCNTs during mixing besides extensional flow etc. However, the shear rate is also an
influential factor affecting dispersion of nanoparticulates, which is in the contrary of shortening
effect of MWCNTs on composite electrical performances. Therefore, the variation in the
rotational speeds of the rotors, phase lag, rotation direction, and mixing time may result in
different shear rates in the mixing chamber. The effects of these parameters and their interactions
are investigated, in order to optimize the mixing parameters and evaluate the importance of each
parameteronthenanocomposites’EMISE.
3.3.2 Influence of Processing Parameters
The effects of the processing parameters on the electrical resistivity of the nanocomposites
mixed with the chaotic mixer are plotted in Figure 3.6, which presents the effect of each
independent variable (rotational speed, phase lag, mixing time, and rotating direction) on the
resistivity of the specimens.
From Figure 3.6, it can be seen that the rotational speeds of the rotors have insignificant
effects on the resistivity values. On the other hand, changes in the phase lag, mixing time and
rotation direction lead to considerable changes in the values of resistivity: an increase in the
phase lag and using counter-rotating mixing resulted in improvement of the electrical
conductivity; but, increase in the mixing time leads to lower electrical conductivity.
Based on the mixing mechanismofthechaoticmixer,aphaselagofπ/2radmeansthat,
when one rotor reaches its highest rotational speed, the second rotor reaches its average
rotational speed.However,when π rad is selected as the phase lag, the first rotor reaches its
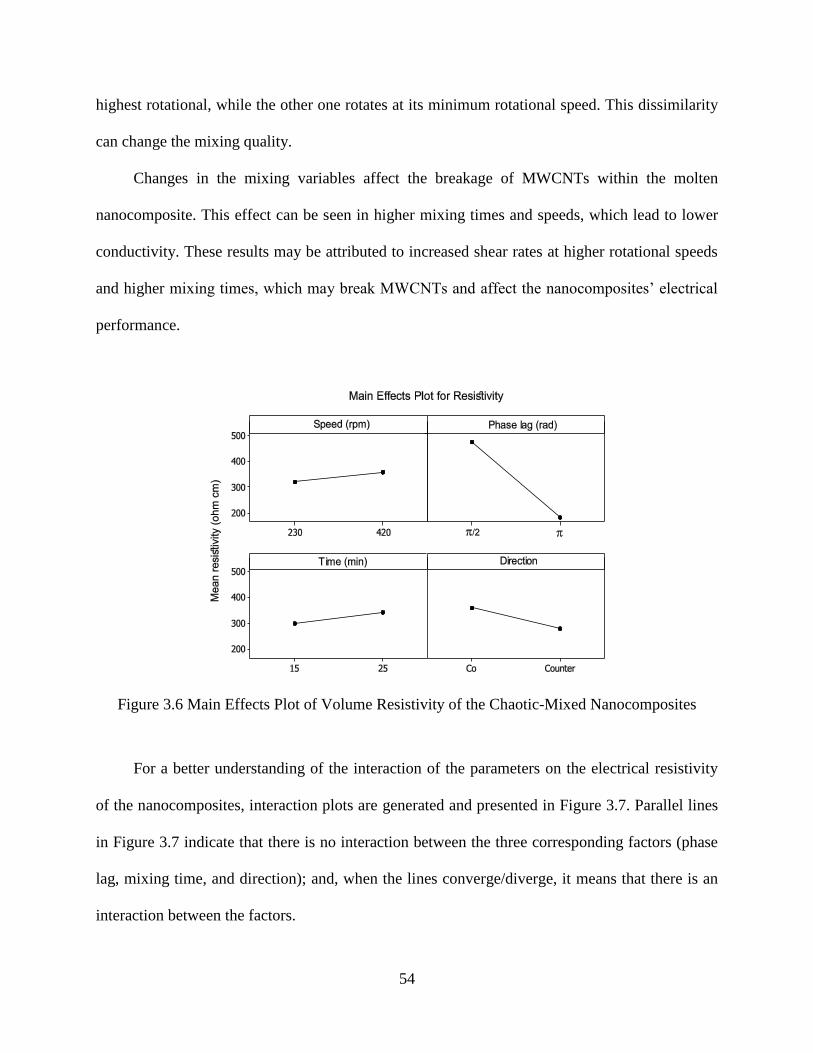
54
highest rotational, while the other one rotates at its minimum rotational speed. This dissimilarity
can change the mixing quality.
Changes in the mixing variables affect the breakage of MWCNTs within the molten
nanocomposite. This effect can be seen in higher mixing times and speeds, which lead to lower
conductivity. These results may be attributed to increased shear rates at higher rotational speeds
and higher mixingtimes,whichmaybreakMWCNTsandaffectthenanocomposites’electrical
performance.
Figure 3.6 Main Effects Plot of Volume Resistivity of the Chaotic-Mixed Nanocomposites
For a better understanding of the interaction of the parameters on the electrical resistivity
of the nanocomposites, interaction plots are generated and presented in Figure 3.7. Parallel lines
in Figure 3.7 indicate that there is no interaction between the three corresponding factors (phase
lag, mixing time, and direction); and, when the lines converge/diverge, it means that there is an
interaction between the factors.
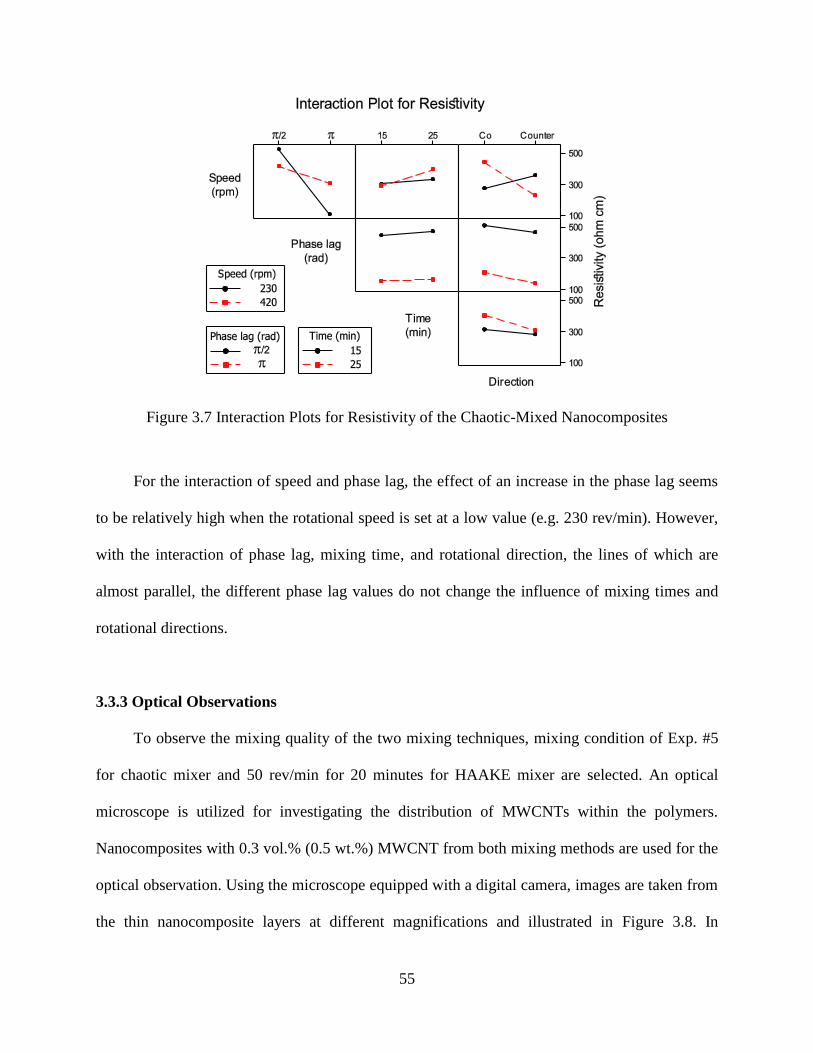
55
Figure 3.7 Interaction Plots for Resistivity of the Chaotic-Mixed Nanocomposites
For the interaction of speed and phase lag, the effect of an increase in the phase lag seems
to be relatively high when the rotational speed is set at a low value (e.g. 230 rev/min). However,
with the interaction of phase lag, mixing time, and rotational direction, the lines of which are
almost parallel, the different phase lag values do not change the influence of mixing times and
rotational directions.
3.3.3 Optical Observations
To observe the mixing quality of the two mixing techniques, mixing condition of Exp. #5
for chaotic mixer and 50 rev/min for 20 minutes for HAAKE mixer are selected. An optical
microscope is utilized for investigating the distribution of MWCNTs within the polymers.
Nanocomposites with 0.3 vol.% (0.5 wt.%) MWCNT from both mixing methods are used for the
optical observation. Using the microscope equipped with a digital camera, images are taken from
the thin nanocomposite layers at different magnifications and illustrated in Figure 3.8. In
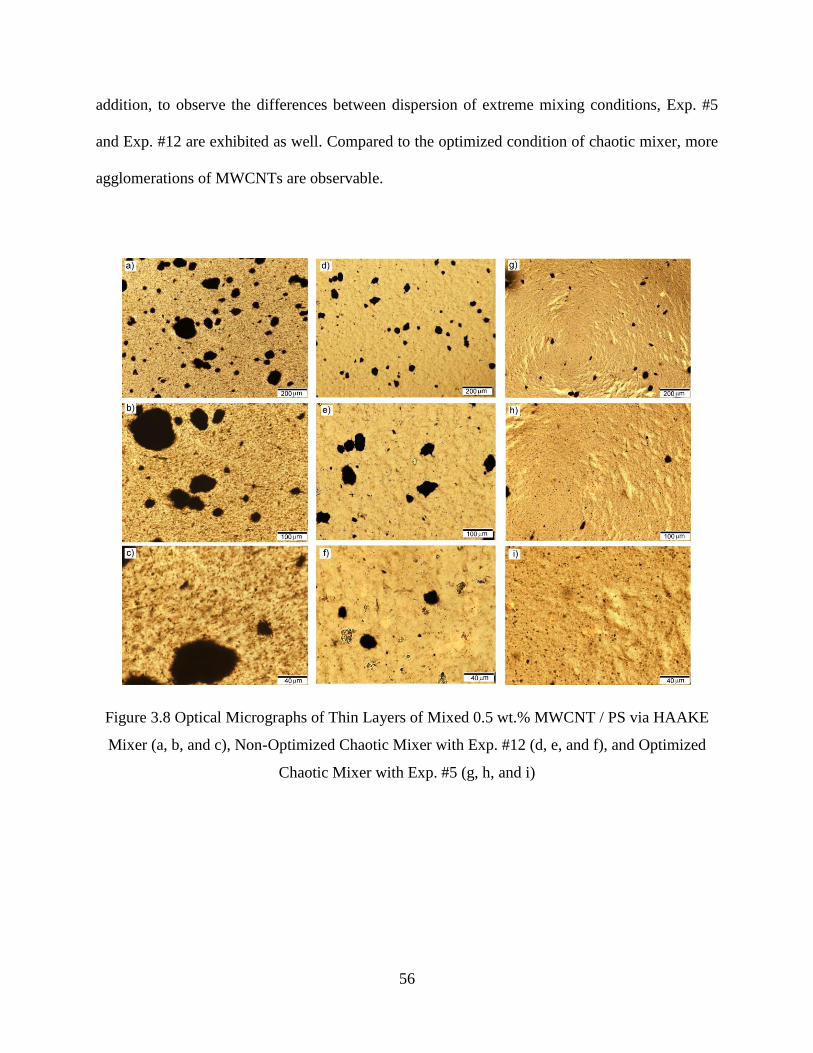
56
addition, to observe the differences between dispersion of extreme mixing conditions, Exp. #5
and Exp. #12 are exhibited as well. Compared to the optimized condition of chaotic mixer, more
agglomerations of MWCNTs are observable.
Figure 3.8 Optical Micrographs of Thin Layers of Mixed 0.5 wt.% MWCNT / PS via HAAKE
Mixer (a, b, and c), Non-Optimized Chaotic Mixer with Exp. #12 (d, e, and f), and Optimized
Chaotic Mixer with Exp. #5 (g, h, and i)
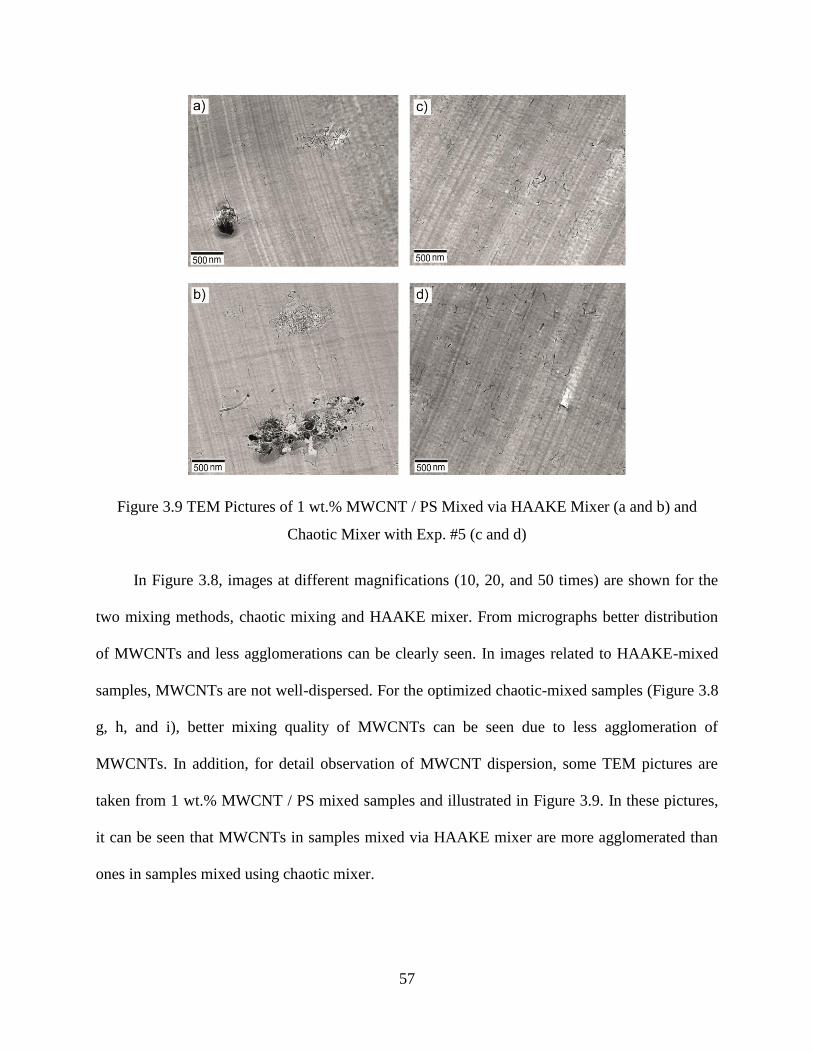
57
Figure 3.9 TEM Pictures of 1 wt.% MWCNT / PS Mixed via HAAKE Mixer (a and b) and
Chaotic Mixer with Exp. #5 (c and d)
In Figure 3.8, images at different magnifications (10, 20, and 50 times) are shown for the
two mixing methods, chaotic mixing and HAAKE mixer. From micrographs better distribution
of MWCNTs and less agglomerations can be clearly seen. In images related to HAAKE-mixed
samples, MWCNTs are not well-dispersed. For the optimized chaotic-mixed samples (Figure 3.8
g, h, and i), better mixing quality of MWCNTs can be seen due to less agglomeration of
MWCNTs. In addition, for detail observation of MWCNT dispersion, some TEM pictures are
taken from 1 wt.% MWCNT / PS mixed samples and illustrated in Figure 3.9. In these pictures,
it can be seen that MWCNTs in samples mixed via HAAKE mixer are more agglomerated than
ones in samples mixed using chaotic mixer.
58
3.3.4 MWCNT Length Distribution
To study the effects of different mixing techniques on length distribution of the MWCNTs,
TEM observations were utilized. Mixed specimens through chaotic mixer and HAAKE mixer are
dissolved in a solvent and the remaining MWCNT are collected for TEM observations.
Figure 3.10 presents the length distribution of MWCNTs for three conditions: before mixing
process, after chaotic mixing and after HAAKE mixing.
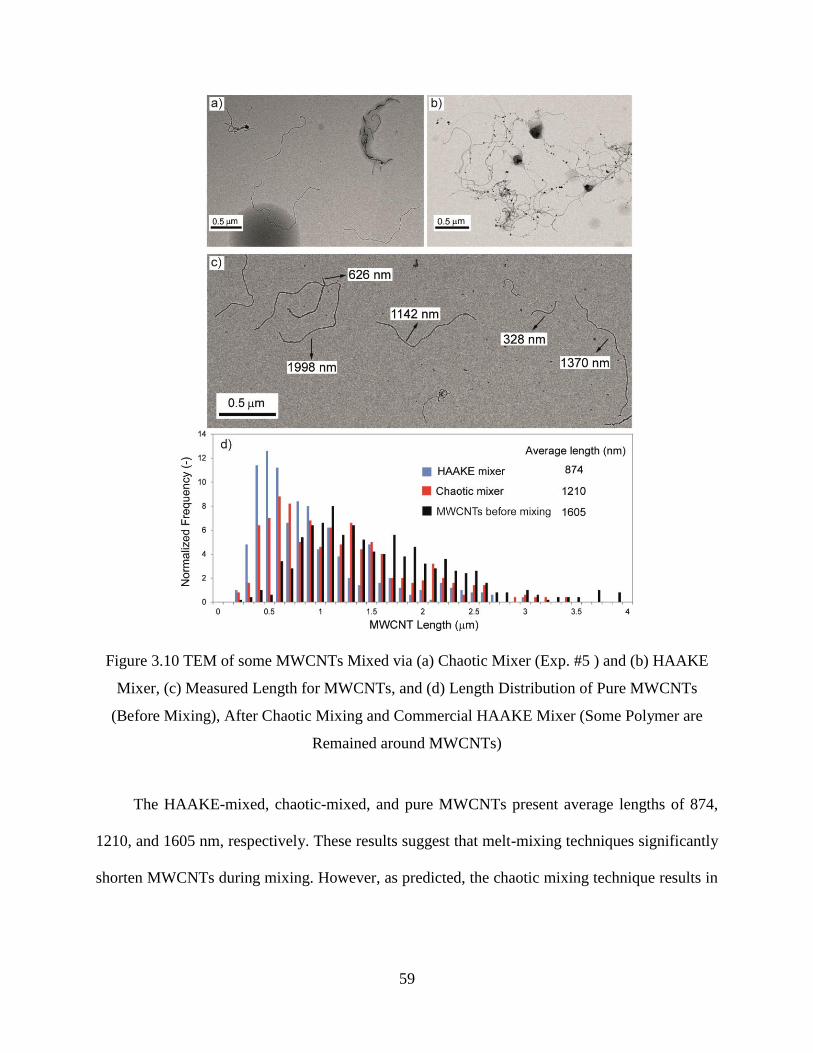
59
Figure 3.10 TEM of some MWCNTs Mixed via (a) Chaotic Mixer (Exp. #5 ) and (b) HAAKE
Mixer, (c) Measured Length for MWCNTs, and (d) Length Distribution of Pure MWCNTs
(Before Mixing), After Chaotic Mixing and Commercial HAAKE Mixer (Some Polymer are
Remained around MWCNTs)
The HAAKE-mixed, chaotic-mixed, and pure MWCNTs present average lengths of 874,
1210, and 1605 nm, respectively. These results suggest that melt-mixing techniques significantly
shorten MWCNTs during mixing. However, as predicted, the chaotic mixing technique results in
60
less MWCNT damage and breakage, as MWCNTs with higher lengths can be observed in the
TEM images.
3.4 CHAOTIC MIXER COMPARATIVE RESULTS
To evaluate the performance of the developed chaotic mixer in dispersing the MWCNTs
within the PS matrix, electrical properties of the mixed nanocomposites are investigated. Also, a
commercial mixer (HAAKE mixer) is employed for mixing the MWCNTs and polymers for
comparison. For both techniques, the same materials and same mixing temperature are chosen.
For the chaotic mixing technique, the optimal mixing condition which was achieved in the
previous section (Exp. #5) is selected.
3.4.1 Electrical Resistivity
In order to obtain a conductive path within a composite, a three-dimensional (3D) network
of conductive fillers is required. The percolation threshold is the filler concentration at which the
electrical resistance of the nanocomposite sharply drops by a few orders of magnitudes [Xu et al.
2005]. Statistical percolation theory predicts the relation between the electrical resistivity
(volume resistivity) of the composite and the filler concentration using Equation (3.1) [Bauhofer
and Kovacs 2009]:
).( cfc VfR (3.1)
61
where Rc is the composite volume resistivity; ρf is the volume resistivity of filler; and, f, Vc, and ζ
are the volume fraction of filler, percolation threshold, and critical exponent (1.4), respectively.
The critical exponent, ζ, depends only on the dimensionality of the space [Hu et al. 2004]. By
taking the logarithm of both sides of Equation (3.1), we obtain Equation (3.2):
)(.)()( cfc VfLogLogRLog (3.2)
Using linear regression of Log(Rc) versus Log(f-Vc), the percolation threshold and the
critical exponent can be found. A lower percolation threshold results if the nanofillers are well-
dispersed and have high aspect ratio [Bauhofer and Kovacs 2009].
Figure 3.11 illustrates the volume resistivity of the nanocomposites mixed with the chaotic
mixer and commercial HAAKE melt mixer. For the chaotic-mixed specimens, Exp.# 5 is
selectedwitharotationalspeedof230rev/min,aphaselagofπ,acounter-rotating direction, and
a mixing time of 15 minutes. Specimens mixed via the chaotic mixer show a lower percolation
threshold, 0.12 vol.%, than that obtained using the HAAKE mixer, 0.29 vol.%. Compared to
previous studies on the electrical conductivity of MWCNT / PS nanocomposites prepared with
melt-mixing and solution mixing techniques, the chaotic-mixed nanocomposites exhibit a lower
percolation threshold, which indicates less damage to the MWCNTs and better dispersion within
the polymeric matrix [Andrews et al. 2002, Kim et al. 2007, Yang et al. 2008, Sun et al. 2010,
Kara et al. 2010, Mazinani et al. 2009].
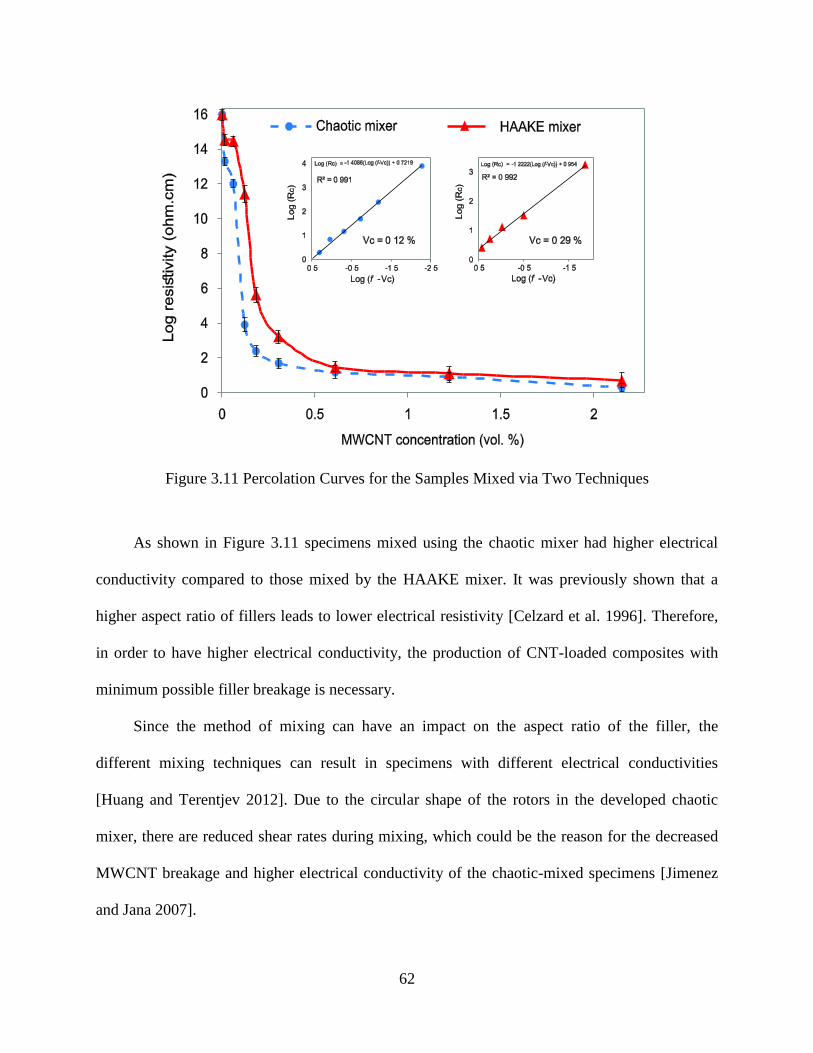
62
Figure 3.11 Percolation Curves for the Samples Mixed via Two Techniques
As shown in Figure 3.11 specimens mixed using the chaotic mixer had higher electrical
conductivity compared to those mixed by the HAAKE mixer. It was previously shown that a
higher aspect ratio of fillers leads to lower electrical resistivity [Celzard et al. 1996]. Therefore,
in order to have higher electrical conductivity, the production of CNT-loaded composites with
minimum possible filler breakage is necessary.
Since the method of mixing can have an impact on the aspect ratio of the filler, the
different mixing techniques can result in specimens with different electrical conductivities
[Huang and Terentjev 2012]. Due to the circular shape of the rotors in the developed chaotic
mixer, there are reduced shear rates during mixing, which could be the reason for the decreased
MWCNT breakage and higher electrical conductivity of the chaotic-mixed specimens [Jimenez
and Jana 2007].
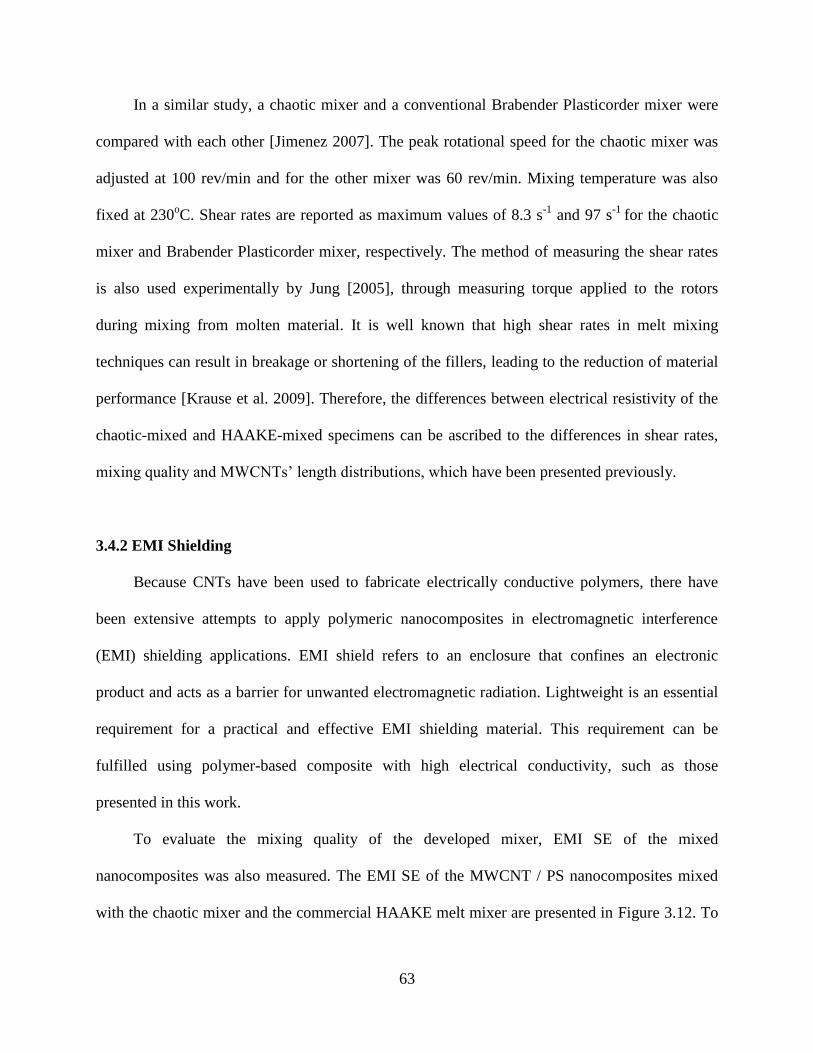
63
In a similar study, a chaotic mixer and a conventional Brabender Plasticorder mixer were
compared with each other [Jimenez 2007]. The peak rotational speed for the chaotic mixer was
adjusted at 100 rev/min and for the other mixer was 60 rev/min. Mixing temperature was also
fixed at 230oC. Shear rates are reported as maximum values of 8.3 s
-1 and 97 s
-1 for the chaotic
mixer and Brabender Plasticorder mixer, respectively. The method of measuring the shear rates
is also used experimentally by Jung [2005], through measuring torque applied to the rotors
during mixing from molten material. It is well known that high shear rates in melt mixing
techniques can result in breakage or shortening of the fillers, leading to the reduction of material
performance [Krause et al. 2009]. Therefore, the differences between electrical resistivity of the
chaotic-mixed and HAAKE-mixed specimens can be ascribed to the differences in shear rates,
mixingqualityandMWCNTs’lengthdistributions,whichhave been presented previously.
3.4.2 EMI Shielding
Because CNTs have been used to fabricate electrically conductive polymers, there have
been extensive attempts to apply polymeric nanocomposites in electromagnetic interference
(EMI) shielding applications. EMI shield refers to an enclosure that confines an electronic
product and acts as a barrier for unwanted electromagnetic radiation. Lightweight is an essential
requirement for a practical and effective EMI shielding material. This requirement can be
fulfilled using polymer-based composite with high electrical conductivity, such as those
presented in this work.
To evaluate the mixing quality of the developed mixer, EMI SE of the mixed
nanocomposites was also measured. The EMI SE of the MWCNT / PS nanocomposites mixed
with the chaotic mixer and the commercial HAAKE melt mixer are presented in Figure 3.12. To
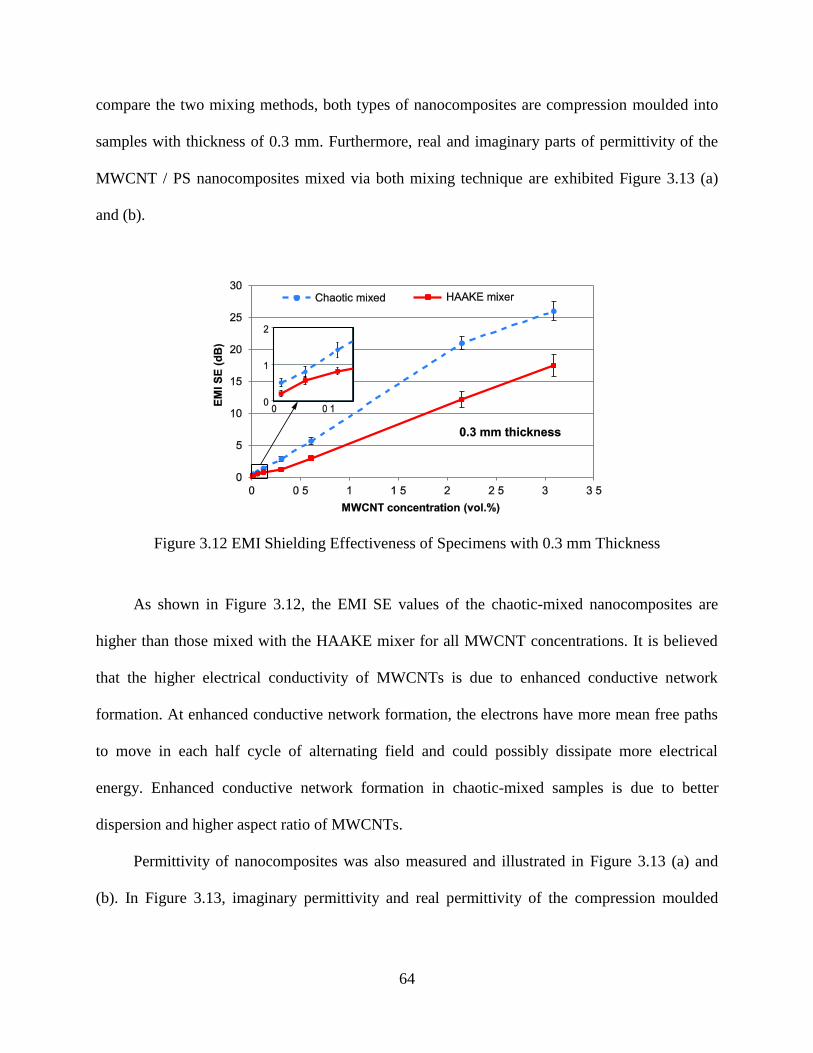
64
compare the two mixing methods, both types of nanocomposites are compression moulded into
samples with thickness of 0.3 mm. Furthermore, real and imaginary parts of permittivity of the
MWCNT / PS nanocomposites mixed via both mixing technique are exhibited Figure 3.13 (a)
and (b).
Figure 3.12 EMI Shielding Effectiveness of Specimens with 0.3 mm Thickness
As shown in Figure 3.12, the EMI SE values of the chaotic-mixed nanocomposites are
higher than those mixed with the HAAKE mixer for all MWCNT concentrations. It is believed
that the higher electrical conductivity of MWCNTs is due to enhanced conductive network
formation. At enhanced conductive network formation, the electrons have more mean free paths
to move in each half cycle of alternating field and could possibly dissipate more electrical
energy. Enhanced conductive network formation in chaotic-mixed samples is due to better
dispersion and higher aspect ratio of MWCNTs.
Permittivity of nanocomposites was also measured and illustrated in Figure 3.13 (a) and
(b). In Figure 3.13, imaginary permittivity and real permittivity of the compression moulded
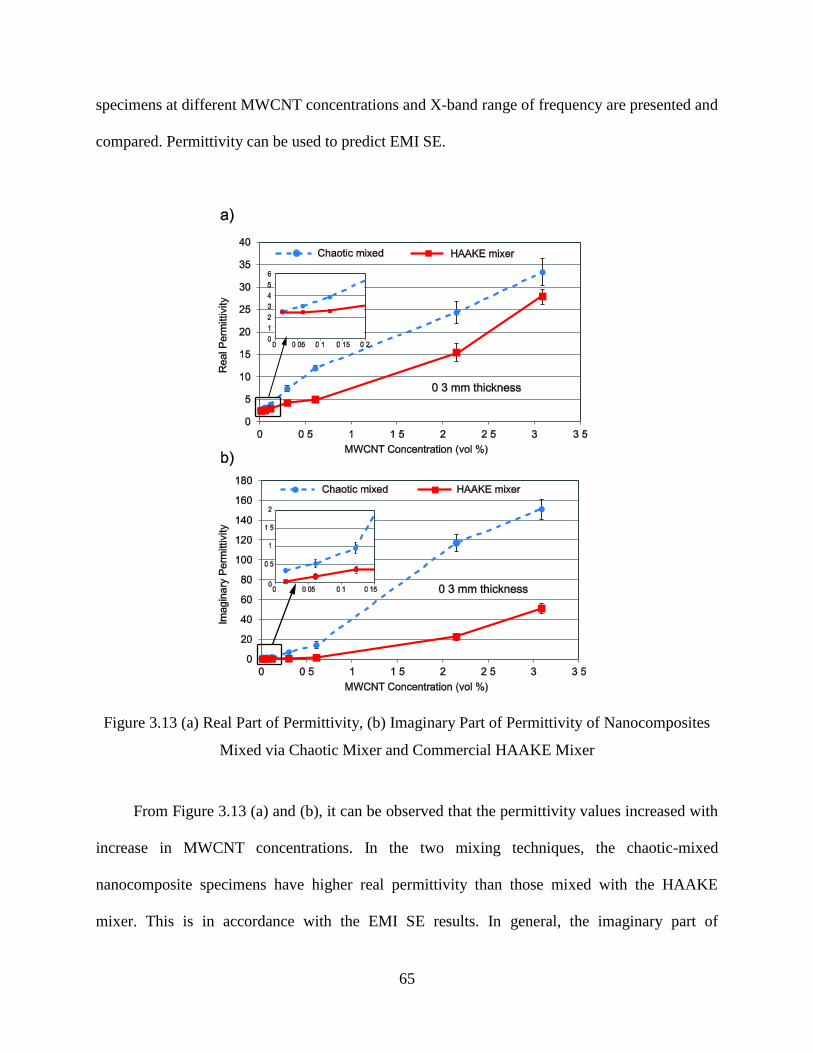
65
specimens at different MWCNT concentrations and X-band range of frequency are presented and
compared. Permittivity can be used to predict EMI SE.
Figure 3.13 (a) Real Part of Permittivity, (b) Imaginary Part of Permittivity of Nanocomposites
Mixed via Chaotic Mixer and Commercial HAAKE Mixer
From Figure 3.13 (a) and (b), it can be observed that the permittivity values increased with
increase in MWCNT concentrations. In the two mixing techniques, the chaotic-mixed
nanocomposite specimens have higher real permittivity than those mixed with the HAAKE
mixer. This is in accordance with the EMI SE results. In general, the imaginary part of
66
permittivity in CNT nanocomposites is rooted in polarization loss such as distortional and
interfacial, and/or ohmic loss. More MWCNT content is equivalent to more mobile charge
carriers (ohmic loss) and nanocapacitors (polarization loss), both of which increase the
imaginary permittivity [Arjmand et al. 2013]. Furthermore, having MWCNTs with higher aspect
ratio may lead to more ohmic loss which could possibly be the reason for very higher imaginary
permittivity of chaotic-mixed specimens compared to HAAKE-mixed specimens (150 and 50 for
3.1 vol.%, respectively).
3.5 SUMMARY
A chaotic mixing system was developed for the mixing and dispersion of nanoparticulates
within polymers. To create chaotic advection during mixing, two DC controllers connected to a
computer via a data acquisition system were utilized. The two rotors rotated independently with
a sinusoidal variation of speed and created chaotic advection in the mixing chamber, which led to
the dispersion of nanoparticulates in polymer.
To evaluate the efficiency of the mixing system, PS was mixed with 0.3 vol.% MWCNTs
in different mixing conditions. The process was then optimized considering the volume
resistivity of the compression moulded nanocomposites. To optimize the chaotic mixer, it was
assumed that the selected parameters (rotational speed, phase lag, mixing time, and rotational
direction) are the main ones, which means changes in these parameters lead to changes in mixing
quality of MWCNTs and polymer. It was observed that the most influential parameter was the
phase lag. In addition to phase lag, mixing time and rotational direction were seen as important
parameters. Based on the analyses, the optimum mixing condition for the 0.3 vol.% MWCNT /
67
PS nanocomposites was rotational speed of 230 rev/min, a phase lag of π, a counter-rotating
direction, and a mixing time of 15 minutes.
To compare the developed chaotic mixer with a commercial melt mixer, the same materials
were mixed using a commercial HAAKE melt mixer. The volume resistivity and EMI SE results
revealed that the chaotic mixer produced nanocomposites with higher electrical conductivity
values and EMI shielding capabilities. The better performance of the chaotic mixer over the
commercial mixer may be attributed to the dissimilarities of the two selected mixing methods.
The circular shape of the rotors and the sinusoidal rotational speeds of the chaotic mixing system
were the main differences from the commercial HAAKE mixer. Differences in MWCNTs’
length distribution were investigated as an important parameter that affected the electrical
behaviour of MWCNT / PS nanocomposites. Due to the described differences, a higher mixing
quality and reduced damage and breakage of the MWCNTs may be the reasons for better
electrical results in the developed chaotic mixer. In the next chapter, it is aimed to investigate the
effects of addition of MWCNTs on the electrical and thermal conductivity of nanocomposites
through modeling. The influences of differences in the length of MWCNTs are studied through
the developed electrical conductivity model. Moreover, alignment and combination of inclusions
with different shapes are included and analyzed in the thermal conductivity model.
68
CHAPTER 4. MODELING OF ELECTRICAL AND THERMAL
BEHAVIOURS OF NANOCOMPOSITES
4.1 INTRODUCTION
Nanoparticulates with superior mechanical, electrical, and thermal properties can enhance
the properties of the polymeric matrices. High electrical conductivity and aspect ratio of up to
several thousands of nanoparticulates such as CNTs enable the manufacture of conductive
polymer composites. High electrical conductivity can be achieved by reaching a percolation
threshold through the addition of a slight amount of CNTs [Sandler et al. 2003]. Similarly, for
the thermal conductivity, nanoscale inclusions like CNTs, GNPs, and hBNs with high aspect
ratios and thermal conductivities can increase the thermal conductivity of the polymeric
matrices. However, the most widely utilized and investigated nanoparticulates for thermal
conductivity enhancement of polymers are CNTs, which form percolating network at very low
loadings [Han and Fina 2011].
One of the main approaches for further improving the properties of nanocomposites is
through alignment of inclusions by taking advantage if their exceptional geometries [Khan et al.
2013, Gupta et al. 2016]. Hybridizing nanoparticulates with diverse geometries can also
significantly progress the electrical and thermal conductivity of composites at low
concentrations. For instance, combining 2D (GNP or hBN) and 1D (CNT) inclusions together
have shown considerable effects on electrical and thermal performances of the polymer
composites [Kumar et al. 2010].
69
Modeling of the thermal and electrical behaviours of composites filled with
nanoparticulates is the main way for predicting the behaviours of the composites and material
design and selection. There are several numerical and theoretical methods for predicting the
thermal and electrical properties of nanocomposites [Zhou, Zhang et al. 2007, Wang et al. 2008,
Bao et al. 2011, Hu et al. 2008]. The currently developed models have several limitations such as
lowaccuracy,theinabilityofreflectingthefillers’orientationsandhybridizing,andconsiderable
runtime and calculations [Guthy et al. 2007, Duong et al. 2009, Bao et al. 2013, Sun et al. 2008].
In this study, two models for predicting electrical and thermal conductivities of nanocomposites
filled with nanoparticulates are presented. The models can reflect the effects of geometry,
alignment, and synergy of different inclusions on the electrical and thermal behaviours of
composites.
In this chapter, the developed and existing models for predicting properties of the final
nanocomposites are described. Two developed models for predicting the electrical and thermal
conductivity of nanocomposites are explained in detail. Both models are based on random walk
method on finite networks. In these models, electrical and thermal particles are imported to a
complex circuit from highest potential nodes. The introduced particles are free to move within
the network until they reach nodes with the lowest electrical or thermal potential. The number of
passing walkers corresponds to the electrical or thermal conductivity of the nanocomposite. For
the electrical conductivity modeling, CNT composites are studied, and the effects of CNTs with
different average lengths are investigated and compared with the previous research works. For
the thermal conductivity modeling, the effects of the orientation and addition of CNTs and
hexagonal boron nitride (hBN) are studied. The developed model is compared with a theoretical
model (EMA) and experimental results.
70
The outcomes of this chapter are published in Composites Part B: Engineering and Journal
of Thermoplastic Composite Materialsentitled“Thermal Conductivity of Carbon Nanotube and
Hexagonal Boron Nitride Polymer Composites”and“Effects of Foaming through Leaching on
the Electrical Behavior of Polystyrene/Carbon Nanotube Composites”,respectively.
4.2 ELECTRICAL RESISTIVITY MODELING
In this section, the electrical conductivity model developed based on random walk method
is described. First, an introduction to the modeling of CNT composites is presented then the
developed electrical conductivity model is explained in detail. The presented model is compared
with the previously published models and experiments. Moreover, the effects of different CNT
loadings and average lengths, as studied in Chapter 3, are evaluated using the model.
4.2.1 Introduction to Electrical Conductivity Modeling
Due to their high aspect ratio, low density, and outstanding electrical, thermal and
mechanical properties, CNTs have recently been established as an effective and desirable
additive; and, there has been growth in the incorporation of CNTs in thermoplastics [Mahmoodi
et al. 2012]. The influence of CNTs on the electrical conductivity of polymers is significant,
particularly compared to conventional additives [Shui and Chung 2000, Annadurai et al. 2002].
To attain high electrical conductivity, the uniform dispersion of the CNTs in a polymeric matrix
is critical [Tjong et al. 2007]. However, due to strong van der Waals interactions between CNTs,
their dispersion and alignment in polymers have been an issue of concern in the fabrication of
electrically conductive composites [Chatterjee et al. 2011]. The very high aspect ratio of CNTs is
also a challenge in achieving homogeneous dispersion.
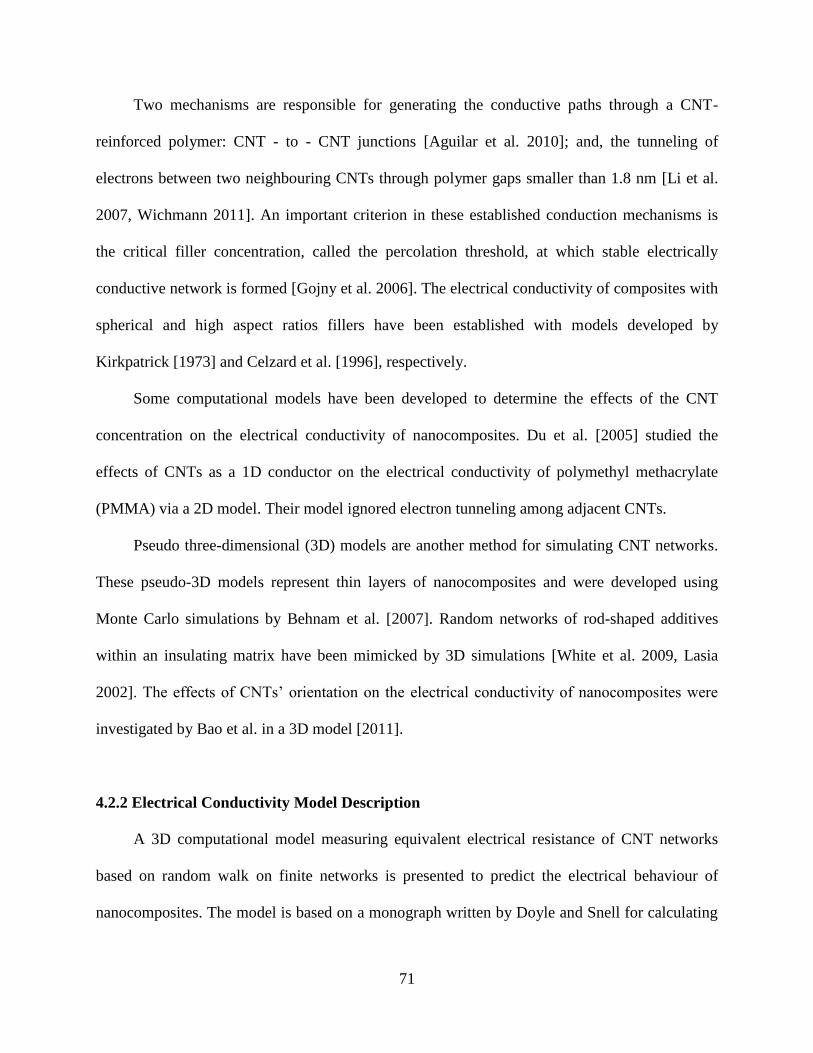
71
Two mechanisms are responsible for generating the conductive paths through a CNT-
reinforced polymer: CNT - to - CNT junctions [Aguilar et al. 2010]; and, the tunneling of
electrons between two neighbouring CNTs through polymer gaps smaller than 1.8 nm [Li et al.
2007, Wichmann 2011]. An important criterion in these established conduction mechanisms is
the critical filler concentration, called the percolation threshold, at which stable electrically
conductive network is formed [Gojny et al. 2006]. The electrical conductivity of composites with
spherical and high aspect ratios fillers have been established with models developed by
Kirkpatrick [1973] and Celzard et al. [1996], respectively.
Some computational models have been developed to determine the effects of the CNT
concentration on the electrical conductivity of nanocomposites. Du et al. [2005] studied the
effects of CNTs as a 1D conductor on the electrical conductivity of polymethyl methacrylate
(PMMA) via a 2D model. Their model ignored electron tunneling among adjacent CNTs.
Pseudo three-dimensional (3D) models are another method for simulating CNT networks.
These pseudo-3D models represent thin layers of nanocomposites and were developed using
Monte Carlo simulations by Behnam et al. [2007]. Random networks of rod-shaped additives
within an insulating matrix have been mimicked by 3D simulations [White et al. 2009, Lasia
2002].TheeffectsofCNTs’orientationon theelectricalconductivityofnanocompositeswere
investigated by Bao et al. in a 3D model [2011].
4.2.2 Electrical Conductivity Model Description
A 3D computational model measuring equivalent electrical resistance of CNT networks
based on random walk on finite networks is presented to predict the electrical behaviour of
nanocomposites. The model is based on a monograph written by Doyle and Snell for calculating
72
electrical current in simple networks [2006]. A random walker in this method is simulated by a
particle in electrical network as done in an earlier study for simple electrical networks [Li 2011].
In the implemented model, particles are imported to the circuit from highest potential nodes
called source (Figure 4.1). Such particles move through the network to the lowest potential
points called sink or drain. The pathway chosen by the particles depends upon the probability of
each possible path connected from one node to another. The model counts the number of
particles and calculates the corresponding current and voltage of each node considering the
whole number of particles. The total electrical current passing through CNT network is then
computed. Finally, by having the calculated electrical current, resistivity value of the objective
CNT network is calculated.
Figure 4.1 Schematic of using the Random Walk Model for Measuring the Resistivity of CNT
Networks
In CNT based nanocomposites, each CNT can have a connection with a neighbouring CNT
by either direct contact or electron tunneling. The electron tunneling effect is possible if the
insulating layer of the polymer is sufficiently thin; however, the resistance offered is certainly
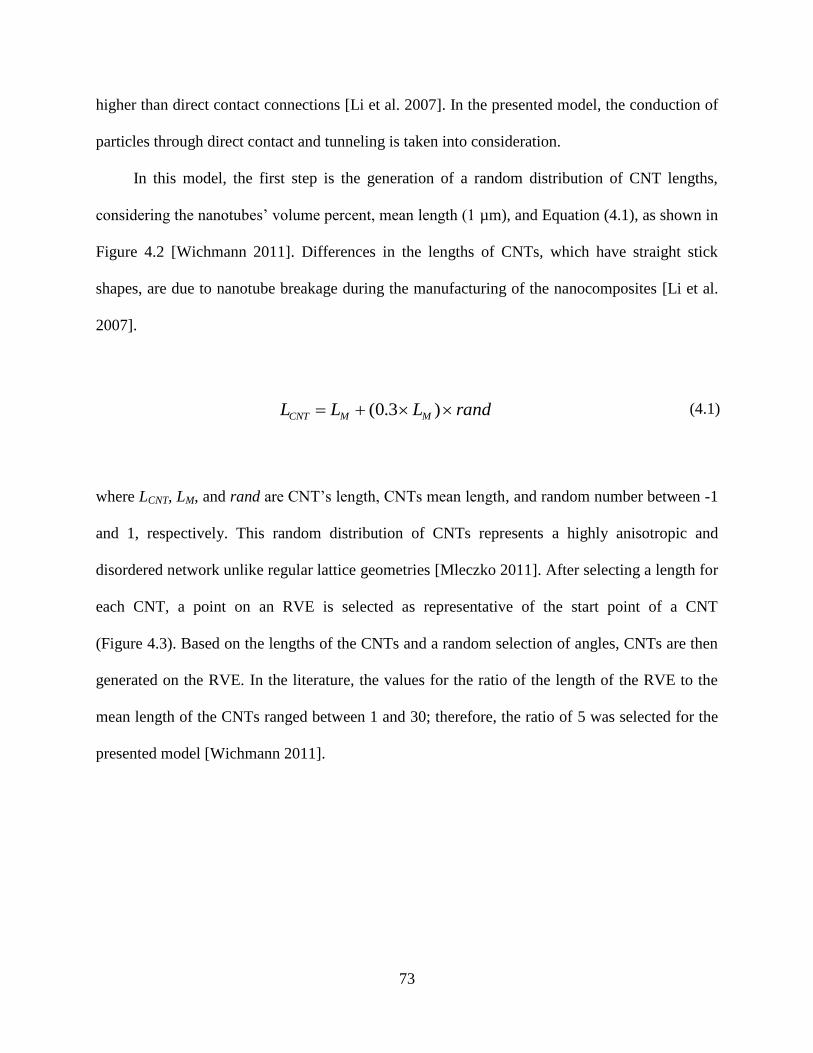
73
higher than direct contact connections [Li et al. 2007]. In the presented model, the conduction of
particles through direct contact and tunneling is taken into consideration.
In this model, the first step is the generation of a random distribution of CNT lengths,
consideringthenanotubes’volumepercent,meanlength(1µm), and Equation (4.1), as shown in
Figure 4.2 [Wichmann 2011]. Differences in the lengths of CNTs, which have straight stick
shapes, are due to nanotube breakage during the manufacturing of the nanocomposites [Li et al.
2007].
randLLL MMCNT )3.0( (4.1)
where LCNT, LM, and rand areCNT’slength,CNTsmeanlength, and random number between -1
and 1, respectively. This random distribution of CNTs represents a highly anisotropic and
disordered network unlike regular lattice geometries [Mleczko 2011]. After selecting a length for
each CNT, a point on an RVE is selected as representative of the start point of a CNT
(Figure 4.3). Based on the lengths of the CNTs and a random selection of angles, CNTs are then
generated on the RVE. In the literature, the values for the ratio of the length of the RVE to the
mean length of the CNTs ranged between 1 and 30; therefore, the ratio of 5 was selected for the
presented model [Wichmann 2011].
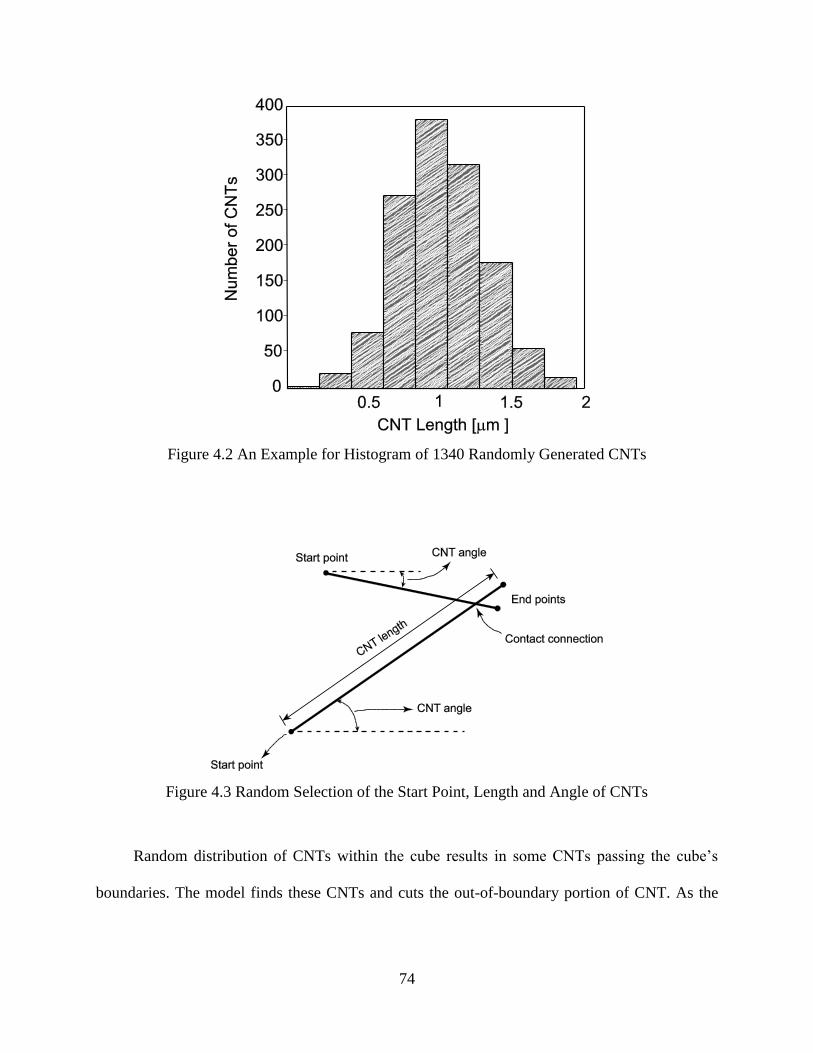
74
Figure 4.2 An Example for Histogram of 1340 Randomly Generated CNTs
Figure 4.3 Random Selection of the Start Point, Length and Angle of CNTs
Random distribution of CNTs within the cube results in someCNTs passing the cube’s
boundaries. The model finds these CNTs and cuts the out-of-boundary portion of CNT. As the
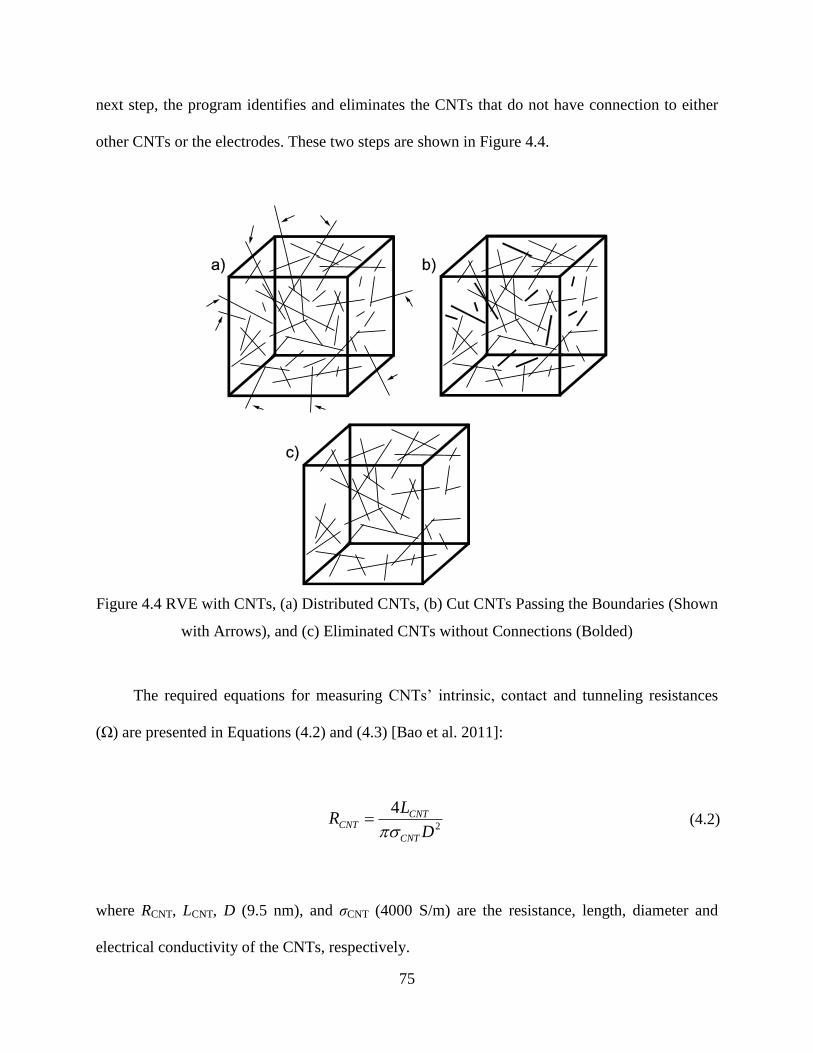
75
next step, the program identifies and eliminates the CNTs that do not have connection to either
other CNTs or the electrodes. These two steps are shown in Figure 4.4.
Figure 4.4 RVE with CNTs, (a) Distributed CNTs, (b) Cut CNTs Passing the Boundaries (Shown
with Arrows), and (c) Eliminated CNTs without Connections (Bolded)
The required equations for measuring CNTs’ intrinsic, contact and tunneling resistances
(Ω) are presented in Equations (4.2) and (4.3) [Bao et al. 2011]:
2
4
D
LR
CNT
CNTCNT
(4.2)
where RCNT, LCNT, D (9.5 nm), and σCNT (4000 S/m) are the resistance, length, diameter and
electrical conductivity of the CNTs, respectively.
76
p
tunMe
hR
1
2 2 (4.3)
where Rtun is the tunneling resistance and h, e, and M arePlanck’sconstant(2πħ), the electron
charge (1.602× 10⁻¹⁹
C), and the number of conduction channels (460), respectively; and, τp is the
transmission probability of an electron to tunnel between CNTs, which is determined by using
the Schrdinger equation, which is discussed in detail elsewhere [Bao et al. 2011, Simmons
1963].
For CNTs that overlap, contact resistance is assumed. For each pair of CNTs with a gap
distance less than the tunneling distance (1.8 nm [Li et al. 2007, Wichmann 2011]), tunneling
resistance can be measured and applied with Equation (4.3).
To incorporate the tunneling effect on the electrical conductivity of an RVE using a
computationalprogramandCNTs’startandendpointsasinputs,theshortestdistancebetween
two CNTs (segment lines in the software) is calculated. Finally, the resistivity values of each
connection inside the CNT network are computed and stored in a square conductance matrix (N
× N, where N is the number of CNTs remaining after eliminations). For measuring the electrical
resistivity of an RVE, the random walk method is used, which is explained in a simple electrical
circuit in Figure 4.5.
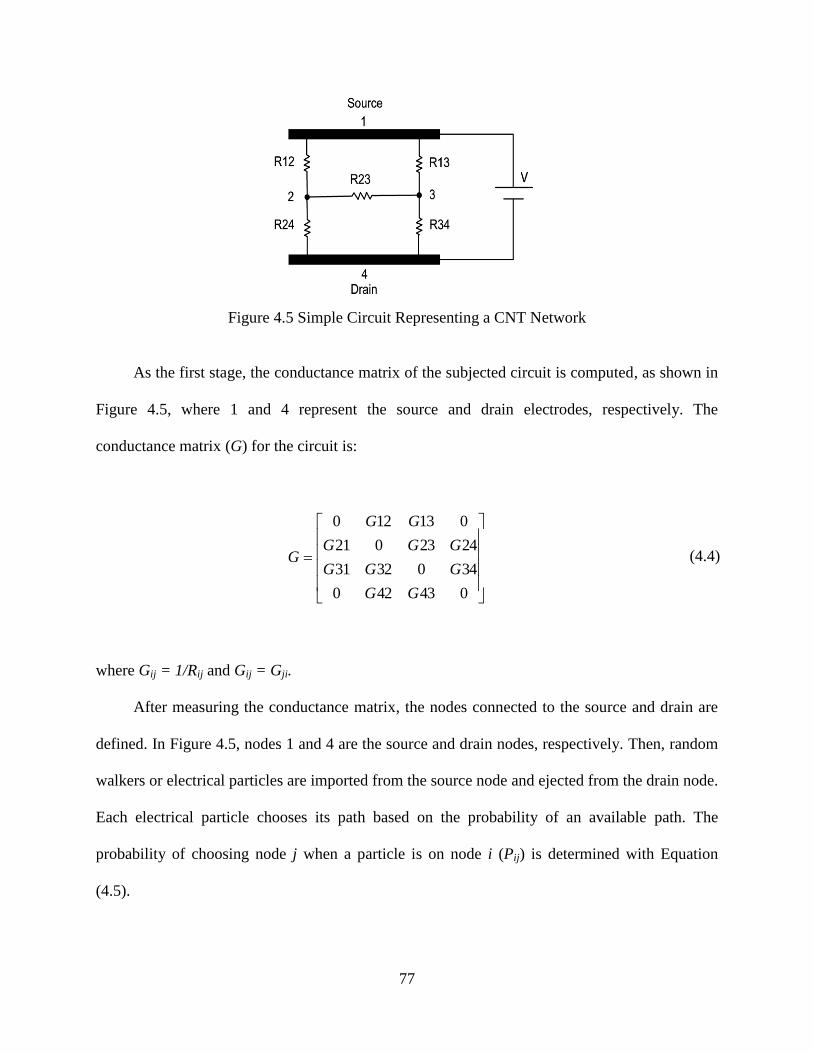
77
Figure 4.5 Simple Circuit Representing a CNT Network
As the first stage, the conductance matrix of the subjected circuit is computed, as shown in
Figure 4.5, where 1 and 4 represent the source and drain electrodes, respectively. The
conductance matrix (G) for the circuit is:
043420
3403231
2423021
013120
GG
GGG
GGG
GG
G (4.4)
where Gij = 1/Rij and Gij = Gji.
After measuring the conductance matrix, the nodes connected to the source and drain are
defined. In Figure 4.5, nodes 1 and 4 are the source and drain nodes, respectively. Then, random
walkers or electrical particles are imported from the source node and ejected from the drain node.
Each electrical particle chooses its path based on the probability of an available path. The
probability of choosing node j when a particle is on node i (Pij) is determined with Equation
(4.5).
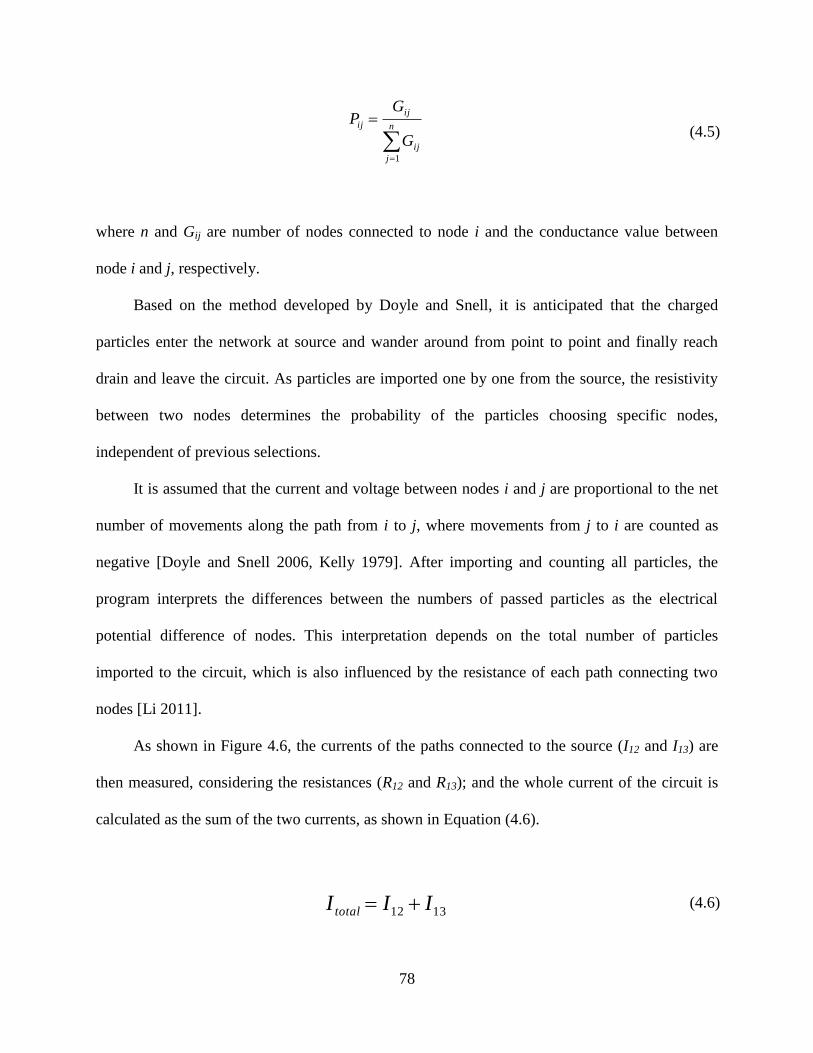
78
(4.5)
where n and Gij are number of nodes connected to node i and the conductance value between
node i and j, respectively.
Based on the method developed by Doyle and Snell, it is anticipated that the charged
particles enter the network at source and wander around from point to point and finally reach
drain and leave the circuit. As particles are imported one by one from the source, the resistivity
between two nodes determines the probability of the particles choosing specific nodes,
independent of previous selections.
It is assumed that the current and voltage between nodes i and j are proportional to the net
number of movements along the path from i to j, where movements from j to i are counted as
negative [Doyle and Snell 2006, Kelly 1979]. After importing and counting all particles, the
program interprets the differences between the numbers of passed particles as the electrical
potential difference of nodes. This interpretation depends on the total number of particles
imported to the circuit, which is also influenced by the resistance of each path connecting two
nodes [Li 2011].
As shown in Figure 4.6, the currents of the paths connected to the source (I12 and I13) are
then measured, considering the resistances (R12 and R13); and the whole current of the circuit is
calculated as the sum of the two currents, as shown in Equation (4.6).
(4.6)
n
j
ij
ij
ij
G
GP
1
1312 III total
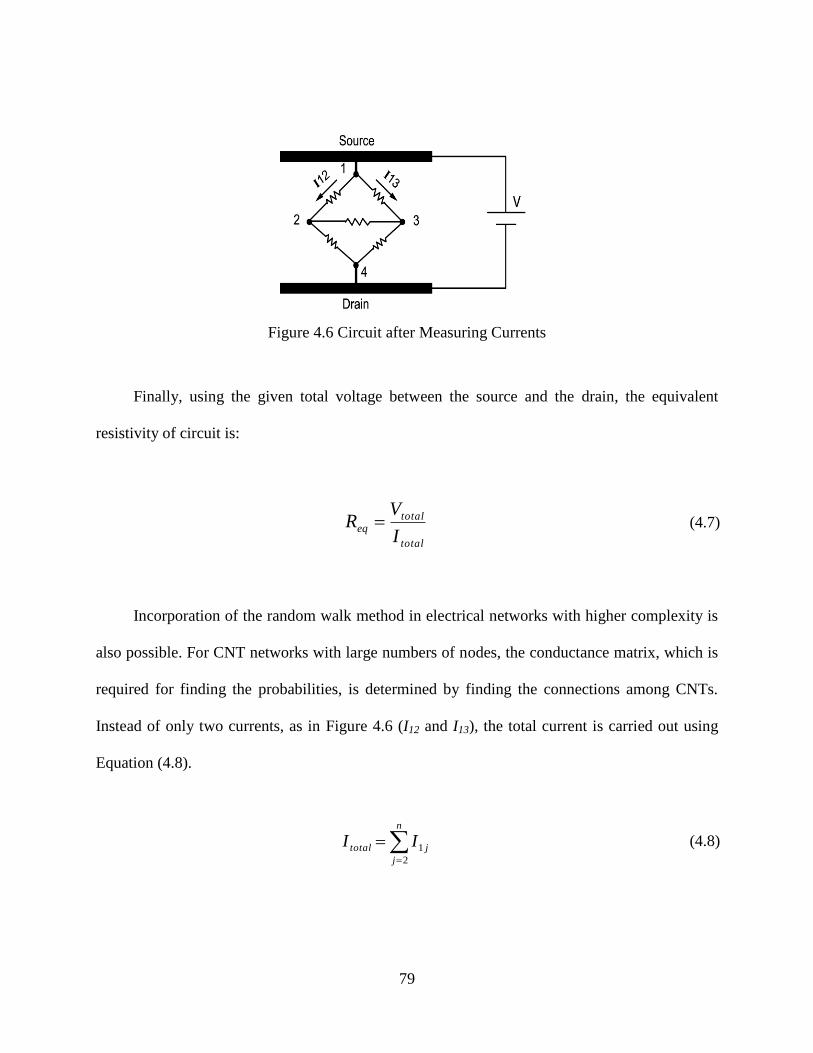
79
Figure 4.6 Circuit after Measuring Currents
Finally, using the given total voltage between the source and the drain, the equivalent
resistivity of circuit is:
(4.7)
Incorporation of the random walk method in electrical networks with higher complexity is
also possible. For CNT networks with large numbers of nodes, the conductance matrix, which is
required for finding the probabilities, is determined by finding the connections among CNTs.
Instead of only two currents, as in Figure 4.6 (I12 and I13), the total current is carried out using
Equation (4.8).
n
j
jtotal II2
1 (4.8)
total
totaleq
I
VR
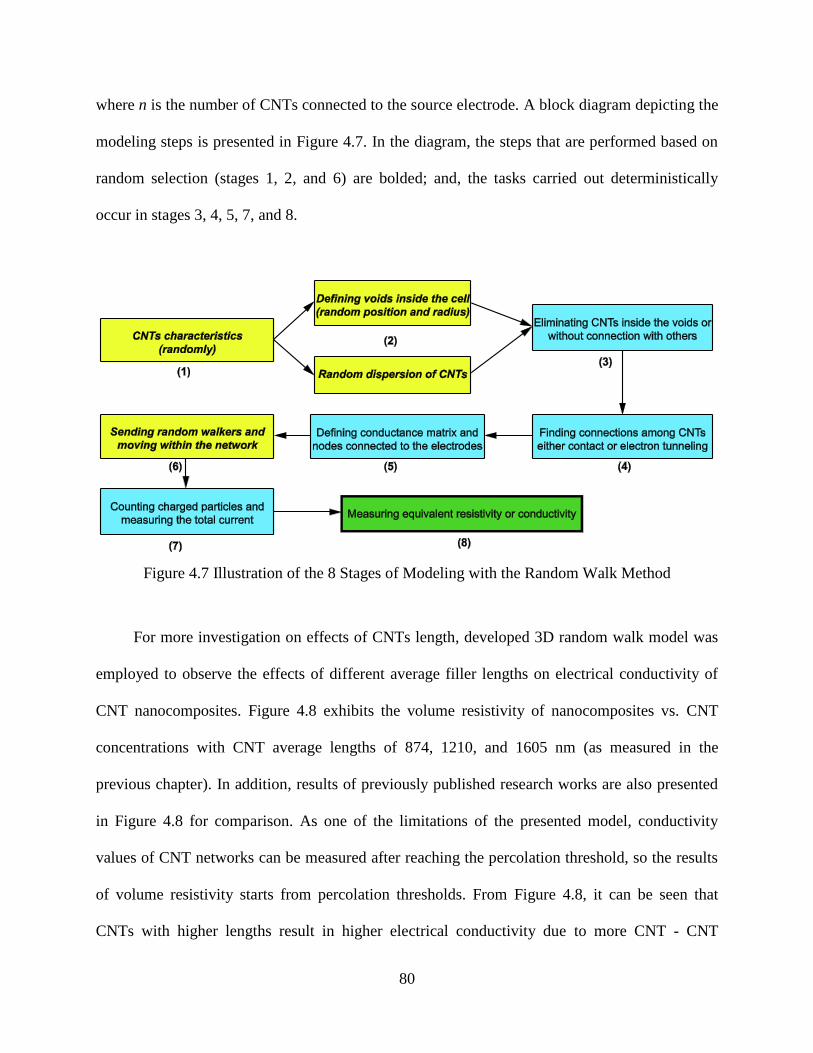
80
where n is the number of CNTs connected to the source electrode. A block diagram depicting the
modeling steps is presented in Figure 4.7. In the diagram, the steps that are performed based on
random selection (stages 1, 2, and 6) are bolded; and, the tasks carried out deterministically
occur in stages 3, 4, 5, 7, and 8.
Figure 4.7 Illustration of the 8 Stages of Modeling with the Random Walk Method
For more investigation on effects of CNTs length, developed 3D random walk model was
employed to observe the effects of different average filler lengths on electrical conductivity of
CNT nanocomposites. Figure 4.8 exhibits the volume resistivity of nanocomposites vs. CNT
concentrations with CNT average lengths of 874, 1210, and 1605 nm (as measured in the
previous chapter). In addition, results of previously published research works are also presented
in Figure 4.8 for comparison. As one of the limitations of the presented model, conductivity
values of CNT networks can be measured after reaching the percolation threshold, so the results
of volume resistivity starts from percolation thresholds. From Figure 4.8, it can be seen that
CNTs with higher lengths result in higher electrical conductivity due to more CNT - CNT
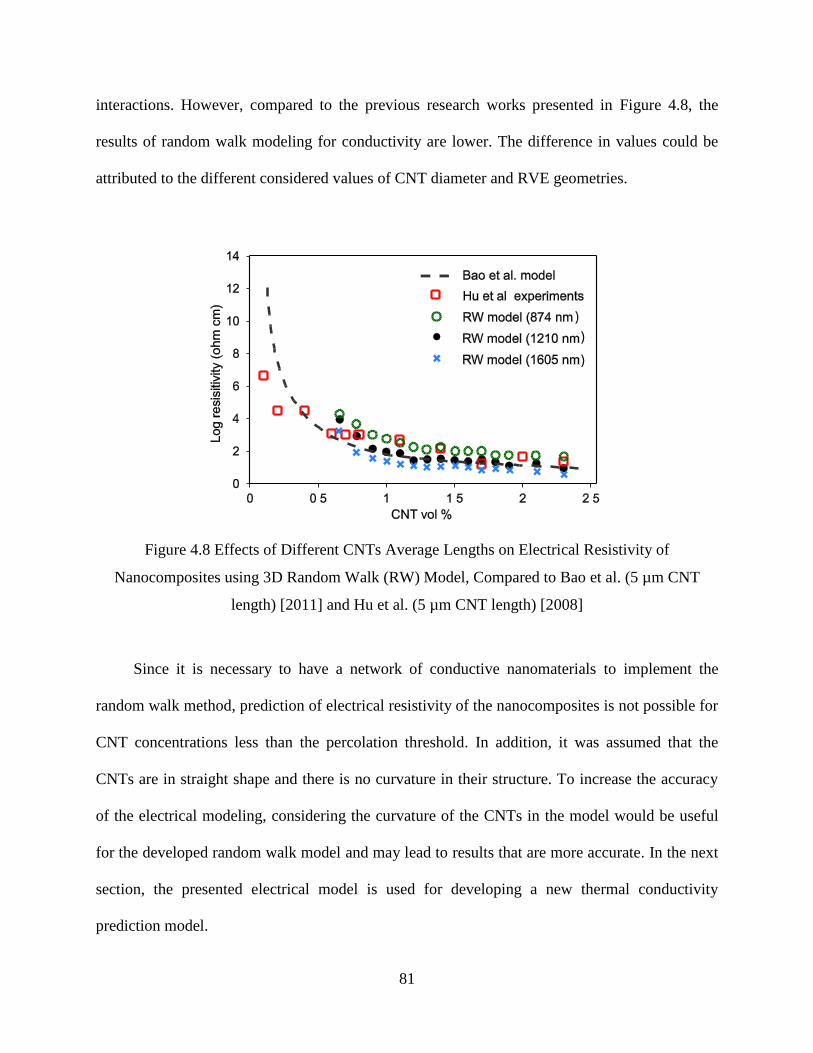
81
interactions. However, compared to the previous research works presented in Figure 4.8, the
results of random walk modeling for conductivity are lower. The difference in values could be
attributed to the different considered values of CNT diameter and RVE geometries.
Figure 4.8 Effects of Different CNTs Average Lengths on Electrical Resistivity of
Nanocomposites using 3D Random Walk (RW) Model, Compared to Bao et al. (5 µm CNT
length) [2011] and Hu et al. (5 µm CNT length) [2008]
Since it is necessary to have a network of conductive nanomaterials to implement the
random walk method, prediction of electrical resistivity of the nanocomposites is not possible for
CNT concentrations less than the percolation threshold. In addition, it was assumed that the
CNTs are in straight shape and there is no curvature in their structure. To increase the accuracy
of the electrical modeling, considering the curvature of the CNTs in the model would be useful
for the developed random walk model and may lead to results that are more accurate. In the next
section, the presented electrical model is used for developing a new thermal conductivity
prediction model.
82
4.3 THERMAL CONDUCTIVITY MODELING
In this section, the developed model for predicting thermal conductivity of nanocomposites
containing CNTs and hBNs is described. In this model the effects of CNT orientations and
addition of hBN nanoparticulates to the composites as hybrid composites are evaluated.
Composites containing CNTs with two orientation degrees (semi-aligned and random
orientations) are fabricated and tested through thermal conductivity measurements. Same CNT
orientations are also taken into account in the developed model. To reflect the effects of hybrid
compositions, hBN / CNT composite are also fabricated and tested, and the experimentally
carried out results are compared with the predicted ones.
4.3.1 Introduction to Thermal Conductivity Modeling
In recent years, thermally and electrically conductive nanocomposites have been widely
studied due to their outstanding multifunctional properties. The high thermal conductivity of
CNTs is anticipated to enhance the thermal properties of polymers (with thermal conductivity of
less than 1 W/mK for common polymers) when they are used as a filler. Several models have
been reported to predict the thermal conductivity of composites with different particulates
including continuous fibres, laminated flat plates, spheres, and ellipsoidal particles [Han and
Fina 2011]. For CNT / polymer composites, concentrations [Xu et al. 2006], interfacial
resistance [Shenogin et al. 2004], and aspect ratio [Deng et al. 2007] of fillers have been studied.
Numerical and theoretical methods are conducted to predict the thermal and electrical
conductivities of the composites with highly thermally conductive particulates [Bigg 1995,
Tomadakis and Sotrichos 1993, Zhou, Zhang et al. 2007, Wang et al. 2008, TabkhPaz et al.
2014, Bao et al. 2011, Hu et al. 2008]. Classical approaches that estimate the thermal
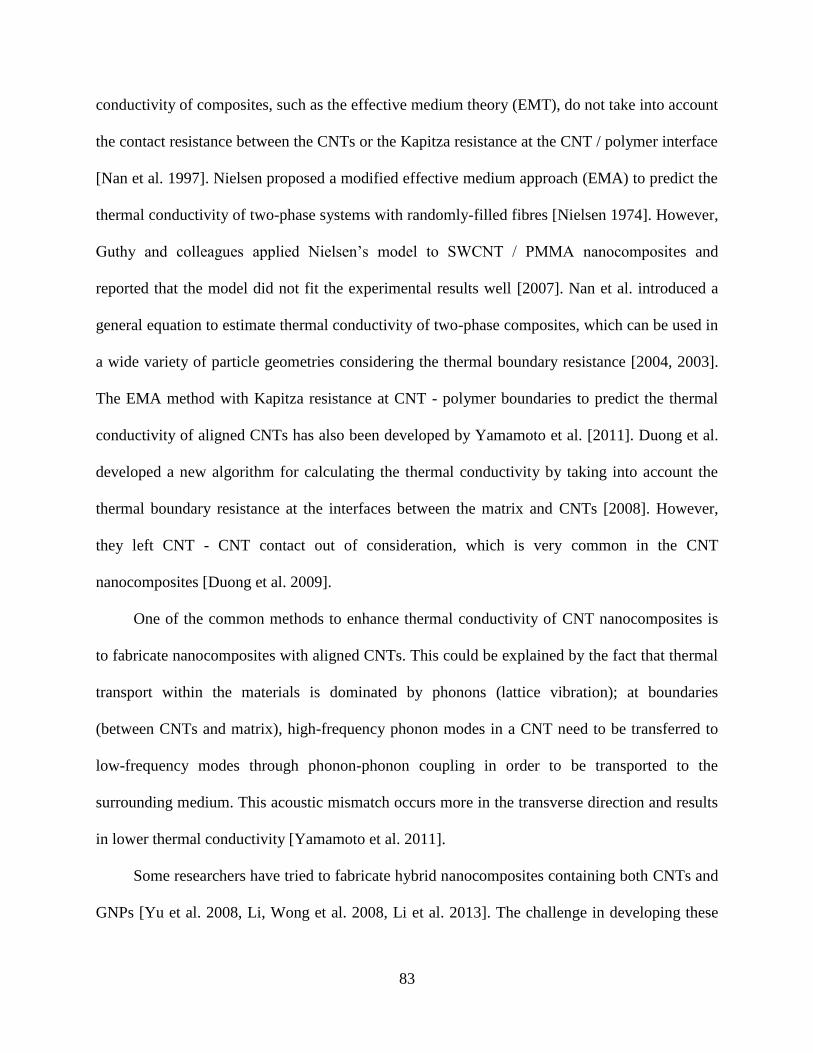
83
conductivity of composites, such as the effective medium theory (EMT), do not take into account
the contact resistance between the CNTs or the Kapitza resistance at the CNT / polymer interface
[Nan et al. 1997]. Nielsen proposed a modified effective medium approach (EMA) to predict the
thermal conductivity of two-phase systems with randomly-filled fibres [Nielsen 1974]. However,
Guthy and colleagues applied Nielsen’s model to SWCNT / PMMA nanocomposites and
reported that the model did not fit the experimental results well [2007]. Nan et al. introduced a
general equation to estimate thermal conductivity of two-phase composites, which can be used in
a wide variety of particle geometries considering the thermal boundary resistance [2004, 2003].
The EMA method with Kapitza resistance at CNT - polymer boundaries to predict the thermal
conductivity of aligned CNTs has also been developed by Yamamoto et al. [2011]. Duong et al.
developed a new algorithm for calculating the thermal conductivity by taking into account the
thermal boundary resistance at the interfaces between the matrix and CNTs [2008]. However,
they left CNT - CNT contact out of consideration, which is very common in the CNT
nanocomposites [Duong et al. 2009].
One of the common methods to enhance thermal conductivity of CNT nanocomposites is
to fabricate nanocomposites with aligned CNTs. This could be explained by the fact that thermal
transport within the materials is dominated by phonons (lattice vibration); at boundaries
(between CNTs and matrix), high-frequency phonon modes in a CNT need to be transferred to
low-frequency modes through phonon-phonon coupling in order to be transported to the
surrounding medium. This acoustic mismatch occurs more in the transverse direction and results
in lower thermal conductivity [Yamamoto et al. 2011].
Some researchers have tried to fabricate hybrid nanocomposites containing both CNTs and
GNPs [Yu et al. 2008, Li, Wong et al. 2008, Li et al. 2013]. The challenge in developing these
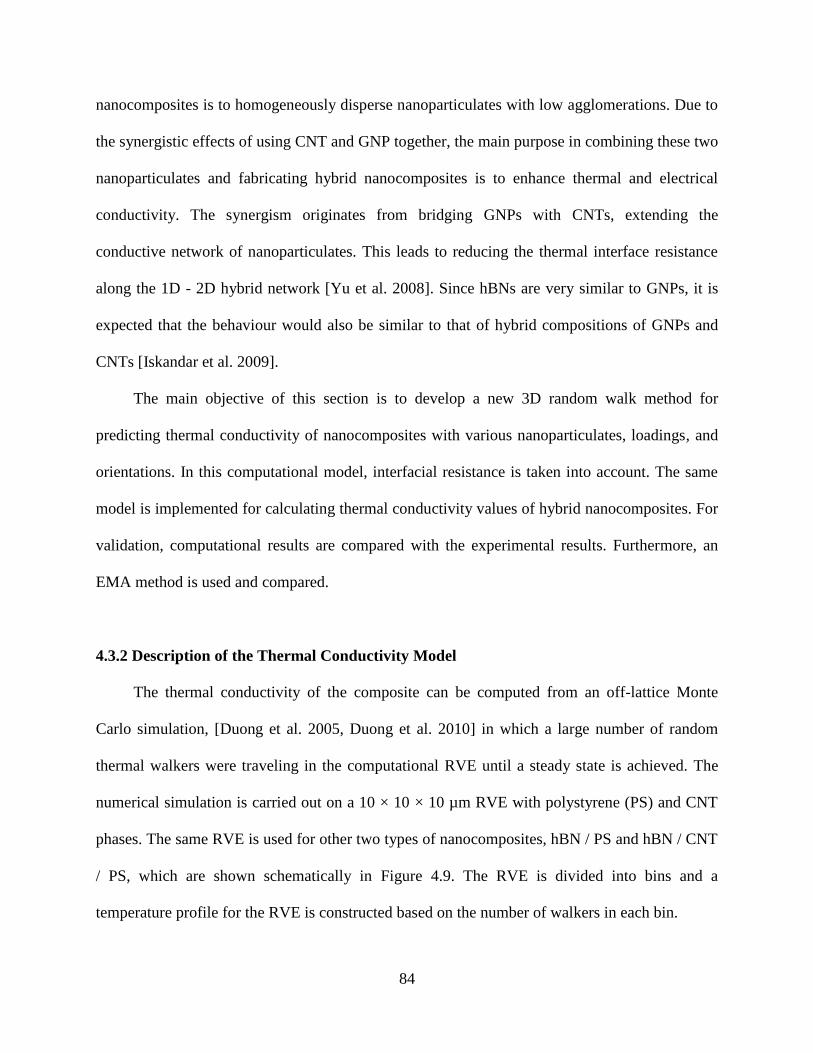
84
nanocomposites is to homogeneously disperse nanoparticulates with low agglomerations. Due to
the synergistic effects of using CNT and GNP together, the main purpose in combining these two
nanoparticulates and fabricating hybrid nanocomposites is to enhance thermal and electrical
conductivity. The synergism originates from bridging GNPs with CNTs, extending the
conductive network of nanoparticulates. This leads to reducing the thermal interface resistance
along the 1D - 2D hybrid network [Yu et al. 2008]. Since hBNs are very similar to GNPs, it is
expected that the behaviour would also be similar to that of hybrid compositions of GNPs and
CNTs [Iskandar et al. 2009].
The main objective of this section is to develop a new 3D random walk method for
predicting thermal conductivity of nanocomposites with various nanoparticulates, loadings, and
orientations. In this computational model, interfacial resistance is taken into account. The same
model is implemented for calculating thermal conductivity values of hybrid nanocomposites. For
validation, computational results are compared with the experimental results. Furthermore, an
EMA method is used and compared.
4.3.2 Description of the Thermal Conductivity Model
The thermal conductivity of the composite can be computed from an off-lattice Monte
Carlo simulation, [Duong et al. 2005, Duong et al. 2010] in which a large number of random
thermal walkers were traveling in the computational RVE until a steady state is achieved. The
numerical simulation is carried out on a 10 × 10 × 10 µm RVE with polystyrene (PS) and CNT
phases. The same RVE is used for other two types of nanocomposites, hBN / PS and hBN / CNT
/ PS, which are shown schematically in Figure 4.9. The RVE is divided into bins and a
temperature profile for the RVE is constructed based on the number of walkers in each bin.
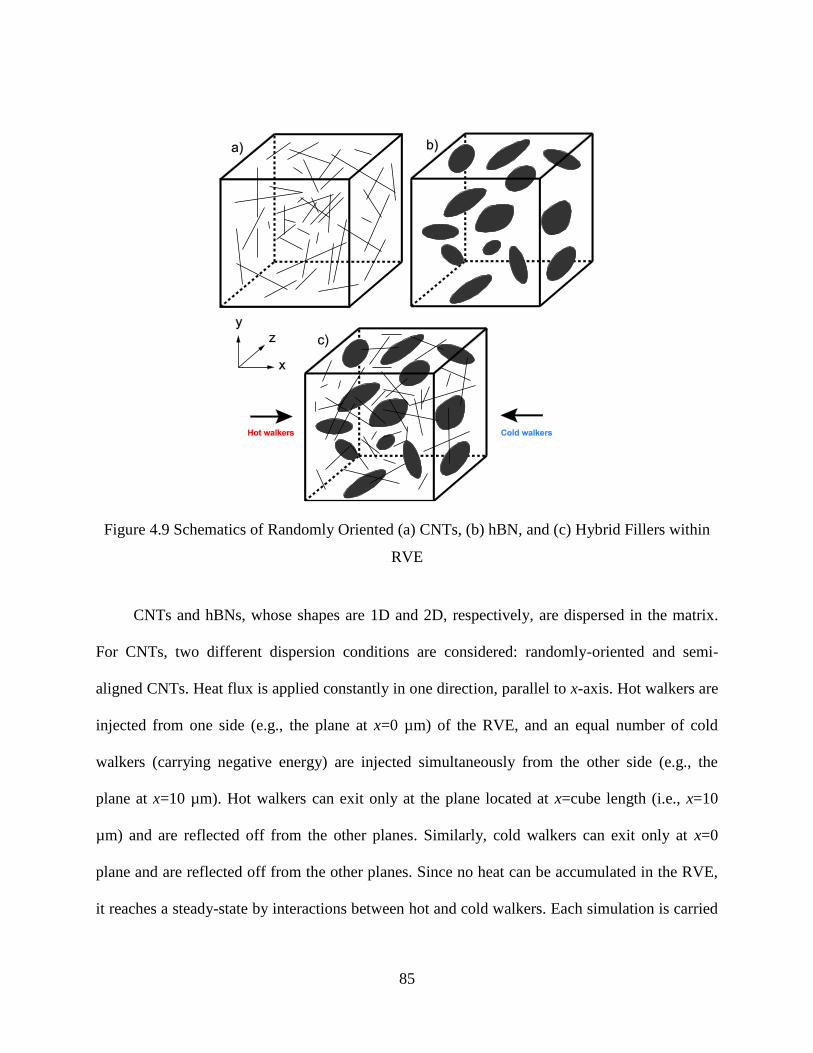
85
Figure 4.9 Schematics of Randomly Oriented (a) CNTs, (b) hBN, and (c) Hybrid Fillers within
RVE
CNTs and hBNs, whose shapes are 1D and 2D, respectively, are dispersed in the matrix.
For CNTs, two different dispersion conditions are considered: randomly-oriented and semi-
aligned CNTs. Heat flux is applied constantly in one direction, parallel to x-axis. Hot walkers are
injected from one side (e.g., the plane at x=0 µm) of the RVE, and an equal number of cold
walkers (carrying negative energy) are injected simultaneously from the other side (e.g., the
plane at x=10 µm). Hot walkers can exit only at the plane located at x=cube length (i.e., x=10
µm) and are reflected off from the other planes. Similarly, cold walkers can exit only at x=0
plane and are reflected off from the other planes. Since no heat can be accumulated in the RVE,
it reaches a steady-state by interactions between hot and cold walkers. Each simulation is carried
86
out for 100 ns, where 90,000 walkers, both hot and cold walkers, are released and distributed
uniformly on the respective plane surfaces at every time step.
The travel of walkers in the matrix can be described by the Brownian motion. The motion
is defined by a normal distribution with a mean of zero and a standard deviation that depends on
the matrix thermal diffusivity, Dm. The standard deviation (σs) of the distribution in each space is
given by:
TDms 2 (4.9)
where ∆T is the time increment. Since the nanoparticulates (CNTs and hBNs) used in this study
are assumed to have very high thermal conductivity values, the thermal walkers move in jumps
that follow a uniform distribution within the nanoparticulates. It is noted that the thermal
resistance for a walker traveling from the matrix to a nanoparticulate equals that from a
nanoparticulate to the matrix, as required by the principle of microscopic reversibility. With this
assumption, once a walker in the matrix reaches the interface between the matrix and a
nanoparticulate, the walker will move into the nanoparticulate phase with a probability of fm-filler
(fm-CNT or fm-hBN ) which represents the thermal resistance of the interface (and will stay at the
previous position in the matrix with a probability 1– fm-filler). Accordingly, the program generates
a probability at random and compares this with fm-filler. If this number is greater than fm-filler, then
the marker remains at the interface; otherwise, it moves into the inclusion (CNT or hBN).
Similarly, once a walker is inside an inclusion, the walker will redistribute randomly within
the inclusion with a certain probability (1–ffiller-m) at the end of a time step and will cross into the
matrix phase with a probability of ffiller-m. Accordingly, program generates another probability
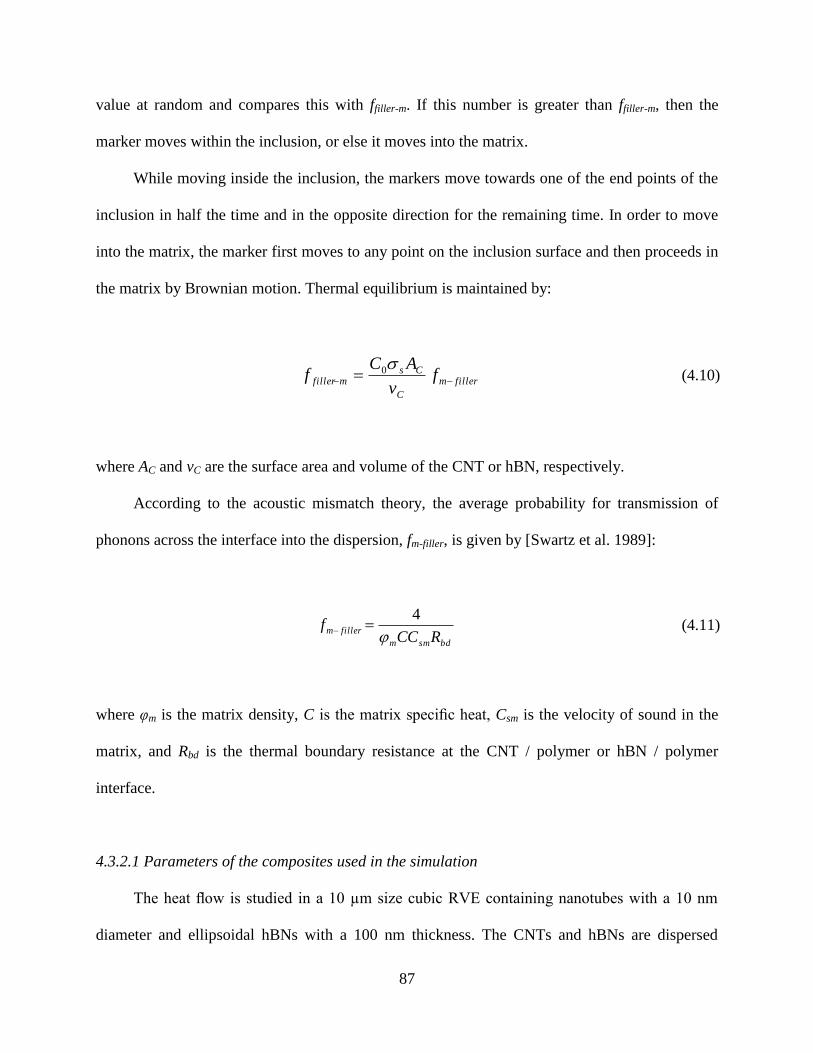
87
value at random and compares this with ffiller-m. If this number is greater than ffiller-m, then the
marker moves within the inclusion, or else it moves into the matrix.
While moving inside the inclusion, the markers move towards one of the end points of the
inclusion in half the time and in the opposite direction for the remaining time. In order to move
into the matrix, the marker first moves to any point on the inclusion surface and then proceeds in
the matrix by Brownian motion. Thermal equilibrium is maintained by:
fillerm
C
Csmfiller f
v
ACf
0 (4.10)
where AC and vC are the surface area and volume of the CNT or hBN, respectively.
According to the acoustic mismatch theory, the average probability for transmission of
phonons across the interface into the dispersion, fm-filler, is given by [Swartz et al. 1989]:
bdsmm
fillermRCC
f
4 (4.11)
where φm is the matrix density, C isthematrixspecificheat,Csm is the velocity of sound in the
matrix, and Rbd is the thermal boundary resistance at the CNT / polymer or hBN / polymer
interface.
4.3.2.1 Parameters of the composites used in the simulation
Theheatflowisstudied ina10µmsizecubicRVEcontainingnanotubeswitha10nm
diameter and ellipsoidal hBNs with a 100 nm thickness. The CNTs and hBNs are dispersed
88
within the RVE and have an average length of 1000 nm. The orientation of CNTs is divided into
two categories: semi-aligned and random dispersion. hBN nanoparticulates are randomly
dispersed. The thermal conductivity of the polymeric matrix was assumed to be 0.14 W/mK and
that of CNT and hBN to be 200 and 300 W/mK, respectively [Yang et al. 2004, Jo et al. 2013].
The modeling parameters are also tabulated in Table 4.1 and Table 4.2.
Table 4.1 The Simulation Parameters for Modeling
Parameter Value
Number of grids per direction 96
Total number of walkers 90000
Total time 100 ns
Time increment 0.0025 ns
Table 4.2 RVE, CNTs, hBNs, and Matrix’sProperties used in Simulation
Property Value Property Value
RVE Volume 10 × 10 × 10 µm Thermal equilibrium factor (C0) 0.25
CNT diameter (average) 10 nm Matrix thermal conductivity 0.14 W/mK
CNT aspect ratio 100 Matrix density 1050 kg/m3
hBN thickness 70 nm Matrix specific heat 1.3 kJ/kg K
hBN length 1000 nm Matrix thermal diffusivity 10.5 m2/s
hBN width 500 nm Step size of marker in matrix 1.6176 nm
Zhong et al. reported systematic MD studies of the effect of contact morphology on the
CNT - CNT contact resistance [2006]. The reported values of the CNT - CNT contact resistance
are in order of 10-8
m2K/W [Shenogin et al. 2004, Han and Fina 2011]. As the CNTs can be
functionalized to reduce their contact resistance, CNT line contact is assumed and the CNT - heat
89
source thermal boundary resistance is assumed to be equal to the CNT - matrix thermal boundary
resistance for simplicity.
The simulations are conducted with two different orientations of CNTs dispersed in
composites (semi-aligned and random). Prior to this stage, using different thermal boundary
resistance and contact resistance values, the simulation process is optimized considering different
CNT concentrations (1, 4, and 8 vol.%). The optimization is done through comparing previously
published research works [Han and Fina 2011, Nan et al. 2004, Clancy and Gates 2006, Gulotty
et al. 2013, Gojny et al. 2006, Moisala et al. 2006, Yang et al. 2009, Bagchi and Nomura 2006].
Figure 4.10 illustrates an example of a simulation run for the nanocomposite with 0.1
vol.% fraction of CNTs and hBNs, dispersed in a 10 × 10 × 10 µm cube. The computational cell
is heated from one surface (the x = 0 plane) with the release of 90,000 walkers (cold and hot
walkers) distributed randomly on the surface. The temperature distribution is calculated from the
number of walkers found in each bin. The walkers move through the matrix material by
Brownian motion. The Brownian motion in each space direction is simulated with random jumps
that each walker executes at each time step (time increment of 0.0025 ns). CNT - CNT thermal
boundary resistance (Rbd), and CNT – polymer boundary resistance were taken to be 10-8
m2K/W
and 10 × 10-8
m2K/W, respectively. For other contact resistances, hBN – hBN, and hBN
polymer, 7 × 10⁻¹⁰
m2K/W, and 10 × 10
-8 m
2K/W were used. Modeling steps are illustrated in
Figure 4.10 (a), where yellow boxes indicate random stages. Figure 4.10 (b) and (c) show two
stages of the modeling, random distribution of nanoparticulates and final distribution of walkers.
In Figure 4.10 (c), hot walkers are depicted in red (left side) and the cold walkers in blue (right
side), and the grid lines are shown in green.
90
Figure 4.10 (a) Modeling Stages and Schematic Illustration of (b) Randomly Distributed CNTs
and hBNs within the RVE and (c) Final Distribution of Walkers in the RVE
4.3.3 Effective Medium Approach (EMA)
EMA method is widely used for thermal conductivity modeling of nanocomposites
containing CNTs and hBN. There are several models for predicting thermal conductivities of
two-phase compositions. Several researchers have proposed a variety of analytical models,
which are based on Fourier’s law of heat transfer [Choi et al. 2005]. For CNT / polymer
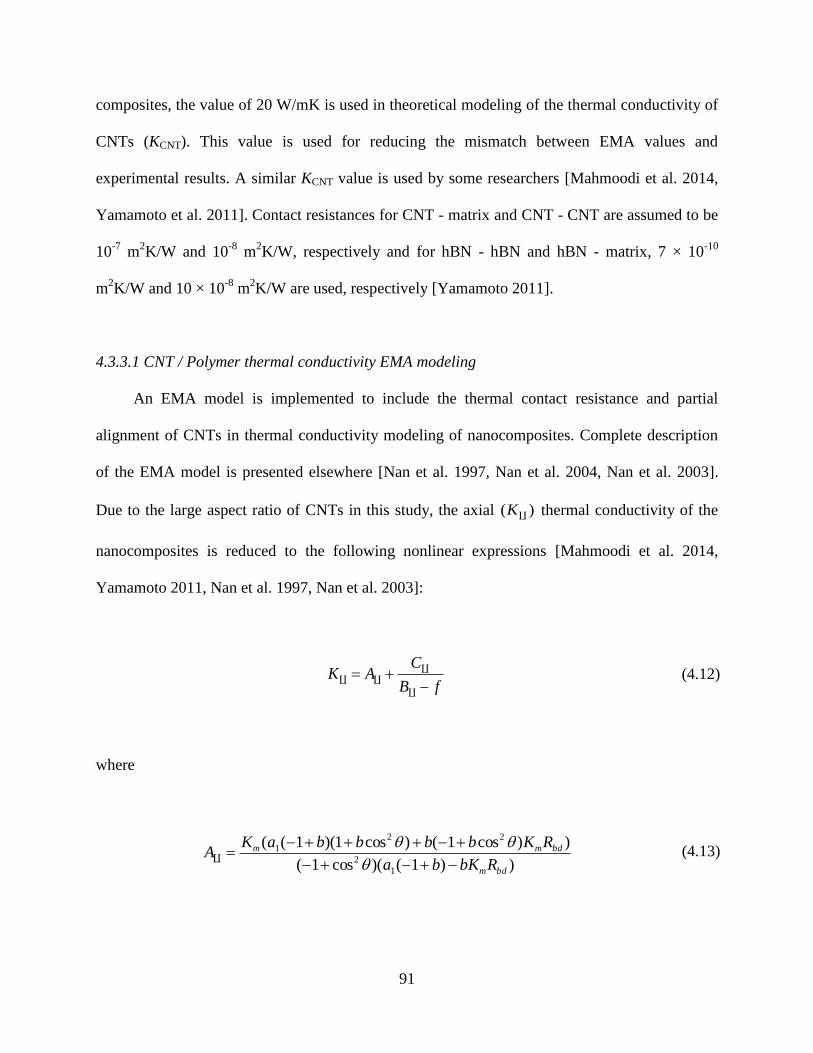
91
composites, the value of 20 W/mK is used in theoretical modeling of the thermal conductivity of
CNTs (KCNT). This value is used for reducing the mismatch between EMA values and
experimental results. A similar KCNT value is used by some researchers [Mahmoodi et al. 2014,
Yamamoto et al. 2011]. Contact resistances for CNT - matrix and CNT - CNT are assumed to be
10-7
m2K/W and 10
-8 m
2K/W, respectively and for hBN - hBN and hBN - matrix, 7 × 10
-10
m2K/W and 10 × 10
-8 m
2K/W are used, respectively [Yamamoto 2011].
4.3.3.1 CNT / Polymer thermal conductivity EMA modeling
An EMA model is implemented to include the thermal contact resistance and partial
alignment of CNTs in thermal conductivity modeling of nanocomposites. Complete description
of the EMA model is presented elsewhere [Nan et al. 1997, Nan et al. 2004, Nan et al. 2003].
Due to the large aspect ratio of CNTs in this study, the axial thermal conductivity of the
nanocomposites is reduced to the following nonlinear expressions [Mahmoodi et al. 2014,
Yamamoto 2011, Nan et al. 1997, Nan et al. 2003]:
(4.12)
where
(4.13)
)( K
fB
CAK
))1()(cos1(
))cos1()cos1)(1((
1
2
22
1
bdm
bdmm
RbKba
RKbbbbaKA
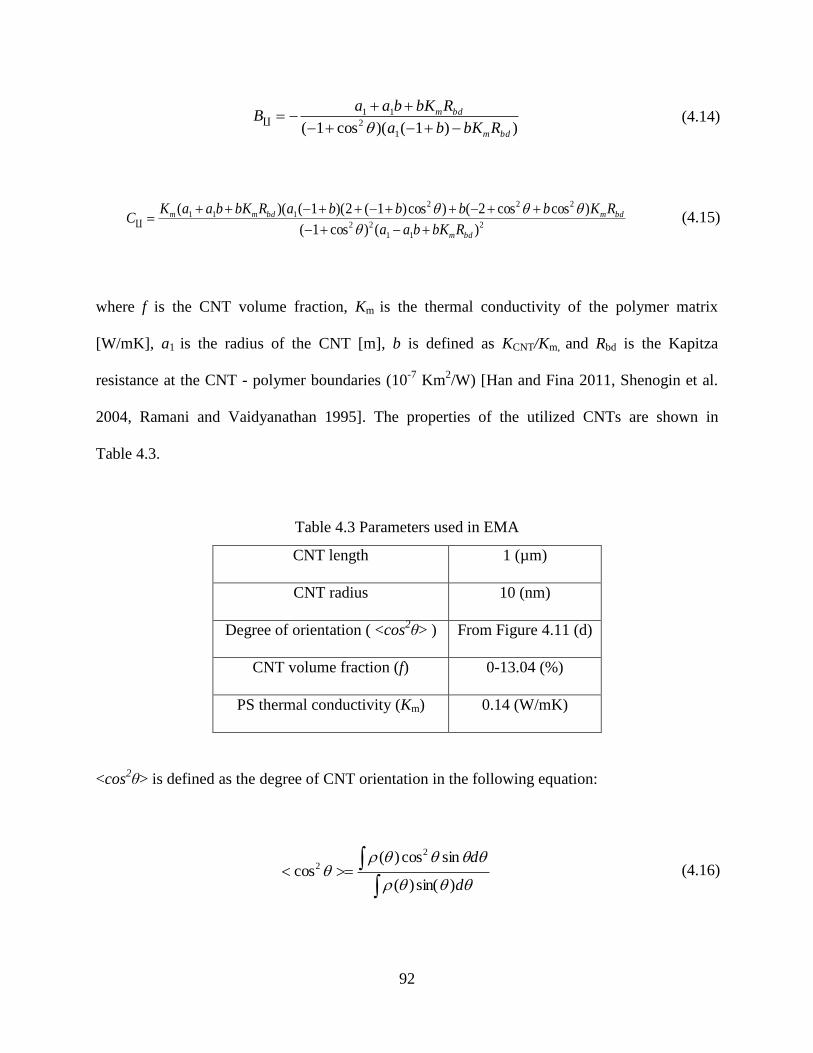
92
(4.14)
(4.15)
where f is the CNT volume fraction, Km is the thermal conductivity of the polymer matrix
[W/mK], a1 is the radius of the CNT [m], b is defined as KCNT/Km, and Rbd is the Kapitza
resistance at the CNT - polymer boundaries (10-7
Km2/W) [Han and Fina 2011, Shenogin et al.
2004, Ramani and Vaidyanathan 1995]. The properties of the utilized CNTs are shown in
Table 4.3.
Table 4.3 Parameters used in EMA
CNT length 1 (µm)
CNT radius 10 (nm)
Degree of orientation ( <cos2θ> ) From Figure 4.11 (d)
CNT volume fraction (f) 0-13.04 (%)
PS thermal conductivity (Km) 0.14 (W/mK)
<cos2θ> is defined as the degree of CNT orientation in the following equation:
(4.16)
))1()(cos1( 1
2
11
bdm
bdm
RbKba
RbKbaaB
2
11
22
222
111
)()cos1(
)coscos2()cos)1(2)(1()((
bdm
bdmbdmm
RbKbaa
RKbbbbaRbKbaaKC
d
d
)sin()(
sincos)(cos
2
2
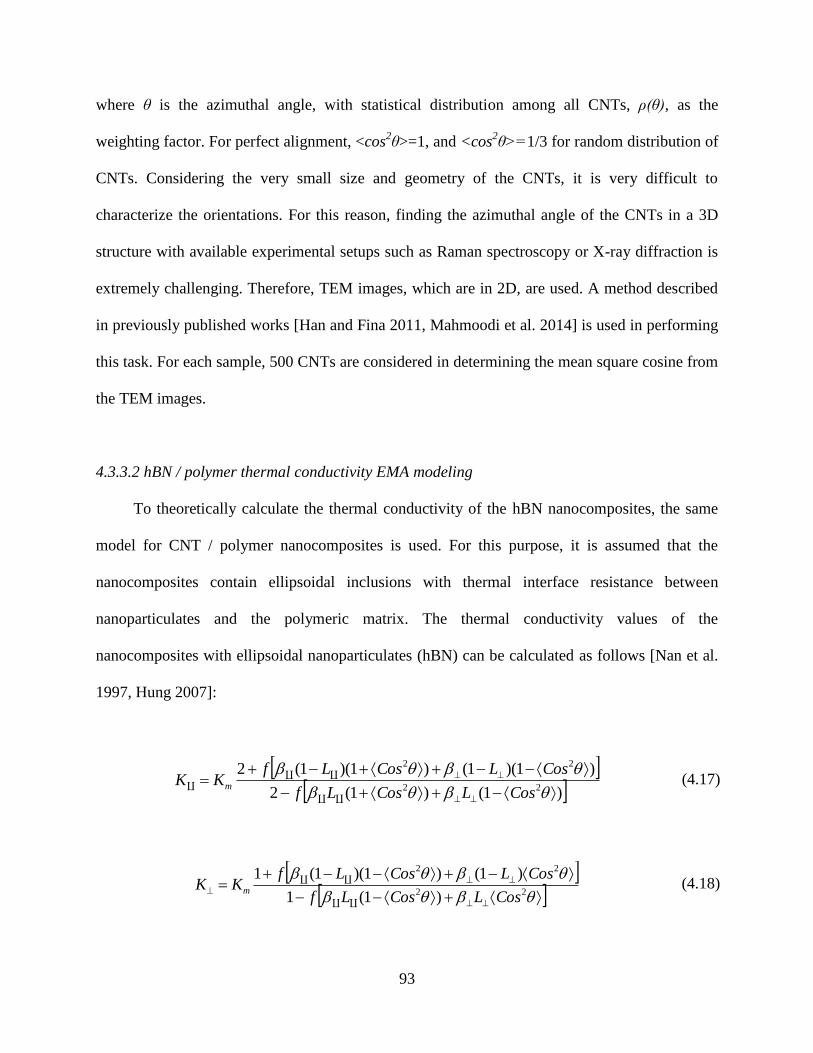
93
where θ is the azimuthal angle, with statistical distribution among all CNTs, ρ(θ), as the
weighting factor. For perfect alignment, <cos2θ>=1, and <cos
2θ>=1/3 for random distribution of
CNTs. Considering the very small size and geometry of the CNTs, it is very difficult to
characterize the orientations. For this reason, finding the azimuthal angle of the CNTs in a 3D
structure with available experimental setups such as Raman spectroscopy or X-ray diffraction is
extremely challenging. Therefore, TEM images, which are in 2D, are used. A method described
in previously published works [Han and Fina 2011, Mahmoodi et al. 2014] is used in performing
this task. For each sample, 500 CNTs are considered in determining the mean square cosine from
the TEM images.
4.3.3.2 hBN / polymer thermal conductivity EMA modeling
To theoretically calculate the thermal conductivity of the hBN nanocomposites, the same
model for CNT / polymer nanocomposites is used. For this purpose, it is assumed that the
nanocomposites contain ellipsoidal inclusions with thermal interface resistance between
nanoparticulates and the polymeric matrix. The thermal conductivity values of the
nanocomposites with ellipsoidal nanoparticulates (hBN) can be calculated as follows [Nan et al.
1997, Hung 2007]:
(4.17)
(4.18)
)1()1(2
)1)(1()1)(1(222
22
CosLCosLf
CosLCosLfKK m
22
22
)1(1
)1()1)(1(1
CosLCosLf
CosLCosLfKK m
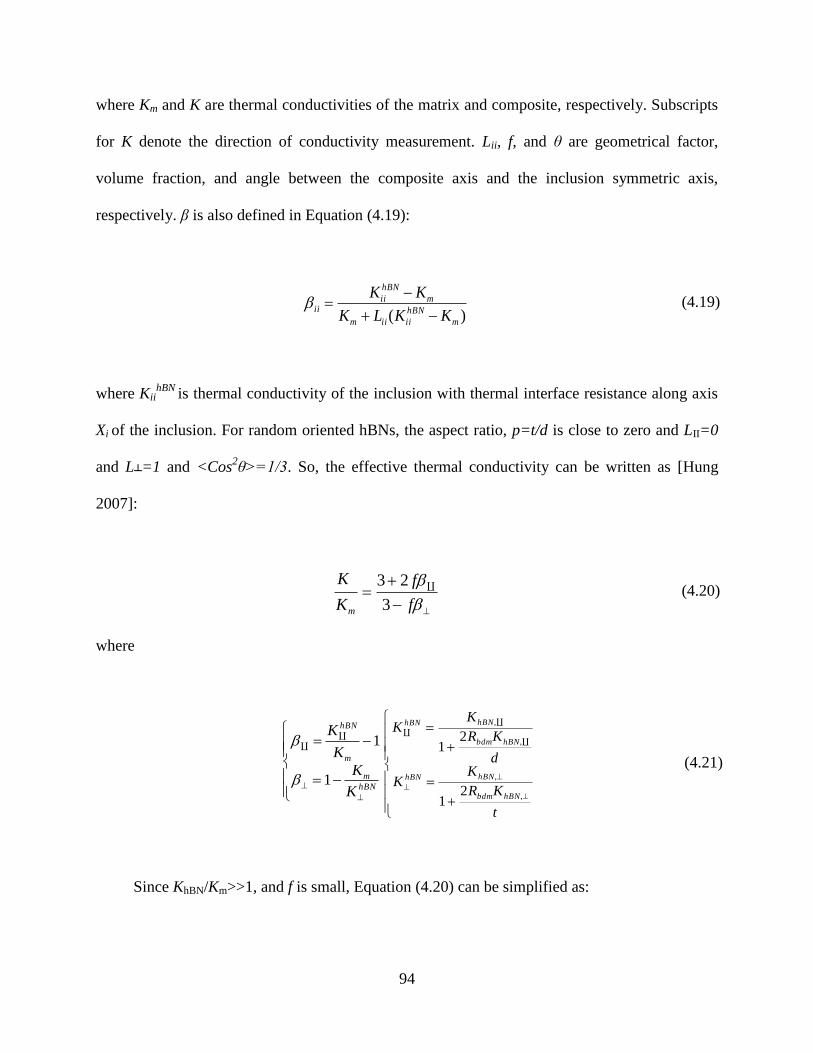
94
where Km and K are thermal conductivities of the matrix and composite, respectively. Subscripts
for K denote the direction of conductivity measurement. Lii, f, and θ are geometrical factor,
volume fraction, and angle between the composite axis and the inclusion symmetric axis,
respectively. β is also defined in Equation (4.19):
(4.19)
where KiihBN
is thermal conductivity of the inclusion with thermal interface resistance along axis
Xi of the inclusion. For random oriented hBNs, the aspect ratio, p=t/d is close to zero and LII=0
and L=1 and <Cos2θ>=1/3. So, the effective thermal conductivity can be written as [Hung
2007]:
(4.20)
where
(4.21)
Since KhBN/Km>>1, and f is small, Equation (4.20) can be simplified as:
)( m
hBN
iiiim
m
hBN
iiii
KKLK
KK
f
f
K
K
m 3
23
hBN
m
m
hBN
K
K
K
K
1
1
t
KR
KK
d
KR
KK
hBNbdm
hBNhBN
hBNbdm
hBNhBN
,
,
,
,
21
21
95
(4.22)
where d, t, and Rbdm arehBN’sdiameter, thickness, and thermal interface resistance, respectively.
Equation (4.22) is used to calculate the thermal conductivity of composites. To present and
compare the results, ratio of thermal conductivity of composites to that of the matrix (PS) is
reported.
4.3.4 Experiments for Thermal Conductivity Modeling Validation
A masterbatch of 20 wt.% PS / CNTs (Hyperion Catalysis) is used and diluted into
nanocomposites with various CNT loadings (0.5, 1, 2, 3.5, 5 and 10 wt.%) using a twin-screw
extruder. Density values of CNTs and PS are used for preparing different concentrations. Multi-
walled CNTs (Cheap Tubes Inc.) are vapour grown and have 10-15 nm in outer diameter, 1-10
µm in length and 1.75 g/cm3 in density. hBN nanoparticulates (MK-hBN-150, M.K. Impex
Corp.) with average size of 70 nm and purity of 99.5 % are also used. Polystyrene (PS) (Styron®
610, American Styrenics LLC) with a density of 1.05 g/cm3 and melt flow index of 11 g/10 min
is used as the polymeric matrix. Thermal conductivity of the PS, represented by Kmatrix, is 0.14
W/mK, which is given by the manufacturer. All the materials for the experiments are dried for 4
hours at 80°C.
As summarized in Table 4.4, a micro-injection moulding machine (BOY 12A) with a screw
diameter of 18 mm and a length to diameter ratio of 20 is used for preparing the injection moulded
samples with processing conditions to fabricate nanocomposites with partially aligned CNTs.
)(21
)(
3
21
d
KR
K
K
fK
K
hBNbdm
m
hBN
m
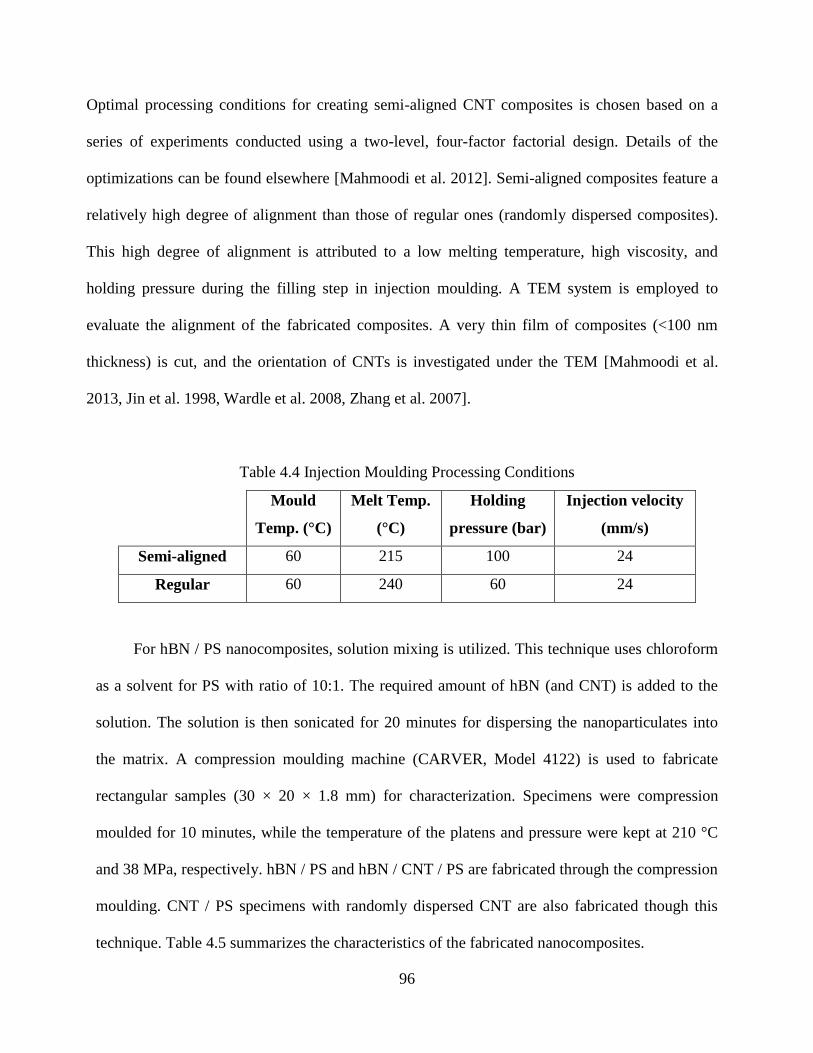
96
Optimal processing conditions for creating semi-aligned CNT composites is chosen based on a
series of experiments conducted using a two-level, four-factor factorial design. Details of the
optimizations can be found elsewhere [Mahmoodi et al. 2012]. Semi-aligned composites feature a
relatively high degree of alignment than those of regular ones (randomly dispersed composites).
This high degree of alignment is attributed to a low melting temperature, high viscosity, and
holding pressure during the filling step in injection moulding. A TEM system is employed to
evaluate the alignment of the fabricated composites. A very thin film of composites (<100 nm
thickness) is cut, and the orientation of CNTs is investigated under the TEM [Mahmoodi et al.
2013, Jin et al. 1998, Wardle et al. 2008, Zhang et al. 2007].
Table 4.4 Injection Moulding Processing Conditions
Mould
Temp. (°C)
Melt Temp.
(°C)
Holding
pressure (bar)
Injection velocity
(mm/s)
Semi-aligned 60 215 100 24
Regular 60 240 60 24
For hBN / PS nanocomposites, solution mixing is utilized. This technique uses chloroform
as a solvent for PS with ratio of 10:1. The required amount of hBN (and CNT) is added to the
solution. The solution is then sonicated for 20 minutes for dispersing the nanoparticulates into
the matrix. A compression moulding machine (CARVER, Model 4122) is used to fabricate
rectangular samples (30 × 20 × 1.8 mm) for characterization. Specimens were compression
moulded for 10 minutes, while the temperature of the platens and pressure were kept at 210 °C
and 38 MPa, respectively. hBN / PS and hBN / CNT / PS are fabricated through the compression
moulding. CNT / PS specimens with randomly dispersed CNT are also fabricated though this
technique. Table 4.5 summarizes the characteristics of the fabricated nanocomposites.
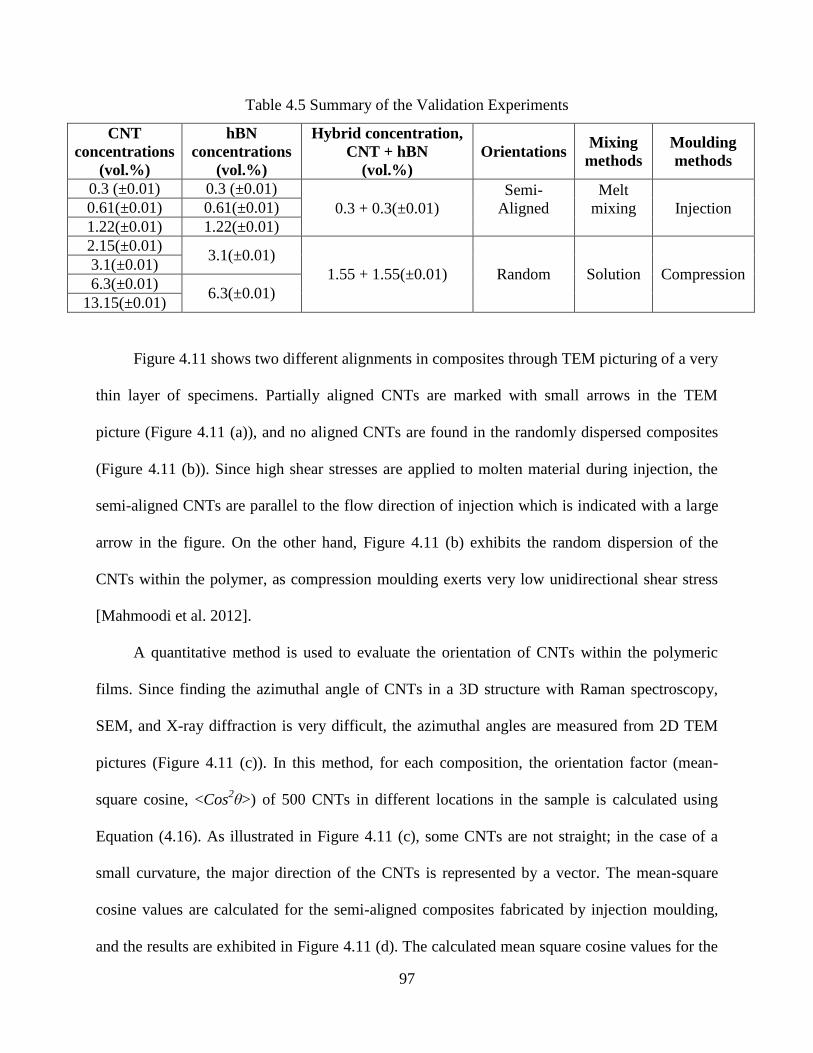
97
Table 4.5 Summary of the Validation Experiments
CNT
concentrations
(vol.%)
hBN
concentrations
(vol.%)
Hybrid concentration,
CNT + hBN
(vol.%)
Orientations Mixing
methods
Moulding
methods
0.3 (±0.01) 0.3 (±0.01)
0.3 + 0.3(±0.01)
Semi-
Aligned
Melt
mixing
Injection
0.61(±0.01) 0.61(±0.01)
1.22(±0.01) 1.22(±0.01)
2.15(±0.01) 3.1(±0.01)
1.55 + 1.55(±0.01) Random Solution Compression 3.1(±0.01)
6.3(±0.01) 6.3(±0.01)
13.15(±0.01)
Figure 4.11 shows two different alignments in composites through TEM picturing of a very
thin layer of specimens. Partially aligned CNTs are marked with small arrows in the TEM
picture (Figure 4.11 (a)), and no aligned CNTs are found in the randomly dispersed composites
(Figure 4.11 (b)). Since high shear stresses are applied to molten material during injection, the
semi-aligned CNTs are parallel to the flow direction of injection which is indicated with a large
arrow in the figure. On the other hand, Figure 4.11 (b) exhibits the random dispersion of the
CNTs within the polymer, as compression moulding exerts very low unidirectional shear stress
[Mahmoodi et al. 2012].
A quantitative method is used to evaluate the orientation of CNTs within the polymeric
films. Since finding the azimuthal angle of CNTs in a 3D structure with Raman spectroscopy,
SEM, and X-ray diffraction is very difficult, the azimuthal angles are measured from 2D TEM
pictures (Figure 4.11 (c)). In this method, for each composition, the orientation factor (mean-
square cosine, <Cos2θ>) of 500 CNTs in different locations in the sample is calculated using
Equation (4.16). As illustrated in Figure 4.11 (c), some CNTs are not straight; in the case of a
small curvature, the major direction of the CNTs is represented by a vector. The mean-square
cosine values are calculated for the semi-aligned composites fabricated by injection moulding,
and the results are exhibited in Figure 4.11 (d). The calculated mean square cosine values for the

98
semi-aligned composites are higher than that of the randomly-dispersed CNT composites,
ranging from 0.45 to 0.6. The mean-square cosine values of perfect alignment and random
dispersion are known to be 1 and 0.33, respectively [Han and Fina 2011]. This method was
previously used to prove the alignment of CNTs within the polymeric matrices [Marconnet et al.
2011].
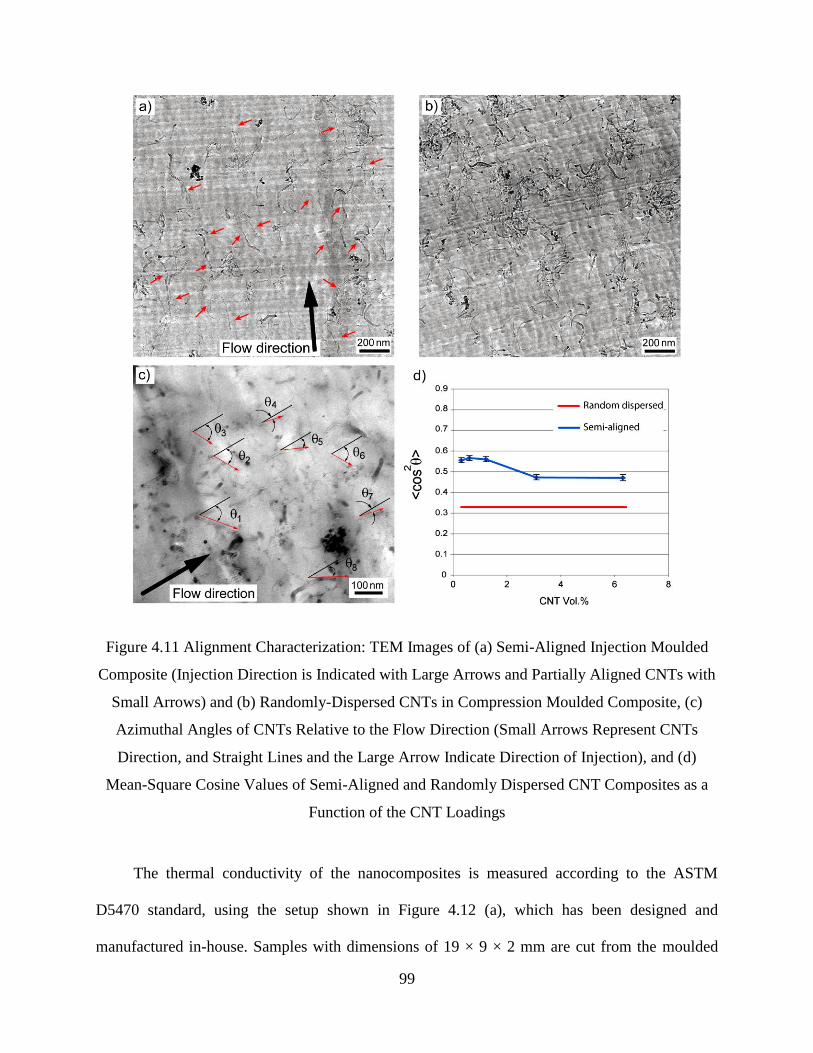
99
Figure 4.11 Alignment Characterization: TEM Images of (a) Semi-Aligned Injection Moulded
Composite (Injection Direction is Indicated with Large Arrows and Partially Aligned CNTs with
Small Arrows) and (b) Randomly-Dispersed CNTs in Compression Moulded Composite, (c)
Azimuthal Angles of CNTs Relative to the Flow Direction (Small Arrows Represent CNTs
Direction, and Straight Lines and the Large Arrow Indicate Direction of Injection), and (d)
Mean-Square Cosine Values of Semi-Aligned and Randomly Dispersed CNT Composites as a
Function of the CNT Loadings
The thermal conductivity of the nanocomposites is measured according to the ASTM
D5470 standard, using the setup shown in Figure 4.12 (a), which has been designed and
manufactured in-house. Samples with dimensions of 19 × 9 × 2 mm are cut from the moulded
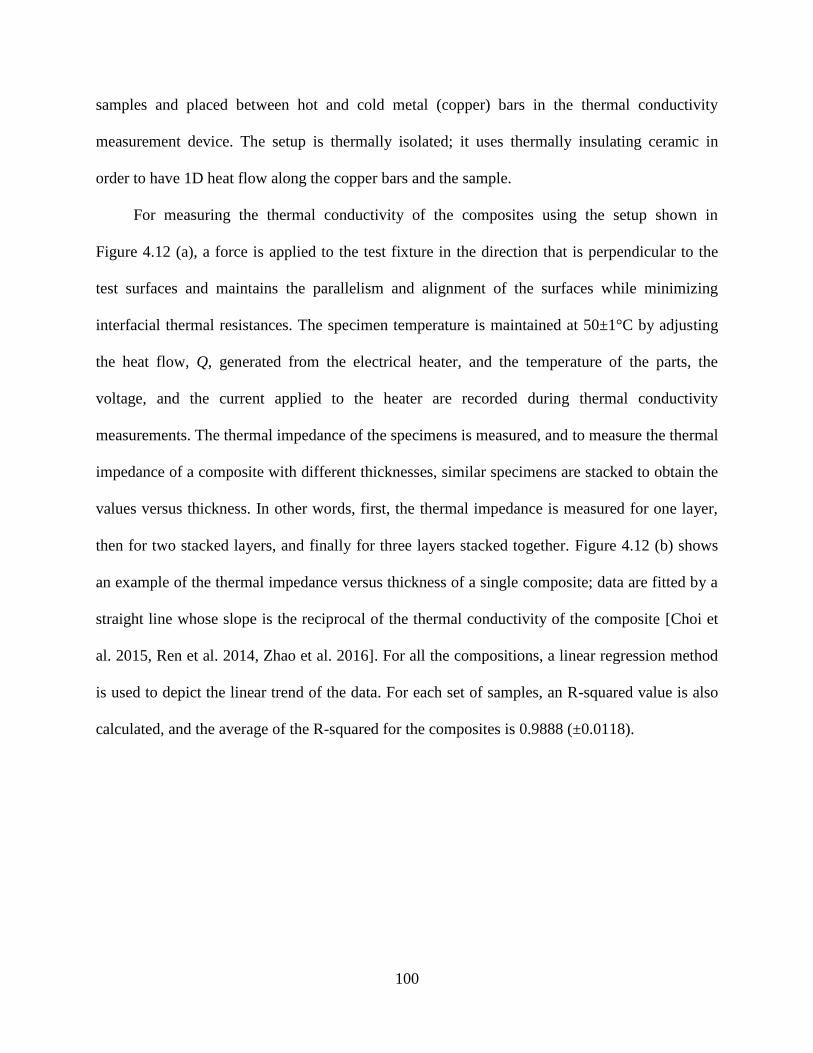
100
samples and placed between hot and cold metal (copper) bars in the thermal conductivity
measurement device. The setup is thermally isolated; it uses thermally insulating ceramic in
order to have 1D heat flow along the copper bars and the sample.
For measuring the thermal conductivity of the composites using the setup shown in
Figure 4.12 (a), a force is applied to the test fixture in the direction that is perpendicular to the
test surfaces and maintains the parallelism and alignment of the surfaces while minimizing
interfacial thermal resistances. The specimen temperature is maintained at 50±1°C by adjusting
the heat flow, Q, generated from the electrical heater, and the temperature of the parts, the
voltage, and the current applied to the heater are recorded during thermal conductivity
measurements. The thermal impedance of the specimens is measured, and to measure the thermal
impedance of a composite with different thicknesses, similar specimens are stacked to obtain the
values versus thickness. In other words, first, the thermal impedance is measured for one layer,
then for two stacked layers, and finally for three layers stacked together. Figure 4.12 (b) shows
an example of the thermal impedance versus thickness of a single composite; data are fitted by a
straight line whose slope is the reciprocal of the thermal conductivity of the composite [Choi et
al. 2015, Ren et al. 2014, Zhao et al. 2016]. For all the compositions, a linear regression method
is used to depict the linear trend of the data. For each set of samples, an R-squared value is also
calculated, and the average of the R-squared for the composites is 0.9888 (±0.0118).
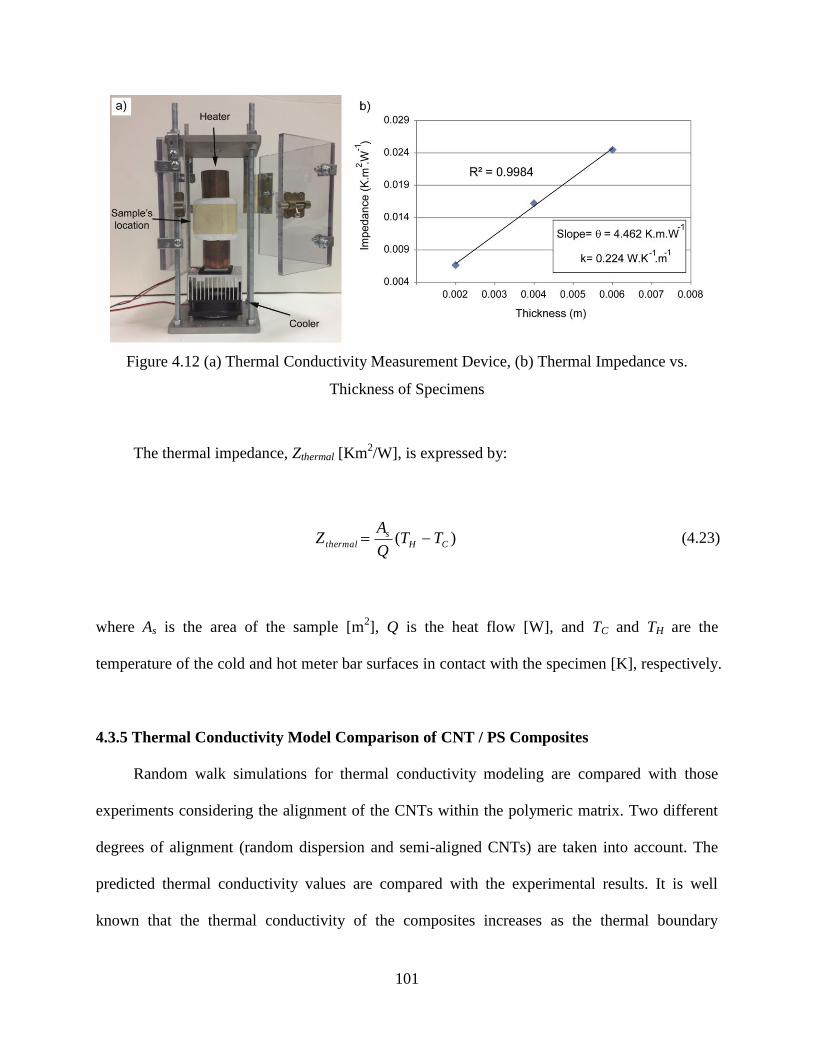
101
Figure 4.12 (a) Thermal Conductivity Measurement Device, (b) Thermal Impedance vs.
Thickness of Specimens
The thermal impedance, Zthermal [Km2/W], is expressed by:
)( CH
sthermal TT
Q
AZ (4.23)
where As is the area of the sample [m2], Q is the heat flow [W], and TC and TH are the
temperature of the cold and hot meter bar surfaces in contact with the specimen [K], respectively.
4.3.5 Thermal Conductivity Model Comparison of CNT / PS Composites
Random walk simulations for thermal conductivity modeling are compared with those
experiments considering the alignment of the CNTs within the polymeric matrix. Two different
degrees of alignment (random dispersion and semi-aligned CNTs) are taken into account. The
predicted thermal conductivity values are compared with the experimental results. It is well
known that the thermal conductivity of the composites increases as the thermal boundary
102
resistance at the CNT - matrix interface decreases. CNT distribution and the associated contact
resistance also have a strong effect on the effective thermal conductivity, with higher
conductivity associated with lower CNT - CNT contact resistance [Hida et al. 2013].
Figure 4.13 and Figure 4.14 compare results obtained from the random walk modeling,
EMA, and experimental results. Experimental and random walk results are curve-fitted to the
power law, and EMA results are fitted to linear lines. Figure 4.13 shows the thermal conductivity
values for specimens with semi-aligned CNTs compared to previously published works [Raja et
al. 2013, Kim et al. 2015]. It is clearly shown that the relative thermal conductivity of composites
increases with the addition of CNTs. Thermal conductivities predicted from EMA are close to
experimental measurements in low concentrations but way high in high concentrations. The
EMA model represented in this study does not reflect the effect of agglomeration of CNTs. In
other words, the EMA model only considers geometry, thermal properties, and orientation of the
entire CNTs. This assumption could be the reason for the increase in the thermal conductivity of
composites with an increase in the concentration of CNTs. Meanwhile, the results from random
walk modeling relatively agree well with the measured thermal conductivities in all
concentrations.
As it was described previously, injection moulding setup is used to fabricate specimens
with semi-aligned orientation of CNTs. As shown in Table 4.4, injection moulding is carried out
at lower processing temperatures to produce semi-aligned composites. The deviation between
random walk and experimental measurements may arise from the difference in the degree of
alignment and distribution of CNTs. The orientation of CNTs is well-controlled in the model,
whereas the alignment and distribution in the fabricated specimens cannot be controlled
103
equivalently. Therefore, slightly higher thermal conductivity values are predicted by the random
walk model, as CNTs are more oriented and able to transfer heat.
Figure 4.13 Thermal Conductivity of Semi-aligned CNT Nanocomposite Specimens Obtained
from Experiments and Modeling (100 iterations)
Figure 4.14 compares predicted and measured thermal conductivities for randomly
dispersed CNT composites. Similar to the semi-aligned composites, the predictions from random
walk modeling approximate to the experimental measurements. Results of Figure 4.14 show that
the developed random walk model is more accurate for predicting thermal conductivity of
randomly dispersed CNTs compared to that of semi-aligned ones. However, there are some
mismatches at concentrations around 3 vol.%, which requires further investigations through
morphology of the nanocomposites to identify the cause.
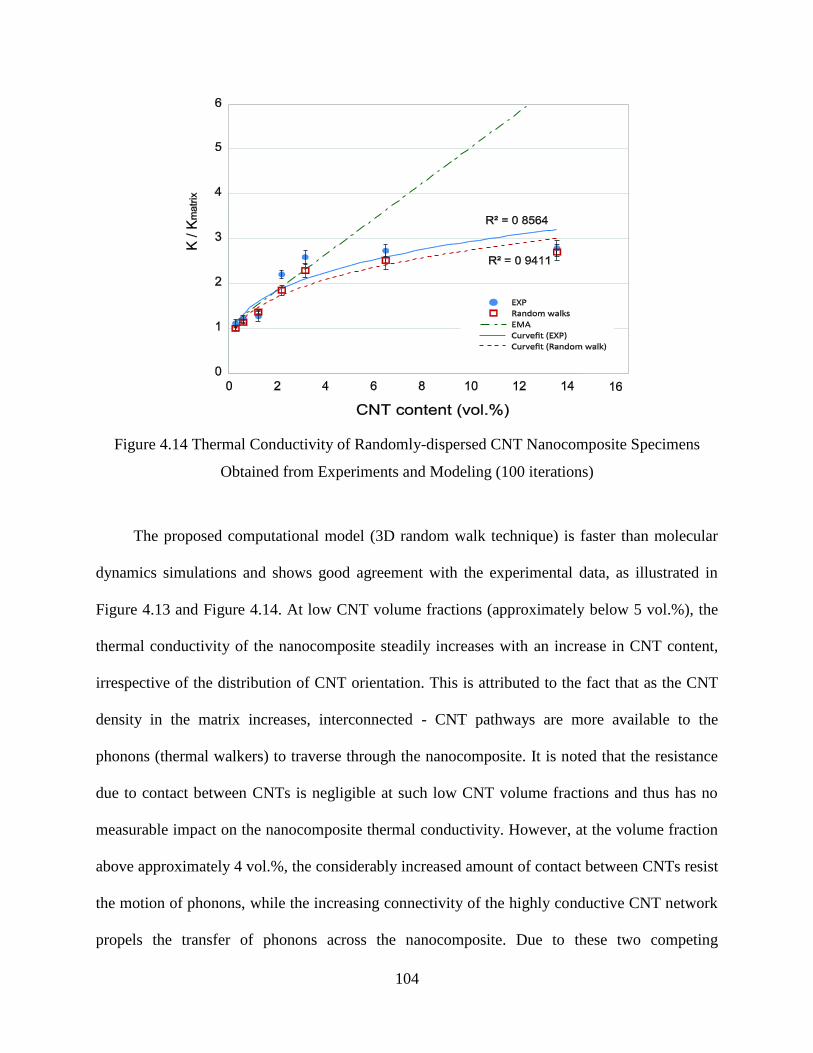
104
Figure 4.14 Thermal Conductivity of Randomly-dispersed CNT Nanocomposite Specimens
Obtained from Experiments and Modeling (100 iterations)
The proposed computational model (3D random walk technique) is faster than molecular
dynamics simulations and shows good agreement with the experimental data, as illustrated in
Figure 4.13 and Figure 4.14. At low CNT volume fractions (approximately below 5 vol.%), the
thermal conductivity of the nanocomposite steadily increases with an increase in CNT content,
irrespective of the distribution of CNT orientation. This is attributed to the fact that as the CNT
density in the matrix increases, interconnected - CNT pathways are more available to the
phonons (thermal walkers) to traverse through the nanocomposite. It is noted that the resistance
due to contact between CNTs is negligible at such low CNT volume fractions and thus has no
measurable impact on the nanocomposite thermal conductivity. However, at the volume fraction
above approximately 4 vol.%, the considerably increased amount of contact between CNTs resist
the motion of phonons, while the increasing connectivity of the highly conductive CNT network
propels the transfer of phonons across the nanocomposite. Due to these two competing
105
influences, the thermal conductivity of the nanocomposite reaches a steady state, and the curve
slopes change at around 4 vol.% as shown in Figure 4.13 and Figure 4.14.
The influence of the CNT orientation distribution on the nanocomposite thermal
conductivity is shown by comparing Figure 4.13 and Figure 4.14. At a given thermal boundary
resistance and a CNT volume fraction, the random jump of phonons along the heat flow direction
rises with an increase in number of the CNTs aligned with the flow direction, resulting in better
heat transfer. Thus, the thermal conductivity should be highest when CNT nanocomposite is
fully-aligned and lowest when CNT is randomly dispersed.
Interestingly, at high concentrations of CNT for randomly-dispersed nanocomposites
(Figure 4.14), experimentally-measured values are greater than those predicted by the random
walk model. It is speculated that the curved shapes of the CNTs and the created networks
through their agglomeration in the fabricated specimens may have caused this mismatch, which
is not taken into account in the model. Further investigation on the morphology of the fabricated
samples is required in order to reveal it.
As it is noticed that alignment of CNTs may change the thermal conductivity of
composites, effects of alignment of CNTs on thermal conductivity of composites are studied
through random walk modeling. Creating a perfectly-aligned network of CNTs in fabricated
composites could be very challenging; however, this can be performed easily through the
developed random walk model. Three-dimensional RVEs with perfectly-aligned CNTs are
attempted to calculate thermal conductivity in two alignment directions: parallel and transverse
to the travel direction of hot/cold walkers as illustrated in Figure 4.15 (a) and (b). CNTs are
aligned in the RVE with azimuthal angle variation of smaller than 10. Figure 4.15 (c) shows the
results as a function of CNT contents. It is seen that thermal conductivity increases with CNT

106
content for both alignment directions. The thermal conductivity increases more rapidly for the
parallel direction than the transverse direction. At the CNT content of 1 vol. %, the thermal
conductivity of the parallel direction is higher than the transverse direction by a factor of 1.5.
This is because more paths are provided to the thermal walkers when CNTs are aligned in the
same direction to the travel direction of walkers.
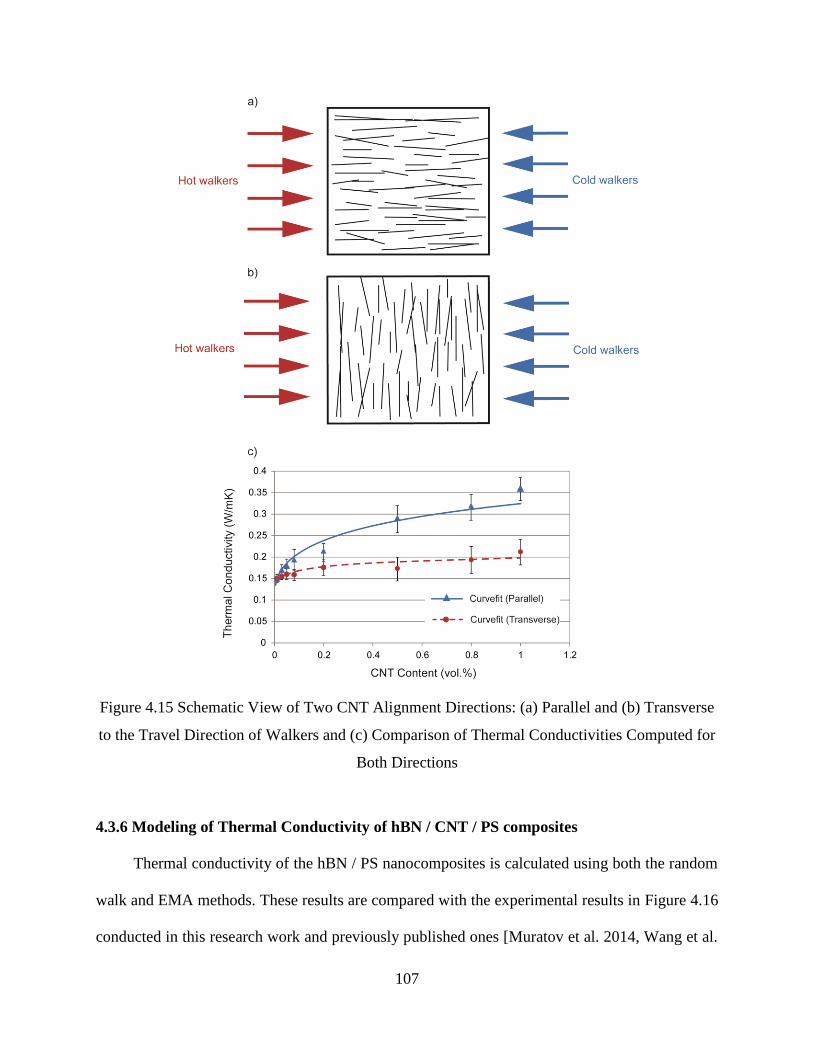
107
Figure 4.15 Schematic View of Two CNT Alignment Directions: (a) Parallel and (b) Transverse
to the Travel Direction of Walkers and (c) Comparison of Thermal Conductivities Computed for
Both Directions
4.3.6 Modeling of Thermal Conductivity of hBN / CNT / PS composites
Thermal conductivity of the hBN / PS nanocomposites is calculated using both the random
walk and EMA methods. These results are compared with the experimental results in Figure 4.16
conducted in this research work and previously published ones [Muratov et al. 2014, Wang et al.
108
2014]. Furthermore, to investigate the effects of the addition of CNTs to hBN / PS composites,
two types of specimens with equal contents of hBN and CNT are fabricated. Thermal
conductivity of these specimens are also calculated through the random walk model and
compared with experimental results. For hBN / PS composites, results obtained from the EMA
do not agree with the experimental values, especially in higher concentrations. This could be
attributed to the fact that dispersion of the hBN nanoparticulates are considered as homogenized
and randomly dispersed (<Cos2θ>=1/3) in the EMA model. However, for the fabricated hBN
nanocomposites, there could still be some agglomerations among hBN nanoparticulates. One can
realize that predicted values using random walk modeling are higher than experimentally
measured value, which contradicts with results of Figure 4.14 with predicted values lower than
experiments. This outcome could be attributed to the difference in the fillers geometry (1D CNTs
versus 2D hBNs) and contact resistances (10-10
m2K/W for CNTs and 7 × 10
-10 m
2K/W for
hBNs).

109
Figure 4.16 Comparison of the Thermal Conductivity Results Obtained from EMA, Random
Walk Model, and Experiments
Hybrid-filled nanocomposites (with both hBN and CNT) have thermal conductivity higher
than nanocomposites containing only hBN nanoparticulates. The high thermal conductivity of
hybrid composites is achieved probably because of using both cylindrical and 2D shapes of
nanoparticulates. When cylindrical inclusions like CNTs are combined with nanoplatelets such
as graphene, CNTs can form an extended filler network by bridging neighbouring nanoplatelets
[Mahmoodi et al. 2013, Yu et al. 2008, Khan 2012, Chan et al. 2012, Li et al. 2014]. Therefore,
due to the fact that graphene and hBN fillers have similar shapes, the same effect could be
expected.
In addition to the above, Figure 4.16 includes results from random walk modeling. It shows
that an increase of the hBN nanoparticulate content enhances thermal conductivity. However,
higher thermal conductivity in all hBN concentrations are observed in the modeling, compared to
experiments. The effect of hybrid compositions (combination of 1D CNTs and 2D hBNs) is
110
reflected in the random walk modeling. Similar to the experimental results, hybrid composites of
CNTs and hBNs have higher thermal conductivity values than those containing only hBN
nanoparticulates. The disagreement between the random walk modeling and experiments could
be attributed to better dispersion generated by a fully computational modeling within the RVE.
However, as discussed earlier, hBN particulates are not completely separated during mixing
nanocomposites, and there could be multilayers of nano-flakes instead of one layer of hBNs.
Furthermore, agglomeration of hBNs by lower quality of mixing leads to a lower distribution of
fillers [Lin et al. 2014].
The above facts can explain the influence of the distribution and content of hBNs on the
thermal conductivity of the nanocomposites. Incorporating other effects, such as intermittent
filler contact and agglomeration of the fillers in the matrix, in the random walk model could
possibly predict the thermal conductivity of the nanocomposites more accurately.
4.6 SUMMARY
In this chapter, two electrical and thermal conductivity models based on random walk
methods were presented. The combination of these two models, one can easily predict both
electrical and thermal properties of a nanocomposite structure. Besides, using a single model for
both electrical and thermal properties results in sharing one RVE, which leads to reduced
runtime. Hence, nanocomposites with a large number of nanoparticulates, similar to real
conditions, could be investigated through the developed comprehensive model. The electrical
model was examined through investigating the effects of variations in length distribution of CNT
inclusions. The electrical modeling results were compared with the previously published research
works.
111
The thermal conductivity model was used to predict thermal conductivity of CNT /
polymer composites with different alignments, concentrations, and aspect ratio. The same model
was used for thermal conductivity of hBN / PS composites with a random dispersion and aspect
ratio of ellipsoidal inclusions. Hybrid compositions of CNT and hBN were also studied. The
thermal conductivity model was also compared with theoretical and experimental measurements.
An injection moulding technique and compression moulding were utilized to fabricate
nanocomposites with semi-aligned and randomly dispersed CNTs to investigate the effect of
CNT alignment. It was observed that alignment of CNTs might result in higher thermal
conductivity values. The developed random walk model was more precise in predicting thermal
conductivity values of composites with the random dispersion of CNTs. Both experimentally
measured and predicted results suggested that hybrid composites might have higher thermal
conductivities. This outcome could be attributed to bridging between hBN nanoparticulates (two-
dimensional) by CNTs (one-dimensional).
In the next chapter, the utilized nanoparticulates are used for fabricating a new coating
system. In addition to hBN and MWCNTs which their effects on the electrical and thermal
conductivity of nanocomposites were studied in this chapter and Chapter 3, graphene
nanoplatelets and zinc particles are also employed as fillers of the coatings. The feasibility of
using these nanoparticulates considering their composites' coating performance is studied in the
next chapter.
112
CHAPTER 5. COATING PERFORMANCE OF NANOCOMPOSITES
5.1 INTRODUCTION
For long-term protection of the carbon steel pipes using materials with superior
mechanical, thermal, and electrical performances has the critical role. High adhesion to the steel
substrate, low gas permeability, and minimized CTE mismatch between coating and carbon steel
are some of the key properties of an efficient coating [Rahman and Ismail 2012]. Several types
of inclusions such as ZnO particles, carbon black, nickel zinc ferrite, clay, and CNTs have been
added to the coating materials to fabricate high performance coatings [Kalendova 2003, Wei et
al. 2007, Liu, Shao et al. 2015, Gergely et al. 2012].
Utilizing nanomaterials within the coatings can lead to coating materials with higher
adhesion to steel, scratch resistance, and surface hardness levels. These properties can be
obtained through using nanoparticulates with exceptional mechanical properties and structures
such as CNTs, GNPs, and hBNs. Excellent mechanical properties and aspect ratios of GNPs and
hBNs can also reduce gas permeability and thermal expansion of the coating materials. Lower
gas permeability and thermal expansion mismatch can minimize the chance of corrosion
initiation [Rout et al. 2011, Olga et al. 2004, Yeh et al. 2006, Dong et al. 2008].
Besides the mentioned features, which indirectly enhance the corrosion protection of the
coatings, the corrosion protection of the coatings can also be improved through using inclusions
with sacrificial behaviour [Valencia 2015]. In this study, a hybrid composition of zinc particles
and CNTs are used for increasing the corrosion protection of the coating materials. The purpose
of the hybridizing CNT and zinc particles is related to insufficient mechanical properties of the
113
zinc-rich composite coatings [Knudsen et al. 2005]. The addition of CNTs enables manufacturers
to reduce the zinc loading since the required physical connections among zinc particles and steel
substrate can be provided by CNTs [Drozdz et al. 2011, Park and Shon 2015].
The coating system presented in this study consists of two-layer composite coatings filled
with CNT, GNP, hBN, and zinc particles. It is aimed to improve the mechanical adhesion,
scratch resistance, and surface hardness of the coatings by using the proposed compositions. Gas
permeability and thermal expansion of the coating materials are decreased as well as
improvement in the corrosion protection under cathodic disbondment testing condition.
This chapter is organized as follows: Initially, materials, polymeric matrices and
nanoparticulates used in the coatings, and the method for dispersing nanoparticulates within the
matrices are presented. Next, different compositions of coating layers, characterization and
testing techniques, and devices for evaluating performances of the coating layers are described.
The results of the conducted tests and characterizations on the fabricated coating system are then
revealed. Characterization results, such as viscosity behaviour of the used polymers, scanning
electron microscopy (SEM) observation of the nanocomposites, and electrical, and thermal
conductivity of nanocomposites are disclosed. Finally, outcomes of the experiments performed
on the coated samples are discussed and compared with previously explained models.
5.2 EXPERIMENTS
In this section, polymeric materials – acrylic and epoxy – used as the matrices for
nanocomposite coatings are described. A brief description of the used nanoparticulates – multi-
walled carbon nanotubes (MWCNT), graphene nanoplatelets (GNP), and hexagonal boron
nitride (hBN) – are provided, followed by properties of the zinc particles as the sacrificial
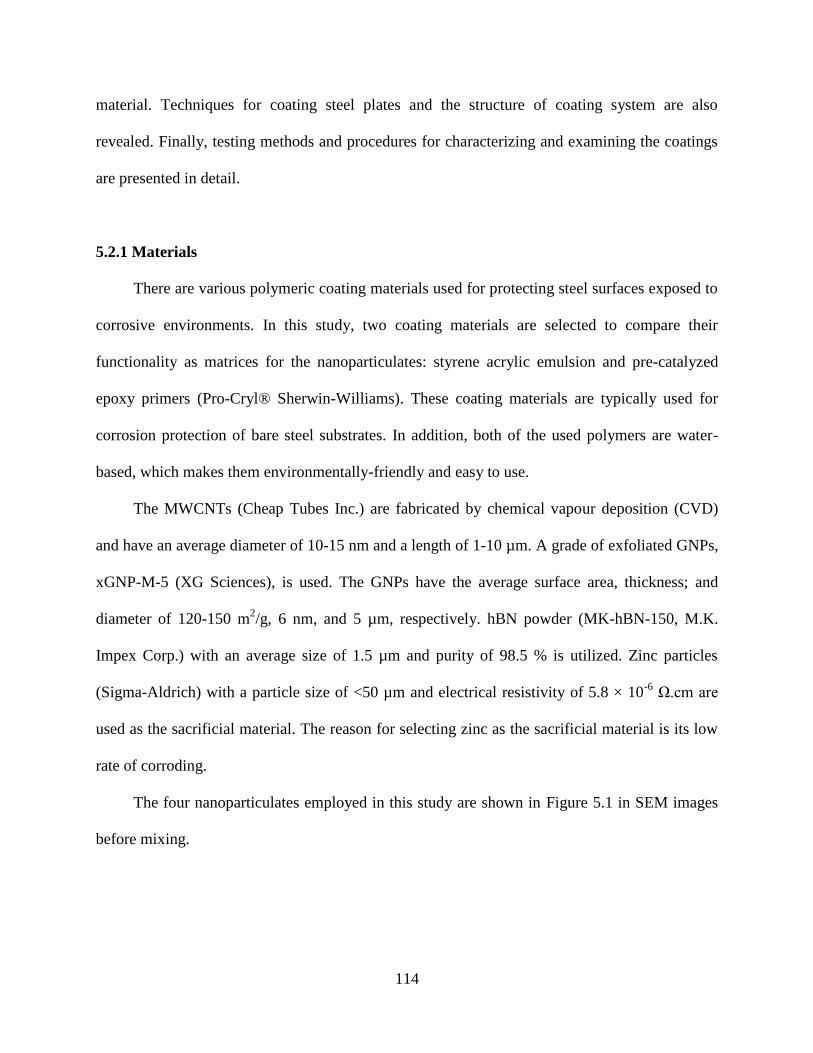
114
material. Techniques for coating steel plates and the structure of coating system are also
revealed. Finally, testing methods and procedures for characterizing and examining the coatings
are presented in detail.
5.2.1 Materials
There are various polymeric coating materials used for protecting steel surfaces exposed to
corrosive environments. In this study, two coating materials are selected to compare their
functionality as matrices for the nanoparticulates: styrene acrylic emulsion and pre-catalyzed
epoxy primers (Pro-Cryl® Sherwin-Williams). These coating materials are typically used for
corrosion protection of bare steel substrates. In addition, both of the used polymers are water-
based, which makes them environmentally-friendly and easy to use.
The MWCNTs (Cheap Tubes Inc.) are fabricated by chemical vapour deposition (CVD)
and have an average diameter of 10-15 nm and a length of 1-10 µm. A grade of exfoliated GNPs,
xGNP-M-5 (XG Sciences), is used. The GNPs have the average surface area, thickness; and
diameter of 120-150 m2/g, 6 nm, and 5 µm, respectively. hBN powder (MK-hBN-150, M.K.
Impex Corp.) with an average size of 1.5 µm and purity of 98.5 % is utilized. Zinc particles
(Sigma-Aldrich) with a particle size of <50 µm and electrical resistivity of 5.8 × 10⁻⁶
Ω.cmare
used as the sacrificial material. The reason for selecting zinc as the sacrificial material is its low
rate of corroding.
The four nanoparticulates employed in this study are shown in Figure 5.1 in SEM images
before mixing.
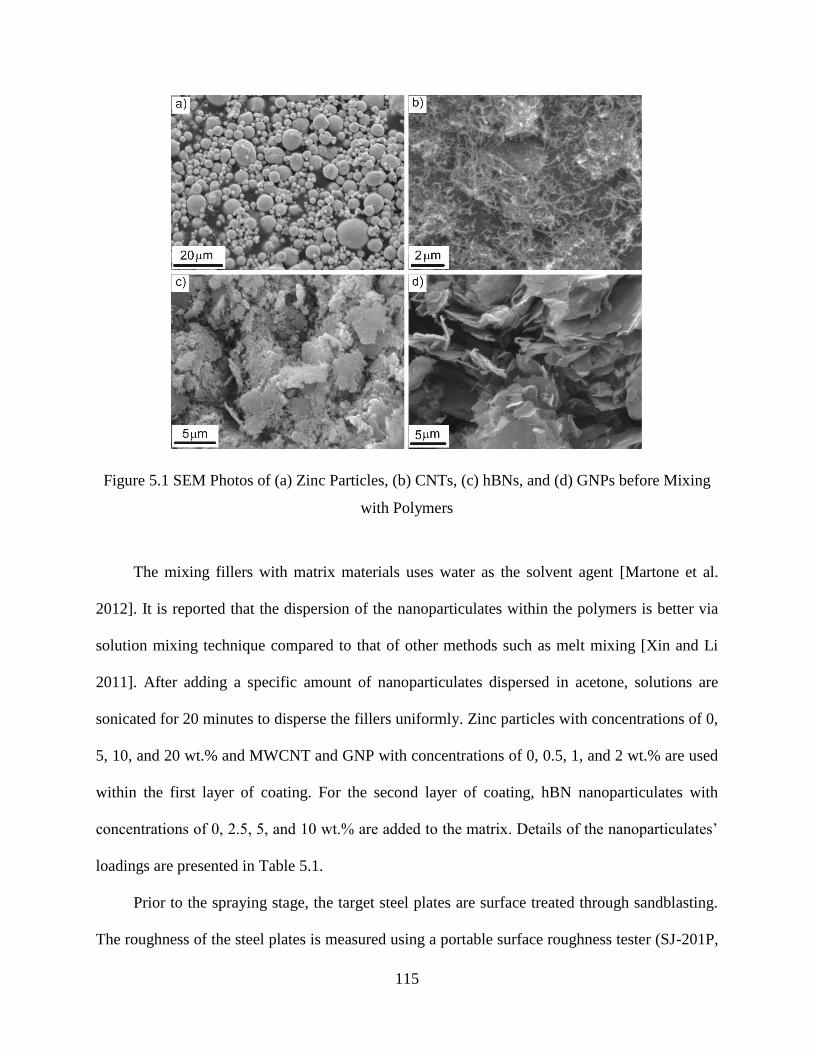
115
Figure 5.1 SEM Photos of (a) Zinc Particles, (b) CNTs, (c) hBNs, and (d) GNPs before Mixing
with Polymers
The mixing fillers with matrix materials uses water as the solvent agent [Martone et al.
2012]. It is reported that the dispersion of the nanoparticulates within the polymers is better via
solution mixing technique compared to that of other methods such as melt mixing [Xin and Li
2011]. After adding a specific amount of nanoparticulates dispersed in acetone, solutions are
sonicated for 20 minutes to disperse the fillers uniformly. Zinc particles with concentrations of 0,
5, 10, and 20 wt.% and MWCNT and GNP with concentrations of 0, 0.5, 1, and 2 wt.% are used
within the first layer of coating. For the second layer of coating, hBN nanoparticulates with
concentrationsof0,2.5,5,and10wt.%areaddedtothematrix.Detailsofthenanoparticulates’
loadings are presented in Table 5.1.
Prior to the spraying stage, the target steel plates are surface treated through sandblasting.
The roughness of the steel plates is measured using a portable surface roughness tester (SJ-201P,
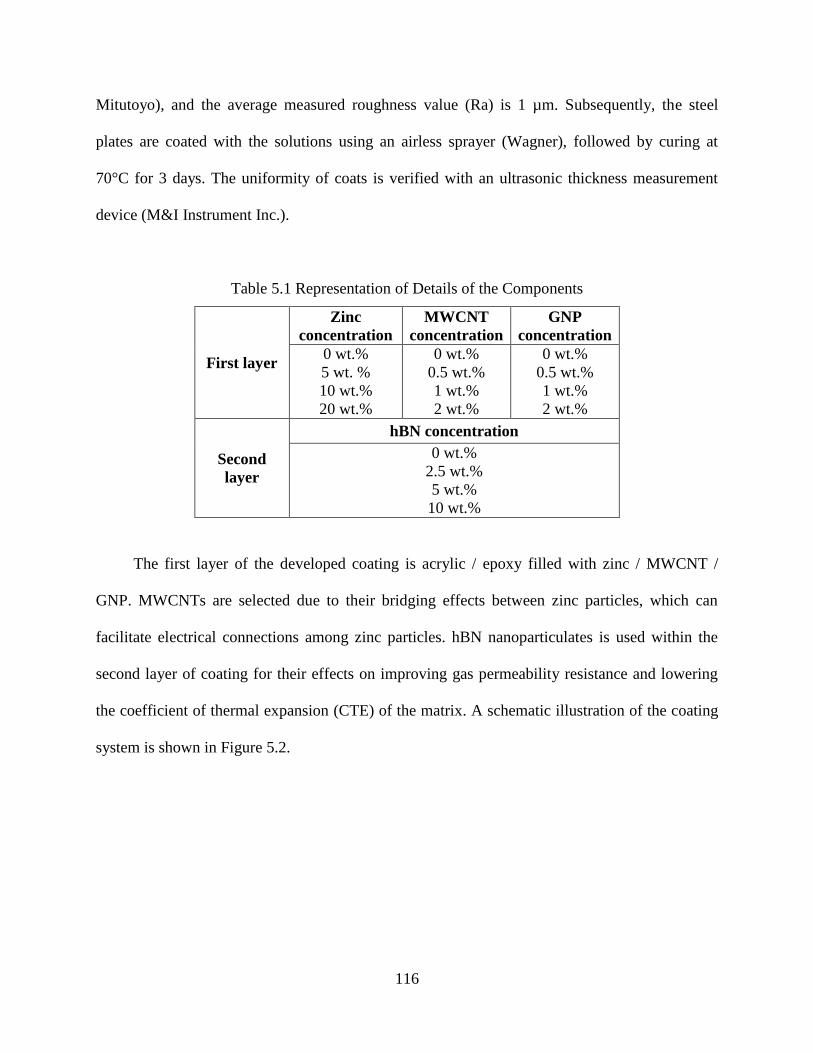
116
Mitutoyo), and the average measured roughness value (Ra) is 1 µm. Subsequently, the steel
plates are coated with the solutions using an airless sprayer (Wagner), followed by curing at
70°C for 3 days. The uniformity of coats is verified with an ultrasonic thickness measurement
device (M&I Instrument Inc.).
Table 5.1 Representation of Details of the Components
First layer
Zinc
concentration
MWCNT
concentration
GNP
concentration
0 wt.%
5 wt. %
10 wt.%
20 wt.%
0 wt.%
0.5 wt.%
1 wt.%
2 wt.%
0 wt.%
0.5 wt.%
1 wt.%
2 wt.%
Second
layer
hBN concentration
0 wt.%
2.5 wt.%
5 wt.%
10 wt.%
The first layer of the developed coating is acrylic / epoxy filled with zinc / MWCNT /
GNP. MWCNTs are selected due to their bridging effects between zinc particles, which can
facilitate electrical connections among zinc particles. hBN nanoparticulates is used within the
second layer of coating for their effects on improving gas permeability resistance and lowering
the coefficient of thermal expansion (CTE) of the matrix. A schematic illustration of the coating
system is shown in Figure 5.2.
117
Figure 5.2 Design of the Hybrid Composite Coating
As the coatings are prepared as hybrid compositions of zinc particles combined with
MWCNT / GNP, it is hard to differentiate the effects of addition of each nanoparticulate on
coating performances. Hence, coating compositions with zinc particles only (without MWCNTs
and GNPs) are manufactured and tested; and, additional coating materials consisting MWCNTs /
GNPs only (without zinc particles) are fabricated and sprayed on the steel plates. Pure matrices
of, epoxy / acrylic without any filler are also employed as coating materials. By comparing the
coating of steel plates with the different compositions shown in Table 5.1, it is possible to reflect
the effects of each type of nanoparticulates and their synergistic effects on the coating properties
of the developed nanocomposites.
5.2.2 Test Methods and Equipment
Devices and procedures for characterizing the fabricated composite coatings are described
in this subsection. A viscosity measurement device, electrical resistivity measurement systems, a
high-precision SEM microscope for microscope observations, a pull-off testing device for
adhesion strength evaluations, a gas permeability measurement system, and a dynamic
mechanical analysis (DMA) device for CTE measurements are represented. Details of a setup for
scratch resistance measurement of composite coatings are also presented. An electrochemical
118
cell is used for examination of cathodic disbondment, and the testing conditions are described in
detail. Finally, a device for examining the surface hardness of the coated plates is introduced.
5.2.2.1 Viscosity Measurements
As one of the main parameters affecting the mixing stage of the polymeric matrix and
nanoparticulates, the viscosity of epoxy and acrylic matrices are measured by a viscometer at
room temperature (CAP 2000+ Series, Brookfield Engineering Labs Inc.). The viscosity of liquid
polymers is measured with cone-plate geometry in the rotational speed range of 30 to 1000 RPM
and the results are presented.
5.2.2.2 Electrical Resistivity Measurements
To evaluate the dispersion of the nanoparticulates within the polymers, the electrical
conductivity of the nanocomposites is measured. Nanocomposites with poor mixing qualities
have lower electrical conductivities, due to agglomerations and a lack of uniform dispersed
nanoparticulates [TabkhPaz el al. 2015]. High electrical conductivities are required in the first
layer to have greater sacrificial behaviour [Park and Shon 2015]. However, electrically insulating
materials are more favourable for the second layer of the coatings.
The volume resistivity measurements are performed using two DC resistivity meters,
Loresta GP (Mitsubishi, MCP-T610) and Keithley 8009 (Keithly Instruments). For the samples
with volume resistivity of less than 104 Ω.cm, a Loresta GP resistivity meter is used following
the ASTM 257-75 standard; and, for the samples with larger volume resistivity values, a
Keithley resistivity meter is employed with an applied voltage of 10 V.
119
5.2.2.3 SEM Observations
SEM images are taken from the cross section of the two-layer coats to characterize the
coatings and the interactions among the nanoparticulates. After adhesion strength testing of
coating materials using a dolly, some materials remain on the surface of the dolly. These
materials consist of the exact two layers of coatings. A high-resolution Philips XL30 SEM is
used to take pictures from coating layers and nanoparticulates. To differentiate the
nanoparticulates, an energy dispersive X-ray spectroscopy (EDS) is used for quantitative analysis
of the elemental composition of samples under SEM.
5.2.2.4 Adhesion of Coatings
To measure the adhesion strength of the coated layers, a portable adhesion tester
(PosiTestTM
) is used, according to the ASTM D4541 standard. This procedure is selected
because its measurements are quantitative and reproducible. In this method, a dolly is attached to
the coating surface with an adhesive material (commercial epoxy glue) stronger than the
adhesion of the coating to the steel. After attaching the dolly to the surface, the pull-off adhesion
strength is determined according to the ASTM D7234 standard. A schematic of the adhesion
tester is depicted in Figure 5.3.
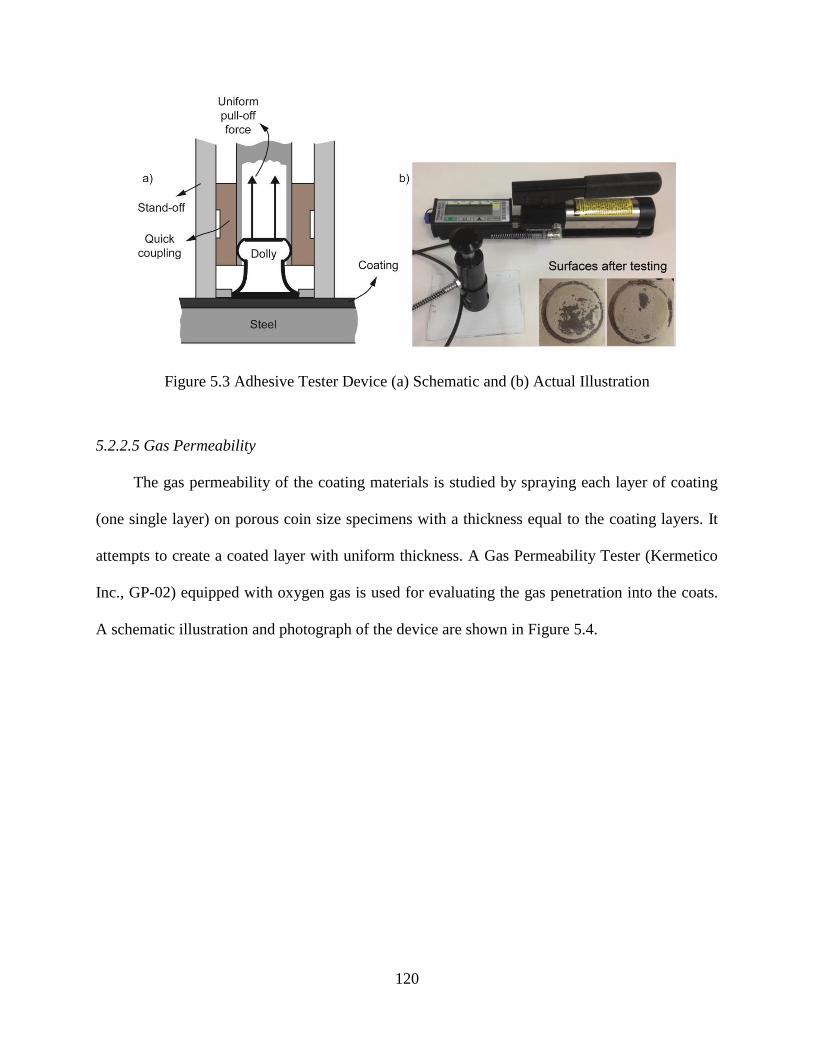
120
Figure 5.3 Adhesive Tester Device (a) Schematic and (b) Actual Illustration
5.2.2.5 Gas Permeability
The gas permeability of the coating materials is studied by spraying each layer of coating
(one single layer) on porous coin size specimens with a thickness equal to the coating layers. It
attempts to create a coated layer with uniform thickness. A Gas Permeability Tester (Kermetico
Inc., GP-02) equipped with oxygen gas is used for evaluating the gas penetration into the coats.
A schematic illustration and photograph of the device are shown in Figure 5.4.
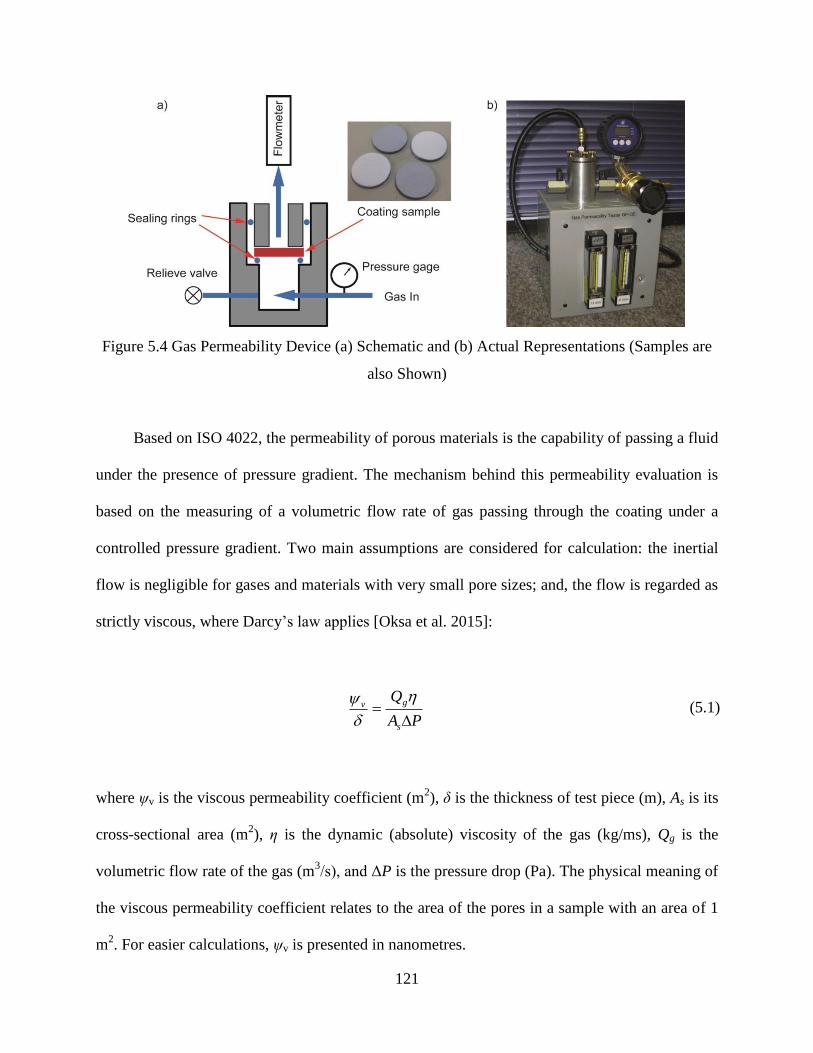
121
Figure 5.4 Gas Permeability Device (a) Schematic and (b) Actual Representations (Samples are
also Shown)
Based on ISO 4022, the permeability of porous materials is the capability of passing a fluid
under the presence of pressure gradient. The mechanism behind this permeability evaluation is
based on the measuring of a volumetric flow rate of gas passing through the coating under a
controlled pressure gradient. Two main assumptions are considered for calculation: the inertial
flow is negligible for gases and materials with very small pore sizes; and, the flow is regarded as
strictly viscous, where Darcy’slawapplies [Oksa et al. 2015]:
PA
Q
s
gv
(5.1)
where ψv is the viscous permeability coefficient (m2), δ is the thickness of test piece (m), As is its
cross-sectional area (m2), η is the dynamic (absolute) viscosity of the gas (kg/ms), Qg is the
volumetric flow rate of the gas (m3/s),andΔP is the pressure drop (Pa). The physical meaning of
the viscous permeability coefficient relates to the area of the pores in a sample with an area of 1
m2. For easier calculations, ψv is presented in nanometres.
122
Coating materials are sprayed on disks with a 25.4 mm diameter, a 3.175 mm thickness,
and an average pore size of 2 microns. The disks do not hinder gas flow remarkably, yet have
enough strength to allow coatings to be sprayed on them. The thickness of coatings may range
from 50 to 200 microns. Two greased rubber O-rings are used for sealing the test cell.
O2 gas under controlled pressure (0-2 MPa) is introduced into the cell under the coating
while the gas flow rate is measured above the coating (Figure 5.4) [Oksa et al. 2015]. The
viscous permeability coefficient ψv (nm2) can be determined from:
P
Qg
v
8870 (5.2)
where Qg, δ,andΔP are the flow rate (cm3/min), coating thickness (cm), and gas pressure drop
(bar), respectively. It isassumed thatsample’s area and oxygen dynamic viscosity are 2.3 cm2
and 2.04×10⁻⁵
Pa.s, respectively.
5.2.2.6 Coefficient of Thermal Expansion (CTE)
For evaluating the effects of nanoparticulates on the thermal expansion rates of the
nanocomposites, each coating layer is tested separately. It is very difficult to fabricate and test
specimens with a thickness equal to that of the coating layers, around 300 µm. Therefore, coating
samples with 1 mm thickness are fabricated and used for CTE measurements. Epoxy and acrylic
samples are cured inside a vacuum drying oven (DZF-6050), which can minimize the voids and
entrapped bubbles. To measure the CTE of composites, a dynamic mechanical analysis system
(DMA, Q800, TA Instruments Inc.) is employed. Through measuring thermal expansions, a
minuscule tension force (0.01 N) is introduced to the composite samples. Expansion of the
123
samples is measured versus temperature variations. It is assumed that the introduced force is very
small and does not have influence on the linear expansion of the samples. It is also supposed that
the enlargement of the samples through thickness and width are negligible compared to the one
through the length direction. The linear thermal expansion of acrylic and epoxy samples without
any added materials is measured for calibration of the setup. It is observed that the outcomes are
in the same range of the reported CTE values. A schematic illustration of the DMA test setup is
depicted in Figure 5.5.
Figure 5.5 Test Setup for Measuring Linear Thermal Expansion of Composites
The length of the CTE sample is increased as the temperature rises (1°C per minute from
25 to 70°C). ΔL represents the linear expansion of the sample and can be measured by finding
the lengths of the sample at 25°C (L1) and 70°C (L2). Locating the initial and the final position of
the driver clamp (the left side clamp shown in Figure 5.5), L1 and L2 can be easily calculated. In
124
Figure 5.5, L0 is the distance between two clamps (17.7 mm), and the width of the samples is
fixed at 10.6 mm. After running the tests, strain versus temperature curves of each sample can be
found, and, the CTE of the sample, which is the slope of the curve, can be measured.
5.2.2.7 Cathodic Disbondment Testing
Cathodic disbondment testing is the one of the techniques for assessing the protection
performances of coatings. In this technique, a coating disbonds due to a cathode reaction at a
location of damage through the coating to the steel. Disbondment during this test occurs by the
creation of hydroxyl ions, which can decrease the acidity at the coating and steel interface. The
high performance of the composite materials in this test correlates to other critical aspects of
coating, such as adhesion [Harun et al. 2005]. Cathode reaction exists due to the corrosion
process in protected systems such as pipelines and marine structures [Guezennec 1991].
The test is carried out on spray-coated steel plates following the BS 3900 standard. A
holiday is drilled in the center of the coated plates to mimic a damage site, using a 6 mm drilling
tool. Then, a clear plastic tube with a diameter of 10 cm is glued on the center of the plates over
the damaged site. A silicon rubber sealant is used to seal the plastic tube. A platinum anode is
used for each cell and placed inside the cup with an approximate distance to damage site of 10
mm. All the cells are connected to a source capable of creating specific DC voltage. A 3 wt.%
sodium chloride (NaCl) / water solution is used as an electrolyte and fills the cell up to a depth of
50 mm. A voltmeter and a saturated calomel reference electrode (Fisher Scientific) are used to
ensure that the voltage between the electrolyte and the steel substrate is 1.5 volts. The reference
electrode is used to adjust the input voltage every day for the first four days and every four days
afterward. Figure 5.6 represents the cell used for the cathodic disbondment test.
125
Figure 5.6 Cathodic Disbondment Test Cell
This test is carried out for 28 days. After this period, the plastic tube is detached from the
coating and radial incisions are cut on the surface of the coating passing the holiday. The coating
material around the holiday is then broken away to expose the substrate surface. It is harder to
detach locations where less disbondment has occurred. Residual coating suggests that the
disbondment has not fully occurred.
5.2.2.8 Scratch Resistance and Hardness Tests
Scratch testing is conducted on the samples for measuring the mechanical properties of the
coating layers. This technique is selected because it is relatively surface specific compared to
other mechanical testing methods [Burnett et al. 1987].
As previously discussed, the steel is prepared by sandblasting before application of the
coating [van den Bosch et al. 2008, Ramamurthi et al. 2013]. After spraying the nanocomposite
coatings on the steel substrates, a method for measuring the scratch resistance of the coatings is
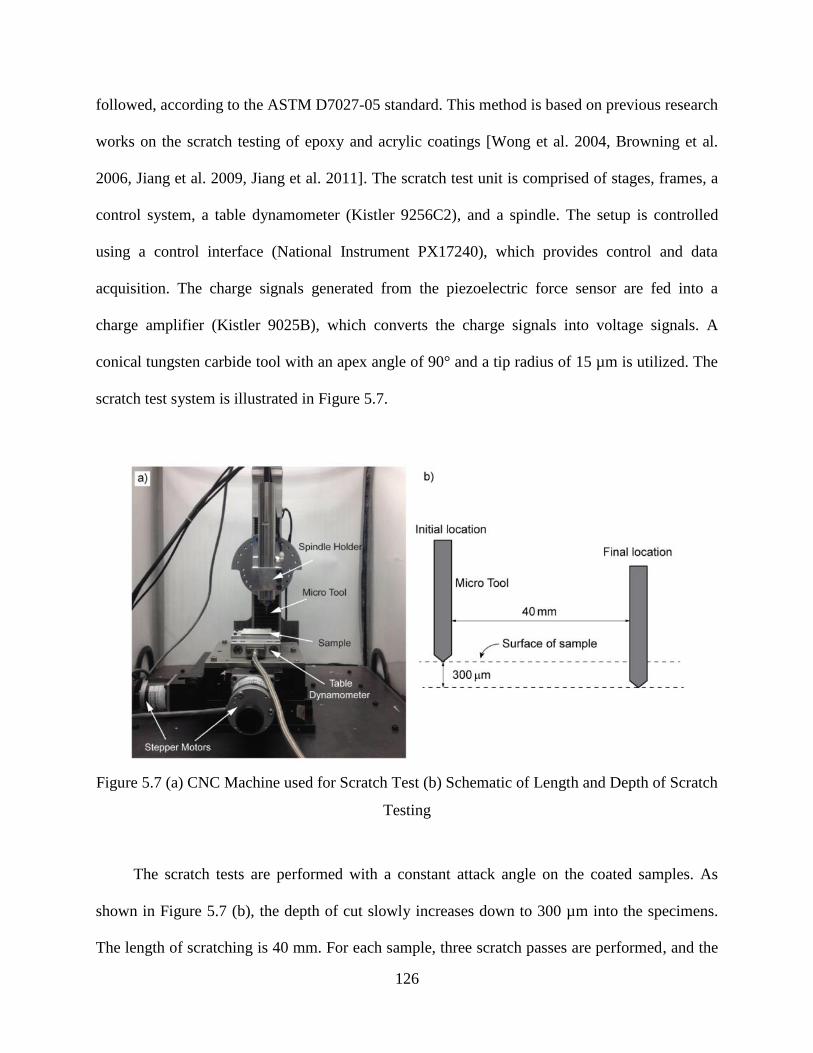
126
followed, according to the ASTM D7027-05 standard. This method is based on previous research
works on the scratch testing of epoxy and acrylic coatings [Wong et al. 2004, Browning et al.
2006, Jiang et al. 2009, Jiang et al. 2011]. The scratch test unit is comprised of stages, frames, a
control system, a table dynamometer (Kistler 9256C2), and a spindle. The setup is controlled
using a control interface (National Instrument PX17240), which provides control and data
acquisition. The charge signals generated from the piezoelectric force sensor are fed into a
charge amplifier (Kistler 9025B), which converts the charge signals into voltage signals. A
conical tungsten carbide tool with an apex angle of 90° and a tip radius of 15 µm is utilized. The
scratch test system is illustrated in Figure 5.7.
Figure 5.7 (a) CNC Machine used for Scratch Test (b) Schematic of Length and Depth of Scratch
Testing
The scratch tests are performed with a constant attack angle on the coated samples. As
shown in Figure 5.7 (b), the depth of cut slowly increases down to 300 µm into the specimens.
The length of scratching is 40 mm. For each sample, three scratch passes are performed, and the
127
cutting forces are recorded. Following the test, the distance of the onset of the scratch-induced
debonding from the initial point can be used to find the critical load. The critical load can be
found from the force versus distance curve of each pass.
Scratch resistance measurements on specimens may also indicate the mechanical properties
of the fabricated nanocomposites, because the mechanical behaviour of the nanocomposite can
be altered with the addition of the nanoparticulates to the matrices. For example, a high
concentration of the hBN may result in a nanocomposite with high brittleness.
For the hardness of the coated plates, a surface hardness measurement device (Louis Small,
All ScaleTM
) is also used following the ASTM D785 standard. The device has an indenter
diameter of 3.175 mm. For each sample, at least five hardness tests are made, and hardness
measurements of those spots are reported. Efforts are made to select points with equal
thicknesses.
5.3 RESULTS AND DISCUSSION
In this section, the viscosity behavior of the pure polymers and SEM morphological
observations of nanoparticulates within the composites are presented. Electrical and thermal
conductivities of the fabricated nanocomposites are characterized, and the results are reported.
The outcomes from the adhesion strength tests, gas permeability evaluations, CTE
measurements, cathodic disbondment, and scratch resistance and surface hardness tests are
revealed.
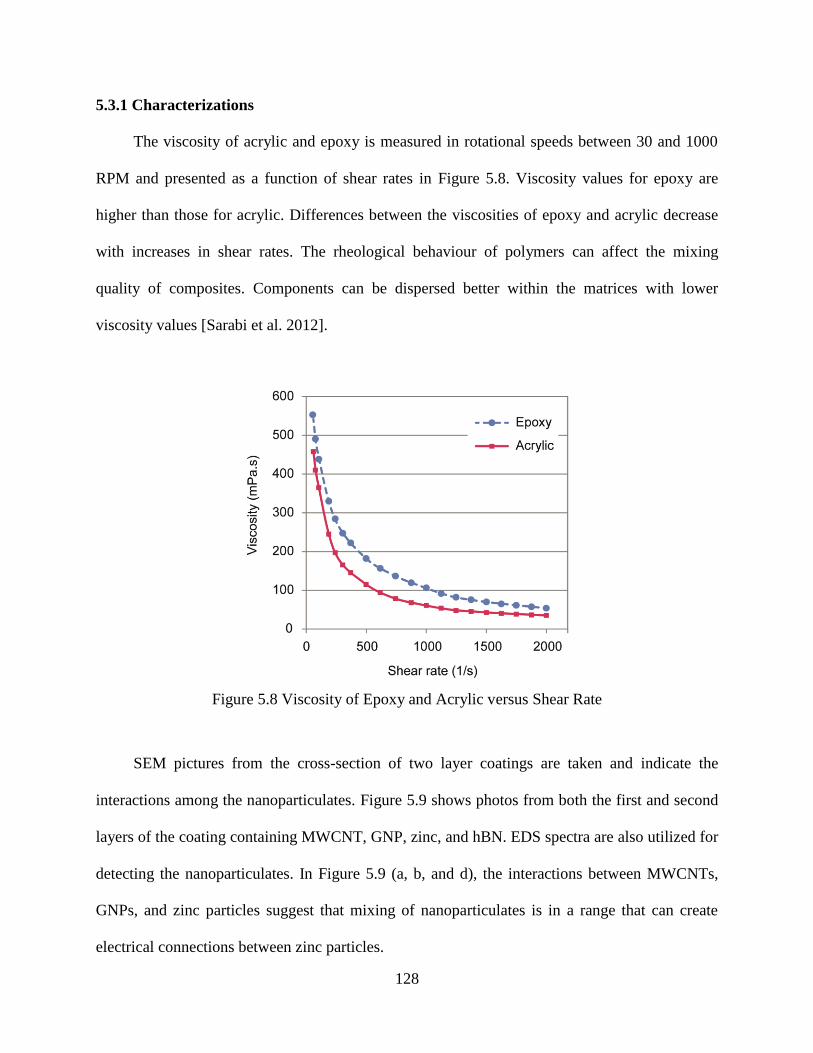
128
5.3.1 Characterizations
The viscosity of acrylic and epoxy is measured in rotational speeds between 30 and 1000
RPM and presented as a function of shear rates in Figure 5.8. Viscosity values for epoxy are
higher than those for acrylic. Differences between the viscosities of epoxy and acrylic decrease
with increases in shear rates. The rheological behaviour of polymers can affect the mixing
quality of composites. Components can be dispersed better within the matrices with lower
viscosity values [Sarabi et al. 2012].
Figure 5.8 Viscosity of Epoxy and Acrylic versus Shear Rate
SEM pictures from the cross-section of two layer coatings are taken and indicate the
interactions among the nanoparticulates. Figure 5.9 shows photos from both the first and second
layers of the coating containing MWCNT, GNP, zinc, and hBN. EDS spectra are also utilized for
detecting the nanoparticulates. In Figure 5.9 (a, b, and d), the interactions between MWCNTs,
GNPs, and zinc particles suggest that mixing of nanoparticulates is in a range that can create
electrical connections between zinc particles.
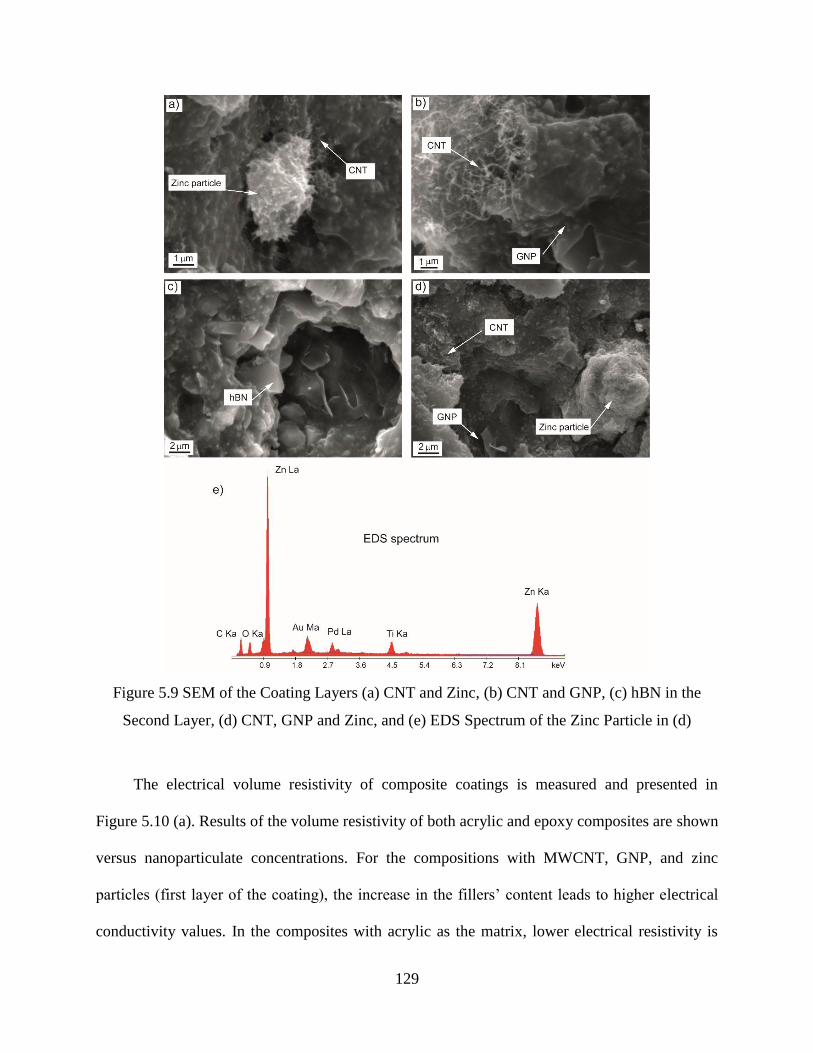
129
Figure 5.9 SEM of the Coating Layers (a) CNT and Zinc, (b) CNT and GNP, (c) hBN in the
Second Layer, (d) CNT, GNP and Zinc, and (e) EDS Spectrum of the Zinc Particle in (d)
The electrical volume resistivity of composite coatings is measured and presented in
Figure 5.10 (a). Results of the volume resistivity of both acrylic and epoxy composites are shown
versus nanoparticulate concentrations. For the compositions with MWCNT, GNP, and zinc
particles(firstlayerofthecoating),theincreaseinthefillers’contentleadstohigherelectrical
conductivity values. In the composites with acrylic as the matrix, lower electrical resistivity is
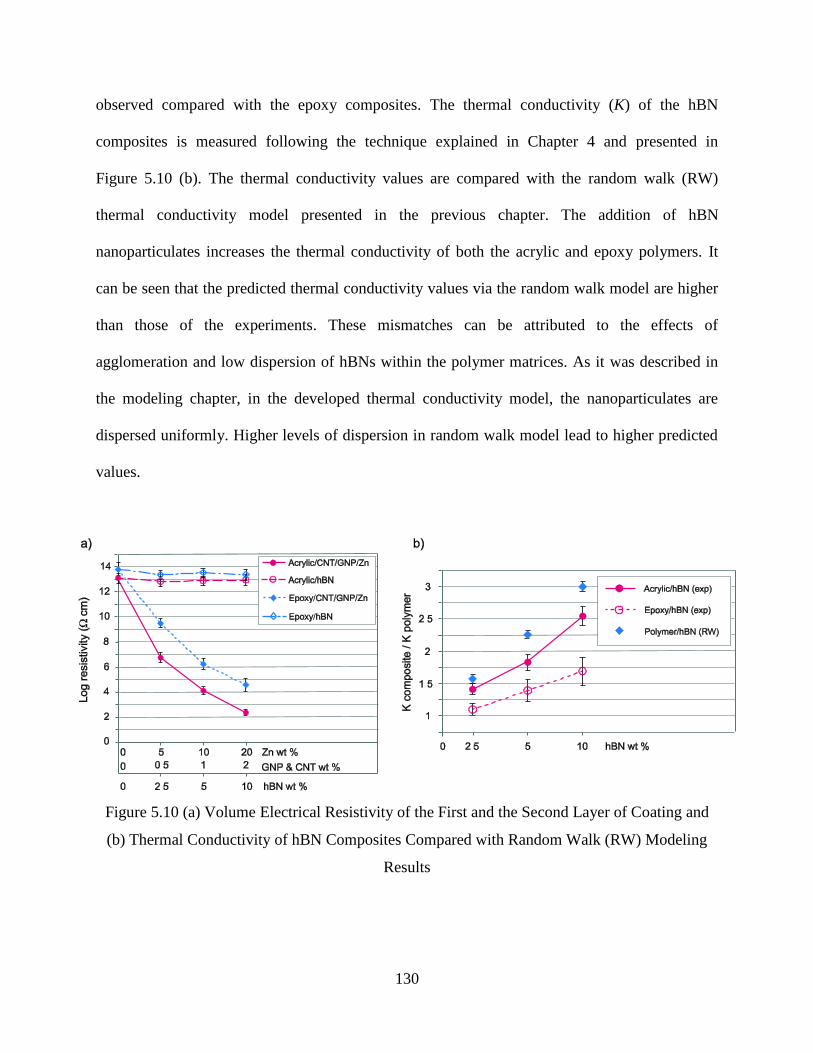
130
observed compared with the epoxy composites. The thermal conductivity (K) of the hBN
composites is measured following the technique explained in Chapter 4 and presented in
Figure 5.10 (b). The thermal conductivity values are compared with the random walk (RW)
thermal conductivity model presented in the previous chapter. The addition of hBN
nanoparticulates increases the thermal conductivity of both the acrylic and epoxy polymers. It
can be seen that the predicted thermal conductivity values via the random walk model are higher
than those of the experiments. These mismatches can be attributed to the effects of
agglomeration and low dispersion of hBNs within the polymer matrices. As it was described in
the modeling chapter, in the developed thermal conductivity model, the nanoparticulates are
dispersed uniformly. Higher levels of dispersion in random walk model lead to higher predicted
values.
Figure 5.10 (a) Volume Electrical Resistivity of the First and the Second Layer of Coating and
(b) Thermal Conductivity of hBN Composites Compared with Random Walk (RW) Modeling
Results
131
In Figure 5.10 (a), for composites with hBN as the filler, the electrical resistivity is not
affected by the addition of the filler, even in the highest concentrations (20 wt.%). This
insulating behaviour can keep the internal layers isolated from the environment. For composites
made of both polymeric matrices, a similar behaviour is seen. Consistency in electrical
conductivity of hBN composites is mainly related to the electrical insulating behaviour of hBN
nanoparticulates. However, for the first layer of coating materials, it can be suggested that the
presence of MWCNTs and GNPs, which have very high electrical conductivities and aspect
ratios, is the primary factor affecting the electrical conductivities of the composites
[Chandrasekaran et al. 2013].
The addition of zinc particles (20 wt.%) does not have a considerable effect on the
electrical conductivity of composites [Park and Shon 2015]. There are some differences between
the electrical resistivity of composites fabricated with the acrylic and epoxy polymers. One of the
effective factors can be the inherent electrical conductivity mismatch between pure polymers as
shown by the initial points in Figure 5.10 (a). In addition, as it was seen in Figure 5.8, the
viscosity behaviour of the pure acrylic matrix is lower especially at the lower shear rates. The
higher viscosity of the epoxy matrix can result in the lower distribution level of conductive
inclusions and consequently higher electrical resistivity. These assumptions can be investigated
thoroughly via morphology techniques such as TEM and SEM observations.
5.3.2 Adhesion
From the pull-off experiments, the tensile stress required for detaching the coats from the
substrate is measured. The results of pull-off tests on different coatings are presented in
Figure 5.11. In this figure, adhesion stress is shown by changes in the concentrations of the
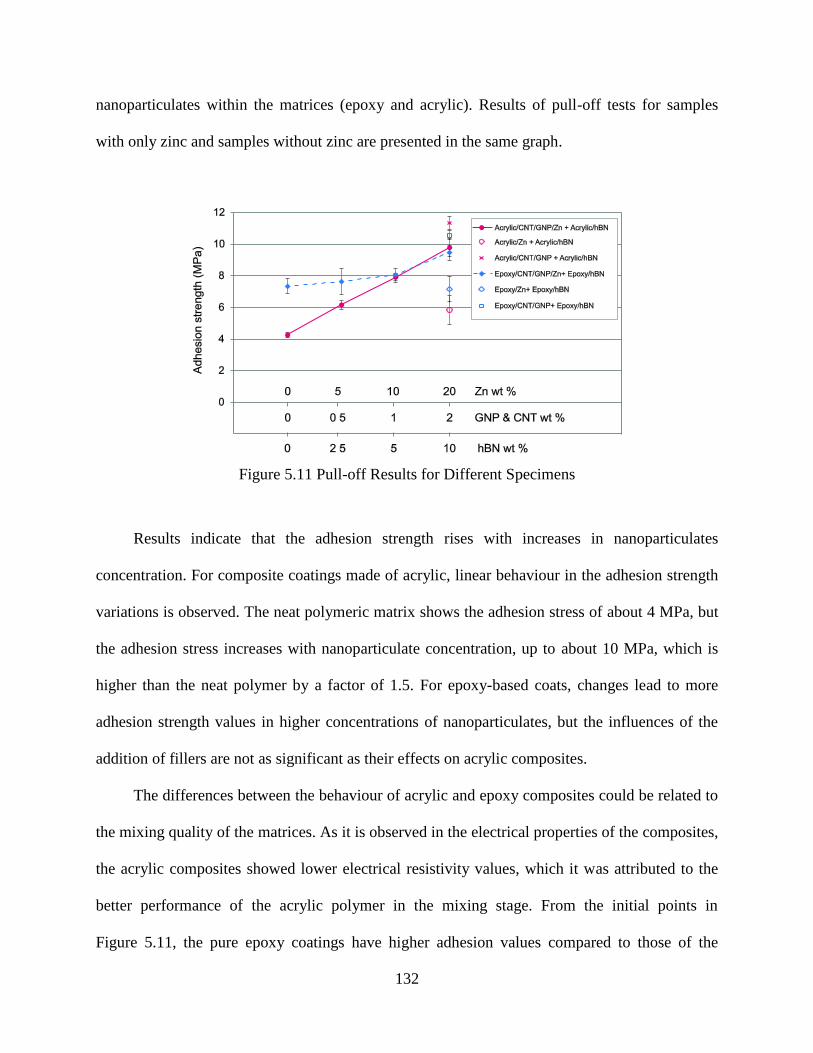
132
nanoparticulates within the matrices (epoxy and acrylic). Results of pull-off tests for samples
with only zinc and samples without zinc are presented in the same graph.
Figure 5.11 Pull-off Results for Different Specimens
Results indicate that the adhesion strength rises with increases in nanoparticulates
concentration. For composite coatings made of acrylic, linear behaviour in the adhesion strength
variations is observed. The neat polymeric matrix shows the adhesion stress of about 4 MPa, but
the adhesion stress increases with nanoparticulate concentration, up to about 10 MPa, which is
higher than the neat polymer by a factor of 1.5. For epoxy-based coats, changes lead to more
adhesion strength values in higher concentrations of nanoparticulates, but the influences of the
addition of fillers are not as significant as their effects on acrylic composites.
The differences between the behaviour of acrylic and epoxy composites could be related to
the mixing quality of the matrices. As it is observed in the electrical properties of the composites,
the acrylic composites showed lower electrical resistivity values, which it was attributed to the
better performance of the acrylic polymer in the mixing stage. From the initial points in
Figure 5.11, the pure epoxy coatings have higher adhesion values compared to those of the
133
acrylic ones. However, the addition of nanoparticulates is more effective for the acrylic
composites compared to the epoxy ones, with respect to the increase in the coating adhesion.
As it can be observed in Figure 5.12 (a), the failure in the adhesion test may occur as a
cohesive failure. Hence, the strength of the coating material may contribute to adhesion
performance. Results presented in Figure 5.11 indicate that higher concentrations of
nanoparticulates lead to stronger coating-steel adhesions. Among the nanoparticulates used in
this study, MWCNTs may play the key role in enhancing the adhesion strength of the coatings.
Increase in the adhesion of the composites may be mainly attributed to higher mechanical
strength in composites filled with MWCNTs [Park and Shon 2015]. It is reported that the
addition of MWCNTs can enhance the mechanical strength of the polymers [Hedia et al. 2006,
Spitalsky et al. 2010].
For each polymeric matrix, two additional compositions are also prepared to study the
effects of each particulate without the presence of the other: one with zinc particles only (without
MWCNTs and GNPs) in the first layer and the other with MWCNTs and GNPs only (without
zinc particles) in the first layer. For compositions with only MWCNTs and GNPs, the adhesion
values are found to be higher than those of hybrid composites with zinc: compositions with only
zinc particles are weaker under tension load applied in the pull-off test. These outcomes can
represent the effects of MWCNTs and GNPs in increasing the strength of composites, whereas
zinc particles are not as effective.
After detaching dollies from the coated sample surface, SEM pictures are taken from the
surfaces of the dollies. Figure 5.12 shows three pictures from the surface of the dollies,
illustrating the remaining coating materials, two layers of coating, and a crack initiation point
within the coating. In Figure 5.12 (a), two layers of coating remain on the dolly surface, with the
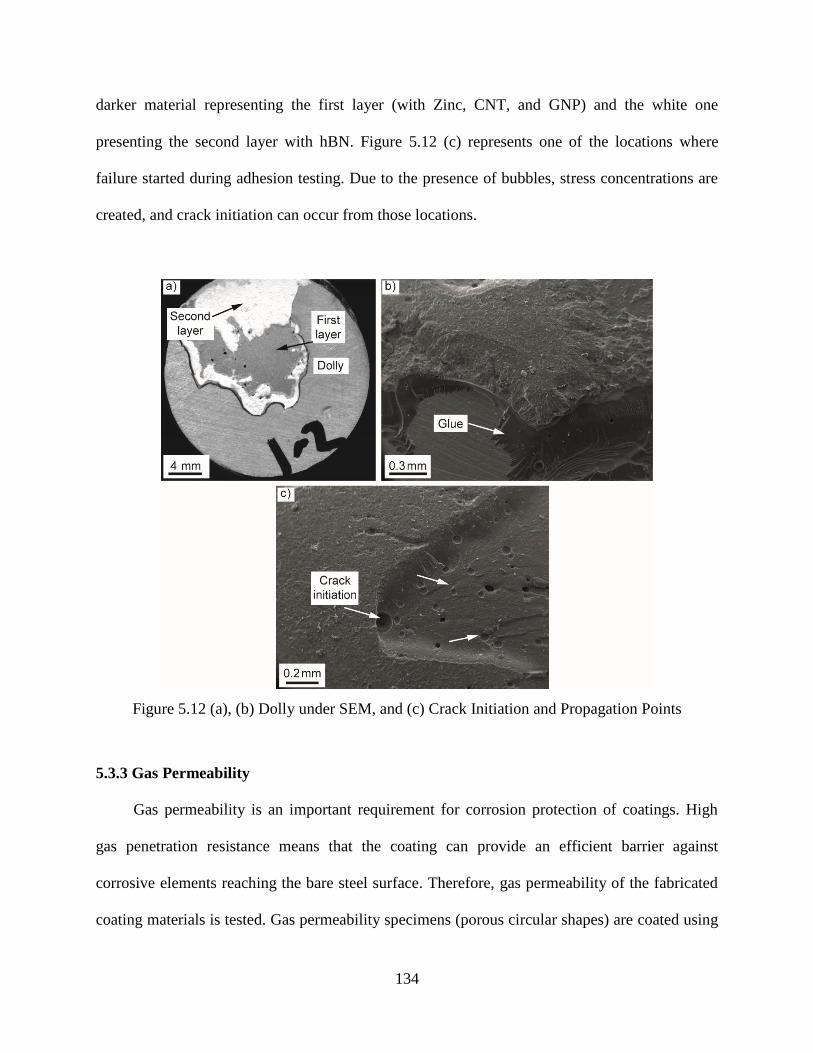
134
darker material representing the first layer (with Zinc, CNT, and GNP) and the white one
presenting the second layer with hBN. Figure 5.12 (c) represents one of the locations where
failure started during adhesion testing. Due to the presence of bubbles, stress concentrations are
created, and crack initiation can occur from those locations.
Figure 5.12 (a), (b) Dolly under SEM, and (c) Crack Initiation and Propagation Points
5.3.3 Gas Permeability
Gas permeability is an important requirement for corrosion protection of coatings. High
gas penetration resistance means that the coating can provide an efficient barrier against
corrosive elements reaching the bare steel surface. Therefore, gas permeability of the fabricated
coating materials is tested. Gas permeability specimens (porous circular shapes) are coated using
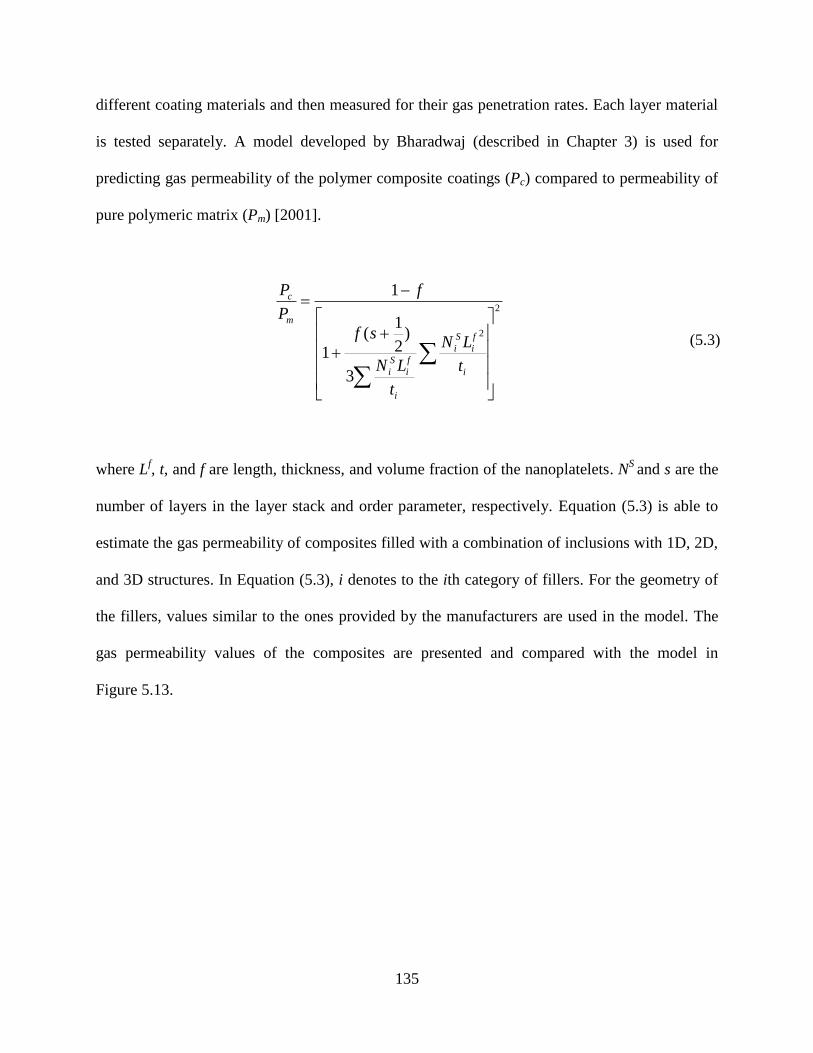
135
different coating materials and then measured for their gas penetration rates. Each layer material
is tested separately. A model developed by Bharadwaj (described in Chapter 3) is used for
predicting gas permeability of the polymer composite coatings (Pc) compared to permeability of
pure polymeric matrix (Pm) [2001].
2
2
3
)2
1(
1
1
i
f
i
S
i
i
f
i
S
i
m
c
t
LN
t
LN
sf
f
P
P
(5.3)
where Lf, t, and f are length, thickness, and volume fraction of the nanoplatelets. N
S and s are the
number of layers in the layer stack and order parameter, respectively. Equation (5.3) is able to
estimate the gas permeability of composites filled with a combination of inclusions with 1D, 2D,
and 3D structures. In Equation (5.3), i denotes to the ith category of fillers. For the geometry of
the fillers, values similar to the ones provided by the manufacturers are used in the model. The
gas permeability values of the composites are presented and compared with the model in
Figure 5.13.
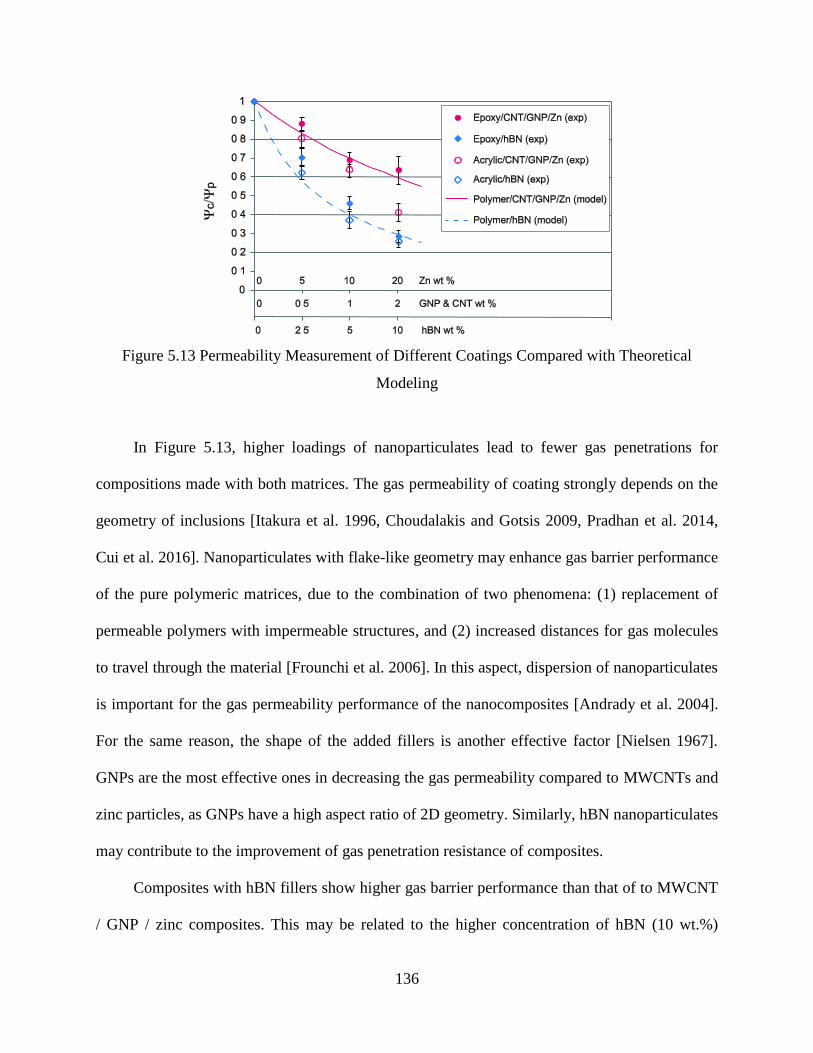
136
Figure 5.13 Permeability Measurement of Different Coatings Compared with Theoretical
Modeling
In Figure 5.13, higher loadings of nanoparticulates lead to fewer gas penetrations for
compositions made with both matrices. The gas permeability of coating strongly depends on the
geometry of inclusions [Itakura et al. 1996, Choudalakis and Gotsis 2009, Pradhan et al. 2014,
Cui et al. 2016]. Nanoparticulates with flake-like geometry may enhance gas barrier performance
of the pure polymeric matrices, due to the combination of two phenomena: (1) replacement of
permeable polymers with impermeable structures, and (2) increased distances for gas molecules
to travel through the material [Frounchi et al. 2006]. In this aspect, dispersion of nanoparticulates
is important for the gas permeability performance of the nanocomposites [Andrady et al. 2004].
For the same reason, the shape of the added fillers is another effective factor [Nielsen 1967].
GNPs are the most effective ones in decreasing the gas permeability compared to MWCNTs and
zinc particles, as GNPs have a high aspect ratio of 2D geometry. Similarly, hBN nanoparticulates
may contribute to the improvement of gas penetration resistance of composites.
Composites with hBN fillers show higher gas barrier performance than that of to MWCNT
/ GNP / zinc composites. This may be related to the higher concentration of hBN (10 wt.%)
137
compared to the concentration of GNPs (2 wt.%). However, there is another type of inclusion
(zinc particles) of high concentration (20 wt.%) within these composites, with low aspect ratio
geometry (spherical), which did not have a significant influence on gas penetration resistance
[Wu et al. 2005].
5.3.4 Coefficient of Thermal Expansion (CTE)
Thermal expansion rates of coatings are measured with a DMA system. For the application
of the coating, it is desirable to decrease the CTE values of coatings to minimize the mismatch
between the CTEs of the coating and the metallic substrate. The addition of nanoparticulates
with high aspect ratio of widths to thickness may reduce this physical property of polymeric
materials. GNP, MWCNTs, and hBN are able to decrease the CTEs of polymers, due to their
interaction [Chow 1978, Wang et al. 2007, Li et al. 2010].
Similar to gas permeability measurements, the CTE of each coating layer is measured and
presented in Figure 5.14. Decreasing the mismatch between the CTEs of the coatings and metal
is crucial in order to minimize the interfacial stresses and enhancing the stability of the coatings
[Olga et al. 2004]. A model for predicting the thermal expansion of composites filled with flakes
like inclusion is used. This theoretical method is described in detail in Chapter 2. The general
form of the model is presented in Equation (5.4).
(5.4)
where α is the thermal expansion tensor and S is the compliance tensor. The superscripts f and m
represent the filler and the polymer, respectively. In the model, the effects of the aspect ratio of
m
ij
m
mnijmnij
m
klmn
f
klmn
m
kl
f
klij SSSS )())(( 1
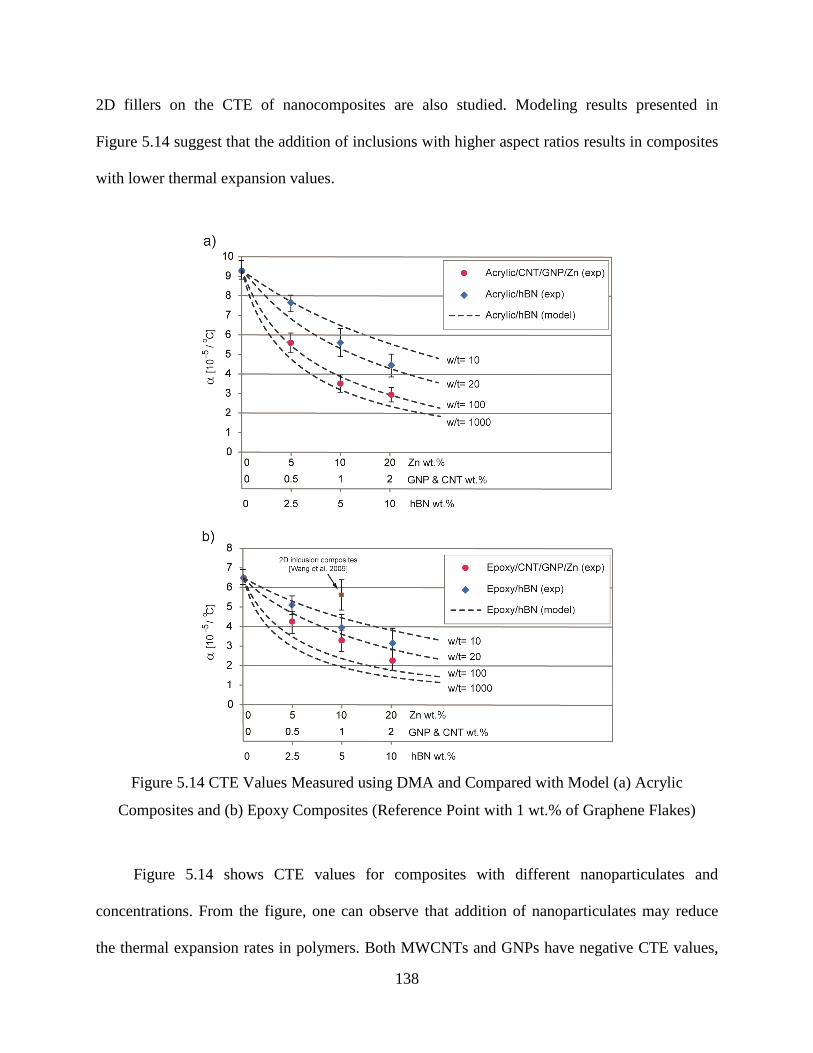
138
2D fillers on the CTE of nanocomposites are also studied. Modeling results presented in
Figure 5.14 suggest that the addition of inclusions with higher aspect ratios results in composites
with lower thermal expansion values.
Figure 5.14 CTE Values Measured using DMA and Compared with Model (a) Acrylic
Composites and (b) Epoxy Composites (Reference Point with 1 wt.% of Graphene Flakes)
Figure 5.14 shows CTE values for composites with different nanoparticulates and
concentrations. From the figure, one can observe that addition of nanoparticulates may reduce
the thermal expansion rates in polymers. Both MWCNTs and GNPs have negative CTE values,
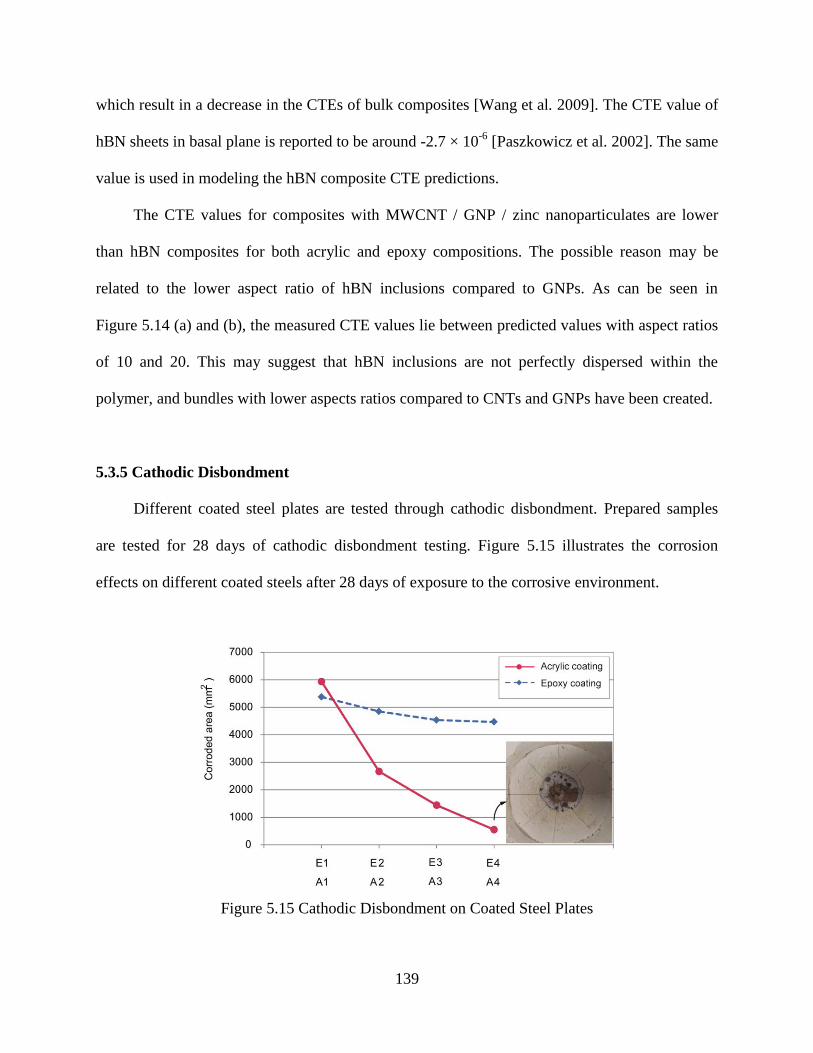
139
which result in a decrease in the CTEs of bulk composites [Wang et al. 2009]. The CTE value of
hBN sheets in basal plane is reported to be around -2.7 × 10⁻⁶
[Paszkowicz et al. 2002]. The same
value is used in modeling the hBN composite CTE predictions.
The CTE values for composites with MWCNT / GNP / zinc nanoparticulates are lower
than hBN composites for both acrylic and epoxy compositions. The possible reason may be
related to the lower aspect ratio of hBN inclusions compared to GNPs. As can be seen in
Figure 5.14 (a) and (b), the measured CTE values lie between predicted values with aspect ratios
of 10 and 20. This may suggest that hBN inclusions are not perfectly dispersed within the
polymer, and bundles with lower aspects ratios compared to CNTs and GNPs have been created.
5.3.5 Cathodic Disbondment
Different coated steel plates are tested through cathodic disbondment. Prepared samples
are tested for 28 days of cathodic disbondment testing. Figure 5.15 illustrates the corrosion
effects on different coated steels after 28 days of exposure to the corrosive environment.
Figure 5.15 Cathodic Disbondment on Coated Steel Plates
140
Descriptions of the samples (A1, A2, A3, A4, E1, E2, E3, E4) are tabulated in Table 5.2.
As shown in Figure 5.15, two rows of pictures represent coated steels with the two polymeric
matrices (acrylic and epoxy). Samples A1 and E1 are pure matrices without any additional
fillers. The A4 and E4 samples have the composite coatings with the highest level of
particulates’concentrations.
Table 5.2 Description of Samples Illustrated in Figure 5.15
Sample
with
acrylic
Zinc
(wt.%)
Nanoparticulates
(wt.%)
Samples
with
epoxy
Zinc
(wt.%)
Nanomaterials
(wt.%)
A1 0
0 MWCNT
0 GNP
0 hBN
E1 0
0 MWCNT
0 GNP
0 hBN
A2 0
2 MWCNT
2 GNP
10 hBN
E2 0
2 MWCNT
2 GNP
10 hBN
A3 20
0 MWCNT
0 GNP
10 hBN
E3 20
0 MWCNT
0 GNP
10 hBN
A4 20
2 MWCNT
2 GNP
10 hBN
E4 20
2 MWCNT
2 GNP
10 hBN
Both of the coatings made of pure matrices (A1 and E1) created more corroded area
compared to the other coatings. However, there is not a noticeable difference among samples
fabricated using epoxy as their matrices. This outcome may be related to the low cathodic
protection of the matrix, in which the effects of the addition of fillers are not noticeable. On the
contrary, acrylic based composites behave differently, and changes in the corroded areas are
observable in Figure 5.15. The highest corrosion resistant coating among the tested ones is A4,
141
which is the composition of 20 wt.% zinc particles combined with MWCNTs and GNPs (2 wt.%
for each) in the first layer and 10 wt.% hBN in the second layer.
Comparing the results of A4 with those of A1, A2, and A3, one can conclude that hybrid
compositions of zinc and MWCNTs may result in higher cathodic disbondment resistances. In
addition, the comparison of samples A4 and A3 can reflect the effects of the addition of
MWCNTs and GNPs to the zinc composites. For sample A3, which only consists of zinc
particles in the first layer, there is less corroded area visible compared to the non-filled sample of
A1. However, the addition of carbon nanoparticulates with very high electrical conductivity and
aspect ratio enhances the cathodicdisbondment(A4).ThisresultcanbeattributedtoMWCNTs’
role as an effective electrical bridge between the zinc particles and carbon steel [Chen et al.
2005, Praveen et al. 2007, Gergely et al. 2013], resulting in more improvement in corrosion
protection [Park and Shon 2015]. The effects of the addition of MWCNTs on the electrical
conductivity of the acrylic and epoxy composites are presented in Figure 5.10
5.3.6 Scratch and Surface Hardness
Scratch resistance of the coated samples are studied by measuring the critical load (Lc,
tangential force), in which the coating starts to debond from the substrate [Sangermano et al.
2009]. Figure 5.16 depicts one of the scratch experiments and the location of the debonding start
point. Lc is found and represented as the average of three scratch tests of each coated plate. In
Figure 5.16 (a), it is also visible that scratching started at around 12 mm from the starting point.
Lc is then found from the cutting force axis. The measured cutting forces for the same sample in
three scratch runs are also illustrated in Figure 5.16 (b)showingtherepeatabilityofcomposite’s
behaviour.
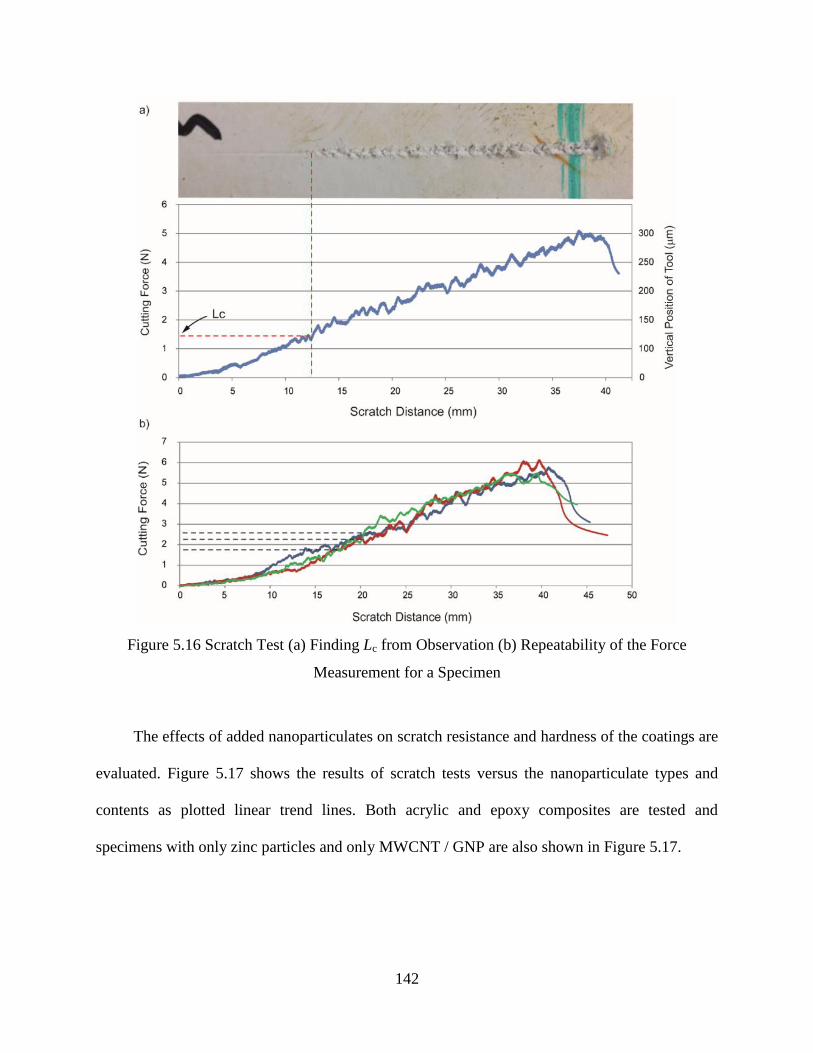
142
Figure 5.16 Scratch Test (a) Finding Lc from Observation (b) Repeatability of the Force
Measurement for a Specimen
The effects of added nanoparticulates on scratch resistance and hardness of the coatings are
evaluated. Figure 5.17 shows the results of scratch tests versus the nanoparticulate types and
contents as plotted linear trend lines. Both acrylic and epoxy composites are tested and
specimens with only zinc particles and only MWCNT / GNP are also shown in Figure 5.17.
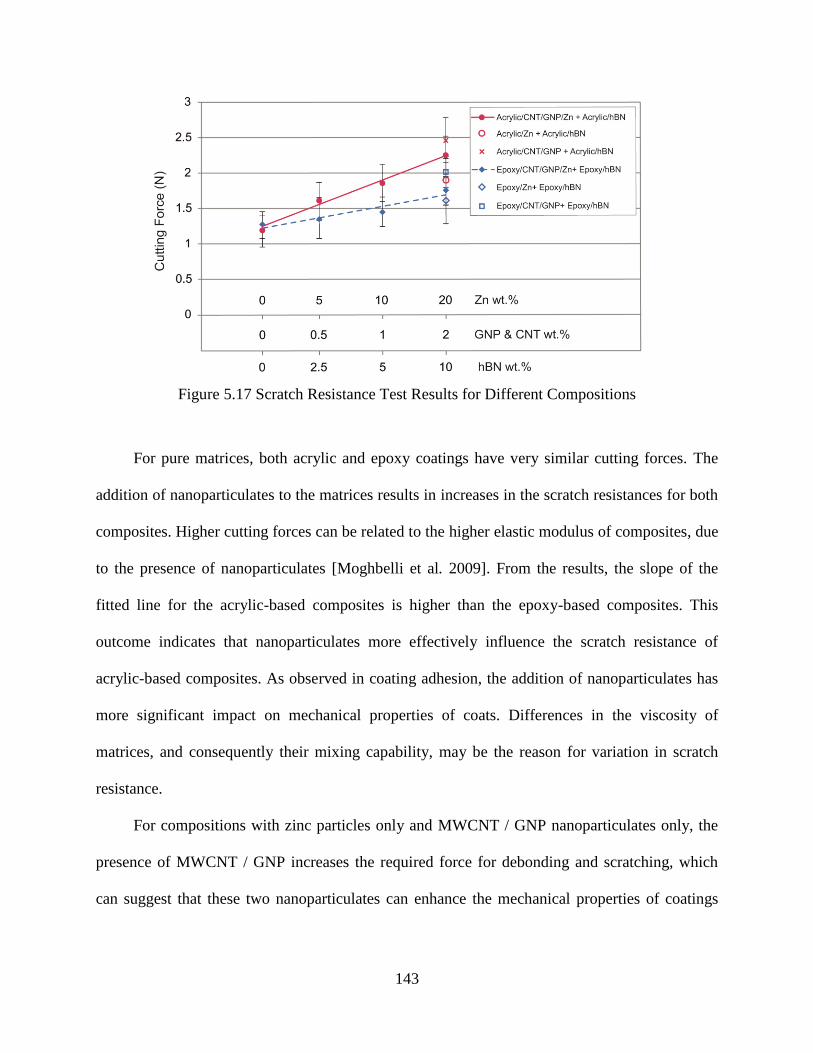
143
Figure 5.17 Scratch Resistance Test Results for Different Compositions
For pure matrices, both acrylic and epoxy coatings have very similar cutting forces. The
addition of nanoparticulates to the matrices results in increases in the scratch resistances for both
composites. Higher cutting forces can be related to the higher elastic modulus of composites, due
to the presence of nanoparticulates [Moghbelli et al. 2009]. From the results, the slope of the
fitted line for the acrylic-based composites is higher than the epoxy-based composites. This
outcome indicates that nanoparticulates more effectively influence the scratch resistance of
acrylic-based composites. As observed in coating adhesion, the addition of nanoparticulates has
more significant impact on mechanical properties of coats. Differences in the viscosity of
matrices, and consequently their mixing capability, may be the reason for variation in scratch
resistance.
For compositions with zinc particles only and MWCNT / GNP nanoparticulates only, the
presence of MWCNT / GNP increases the required force for debonding and scratching, which
can suggest that these two nanoparticulates can enhance the mechanical properties of coatings
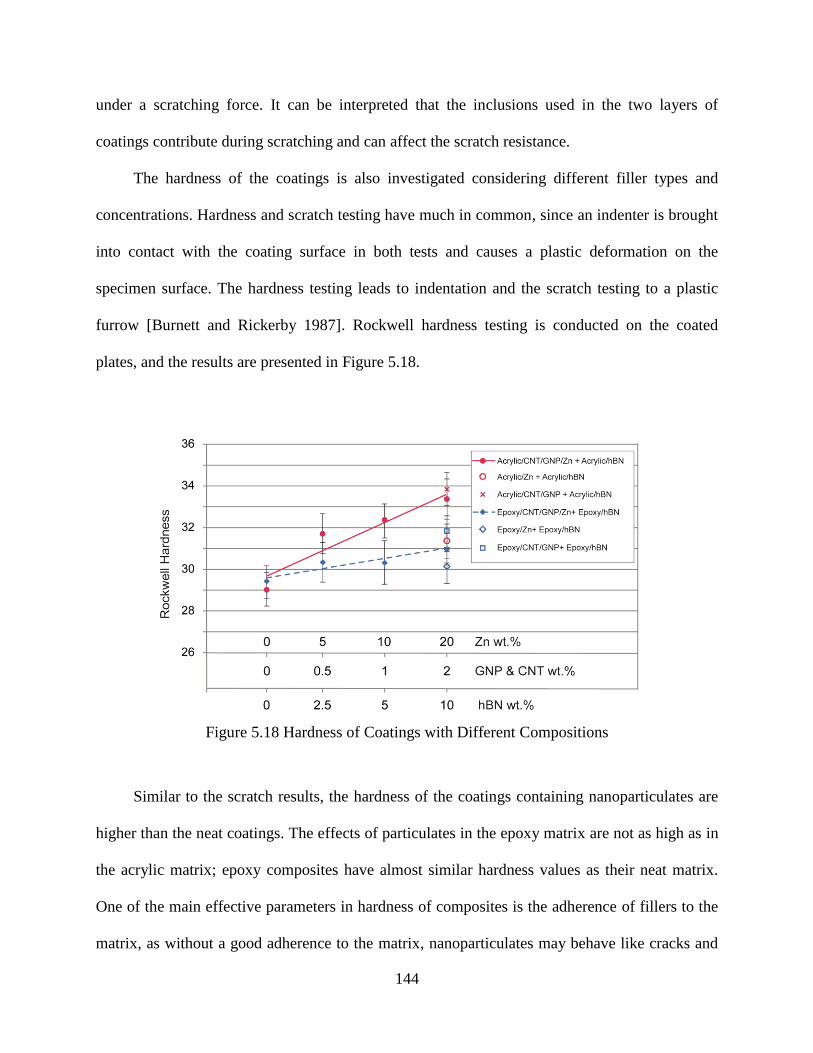
144
under a scratching force. It can be interpreted that the inclusions used in the two layers of
coatings contribute during scratching and can affect the scratch resistance.
The hardness of the coatings is also investigated considering different filler types and
concentrations. Hardness and scratch testing have much in common, since an indenter is brought
into contact with the coating surface in both tests and causes a plastic deformation on the
specimen surface. The hardness testing leads to indentation and the scratch testing to a plastic
furrow [Burnett and Rickerby 1987]. Rockwell hardness testing is conducted on the coated
plates, and the results are presented in Figure 5.18.
Figure 5.18 Hardness of Coatings with Different Compositions
Similar to the scratch results, the hardness of the coatings containing nanoparticulates are
higher than the neat coatings. The effects of particulates in the epoxy matrix are not as high as in
the acrylic matrix; epoxy composites have almost similar hardness values as their neat matrix.
One of the main effective parameters in hardness of composites is the adherence of fillers to the
matrix, as without a good adherence to the matrix, nanoparticulates may behave like cracks and
145
reduce the hardness [Felisberto et al. 2012]. On the other hand, the addition of MWCNTs, GNPs,
zinc, and hBN particulates enhances the hardness of the acrylic matrix, with values increased
from 29 to 33.3. There is no noticeable difference in hardness of acrylic composites with and
without zinc particles. Other researchers have used different nanoparticulates within the
polymeric matrices and observed that scratch resistance and hardness of the fabricated
composites are improved through the addition of fillers with high mechanical properties [Wong
et al. 2004, Wong, Moyse et al. 2004, Browning et al. 2006, Sangermano et al. 2009, Kiran et al.
2011].
5.4 SUMMARY
In this chapter, materials, methods, and equipment for testing and characterization of the
fabricated nanocomposite coatings are described. The studied polymers and nanoparticulates
with their physical properties are presented. The coating structures and compositions of each
layer are explained in detail. Different devices and procedures for measuring viscosity, electrical
resistivity, adhesion strength, gas permeability, CTE, cathodic disbondment, scratch resistance,
and hardness of the coating materials are described.
Fabricated nanocomposite coatings are employed as a two-layer coating material for steel
plates. Two polymeric matrices are used for preparing the compositions with different
nanoparticulates. The coating materials are characterized and evaluated through SEM
observations, adhesion testing (pull-off tests), cathodic disbondment tests, gas permeability
measurements, thermal expansion measurements, and scratch and hardness tests.
From the experiments carried out on the developed composite coatings, the employed
inclusions enhance the performance of the composite materials for coating purposes. Hybrid
146
composites, including both MWCNTs and zinc particles together, have better corrosion
protection performance compared to ones with zinc particles only and MWCNTs and GNPs
only. Moreover, the addition of the nanoparticulates decreases the thermal expansion and gas
penetration of the composites. These outcomes lead to a lower thermal expansion mismatch
between coating and substrate and less corrosive elements reaching the coated substrate,
respectively. The scratch resistance and hardness of the coating materials are also improved with
the addition of nanoparticulates.
147
CHAPTER 6. CONCLUSION AND FUTURE WORK
A summary of conclusions of this research work and an overview of its novel contributions
are presented in this chapter. The contributions are related to the fabrication, modeling, and
implementation of composites with nanoparticulates. The assumptions and limitations of the
study are also discussed. Also, future works that can be undertaken to improve this research
work are suggested in this chapter.
6.1 CONCLUSIONS AND NOVEL SCIENTIFIC CONTRIBUTIONS
Composites with nanoparticulates, such as multi-walled carbon nanotubes (MWCNTs),
graphene nanoplatelets (GNPs), hexagonal boron nitride (hBN), and zinc are promising materials
for the fabrication of multifunctional components with unique mechanical, thermal and corrosion
protection properties. Their superior advantages over neat polymers and composites with
inclusions with different geometries open up a broad range of applications for these advanced
materials. Therefore, various preparation techniques and modeling methods are introduced to
produce nanoparticulate/polymer composites efficiently. Given their superior performances,
nanocomposites can be employed in several applications, such as sensors, actuators, electrical
and thermal shields, and protecting materials for metals in corrosive environments. Only a few
research works have been focused on the usage of nanocomposites for coating purposes, which is
the primary goal of this study.
As one of the critical stages of the fabrication of nanocomposites with high aspect ratio
inclusions, mixing and dispersion of inclusions can play a vital role in the final properties of the
148
composite materials. There is always demand for dispersing nanoparticulates uniformly within
polymers without damaging their geometries. Efficient mixing and dispersion of inclusions can
result in composites with higher mechanical, electrical, and thermal properties. Coating materials
made of composites with superior properties can provide higher levels of protection due to better
interactions among nanoparticulates and the polymeric matrix.
Investigation of the critical properties of composites, such as electrical and thermal
conductivity, through modeling is another tool for prediction of final properties and evaluation of
effective parameters. There are many theoretical and computational models developed for
predicting electrical and thermal properties of composites filled with a single type of inclusion.
However, a comprehensive model able to reflect synergistic effects of using hybrid inclusions on
both electrical and thermal conductivities of composites is still required.
Considering the effects of utilizing MWCNTs, GNPs, and hBNs on mechanical, electrical
and thermal properties of polymers, the resulting compositions can be employed as coating
materials for metal protection. High mechanical, thermal, gas barrier and anti-corrosive
performances of GNPs and MWCNTs can improve the coating protection properties of
polymers. hBN is another nanomaterial with physical properties that can enhance the coating
efficiency of polymers. Furthermore, among all the anti-corrosive particulates used in coating
materials, zinc particles are attractive, due to their sacrificial behaviour. Using zinc-rich primers
for coating of steel provides a unique protecting capability for steel, even after small coating
mechanical damage.
One of the challenges that researchers and manufacturers face in producing coatings filled
with zinc particles is the high levels of zinc content required for coating purposes. To achieve
sufficient galvanic protection in zinc-filled coatings, adequate physical interactions should be
149
created among the zinc particles and the metal substrate. Higher levels of zinc concentrations
(60-90 wt.%) are needed to build a network of zinc particles. Composites made of these contents
of zinc particles usually result in poor mechanical properties and many processing difficulties.
Recently, it has been found that the addition of a very small amount of carbon nanotubes
(CNTs) to low filled zinc / polymer composites (10-30 wt.% zinc) can create the same level of
protection of zinc-rich primers in composites. Therefore, implementation of these
nanoparticulates within the polymer coating may result in the fabrication of coating materials
with high levels of mechanical, thermal, and corrosion protection.
The outcomes of this research will be beneficial for pipeline protection applications and
may also be appropriate for several other applications, such as sensing, packaging, and
electronics. The outcomes and novel contributions associated with this research are summarized
in the following subsections.
6.1.1 Effects of Mixing on Properties of Nanocomposites
To investigate the effects of dispersion and aspect ratio of fillers on the properties of final
nanocomposites, one of the most fragile nanoparticulates, MWCNTs, was used as the inclusion.
A new chaotic mixing system was designed and developed for mixing nanoparticulates with
polymers. In the mixer, two controllers equipped with a data acquisition system, that was
connected to a computer, were utilized to rotate two cylindrical rotors. The rotors can rotate
independently with sinusoidal speed variations inside the chamber and disperse the
nanoparticulates within the molten polymer. The mixing system was tested through evaluation of
electrical resistivity of a composite with the same MWCNT content mixed with different mixing
conditions, and the best mixing conditions was selected. Four major parameters were selected for
150
variation; mixing time, speed, direction, and phase lag between the rotors. The mixtures of
composites were moulded into specific sample size through the compression moulding
technique. Finally, the fabricated samples with the same MWCNT content were tested for
electrical conductivity and electromagnetic interference (EMI) shielding measurements to find
the optimal mixing condition.
The chaotic mixer was then employed for mixing MWCNTs with the polymer in a range of
inclusion concentrations. The same compositions were mixed via a commercial melt mixer. The
mixed composite materials from both mixing methods were then compression moulded and
tested. The electrical resistivity and EMI shielding of the composites were measured in order to
evaluate the different mixing techniques. The results showed that the chaotic-mixed composites
had better performance than those mixed with the commercial mixer. The MWCNT composites
mixed via the chaotic mixer showed a lower percolation threshold, 0.12 vol.%, than that
achieved using the commercial mixer, 0.29 vol.%. The EMI shielding capability of the
composites mixed via the chaotic mixer was also higher, about 26 dB compared to 17 dB, for
samples with 3.1 vol.% MWCNT and 0.3 mm thickness.
Different outcomes from the two mixing methods can be attributed to different levels of
dispersion and breakage of MWCNTs during the mixing stage. To verify these assumptions,
optical and transmitting electron microscopy (TEM) observations were conducted on the mixed
composites. From these observations, it was seen that MWCNTs were less agglomerated in the
specimens mixed through the developed chaotic mixer. In addition, to study the breakage of
MWCNTs during mixing, lengths of MWCNTs before and after mixing stage were measured
through TEM pictures. The results of length distribution indicated that MWCNTs of composites
mixed with the commercial mixer were more broken and their average length was shorter.
151
These outcomes can explain the differences between electrical behaviours of composites
mixed with different methods. It was shown that efficient mixing of even a very small amount of
MWCNTs with polymers could create composites with higher electrical properties compared to
conventional compositions, due to very high aspect ratio of MWCNTs. Considering these
outcomes, it was assumed that the employing MWCNTs as electrical connectors within the
coating layers may result in composites with higher protection performances. The obtained
results also suggest that the chaotic mixer has a higher potential for mixing nanoparticulates with
thermoplastics without breaking the nanotubes compared to other types of melt mixing
techniques, thereby improving the electrical properties. The developed chaotic mixer can be
adopted for fabrication of nanocomposites for various applications such as gas and liquid leakage
detection sensors. However, due to limitations facing the chaotic mixing of thermosets, solution
mixing technique was used for fabrication of composites for coating experiments.
6.1.2 Development of Electrical and Thermal Conductivity Models for Nanocomposites
The electrical and thermal properties of composites are very critical in fabricating coating
materials with a sufficient level of protection. One of the methods for investigating the effects of
different parameters on electrical and thermal behaviours of nanocomposites is to predict their
conductivities through computational models. The challenge in modeling complex and large
networks of nanoparticulates is the considerable computation time. However, using methods
such as the random walk technique can result in models with less calculation and run time. In
this research, two new models for predicting electrical and thermal conductivities of composites
filled with nanoparticulates were developed and compared with experiments and previously
reported models.
152
For the electrical conductivity model, a three-dimensional (3D) cubical representative
volume element (RVE) was filled with randomly dispersed MWCNTs and a network of the
conductive inclusion was created. The random walkers mimicking electrical particles were
imported from one side of the cube and wandered inside the RVE until they reached the other
end of the cube. The walkers chose their pathway to the lowest potential nodes based on
conductivities between MWCNTs (both contact and tunneling mechanisms) and probabilities.
After importing a specific quantity of random walkers, the model could measure the
voltage and current of each node based on the number of passed walkers. Finally, the electrical
conductivity of the whole composite was calculated. The results of the developed model were in
agreement with previously published models and experiments. The developed model was
capable of reflecting the effects of concentration, alignment, and length of MWCNTs.
Additionally, the piezoresistive behaviour of the nanocomposites could be studied with the
developed model; however, this was out of the scope of this study.
The same modeling method was utilized for the thermal conductivity model. The
developed model was able to predict the thermal conductivity of composites filled with
inclusions in different concentrations, with different geometries and alignments. In the thermal
conductivity model, hybrid composites filled with both two-dimensional (2D, such as hBN and
GNPs) and one-dimensional (1D, such as MWCNTs) can also be studied.
To verify the developed thermal conductivity model, MWCNT / polymer composites were
fabricated with different concentrations and alignments. The thermal conductivity values of
nanocomposites fabricated and measured through experiments were compared with those
determined with the developed model. To reflect the effects of alignment, injection moulding
and compression moulding techniques were used for fabricating composites with semi-aligned
153
and randomly dispersed MWCNTs, respectively. It was determined in both modeling and
experiments that composites with even a small degree of alignment of MWCNTs have higher
thermal conductivity values. Moreover, hybrid composites with both hBN and MWCNTs were
fabricated, and their thermal conductivity was measured through experiments and the random
walk model.
The outcomes of two methods were evaluated, and it was observed that the random walk
model results were close to the results of the previously published models and experiments. For
the electrical conductivity model, among the composites including MWCNTs with different
average lengths, the predicted electrical conductivity values of composites with the ones with the
average length of 1210 nm were closer to the previous experiments and models. The thermal
conductivity values predicted by the model were more accurate for composites with randomly
dispersed MWCNTs than those of composites with aligned MWCNTs.
Since the both electrical and thermal conductivity models were based on the same method,
a single common RVE can be used for predicting both electrical and thermal properties. This
advantage can result in models capable of calculating electrical and thermal conductivity of very
big networks with hybrid inclusions with less calculation time compared to the previous models.
6.1.3 Feasibility of using Nanocomposites as Coating
Current coating systems face some challenges, such as poor mechanical adhesion and large
mismatches in the coefficients of thermal expansion (CTE) between the polymer coating and the
metal substrate. This study aimed at improving the performance of the coating materials by using
nanocomposites as protective layers. New composites filled with nanoparticulates were
154
fabricated into a two-layer coating structure. The coating consisted of one layer contacting the
steel substrate and a second layer covers the first layer.
Two polymeric coating materials – styrene acrylic and epoxy – were used as the matrices
for composites. For the first layer, MWCNTs, GNPs, and zinc particles were employed. GNPs
were used for their effects on decreasing CTE mismatch and gas permeation, as well as their
anti-corrosive influence. Zinc particles were also used for their sacrificial behaviour in protecting
the steel after slight damage. To increase the efficiency of the galvanic protection of zinc
particles and enhancing mechanical properties of the first layer, MWCNTs were also added.
In the second layer of the fabricated coating, hBN was added to the polymer to increase the
coating’s gas barrier effects andmechanical properties. Furthermore, the addition of hBN can
result in composites with lower CTE values compared to those of pure polymers. Using the
coating materials, two-layer coats were sprayed on the surface of the steel plates. The coating
materials and coated plates were characterized and tested. The mixing effectiveness of the
inclusions and polymers were examined through scanning electron microscopy (SEM)
observations and electrical and thermal conductivity measurements. Other tests and evaluations,
such as gas permeability measurements, mechanical adhesion tests, CTE measurements, scratch
resistance, surface hardness, and cathodic disbondment, of the coating materials were conducted
on the specimens and compared with theoretical models.
These series of experiments showed composites made of acrylic had better performances
than those made of epoxy. These outcomes were attributed to the lower viscosity of acrylic
compared to epoxy, which can affect the interactions and dispersion of nanoparticulates. The
addition of nanoparticulates resulted in composites with higher gas barrier effects (around 70%
reduction), higher mechanical strength (around 80% increase in the cutting force), lower CTE
155
values (around 60% decrease), and higher adhesion to steel (around 120% increase). For the
cathodic disbondment experiments, acrylic composites filled with nanoparticulates showed lower
corroded area compared to the pure polymer coatings, around 600 mm2
compared to 6000 mm2.
The effects of the creation hybrid composites with both MWCNTs and zinc particles were also
investigated through the fabrication of composites with single type inclusion. It was seen that the
addition of MWCNTs enhanced the effectiveness of zinc particles in protecting the steel surface
from cathodic disbondment.
6.2 ASSUMPTIONS AND LIMITATIONS
There were several assumptions and limitations associated with this study. In the
optimization section of chaotic mixer development, it was assumed that the four selected
parameters were the most influential ones, and their effects were investigated for only two levels.
In the investigation of the breakage of MWCNTs during mixing, a limited quantity of MWCNTs
(500) was considered, and it was assumed that the average length could be attributed to all the
MWCNTs. In observing the dispersion and distribution of MWCNTs through optical and TEM
images, only some parts of the specimens were investigated and generalized as being
representative of the whole composite.
In the modeling chapter of the study, the developed electrical conductivity model was
found to be capable of predicting the electrical conductivity only after the percolation threshold
of the MWCNTs. For both the electrical and thermal conductivity models, MWCNTs were
assumed as straight lines with a constant diameter and uniformly dispersed within the RVE.
Polymeric matrices were also assumed as insulating in electrical modeling. Moreover, the hBN
nanoparticulates mimicked in the thermal conductivity model were assumed as flat nanoplatelets
156
that were dispersed inside the RVE without agglomerations. Electrical and thermal conductivity
and the geometry of the nanoparticulates were not measured experimentally, and the data
provided by the manufacturer were used. For the thermal conductivity measurement device, it
was assumed that the system was fully sealed against heat dissipation. Moreover, the alignment
of the MWCNTs was measured using 2D TEM pictures.
For the coating investigations, although the solution mixing technique is one of the
methods with the highest mixing qualities, there were still some agglomerations of inclusions
observed in the SEM pictures. For the CTE and gas permeability models, the geometry of the
inclusions was assumed as a constant value. It was also assumed that the sandblasting technique
created a uniform roughness all over the specimens and that the sprayed coatings were uniform
in thickness. However, both of these properties were quantified using standard devices, and the
average values were reported.
The thickness of the samples for gas permeability and CTE measurements were considered
as uniform. For CTE measurements, it was difficult to fabricate and test samples with
thicknesses of around 300 µm (equal to the thickness of a single coating layer), so thicker
samples were prepared and tested. For cathodic disbondment testing, it was assumed that the
presence of zinc particles combined with MWCNTs within the composites resulted in higher
cathodic disbondment resistance of the coats. However, more electrochemical tests and
investigations on the coating materials are needed to prove the level of corrosion protection in
the developed coatings.
157
6.3 FUTURE WORK
The present work creates a framework for investigating the performances of the fabricated
composite coatings. It was shown that the addition of MWCNTs, GNPs, and zinc particles
enhanced the electrical properties of the first coating layer. Modification of the developed
electrical conductivity model for predicting the electrical properties of the composites with
multi-type inclusions with different geometries (1D, 2D and 3D shapes) can be the subject of
future work. In the both electrical and thermal conductivity models, it was assumed that the
MWCNTs and hBNs had straight geometries; however, modeling the inclusions with curved
shapes may lead to results that are more accurate. The limitation of the current electrical
conductivity model, which lacks electrical conductivity predictions before reaching the
percolation threshold, can be resolved in future research.
It was seen that the gas permeability and CTE of the composites filled with nanoplatelets
could be minimized through the alignment of the inclusions. The presented theoretical models
can show the effects of orientation of nanoplatelets on gas permeability and CTE values.
Fabrication of composites with aligned inclusions through a spraying technique may result in
nanocomposites with better performances in these aspects. The effects of the addition of
nanoparticulates on adhesion properties of composite coatings can be investigated through
theoretical and numerical models such as cohesive zone model.
Moreover, since the utilized nanocomposites can be employed as sensors, due to the
presence of MWCNTs and GNPs, the feasibility of force and leakage sensing of the coating
materials can be investigated. This sensing method is based on the changes in electrical
conductivity due to the gas or liquid penetration, external force, or wear of the coatings. The
developed random walk electrical conductivity model can reflect the strain sensing behaviour of
158
the MWCNT composites, which can be utilized for predicting the final properties of composites
with dissimilar inclusions.
Furthermore, the composite coatings can be optimized and then they can be compared with
the current coating materials such as two-layer fusion bonded epoxy (FBE). More tests on the
corrosion protection performance of the fabricated coatings, such as corrosion rates, corrosion
potential, and electrochemical impedance measurements, should be considered for future
research. Moreover, corrosion protection evaluation of the coating materials in different
conditions, such as high temperatures, inside a salt spray chamber, and hygrothermal cyclic tests
are also needed. Acoustic emission (AE) sensors can be employed for investigating the corrosion
protection of the coatings. Furthermore, zinc particulates with platelets and nanotube geometries
have been introduced and used. Employing zinc particles with 1D and 2D structures may lead to
the creation of coating materials with enhanced mechanical and corrosion protection properties.
159
REFERENCES
Aboudi, J., 2013, "Mechanics of composite materials: a unified micromechanical approach", Elsevier.
Aguilar, J. O., J. R. Bautista-Quijano and F. Avilés, 2010, "Influence of carbon nanotube clustering on the electrical
conductivity of polymer composite films", eXPRESS Polymer Letters, 5, pp. 292-299.
Aleksandrova, M., 2009, "Spray deposition of multilayer polymer structures for optoelectronic applications", e-
Journal of Surface Science and Nanotechnology, pp. 859-862.
Amdouni, N., H. Sautereau and J. F. Gerard, 1992, "Epoxy composites based on glass beads. II. Mechanical
properties", Journal of Applied Polymer Science, 10, pp. 1723-1735.
Andrady, A. L., T. C. Merkel and L. G. Toy, 2004, "Effect of particle size on gas permeability of filled superglassy
polymers", Macromolecules, 11, pp. 4329-4331.
Andrews, R., D. Jacques, M. Minot and T. Rantell, 2002, "fabrication of carbon multiwall nanotube/polymer
composites by shear mixing", Macromolecular Materials and Engineering, 6, pp. 395-403.
Annadurai, P., A. K. Mallick and D. K. Tripathy, 2002, "Studies on microwave shielding materials based on ferrite-
and carbon black-filled EPDM rubber in the X-band frequency", Journal of Applied Polymer Science, 1, pp.
145-150.
Arjmand, M., M. Mahmoodi, G. A. Gelves, S. Park and U. Sundararaj, 2011, "Electrical and electromagnetic
interference shielding properties of flow-induced oriented carbon nanotubes in polycarbonate", Carbon, 11,
pp. 3430-3440.
Arjmand, M., M. Mahmoodi, S. Park and U. Sundararaj, 2013, "An innovative method to reduce the energy loss of
conductive filler/polymer composites for charge storage applications", Composites Science and Technology,
pp. 24-29.
Ayatollahi, M. R., S. Shadlou, M. M. Shokrieh and M. Chitsazzadeh, 2011, "Effect of multi-walled carbon nanotube
aspect ratio on mechanical and electrical properties of epoxy-based nanocomposites", Polymer Testing, 5, pp.
548-556.
Bagchi, A. and S. Nomura, 2006, "On the effective thermal conductivity of carbon nanotube reinforced polymer
composites", Composites science and technology, 11, pp. 1703-1712.
Banach, J., 2004, "Liquid epoxycoatings for today’spipeline coating challenges",ProceedingsofNorthernArea
Western Conference, Victoria.
Bao, H.-D., Y. Sun, Z.-Y. Xiong, Z.-X. Guo and J. Yu, 2013, "Effects of the dispersion state and aspect ratio of
carbon nanotubes on their electrical percolation threshold in a polymer", Journal of Applied Polymer Science,
1, pp. 735-740.
Bao, W. S., S. A. Meguid, Z. H. Zhu and M. J. Meguid, 2011, "Modeling electrical conductivities of
nanocomposites with aligned carbon nanotubes", Nanotechnology, 48, pp. 485704-8.
Bauhofer, W. and J. Z. Kovacs, 2009, "A review and analysis of electrical percolation in carbon nanotube polymer
composites", Composites Science and Technology, 10, pp. 1486-1498.
160
Behnam, A., G. Jing and U. Ant, 2007, "Effects of nanotube alignment and measurement direction on percolation
resistivity in single-walled carbon nanotube films", Journal of Applied Physics, 4, pp. 7.
Bellucci, F., L. Nicodemo, T. Monetta, M. Kloppers and R. Latanision, 1992, "A study of corrosion initiation on
polyimide coatings", Corrosion science, 8, pp. 1203-1226.
Berry, D. H. and A. Namkanisorn, 2005, "Fracture toughness of a silane coupled polymer-metal interface: Silane
concentration effects", The Journal of Adhesion, 3-4, pp. 347-370.
Bigg, D. M., 1995, "Thermal conductivity of heterophase polymer compositions", Thermal and Electrical
Conductivity of Polymer Materials, Springer Berlin Heidelberg, pp. 1-30.
Browning, R., G.-T. Lim, A. Moyse, H.-J. Sue, H. Chen and J. Earls, 2006, "Quantitative evaluation of scratch
resistance of polymeric coatings based on a standardized progressive load scratch test", Surface and Coatings
Technology, 6, pp. 2970-2976.
Burnett, P. J. and D. S. Rickerby, 1987, "The relationship between hardness and scratch adhesion", Thin Solid Films,
1, pp. 403-416.
Burrows, P. E., G. L. Graff, M. E. Gross, P. M. Martin, M. Hall, E. Mast, C. C. Bonham, W. D. Bennett, L. A.
Michalski, M. S. Weaver, J. J. Brown, D. Fogarty and L. S. Sapochak, 2001, "Gas permeation and lifetime
tests on polymer-based barrier coatings".
Callister, W. D. J., 2003, "Materials science and engineering: an introduction", New York, Wiley.
Çamurlu, H. E., S. Mathur, O. Arslan and E. Akarsu, 2016, "Modification of hexagonal boron nitride nanoparticles
with fluorosilane", Ceramics International, 5, pp. 6312-6318.
CAPE, "Composites and Polymer Engineering Laboratory", ww.cape.sdsmt.edu.
Celzard, A., E. McRae, C. Deleuze, M. Dufort, G. Furdin and J. F. Marêché, 1996, "Critical concentration in
percolating systems containing a high-aspect-ratio filler", Physical Review B, 10, pp. 6209-6214.
Chan, E., S. N. Leung, M. O. Khan, H. Naguib, F. Dawson, V. Adinkrah and L. Lakatos-Hayward, 2012,
"Fabrication and characterization of ceramic-filled thermoplastics composites with enhanced multifunctional
properties", Journal of Thermoplastic Composite Materials.
Chandrasekaran, S., C. Seidel and K. Schulte, 2013, "Preparation and characterization of graphite nano-platelet
(GNP)/epoxy nano-composite: Mechanical, electrical and thermal properties", European Polymer Journal, 12,
pp. 3878-3888.
Chang, C.-H., T.-C. Huang, C.-W. Peng, T.-C. Yeh, H.-I. Lu, W.-I. Hung, C.-J. Weng, T.-I. Yang and J.-M. Yeh,
2012, "Novel anticorrosion coatings prepared from polyaniline/graphene composites", Carbon, 14, pp. 5044-
5051.
Chang, K.-C., M.-H. Hsu, H.-I. Lu, M.-C. Lai, P.-J. Liu, C.-H. Hsu, W.-F. Ji, T.-L. Chuang, Y. Wei, J.-M. Yeh and
W.-R. Liu, 2014, "Room-temperature cured hydrophobic epoxy/graphene composites as corrosion inhibitor
for cold-rolled steel", Carbon, pp. 144-153.
Chatterjee, S., F. A. Nüesch and B. T. T. Chu, 2011, "Comparing carbon nanotubes and graphene nanoplatelets as
reinforcements in polyamide 12 composites", Nanotechnology, 27, pp. 275714-8.
161
Chen, X., C. Chen, H. Xiao, F. Cheng, G. Zhang and G. Yi, 2005, "Corrosion behavior of carbon nanotubes–Ni
composite coating", Surface and Coatings Technology, 2, pp. 351-356.
Choi, J.-R., K.-Y. Rhee and S.-J. Park, 2015, "Influence of electrolessly silver-plated multi-walled carbon nanotubes
on thermal conductivity of epoxy matrix nanocomposites", Composites Part B: Engineering, pp. 379-384.
Choi, T. Y., D. Poulikakos, J. Tharian and U. Sennhauser, 2005, "Measurement of thermal conductivity of
individual multiwalled carbon nanotubes by the 3-ωmethod",Applied physics letters, 1, pp. 13103-13108.
Choudalakis, G. and A. Gotsis, 2009, "Permeability of polymer/clay nanocomposites: a review", European Polymer
Journal, 4, pp. 967-984.
Chow, T. S., 1978, "Effect of particle shape at finite concentration on thermal expansion of filled polymers", Journal
of Polymer Science: Polymer Physics Edition, 6, pp. 967-970.
Choy, K., 2003, "Chemical vapour deposition of coatings", Progress in materials science, 2, pp. 57-170.
Christensen, R. M., 2012, "Mechanics of composite materials", Dover Publications.
Claes, M., S. Voccia, C. Detrembleur, C. Jérôme, B. Gilbert, P. Leclère, V. M. Geskin, R. Gouttebaron, M. Hecq, R.
Lazzaroni and R. Jérôme, 2003, "Polymer coating of steel by a combination of electrografting and atom-
transfer radical polymerization", Macromolecules, 16, pp. 5926-5933.
Clancy, T. C. and T. S. Gates, 2006, "Modeling of interfacial modification effects on thermal conductivity of carbon
nanotube composites", Polymer, 16, pp. 5990-5996.
Coan, T., G. S. Barroso, G. Motz, A. Bolzán and R. A. F. Machado, 2013, "Preparation of PMMA/hBN composite
coatings for metal surface protection", Materials Research, pp. 1366-1372.
Cole, I. and D. Marney, 2012, "The science of pipe corrosion: A review of the literature on the corrosion of ferrous
metals in soils", Corrosion science, pp. 5-16.
Coleman, J. N., U. Khan and Y. K. Gun'ko, 2006, "Mechanical Reinforcement of Polymers Using Carbon
Nanotubes", Advanced Materials, 6, pp. 689-706.
Cui, Y., S. Kundalwal and S. Kumar, 2016, "Gas barrier performance of graphene/polymer nanocomposites",
Carbon, pp. 313-333.
Danescu, R. I. and D. A. Zumbrunnen, 2000, "Production of electrically conducting plastic composites by three-
dimensional chaotic mixing of melts and powder additives", Journal of Vinyl and Additive Technology, 1, pp.
26-33.
Deng, F., Q.-S. Zheng, L.-F. Wang and C.-W. Nan, 2007, "Effects of anisotropy, aspect ratio, and nonstraightness of
carbon nanotubes on thermal conductivity of carbon nanotube composites", Applied Physics Letters, 2, pp.
021914-3.
Dennis, R. V., L. T. Viyannalage, A. V. Gaikwad, T. K. Rout and S. Banerjee, 2013, "Graphene nanocomposite
coatings for protecting low-alloy steels from corrosion", American Ceramic Society Bulletin, 5, pp. 18-24.
Dharaiya, D. P. and S. C. Jana, 2005, "Nanoclay-induced morphology development in chaotic mixing of immiscible
polymers", Journal of Polymer Science Part B: Polymer Physics, 24, pp. 3638-3651.
162
Dietsche, F., Y. Thomann, R. Thomann and R. Mülhaupt, 2000, "Translucent acrylic nanocomposites containing
anisotropic laminated nanoparticles derived from intercalated layered silicates", Journal of Applied Polymer
Science, 3, pp. 396-405.
Dong, C., A. Fu, X. Li and Y. Cheng, 2008, "Localized EIS characterization of corrosion of steel at coating defect
under cathodic protection", Electrochimica Acta, 2, pp. 628-633.
Doyle, P. G. and J. L. Snell, 2006, "Random walks and electric networks", Washington, D.C., Mathematical
Association of America.
Drozdz, S. A., T. Hawkins, L. Clark, M. Surratt, J. Kingsley, K. Palutke and J. Dean, 2011, "demonstration of a
nanomaterial-modified primer for use in corrosion-inhibiting coating systems", DTIC Document.
Du, F., J. E. Fischer and K. I. Winey, 2005, "Effect of nanotube alignment on percolation conductivity in carbon
nanotube/polymer composites", Physical Review B, 12, pp. 121404-4.
Duong, H. M., D. V. Papavassiliou, L. L. Lee and K. J. Mullen, 2005, "Random walks in nanotube composites:
Improved algorithms and the role of thermal boundary resistance", Applied Physics Letters, 1, pp. 013101-3.
Duong, H. M., D. V. Papavassiliou, K. J. Mullen and S. Maruyama, 2008, "Computational modeling of the thermal
conductivity of single-walled carbon nanotube–polymer composites", Nanotechnology, 6, pp. 65702-8.
Duong, H. M., N. Yamamoto, K. Bui, D. V. Papavassiliou, S. Maruyama and B. L. Wardle, 2010, "Morphology
effects on nonisotropic thermal conduction of aligned single-walled and multi-walled carbon nanotubes in
polymer nanocomposites", The Journal of Physical Chemistry C, 19, pp. 8851-8860.
Duong, H. M., N. Yamamoto, D. V. Papavassiliou, S. Maruyama and B. L. Wardle, 2009, "Inter-carbon nanotube
contact in thermal transport of controlled-morphology polymer nanocomposites", Nanotechnology, 15, pp.
155702-10.
Faidi, S. E., J. D. Scantlebury, P. Bullivant, N. T. Whittle and R. Savin, 1993, "Advances in corrosion and protection
an electrochemical study of zinc-containing epoxy coatings on mild steel", Corrosion Science, 5, pp. 1319-
1328.
Felisberto, M., A. Arias-Durán, J. A. Ramos, I. Mondragon, R. Candal, S. Goyanes and G. H. Rubiolo, 2012,
"Influence of filler alignment in the mechanical and electrical properties of carbon nanotubes/epoxy
nanocomposites", Physica B: Condensed Matter, 16, pp. 3181-3183.
Fellahi, S., N. Chikhi and M. Bakar, 2001, "Modification of epoxy resin with kaolin as a toughening agent", Journal
of Applied Polymer Science, 4, pp. 861-878.
Frounchi, M., S. Dadbin, Z. Salehpour and M. Noferesti, 2006, "Gas barrier properties of PP/EPDM blend
nanocomposites", Journal of Membrane Science, 1–2, pp. 142-148.
Gabr, M. H., W. Okumura, H. Ueda, W. Kuriyama, K. Uzawa and I. Kimpara, 2015, "Mechanical and thermal
properties of carbon fiber/polypropylene composite filled with nano-clay", Composites Part B: Engineering,
pp. 94-100.
Gelves, G. A., M. H. Al-Saleh and U. Sundararaj, 2011, "Highly electrically conductive and high performance EMI
shielding nanowire/polymer nanocomposites by miscible mixing and precipitation", Journal of Materials
Chemistry, 3, pp. 829-836.
163
Gergely, A., I. Bertóti, T. Török, É. Pfeifer and E. Kálmán, 2013, "Corrosion protection with zinc-rich epoxy paint
coatings embedded with various amounts of highly dispersed polypyrrole-deposited alumina monohydrate
particles", Progress in Organic Coatings, 1, pp. 17-32.
Gergely, A., Z. Pászti, O. Hakkel, E. Drotár, J. Mihály and E. Kálmán, 2012, "Corrosion protection of cold-rolled
steel with alkyd paint coatings composited with submicron-structure types polypyrrole-modified nano-size
alumina and carbon nanotubes", Materials Science and Engineering: B, 18, pp. 1571-1582.
Gojny, F. H., M. H. G. Wichmann, B. Fiedler, I. A. Kinloch, W. Bauhofer, A. H. Windle and K. Schulte, 2006,
"Evaluation and identification of electrical and thermal conduction mechanisms in carbon nanotube/epoxy
composites", Polymer, 6, pp. 2036-2045.
Goldie, B., 2012, "Developments in pipeline protection reviewed", Protecting and Maintaining Transmission
Pipeline, Technology Publishing Company.
Grady, B. P., 2012, "Effects of carbon nanotubes on polymer physics", Journal of Polymer Science Part B: Polymer
Physics, 9, pp. 591-623.
Green, R., A. Morfa, A. Ferguson, N. Kopidakis, G. Rumbles and S. Shaheen, 2008, "Performance of bulk
heterojunction photovoltaic devices prepared by airbrush spray deposition", Applied Physics Letters, 3, pp.
033301-3.
Gregory, B. W. and J. L. Stickney, 1991, "Electrochemical atomic layer epitaxy (ECALE)", Journal of
electroanalytical chemistry and interfacial electrochemistry, 1, pp. 543-561.
Grujicic, M., V. Sellappan, M. A. Omar, N. Seyr, A. Obieglo, M. Erdmann and J. Holzleitner, 2008, "An overview
of the polymer-to-metal direct-adhesion hybrid technologies for load-bearing automotive components",
Journal of Materials Processing Technology, 1–3, pp. 363-373.
Guermazi, N., K. Elleuch, H. F. Ayedi and P. Kapsa, 2008, "Aging effect on thermal, mechanical and tribological
behaviour of polymeric coatings used for pipeline application", Journal of Materials Processing Technology,
1–3, pp. 404-410.
Guezennec, J., 1991, "Influence of cathodic protection of mild steel on the growth of sulphate‐reducing bacteria at
35° C in marine sediments", Biofouling, 4, pp. 339-348.
Guidetti, G. P., G. L. Rigosi and R. Marzola, 1996, "The use of polypropylene in pipeline coatings", Progress in
Organic Coatings, 1–4, pp. 79-85.
Gulotty, R., M. Castellino, P. Jagdale, A. Tagliaferro and A. A. Balandin, 2013, "Effects of functionalization on
thermal properties of single-wall and multi-wall carbon nanotube–polymer nanocomposites", ACS nano, 6,
pp. 5114-5121.
Gupta, P., M. Rajput, N. Singla, V. Kumar and D. Lahiri, 2016, "Electric field and current assisted alignment of
CNT inside polymer matrix and its effects on electrical and mechanical properties", Polymer, pp. 119-127.
Guthy, C., F. Du, S. Brand, K. I. Winey and J. E. Fischer, 2007, "Thermal conductivity of single-walled carbon
nanotube/PMMA nanocomposites", Journal of Heat Transfer, 8, pp. 1096-1099.
Han, M.-H. and J. A. Nairn, 2003, "Hygrothermal aging of polyimide matrix composite laminates", Composites Part
A: Applied Science and Manufacturing, 10, pp. 979-986.
164
Han, Z. and A. Fina, 2011, "Thermal conductivity of carbon nanotubes and their polymer nanocomposites: A
review", Progress in Polymer Science, 7, pp. 914-944.
Harris, G. M. and A. Lorenz, 1993, "New coatings for the corrosion protection of steel pipelines and pilings in
severely aggressive environments", Corrosion Science, 5–8, pp. 1417-1423.
Harun, M. K., J. Marsh and S. B. Lyon, 2005, "The effect of surface modification on the cathodic disbondment rate
of epoxy and alkyd coatings", Progress in Organic Coatings, 4, pp. 317-321.
Hasani-Sadrabadi, M. M., E. Dashtimoghadam, F. S. Majedi, S. Wu, A. Bertsch, H. Moaddel and P. Renaud, 2013,
"Nafion/chitosan-wrapped CNT nanocomposite membrane for high-performance direct methanol fuel cells",
RSC Advances, 20, pp. 7337-7346.
Haubner, R., M. Wilhelm, R. Weissenbacher and B. Lux, 2002, "Boron nitrides—properties, synthesis and
applications", Springer.
Hedia, H. S., L. Allie, S. Ganguli and H. Aglan, 2006, "The influence of nanoadhesives on the tensile properties and
Mode-I fracture toughness of bonded joints", Engineering Fracture Mechanics, 13, pp. 1826-1832.
Hida, S., T. Hori, T. Shiga, J. Elliott and J. Shiomi, 2013, "Thermal resistance and phonon scattering at the interface
between carbon nanotube and amorphous polyethylene", International Journal of Heat and Mass Transfer, pp.
1024-1029.
Hu, L., D. S. Hecht and G. Grüner, 2004, "Percolation in Transparent and Conducting Carbon Nanotube Networks",
Nano Letters, 12, pp. 2513-2517.
Hu, N., Z. Masuda, C. Yan, G. Yamamoto, H. Fukunaga and T. Hashida, 2008, "The electrical properties of polymer
nanocomposites with carbon nanotube fillers", Nanotechnology, 21, pp. 10.
Huang, Y. Y. and E. M. Terentjev, 2012, "Dispersion of carbon nanotubes: mixing, sonication, stabilization, and
composite properties", Polymers, 1, pp. 275-295.
Hung, M.-T., 2007, "Heat transport in polymer thin films for micro/nano-manufacturing", PhD Thesis, University of
California, Los Angeles, United States of America.
Huttunen-Saarivirta, E., G. Vaganov, V. Yudin and J. Vuorinen, 2013, "Characterization and corrosion protection
properties of epoxy powder coatings containing nanoclays", Progress in Organic Coatings, 4, pp. 757-767.
Ioniţă,M. andA. Prună, 2011, "Polypyrrole/carbon nanotube composites:Molecularmodeling and experimental
investigation as anti-corrosive coating", Progress in Organic Coatings, 4, pp. 647-652.
Iskandar, F., S.-G. Kim, A. B. D. Nandiyanto, Y. Kaihatsu, T. Ogi and K. Okuyama, 2009, "Direct synthesis of
hBN/MWCNT composite particles using spray pyrolysis", Journal of Alloys and Compounds, 1, pp. 166-171.
Itakura, A., M. Tosa, S. Ikeda and K. Yoshihara, 1996, "Hydrogen permeation properties and surface structure of
BN-coated stainless steel membrane", Vacuum, 6–8, pp. 697-700.
Jagtap, R. N., R. Nambiar, S. Z. Hassan and V. C. Malshe, 2007, "Predictive power for life and residual life of the
zinc rich primer coatings with electrical measurement", Progress in Organic Coatings, 4, pp. 253-258.
Jalili, M., M. Rostami and B. Ramezanzadeh, 2015, "An investigation of the electrochemical action of the epoxy
zinc-rich coatings containing surface modified aluminum nanoparticle", Applied Surface Science, pp. 95-108.
165
Jana, S. C. and J. M. Ottino, 1992, "Chaos-enhanced transport in cellular flows", Philosophical Transactions of the
Royal Society of London. Series A: Physical and Engineering Sciences, 1651, pp. 519-532.
Jana, S. C. and M. Sau, 2004, "Effects of viscosity ratio and composition on development of morphology in chaotic
mixing of polymers", Polymer, 5, pp. 1665-1678.
Jana, S. C., W. Scott and U. Sundararaj, 2000, "Single extruder screw for efficient blending of miscible and
immiscible polymeric materials", Google Patents.
Jiang, H., R. Browning, P. Liu, T. Chang and H.-J. Sue, 2011, "Determination of epoxy coating wet-adhesive
strength using a standardized ASTM/ISO scratch test", Journal of Coatings Technology and Research, 2, pp.
255-263.
Jiang, H., R. Browning and H.-J. Sue, 2009, "Understanding of scratch-induced damage mechanisms in polymers",
Polymer, 16, pp. 4056-4065.
Jiang, P. and M. J. McFarland, 2004, "Large-scale fabrication of wafer-size colloidal crystals, macroporous
polymers and nanocomposites by spin-coating", Journal of the American Chemical Society, 42, pp. 13778-
13786.
Jimenez, G. A., 2007, "Characterization of poly(methyl methacrylate) and thermoplastic polyurethane-carbon
nanofiber composites produced by chaotic mixing ", PhD Thesis, University of Akron, Akron, United States
of America.
Jimenez, G. A. and S. C. Jana, 2007, "Electrically conductive polymer nanocomposites of polymethylmethacrylate
and carbon nanofibers prepared by chaotic mixing", Composites Part A: Applied Science and Manufacturing,
3, pp. 983-993.
Jimenez, G. A. and S. C. Jana, 2007, "Oxidized carbon nanofiber/polymer composites prepared by chaotic mixing",
Carbon, 10, pp. 2079-2091.
Jimenez, G. A. and S. C. Jana, 2009, "Composites of carbon nanofibers and thermoplastic polyurethanes with shape-
memory properties prepared by chaotic mixing", Polymer Engineering & Science, 10, pp. 2020-2030.
Jin, L., C. Bower and O. Zhou, 1998, "Alignment of carbon nanotubes in a polymer matrix by mechanical
stretching", Applied Physics Letters, 9, pp. 1197-1199.
Jo, I., M. T. Pettes, J. Kim, K. Watanabe, T. Taniguchi, Z. Yao and L. Shi, 2013, "Thermal conductivity and phonon
transport in suspended few-layer hexagonal boron nitride", Nano Letters, 2, pp. 550-554.
Jung, C., 2005, "Synthesis of thermoplastic polyurethanes and polyurethane nanocomposites under chaotic mixing
condition", PhD Thesis, University of Akron, Akron, United States of America.
Kaiser, K. L., 2005, "Electromagnetic shielding", Taylor & Francis.
Kalendová, A., 2003, "Effects of particle sizes and shapes of zinc metal on the properties of anticorrosive coatings",
Progress in Organic Coatings, 4, pp. 324-332.
Kalendová, A., D. Veselý, M. Kohl and J. Stejskal, 2015, "Anticorrosion efficiency of zinc-filled epoxy coatings
containing conducting polymers and pigments", Progress in Organic Coatings, pp. 1-20.
166
Kalendová, A., D. Veselý and J. Stejskal, 2008, "Organic coatings containing polyaniline and inorganic pigments as
corrosion inhibitors", Progress in Organic Coatings, 1, pp. 105-116.
Kara, S., E. Arda, F. Dolastir and Ö. Pekcan, 2010, "Electrical and optical percolations of polystyrene latex–
multiwalled carbon nanotube composites", Journal of Colloid and Interface Science, 2, pp. 395-401.
Kelly, F. P., 1979, "Reversibility and Stochastic Networks", John Wiley and Sons.
Kendig, M., M. HonandL.Warren,2003,"‘Smartcorrosion inhibiting coatings", Progress in Organic Coatings, 3,
pp. 183-189.
Kennedy, J. L., 1993, "Oil and Gas Pipeline Fundamentals", PennWell Publishing Company.
Khakhar, D. V. and J. M. Ottino, 1987, "Breakup of liquid threads in linear flows", International Journal of
Multiphase Flow, 1, pp. 71-86.
Khan, S. U., J. R. Pothnis and J.-K. Kim, 2013, "Effects of carbon nanotube alignment on electrical and mechanical
properties of epoxy nanocomposites", Composites Part A: Applied Science and Manufacturing, pp. 26-34.
Kho, J.-G., K.-T. Moon, J.-H. Kim and D.-P. Kim, 2000, "Properties of Boron Nitride (BxNy) Films Produced by
the Spin-Coating Process of Polyborazine", Journal of the American Ceramic Society, 11, pp. 2681-2683.
Kim, H. S., J.-u. Jang, J. Yu and S. Y. Kim, 2015, "Thermal conductivity of polymer composites based on the length
of multi-walled carbon nanotubes", Composites Part B: Engineering, pp. 505-512.
Kim, S.-K. and T.-S. Oh, 2011, "Electrodeposition behavior and characteristics of Ni-carbon nanotube composite
coatings", Transactions of Nonferrous Metals Society of China, pp. s68-s72.
Kim, S., H. Choi and S. Hong, 2007, "Bulk polymerized polystyrene in the presence of multiwalled carbon
nanotubes", Colloid and Polymer Science, 5, pp. 593-598.
Kiran, M., K. Raidongia, U. Ramamurty and C. Rao, 2011, "Improved mechanical properties of polymer
nanocomposites incorporating graphene-like BN: Dependence on the number of BN layers", Scripta
Materialia, 6, pp. 592-595.
Kirkpatrick, S., 1973, "Percolation and Conduction", Reviews of Modern Physics, 4, pp. 574-588.
Knudsen, O. Ø., U. Steinsmo and M. Bjordal, 2005, "Zinc-rich primers - Test performance and electrochemical
properties", Progress in Organic Coatings, 3, pp. 224-229.
Kolasinska, M., T. Gutberlet and R. Krastev, 2009, "Ordering of Fe3O4 nanoparticles in polyelectrolyte multilayer
films", Langmuir, 17, pp. 10292-10297.
Kopeliovich, D. (2012), "Boron nitride as solid lubricant", www.substech.com.
Krause, B., P. Pötschke and L. Häußler, 2009, "Influence of small scale melt mixing conditions on electrical
resistivity of carbon nanotube-polyamide composites", Composites Science and Technology, 10, pp. 1505-
1515.
Krause, B., T. Villmow, R. Boldt, M. Mende, G. Petzold and P. Pötschke, 2011, "Influence of dry grinding in a ball
mill on the length of multiwalled carbon nanotubes and their dispersion and percolation behaviour in melt
mixed polycarbonate composites", Composites Science and Technology, 8, pp. 1145-1153.
167
Kumar, S., L. L. Sun, S. Caceres, B. Li, W. Wood, A. Perugini, R. G. Maguire and W. H. Zhong, 2010, "Dynamic
synergy of graphitic nanoplatelets and multi-walled carbon nanotubes in polyetherimide nanocomposites",
Nanotechnology, 10, pp. 105702-9.
Kuzumaki, T., K. Miyazawa, H. Ichinose and K. Ito, 1998, "Processing of carbon nanotube reinforced aluminum
composite", Journal of Materials Research, 9, pp. 2445-2449.
Lamaka, S. V., M. L. Zheludkevich, K. A. Yasakau, R. Serra, S. K. Poznyak and M. G. S. Ferreira, 2007,
"Nanoporous titania interlayer as reservoir of corrosion inhibitors for coatings with self-healing ability",
Progress in Organic Coatings, 2–3, pp. 127-135.
Lasia, A., 2002, "Electrochemical Impedance Spectroscopy and its Applications", Modern Aspects of
Electrochemistry, B. E. Conway, J. O. M. Bockris and R. White, Springer US, pp. 143-248.
Li, C., E. T. Thostenson and T.-W. Chou, 2007, "Dominant role of tunneling resistance in the electrical conductivity
of carbon nanotube-based composites", Applied Physics Letters, 22, pp. 223114-3.
Li, D., 2011, "Shortest paths through a reinforced random walk, Department of Mathematics, Uppsala University,
Uppsala, Sweden.
Li, H. and U. Sundararaj, 2008, "Does drop size affect the mechanism of viscoelastic drop breakup?", Physics of
Fluids, 5, pp. 053101-6.
Li, H. and U. Sundararaj, 2009, "Morphology Development of Polymer Blends in Extruder: The Effects of
Compatibilization and Rotation Rate", Macromolecular Chemistry and Physics, 10, pp. 852-863.
Li, J., P.-S. Wong and J.-K. Kim, 2008, "Hybrid nanocomposites containing carbon nanotubes and graphite
nanoplatelets", Materials Science and Engineering: A, pp. 660-663.
Li, L., M. Zhang and W. Ruan, 2014, "Studies on synergistic effect of CNT and CB nanoparticles on PVDF",
Polymer Composites, pp. 2248-2254.
Li, T.-L. and S. L.-C. Hsu, 2010, "Enhanced thermal conductivity of polyimide films via a hybrid of micro- and
nano-sized boron nitride", The Journal of Physical Chemistry B, 20, pp. 6825-6829.
Li, W., A. Dichiara and J. Bai, 2013, "Carbon nanotube–graphene nanoplatelet hybrids as high-performance
multifunctional reinforcements in epoxy composites", Composites Science and Technology, pp. 221-227.
Liang, G. D. and S. C. Tjong, 2006, "Electrical properties of low-density polyethylene/multiwalled carbon nanotube
nanocomposites", Materials Chemistry and Physics, 1, pp. 132-137.
Lin, B., U. Sundararaj, F. Mighri and M. A. Huneault, 2003, "Erosion and breakup of polymer drops under simple
shear in high viscosity ratio systems", Polymer Engineering & Science, 4, pp. 891-904.
Lin, B., U. Sundararaj and P. Pötschke, 2006, "Melt mixing of polycarbonate with multi-walled carbon nanotubes in
miniature mixers", Macromolecular Materials and Engineering, 3, pp. 227-238.
Lin, R. M. and C. Lu, 2010, "Modeling of interfacial friction damping of carbon nanotube-based nanocomposites",
Mechanical Systems and Signal Processing, 8, pp. 2996-3012.
168
Lin, Z., A. McNamara, Y. Liu, K.-s. Moon and C.-P. Wong, 2014, "Exfoliated hexagonal boron nitride-based
polymer nanocomposite with enhanced thermal conductivity for electronic encapsulation", Composites
Science and Technology, pp. 123-128.
Lindt, J. T. and A. K. Ghosh, 1992, "Fluid mechanics of the formation of polymer blends. Part I: Formation of
lamellar structures", Polymer Engineering & Science, 24, pp. 1802-1813.
Lipp, A., K. A. Schwetz and K. Hunold, 1989, "Hexagonal boron nitride: fabrication, properties and applications",
Journal of the European Ceramic Society, 1, pp. 3-9.
Liu, X., Y. Shao, Y. Zhang, G. Meng, T. Zhang and F. Wang, 2015, "Using high-temperature mechanochemistry
treatment to modify iron oxide and improve the corrosion performance of epoxy coating – I. High-
temperature ball milling treatment", Corrosion Science, pp. 451-462.
Ma, P.-C., N. A. Siddiqui, G. Marom and J.-K. Kim, 2010, "Dispersion and functionalization of carbon nanotubes
for polymer-based nanocomposites: A review", Composites Part A: Applied Science and Manufacturing, 10,
pp. 1345-1367.
Mahmoodi, M., 2013, "Electrical, thermal, and machining behavior of injection molded polymeric CNT
nanocomposites", PhD Thesis, University of Calgary, Calgary, Canada.
Mahmoodi, M., M. Arjmand, U. Sundararaj and S. Park, 2012, "The electrical conductivity and electromagnetic
interference shielding of injection molded multi-walled carbon nanotube/polystyrene composites", Carbon, 4,
pp. 1455-1464.
Mahmoodi, M., Y. H. Lee, A. Mohamad and S. S. Park, 2014, "Effect of flow induced alignment on the thermal
conductivity of injection molded carbon nanotube ‐ filled polystyrene nanocomposites", Polymer
Engineering & Science, 4, pp. 753-762.
Mahmoodi, M., M. G. Mostofa, M. Jun and S. S. Park, 2013, "Characterization and micromilling of flow induced
aligned carbon nanotube nanocomposites", Journal of Micro and Nano-Manufacturing, 1, pp. 011009-8.
Marchebois, H., S. Joiret, C. Savall, J. Bernard and S. Touzain, 2002, "Characterization of zinc-rich powder coatings
by EIS and Raman spectroscopy", Surface and Coatings Technology, 2–3, pp. 151-161.
Marconnet, A. M., N. Yamamoto, M. A. Panzer, B. L. Wardle and K. E. Goodson, 2011, "Thermal conduction in
aligned carbon nanotube–polymer nanocomposites with high packing density", ACS Nano, 6, pp. 4818-4825.
Mardel, J., S. J. Garcia, P. A. Corrigan, T. Markley, A. E. Hughes, T. H. Muster, D. Lau, T. G. Harvey, A. M. Glenn,
P. A. White, S. G. Hardin, C. Luo, X. Zhou, G. E. Thompson and J. M. C. Mol, 2011, "The characterisation
and performance of Ce(dbp)3-inhibited epoxy coatings", Progress in Organic Coatings, 2–3, pp. 91-101.
Martone, A., C. Formicola, F. Piscitelli, M. Lavorgna, M. Zarrelli, V. Antonucci and M. Giordano, 2012, "Thermo-
mechanical characterization of epoxy nanocomposites with different carbon nanotube distributions obtained
by solvent aided and direct mixing", Express Polymer Letters, pp. 520-531.
Mazinani, S., A. Ajji and C. Dubois, 2009, "Morphology, structure and properties of conductive PS/CNT
nanocomposite electrospun mat", Polymer, 14, pp. 3329-3342.
Mleczko, M. J., 2011, "MATLAB Monte-Carlo simulation of percolation transport in carbon nanotube films",
Nanotechnology Engineering Research Project.
169
Moghbelli, E., L. Sun, H. Jiang, W. J. Boo and H.-J. Sue, 2009, "Scratch behavior of epoxy nanocomposites
containingα-zirconium phosphate and core-shell rubber particles", Polymer Engineering & Science, 3, pp.
483-490.
Moisala, A., Q. Li, I. Kinloch and A. Windle, 2006, "Thermal and electrical conductivity of single-and multi-walled
carbon nanotube-epoxy composites", Composites Science and Technology, 10, pp. 1285-1288.
Moloney, A. C., H. H. Kausch and H. R. Stieger, 1983, "The fracture of particulate-filled epoxide resins", Journal of
Materials Science, 1, pp. 208-216.
Moosavi, A. N., S. O. Al-Mutawwa, S. Balboul and M. R. Saady, 2006, "Hidden problems with three layer
polypropylene pipeline coatings", Corrosion 2006, NACE International.
Muratov,D. S.,D.V.Kuznetsov, I.A. Il’inykh, I.N.Mazov,A.A. Stepashkin andV.V.Tcherdyntsev, 2014,
"Thermal conductivity of polypropylene filled with inorganic particles", Journal of Alloys and Compounds,
pp. S451-S454.
Naderi, R. and M. M. Attar, 2010, "The role of zinc aluminum phosphate anticorrosive pigment in Protective
Performance and cathodic disbondment of epoxy coating", Corrosion Science, 4, pp. 1291-1296.
Nafchi, A. M., R. Nassiri, S. Sheibani, F. Ariffin and A. A. Karim, 2013, "Preparation and characterization of
bionanocomposite films filled with nanorod-rich zinc oxide", Carbohydrate Polymers, 1, pp. 233-239.
Nan, C.-W., R. Birringer, D. R. Clarke and H. Gleiter, 1997, "Effective thermal conductivity of particulate
composites with interfacial thermal resistance", Journal of Applied Physics, 10, pp. 6692-6699.
Nan, C.-W., G. Liu, Y. Lin and M. Li, 2004, "Interface effect on thermal conductivity of carbon nanotube
composites", Applied Physics Letters, 16, pp. 3549-3551.
Nan, C.-W., Z. Shi and Y. Lin, 2003, "A simple model for thermal conductivity of carbon nanotube-based
composites", Chemical Physics Letters, 5, pp. 666-669.
Nielsen, L. E., 1967, "Models for the permeability of filled polymer systems", Journal of Macromolecular Science:
Part A - Chemistry, 5, pp. 929-942.
Nielsen, L. E., 1974, "The thermal and electrical conductivity of two-phase systems", Industrial & Engineering
Chemistry Fundamentals, 1, pp. 17-20.
Nogales,A.,G.Broza,Z.Roslaniec,K.Schulte,I.Šics,B.S.Hsiao,A.Sanz,M.C.García-Gutiérrez, D. R. Rueda,
C. Domingo and T. A. Ezquerra, 2004, "Low percolation threshold in nanocomposites based on oxidized
single wall carbon nanotubes and poly(butylene terephthalate)", Macromolecules, 20, pp. 7669-7672.
Oksa, M. and J. Metsäjoki, 2015, "Optimizing NiCr and FeCr HVOF coating structures for high temperature
corrosion protection applications", Journal of Thermal Spray Technology, 3, pp. 436-453.
Olga, G., L. Hans Rudolf and A. G. Andrei, 2004, "Matching thermal expansion of mica–polymer nanocomposites
and metals", Modelling and Simulation in Materials Science and Engineering, 3, pp. S101-S105.
Ottino, J. M., W. E. Ranz and C. W. Macosko, 1979, "A lamellar model for analysis of liquid-liquid mixing",
Chemical Engineering Science, 6, pp. 877-890.
170
Park, S. and M. Shon, 2015, "Effects of multi-walled carbon nano tubes on corrosion protection of zinc rich epoxy
resin coating", Journal of Industrial and Engineering Chemistry, pp. 1258-1264.
Parmar, K., M. Mahmoodi, P. Chaneel and S. P. Simon, 2013, "Effect of CNT alignment on the strain sensing
capability of carbon nanotube composites", Smart Materials and Structures, 7, pp. 075006-12.
Paszkowicz, W., J. B. Pelka, M. Knapp, T. Szyszko and S. Podsiadlo, 2002, "Lattice parameters and anisotropic
thermal expansion of hexagonal boron nitride in the 10–297.5 K temperature range", Applied Physics A, 3,
pp. 431-435.
Pereira, D., J. D. Scantlebury, M. G. S. Ferreira and M. E. Almeida, 1990, "The application of electrochemical
measurements to the study and behaviour of zinc-rich coatings", Corrosion Science, 11, pp. 1135-1147.
Politi, P., G. Grenet, A. Marty, A. Ponchet and J. Villain, 2000, "Instabilities in crystal growth by atomic or
molecular beams", Physics Reports, 5, pp. 271-404.
Popov, V. N., 2004, "Carbon nanotubes: properties and application", Materials Science and Engineering: R: Reports,
3, pp. 61-102.
Pötschke, P., T. Villmow and B. Krause, 2013, "Melt mixed PCL/MWCNT composites prepared at different rotation
speeds: Characterization of rheological, thermal, and electrical properties, molecular weight, MWCNT
macrodispersion, and MWCNT length distribution", Polymer, 12, pp. 3071-3078.
Pradhan, G. C., L. Behera and S. K. Swain, 2014, "Effects of boron nitride nanopowder on thermal, chemical and
gas barrier properties of starch", Chinese Journal of Polymer Science, 10, pp. 1311-1318.
Prasai, D., J. C. Tuberquia, R. R. Harl, G. K. Jennings and K. I. Bolotin, 2012, "Graphene: corrosion-inhibiting
coating", ACS Nano, 2, pp. 1102-1108.
Praveen, B. M., T. V. Venkatesha, Y. Arthoba Naik and K. Prashantha, 2007, "Corrosion studies of carbon
nanotubes–Zn composite coating", Surface and Coatings Technology, 12, pp. 5836-5842.
PRD Inc., 2011, www.prdcompany.com.
Rahman, N. and M. Ismail, 2012, "Corrosion protection coating for buried pipelines: a short review", World Applied
Sciences Journal, 4, pp. 524-531.
Raja, M., S. H. Ryu and A. M. Shanmugharaj, 2013, "Thermal, mechanical and electroactive shape memory
properties of polyurethane (PU)/poly (lactic acid) (PLA)/CNT nanocomposites", European Polymer Journal,
11, pp. 3492-3500.
Ramamurthi, M., J.-S. Lee, S.-H. Yang and Y.-S. Kim, 2013, "Delamination characterization of bonded interface in
polymer coated steel using surface based cohesive model", International Journal of Precision Engineering and
Manufacturing, 10, pp. 1755-1765.
Ramani, K. and B. Moriarty, 1998, "Thermoplastic bonding to metals via injection molding for macro-composite
manufacture", Polymer Engineering & Science, 5, pp. 870-877.
Ramani, K. and A. Vaidyanathan, 1995, "Finite element analysis of effective thermal conductivity of filled
polymeric composites", Journal of Composite Materials, 13, pp. 1725-1740.
171
Ren, L., K. Pashayi, H. R. Fard, S. P. Kotha, T. Borca-Tasciuc and R. Ozisik, 2014, "Engineering the coefficient of
thermal expansion and thermal conductivity of polymers filled with high aspect ratio silica nanofibers",
Composites Part B: Engineering, pp. 228-234.
Rosato, D. V., Donald and M. G. Rosato, 2000, "Injection molding handbook", Kluwer Academic Publisher.
Rout, T. K., A. V. Gaikwad, V. Lee and S. Banerjee, 2011, "Hybrid nanocomposite coatings for corrosion protection
of low carbon steel: A substrate-integrated and scalable active–passive approach", Journal of Materials
Research, 6, pp. 837-844.
Roy, D., G. Simon, M. Forsyth and J. Mardel, 2002, "Towards a better understanding of the cathodic disbondment
performance of polyethylene coatings on steel", Advances in polymer technology, 1, pp. 44-58.
Ruhi, G., H. Bhandari and S. K. Dhawan, 2014, "Designing of corrosion resistant epoxy coatings embedded with
polypyrrole/SiO2 composite", Progress in Organic Coatings, 9, pp. 1484-1498.
Russ, M., S. S. Rahatekar, K. Koziol, B. Farmer and H.-X. Peng, 2013, "Length-dependent electrical and thermal
properties of carbon nanotube-loaded epoxy nanocomposites", Composites Science and Technology, pp. 42-
47.
Sandler, J. K. W., J. E. Kirk, I. A. Kinloch, M. S. P. Shaffer and A. H. Windle, 2003, "Ultra-low electrical
percolation threshold in carbon-nanotube-epoxy composites", Polymer, 19, pp. 5893-5899.
Sangaj, N. S. and V. C. Malshe, 2004, "Permeability of polymers in protective organic coatings", Progress in
Organic Coatings, 1, pp. 28-39.
Sangermano, M., M. Messori, M. M. Galleco, G. Rizza and B. Voit, 2009, "Scratch resistant tough nanocomposite
epoxy coatings based on hyperbranched polyesters", Polymer, 24, pp. 5647-5652.
Sarabi, M. T., A. H. Behravesh, P. Shahi and Y. Daryabari, 2012, "Effect of polymeric matrix melt flow index in
reprocessing extruded wood–plastic composites", Journal of Thermoplastic Composite Materials, pp. 881-
894.
Sau, M., 2003, "Morphology development in chaotic mixing of polymers", PhD Thesis, University of Akron, Akron,
United States of America.
Sau, M. and S. C. Jana, 2004, "Effect of waveforms on morphology development in chaotic mixing of polymers",
AIChE Journal, 10, pp. 2346-2358.
Sauvant-Moynot, V., S. Gonzalez and J. Kittel, 2008, "Self-healing coatings: An alternative route for anticorrosion
protection", Progress in Organic Coatings, 3, pp. 307-315.
Schaefer, K. and A. Miszczyk, 2013, "Improvement of electrochemical action of zinc-rich paints by addition of
nanoparticulate zinc", Corrosion Science, pp. 380-391.
Schilling, P. J., P. D. Herrington, E. Daigle and E. Meletis, 2002, "Surface characteristics of structural steel
processed using electro-plasma techniques", Journal of materials engineering and performance, 1, pp. 26-31.
Shen, L., W. Qiu, W. Wang, G. Xiao and Q. Guo, 2015, "Facile fabrication of superhydrophobic conductive
graphite nanoplatelet/vapor-grown carbon fiber/polypropylene composite coatings", Composites Science and
Technology, pp. 39-45.
172
Shenogin, S., L. Xue, R. Ozisik, P. Keblinski and D. G. Cahill, 2004, "Role of thermal boundary resistance on the
heat flow in carbon-nanotube composites", Journal of Applied Physics, 12, pp. 8136-8144.
Shi, X., T. A. Nguyen, Z. Suo, Y. Liu and R. Avci, 2009, "Effect of nanoparticles on the anticorrosion and
mechanical properties of epoxy coating", Surface and Coatings Technology, 3, pp. 237-245.
Shi, Y., C. Hamsen, X. Jia, K. K. Kim, A. Reina, M. Hofmann, A. L. Hsu, K. Zhang, H. Li and Z.-Y. Juang, 2010,
"Synthesis of few-layer hexagonal boron nitride thin film by chemical vapor deposition", Nano letters, 10, pp.
4134-4139.
Shreir, L. L., R. A. Jarman and G. T. Burstein, 1993, "Corrosion (3rd Edition)" Volumes 1-2, Elsevier.
Shui, X. and D. D. L. Chung, 2000, "Submicron diameter nickel filaments and their polymer-matrix composites",
Journal of Materials Science, 7, pp. 1773-1785.
Simmons, J. G., 1963, "Generalized formula for the electric tunnel effect between similar electrodes separated by a
thin insulating film", Journal of Applied Physics, 6, pp. 1793-1803.
Simon, M., K. Stafford and D. Ou, 2008, "Nanoclay reinforcement of liquid silicone rubber", Journal of Inorganic
and Organometallic Polymers and Materials, 3, pp. 364-373.
Singh, B. P., S. Nayak, K. K. Nanda, B. K. Jena, S. Bhattacharjee and L. Besra, 2013, "The production of a
corrosion resistant graphene reinforced composite coating on copper by electrophoretic deposition", Carbon,
pp. 47-56.
Spanoudakis, J. and R. J. Young, 1984, "Crack propagation in a glass particle-filled epoxy resin", Journal of
Materials Science, 2, pp. 473-486.
Spitalsky, Z., D. Tasis, K. Papagelis and C. Galiotis, 2010, "Carbon nanotube–polymer composites: chemistry,
processing, mechanical and electrical properties", Progress in polymer science, 3, pp. 357-401.
Srivastava, V. K. and P. S. Shembekar, 1990, "Tensile and fracture properties of epoxy resin filled with flyash
particles", Journal of Materials Science, 8, pp. 3513-3516.
Strohm, H. and P. Löbmann, 2004, "Porous TiO2 hollow spheres by liquid phase deposition on polystyrene latex-
stabilised Pickering emulsions", Journal of Materials Chemistry, 17, pp. 2667-2673.
Sun, G., G. Chen, Z. Liu and M. Chen, 2010, "Preparation, crystallization, electrical conductivity and thermal
stability of syndiotactic polystyrene/carbon nanotube composites", Carbon, 5, pp. 1434-1440.
Sun, Y., H.-D. Bao, Z.-X. Guo and J. Yu, 2008, "Modeling of the electrical percolation of mixed carbon fillers in
polymer-based composites", Macromolecules, 1, pp. 459-463.
Sundararaj, U., Y. Dori and C. W. Macosko, 1995, "Sheet formation in immiscible polymer blends: model
experiments on initial blend morphology", Polymer, 10, pp. 1957-1968.
Sundararaj, U., C. Macosko, R. Rolando and H. Chan, 1992, "Morphology development in polymer blends",
Polymer Engineering & Science, 24, pp. 1814-1823.
Swartz, E. T. and R. O. Pohl, 1989, "Thermal boundary resistance", Reviews of Modern Physics, 3, pp. 605-668.
173
TabkhPaz, M., M. Mahmoodi, M. Arjmand, U. Sundararaj, J. Chu and S. S. Park, 2015, "Investigation of chaotic
mixing for mwcnt/polymer composites", Macromolecular Materials and Engineering, 5, pp. 482-496.
TabkhPaz, M., K. Parmar, A. M. Ali and S. Park, 2014, "Effects of foaming through leaching on the electrical
behavior of polystyrene/carbon nanotube composites", Journal of Thermoplastic Composite Materials.
Terrones, M., 2012, "Controlling the shapes and assemblages of graphene", Proceedings of the National Academy of
Sciences, 21, pp. 7951-7952.
Thompson, I. and J. R. Saithala, 2013, "Review of pipe line coating systems from an operators perspective",
Corrosion 2013, NACE International.
Thostenson, E. T., Z. Ren and T.-W. Chou, 2001, "Advances in the science and technology of carbon nanotubes and
their composites: a review", Composites Science and Technology, 13, pp. 1899-1912.
Tjahjadi, M. and J. Ottino, 1991, "Stretching and breakup of droplets in chaotic flows", Journal of Fluid Mechanics,
pp. 191-219.
Tjong, S. C., G. D. Liang and S. P. Bao, 2007, "Electrical behavior of polypropylene/multiwalled carbon nanotube
nanocomposites with low percolation threshold", Scripta Materialia, 6, pp. 461-464.
Tomadakis, M. M. and S. V. Sotirchos, 1993, "Transport properties of random arrays of freely overlapping cylinders
with various orientation distributions", The Journal of Chemical Physics, 1, pp. 616-626.
Tsukada, Y., S. Tsuchida and Y. Mashimoto, 1992, "Surface laminar circuit packaging", Electronic Components and
Technology Conference, IEEE 42nd
, San Diego, United States of America.
Valencia, V., 2015, "Electrochemical characterization of zinc-rich epoxy primer-CNT nanocoating/steel interface in
CO2 saturated under different flow conditions", MSc Thesis, University of Akron, Akron, United States of
America.
van den Bosch, M. J., P. J. G. Schreurs and M. G. D. Geers, 2008, "Identification and characterization of
delamination in polymer coated metal sheet", Journal of the Mechanics and Physics of Solids, 11, pp. 3259-
3276.
Velasco-Santos, C., A. L. Martínez-Hernández, F. T. Fisher, R. Ruoff and V. M. Castaño, 2003, "Improvement of
Thermal and Mechanical Properties of Carbon Nanotube Composites through Chemical Functionalization",
Chemistry of Materials, 23, pp. 4470-4475.
Vencl, A., S. Arostegui, G. Favaro, F. Zivic, M. Mrdak, S. Mitrović and V. Popovic, 2011, "Evaluation of
adhesion/cohesion bond strength of the thick plasma spray coatings by scratch testing on coatings cross-
sections", Tribology International, 11, pp. 1281-1288.
Vlachopoulos, J. and D. Strutt, 2003, "Polymer processing", Materials science and technology, 9, pp. 1161-1169.
Voccia,S.,L.Bech,B.Gilbert,R.JérômeandC.Jérôme,2004,"PreparationofPoly(ε-caprolactone) Brushes at the
Surface of Conducting Substrates", Langmuir, 24, pp. 10670-10678.
Wang, J., J. K. Carson, M. F. North and D. J. Cleland, 2008, "A new structural model of effective thermal
conductivity for heterogeneous materials with co-continuous phases", International Journal of Heat and Mass
Transfer, 9–10, pp. 2389-2397.
174
Wang, S., Z. Liang, P. Gonnet, Y. H. Liao, B. Wang and C. Zhang, 2007, "Effect of Nanotube Functionalization on
the Coefficient of Thermal Expansion of Nanocomposites", Advanced Functional Materials, 1, pp. 87-92.
Wang, S., M. Tambraparni, J. Qiu, J. Tipton and D. Dean, 2009, "Thermal expansion of graphene composites",
Macromolecules, 14, pp. 5251-5255.
Wang, X.-B., Q. Weng, X. Wang, X. Li, J. Zhang, F. Liu, X.-F. Jiang, H. Guo, N. Xu, D. Golberg and Y. Bando,
2014, "Biomass-directed synthesis of 20 g high-quality boron nitride nanosheets for thermoconductive
polymeric composites", ACS Nano, 9, pp. 9081-9088.
Watanabe, K., T. Taniguchi, T. Niiyama, K. Miya and M. Taniguchi, 2009, "Far-ultraviolet plane-emission
handheld device based on hexagonal boron nitride", Nat Photon, 10, pp. 591-594.
Wei, Y. H., L. X. Zhang and W. Ke, 2007, "Evaluation of corrosion protection of carbon black filled fusion-bonded
epoxy coatings on mild steel during exposure to a quiescent 3% NaCl solution", Corrosion Science, 2, pp.
287-302.
White, S. I., B. A. DiDonna, M. Mu, T. C. Lubensky and K. I. Winey, 2009, "Simulations and electrical
conductivity of percolated networks of finite rods with various degrees of axial alignment", Physical Review
B, 2, pp. 024301-6.
Wichmann, M., 2011, "Numerical modeling, determination, and characterization of electrical properties of
nanocomposites", MSc Thesis, Rice University, Houston, United States of America.
Wielant, J., R. Posner, G. Grundmeier and H. Terryn, 2008, "Interface dipoles observed after adsorption of model
compounds on iron oxide films: effect of organic functionality and oxide surface chemistry", The Journal of
Physical Chemistry C, 33, pp. 12951-12957.
Wong, C. and R. S. Bollampally, 1999, "Thermal conductivity, elastic modulus, and coefficient of thermal
expansion of polymer composites filled with ceramic particles for electronic packaging", Journal of Applied
Polymer Science, 14, pp. 3396-3403.
Wong, M., G. T. Lim, A. Moyse, J. N. Reddy and H. J. Sue, 2004, "A new test methodology for evaluating scratch
resistance of polymers", Wear, 11–12, pp. 1214-1227.
Wong, M., A. Moyse, F. Lee and H.-J. Sue, 2004, "Study of surface damage of polypropylene under progressive
loading", Journal of Materials Science, 10, pp. 3293-3308.
Wu, D., L. Wu, W. Zhou, Y. Sun and M. Zhang, 2010, "Relations between the aspect ratio of carbon nanotubes and
the formation of percolation networks in biodegradable polylactide/carbon nanotube composites", Journal of
Polymer Science Part B: Polymer Physics, 4, pp. 479-489.
Wu, Y.-P., Y.-Q. Wang, H.-F. Zhang, Y.-Z. Wang, D.-S. Yu, L.-Q. Zhang and J. Yang, 2005, "Rubber–pristine clay
nanocomposites prepared by co-coagulating rubber latex and clay aqueous suspension", Composites Science
and Technology, 7–8, pp. 1195-1202.
Xin, F. and L. Li, 2011, "Decoration of carbon nanotubes with silver nanoparticles for advanced CNT/polymer
nanocomposites", Composites Part A: Applied Science and Manufacturing, 8, pp. 961-967.
Xu, L. Y. and Y. F. Cheng, 2013, "Development of a finite element model for simulation and prediction of
mechanoelectrochemical effect of pipeline corrosion", Corrosion Science, pp. 150-160.
175
Xu, Y., B. Higgins and W. J. Brittain, 2005, "Bottom-up synthesis of PS–CNF nanocomposites", Polymer, 3, pp.
799-810.
Xu, Y., G. Ray and B. Abdel-Magid, 2006, "Thermal behavior of single-walled carbon nanotube polymer–matrix
composites", Composites Part A: Applied Science and Manufacturing, 1, pp. 114-121.
Yamamoto, N., 2011, "Multi-scale electrical and thermal properties of aligned multi-walled carbon nanotubes and
their composites", PhD Thesis, Massachusetts Institute of Technology, Cambridge, United States of America.
Yamamoto, N., A. Marconnet, H. Duong, K. Goodson and B. Wardle, 2011, "Non-linear thermal conductivity
enhancement in nanocomposites with aligned-CNT implementation", 18th
International Conference on
Composite Materials (ICCM18), Jeju Island, South Korea.
Yang, C., Y. Lin and C. W. Nan, 2009, "Modified carbon nanotube composites with high dielectric constant, low
dielectric loss and large energy density", Carbon, 4, pp. 1096-1101.
Yang, D. J., S. G. Wang, Q. Zhang, P. J. Sellin and G. Chen, 2004, "Thermal and electrical transport in multi-walled
carbon nanotubes", Physics Letters A, 3, pp. 207-213.
Yang, L. H., F. C. Liu and E. H. Han, 2005, "Effects of P/B on the properties of anticorrosive coatings with different
particle size", Progress in Organic Coatings, 2, pp. 91-98.
Yang, Y., M. C. Gupta, J. N. Zalameda and W. P. Winfree, 2008, "Dispersion behaviour, thermal and electrical
conductivities of carbon nanotube-polystyrene nanocomposites", Micro & Nano Letters, 2, pp. 35-40.
Yasmin, A. and I. M. Daniel, 2004, "Mechanical and thermal properties of graphite platelet/epoxy composites",
Polymer, 24, pp. 8211-8219.
Yasmin, A., J. J. Luo, J. L. Abot and I. M. Daniel, 2006, "Mechanical and thermal behavior of clay/epoxy
nanocomposites", Composites Science and Technology, 14, pp. 2415-2422.
Yeh, J.-M., H.-Y. Huang, C.-L. Chen, W.-F. Su and Y.-H. Yu, 2006, "Siloxane-modified epoxy resin–clay
nanocomposite coatings with advanced anticorrosive properties prepared by a solution dispersion approach",
Surface and Coatings Technology, 8, pp. 2753-2763.
Yin, S., C. Rong, S. Zhang, P. Huo and G. Wang, 2011, "The preparation and electrical properties of the
functionalized graphene/poly (ether sulfone) nanocomposites", High Performance Polymers, 8, pp. 592-601.
Yin, T., M. Z. Rong, M. Q. Zhang and G. C. Yang, 2007, "Self-healing epoxy composites–preparation and effect of
the healant consisting of microencapsulated epoxy and latent curing agent", Composites Science and
Technology, 2, pp. 201-212.
Yu, A., P. Ramesh, X. Sun, E. Bekyarova, M. E. Itkis and R. C. Haddon, 2008, "Enhanced thermal conductivity in a
hybrid graphite nanoplatelet – carbon nanotube filler for epoxy composites", Advanced Materials, 24, pp.
4740-4744.
Zhang, H., Z. Wang, Z. Zhang, J. Wu, J. Zhang and J. He, 2007, "Regenerated‐cellulose/multiwalled‐carbon‐
nanotube composite fibers with enhanced mechanical properties prepared with the ionic liquid 1‐allyl‐3‐methylimidazolium chloride", Advanced Materials, 5, pp. 698-704.
Zhao, X., C. Hinchliffe, C. Johnston, P. J. Dobson and P. S. Grant, 2008, "Spray deposition of polymer
nanocomposite films for dielectric applications", Materials Science and Engineering: B, 2, pp. 140-145.
176
Zhao, Y.-H., Y.-F. Zhang, Z.-K. Wu and S.-L. Bai, 2016, "Synergic enhancement of thermal properties of polymer
composites by graphene foam and carbon black", Composites Part B: Engineering, pp. 52-58.
Zhbanov, A. I., E. G. Pogorelov and Y.-C. Chang, 2010, "Van der Waals interaction between two crossed carbon
nanotubes", ACS Nano, 10, pp. 5937-5945.
Zheng, Z., Y. Du, Z. Wang, Q. Feng and C. Wang, 2013, "Pt/graphene-CNTs nanocomposite based electrochemical
sensors for the determination of endocrine disruptor bisphenol A in thermal printing papers", Analyst, 2, pp.
693-701.
Zhong, H. and J. R. Lukes, 2006, "Interfacial thermal resistance between carbon nanotubes: molecular dynamics
simulations and analytical thermal modeling", Physical Review B, 12, pp. 0125403-10.
Zhou, H., S. Zhang and M. Yang, 2007, "The effect of heat-transfer passages on the effective thermal conductivity
of high filler loading composite materials", Composites Science and Technology, 6, pp. 1035-1040.
Zhou, W., T. E. Jeffers and O. H. DECKEE, 2007, "Properties of a new high-tg FBE coating for high-temperature
service", Materials performance, 4, pp. 36-40.
Zumbrunnen, D. A., K. C. Miles and Y. H. Liu, 1996, "Auto-processing of very fine-scale composite materials by
chaotic mixing of melts", Composites Part A: Applied Science and Manufacturing, 1, pp. 37-47.

177
APPENDIX
6/20/2016 Rightslink® by Copyright Clearance Center
https://s100.copyright.com/AppDispatchServlet#formTop 1/1
Title: Effects of foaming throughleaching on the electricalbehavior of polystyrene/carbonnanotube composites:
Author: Majid TabkhPaz, Kaushik Parmar,Anam Mohammed Ali, SimonPark
Publication: Journal of ThermoplasticComposite Materials
Publisher: SAGE PublicationsDate: 04/30/2014Copyright © 2014, © SAGE Publications
Logged in as: Simon Park Account #: 3000624301
Gratis Reuse
Without further permission, as the Author of the journal article you may:post the accepted version (version 2) on your personal website, department’swebsite or your institution's repository. You may NOT post the published version(version 3) on a website or in a repository without permission from SAGE.post the accepted version (version 2) of the article in any repository other than thoselisted above 12 months after official publication of the article.use the published version (version 3) for your own teaching needs or to supply onan individual basis to research colleagues, provided that such supply is not forcommercial purposes.use the accepted or published version (version 2 or 3) in a book written or edited byyou. To republish the article in a book NOT written or edited by you, permissionsmust be cleared on the previous page under the option 'Republish in a Book/Journal'by the publisher, editor or author who is compiling the new work.
When posting or re-using the article electronically, please link to the original article andcite the DOI.All other re-use of the published article should be referred to SAGE. Contact informationcan be found on the bottom of our ‘Journal Permissions’ page.
Copyright © 2016 Copyright Clearance Center, Inc. All Rights Reserved. Privacy statement. Terms and Conditions. Comments? We would like to hear from you. E-mail us at [email protected]
6/20/2016 RightsLink Printable License
https://s100.copyright.com/App/PrintableLicenseFrame.jsp?publisherID=70&publisherName=ELS&publication=1359-8368&publicationID=10949&rightID=1&ty… 1/6
ELSEVIER LICENSETERMS AND CONDITIONS
Jun 20, 2016
This Agreement between Simon Park ("You") and Elsevier ("Elsevier") consists of yourlicense details and the terms and conditions provided by Elsevier and Copyright ClearanceCenter.
License Number 3893251410451
License date Jun 20, 2016
Licensed Content Publisher Elsevier
Licensed Content Publication Composites Part B: Engineering
Licensed Content Title Thermal conductivity of carbon nanotube and hexagonal boron nitridepolymer composites
Licensed Content Author Majid TabkhPaz,Shaghayegh Shajari,Mehdi Mahmoodi,DongYeobPark,Hamsini Suresh,Simon S. Park
Licensed Content Date 1 September 2016
Licensed Content VolumeNumber
100
Licensed Content IssueNumber
n/a
Licensed Content Pages 12
Start Page 19
End Page 30
Type of Use reuse in a thesis/dissertation
Intended publisher of newwork
other
Portion full article
Format electronic
Are you the author of thisElsevier article?
Yes
Will you be translating? No
Order reference number
Title of yourthesis/dissertation
INVESTIGATION OF POLYMERIC COMPOSITES WITH HIGH ASPECTRATIO NANOPARTICULATES FOR METAL COATING
Expected completion date Jun 2016
Estimated size (number ofpages)
197
Elsevier VAT number GB 494 6272 12
Requestor Location Simon Park2500 University Dr. NW

6/20/2016 RightsLink Printable License
https://s100.copyright.com/App/PrintableLicenseFrame.jsp?publisherID=70&publisherName=ELS&publication=1359-8368&publicationID=10949&rightID=1&ty… 2/6
Calgary, AB T2N1N4CanadaAttn: Dr. Simon Park
Total 0.00 CAD
Terms and Conditions
INTRODUCTION1. The publisher for this copyrighted material is Elsevier. By clicking "accept" inconnection with completing this licensing transaction, you agree that the following termsand conditions apply to this transaction (along with the Billing and Payment terms andconditions established by Copyright Clearance Center, Inc. ("CCC"), at the time that youopened your Rightslink account and that are available at any time athttp://myaccount.copyright.com).
GENERAL TERMS2. Elsevier hereby grants you permission to reproduce the aforementioned material subject tothe terms and conditions indicated.3. Acknowledgement: If any part of the material to be used (for example, figures) hasappeared in our publication with credit or acknowledgement to another source, permissionmust also be sought from that source. If such permission is not obtained then that materialmay not be included in your publication/copies. Suitable acknowledgement to the sourcemust be made, either as a footnote or in a reference list at the end of your publication, asfollows:"Reprinted from Publication title, Vol /edition number, Author(s), Title of article / title ofchapter, Pages No., Copyright (Year), with permission from Elsevier [OR APPLICABLESOCIETY COPYRIGHT OWNER]." Also Lancet special credit - "Reprinted from TheLancet, Vol. number, Author(s), Title of article, Pages No., Copyright (Year), withpermission from Elsevier."4. Reproduction of this material is confined to the purpose and/or media for whichpermission is hereby given.5. Altering/Modifying Material: Not Permitted. However figures and illustrations may bealtered/adapted minimally to serve your work. Any other abbreviations, additions, deletionsand/or any other alterations shall be made only with prior written authorization of ElsevierLtd. (Please contact Elsevier at [email protected])6. If the permission fee for the requested use of our material is waived in this instance,please be advised that your future requests for Elsevier materials may attract a fee.7. Reservation of Rights: Publisher reserves all rights not specifically granted in thecombination of (i) the license details provided by you and accepted in the course of thislicensing transaction, (ii) these terms and conditions and (iii) CCC's Billing and Paymentterms and conditions.8. License Contingent Upon Payment: While you may exercise the rights licensedimmediately upon issuance of the license at the end of the licensing process for thetransaction, provided that you have disclosed complete and accurate details of your proposeduse, no license is finally effective unless and until full payment is received from you (eitherby publisher or by CCC) as provided in CCC's Billing and Payment terms and conditions. Iffull payment is not received on a timely basis, then any license preliminarily granted shall bedeemed automatically revoked and shall be void as if never granted. Further, in the eventthat you breach any of these terms and conditions or any of CCC's Billing and Paymentterms and conditions, the license is automatically revoked and shall be void as if nevergranted. Use of materials as described in a revoked license, as well as any use of thematerials beyond the scope of an unrevoked license, may constitute copyright infringementand publisher reserves the right to take any and all action to protect its copyright in the

6/20/2016 RightsLink Printable License
https://s100.copyright.com/App/PrintableLicenseFrame.jsp?publisherID=70&publisherName=ELS&publication=1359-8368&publicationID=10949&rightID=1&ty… 3/6
materials.9. Warranties: Publisher makes no representations or warranties with respect to the licensedmaterial.10. Indemnity: You hereby indemnify and agree to hold harmless publisher and CCC, andtheir respective officers, directors, employees and agents, from and against any and allclaims arising out of your use of the licensed material other than as specifically authorizedpursuant to this license.11. No Transfer of License: This license is personal to you and may not be sublicensed,assigned, or transferred by you to any other person without publisher's written permission.12. No Amendment Except in Writing: This license may not be amended except in a writingsigned by both parties (or, in the case of publisher, by CCC on publisher's behalf).13. Objection to Contrary Terms: Publisher hereby objects to any terms contained in anypurchase order, acknowledgment, check endorsement or other writing prepared by you,which terms are inconsistent with these terms and conditions or CCC's Billing and Paymentterms and conditions. These terms and conditions, together with CCC's Billing and Paymentterms and conditions (which are incorporated herein), comprise the entire agreementbetween you and publisher (and CCC) concerning this licensing transaction. In the event ofany conflict between your obligations established by these terms and conditions and thoseestablished by CCC's Billing and Payment terms and conditions, these terms and conditionsshall control.14. Revocation: Elsevier or Copyright Clearance Center may deny the permissions describedin this License at their sole discretion, for any reason or no reason, with a full refund payableto you. Notice of such denial will be made using the contact information provided by you. Failure to receive such notice will not alter or invalidate the denial. In no event will Elsevieror Copyright Clearance Center be responsible or liable for any costs, expenses or damageincurred by you as a result of a denial of your permission request, other than a refund of theamount(s) paid by you to Elsevier and/or Copyright Clearance Center for deniedpermissions.
LIMITED LICENSEThe following terms and conditions apply only to specific license types:15. Translation: This permission is granted for non-exclusive world English rights onlyunless your license was granted for translation rights. If you licensed translation rights youmay only translate this content into the languages you requested. A professional translatormust perform all translations and reproduce the content word for word preserving theintegrity of the article.16. Posting licensed content on any Website: The following terms and conditions apply asfollows: Licensing material from an Elsevier journal: All content posted to the web site mustmaintain the copyright information line on the bottom of each image; A hyper-text must beincluded to the Homepage of the journal from which you are licensing athttp://www.sciencedirect.com/science/journal/xxxxx or the Elsevier homepage for books athttp://www.elsevier.com; Central Storage: This license does not include permission for ascanned version of the material to be stored in a central repository such as that provided byHeron/XanEdu.Licensing material from an Elsevier book: A hyper-text link must be included to the Elsevierhomepage at http://www.elsevier.com . All content posted to the web site must maintain thecopyright information line on the bottom of each image.
Posting licensed content on Electronic reserve: In addition to the above the followingclauses are applicable: The web site must be password-protected and made available only tobona fide students registered on a relevant course. This permission is granted for 1 year only.
6/20/2016 RightsLink Printable License
https://s100.copyright.com/App/PrintableLicenseFrame.jsp?publisherID=70&publisherName=ELS&publication=1359-8368&publicationID=10949&rightID=1&ty… 4/6
You may obtain a new license for future website posting.17. For journal authors: the following clauses are applicable in addition to the above:Preprints:A preprint is an author's own write-up of research results and analysis, it has not been peer-reviewed, nor has it had any other value added to it by a publisher (such as formatting,copyright, technical enhancement etc.).Authors can share their preprints anywhere at any time. Preprints should not be added to orenhanced in any way in order to appear more like, or to substitute for, the final versions ofarticles however authors can update their preprints on arXiv or RePEc with their AcceptedAuthor Manuscript (see below).If accepted for publication, we encourage authors to link from the preprint to their formalpublication via its DOI. Millions of researchers have access to the formal publications onScienceDirect, and so links will help users to find, access, cite and use the best availableversion. Please note that Cell Press, The Lancet and some society-owned have differentpreprint policies. Information on these policies is available on the journal homepage.Accepted Author Manuscripts: An accepted author manuscript is the manuscript of anarticle that has been accepted for publication and which typically includes author-incorporated changes suggested during submission, peer review and editor-authorcommunications.Authors can share their accepted author manuscript:
immediatelyvia their non-commercial person homepage or blogby updating a preprint in arXiv or RePEc with the accepted manuscriptvia their research institute or institutional repository for internal institutionaluses or as part of an invitation-only research collaboration work-group
directly by providing copies to their students or to research collaborators fortheir personal use
for private scholarly sharing as part of an invitation-only work group oncommercial sites with which Elsevier has an agreement
after the embargo periodvia non-commercial hosting platforms such as their institutional repositoryvia commercial sites with which Elsevier has an agreement
In all cases accepted manuscripts should:
link to the formal publication via its DOI bear a CC-BY-NC-ND license - this is easy to do if aggregated with other manuscripts, for example in a repository or other site, beshared in alignment with our hosting policy not be added to or enhanced in any way toappear more like, or to substitute for, the published journal article.
Published journal article (JPA): A published journal article (PJA) is the definitive finalrecord of published research that appears or will appear in the journal and embodies allvalue-adding publishing activities including peer review co-ordination, copy-editing,formatting, (if relevant) pagination and online enrichment.Policies for sharing publishing journal articles differ for subscription and gold open accessarticles:Subscription Articles: If you are an author, please share a link to your article rather than thefull-text. Millions of researchers have access to the formal publications on ScienceDirect,
6/20/2016 RightsLink Printable License
https://s100.copyright.com/App/PrintableLicenseFrame.jsp?publisherID=70&publisherName=ELS&publication=1359-8368&publicationID=10949&rightID=1&ty… 5/6
and so links will help your users to find, access, cite, and use the best available version.Theses and dissertations which contain embedded PJAs as part of the formal submission canbe posted publicly by the awarding institution with DOI links back to the formalpublications on ScienceDirect.If you are affiliated with a library that subscribes to ScienceDirect you have additionalprivate sharing rights for others' research accessed under that agreement. This includes usefor classroom teaching and internal training at the institution (including use in course packsand courseware programs), and inclusion of the article for grant funding purposes.Gold Open Access Articles: May be shared according to the author-selected end-userlicense and should contain a CrossMark logo, the end user license, and a DOI link to theformal publication on ScienceDirect.Please refer to Elsevier's posting policy for further information.18. For book authors the following clauses are applicable in addition to the above: Authors are permitted to place a brief summary of their work online only. You are notallowed to download and post the published electronic version of your chapter, nor may youscan the printed edition to create an electronic version. Posting to a repository: Authors arepermitted to post a summary of their chapter only in their institution's repository.19. Thesis/Dissertation: If your license is for use in a thesis/dissertation your thesis may besubmitted to your institution in either print or electronic form. Should your thesis bepublished commercially, please reapply for permission. These requirements includepermission for the Library and Archives of Canada to supply single copies, on demand, ofthe complete thesis and include permission for Proquest/UMI to supply single copies, ondemand, of the complete thesis. Should your thesis be published commercially, pleasereapply for permission. Theses and dissertations which contain embedded PJAs as part ofthe formal submission can be posted publicly by the awarding institution with DOI linksback to the formal publications on ScienceDirect. Elsevier Open Access Terms and ConditionsYou can publish open access with Elsevier in hundreds of open access journals or in nearly2000 established subscription journals that support open access publishing. Permitted thirdparty re-use of these open access articles is defined by the author's choice of CreativeCommons user license. See our open access license policy for more information.Terms & Conditions applicable to all Open Access articles published with Elsevier:Any reuse of the article must not represent the author as endorsing the adaptation of thearticle nor should the article be modified in such a way as to damage the author's honour orreputation. If any changes have been made, such changes must be clearly indicated.The author(s) must be appropriately credited and we ask that you include the end userlicense and a DOI link to the formal publication on ScienceDirect.If any part of the material to be used (for example, figures) has appeared in our publicationwith credit or acknowledgement to another source it is the responsibility of the user toensure their reuse complies with the terms and conditions determined by the rights holder.Additional Terms & Conditions applicable to each Creative Commons user license:CC BY: The CC-BY license allows users to copy, to create extracts, abstracts and newworks from the Article, to alter and revise the Article and to make commercial use of theArticle (including reuse and/or resale of the Article by commercial entities), provided theuser gives appropriate credit (with a link to the formal publication through the relevantDOI), provides a link to the license, indicates if changes were made and the licensor is notrepresented as endorsing the use made of the work. The full details of the license areavailable at http://creativecommons.org/licenses/by/4.0.CC BY NC SA: The CC BY-NC-SA license allows users to copy, to create extracts,

6/20/2016 RightsLink Printable License
https://s100.copyright.com/App/PrintableLicenseFrame.jsp?publisherID=70&publisherName=ELS&publication=1359-8368&publicationID=10949&rightID=1&ty… 6/6
abstracts and new works from the Article, to alter and revise the Article, provided this is notdone for commercial purposes, and that the user gives appropriate credit (with a link to theformal publication through the relevant DOI), provides a link to the license, indicates ifchanges were made and the licensor is not represented as endorsing the use made of thework. Further, any new works must be made available on the same conditions. The fulldetails of the license are available at http://creativecommons.org/licenses/by-nc-sa/4.0.CC BY NC ND: The CC BY-NC-ND license allows users to copy and distribute the Article,provided this is not done for commercial purposes and further does not permit distribution ofthe Article if it is changed or edited in any way, and provided the user gives appropriatecredit (with a link to the formal publication through the relevant DOI), provides a link to thelicense, and that the licensor is not represented as endorsing the use made of the work. Thefull details of the license are available at http://creativecommons.org/licenses/by-nc-nd/4.0.Any commercial reuse of Open Access articles published with a CC BY NC SA or CC BYNC ND license requires permission from Elsevier and will be subject to a fee.Commercial reuse includes:
Associating advertising with the full text of the Article Charging fees for document delivery or access Article aggregation Systematic distribution via e-mail lists or share buttons
Posting or linking by commercial companies for use by customers of those companies. 20. Other Conditions: v1.8Questions? [email protected] or +18552393415 (toll free in the US) or+19786462777.
6/20/2016 RightsLink Printable License
https://s100.copyright.com/App/PrintableLicenseFrame.jsp?publisherID=140&publisherName=Wiley&publication=MAME&publicationID=31697&rightID=1&typ… 1/5
JOHN WILEY AND SONS LICENSETERMS AND CONDITIONS
Jun 20, 2016
This Agreement between Simon Park ("You") and John Wiley and Sons ("John Wiley andSons") consists of your license details and the terms and conditions provided by John Wileyand Sons and Copyright Clearance Center.
License Number 3893251219995
License date Jun 20, 2016
Licensed Content Publisher John Wiley and Sons
Licensed Content Publication Macromolecular Materials & Engineering
Licensed Content Title Investigation of Chaotic Mixing for MWCNT/Polymer Composites
Licensed Content Author Majid TabkhPaz,Mehdi Mahmoodi,Mohammad Arjmand,UttandaramanSundararaj,Jingsong Chu,Simon S. Park
Licensed Content Date Jan 21, 2015
Licensed Content Pages 15
Type of use Dissertation/Thesis
Requestor type Author of this Wiley article
Format Electronic
Portion Full article
Will you be translating? No
Title of your thesis /dissertation
INVESTIGATION OF POLYMERIC COMPOSITES WITH HIGH ASPECTRATIO NANOPARTICULATES FOR METAL COATING
Expected completion date Jun 2016
Expected size (number ofpages)
197
Requestor Location Simon Park2500 University Dr. NW
Calgary, AB T2N1N4CanadaAttn: Dr. Simon Park
Publisher Tax ID EU826007151
Billing Type Invoice
Billing Address Simon Park2500 University Dr. NW
Calgary, AB T2N1N4CanadaAttn: Dr. Simon Park
Total 0.00 CAD
6/20/2016 RightsLink Printable License
https://s100.copyright.com/App/PrintableLicenseFrame.jsp?publisherID=140&publisherName=Wiley&publication=MAME&publicationID=31697&rightID=1&typ… 2/5
Terms and Conditions
TERMS AND CONDITIONSThis copyrighted material is owned by or exclusively licensed to John Wiley & Sons, Inc. orone of its group companies (each a"Wiley Company") or handled on behalf of a society withwhich a Wiley Company has exclusive publishing rights in relation to a particular work(collectively "WILEY"). By clicking "accept" in connection with completing this licensingtransaction, you agree that the following terms and conditions apply to this transaction(along with the billing and payment terms and conditions established by the CopyrightClearance Center Inc., ("CCC's Billing and Payment terms and conditions"), at the time thatyou opened your RightsLink account (these are available at any time athttp://myaccount.copyright.com).
Terms and Conditions
The materials you have requested permission to reproduce or reuse (the "WileyMaterials") are protected by copyright.
You are hereby granted a personal, non-exclusive, non-sub licensable (on a stand-alone basis), non-transferable, worldwide, limited license to reproduce the WileyMaterials for the purpose specified in the licensing process. This license, and anyCONTENT (PDF or image file) purchased as part of your order, is for a one-timeuse only and limited to any maximum distribution number specified in the license.The first instance of republication or reuse granted by this license must be completedwithin two years of the date of the grant of this license (although copies preparedbefore the end date may be distributed thereafter). The Wiley Materials shall not beused in any other manner or for any other purpose, beyond what is granted in thelicense. Permission is granted subject to an appropriate acknowledgement given to theauthor, title of the material/book/journal and the publisher. You shall also duplicatethe copyright notice that appears in the Wiley publication in your use of the WileyMaterial. Permission is also granted on the understanding that nowhere in the text is apreviously published source acknowledged for all or part of this Wiley Material. Anythird party content is expressly excluded from this permission.
With respect to the Wiley Materials, all rights are reserved. Except as expresslygranted by the terms of the license, no part of the Wiley Materials may be copied,modified, adapted (except for minor reformatting required by the new Publication),translated, reproduced, transferred or distributed, in any form or by any means, and noderivative works may be made based on the Wiley Materials without the priorpermission of the respective copyright owner.For STM Signatory Publishersclearing permission under the terms of the STM Permissions Guidelines only, theterms of the license are extended to include subsequent editions and for editionsin other languages, provided such editions are for the work as a whole in situ anddoes not involve the separate exploitation of the permitted figures or extracts,You may not alter, remove or suppress in any manner any copyright, trademark orother notices displayed by the Wiley Materials. You may not license, rent, sell, loan,lease, pledge, offer as security, transfer or assign the Wiley Materials on a stand-alonebasis, or any of the rights granted to you hereunder to any other person.
The Wiley Materials and all of the intellectual property rights therein shall at all timesremain the exclusive property of John Wiley & Sons Inc, the Wiley Companies, or

6/20/2016 RightsLink Printable License
https://s100.copyright.com/App/PrintableLicenseFrame.jsp?publisherID=140&publisherName=Wiley&publication=MAME&publicationID=31697&rightID=1&typ… 3/5
their respective licensors, and your interest therein is only that of having possession ofand the right to reproduce the Wiley Materials pursuant to Section 2 herein during thecontinuance of this Agreement. You agree that you own no right, title or interest in orto the Wiley Materials or any of the intellectual property rights therein. You shall haveno rights hereunder other than the license as provided for above in Section 2. No right,license or interest to any trademark, trade name, service mark or other branding("Marks") of WILEY or its licensors is granted hereunder, and you agree that youshall not assert any such right, license or interest with respect thereto
NEITHER WILEY NOR ITS LICENSORS MAKES ANY WARRANTY ORREPRESENTATION OF ANY KIND TO YOU OR ANY THIRD PARTY,EXPRESS, IMPLIED OR STATUTORY, WITH RESPECT TO THE MATERIALSOR THE ACCURACY OF ANY INFORMATION CONTAINED IN THEMATERIALS, INCLUDING, WITHOUT LIMITATION, ANY IMPLIEDWARRANTY OF MERCHANTABILITY, ACCURACY, SATISFACTORYQUALITY, FITNESS FOR A PARTICULAR PURPOSE, USABILITY,INTEGRATION OR NON-INFRINGEMENT AND ALL SUCH WARRANTIESARE HEREBY EXCLUDED BY WILEY AND ITS LICENSORS AND WAIVEDBY YOU.
WILEY shall have the right to terminate this Agreement immediately upon breach ofthis Agreement by you.
You shall indemnify, defend and hold harmless WILEY, its Licensors and theirrespective directors, officers, agents and employees, from and against any actual orthreatened claims, demands, causes of action or proceedings arising from any breachof this Agreement by you.
IN NO EVENT SHALL WILEY OR ITS LICENSORS BE LIABLE TO YOU ORANY OTHER PARTY OR ANY OTHER PERSON OR ENTITY FOR ANYSPECIAL, CONSEQUENTIAL, INCIDENTAL, INDIRECT, EXEMPLARY ORPUNITIVE DAMAGES, HOWEVER CAUSED, ARISING OUT OF OR INCONNECTION WITH THE DOWNLOADING, PROVISIONING, VIEWING ORUSE OF THE MATERIALS REGARDLESS OF THE FORM OF ACTION,WHETHER FOR BREACH OF CONTRACT, BREACH OF WARRANTY, TORT,NEGLIGENCE, INFRINGEMENT OR OTHERWISE (INCLUDING, WITHOUTLIMITATION, DAMAGES BASED ON LOSS OF PROFITS, DATA, FILES, USE,BUSINESS OPPORTUNITY OR CLAIMS OF THIRD PARTIES), ANDWHETHER OR NOT THE PARTY HAS BEEN ADVISED OF THE POSSIBILITYOF SUCH DAMAGES. THIS LIMITATION SHALL APPLYNOTWITHSTANDING ANY FAILURE OF ESSENTIAL PURPOSE OF ANYLIMITED REMEDY PROVIDED HEREIN.
Should any provision of this Agreement be held by a court of competent jurisdictionto be illegal, invalid, or unenforceable, that provision shall be deemed amended toachieve as nearly as possible the same economic effect as the original provision, andthe legality, validity and enforceability of the remaining provisions of this Agreementshall not be affected or impaired thereby.
The failure of either party to enforce any term or condition of this Agreement shall not

6/20/2016 RightsLink Printable License
https://s100.copyright.com/App/PrintableLicenseFrame.jsp?publisherID=140&publisherName=Wiley&publication=MAME&publicationID=31697&rightID=1&typ… 4/5
constitute a waiver of either party's right to enforce each and every term and conditionof this Agreement. No breach under this agreement shall be deemed waived orexcused by either party unless such waiver or consent is in writing signed by the partygranting such waiver or consent. The waiver by or consent of a party to a breach ofany provision of this Agreement shall not operate or be construed as a waiver of orconsent to any other or subsequent breach by such other party.
This Agreement may not be assigned (including by operation of law or otherwise) byyou without WILEY's prior written consent.
Any fee required for this permission shall be non-refundable after thirty (30) daysfrom receipt by the CCC.
These terms and conditions together with CCC's Billing and Payment terms andconditions (which are incorporated herein) form the entire agreement between you andWILEY concerning this licensing transaction and (in the absence of fraud) supersedesall prior agreements and representations of the parties, oral or written. This Agreementmay not be amended except in writing signed by both parties. This Agreement shall bebinding upon and inure to the benefit of the parties' successors, legal representatives,and authorized assigns.
In the event of any conflict between your obligations established by these terms andconditions and those established by CCC's Billing and Payment terms and conditions,these terms and conditions shall prevail.
WILEY expressly reserves all rights not specifically granted in the combination of (i)the license details provided by you and accepted in the course of this licensingtransaction, (ii) these terms and conditions and (iii) CCC's Billing and Payment termsand conditions.
This Agreement will be void if the Type of Use, Format, Circulation, or RequestorType was misrepresented during the licensing process.
This Agreement shall be governed by and construed in accordance with the laws ofthe State of New York, USA, without regards to such state's conflict of law rules. Anylegal action, suit or proceeding arising out of or relating to these Terms andConditions or the breach thereof shall be instituted in a court of competent jurisdictionin New York County in the State of New York in the United States of America andeach party hereby consents and submits to the personal jurisdiction of such court,waives any objection to venue in such court and consents to service of process byregistered or certified mail, return receipt requested, at the last known address of suchparty.
WILEY OPEN ACCESS TERMS AND CONDITIONSWiley Publishes Open Access Articles in fully Open Access Journals and in Subscriptionjournals offering Online Open. Although most of the fully Open Access journals publishopen access articles under the terms of the Creative Commons Attribution (CC BY) Licenseonly, the subscription journals and a few of the Open Access Journals offer a choice ofCreative Commons Licenses. The license type is clearly identified on the article.The Creative Commons Attribution License
6/20/2016 RightsLink Printable License
https://s100.copyright.com/App/PrintableLicenseFrame.jsp?publisherID=140&publisherName=Wiley&publication=MAME&publicationID=31697&rightID=1&typ… 5/5
The Creative Commons Attribution License (CC-BY) allows users to copy, distribute andtransmit an article, adapt the article and make commercial use of the article. The CC-BYlicense permits commercial and non-Creative Commons Attribution Non-Commercial LicenseThe Creative Commons Attribution Non-Commercial (CC-BY-NC)License permits use,distribution and reproduction in any medium, provided the original work is properly citedand is not used for commercial purposes.(see below)
Creative Commons Attribution-Non-Commercial-NoDerivs LicenseThe Creative Commons Attribution Non-Commercial-NoDerivs License (CC-BY-NC-ND)permits use, distribution and reproduction in any medium, provided the original work isproperly cited, is not used for commercial purposes and no modifications or adaptations aremade. (see below)Use by commercial "for-profit" organizationsUse of Wiley Open Access articles for commercial, promotional, or marketing purposesrequires further explicit permission from Wiley and will be subject to a fee.Further details can be found on Wiley Online Libraryhttp://olabout.wiley.com/WileyCDA/Section/id-410895.html
Other Terms and Conditions:
v1.10 Last updated September 2015Questions? [email protected] or +18552393415 (toll free in the US) or+19786462777.

This page is intentionally left blank.

![Composites: Part Bfiber–polymer composites [29,30,35,26] and polymeric foams [8], usually fail in a brittle manner and exhibit strong deterministic size effect. Obviously, the same](https://img.pdfslide.net/doc/110x75/6050d3726fcfd95b5c30ef50/composites-part-b-iberapolymer-composites-29303526-and-polymeric-foams.jpg)