Embed Size (px)
Citation preview
Malaysian Journal of Computing, 4 (1): 178–192, 2019
Copyright © UiTM Press
eISSN: 2600-8238 online
178
This open access article is distributed under a Creative Commons Attribution (CC-BY SA) 3.0 license
INVESTIGATION OF SPEECH DISFLUENCIES
CLASSIFICATION ON DIFFERENT THRESHOLD
SELECTION TECHNIQUES USING ENERGY FEATURE
EXTRACTION
R. Hamzah1 and N.Jamil2
1,2Faculty of Computer and Mathematical Sciences, UiTM Shah Alam, Selangor, Malaysia [email protected], [email protected]
ABSTRACT
Filled pause and Elongation are the two types of speech disfluencies that need more suitable
acoustical features to be classified correctly since they are always being misclassified. This
work concentrates on developing an accurate and robust energy feature extraction for
modelling filled pause and elongation by investigating different energy features using local
maxima points of the speech energy. Method: In this paper, we extracted peak values from each
frame of a voiced signal by implementing different thresholding techniques to classify filled
pause and elongation. These energy features are evaluated by using statistical naïve Bayes
classifier to see the contribution on the classification processes. Various samples of sustained
syllables and filled pauses of spontaneous speech were extracted from Malaysian
Parliamentary Debate Database of the year 2008. A naïve Bayes was used as a classifier. We
performed F-measure evaluation to investigate the significant differences in mean of filled
pause and elongation samples. Results: Results revealed that our proposed LM-E has increase
the classification with up to 71% and 75% F-measure for elongation and filled pause.
Conclusion: The best achieved accuracies in both filled pause and elongation classification
were varied depending on the types of thresholding techniques applied during the local maxima
of speech energy extraction. The most contributed thresholding technique is our proposed
technique which is by using the adaptive height as the threshold that extracts the local maxima
of the speech energy (LM-E).
Keywords: Filled pause and elongation, naïve Bayes, energy feature extraction, automatic
speech recognition.
1. Introduction
Over the past decades, Automatic Speech Recognition (ASR) system offers invaluable
contributions to various fields. The benefits of ASR can be clearly seen in read and planned
speech as speech is the main tool in daily communication and has been used in many application
(Zapata and Kirkedal, 2015). However, developing an ASR system becomes more challenging
for natural speech due to the occurrences of disfluencies such as filled pause. Studies have
reported filled pauses has degraded the ASR’s performance because it interrupts the fluency of
speech, increases ASR complexity, and causes confusion to machine-based recognition devices
(Singh et al., 2012). This problem becomes pertinent when a vowel sound of a normal word
being spoken relatively long at any position in an utterance, both within a word as well as
between words. This occurrence formerly known as elongation causes a normal word to be
falsely detected as filled pause because both elongation and filled pause shared similar
acoustical feature patterns (Kaushik et al. 2010). Several established related researches have
been conducted in detecting the filled pause, where both filled pause and elongation were
classified into the same disfluency class (Audhkasi et al., 2009). However, classifying filled
pause and elongation into the same disfluency class can affect ASR’s performance as
Hamzah and Jamil, Malaysian Journal of Computing, 4 (1): 178–192, 2019
179
eliminating normal words from recognition may modify the intended context of a speech and
leads to inaccurate transcription. According to (Kaushik et al., 2010), filled pause and
elongation causes transcription problem in ASR. Many ways were conducted to separate filled
pause and elongation. The most common way is by extracting the acoustical features of the
filled pause to be used in the classification. Various acoustical features were used to model
filled pause such as energy, fundamental frequency, Mel-frequency cepstral coefficients and
formant frequency. Among the well-established acoustical features, fundamental frequency is
mostly used as can be found in (Gabrea et al., 2000, Goto et al., 1999, Audhkhasi et al., 2009
and Kaushik et al., 2010). Fundamental frequency is associated with energy as confirmed by
(Rosenberg & Hirschberg, 2006) in his work where energy is used to classify pitch into
accented or non-accented word. However, when the conventional energy extraction is used, the
accurate modelling of filled pause and elongation cannot be achieved as seen in (Li et al., 2010).
Therefore, this paper addresses the exploitation of speech energy as a feature to accurately
model the filled pause and elongation. Energy was widely used in filled pause research (Garg
& Wards, 2006, Li et al.,2008 and Stouten et al., 2006). The use of energy can be found in
different language of filled pause studies such as Mandarin, European Portuguese and English.
Since filled pause and elongation is language specific (Yusof et al., 2008), the performance of
energy was reported differently. It was proven in (Stouten et al., 2006) that energy is unable to
differentiate filled pause and elongation of European Portuguese language due to the equal
pattern of energy stability. In contrast with (Li et al., 2008), the energy along with MFCC and
F0 have shown promising classification performance for Mandarin filled pause. It is observable
from those researches that the combination of suitable feature with energy can increase the
classification process compared to energy alone.
Energy of the speech may be measured using several techniques such as log energy, sum of
square energy and sum of absolute energy. Generally, all the above-mentioned techniques of
calculating the sums of energy are measured on each short frame. These techniques are suitable
and beneficial for speech involving normal words. However, sum of energy cannot sufficiently
represent filled pause, especially when filled pause needs to be differentiated with elongation.
According to (Stouten et al., 2006), the current means of representing energy is not able to
separate filled pause and elongation in Portuguese language well due to their similar energy
characteristics. The use of energy parameter is customary but not limited in endpoint detection
only. It is also beneficial in consonant and vowel detection in (Izzad et al., 2013). However,
sum of energy calculated from short time speech frame is unable to detect the energy variation
from the consonant and vowel in the elongation. These researchers concluded that there are
difficulties in differentiating filled pause and elongation into two separate classes. Therefore,
further work is needed to investigate and select the suitable energy feature extraction technique
for the abovementioned purpose. Rigorous energy feature selection research for representing
filled pause and elongation remains hard to find. Therefore, this research aims to identify the
most suitable energy characteristic of filled pause and elongation, and construct a classification
model that is able to discriminate filled pause and elongation into their own separate classes.
.
2. Methodology
The methods of this research are divided into several stages. The first stage is dataset
development of filled pause and elongation. Filled pause dataset (i.e. FP_DATA) and
elongation dataset (i.e. ELO_DATA) are then subjected to pre-processing stage which is a
combination of established procedures in speech analysis. The output of the speech pre-
processing is passed to the energy feature extraction stage process to get the energy feature
representation of the speech. The selected energy feature vectors are then fed into the
classification stage to classify the speech disfluencies into filled pause or elongation. The last
stage is to evaluate the classifier performance based on several measurements. In overall, this
research uses Matlab, Wavesurfer and R statistical software for speech processing and analysis.
Detail of each stage is further elaborated in the subsequent sections.
Hamzah and Jamil, Malaysian Journal of Computing, 4 (1): 178–192, 2019
180
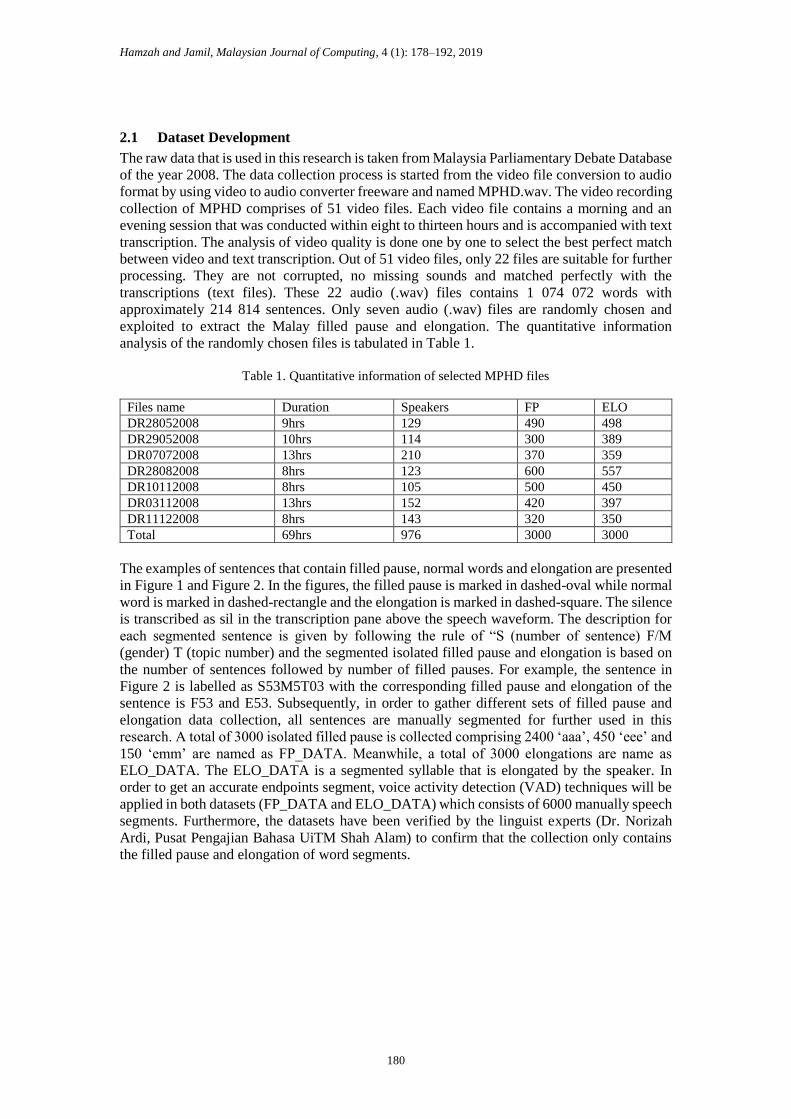
2.1 Dataset Development
The raw data that is used in this research is taken from Malaysia Parliamentary Debate Database
of the year 2008. The data collection process is started from the video file conversion to audio
format by using video to audio converter freeware and named MPHD.wav. The video recording
collection of MPHD comprises of 51 video files. Each video file contains a morning and an
evening session that was conducted within eight to thirteen hours and is accompanied with text
transcription. The analysis of video quality is done one by one to select the best perfect match
between video and text transcription. Out of 51 video files, only 22 files are suitable for further
processing. They are not corrupted, no missing sounds and matched perfectly with the
transcriptions (text files). These 22 audio (.wav) files contains 1 074 072 words with
approximately 214 814 sentences. Only seven audio (.wav) files are randomly chosen and
exploited to extract the Malay filled pause and elongation. The quantitative information
analysis of the randomly chosen files is tabulated in Table 1.
Table 1. Quantitative information of selected MPHD files
Files name Duration Speakers FP ELO
DR28052008 9hrs 129 490 498
DR29052008 10hrs 114 300 389
DR07072008 13hrs 210 370 359
DR28082008 8hrs 123 600 557
DR10112008 8hrs 105 500 450
DR03112008 13hrs 152 420 397
DR11122008 8hrs 143 320 350
Total 69hrs 976 3000 3000
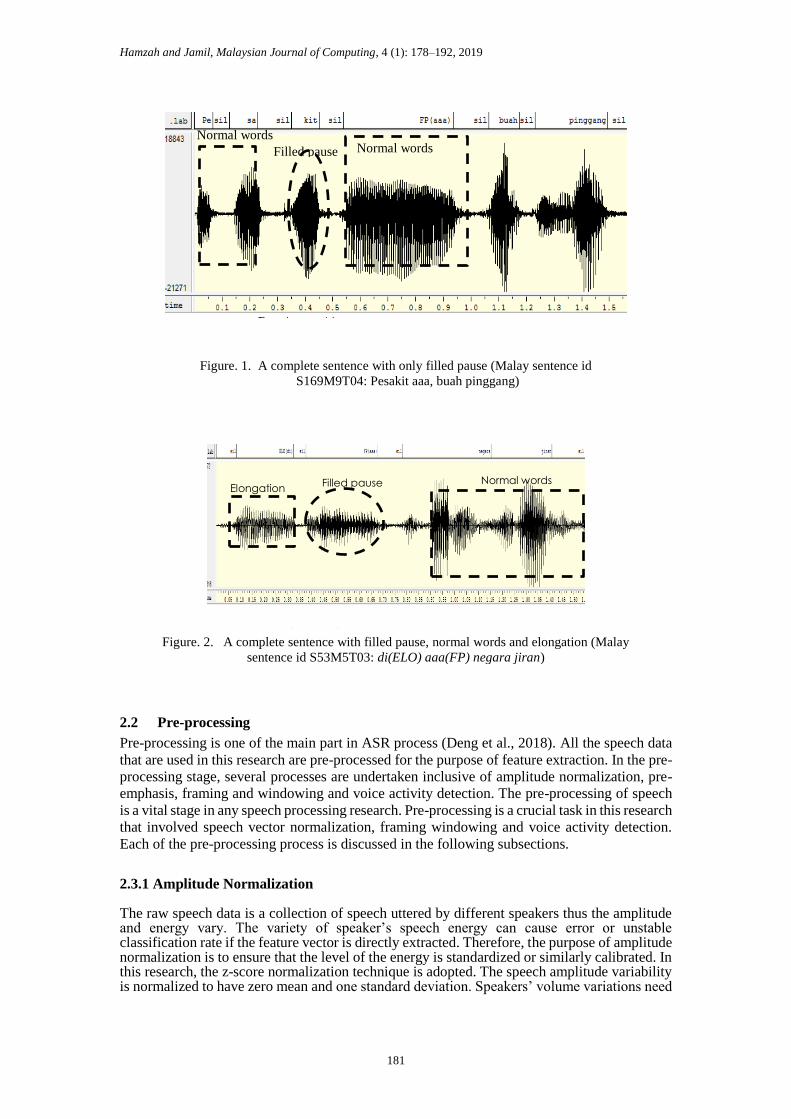
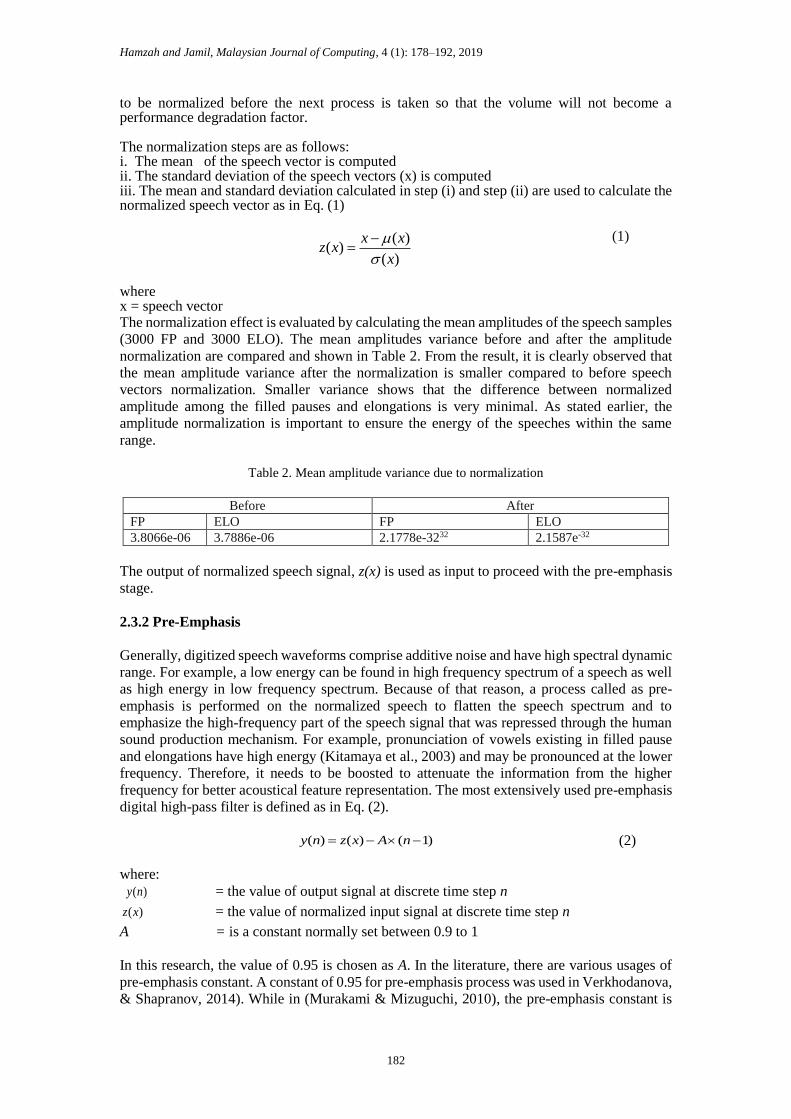
The examples of sentences that contain filled pause, normal words and elongation are presented
in Figure 1 and Figure 2. In the figures, the filled pause is marked in dashed-oval while normal
word is marked in dashed-rectangle and the elongation is marked in dashed-square. The silence
is transcribed as sil in the transcription pane above the speech waveform. The description for
each segmented sentence is given by following the rule of “S (number of sentence) F/M
(gender) T (topic number) and the segmented isolated filled pause and elongation is based on
the number of sentences followed by number of filled pauses. For example, the sentence in
Figure 2 is labelled as S53M5T03 with the corresponding filled pause and elongation of the
sentence is F53 and E53. Subsequently, in order to gather different sets of filled pause and
elongation data collection, all sentences are manually segmented for further used in this
research. A total of 3000 isolated filled pause is collected comprising 2400 ‘aaa’, 450 ‘eee’ and
150 ‘emm’ are named as FP_DATA. Meanwhile, a total of 3000 elongations are name as
ELO_DATA. The ELO_DATA is a segmented syllable that is elongated by the speaker. In
order to get an accurate endpoints segment, voice activity detection (VAD) techniques will be
applied in both datasets (FP_DATA and ELO_DATA) which consists of 6000 manually speech
segments. Furthermore, the datasets have been verified by the linguist experts (Dr. Norizah
Ardi, Pusat Pengajian Bahasa UiTM Shah Alam) to confirm that the collection only contains
the filled pause and elongation of word segments.
Hamzah and Jamil, Malaysian Journal of Computing, 4 (1): 178–192, 2019
181
Figure. 1. A complete sentence with only filled pause (Malay sentence id
S169M9T04: Pesakit aaa, buah pinggang)
Figure. 2. A complete sentence with filled pause, normal words and elongation (Malay
sentence id S53M5T03: di(ELO) aaa(FP) negara jiran)
2.2 Pre-processing
Pre-processing is one of the main part in ASR process (Deng et al., 2018). All the speech data
that are used in this research are pre-processed for the purpose of feature extraction. In the pre-
processing stage, several processes are undertaken inclusive of amplitude normalization, pre-
emphasis, framing and windowing and voice activity detection. The pre-processing of speech
is a vital stage in any speech processing research. Pre-processing is a crucial task in this research
that involved speech vector normalization, framing windowing and voice activity detection.
Each of the pre-processing process is discussed in the following subsections.
2.3.1 Amplitude Normalization The raw speech data is a collection of speech uttered by different speakers thus the amplitude and energy vary. The variety of speaker’s speech energy can cause error or unstable classification rate if the feature vector is directly extracted. Therefore, the purpose of amplitude normalization is to ensure that the level of the energy is standardized or similarly calibrated. In this research, the z-score normalization technique is adopted. The speech amplitude variability is normalized to have zero mean and one standard deviation. Speakers’ volume variations need
Normal words
Filled pause
Time (seconds)
Am
plit
ud
e
Normal words
Elongation Filled pause Normal words
Time (seconds)
Am
plit
ud
e
Hamzah and Jamil, Malaysian Journal of Computing, 4 (1): 178–192, 2019
182
to be normalized before the next process is taken so that the volume will not become a performance degradation factor. The normalization steps are as follows: i. The mean of the speech vector is computed ii. The standard deviation of the speech vectors (x) is computed iii. The mean and standard deviation calculated in step (i) and step (ii) are used to calculate the normalized speech vector as in Eq. (1)
)(
)()(
x
xxxz
(1)
where x = speech vector The normalization effect is evaluated by calculating the mean amplitudes of the speech samples
(3000 FP and 3000 ELO). The mean amplitudes variance before and after the amplitude
normalization are compared and shown in Table 2. From the result, it is clearly observed that
the mean amplitude variance after the normalization is smaller compared to before speech
vectors normalization. Smaller variance shows that the difference between normalized
amplitude among the filled pauses and elongations is very minimal. As stated earlier, the
amplitude normalization is important to ensure the energy of the speeches within the same
range.
Table 2. Mean amplitude variance due to normalization
Before After
FP ELO FP ELO
3.8066e-06 3.7886e-06 2.1778e-3232 2.1587e-32
The output of normalized speech signal, z(x) is used as input to proceed with the pre-emphasis
stage.
2.3.2 Pre-Emphasis
Generally, digitized speech waveforms comprise additive noise and have high spectral dynamic
range. For example, a low energy can be found in high frequency spectrum of a speech as well
as high energy in low frequency spectrum. Because of that reason, a process called as pre-
emphasis is performed on the normalized speech to flatten the speech spectrum and to
emphasize the high-frequency part of the speech signal that was repressed through the human
sound production mechanism. For example, pronunciation of vowels existing in filled pause
and elongations have high energy (Kitamaya et al., 2003) and may be pronounced at the lower
frequency. Therefore, it needs to be boosted to attenuate the information from the higher
frequency for better acoustical feature representation. The most extensively used pre-emphasis
digital high-pass filter is defined as in Eq. (2).
)1()()( nAxzny (2)
where:
)(ny
= the value of output signal at discrete time step n
)(xz
= the value of normalized input signal at discrete time step n
A = is a constant normally set between 0.9 to 1
In this research, the value of 0.95 is chosen as A. In the literature, there are various usages of
pre-emphasis constant. A constant of 0.95 for pre-emphasis process was used in Verkhodanova,
& Shapranov, 2014). While in (Murakami & Mizuguchi, 2010), the pre-emphasis constant is
Hamzah and Jamil, Malaysian Journal of Computing, 4 (1): 178–192, 2019
183
set to 0.97. However, according to (Abbas et al., 2013), the typical value of pre-emphasis
constant is 0.95. A low frequency signal is the one with slow time variation. The slow variation
effect on low frequency signal concurrently produces adjacent samples of similar numerical
value. From equation (2)(2), the subtraction process removed the part of the samples that did
not change in relation to its adjacent samples to retain the high-frequency components. The
output signal of the pre-emphasis process )(nxprem is then past to the framing stage.
2.3.3 Framing
Speech signal is non-stationary and non-periodic in a longer duration. Its statistical properties
are non-constant over time. However, practically, at a frame of 20ms~30ms, speech is
considered stationary and quasi-periodic (Ganaphaty, 2012). Thus, the non-stationary
properties of a speech signal need to be transformed as stationary using framing. Framing a
speech signal is a process of blocking the speech signal into frames of N samples, with adjacent
frames being separated by M samples i.e., the frame is shifted with M samples from the adjacent
frame. The spectral features estimated from frame to frame will be smooth if the shifting is
small. The shifting process is important to ensure overlapping of the speech frame. The absence
of overlapping between adjacent frames will cause the speech signal to be entirely mislaid and
will contain noisy components only.
The general equation for frame blocking is written in Eq. (3) by assuming that the speech frame
length ( thl ) is represented as S and the entire speech signal is denoted as L.
( ) ( )l lX N S M N (3)
where.
lX = frame of speech
N = 0,1,…,N-1 sample
l = 0,1,…L-1 frames
In this research, the frame size is set to 20ms (320 points) frames, which were overlapped at
10ms (160 points). A typical frame shift of 10ms of a short frame of 20ms is always chosen in
speech processing research (Rosenberg & Hirschberg, 2006). The overlapping is important to
ensure the smooth transition of estimated parameters between frames.
2.3.4 Windowing
Windowing is done to reduce the discontinuities of the speech signal at the edges of each frame
by applying a tapered window to each frame. At each framed speech signal, a window is applied
at the beginning and ending by using window function. For a window w(n), the windowed
signal will be defined as in Eq. (4)(4).
),().()( nwnxny 10 Nn (4)
where,
w(n) = Hamming window
x(n) = speech signal
)(ny = windowing result of the signal
Hamming window is the mostly used windowing function applied on each speech’s frame of
the speech and is described in Eq. (5)(5). It also provides better frequency resolution as it
minimizes signal discontinuity.
Hamzah and Jamil, Malaysian Journal of Computing, 4 (1): 178–192, 2019
184
𝑤(𝑛) = {0.54 − 0.46cos(2𝜋(𝑛 − 1)
𝑁 − 1)
0
, 0 ≤ 𝑛 ≤ 𝑁
(5)
2.4 Energy feature extraction
In general, the process of getting the representation of each speech sample’s energy is by using
the standard method (Jalil et al., 2013) that is by calculating the sum of the energy of each short
speech frame as in equation (6).
2]
1
)()([
n
Nnm
mnwnxnE (6)
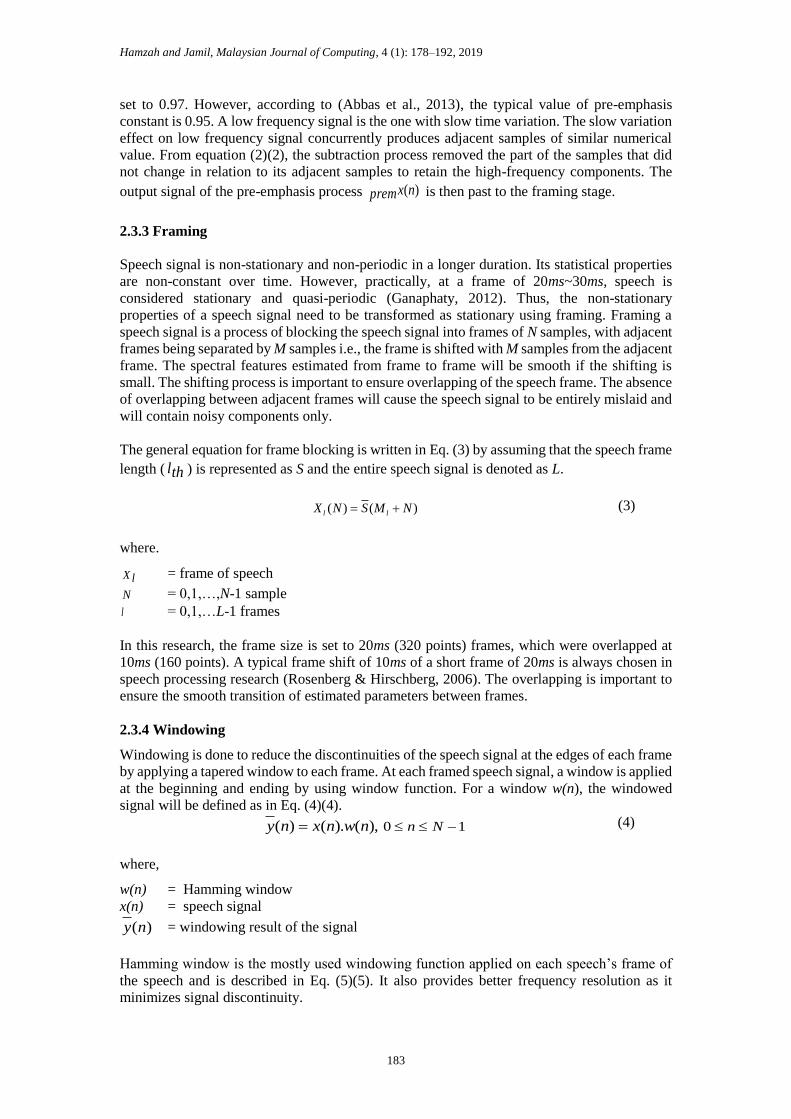
The next step is to calculate the standard deviation of the whole speech segment to measure
energy’s stability. Energy standard deviation of the filled pause is expected to be small (Stouten
et al., 2006) as they are presumed to be more stable. Energy example of filled pause and
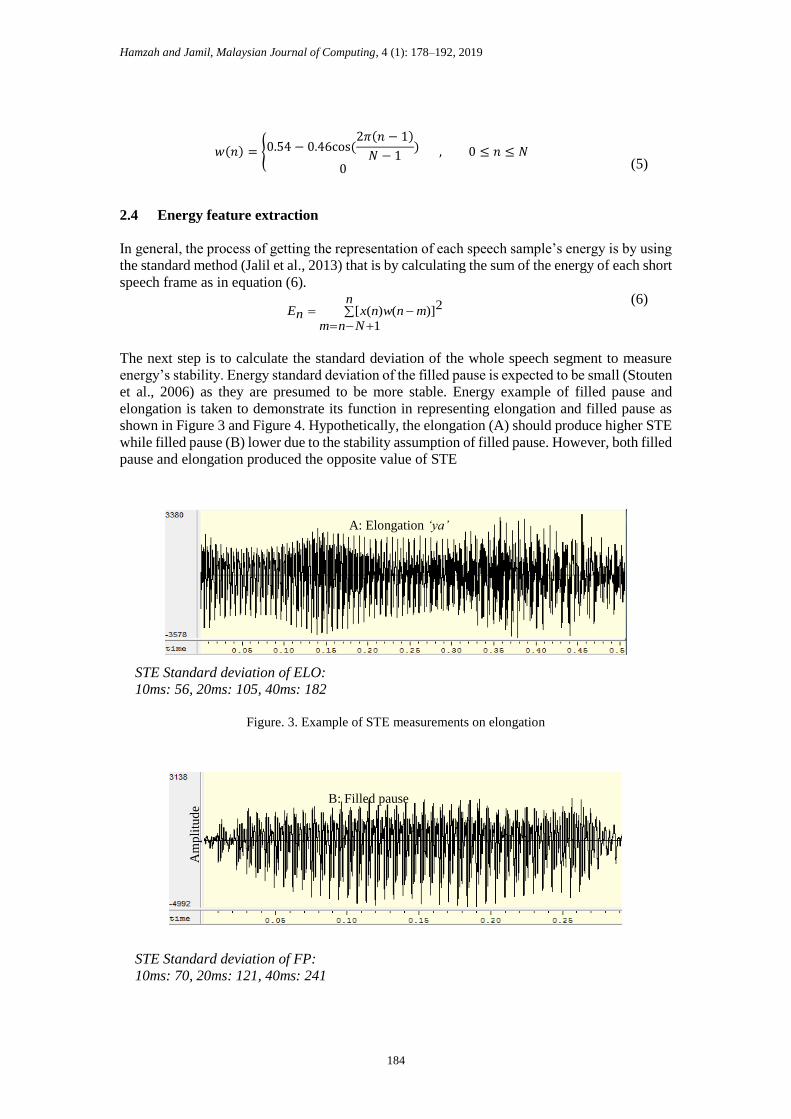
elongation is taken to demonstrate its function in representing elongation and filled pause as
shown in Figure 3 and Figure 4. Hypothetically, the elongation (A) should produce higher STE
while filled pause (B) lower due to the stability assumption of filled pause. However, both filled
pause and elongation produced the opposite value of STE
STE Standard deviation of ELO:
10ms: 56, 20ms: 105, 40ms: 182
Figure. 3. Example of STE measurements on elongation
STE Standard deviation of FP:
10ms: 70, 20ms: 121, 40ms: 241
Time (seconds)
Am
pli
tud
e
Time (seconds)
A: Elongation ‘ya’
B: Filled pause
Am
plit
ud
e

Hamzah and Jamil, Malaysian Journal of Computing, 4 (1): 178–192, 2019
185
Figure. 4. Example of STE measurements on filled pause
Figure. 5. STE value distribution for filled pause and elongation
In filled pause research, energy is an important feature. Several acoustical features that were
previously tested in filled pause classification such as fundamental frequency and spectral
envelope are correlated with energy (Rosenberg & Hirschberg, 2006). Generally, the energy of
filled pause is stable and constant, as proven in (Garg & Ward, 2006). However, due to the
transition between consonant and vowel in the elongation, the standard method of energy
measurement is not able to represent this transition named as expressive intonation. Therefore,
another way of exploiting the energy of the speech is by using the local information of the
speech energy need to be investigated. This is further explored and discussed in the next
subsection.
For each duration that are tested (i.e. 10ms, 20ms and 40ms), the standard deviation of the
energy produced by elongation are denoted as 56, 105 and 182 which are lower compared to
filled pause energy’s standard deviations (i.e. 70, 121, 241). The distribution of energy value
of both filled pause and elongation is shown in Figure 5. From Figure 5, it is obviously seen
that the energy representation (energy standard deviation) of filled pause and elongation is
overlapping. It shows that the filled pause and elongation cannot be differentiated by using
energy as the feature.
2.5 Proposed Speech Energy Extraction using Local Maxima
Previously, several techniques of local maxima extraction have been proposed. Basically, the
techniques of local maxima extraction depend on the threshold parameter selection. One of the
techniques of local maxima extraction is by utilizing the distance between peaks as threshold
(Schwartzman et al., 2011). The technique is implemented by assigning a minimum peak as a
threshold. A point is marked as local maxima if it is the highest peak number among the
descending peak data. The other technique is by using minimum height (Bertot etal., 2014) as
threshold. In this technique, the peak is detected by first order difference information. A peak
occurs when the trend changes from upward to downward, i.e., a peak is where the difference
changed from a streak of positives and zeros to negative. Both techniques were applied in this
research. According to (Schwartzman et al., 2011), these techniques are only applicable when
the noise is stationary and isotropic. However, it is well-known that speech is non-stationary
and the values of amplitudes represented by the volumes or energy is extremely varied and thus
not isotropic. Therefore, the aim of the proposed energy extraction manipulating the local
maxima is to optimize the local maxima selection in each speech segment.
Hamzah and Jamil, Malaysian Journal of Computing, 4 (1): 178–192, 2019
186
Speech energy is closely related to the amplitude of the speech (Izzad et al., 2013). Instead of
calculating the total energy of each frame, in this research the energy stability of the speech is
measured based on the amplitude transition from one frame to another. To measure the
amplitude transition, this research proposed the manipulation of the local maxima points of the
speech. We introduced adaptive local maxima threshold selection technique by directly
comparing one peak points to another using adaptive threshold selection based on the height
difference. The proposed energy extraction technique is Local Maxima of the Speech Energy
(LM-E). The details steps of the proposed LM-E are as below:
Step1: Find the minimum peak mp of all the peaks in the speech
Step2: Set the mp as the first threshold.
Step 3: Iterate the process to the next consecutive point in the speech np
Step 4: Compare mp and np
Step 5: If 0 nPmP and 0nP , then np is assigned as the first local maxima 1ELM .
If 0 nPmP then repeat step 3.
Step 6: Save the nELM into a matrix for further process.
In this proposed method, different adjustable positive scalar number is tested as threshold to
observe the most suitable parameter.
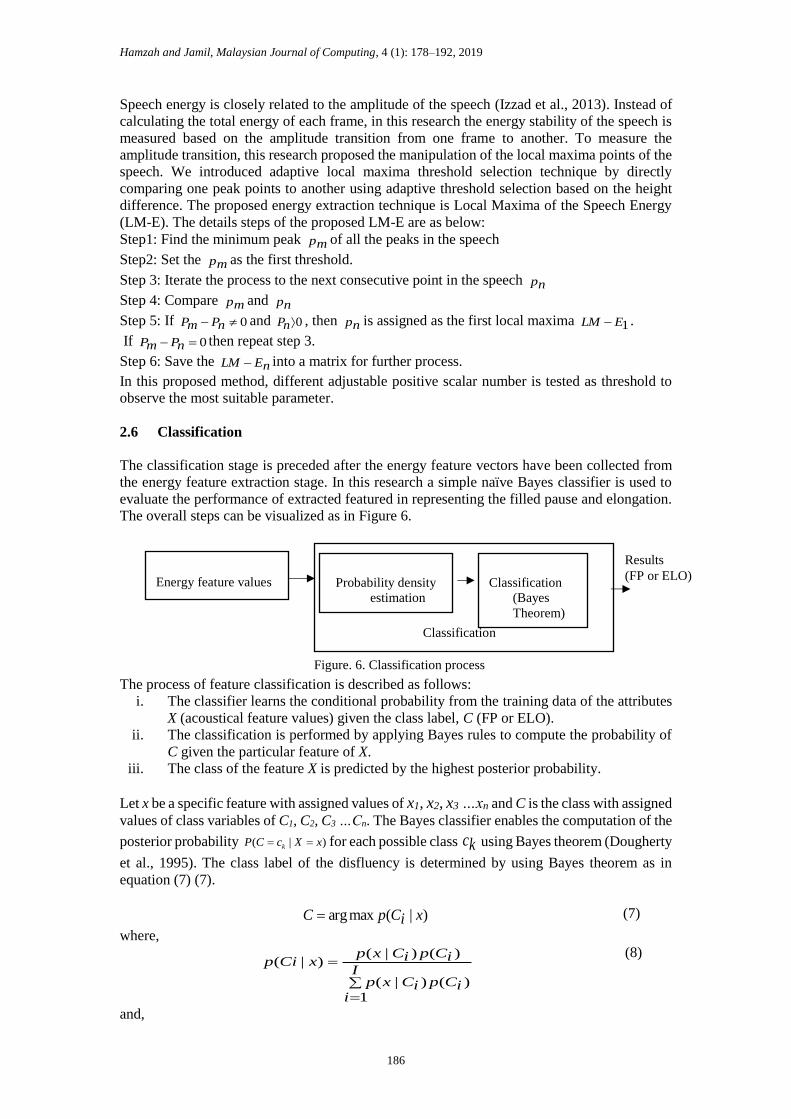
2.6 Classification
The classification stage is preceded after the energy feature vectors have been collected from
the energy feature extraction stage. In this research a simple naïve Bayes classifier is used to
evaluate the performance of extracted featured in representing the filled pause and elongation.
The overall steps can be visualized as in Figure 6.
Classification
Figure. 6. Classification process
The process of feature classification is described as follows:
i. The classifier learns the conditional probability from the training data of the attributes
X (acoustical feature values) given the class label, C (FP or ELO).
ii. The classification is performed by applying Bayes rules to compute the probability of
C given the particular feature of X.
iii. The class of the feature X is predicted by the highest posterior probability.
Let x be a specific feature with assigned values of x1, x2, x3 …xn and C is the class with assigned
values of class variables of C1, C2, C3 …Cn. The Bayes classifier enables the computation of the
posterior probability ( | )kP C c X x for each possible class kc using Bayes theorem (Dougherty
et al., 1995). The class label of the disfluency is determined by using Bayes theorem as in
equation (7) (7).
)|(maxarg xiCpC (7)
where,
I
iiCpiCxp
iCpiCxpxCip
1
)()|(
)()|()|(
(8)
and,
Energy feature values Probability density
estimation
Classification
(Bayes Theorem)
Results
(FP or ELO)
Hamzah and Jamil, Malaysian Journal of Computing, 4 (1): 178–192, 2019
187
( , ) ( | ) ( )i i ip x C p x C p C (9)
where,
c = class of the disfluencies
(c = FP for filled pause , c = ELO for elongation)
x = acoustical feature
p(c) = prior probability
p(x|c) = conditional probability
p(c|x) = posterior probability
The prior probability of 0.5 for each class is set equally since the number of filled pause and
elongation is distributed equivalently. To validate the classifier, a 10-folds cross validation is
used. Cross validation (CV) is the most common and recently used (Elkan, 2012; Qin et. al,
2012). There are several techniques applied in CV such as leave one-out and fold-CV. In
(Stouten et al., 2006), a total of 186 iterations is applied into leave one-out cross-validation in
which each time of the experiment, 1 sequence of data is taken out as a test data while the rest
is used for training. This process is repeated up to 186 times. However, this method is quite
time consuming for a larger dataset. A large dataset that consists of 1076 samples has been
applied with 10-fold CV in order to test the classifier’s performance (Elkan, 2012). The study
found that their classifier’s performance is comparable with the previous work done by
(Bouckaert, 2004). In (Murakami & Mizuguchi, 2010), two stage of classifiers validation is
done. The first stage is conducted by using standard training and testing data partition with
different data division ratios while the second stage uses cross-validation.
This research chooses cross validation method to test the accuracy of the model. In 10-CV
technique, nine folds are used to train classifier, and the one-fold that is held out is then used to
test the classifier. The process of dividing the data into 10-fold CV is as follows:
Input: Training set S , integer constant 𝑘
Procedure:
Partition 𝑆 into 𝑘 equal-sized subset 𝑆1…𝑆𝑛
For 1i to ki
Let iSST /
Run learning algorithm (Bayes classifier) with T as training set
Test the resulting classifier or iS .
In the 10-fold CV the total data of filled pause and elongation are divided into 10 equivalent
folds. This process is executed 10 times with different fold used as testing during each iteration.
Then, the evaluation of the classification is done based on several measurement techniques such
as accuracy, F-Measure, precision and recall.
3. Results and Discussion
To verify the validity of the extracted energy features from the MPHD database in the
classification processes of filled pauses and elongations, various experiments were performed.
To ensure accuracy, various experiments were performed individually for each energy feature
by using 10-folds cross-validation. The feature classification performances are measured using
precision, recall, F-measure and accuracy. The precision and recall rate are needed to get the F-
measure. The recall rate shows that the number of relevant filled pause or elongation that is
successfully classified among the relevant filled pause or elongation. Precision shows the
number of relevant filled pause or elongation that is successfully classified among all of the
filled pause or elongation. On the other hand, F-measure is the harmonic mean between
precision and recall rate. The accuracy shows the overall performance which denotes the
number of filled pause or elongation that is successfully classified among the entire filled pause
Hamzah and Jamil, Malaysian Journal of Computing, 4 (1): 178–192, 2019
188
and elongation. All of the stated measurements between both STE and proposed LM-E are
shown in Table 3.
Table 3. Evaluation results of STE and LM-E for FP and ELO
Acoustical
Features
F-
Measure
%
Precision
(PR)%
Recall
(RE) %
Accuracy
(ACC)%
FP ELO FP ELO ELO FP
LM-E 71 75 68 80 78 78 74
STE 63 70 65 68 65 63 67
From the results, it can be seen that the LM-E outperform the well-established STE. In overall,
the accuracy of the energy feature increased from 67% to 74% which are about 7% increment
when the technique of adaptive thresholding is introduced. Among them, LM-E scored higher
recall and precision rate at > 68% for both filed pause and elongation compared to STE. The
highest F-measure for filled pause is achieved by LM-E at 71% followed by STE at 63%. LM-
E scored higher F-measure at 75% for elongations followed by STE at 70%. It shows that the
proposed LM-E represents elongation better compared to STE.
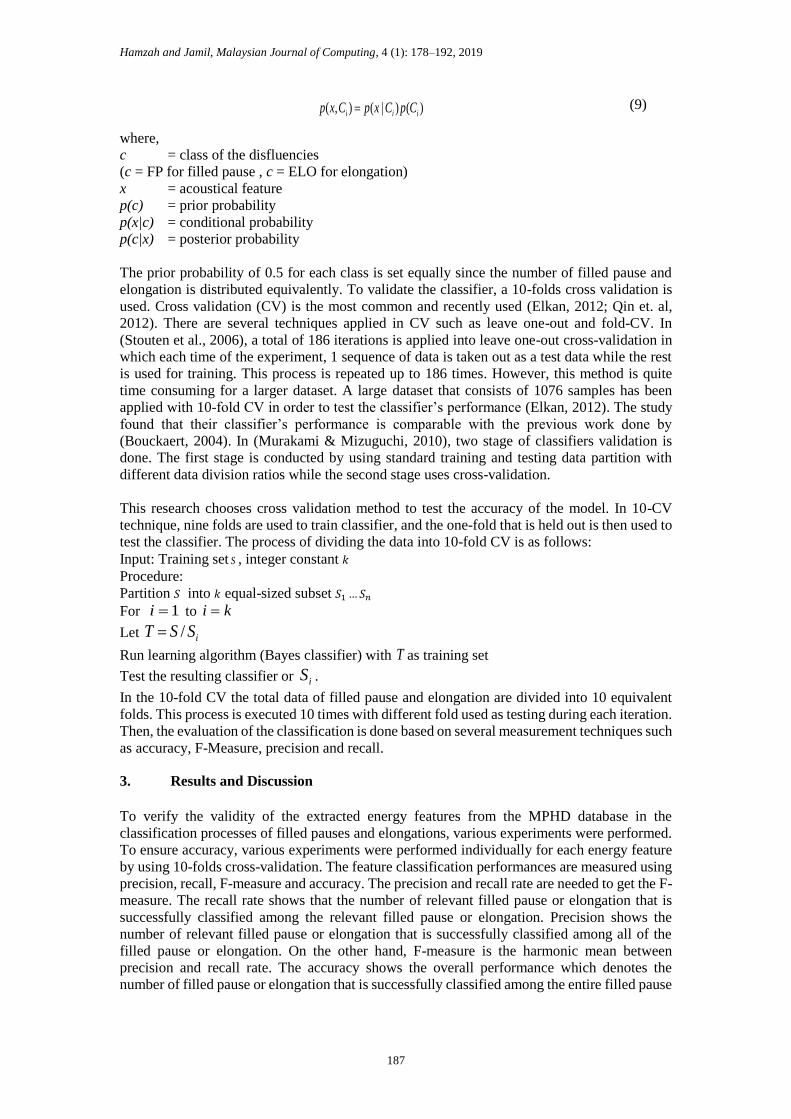
The results of accuracy for each fold in the 10-fold CV for both LM-E and STE are shown in
Fig 8. For the proposed LM-E, the accuracy differences between fold is considerably small
which is only 3.69. This indicates LM-E is consistent in representing each filled pause and
elongations. The lowest accuracy of the proposed LM-E is denoted at 68% as seen in the 7th
fold. Most of the speech data of the 7th fold is from DR20080528 and DR20080828 datasets.
An example of misclassified ELO and FP are randomly taken from DR20080828 dataset. The
LM-E standard deviation for both ELO (ELO07.wav and ELO06.wav) and FP (FP11.wav and
FP107.wav) are 0.684, 0.378, 0.937 and 0.9828 respectively. It is obviously shown that the
LM-E standard deviation for FP are lower compared to ELO which is supposedly to be small.
Figure. 8. 10-fold CV for LM-E and STE accuracy
In speech production, there is a transition between consonant to vowel causing the acoustic
changes within the transition (Doellinger et al., 2011). According to (Doellinger et al., 2011)
the transition between consonant to vowel is due to the interval between the release burst and
the onset of laryngeal pulsing. The transition from consonant to vowel in Malay language
73 73 7075
7180
6873 73
80
6067
6067
60 6565
6872
70
0
10
20
30
40
50
60
70
80
90
Accuracy of LM-E and STE for each fold of
10-fold CV
LM-E STE
Hamzah and Jamil, Malaysian Journal of Computing, 4 (1): 178–192, 2019
189
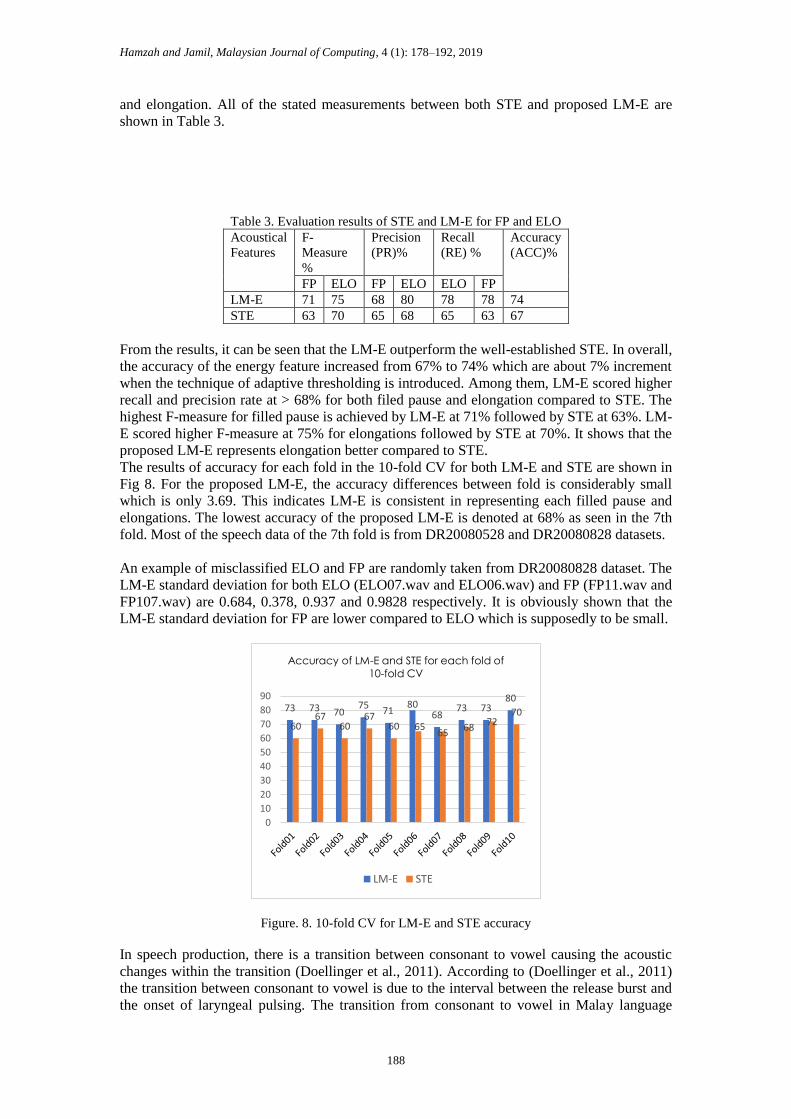
dataset produced a unique phenomenon named as expressive intonation in this research. The
graphical representation of the consonant to vowel transition is shown in Figure 9. Since there
is no significant transition between consonant to vowel in the elongations depicted in Figure 9,
a lower standard deviation of LM-E is derived. Thus, the standard deviation does not meet the
acoustical rules of LM-E for elongation; they are misclassified as filled pause.
Some of the elongation starts with voiced consonant (i.e. /ga/, /da/, and /ni/) unvoiced consonant
(i.e. /pi/, /tu/, and /ke/). There are also elongations uttered with semivowel (i.e. /ya/, /wa/). It is
observable that there is no significant amplitude transition between consonant to vowel in many
of the elongations of the 7th fold; thus, causing lower LM-E standard deviation. The elongation
that is in the form of semivowel is hardly to be correctly classified by LM-E. Most of the
elongations cannot be correctly classified by using LM-E as the energy of the semivowel and
the vowel of the filled pause do not differ significantly.
Figure. 9. Consonant to vowel transition in elongation /da/
According to (Espy, 1986), the similar acoustical pattern between semivowel and vowel
causing the detection of semivowels is a challenging task. In summary, several causes of
misclassification done by LM-E are:
I. A low volume of voice pronunciation by the speaker caused inaccurate representation
of LM-E for filled pause.
II. Filled pause is uttered in an emotional state of mind such as angry, happy and doubt;
producing expressive intonation in the filled pause utterances. Therefore, filled pause
is misclassified as elongation as it possessed characteristic similar to elongation.
III. Insignificant transition between consonant to vowel in elongation; causing a low
LME’s standard deviation.
As stated earlier, the LM-E is associated with the speech energy (STE). Therefore, this research
compares the performance of these two speech energy characteristics in differentiating filled
pause and elongation. Since the filled pause is unvaried pronunciation of phonemes, the energy
is constant. The consistency of the energy is measured based on STE’s lower standard deviation
(Stouten et la., 2006). In other words, the STE’s standard deviation for filled pause is lower
compared to elongation. The LM-E which is an exploitation of the speech energy, however
managed to differentiate the elongation better compared to STE.
Am
pli
tud
e
/D/ /A/
Hamzah and Jamil, Malaysian Journal of Computing, 4 (1): 178–192, 2019
190
4. Conclusion
This research concludes that the exploitation of the well-established STE has produced better
classification accuracy for FP and ELO. In the future, the research is expected to produce a
more robust energy feature or any acoustical feature that ae more suitable especially in
overcoming the problem of semivowel detection in elongation. The research also suggests a
more efficient algorithm can be constructed so that it can reduce the computation time.
Acknowledgement
This research is fully supported by FRGS grant,
600-IRMI/REI 5/3 (010/2018). The authors fully acknowledged Ministry of Higher Education
(MOHE) and Universiti Teknologi MARA Malaysia for the approved fund which makes this
important research viable and effective.
References
Abbas, E. I., & Refeis, A. A. (2013). Influence of Noisy Environment on the Speech Recognition Rate
Based on the Altera FPGA. Engineering and Technology Journal, 31(13 Part (A) Engineering),
2513-2530.
Audhkhasi, K., Kandhway, K., Deshmukh, O. D., & Verma, A. (2009, April). Formant-based technique
for automatic filled-pause detection in spontaneous spoken English. In 2009 IEEE International
Conference on Acoustics, Speech and Signal Processing (pp. 4857-4860). IEEE.
Bertot, E. M., Beaujean, P. P., & Vendittis, D. (2014, July). Refining envelope analysis methods using
wavelet de-noising to identify bearing faults. In European Conference of the Prognostics and
Health Management Society.
Bouckaert, R. R. (2004, December). Naive bayes classifiers that perform well with continuous variables.
In Australasian joint conference on artificial intelligence (pp. 1089-1094). Springer, Berlin,
Heidelberg.
Deng, L., & O'Shaughnessy, D. (2018). Speech processing: a dynamic and optimization-oriented
approach. CRC Press.
Doellinger, M., Burger, M., Hoppe, U., Bosco, E., & Eysholdt, U. (2011). Effects of consonant-vowel
transitions in speech stimuli on cortical auditory evoked potentials in adults. The open neurology
journal, 5, 37.
Dougherty, J., Kohavi, R., & Sahami, M. (1995). Supervised and unsupervised discretization of
continuous features. In Machine Learning Proceedings 1995 (pp. 194-202). Morgan Kaufmann.
Espy-Wilson, C. (1986, April). A phonetically based semivowel recognition system. In ICASSP'86. IEEE
International Conference on Acoustics, Speech, and Signal Processing(Vol. 11, pp. 2775-2778).
IEEE.
Elkan, C. (2012). Evaluating classifiers. San Diego: University of California.
Gabrea, M., & O'Shaughnessy, D. (2000). Detection of filled pauses in spontaneous conversational
speech. In Sixth International Conference on Spoken Language Processing.
Ganapathy, S. (2012). Signal analysis using autoregressive models of amplitude modulation (Doctoral
dissertation, Johns Hopkins University).
Hamzah and Jamil, Malaysian Journal of Computing, 4 (1): 178–192, 2019
191
Garg, G., & Ward, N. (2006). Detecting filled pauses in tutorial dialogs. Report of University of Texas at
El Paso, El Paso.
Goto, M., Itou, K., & Hayamizu, S. (1999). A real-time filled pause detection system for spontaneous
speech recognition. In Sixth European Conference on Speech Communication and Technology.
Izzad, M., Jamil, N., & Bakar, Z. A. (2013, January). Speech/non-speech detection in Malay language
spontaneous speech. In 2013 International Conference on Computing, Management and
Telecommunications (ComManTel) (pp. 219-224). IEEE.
Jalil, M., Butt, F. A., & Malik, A. (2013, May). Short-time energy, magnitude, zero crossing rate and
autocorrelation measurement for discriminating voiced and unvoiced segments of speech signals.
In 2013 The International Conference on Technological Advances in Electrical, Electronics and
Computer Engineering (TAEECE) (pp. 208-212). IEEE.
Karpiński, M. (2013). Acoustic Features of Filled Pauses in Polish Task-Oriented Dialogues. Archives
of Acoustics, 38(1), 63-73.
Kaushik, M., Trinkle, M., & Hashemi-Sakhtsari, A. (2010). Automatic detection and removal of
disfluencies from spontaneous speech. In Proceedings of the Australasian International
Conference on Speech Science and Technology (SST).
Kitayama, K., Goto, M., Itou, K., & Kobayashi, T. (2003). Speech starter: Noise-robust endpoint
detection by using filled pauses. In Eighth European Conference on Speech Communication and
Technology.
Li, Y. X., He, Q. H., & Li, T. (2008, May). A novel detection method of filled pause in mandarin
spontaneous speech. In Seventh IEEE/ACIS International Conference on Computer and
Information Science (icis 2008) (pp. 217-222). IEEE.
Li, Y. X., He, Q. H., Li, W., & Wang, Z. F. (2010, November). Two-level approach for detecting non-
lexical audio events in spontaneous speech. In 2010 International Conference on Audio,
Language and Image Processing (pp. 771-777). IEEE.
Meseguer, N. A. (2009). Speech analysis for automatic speech recognition. Norwegian University of
Science and Technology, Department of Electronics and Telecommunications, 14-19.
Mohd Yusof, S. A., & Yaacob, S. (2008). Classification of Malaysian vowels using formant based
features. Journal of ICT, 7, 27-40.
Murakami, Y., & Mizuguchi, K. (2010). Applying the Naïve Bayes classifier with kernel density
estimation to the prediction of protein–protein interaction sites. Bioinformatics, 26(15), 1841-
1848.
Ogata, J., Goto, M., & Itou, K. (2009, April). The use of acoustically detected filled and silent pauses in
spontaneous speech recognition. In 2009 IEEE International Conference on Acoustics, Speech
and Signal Processing (pp. 4305-4308). IEEE.
Qin, H., Ma X., Herawan, T., and Zain, J. M. (2012). “DFIS: A Novel Data Filling Approach for
Incomplete Soft Set”, Journal of Applied Mathematics and Computer Science, 22 (4), 817-828.
Rosenberg, A., & Hirschberg, J. (2006). On the correlation between energy and pitch accent in read
english speech. In Ninth International Conference on Spoken Language Processing.
Schwartzman, A., Gavrilov, Y., & Adler, R. J. (2011). Multiple testing of local maxima for detection of
peaks in 1D. Annals of statistics, 39(6), 3290.
Singh, B., Rani, V., & Mahajan, N. (2012). Preprocessing in ASR for computer machine interaction with
humans: A review. International Journal of Advanced Research in Computer Science and
Software Engineering, 2(3), 396-399.

Hamzah and Jamil, Malaysian Journal of Computing, 4 (1): 178–192, 2019
192
Stouten, F. (2008). Feature extraction and event detection for automatic speech recognition (Doctoral
dissertation, Ghent University).
Stouten, F., & Martens, J. P. (2003). A feature-based filled pause detection system for Dutch. In
Automatic Speech Recognition and Understanding, 2003. ASRU'03. 2003 IEEE Workshop on (pp.
309-314). IEEE.
Stouten, F., Duchateau, J., Martens, J. P., & Wambacq, P. (2006). Coping with disfluencies in
spontaneous speech recognition: Acoustic detection and linguistic context manipulation. Speech
Communication, 48(11), 1590-1606.
Stouten, F., Duchateau, J., Martens, J. P., & Wambacq, P. (2006). Coping with disfluencies in
spontaneous speech recognition: Acoustic detection and linguistic context manipulation. Speech
Communication, 48(11), 1590-1606.
Veiga, A., Candeias, S., Lopes, C., & Perdigão, F. (2011, August). Characterization of Hesitations Using
Acoustic Models. In ICPhS (pp. 2054-2057).
Verkhodanova, V., & Shapranov, V. (2014, October). Filled Pauses and Lengthenings Detection Based
on the Acoustic Features for the Spontaneous Russian Speech. In International Conference on
Speech and Computer (pp. 227-234). Springer, Cham.
Zapata, J., & Kirkedal, A. S. (2015). Assessing the Performance of Automatic Speech Recognition
Systems When Used by Native and Non-Native Speakers of Three Major Languages in Dictation
Workflows. In Proceedings of the 20th Nordic Conference of Computational Linguistics
(NODALIDA 2015) (pp. 201-210).
Žgank, A., Rotovnik, T., & Sepesy Maučec, M. (2008). Slovenian spontaneous speech recognition and
acoustic modeling of filled pauses and onomatopoeas. WSEAS Transaction on Signal
Processing, 4(7), 388-397.