Embed Size (px)
Citation preview

*
NASA CR-54393
? DOUGLAS REPORT SM-48845
r
INVESTIGATION OF STRUCTURAL PROPERTIES OF FIBER-GLASS FILAMENT-WOUND PRESSURE VESSELS
AT CRYOGENIC TEMPERATURES
SEPTEMBER 1965
Prepared under Contract No. NAS3-2562 by Douglas Aircraft Company, Inc.
Missile and Space Systems Division Santa Monica, California
for
NATIONAL AERONAUTICS AND SPACT ADMINISTRATION
:'' " >'' -v ■.'■■'- ■ • •" -'.'I.' Iif, ' «'H' I i\< I ,.
NOTICE
This report was prepared as an account of Government sponsored
work. Neither the United States, nor the National Aeronautics
and Space Administration (NASA), nor any person acting on behalf
of NASA:
A.) Makes any warranty or representation, expressed or implied,
with respect to the accuracy, completeness, or usefulness
of the information contained in this report, or that the use
of any information, apparatus, method, or process disclosed
in this report may not infringe privately owned rights; or
f
B.) Assumes any liabilities with respect to the use of, or for
damages resulting from the use of any information, apparatus,
method or process disclosed in this report.
As used above, "person acting on behalf of NASA" includes any
employee or contractor of NASA, or employee of such contractor,
to the extent that such employee or contractor of NASA, or employee
of such contractor prepares, disseminates, or provides access to,
any information pursuant to his employment or contract with NASA,
or his employment with such contractor.
t
Requests for copies of this report should be referred to National Aeronautics and Space Administration Office of Scientific and Technical Information
Attention: AFSS-A Washington, D.C. 20546
NASA CR-54393
1 DOUGLAS REPORT SM-48845
f-
INVESTIGATION OF STRUCTURAL PROPERTIES OF FIBER-GLASS FILAMENT-WOUND PRESSURE VESSELS
AT CRYOGENIC TEMPERATURES
SEPTEMBER 1965
By J.M. TOTH, JR., W.C. SHERMAN, and D.J. SOLTYSIAK
H
Prepared under Contract No. NAS3-2562 by Douglas Aircraft Company, Inc.
Missile and Space Systems Division Santa Monica, California
for
NATIONAL AERONAUTICS AND SPACE ADMINISTRATION

FOREWORD
This report was prepared by the Douglas Aircraft Company, Inc. , Missile and Space Systems Division, under NASA Contract NAS 3-2562. This investigation was initiated by Lewis Research Center of NASA to determine the structural properties of fiber-glass, filament-wound pressure vessels at cryogenic temperatures. The work was administered under the direction of the Chemical Rocket Systems Division, with Mr. James R. Barber acting as Project Manager.
The report covers work conducted from July 1, 1963 through June 16, 1965. It is submitted in fulfillment of the contract and is cataloged by Douglas as Report No. SM-48845.
R. W. Hallet, Jr. , Director of Research and Development, provided technical direction. Included among those who participated in the project were J. M. Toth, Jr. , Project Director, W. C. Loomis and D. J„ Soltysiak, Research and Development; R. Harvey, R. B. Lantz, B. E. Newman, T. T. Sakurai, and W. C. Sherman, Materials Research and Production Methods; R. W. Bowman, E. R. Charhut, and R. Yeaman, Engineering Laboratories and Services; R. T. Pfaffenberger, Tooling; and D. W. Yockey, Reliability Assurance.
Portions of the work reported herein were accomplished under Douglas Independent Research and Development funding.
CONTENTS
Page
FOREWORD iü SUMMARY 1 INTRODUCTION 2 PHASE I - LINER AND RESIN SYSTEM EVALUATION 3
Liner Material Investigation 3 Mechanical Properties Tests 3 Thermal Contraction Tests 14 Unstressed Permeability at Ambient-Temperature 16
Resin System Evaluation 20 Candidate Systems 20 NOL Ring Screening 20 Uniaxial Cyclic Tests at Cryogenic Temperature 23 Thermal Contraction 24 Biaxial Cylinder Fabrication and Test 24
18-In. Diameter Pressure Vessels 54 Design . . . . : 54 Fabrication 57 Test 61 General 67
PHASE II - FABRICATION OF PRESSURE VESSELS 67 Helical Winding 67 Polar Winding 67
Vessel S/N 004 67 Vessel S/N 005 69 Vessel S/N 006 69 Comments 69 Vessel S/N 007 69
PHASE III - TESTING AT -320 °F 70 Vessel S/N 006 72
PHASE IV - TESTING AT -423 °F 76 Vessel S/N 004 76 Vessel S/N 005 76 Comments 76
SUMMARY OF RESULTS 81 APPENDIXES
A. ELECTRODEPOSITED NICKEL LINERS 83 B. BIAXIALITY CONVERSION CRITERIA 89 C. VESSEL DESIGN 101 D. DISCONTINUITY STRESSES AT THE DOME-
CYLINDER JUNCTION FOR FIBER GLASS PRESSURE VESSELS Ill
REFERENCES 123

V
FIGUEES
1 Temperature-Strength Behavior for Tedlar BG 30 WH Film • • 4
2 Temperature-Strength Behavior for Glass Flake Film 5
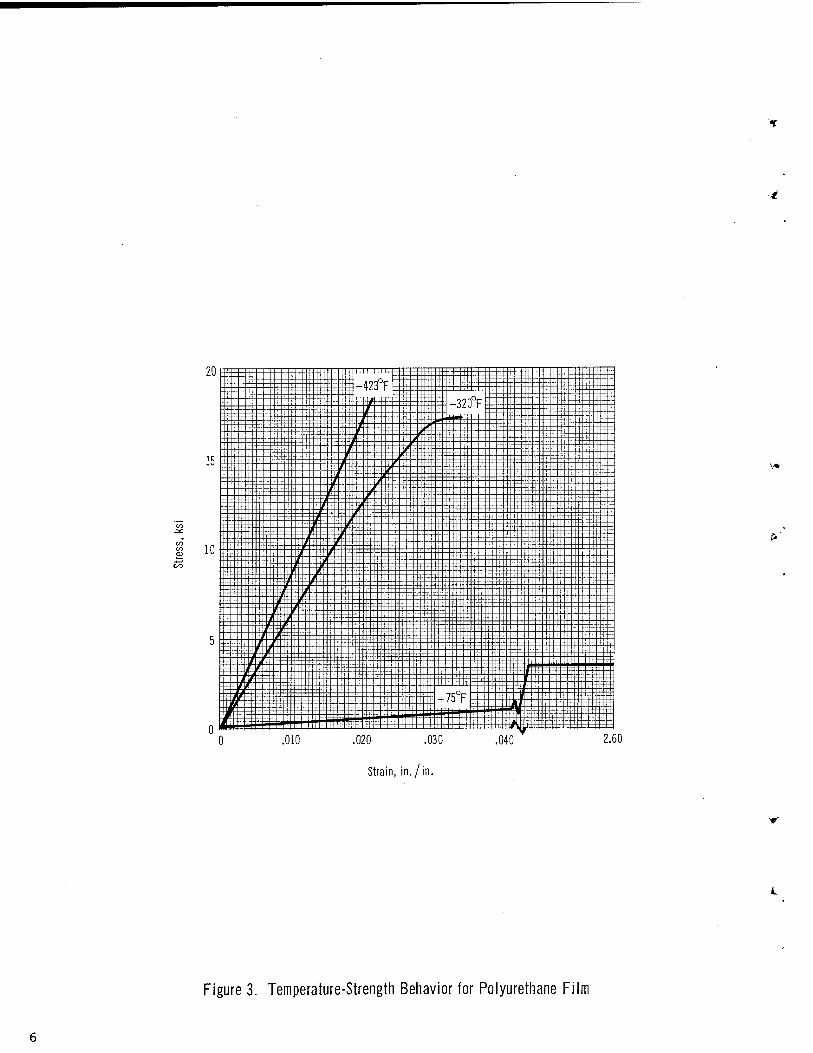
3 Temperature-Strength Behavior for Polyurethane Film 6
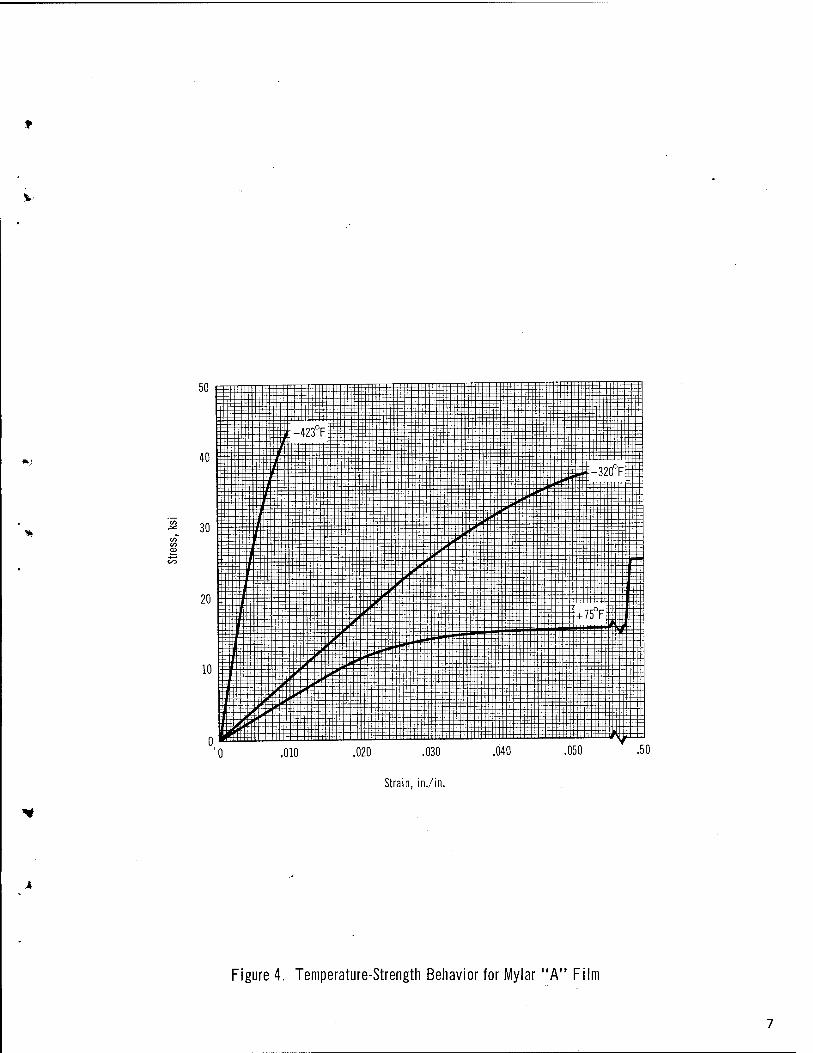
4 Temperature-Strength Behavior for Mylar "A" Film 7
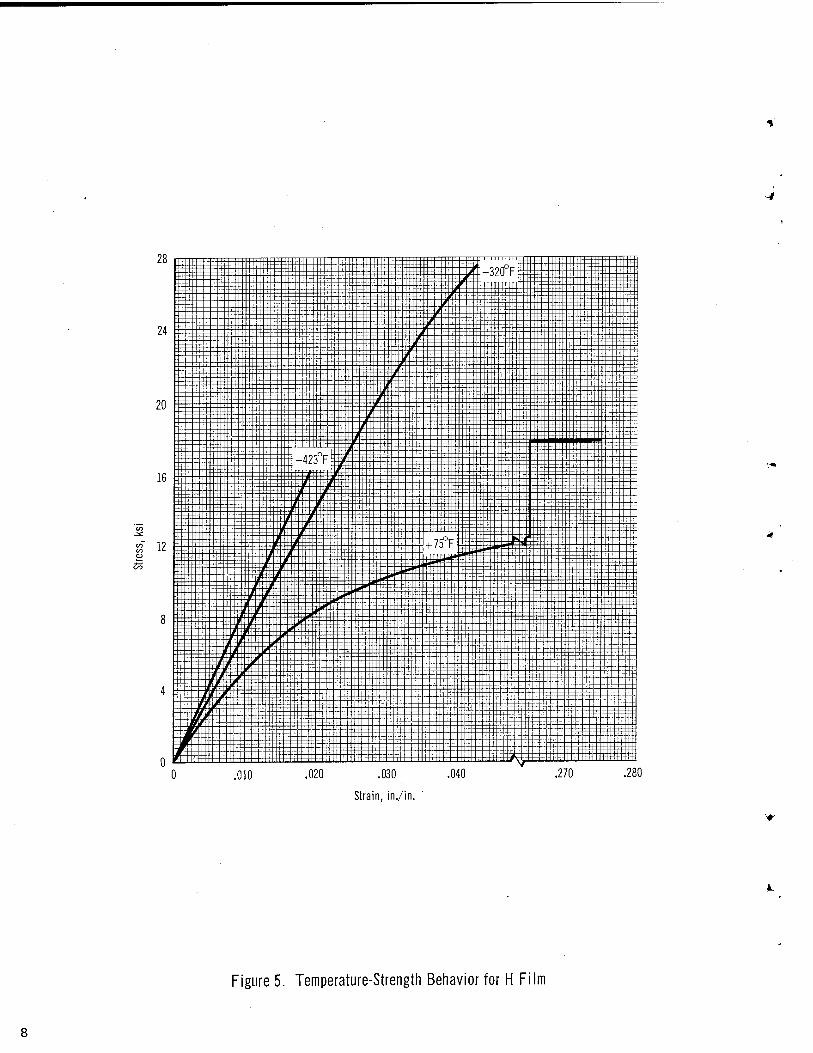
5 Temperature-Strength Behavior for H Film 8
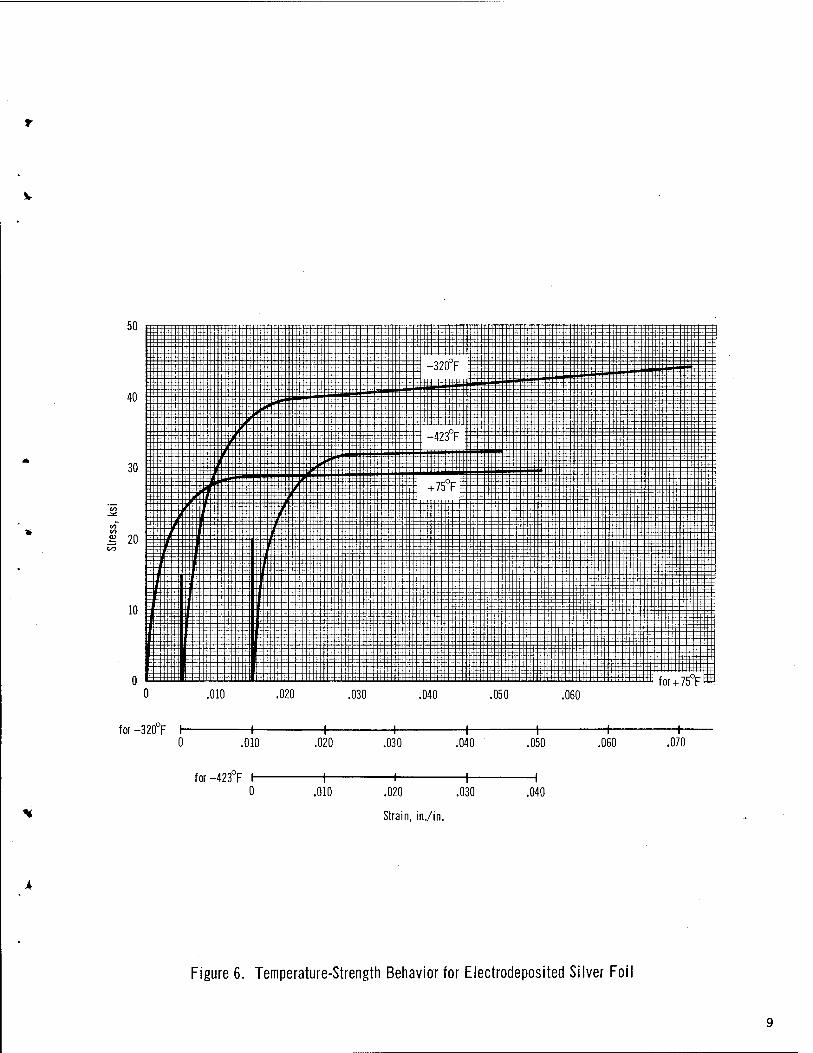
6 Temperature-Strength Behavior for Electrodeposited Silver Foil 9
7 Temperature-Strength Behavior for Electrodeposited Nickel Foil 10
8 Temperature-Strength Behavior for Electrodeposited Copper Foil H
9 Tensile Test Coupon, ASTM Standard D638-61T 12
10 "Joined-Jaw" Test Grips 13
11 Contraction Curves of Candidate Liner Materials 15
12 Open Permeation Cell with Test Specimen 17
13 Permeability Measuring Equipment 17
14 Preliminary Resin System Evaluation Tests at Cryogenic Temperatures 21
15 LH2 (-423°F) Cycle Procedure 25
16 Sub-Scale Pressure Vessel Biaxial Test Specimen 26
17 Structural Wall Cross-Section 27
18 Biaxial Cylinder Structural Wall Schematic 28
19 Pressure Vessel Test Schematic for LH2 Burst and Cycle Tests 31
20 Burst at Eoom Temperature 34
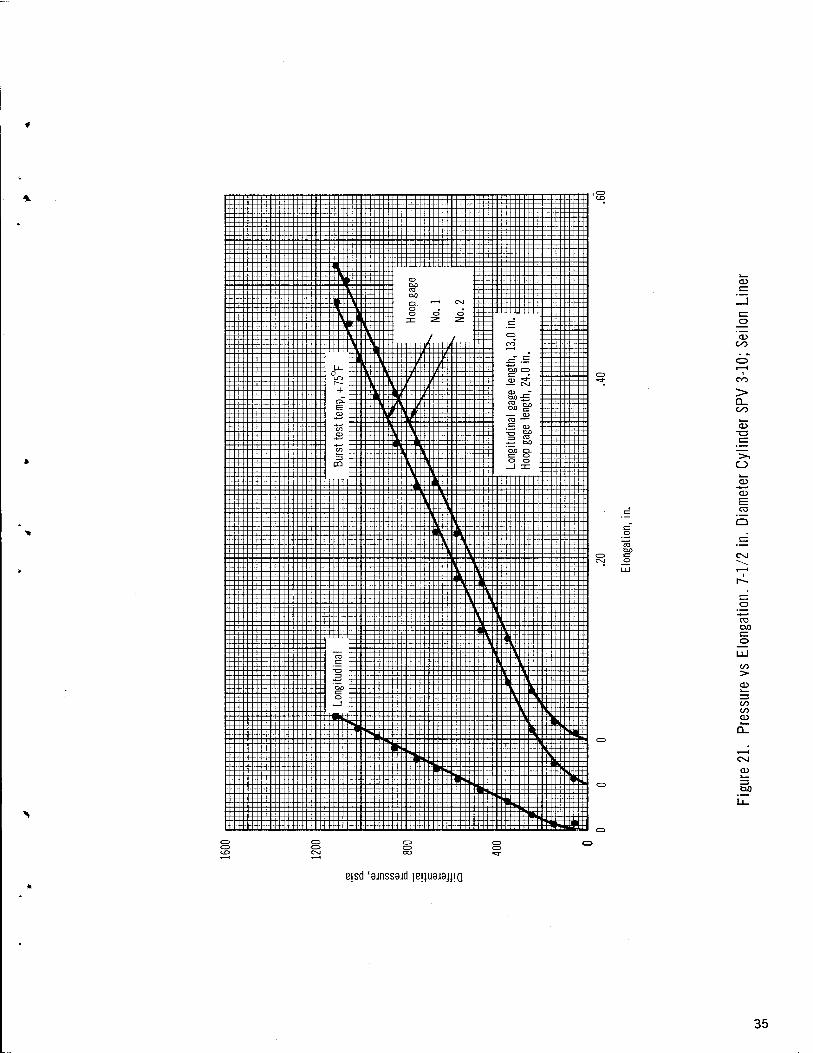
21 Pressure vs Elongation. 7 1/2 in. Diameter Cylinder SPV 3-10; Seilon Liner 35
22 Hoop Stress-Strain Diagram. 7 1/2 in. Diameter Cylinder SPV 3-10; Seilon Liner • • • • 36
23 Longitudinal Stres s-Strain Diagram. 7 1/2 in. Diameter Cylinder SPV 3-10; Seilon Liner • • • 37
24 Biaxial Tests. Cycle-Pressure Diagram, 7 1/2 in. Diameter Cylinder SPV 3-14'; Nickel Liner 38
25 Pressure vs Hoop Elongation. 7 1/2 in. Diameter Cylinder SPV 3-14'; Nickel Liner 40
26 Pressure vs Longitudinal Elongation. 7 1/2 in. Diameter Cylinder SPV 3-14'; Nickel Liner 41
27 Hoop Stress-Strain Diagram. 7 1/2 in. Diameter Cylinder SPV 3-14'; Nickel Liner 42
28 Longitudinal Stress-Strain Diagram. 7 1/2 in. Diameter Cylinder SPV 3-14'; Nickel Liner 43
29 Probable Behavior of Nickel Liner. Specimen SPV 3-14; Cycles 18, 19 and 20 44
30 Ultimate Filament Stress vs Time to Failure 45
31 Mylar Lined Specimen SPV 1-17; After Test 46
32 H-Film Lined Specimen SPV 2-21;After Test 46
33 Pressure vs Elongation. 7 1/2 in. Diameter Cylinder SPV 3-8; Nickel Liner 48
34 Stress-Strain Diagram. 7 1/2 in. Diameter Cylinder SPV 3-8; Nickel Liner 49
3 5 5 Mil Nickel Lined Specimen (SPV 3-16) After 250 Cycles at 36% of Ultimate 50
36 5 Mil Nickel Lined Specimen (SPV 3-16) After 250 Cycles at 36% of Ultimate 5 0
37 Pressure vs Hoop Elongation. 7 1/2 in. Diameter Cylinder SPV 3-16; Nickel Liner 51
38 Pressure vs Longitudinal Elongation. 7 1/2 in. Diameter Cylinder SPV 3-16; Nickel Liner 52
39 Stress-Strain Diagram. 7 1/2 in. Diameter Cylinder SPV 3-16; Nickel Liner 53
40 Fiber Glass Vessel Cryogenic Test 56
41 Decrease in Meridional Stress vs No. of Layers 58
42 Vessel S/N 001. Before Test 59
43 Fiberglass Tank End Fitting Seal 62
44 Liner of Vessel S/N 001. After Test 63
45 Pressure vs Elongation. 18 in. Diameter Vessel S/N 001. . 64
46 Hoop Stress-Strain Diagram. 18 in. Diameter Vessel S/N 001 65
47 Longitudinal Stress-Strain Diagram. 18 in. Diameter Vessel S/N 001 66

48 Hoop Stress-Strain Diagram (Corrected). 18 in. Diameter Vessel S/N 001. 68
49 Pressure Vessel Test Schematic for 18 in. Diameter Vessel Testing 71
50 Pressure vs Elongation. 18 in. Diameter Vessel S/N 006 73
51 Hoop Stress-Strain Diagram. 18 in. Diameter Vessel S/N 006 74
52 Longitudinal Stress-Strain Diagram. 18 in. Diameter Vessel S/N 006 75
53 Vessel S/N 005 High Liner Deformation 77
54 Vessel S/N 005 Eadial Strain Lines 77
Al Photomicrographs, 18 in. Diameter Vessel S/N 007 Liner (X250) 87
Bl Biaxial Stress-Strain Conversion 93
B2 Nickel Biaxial Stress-Strain Diagram 94
B3 Nickel Biaxial Stress-Strain Diagram 95
B4 Nickel Biaxial Stress-Strain Diagram 96
B5 Nickel Biaxial Stress-Strain Diagram 97
B6 Plastic Instability Determination 99
Cl Design Factor for Variation of Allowable Filament Stress as a Function of Boss Diameter 102
C2 Design Factor for Variation of Allowable Filament Stress as a Function of Vessel Length 103
C3 Design Factor for Variation of Allowable Filament Stress as a Function of Wall Thickness 104
C4 Design Factor for Variation of Allowable Filament Stress as a Function of Vessel Diameter 105
Dl Diagram of Pressure Vessel Winding 112
D2 Composite Material Properties for Two Helix Layers and a Varying Number of Hoop Layers 113
D3 Pressure Vessel Free Body Idealization 114
D4 Meridional Bending Moment for Several Hoop Layers 120
D5 Increase in Meridional Stress vs No. of Layers 121
IX
TABLES
I Unstressed Room Temperature Permeability Constants ....... 19
II Tensile-Lap Shear 27
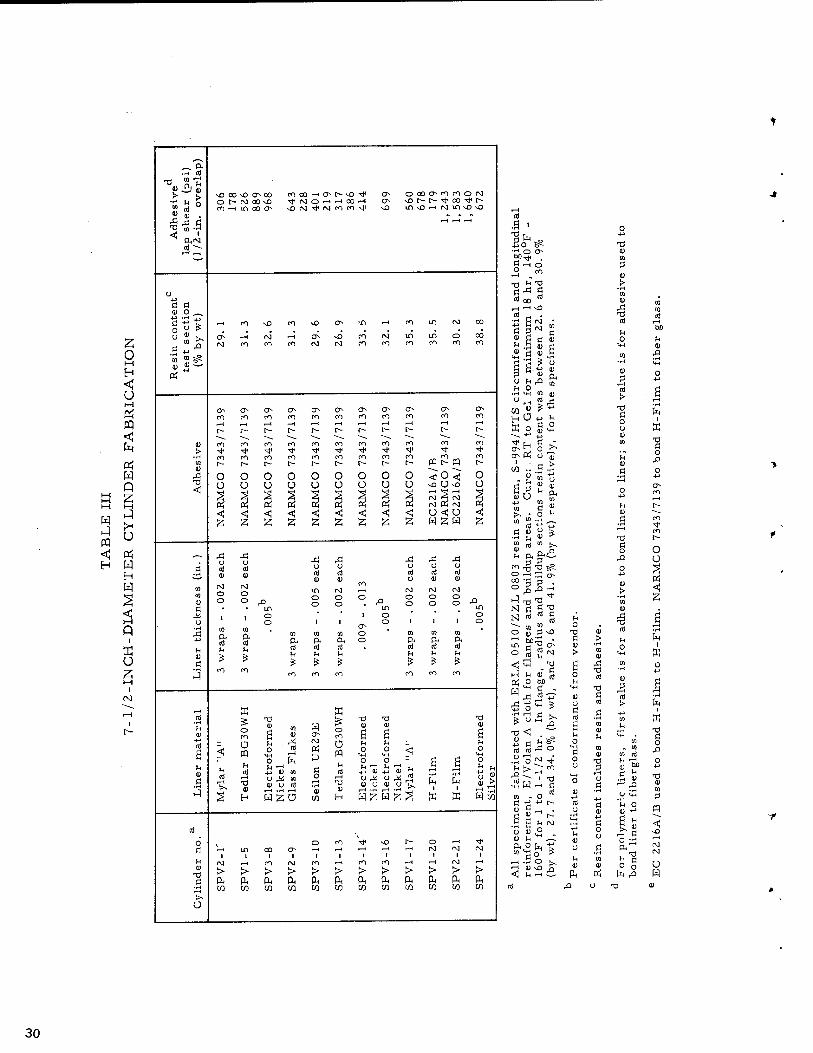
III 7-1/2-Inch-Diameter Cylinder Fabrication 30
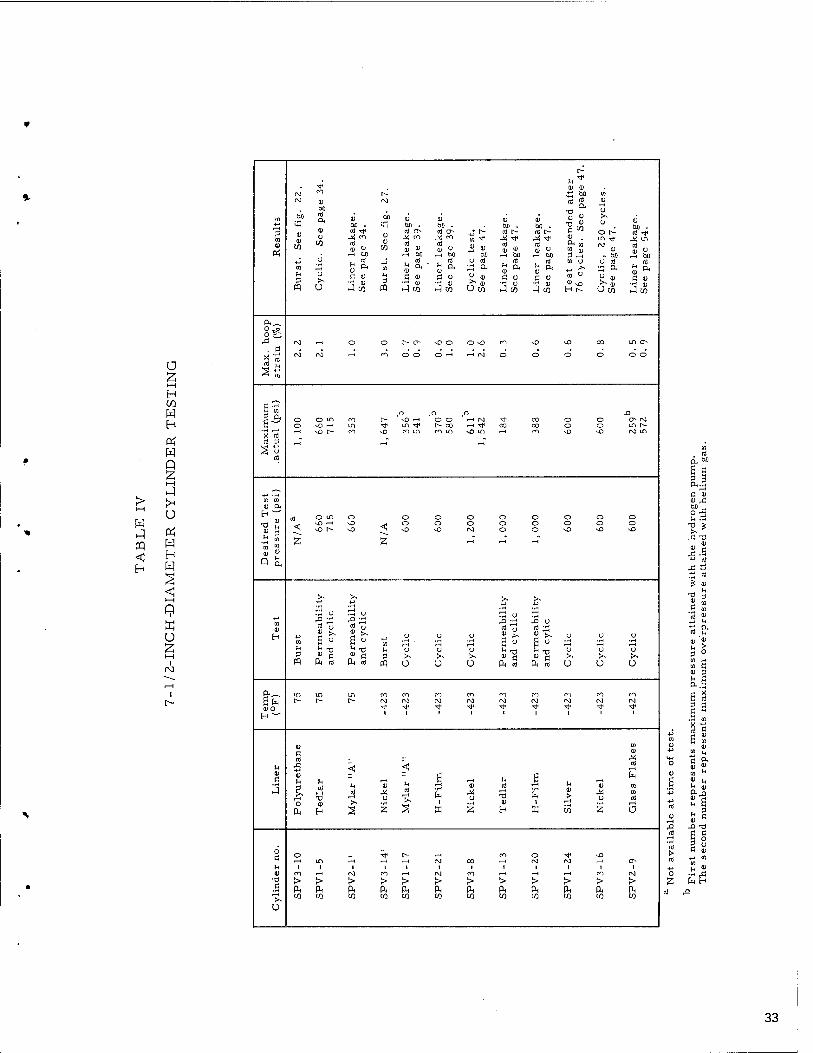
IV 7-1 /2-Inch-Diameter Cylinder Testing 33
V Polymeric Liner Behavior at -423 °F 55
VI 18-Inch-Diameter Vessel Process Data 60
VII 18-Inch-Diameter Vessel Testing Data 78

INVESTIGATION OF STRUCTURAL PROPERTIES OF
FIBER-GLASS FILAMENT-WOUND PRESSURE VESSELS
AT CRYOGENIC TEMPERATURES
ByJ.M. Toth, Jr., W. C. Sherman, and D. J. Soltysiak
SUMMARY
^Preliminary investigations of the structural properties of fiber-glass, filament-wound composites have shown that these materials have a great deal of promise for vessels that are structurally more efficient for storing fluids under pressure in a cryogenic environment than present vessels of metallic materials. This investigation was made to determine such struc- tural properties through the use of a typical 18-in. -diam pressure test vessel. It was realized at the outset that providing a suitable liner would be a major problem. Accordingly, the initial effort dealt with the testing of various candidate liner materials. Data were obtained on mechanical prop- erties, permeability, thermal contraction, and cyclic resistance of poly- meric and electrodeposited metallic materials. During the initial liner eval- uation, it was found that the strength of S-994 glass filaments in a 7-l/Z-in. - diam biaxial cylinder increased approximately 20% when tested at -423°F compared to its strength at +7 5°F.""/
The number of cycles that can be achieved by a pressure vessel opera- ting in the range of 1 to 2-l/2% strain is dependent upon the ability of the bond between the vessel wall and liner to prevent the liner from buckling and upon the ability of the liner to resist fracture when subjected to high plastic tensile and compressive strains. The investigated polymeric films had a low total elongation which, coupled with their high differential-contraction rates as compared with the glass-resin composites, made them unsuitable for liners in filament-wound pressure vessels operating at high strains and designed to take all of the strain in tension. A large number of cycles were achieved with a 7-l/2-in. -diam biaxial cylinder containing a 5-mil electrodeposited- nickel liner cycled at approximately 0.8% strain with liquid hydrogen. A fuller evaluation of the strain problem with 18-in. -diam filament-wound test vessels was unsuccessful as a result of liner and fabrication problems.
INTRODUCTION
Use of fiber-glass, filament-wound material for structural applications at cryogenic temperatures has been of interest to the aerospace field forborne time. Pressure vessels for containing liquid hydrogen have been of specific interest. Proper use of this material in the design of vessels for exposure to low temperatures requires a determination of its mechanical properties at those temperatures. Preliminary testing of some sample materials that were typical of filament-wound composites was undertaken at Lewis Research Cen- ter (ref. 1). From the preliminary data, it was learned that the extremely low temperatures had no harmful effect on the tensile strengths of the test speci- mens. In fact, specimens tested at -320°F and -423°F showed an increase in strength over those tested at 75°F. Furthermore, visual inspection of the^ specimens revealed no gross deleterious effects from contact with either liq- uid nitrogen or liquid hydrogen, the two cryogenic fluids into which the test specimens were immersed to obtain the low-temperature points. These re- sults were encouraging enough to allow further consideration for development in this area. This program was established to determine the structural pro^- perties of a filament-wound fiber-glass pressure vessel at -320 F and -423 F. The program was divided into four phases.
The Phase I effort included the investigation of liner materials and resin systems suitable for use in the development of small-scale pressure vessels operating at cryogenic temperatures. Liner materials investigated were a polyester film (Mylara, Type A), a polyvinyl fluoride film (Tedlara, Type^ BG30WH), a polyimide film (H-Filma), a polyurethane film (Seiion UR29E ), glass flakes0, and electrochemically deposited nickel, silver, and copper foild. Three epoxy resin systems, ER LA 0510/ZZL 0803e, EpiR ez 0510-5042/ EpiCure 841f, and EpiRez 5101f/APCo 322§, were evaluated with S-994 fiber glass roving and cloth. The following materials were selected for use in Phase II: (1) Liner: 5 mil (0.005 in.) electrodeposited nickel (2) Fiber glass: S-994/HTS (3) Adhesive: Narmco 7343/7139 (4) Resin System: ER LA 0510/ ZZL 0803.
The Phase II work included the incorporation of the materials selected in Phase I into the fabrication of 18-in. -diam by 24-in. -long domed pressure vessels. The Phase III and IV work included burst testing at -320°F and -423°F, respectively. The materials chosen for investigation in this program were all commercially available and were not necessarily intended for use at cryogenic temperatures. Their acceptance or rejection for this use, there- fore, is no reflection on their suitability for use as intended by the manufacturer.
aManufactured by E. I. duPont de Nemours & Co. bManufactured by Seiberling Rubber Co. cManufactured by Owens-Corning Fiberglas Co. dManufactured by Electroforms, Inc. eManufactured by Union Carbide Plastics Co. ^Manufactured by Jones-Dabney Co. ^Manufactured by Applied Plastics Co.
A
PHASE I - LINER AND RESIN SYSTEM EVALUATION
Liner Material Investigation
A previous Douglas program (ref. 2) had demonstrated the feasibility f certain types of integral metallic and polymeric liners. Requirements or all liners were that they must be:
(1) Impermeable to cryogenic liquids.
(2) Highly impermeable to gases from cryogenic liquids.
(3) Chemically inert with either fluid or gas.
Electrodeposited nickel and Mylar had been utilized successfully in that program. However, it was not definitely ascertained that either of these materials was the best of their respective families. Accordingly, candidate materials included in addition to Mylar and nickel, Tedlar, H-Film, poly- urethane film, glass flakes (polyester film backing), and electrodeposited silver and copper foils.
The selection of a liner was based primarily upon permeability con- siderations and compatibility of the liner and fiber glass composite to undergo ultimate and cyclic loading in a cryogenic environment; second- ary criteria included relative permeability, weight, and manufacturing techniques.
Since the polymeric liners were to be fabricated in two layers, a suit- able adhesive system was necessary which would be compatible with the films and resin cure temperatures.
The selection of a suitable resin system was based primarily on its response to cyclic stresses in a cryogenic environment.
Work by Mowers (ref. 3) has shown mechanical properties at cryo- genic temperatures to be dependent upon crystallinity of the material; more desirable properties being obtained -with lower crystallinity. There- fore, the lowest crystallinity materials available in each material family were secured for test. (The lowest crystallinity Mylar was available in type HS, but thermal contraction of the material was high; therefore, the next lowest crystallinity grade, Type A, was used. )
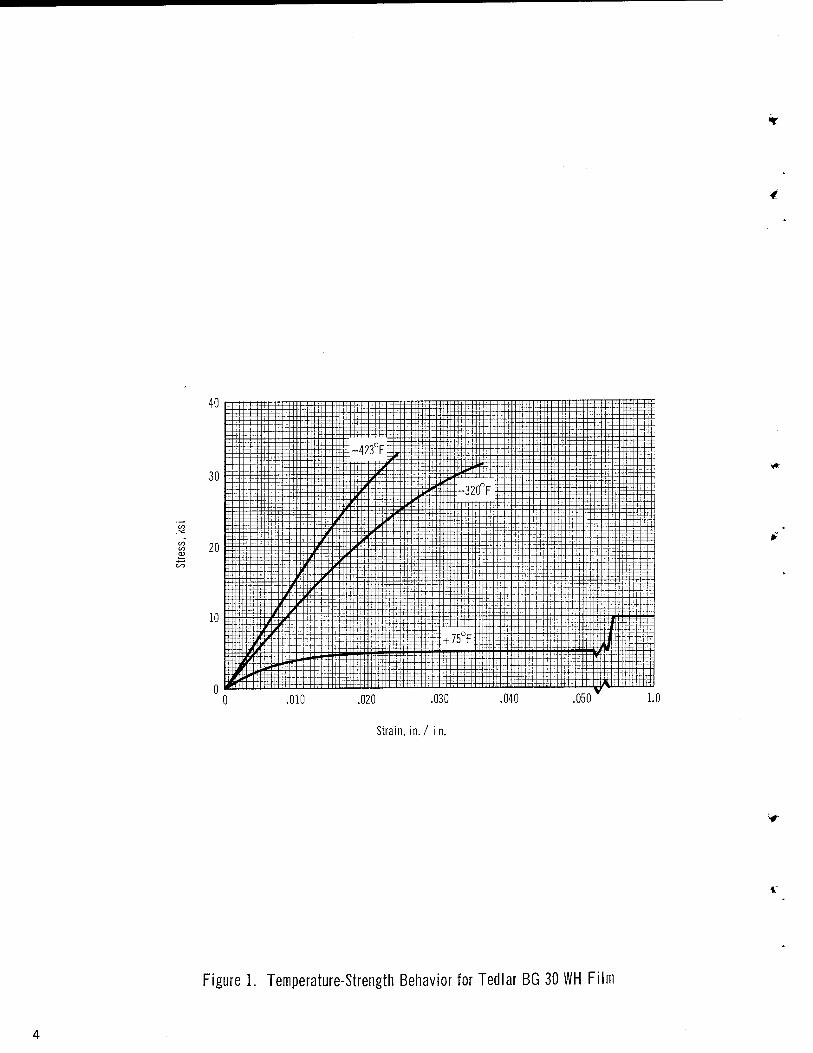
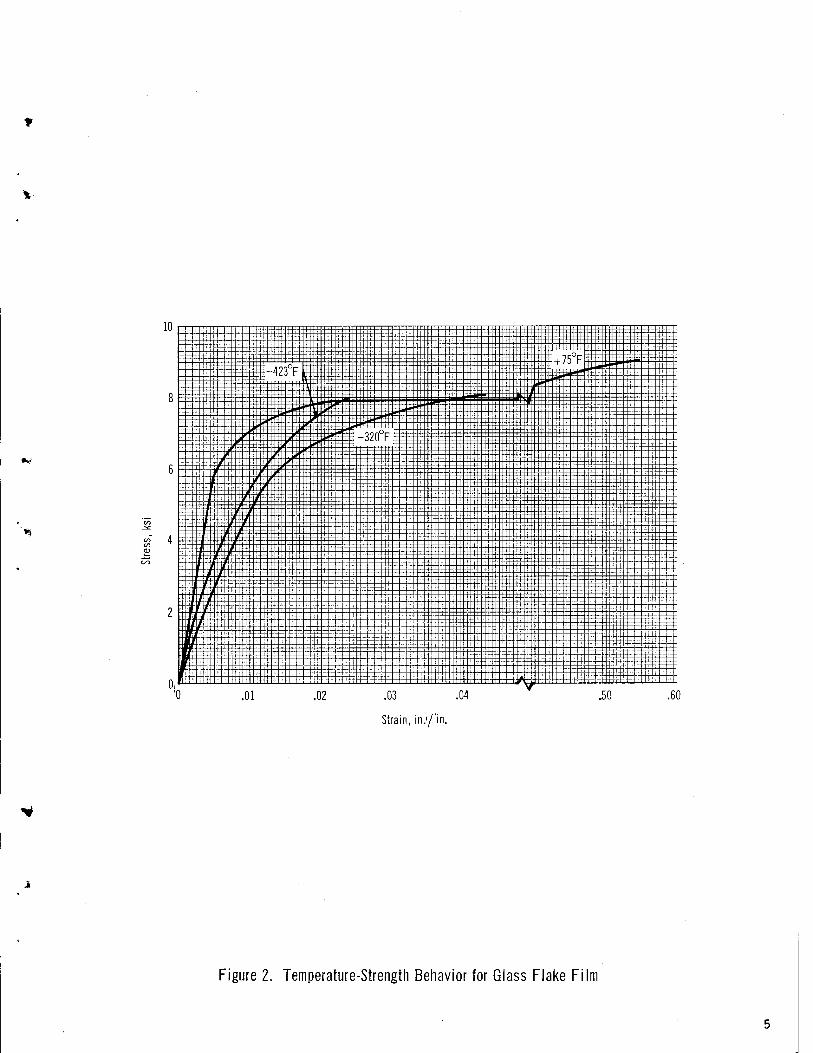
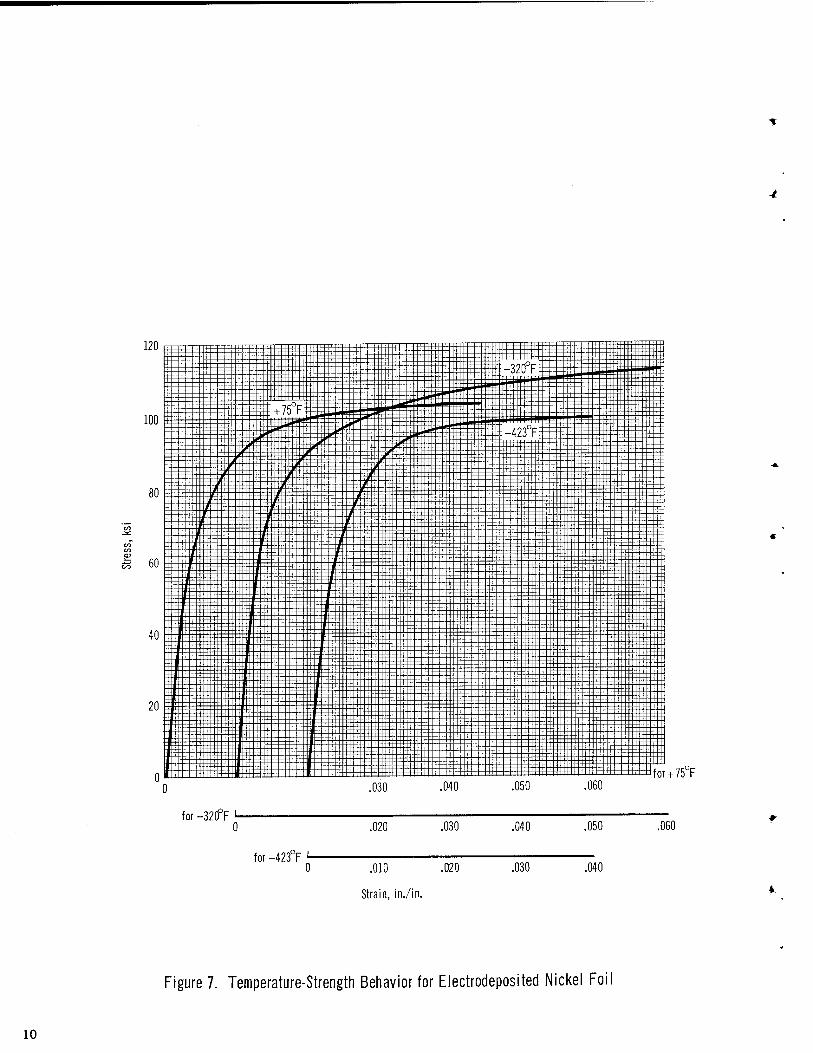
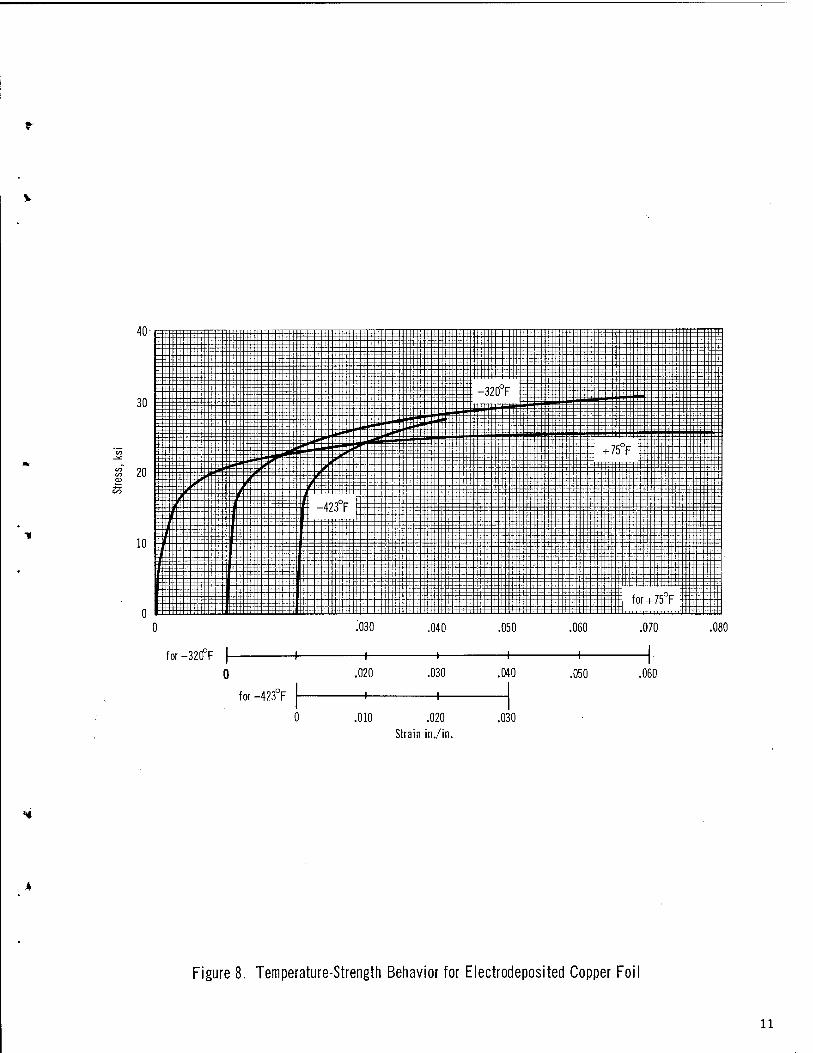
Mechanical Properties Tests. — Mechanical properties tests were made on candidate liners. Suitable instrumentation provided data on the ultimate strength, yield strength, modulus of elasticity, and ultimate elonga- tion. Results are plotted in figs. 1 through 8. These tests were run at ambient temperature, -320 F, and -42 3°F.
Modified ASTM standard shaped specimens were used (ASTM specifica- tion D-638-6IT). The configuration is shown in fig. 9.
.020 .030
Strain, in./ in.
1.0
Figure 1. Temperature-Strength Behavior for Tedlar BG 30 WH Film
U :X:T^-:
iiHP ' 11 j 1 i 111111 l-H- -U44-4-I-- :E4+±
||IjpKft titlTTti it J
HE+J
8 Uk]
6 ijip
411
HIP"4
UlmzÜ °F;I
""Ttf"
-5" I mtptlHi \\\\M
TrTTtf "jtf"""
Ertfct
AS „111
w 1 JIMP
:tT:EW#TFF
EIITEEEF
PlliP::
+FTffll
ffifffffffg;
::BHt
-mm
m
.01 .02 .03 .04
Strain, in.'/'in.
.50 60
Figure 2. Temperature-Strength Behavior for Glass Flake Film
£ io
2.60
Strain, in./in.
Figure 3. Temperature-Strength Behavior for Polyurethane Film
50
40
■2 30
20
10
-423 °F
jjtW
BffniB^
Mi||||MM
:l TnJi'Hm-t-i-t-l'I'l 11 m4li4]iy^ffflTnT ITTT
iTiTtiTrt' f 1 HHTITTTL i+75iMÜi
.010 .020 .030 .040 .050 " .50
Strain, in/in.
Figure 4. Temperature-Strength Behavior for Mylar "A" Film
28
24
20
16
12
■S ffffttSf+EH -320°F|Bff
ifffffrnfffTTf Iffl-rf InlW^:
iü j'j 1 fr H M iTiM" HÜ"! iKpfiE
"tBfffnT" +H-f
; trjfj rmmfflffffH j jjjiffiffi JSflgf ml \\\\\\Wft
fflffTjTtTnil j|T|^ -423°F E
wpiStW+75°F IWfifflfttW \\\T\\\\ mffHrni 1 1 H M ■ 11TTritftffH^^TTnjniTHTT [H j 1 H 1 [ Irifffff""'
iö
lli ü fff 1111II i i "pfrnf
-Ij-j II | j-
-H-K-rH-j-H 1 j 1 s fffr
fff ffHfrlii TlTTlT
tm"iff ff ftPTff
■ Ti MTTM
[jH+Hft"
Ötttttaf
HÜ Iffllff T4-H- ---frfrffr-
.010 .020 .030
Strain, in./in.
.270 .280
Figure 5. Temperature-Strength Behavior for H Film
50
40
30
20
10 fl"" Mill if "T
•|;i =l|ri-|i;
IIEBESjH:
P M 1 -32°°F ll[ H
jllllll IJjjjjjJM -423°F 'ffiffll 1 ^^ ^
llllll^^ + 75°F jfjjf»^
TlilTilinTirlllTinTllilllllm .010 .020 .030 .040 .050
for-320 F I- 0 .010 .020 .030 .040 .060 .070
for-423 F f- 0
+■ .010 .020 .030
Strain, in./in.
.040
Figure 6. Temperature-Strength Behavior for Electrodeposited Silver Foil
for -320°F i- 0
for + 75T
.020 .030 .040 .050
for -423°F L
0 .010 .020
Strain, in./in.
.030 .040
Figure 7. Temperature-Strength Behavior for Electrodeposited Nickel Foil
10
for -320 F
for -423TF
—f—
.020
—I—
—»—
.030
—t—
.010 .020
Strain in./in.
.040
.030
.060
Figure 8. Temperature-Strength Behavior for Electrodeposited Copper Foil
li
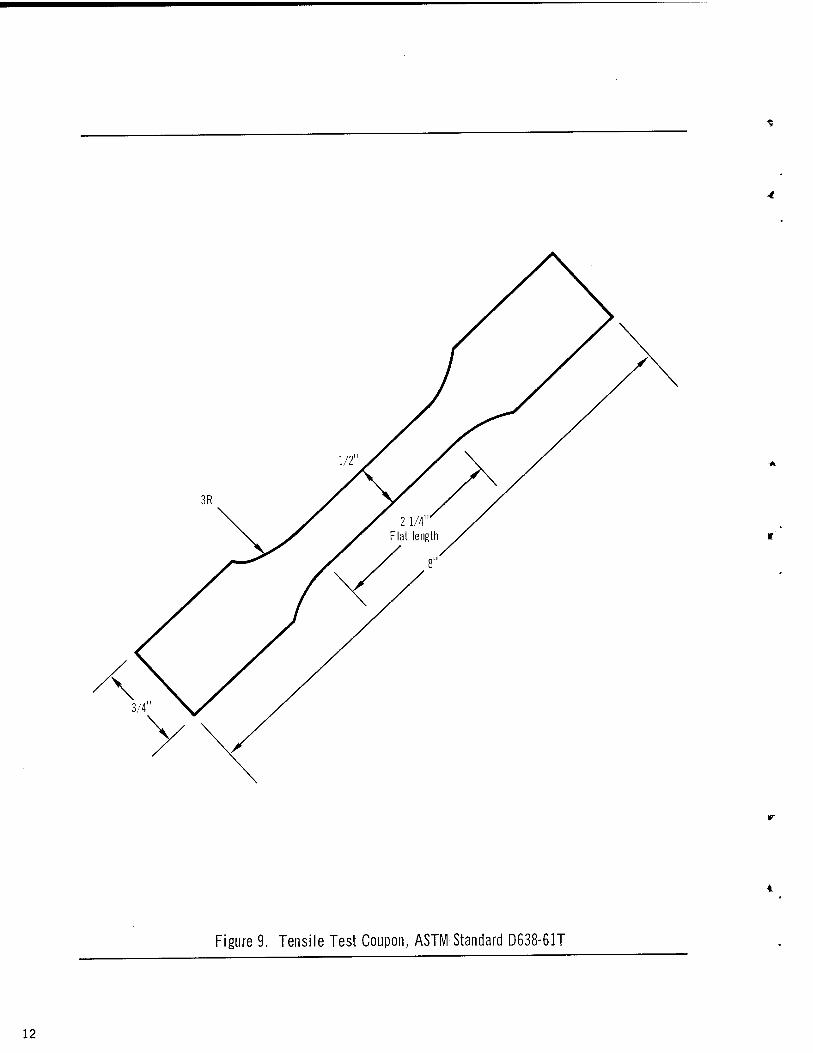
Figure 9. Tensile Test Coupon, ASTM-Standard D638-61T
12

Figure 10. "Joined-Jaw" Test Grips.
A special test fixture (fig. 10) was utilized for all the tests. The grips consisted of two clamp-type jaws constructed in a manner such that the line of action of the load train coincided -with the axis of the specimen. The jaw faces were lapped together so that the clamping force of the jaws would be evenly distributed across the width of the specimen. The upper and lower jaws were connected by two arms on either side of the specimen and the arms were connected to the jaws by removable pins. The specimens were then mounted in the jaws with the arms connected; the assembly forming one rigid body. In this way no load or twist was placed on the sample. After the two jaws and the specimens were installed in the container, the two pins were re- moved to allow the upper and lower jaws to move independently of each other.
The stiffness and strength of the metallic candidate materials permitted the use of mechanical extensometers, although some failures occurred at the points where the extensometer was attached.
The thinness of the polymeric films to be evaluated (0. 001 to 0. 005 in. ) made the direct attachment of strain transducers impossible without notice- ably affecting the strength of the material and introducing a significant non- axial load factor into the test results. The cryogenic temperatures placed additional restrictions on the test method because space was limited when testing with the cryogens and there could be no visual observation of the test specimen during the tests. Effective gage lengths were determined for each material at 75°F and these lengths were applied to the load elongation data at -320°F and -423°F.
13

The gage length determination was based upon a method described by Smith (ref. 4). A correction for deformation in the cryostat load train was made and applied to the machine crosshead displacements.
At 7 5°F, the head travel rate for the polymeric films was 0.5 in. /min. except for the Tedlar and the polyurethane film. Due to the high elongation of those materials, the head travel rate was 5. 0 in. /min. At -423 F, the head travel rate was 0. 1 in. /min. except for the Mylar "A" and the glass flake material (polyester backing), which were tested at 0. 5 in. /min. It had been planned to keep a constant head rate for all the temperatures; however, specimen breakage at the jaws subsequent to the -423 F testing of the Mylar and glass flakes became a factor and the rate was reduced to 0. 1 in./min. At -320°F, the head travel rate for the polymeric films was 0. 1 in./min.
At all three temperatures, the metallic foils were tested at a load rate of 1, 200 lb/min.
For the polymeric films: All of the materials showed rather high ulti- mate elongations at room temperature; the seilon was highest, 236% and H-Film was the lowest, 24%. As was expected, elongation became much less at -320°F and -423°F. The highest average elongation at -423 F was that of the glass flake material, 2.71%, which was a measure of the polyester film backing. In most cases, strength increased with decrease in tempera- ture. Highest strength in liquid hydrogen was Mylar UA", 40, 000 psi, and lowest was glass flake material, 8,400 psi.
In comparison with published data, the elongation of Mylar at -320 F agrees with the findings of Miller (ref. 5) (5. 11% vs. Miller 5. 1%) although ultimate strength does not (36, 500 psi vs. Miller 44, 000 psi). Strength data for Mylar MA" agrees quite well with Mowers (ref. 3) at all test temperatures, but ultimate elongation is at considerable variance; limited strength data for H-Film agree at the given temperature (18, 000 psi vs. 21, 300 psi at 75 F and 24,'000 psi vs. 25, 000 psi at -320°F).
For the metallic foils: Elongations of all three materials at the three temperatures were lower than had been expected. None of the values approached those reported in Cryogenic Materials Data Handbook (ref. 6); the strength of the copper as a function of temperature was much lower, while the strength of the nickel was much higher. The properties of the electro- deposited foil differed considerably from the data for the rolled or wrought material. Rough edges of the tensile coupons were suspected of having caused the low values. Subsequent work during this investigation (reported in Appendix A on liner electrodeposition) indicated that process variables contributed to the low elongation values.
Thermal Contraction Tests. — Thermal contraction tests were made at temperatures between 75° and -423°F with a quartz tube dilatometer. The ASTM D-696-44 test method was used. Results are shown in fig. 11. Smooth curves have been drawn through the four test points.
14

.002
.010
.012
.014
.016
.018
-ResinKb« A.B-
Resin ftogLL-
^ag0Rp/5c
Myia
Nicket plating
w-^w^
7 $ 4/
-400 -300 0 -200 -100
Temperature (°F)
Figure 11. Contraction Curves of Candidate Liner Materials
15
A special holder was used for the relatively rigid metallic foils. The holder could not adequately support the polymeric films, and therefore a different technique was used. The films were cut into rectangular strips 4-1/2-in. wide and 6-to 24-in. long (depending upon the material and film thickness), rolled into l/2-in. diam tubes, and tied at two places with Dacron string; the rolled tube effectively supported the quartz dilatometer rod.
Measurements were taken at 75°, -103°, -320°, and -42 3 F with two specimens of each material. Reproducibility of the data was excellent. As a check of the rolled tube test method for the polymeric films, the thermal contraction of a fluorocarbon film, Teflon FEP*, was also measured and compared with the data given in Mowers (ref. 3); the data were in agreement. The thermal contraction values for nickel and copper agree with those of the Cryogenic Materials Data Handbook (ref. 6) and Scott (ref. 7).
Unstressed Ambient-Temperature Permeability. — To provide a rela- tiv ely-sTrr7pTe~Tol:^^ liners were tested in an unstressed condition with the ambient-temperature diffusion cell and support equipment shown in figs. 12 and 13. The cell consists of two demountable brass disks, each with a cavity 3 in. in diam and 1/4 in. deep. The specimen to be tested was clamped between the two disks and acted as a divider separating the two cavities. O-ring seals prevented air leakage into the cavities. Air was evacuated from the collecting cavity and high-purity argon was introduced and held at atmospheric pressure. Hydro- gen or nitrogen at 10 cu cm/sec flowed through the specimen and into the argon-rich cavity. After allowing time for diffusion of a measurable amount of test gas as determined by trial and error, the mixture in the collecting cavity was flushed out with a stream of argon and was introduced into a Linde Molecular Sieve column of a Perkins-Elmer Vapor Fracto- meter. The quantity of test gas diffusing through the specimen was indicated as a recorded trace of the signal from a thermal conductivity cell in the instrument. The instrument was standardized by injecting known volumes of gas into the system.
From the total amounts of diffused hydrogen or nitrogen, the permea- bility constants of each specimen were calculated from the following equation (Fick1 s Law):
V
-■-Manufactured by E. I. duPont de Nemours & Co.
16

fiäibi
SI V»i
«tat Figure 12. Open Permeation Cell with Test Specimen.
Figure 13. Permeability Measuring Equipment.
17
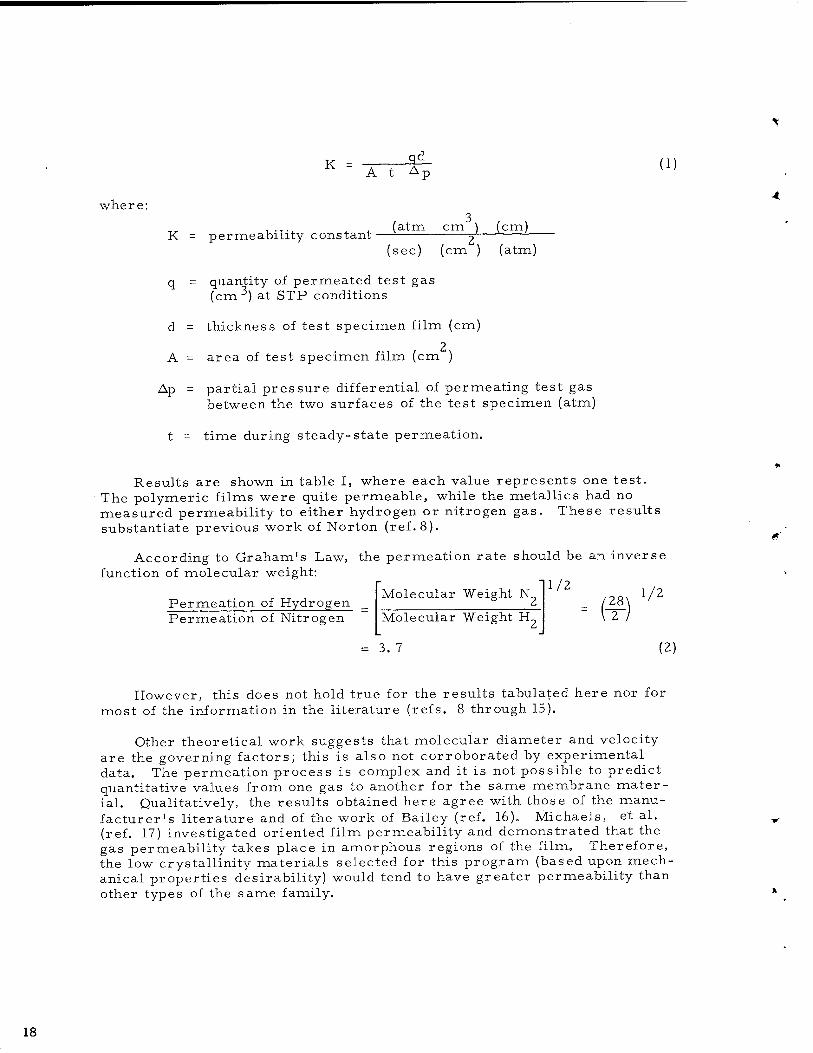
K S°_ (I) K ~ A t Ap W
where: 3
, .,. , (atm cm ) (cm) K = permeability constant y
(sec) (cm ) (atm)
q = quantity of permeated test gas (cm3) at STP conditions
d = thickness of test specimen film (cm) 2
A = area of test specimen film (cm )
Ap = partial pressure differential of permeating test gas between the two surfaces of the test specimen (atm)
t = time during steady-state permeation.
Results are shown in table I, where each value represents one test. The polymeric films were quite permeable, while the metallics had no measured permeability to either hydrogen or nitrogen gas. These results substantiate previous work of Norton (ref.8).
According to Graham's Law, the permeation rate should be an inverse function of molecular weight:
"U/2 Permeation of Hydrogen _ Permeation of Nitrogen
Molecular Weight N
Molecular Weight H = ( 28
1/2
3. 7 (2)
However, this does not hold true for the results tabulated here nor for most of the information in the literature (refs. 8 through 15).
Other theoretical work suggests that molecular diameter and velocity are the governing factors; this is also not corroborated by experimental data. The permeation process is complex and it is not possible to predict quantitative values from one gas to another for the same membrane mater- ial. Qualitatively, the results obtained here agree with those of the manu- facturer's literature and of the work of Bailey (ref. 16). Michaels, et al. (ref. 17) investigated oriented film permeability and demonstrated that the gas permeability takes place in amorphous regions of the film. Therefore, the low crystallinity materials selected for this program (based upon mech- anical properties desirability) would tend to have greater permeability than other types of the same family.
18

TABLE I
UNSTRESSED ROOM TEMPERATURE PERMEABILITY CONSTANTS
Material
Hydrogen gas Nitrogen gas
/l0~9(cc at STP)cm^ /l0"9(cc at STP)cm^
\ cm sec atm / \ cm sec atm /
Mylar "HS" (1/2 mil)
37.0 22.0 33. 0
3. 4 1. 7
Mylar "A" (2 mil)
8.6 13. 0
1. 1 1.6
Polyurethane Seiion UR29E (5 mil)
50.0 54.0
7. 1 9-0
Tedlar BG30WH (2 mil)
5. 7 6.9
3.8 2. 7
H-Film (1 mil)
23. 0 24.0
1.0 1.4 0.9
Silver (10 mil)
Less than 0. 04 Less than 0. 04a
Less than 0. 04^ Less than 0. 04
Copper (5 mil)
Less than 0. 02 Less than 0. 02
Less than 0. 02 Less than 0. 02
Nickel (7 mil)
Less than 0. 0 3 Less than 0. 0 3
Less than 0. 03, Less than 0. 03
No detectable hydrogen for given test time. Values are for limit of apparatus for given time period.
Values for nitrogen are probably lower than those for hydrogen.
19
Resin System Evaluation
Five steps were taken to select a suitable resin system for use at cryo- genic temperatures. The five steps were:
(1) Selection of 11 candidate systems.
(2) Winding of NOL rings using the candidate resin systems to screen out those systems with undesirable processing characteristics.
(3) Testing of NOL rings wound with candidate systems to screen out systems contributing least to composite structural proper- ties at cryogenic temperatures.
(4) Preparation and testing of flat panel, filament-wound composite using resin systems not eliminated in (2) and (3) for uniaxial cyclic behavior at cryogenic temperatures.
(5) Measurement of thermal contraction of composites made in (4) above to ascertain reasonable compatibility with liner candidates.
Candidate Systems. - S-994 glass roving with HTS finish was used for filament-wound test specimens since it represented the most advanced product available. Mechanical properties are superior to E-glass/HTS from cryogenic to puddling temperatures (ref. 1 and 18).
Eleven candidate resin systems were selected. For the most part, the resins were epoxies chosen because of their structural properties and dimen- sional stability. Specific epoxies were selected on the basis of high purity, poly-functionality, and low chlorine content. Hardener choice was based upon imparting flexibility at cryogenic temperatures.
One polyurethane system was chosen for evaluation because of its ex- cellent cryogenic properties and its anticipated use in this program to bond the liner to the fiber glass. Room temperature curing systems were exten- sively investigated since some of the liner materials and adhesives could have been adversely affected by elevated temperature curing. Elevated temperature curing systems were evaluated, however, in case a system requiring preimpregnation of resin with the glass (prepreg) would be required for very large booster-tank construction.
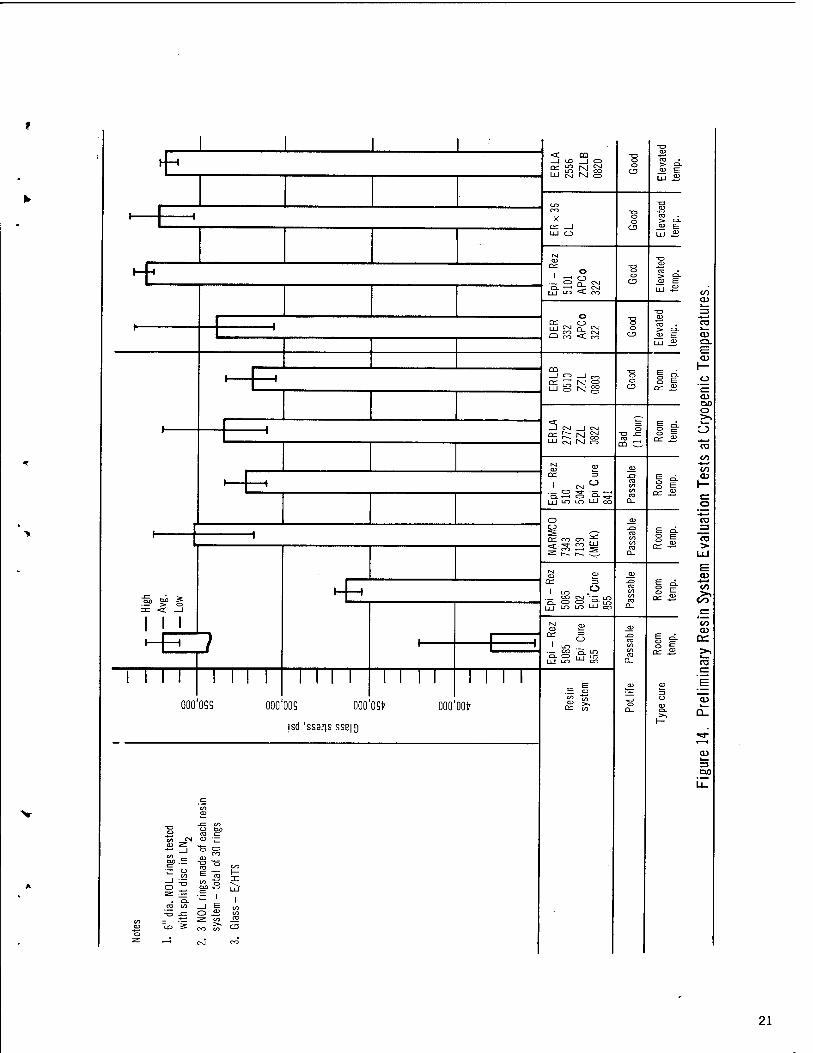
NOL Ring Screening. — Eleven resin systems with characteristics out- lined above were screened prior to the present program. The evaluation was made with 6-in. -diam NOL rings. Processing characteristics were deter-^ mined during winding. The resin systems were tested at -320°F with a split disk apparatus. The results are shown in fig. 14. On the basis of the screen- ing, three resin systems, A, B, and C were chosen for further testing.
System A was comprised of a highly purified triglycidyl derivative of para-amino phenol (ERLA 0510) and a condensation product of diethylene triamine and acrylonitrile (ZZL 0803).
20
1 1 1 1 -a
H-H <Z ÜQ —1 CD | c=> rv- LO r**| Osl ^ m rH co UJ cvj N o
"8 O
CD
ca > O-
LU &
U3 CO "O
-o
ca > Q. X o
C3 LXJ O LU 3
Epi -
Rez
5101
A
PC
o 32
2
"8 o
CD E »- -1
LU Ä
CD Cd o LU £J o. <>j
"S o Dm < n CD <u E
LU i£
ca -> 2 —' co "8
O i £ a Sr LU S M g CD cc Ä
1 CVJ 1 CNJ
S ^ ö s LU IN No
13 o
ca 03 C-
ei =>. 1 o E
S 2? cn = o>
1 «M« CD ^3" •— t~H o..—i es ,=>- *a-
ca co o &=
cc J2 ca LLJ LO LO LU oo
O O
_CD
ca co 1 E o.
8 f, tf«-m Lü ca cc -S ^ r- r- S-
1 LO .0
-O 03 co § 1
.25' > o 3= <C —1
■aSSö.S LU LO LO LU co
ca a_ a= Ä
1 1 1
Epi -
Rez
50
85
Epi
Cure
85
5
_CD
ca co
i . ) 1 , o fc
D£ .£2 1 ' ca
Ü_
llll 1 I 1 1 llll MM MM CD
.= 5 OOO'OSS ooo'oos ooü'GQt ooo'oot^
SS « CC co
"o Q_
O
CD 0_ =^,
jsd 'ssajjs SSE|9
e= CO CD
"to CM » -^ eu s: M-
■+-■ I O CD
gP.E x,-6 co
NO
Lri
it di
sc
ngs
m -
tota
l 1—
ÜJ
1 TO co | E ^ J= o «2 CO
to _ *i z: w Q3 CO == ^ ^ CD o
—• ■xj CO
co cu
a3
CD DO O
CT3
co co CD
O
ca
co
co a>
DC
fö
<u
Q_
=3 Ö0
21
System B was a mixture of two epoxy resins and a hardener. One epoxy was a commercial grade diglycidyl ether of bisphenol A with no modifier or diluent and a hydrolyzable chlorine content of 0.3% (EpiRez 510, epoxy equiv- alent weight of 185-200). The other was an epoxy based on an aliphatic polyol (EpiRex 5042) which improves flexibility and impact characteristics at ambient temperature. The hardener was a liquid mixture of aromatic poly- amines including methylene dianiline (EpiCure 841).
System C was an elevated temperature curing system comprised of a highly purified, low chlorine content version of EpiRez 510 (EpiRez 5101, epoxy equivalent weight of 185-200, chlorine content of 0. l%maximum), and a complex highly functional polyamine of an aromatic nature having no ali- phatic side chains or diamines (APCo 322, active hydrogen equivalent weight of 34).
The following is a tabulation of the chosen resin systems which shows stoichiometry and cure conditions:
Resin/Resin Hardener (phr) (phr) Cure
(1) System A ERLA 0510/ 100 72 Room Temperature ZZL 0803
(2) System B EpiRez 510-5042/ 80/20 22 Room Temperature EpiCure 841
(3) SystemC EpiRez 5101/ 100 15 Room Temperature- APCo 322 gel
150°F - 1 hour 250°F - 3-1/2 hours
Of the room temperature curing systems which could be used in the wet filament-winding process, systems A and B provided the best glass stresses for NOL rings at -320°F. System A had a longer pot-life than system B.
The particular polyurethane system (Narmco 7343/7139*) proved unmanageable in wet filament-winding because of the very high viscosity. Viscosity reduction by solvent dilution was impractical for use on any larger scale than that of winding because of the very high viscosity. Viscosity reduction by solvent dilution was impractical for use on any larger scale than that of winding rings.
«Obtained from Narmco Materials Division, Whittaker Corporation
22
The short pot-life of a system of bisphenol A type resin (ERLA 2112) and a primary amine having a long flexible molecular structure (ZZL 0822) were unacceptable.
System C, an elevated temperature curing system, provided the highest glass stress for NOL rings at -320°F of any system tested.
Uniaxial Cyclic Tests at Cryogenic Temperature. — Resin systems A, B, and C were used to fabricate simulated filament-wound composites. Two plies of single-end S and Z twist S-994/HTS glass filament at 100 ends/in. per ply were wound on a flat mandrel at 10°, two plies were wound at -10°, and six plies were wound at 90° to simulate a filament-wound composite. The part was vacuum bagged and cured at conditions tabulated in the previous section.
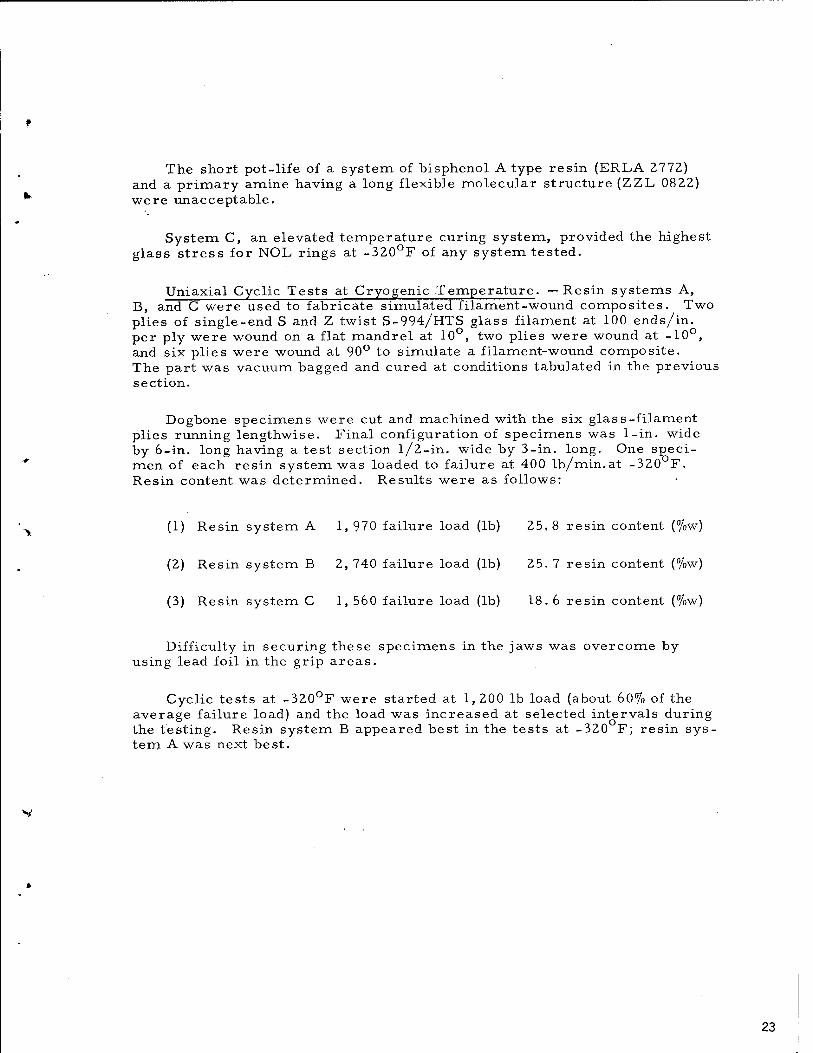
Dogbone specimens were cut and machined with the six glass-filament plies running lengthwise. Final configuration of specimens was 1-in. wide by 6-in. long having a test section l/2-in. wide by 3-in. long. One speci- men of each resin system was loaded to failure at 400 lb/min.at -320 F. Resin content was determined. Results were as follows:
(1) Resin system A 1, 970 failure load (lb) 25.8 resin content (%w)
(2) Resin system B 2, 740 failure load (lb) 25. 7 resin content (%w)
(3) Resin system C 1, 560 failure load (lb) 18. 6 resin content (%w)
Difficulty in securing these specimens in the jaws was overcome by using lead foil in the grip areas.
Cyclic tests at -320°F were started at 1, 200 lb load (about 60% of the average failure load) and the load was increased at selected intervals during the testing. Resin system B appeared best in the tests at -320 F; resin sys- tem A was next best.
23
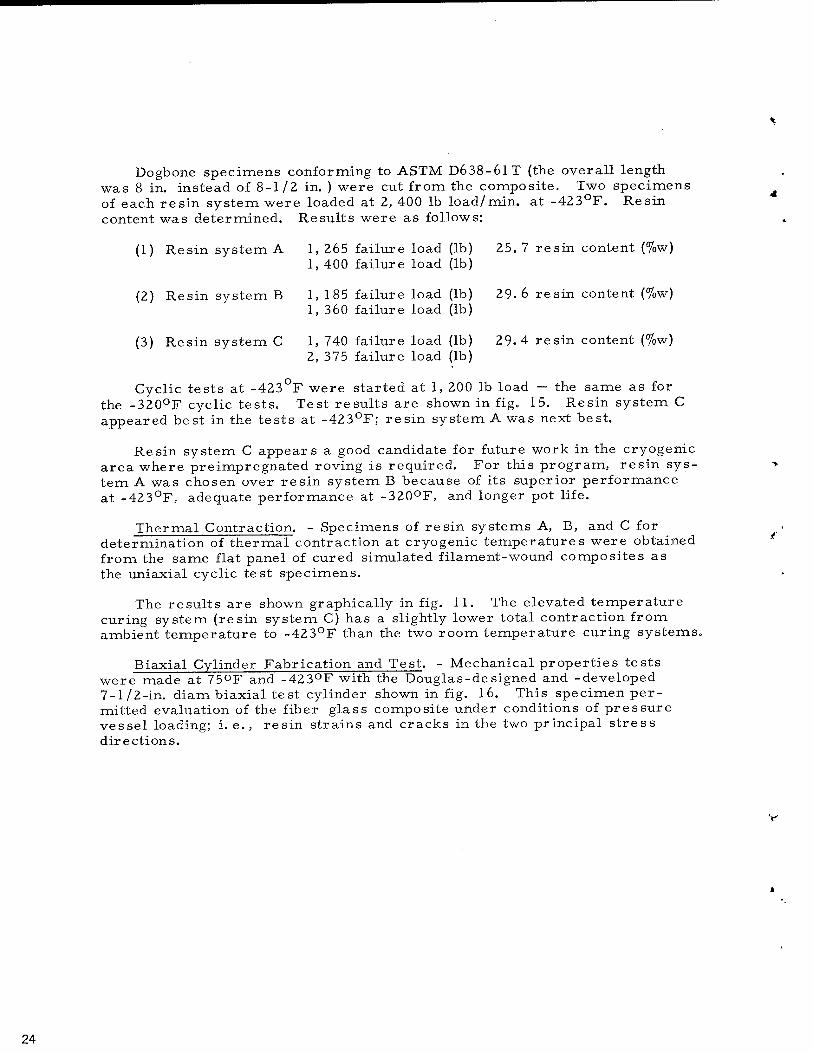
Dogbone specimens conforming to ASTM D638-61T (the overall length was 8 in. instead of 8-1/2 in. ) were cut from the composite. Two specimens of each resin system were loaded at 2, 400 lb load/min. at -423°F. Resin content was determined. Results were as follows:
(1) Resin system A 1, 265 failure load (lb) 25. 7 resin content (%w) 1, 400 failure load (lb)
(2) Resin system B 1, 185 failure load (lb) 29.6 resin content (%w) 1, 360 failure load (lb)
(3) Resin system C 1, 740 failure load (lb) 29.4 resin content (%w) 2, 375 failure load (lb)
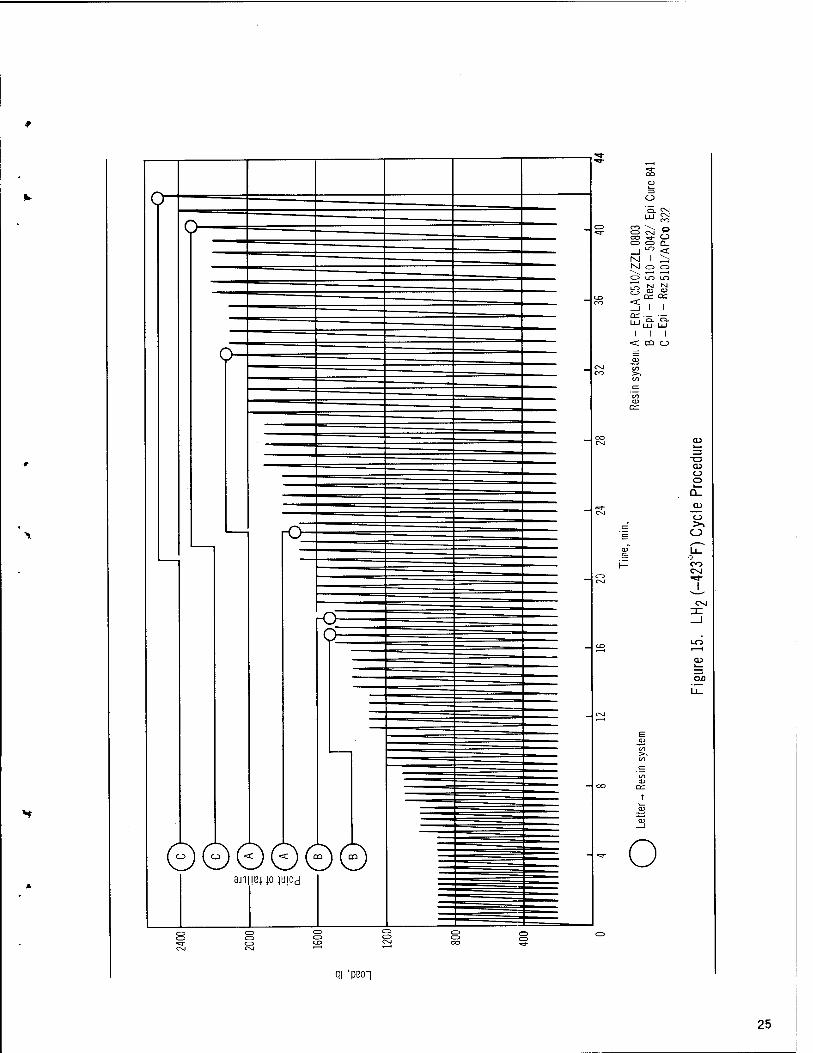
Cyclic tests at -423°F were started at 1, 200 lb load — the same as for the -320°F cyclic tests. Test results are shown in fig. 15. Resin system C appeared best in the tests at -423°F; resin system A was next best.
Resin system C appears a good candidate for future work in the cryogenic area where preimpregnated roving is required. For this program, resin sys- tem A was chosen over resin system B because of its superior performance at -423°F, adequate performance at -320°F, and longer pot life.
Thermal Contraction. - Specimens of resin systems A, B, and C for determination of thermal contraction at cryogenic temperatures were obtained from the same flat panel of cured simulated filament-wound composites as the uniaxial cyclic test specimens.
The results are shown graphically in fig. 11. The elevated temperature curing system (resin system C) has a slightly lower total contraction from ambient temperature to -423°F than the two room temperature curing systems.
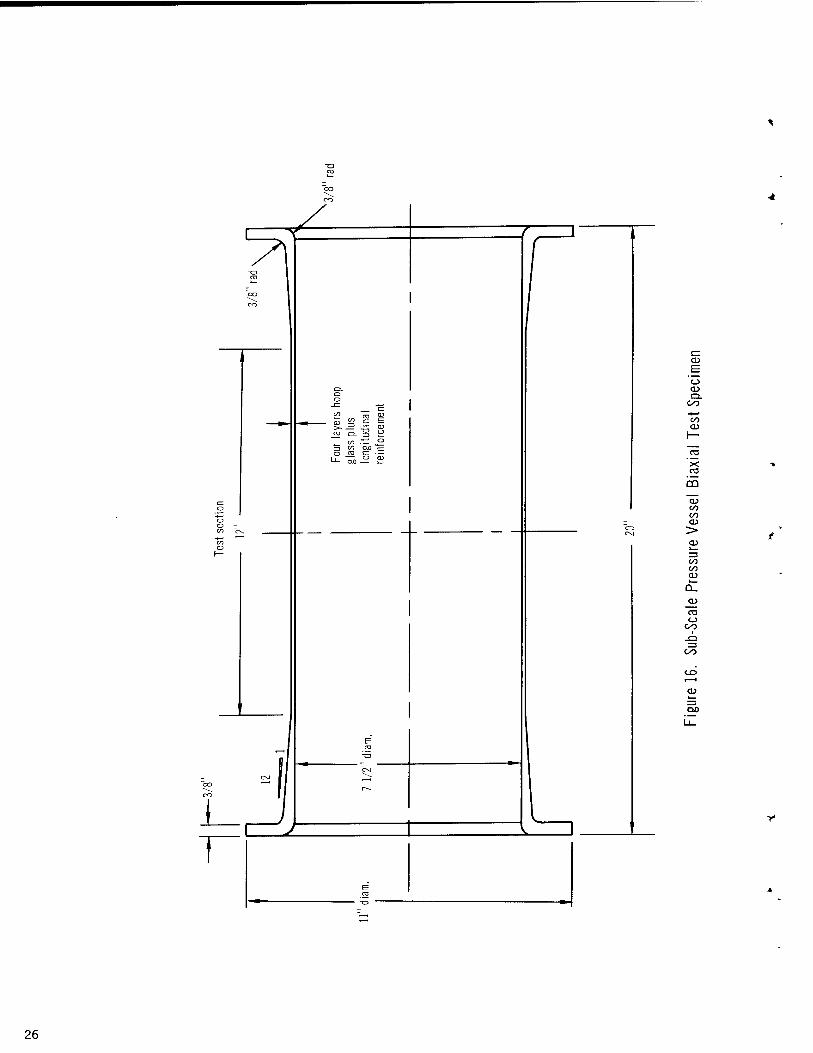
Biaxial Cylinder Fabrication and Test. - Mechanical properties tests were made at 75°F and -423°F with the Douglas-designed and -developed 7-1/2-in. diam biaxial test cylinder shown in fig. 1 6. This specimen per- mitted evaluation of the fiber glass composite under conditions of pressure vessel loading; i. e., resin strains and cracks in the two principal stress directions.
24
CNJ
LU ro
O on C_J c~> (~) n _.l
LO <c M 1 ^7 M C-3 <—> \ C 3 in LO
LTD CD CD fV Ld
<T _l 1 1 fK — LU Q.
LU LU
<c CÜ O
O O
o O
CO Csl
CVI
Z3
T
o
qi 'peon
25
£ ,„ s
,_ oo := ü
no — £:
O CD Q.
CO
co CD
X
in CD oo co CD
co co CD
CO CJ
CO
CO
CD I—I
CD
=5 00
26
specimens were tested. Results are shown in table II (values are averages of three tests at -423°F and two tests at room temperature).
TABLE II
TENSILE-LAP SHEAR
Film Thicknes s
(Mil) Adhesive RT
(psi) -423°F
(psi)
Mylar Mylar
2 2
Narmco 7343/7139 EC 2216 B/A
620 695
903 626
Tedlar Tedlar
1 1
Narmco 7343/7139 EC 2216 B/A
880 1,245
1,946 772
H-Film H-Film
2. 5 2. 5
Narmco 7343/7139 EC 2216 B/A
555 1, 320
2, 089 2,663
On the basis of this work, the urethane/diamine adhesive was used for the bonding of all polymeric liner layers except the H-Film liners, which were bonded with the modified epoxy. The polyurethane adhesive was used in all cases to bond the liner to the fiber glass composite.
S994 Single end roving, 100 ends/inch
Epoxy resin . system
Liner
No. 9943 Glass cloth
■ Adhesive
Figure 17. Structural Wall Cross-Section
27
Biaxial cylinder structural wall hoop direction schematic
Hoop glass only (0.0083 in.2)
v//ft///////////;//? w;////jr777t
Hoop glass and fill cloth (0.0083+0.0021= 0.0104 in2)
1/ / n1111 > > i i n i /> 111 n 111, / / / i , , ,-nx
V,,,//////////////////////////f////\
Hoop glass resin (glass 0.0083 in2); for resin content by weight
-^ of 30%,resin area = 0.0077 in?, _> total area= 0.0160 in.2)
ij>>/),,iii)iinn>>>iiiiiiiiijii>n
Hoop glass, fill cloth, and resin (glass 0.0104 in.2; for resin content by weight of 30%,resin area = 0.0097 in2; total area =0.0201 in.2)
•••••••• ••••••••••«•••••••ft«
Total composite (hoop glass, fill cloth, longitudinal cloth, and resin) (glass 0.0104+0.0203= 0.0307 in.2; for resin content by weight of 30%, resin area= 0.0287 in.2; total total area = 0.0594 in.2)
Figure 18. Biaxial Cylinde
28
Biaxial cylinder structural wall longitudinal direction schematic
v ///////!///// //// //// ii n/iit mim
k \ltl/t///tU/l/t/llliU>'>>i>>>>">>n _^
Z 21
Longitudinal glass only (0.0203 in.2)
V/)////////!>/>/>//,,,,,///l/llII>>>\
3 k Ullllllllllltl/il'l'ii'iiiiiiii'iiii*
Longitudinal glass and resin (glass 0.0203 in.2; for resin content by weight of 30%, resin area= 0.0190 in.2; total area = 0.0393 in.2)
ial Cylinder Structural Wall Schematic
Total composite (hoop glass, fill cloth, longitudinal cloth, and resin)
(glass 0.0203+0.0104= 0.0307 in2; for resin content by weight of 30%, resin area =0.0287 in.2;
total area =0.0594 in.2)
Table III presents a compilation of pertinent fabrication information for each test cylinder.
Test: The objectives of the work with the 7-1/2-in. -diam cylinders were: first, to establish the ultimate strength of the cylindrical configura- tion at ambient and cryogenic temperatures and second, to determine the cyclic resistance of the various liners as a percentage of the ultimate strength of the cylinder.
The test cylinders were instrumented to provide two sets of longitudinal deflection measurements and two sets of circumferential deflection measure- ments. The specimens were tested in a vacuum chamber, which was capable of withstanding the force of an ambient or cryogenic temperature specimen failure. For ambient temperature pressurization, helium gas was used to pressurize a water reservoir which fed to the specimen. For cryogenic temperature pressurization, a cryogenic pump was used to pressurize the feed lines directly. In some instances, the pump capacity was exceeded by liner leakage, in which case a helium overpressure was used to increase the pressure (described below for each tested specimen).
A schematic diagram of the system for the cryogenic testing is shown in fig. 19; the system for the ambient temperature testing was similar, but considerably simplified. A list of instrumentation for testing follows:
(1) Recorder oscillograph.
(A) Mfg. : Consolidated Engineering Corporation, Model 5-119. (B) Range: 0-4 in. deflection. (C) Accuracy: Recorder only ±1% of full scale; complete system,
±3% of full scale.
(Z) Deflection transducer.
(A) Mfg. : Micro Systems, Inc. , Model D01AV5. (B) Range: 0-2 in. (C) Accuracy: ±1%.
(3) Pressure transducer.
(A) Mfg. : Statham Corporation. (B) Range: Various. (C) Accuracy: ±1%.
(4) Strain gage.
(A) Mfg.: Budd Co. , typeC6-121C. (B) Range: 0-3% strain. (C) Accuracy: ±1% ambient temperature, ±10% cryogenic
temperature.
29
2 O i—i
H < Ü n «
w Q
W
pq
H
I* U
« H H W
Q i
U 2
,-. ft .H cd
73 CD
en T* p, h
sO 00 NO O CX) CO CO H t>r^vo TJI o o oc 0s CO CO O CM -rH O t~- CM 00 vP ■* CM O rl •—1 M -H o vOht^TM^> to co rH m 00 o vO CM ■* CM CO "O TJ1 vO in sc ■—i CM m NO vo V CD ■ A ,G G •—I t—i —I
73 CO 'H
«! 1 P.IM
CJ 4->
Ö Ö CD 0 _ G 0
•rH ,, ■—i ro sO CO vO o m ^H CO in CM 00
o CO >•
o t—c CM r~\ o ^o to CM in in o 00
G CM CO CO CO CM CM CO CO CO CO CO CO
-H
CO S^ <u cü — 4-» «
o o o o- o o o o o o^ 0^
co CO CO CO CO CO CO CO CO CO CO ^4 i—l ,—I ,—1 1—1 t—c ^H ^H i—i ■—i rH
r~ r- [- c- r~ [- r~ [^ [^ r~ r~
CD CO CO CO CO CO CO CO CO CO CO CO
> ^ ■* "# Tf -* ■* Tf Tf •* •* ■*
-rH co CO CO CO CO CO CO CO CO ^ M ^ CO CO
CD t- r- t~ r~ r~ r~ r- t^ r- n t~ pq r-
O O o o O O O O O <o^ O 73 < U U u o o O O U O •J3 U -o O
2 s s S -15-1 CM ^ CM S
w s s 2 Pi PH Pen Pi PH CM PH CM Pi <! <! <; < < < <; <! < U<! O < £ 2 £ £ £ % z £ % wzw g
,-. r5 o CO
ID
o CtJ
4)
A X A ^H ^J
G • rH
o cd
V cd
ü cd
Ü 0 cd cd
CD CD ID D CD
CO CM O O
CM o O
in CM CO
CM CM CM CO
CD rO o o
O O
O rQ
O O
O O O O ,P
d in in in
X o 1 o 0
u .rH
rg CO
P. Cd h
is
CO
P.
o CD P.
1
CO
p.
1
CO o o
o 1
CO PH
1 1
CO CO
0
u CD
G
td cd cd . cd cd cd
£ is u i*
u u u
•r-4
►H
ro CO CO CO m CO CO CO
i—< ffi tu o
73 CD CO
CD o CO
13 ID
T3 CD
T3 CD
-4->
a ID G
<
cd
Ü PQ
rH
CO r-H
73 ectr
ofo
ri
ckel
as
s F
lak
CM
PH
t> G 0
r-H -H
Ü PH-
cd
ectr
ofo
r:
ckel
ec
tro
for:
< CD ^
•Fil
m
•Fil
m 0
m O
O S
13 CD
H i—1 .r-l i—1
W2Ü CD CD
H ,-H .rH ^H -rH '
ffi K W to
nJ
6 o CO V ^O r~ 0 —i ■*
d i—i Lf) 00 o> -1 ^ ^ "^ ■"" CM CM
1 1 CM
1 u CM J, CO CM CO rt CO CO i—i -H CM CD
73 G
> > > > > !> f> > > > > t> a, PH PH PH PH PH PH PH PH PH PH PH
• ri w </> w en in UD W t/) W <y) w W ^ u
.So«^
o
d CD >
CD
A 73 cd cd 1—i
In 0 rH
<4H CD
CO ,P
<+4
CD 0 3 4->
r-H
cd > ■ s 1—t
73 G
■i-4
0 O ffi ID CO -H -- 0
rO
73 G
T3 cd
u o
rd CO
cd CD
■2 -3
o u Pi <
PH I
d cd •H
0 cd S> PH Ö cd
d • rH CO
1
X b CO
CD u
71 U u-t d
0
d CO
CD
- CO CO cd
r° u 73 *H Tl, n u 3 CD M H-i
4H 0
rH u d
0 Si • H <D rH ,0
73 CD
CD H->
■rH O ^1 -rH 3
U d CD
u 0 CD H-1 pq
"+H +H d ß Ü <
CM
CM
SH
CD
O
0 u d
• rH
rH-G
p< . 73
rH CO ^ G CD CD 0 0 O
PH Pi PH rO w
30

5
/ >
a -g M
v y s
7 itJfe^- E= MO
CO CD
O
O ■a t= ca
CO
o
O
CD
CO
o 00
00 CD
00 00 CD
00 00 CD
CD )■_ =3 00
Tt
31
(5) Recorder strip chart.
(A) Mfg. : Leeds and Northrop Co. , Model 69953. (B) Range: 9-10 mV (0-10 in. ). (C) Accuracy: Recorder only +1/2% of full scale; complete system,
+3% of full scale.
(6) Thermocouple.
(A) Mfg. : Revere Corp. of America, Copper Constantan, WW60546-26GA.
(B) Range: -430°F to +750°F. (C) Accuracy: +5°F.
(7) Pirani vacuum gage.
(A) Mfg. : Consolidated Vacuum Corp. , Model GP-110. (B) Range: 2-2, 000u. (C) Accuracy: +2fi for 2-50p., +5% for 50~500fi, not calibrated due
to compression of scale from 500 to 2, OOOu.
A review of results is shown in table IV. A detailed description of each vessel tested follows.
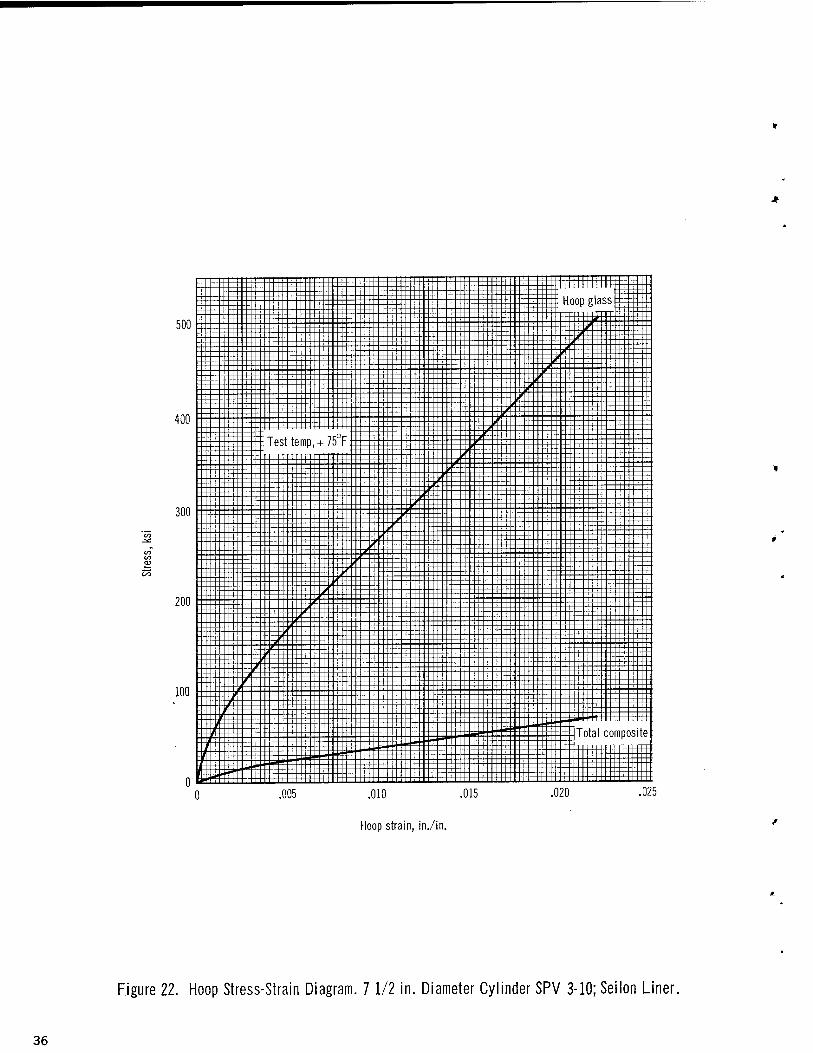
Cylinder SPV3-10: This polyurethane lined cylinder was tested for ulti- mate strength at ambient temperature. Internal pressure at burst was 1, 100 psia. The failed specimen is shown in fig. 20. The elongation data versus pressure data are shown in fig. 21. The stress versus strain data are shown in figs. 22 and 23. The circumferential glass filament stress is based on the assumption that only the single-end hoop glass carries the load; the lon- gitudinal glass filament stress is based on the area of the warp glass of the longitudinal woven cloth; and the total composite stress is based on the total volume of glass plus the total contained resin content (including adhesive) in the fiber glass shell. For this cylinder, the strength of the liner at the given strain was so small, compared to the fiberglass shell, that the liner strength was neglected in computing the stress-strain data.
Pressurization during the test was controlled to cause approximately 2% hoop strain/min.in the cylinder.
Longitudinal deflection measurements were made from flange to flange of the cylinder. A correlation testwas usedto permit the conversion of over- all elongation to effective strain in the test section. The testwas made at ambient temperature and assumed to be applicable for the cryogenic testing also. All of the longitudinal strain measurements given for the test cylinders were calculated with the effective gage length.
32
Ü £ n H en W H
« H Q £ i—i -1
>
w J rt pq w < H H W
I—I
9 u
i
r^ K^
■* 0) (Ü
fM CO r^ £ w> (0
no 4>
it a
Oj ctj "J CD
en 41 BO .
Ö0
bo . 0)
bo . 41 M
ß w
U
bo . "3 to
4> 41
to
41 (t ^ rt er- nj cr^ nj r- rt r^ o r^ CO ^ 41 .M on
it
-H bo ^H 00
n) 41 4)
M
CD
^ co
2 « - bo
X in
r^ 00 Ü
i, rt L, ^ - , rö u nj , m n) to u u rt (ti
(0
3
—1 U >- U
u Hi 41 Ö <u
■■i ai i-I W
CO f-l a
►-1 CO
tu ^ ß <u
t-1 CO U in
h a 4) fi 4)
i-l CO
41 g 3
a, 4) 4) w
to u ^ ft ^^ U to
h ft ß V
•rf a) J CO
Q< —
o £; j3 IM .—i o o r^ o^ vD O O vO on vO vO CO m o
. c
2 * <3 M
t\i f\i ^ ro o d O ^ ^H (\i o d d o o d
rQ r^ & ,Q
o o m ro [-- vO -H o o -H f\] xf CO o o O^ fM
o MD H in ■* m -^ r- oo -1 ■* CO CO o o in r*- S d ^ vo r*- on ^) m m co m o in rt on ND ^£1 rvj in id 3 _^" r-T ^ S u
d
-4J -.-l to to <D ft
(ti o m o o o o o o o o o < O ^H *£> < o o o o o o o o
rn W
so r- vO NJD vO M o o vO sD vO
Z z -T -." -T oi a>
Q a
en
H CO S "
>> 3 Ü
TO U
d * CO
u ■ H -
u o
3 u to o
+->
IS 41
s o
.—I
o u Ü o
fn « "O t! "ö ^ o u u
A rt
^ 13 C it
u u u 3 n" « n « p >> s >. dJ s !>> s
PQ A (t A ni pq U U Ü ft u U Ü
Sft 11 o
in in m ro CO CO on CO CO CO CO CO
r^- r- r- no f\J r0 rJ (M oO (M <M CM ^ ^ ■* •* Th ■^ ■* T?H Tf
H~ I 1 i i 1 1
a> (0
^ 0)
h ■5 < < CO r—1
0) g 4) ^ i—i " | i—i U a •-i
A
3 o
it *< it
f-t
S
•i-i
1
01 A! o A
t u to
.—1
ft H 3 s X s H ffi CO s 0
6 o ^ r- .—i CO o ^ vO in T—( (N] 00 ^H rJ INJ o^ ^ 1 i 1 I i 1 1 1 I 1 1 i
<D co ■—i co CO r—i rj on —1 i—i I—I CO (M -0 g > > > > > > > > > > > >
A A ft (In ft ft A A A ft ft A r-l w w W CO CO CO U3 tn tn CO CO w
u
a. OO
g H y a, c Q) a> X 00 O
Tl ? >• A T)
^J Ö
ot .£ ts ^H a) ^ <D
41 3
D. g
as 8fl
rt Ö CO § "
+■* 10 1H
0
aj 10 h
ß 2 h
+J £^rJ3 +J US 41
41 H
^1 ,D T3 nl a fi > 3 " nl
^ ° 0 " ^! ^ A H
33

.,»**fl*!
Etti
Figure 20. Burst at Room Temperature.
Cylinder SPV1-5: This Tedlar lined cylinder was tested at ambient temperature. This cylinder, as well as cylinder SPVZ-11, tobe discussed, was tested to obtain permeability data of the biaxially stressed liner. Due to inadequacies of the system, which were discovered after testing these cylin- ders, the data could not be generated. The cylinder was cycled Zl times. Initial pressurization was to 660 psia (60% of the burst pressure of cylinder SPV3-10) and was held for 30 min., during which time the attempted permea- bility testing proceeded. Then the specimen was cycled from 100 psia to 660 psia an additional 16 times. The peak loading was then increased to 715 psia (65% of the burst pressure of cylinder SPV3-10), and the specimen failed at the peak of the fourth such cycle.
Cylinder SPV2-1': This Mylar lined cylinder was tested at ambient temperature. A maximum pressure of 353 psia was obtained before liner leakage occurred.
All of the following cylinders were tested at -423°F.
Cylinder SPV3-14': This was a nickel lined cylinder. Ultimate internal pressure was 1, 647 psia. Leakage at the end seals presented a problem and numerous pressurizations were attempted to burst the cylinder; fig. 24 illus- trates the loadings applied to the cylinder. The liquid hydrogen pump was used alone until completion of the 18th cycle; helium overpressure on the liquid hydrogen was used for cycles 19 and 20. Elongation data for the hoop
34
CD
C/O
O
CD
CD E CO
Q
zz o
zz o
co >
co CD
CD
O CZ> OO
ejsd 'ajnssajd |ep8J8jj!Q
35
.005 .010 .015
Hoop strain, in./in.
.020
Figure 22. Hoop Stress-Strain Diagram. 71/2 in. Diameter Cylinder SPV 3-10; Seilon Liner.
36

.005
Longitudinal strain, in./in.
Figure 23. Longitudinal Stress-Strain Diagram. 7 1/2 in. Diameter Cylinder SPV 3-10; Sei Ion Liner
37

1800
5 10
Cycle number
Figure 24. Biaxial Tests. Cycle-Pressure Diagram, 7 1/2 in. Diameter Cylinder SPV 3-14'; Nickel Liner
38
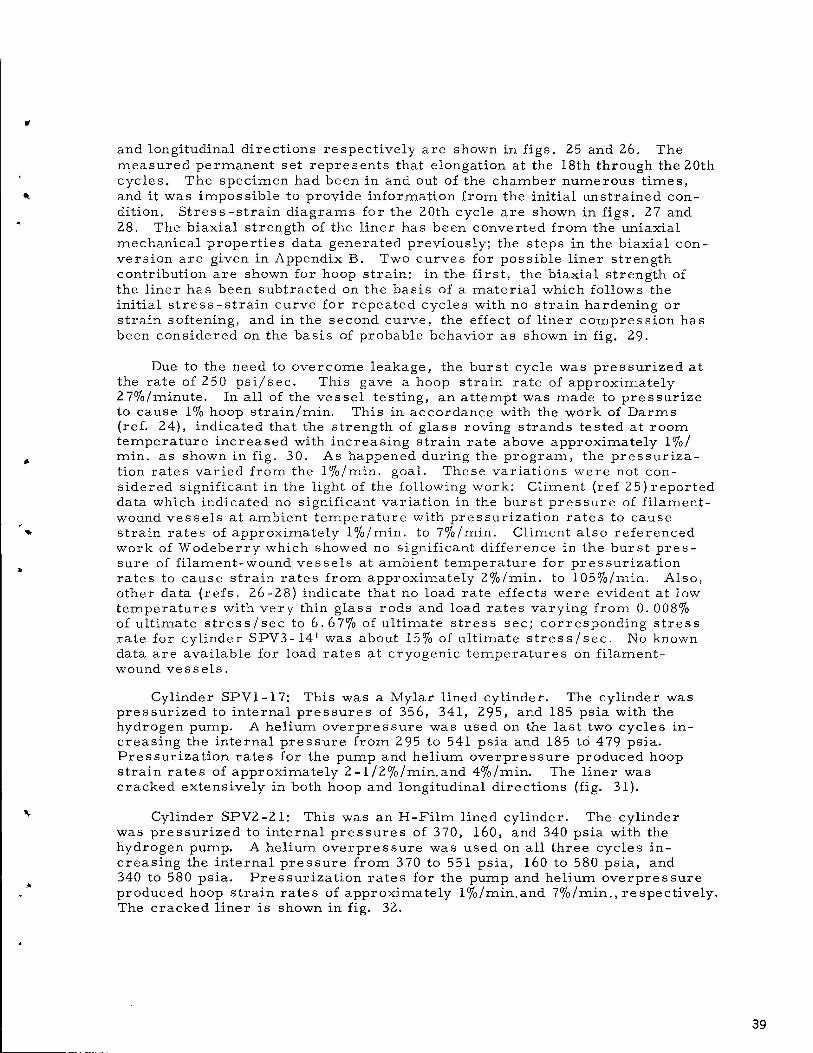
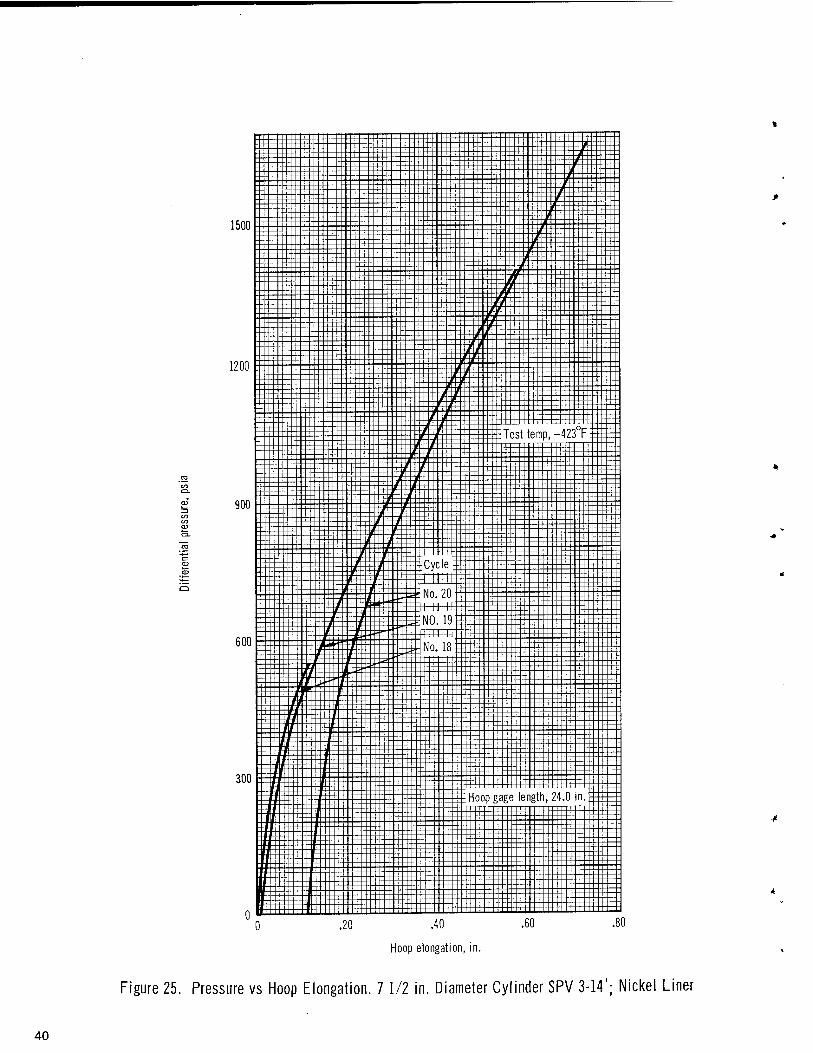
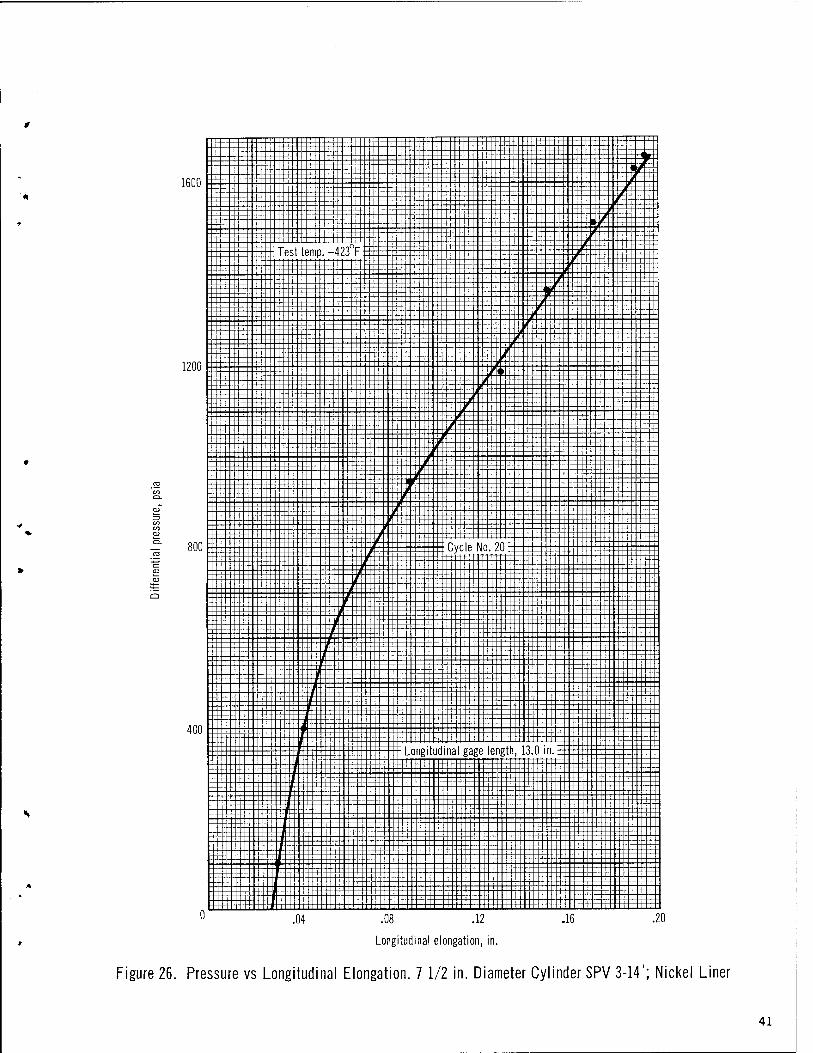
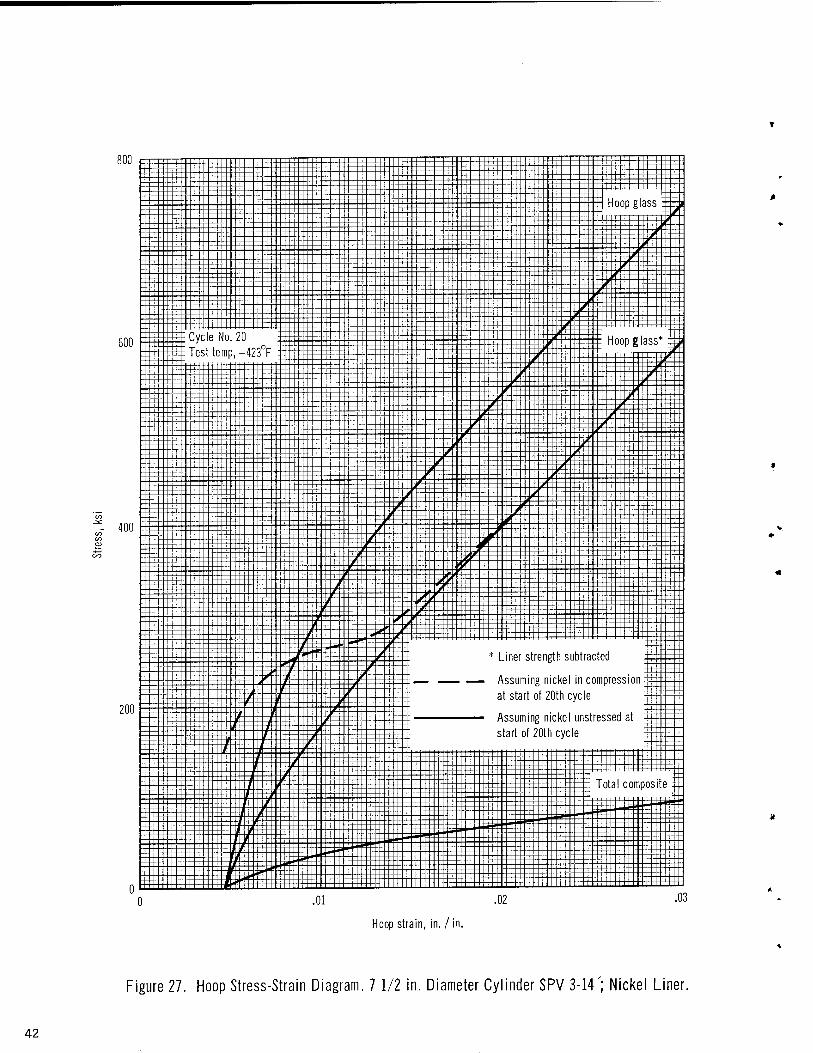
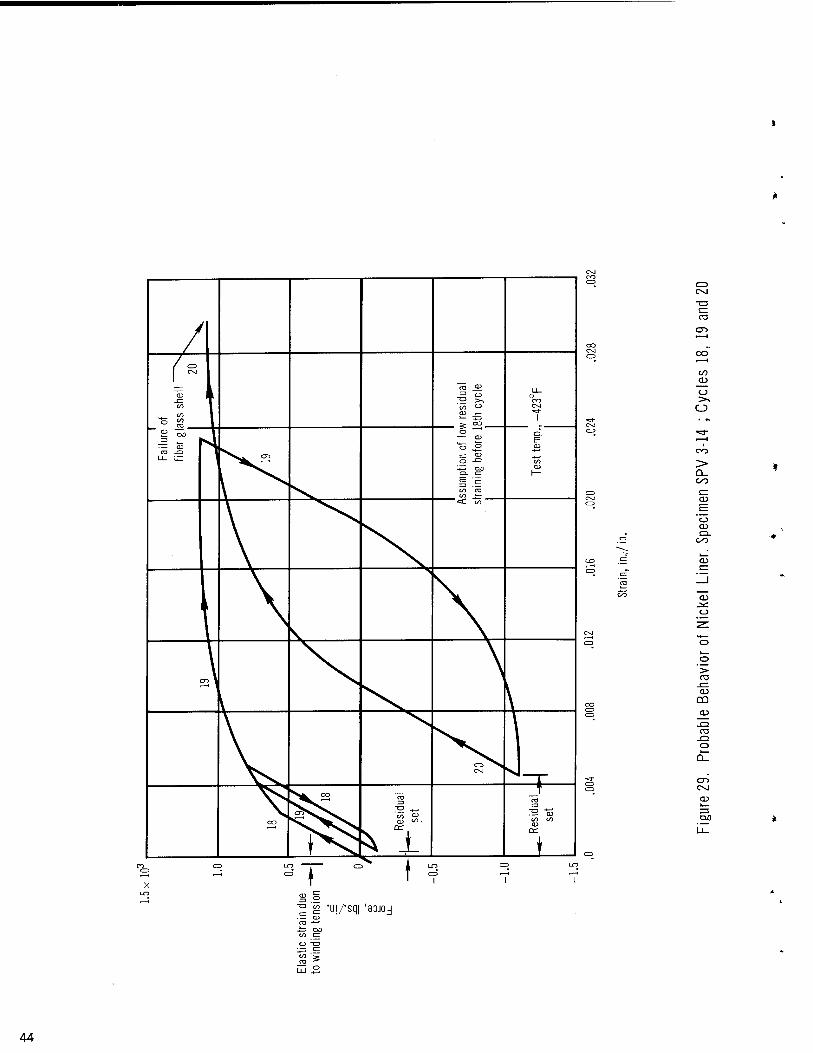
and longitudinal directions respectively are shown in figs. 25 and 26. The measured permanent set represents that elongation at the 18th through the 20th cycles. The specimen had been in and out of the chamber numerous times, and it was impossible to provide information from the initial unstrained con- dition. Stress-strain diagrams for the 20th cycle are shown in figs. 27 and 28. The biaxial strength of the liner has been converted from the uniaxial mechanical properties data generated previously; the steps in the biaxial con- version are given in Appendix B. Two curves for possible liner strength contribution are shown for hoop strain: in the first, the biaxial strength of the liner has been subtracted on the basis of a material which follows the initial stress-strain curve for repeated cycles with no strain hardening or strain softening, and in the second curve, the effect of liner compression has been considered on the basis of probable behavior as shown in fig. 29.
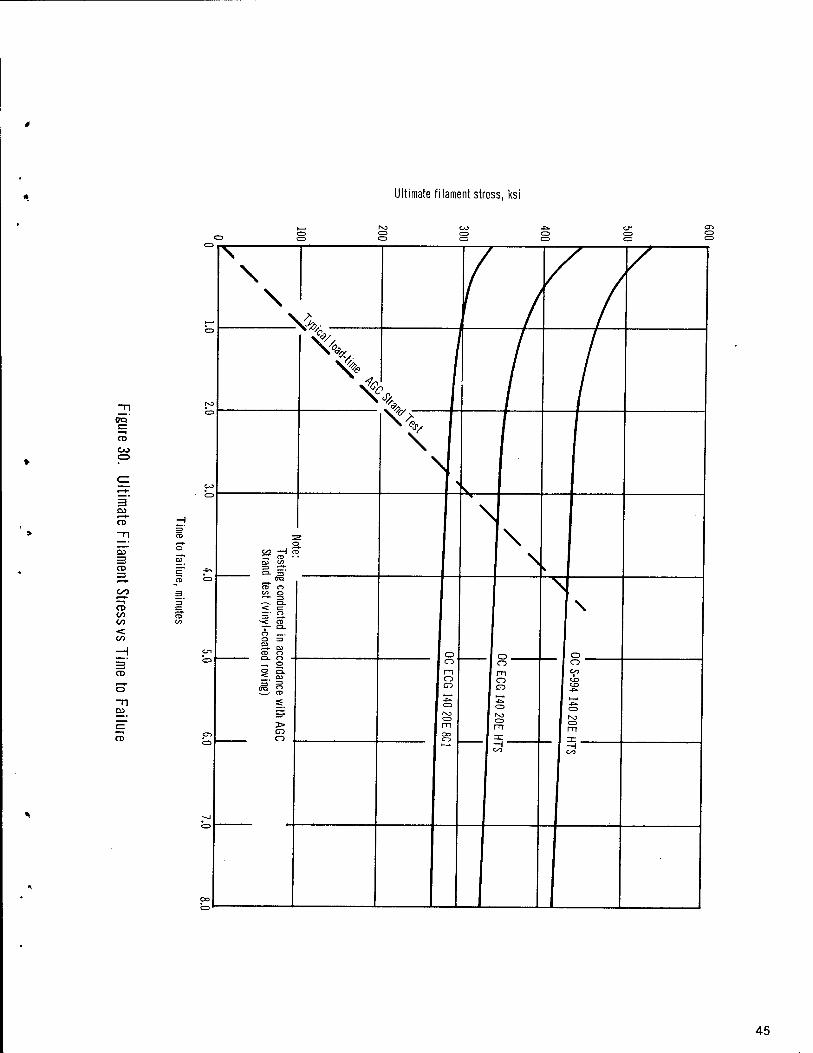
Due to the need to overcome leakage, the burst cycle was pressurized at the rate of 250 psi/sec. This gave a hoop strain rate of approximately 27%/minute. In all of the vessel testing, an attempt was made to pressurize to cause 1% hoop strain/min. This in accordance with the work of Darms (ref. 24), indicated that the strength of glass roving strands tested at room temperature increased with increasing strain rate above approximately 1%/ min. as shown in fig. 30. As happened during the program, the pressuriza- tion rates varied from the 1%/min. goal. These variations were not con- sidered significant in the light of the following work: Climent (ref 25) reported data which indicated no significant variation in the burst pressure of filament- wound vessels at ambient temperature with pressurization rates to cause strain rates of approximately 1%/min. to 7%/min. Climent also referenced work of Wodeberry which showed no significant difference in the burst pres- sure of filament-wound vessels at ambient temperature for pressurization rates to cause strain rates from approximately 2%/min. to 105%/min. Also, other data (refs. 26-28) indicate that no load rate effects were evident at low temperatures with very thin glass rods and load rates varying from 0. 008% of ultimate stress/sec to 6.67% of ultimate stress sec; corresponding stress rate for cylinder SPV3-14' was about 15% of ultimate stress/sec. No known data are available for load rates at cryogenic temperatures on filament- wound vessels.
Cylinder SPV1-17: This was a Mylar lined cylinder. The cylinder was pressurized to internal pressures of 356, 341, 295, and 185 psia with the hydrogen pump. A helium overpressure was used on the last two cycles in- creasing the internal pressure from 295 to 541 psia and 185 to 479 psia. Pressurization rates for the pump and helium overpressure produced hoop strain rates of approximately 2-1/2%/min.and 4%/min. The liner was cracked extensively in both hoop and longitudinal directions (fig. 31).
Cylinder SPV2-21: This was an H-Film lined cylinder. The cylinder was pressurized to internal pressures of 370, 160, and 340 psia with the hydrogen pump. A helium overpressure was used on all three cycles in- creasing the internal pressure from 370 to 551 psia, 160 to 580 psia, and 340 to 580 psia. Pressurization rates for the pump and helium overpressure produced hoop strain rates of approximately 1%/min.and 7%/min., respectively. The cracked liner is shown in fig. 32.
39
.20 .40
Hoop elongation, in.
Figure 25. Pressure vs Hoop Elongation. 7 1/2 in. Diameter Cylinder SPV 3-14'; Nickel Liner
40
1600
1200
Longitudinal elongation, in.
Figure 26. Pressure vs Longitudinal Elongation. 7 1/2 in. Diameter Cylinder SPV 3-14'; Nickel Liner
41
.01 .02
Hoop strain, in. /in.
Figure 27. Hoop Stress-Strain Diagram. 7 1/2 in. Diameter Cylinder SPV 3-14'; Nickel Liner.
42

Longitudinal strain, in./ in.
Figure 28. Longitudinal Stress-Strain Diagram. 71/2 in. Diameter Cylinder SPV 3-14'; Nickel Liner.
43
/
f
/r, 1 CSJ 1
= k ro 3a LU <U ■ -3 ° i- T T3 >> ro CO 1 GO "
CD t—
° 58 I ■» CO
3 i—
o ' — CO
Ll_ ^Z m
ptio
n
ning
be
CO CD
1—
CO TO CO f-:
«£ CO
cn 1
CD ^^ CsJ Vj—r
^^k CO — T
CO
o^^^^^w^ 13
'<" Hi CD <" '
ro S "S
CO 00
£C
t *f^ 5\ ± < i
ca cn
oo a> o >-. O
Q_ C/O
c: a>
o CD a.
CD
o
> ro CD
GÜ
ca
o
CO
X LO
5 ♦ ■uj/-sq| 'aojoj
44
Ultimate filament stress, ksi
OQ
CO
I—♦■ CD
CO
CD 00 00 < 00
CD <—*- o
t => CD CD CD CO o c
H-J
\
\
Vfc, CD
sk
CO
^ 1 \
V 1
4=»
c w H 5 ^T CD • CO C/>
CL -,
> \
. CD
en
1
g conducted in ace test (vinyl-coatec C ) 1 r-,
\
O
CO
.ordance with AG
C
roving)
t
rr c: cr:
CD
CD m CO
) 1 O 1 rn o
1 S ro CD m 3:
u CO
to CJD
CD
ro CD rn
--J
CO 1 -H 1 oo
CO
45
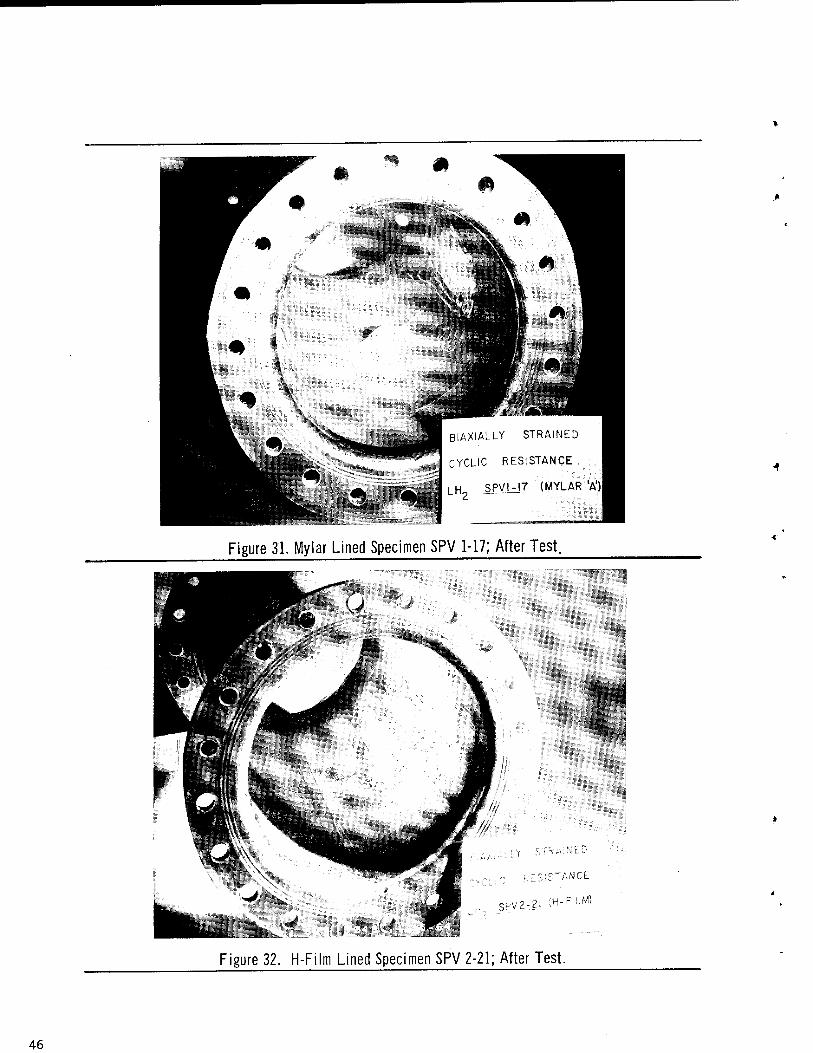
Figure 31. Mylar Lined Specimen SPV 1-17; After Test.
Figure 32. H-Film Lined Specimen SPV 2-21; After Test.
46
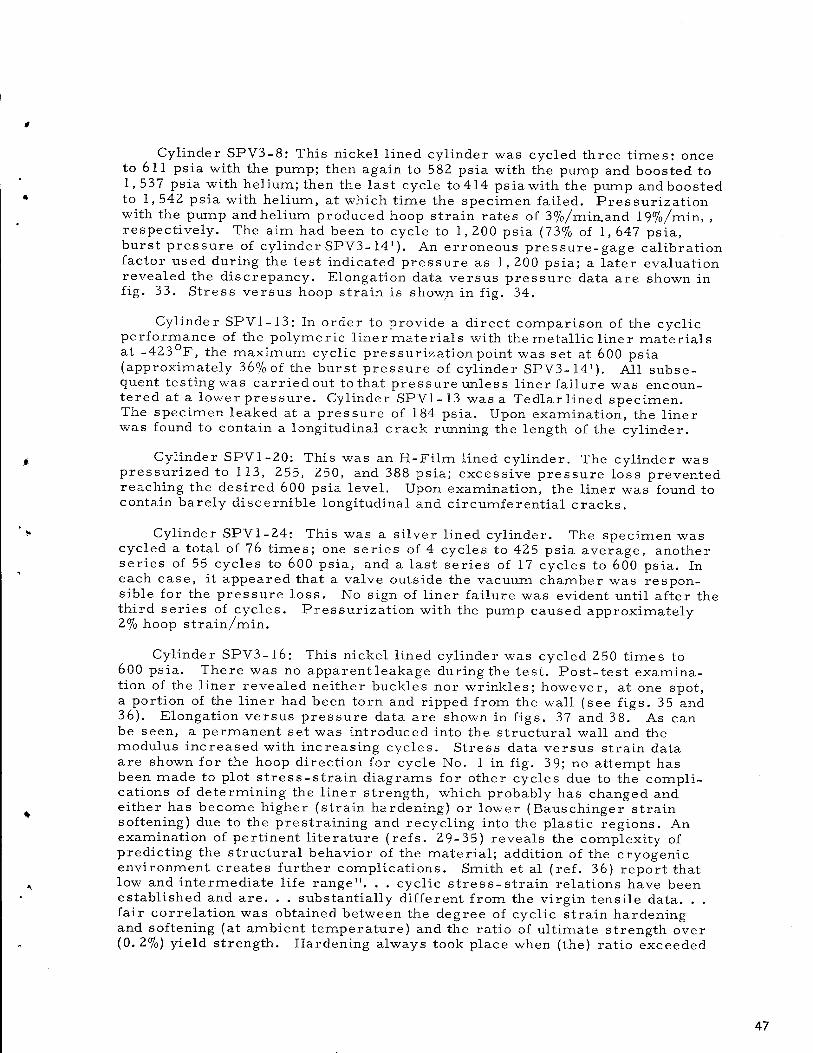
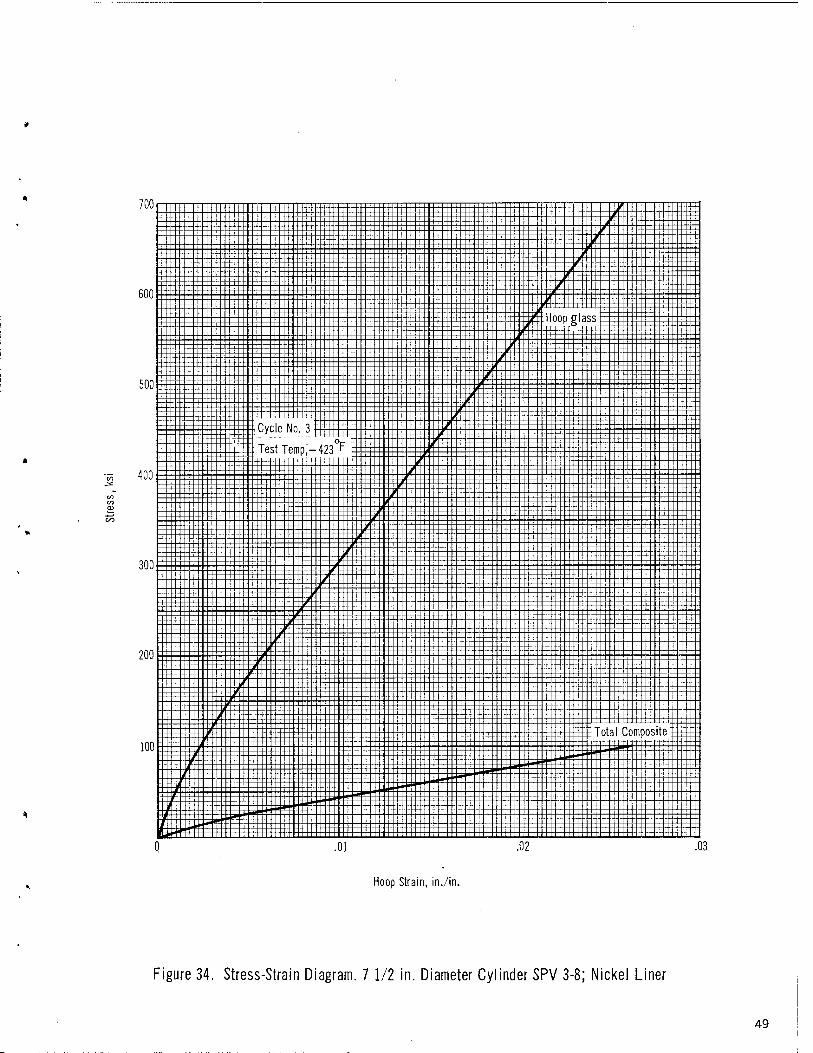
Cylinder SPV3-8: This nickel lined cylinder was cycled three times: once to 611 psia with the pump; then again to 582 psia with the pump and boosted to 1, 537 psia with helium; then the last cycle to414 psia with the pump andboosted to 1, 542 psia with helium, at which time the specimen failed. Pressurization with the pump and helium produced hoop strain rates of 3%/min.and 19%/min, , respectively. The aim had been to cycle to 1,200 psia (73% of 1, 647 psia, burst pressure of cylinder SPV3- 14'). An erroneous pressure-gage calibration factor used during the test indicated pressure as 1, 200 psia; a later evaluation revealed the discrepancy. Elongation data versus pressure data are shown in fig. 33. Stress versus hoop strain is shown in fig. 34.
Cylinder SPV1-13; In order to provide a direct comparison of the cyclic performance of the polymeric liner materials with the metallic liner materials at -423 F, the maximum cyclic pressurization point was set at 600 psia (approximately 36% of the burst pressure of cylinder SPV3-14'). All subse- quent testing was carried out to that pressure unless liner failure was encoun- tered at a lower pressure. Cylinder SPV1-13 was a Tedlarlined specimen. The specimen leaked at a pressure of 184 psia. Upon examination, the liner was found to contain a longitudinal crack running the length of the cylinder.
Cylinder SPV1-20: This was an H-Film lined cylinder. The cylinder was pressurized to 113, 255, 250, and 388 psia; excessive pressure loss prevented reaching the desired 600 psia level. Upon examination, the liner was found to contain barely discernible longitudinal and circumferential cracks.
Cylinder SPV1-24: This was a silver lined cylinder. The specimen was cycled a total of 76 times; one series of 4 cycles to 425 psia average, another series of 55 cycles to 600 psia, and a last series of 17 cycles to 600 psia. In each case, it appeared that a valve outside the vacuum chamber was respon- sible for the pressure loss. No sign of liner failure was evident until after the third series of cycles. Pressurization with the pump caused approximately 2% hoop strain/min.
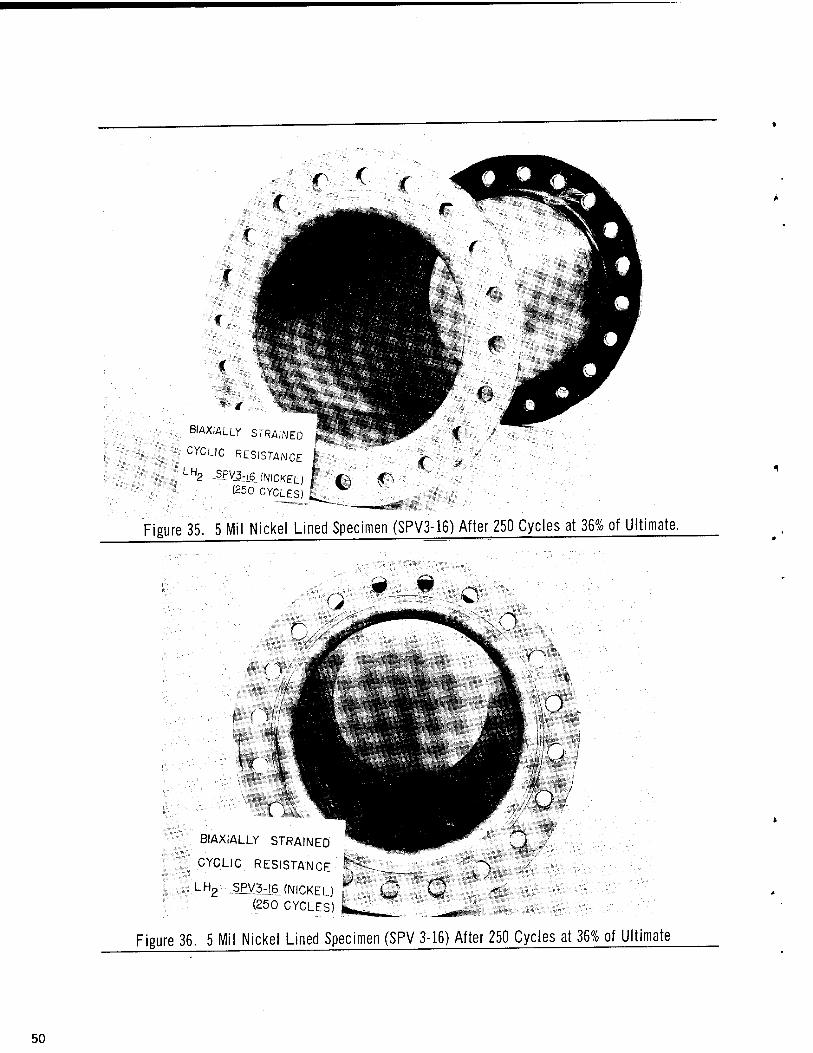
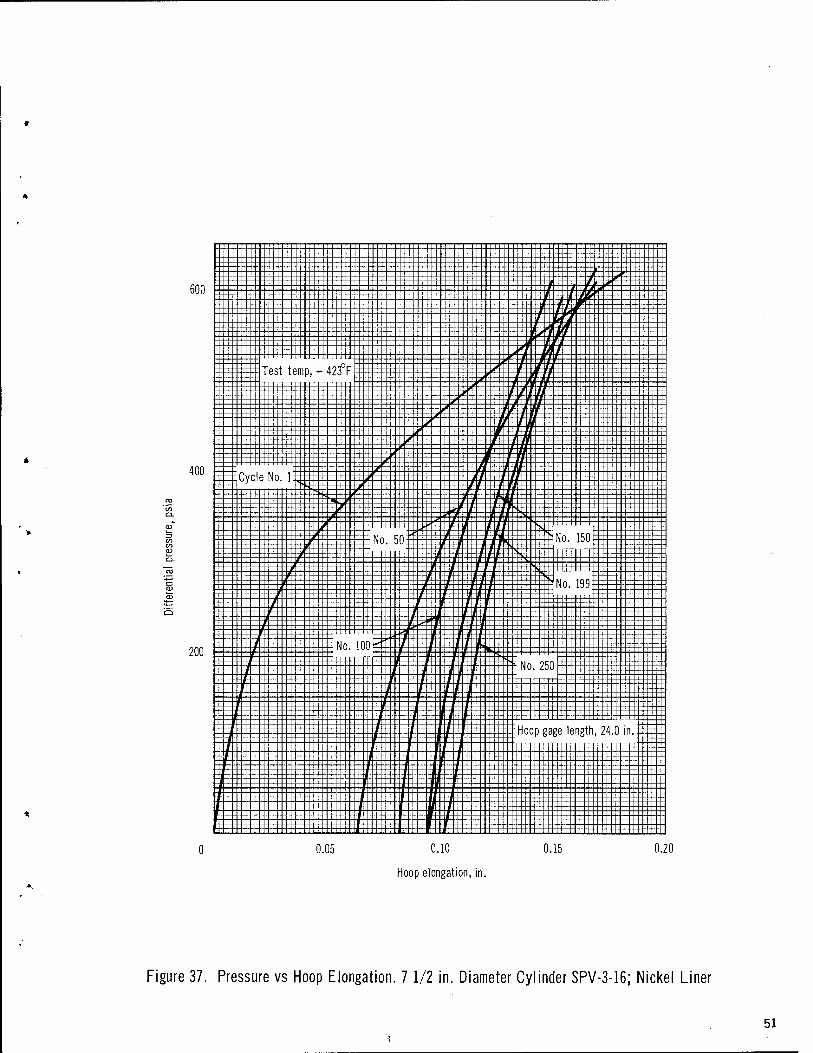
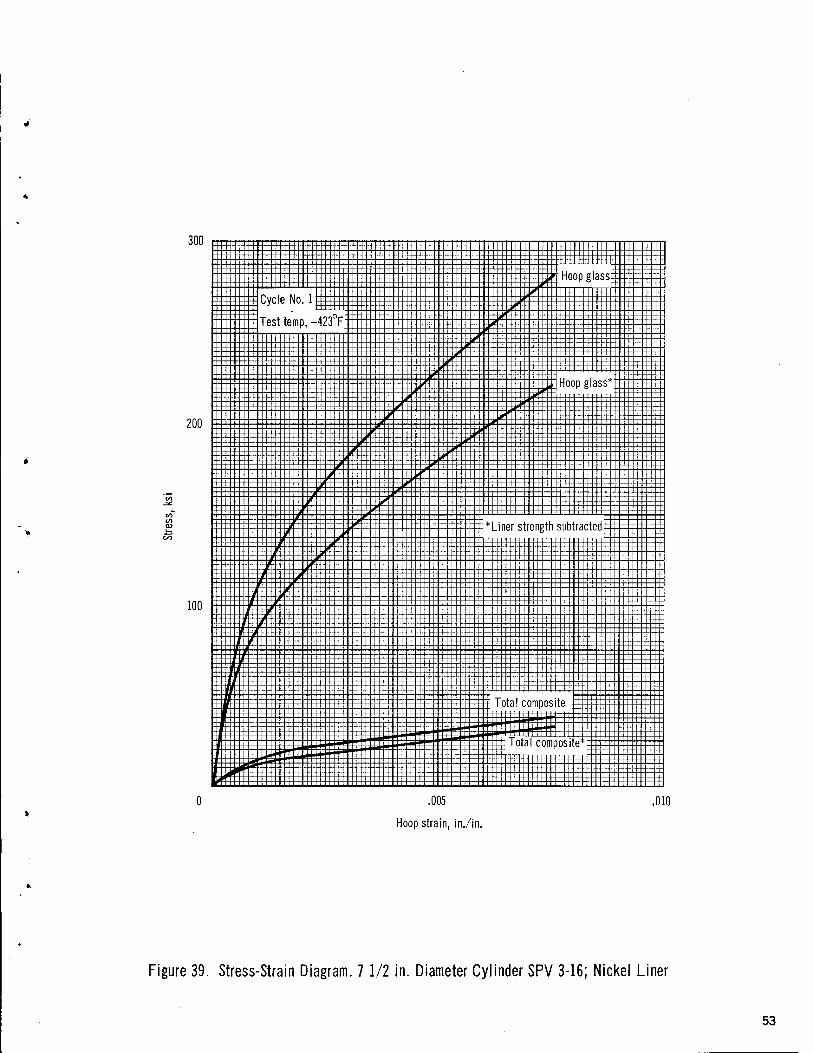
Cylinder SPV3-16: This nickel lined cylinder was cycled 250 times to 600 psia. There was no apparent leakage during the test. Post-test examina- tion of the liner revealed neither buckles nor wrinkles; however, at one spot, a portion of the liner had been torn and ripped from the wall (see figs. 35 and 36). Elongation versus pressure data are shown in figs. 37 and 38. As can be seen, a permanent set was introduced into the structural wall and the modulus increased with increasing cycles. Stress data versus strain data are shown for the hoop direction for cycle No. 1 in fig. 39; no attempt has been made to plot stress-strain diagrams for other cycles due to the compli- cations of determining the liner strength, which probably has changed and either has become higher (strain hardening) or lower (Bauschinger strain softening) due to the prestraining and recycling into the plastic regions. An examination of pertinent literature (refs. 29-35) reveals the complexity of predicting the structural behavior of the material; addition of the cryogenic environment creates further complications. Smith et al (ref. 36) report that low and intermediate life range". . . cyclic stress-strain relations have been established and are. . . substantially different from the virgin tensile data. . . fair correlation was obtained between the degree of cyclic strain hardening and softening (at ambient temperature) and the ratio of ultimate strength over (0. 2%) yield strength. Hardening always took place when (the) ratio exceeded
47

CD
o
Q_ C/O
CD "CD
o CD
■4—» CD
C3
Q
CNl —
CO DO
CO
co CD
CO CO
Bisd '9jnss9Jd |ei}U9J8jj!0
48
Hoop Strain, in./in.
Figure 34. Stress-Strain Diagram. 7 1/2 in. Diameter Cylinder SPV 3-8; Nickel Liner
49
BIAX1ALLY STRAINED
CYCLIC RESISTANCE I LH2 5PV1-I6 (NICKEL) f f
(250 CYCLES)^ V '
c
Figure 35. 5 Mil Nickel Lined Specimen (SPV3-16) After 250 Cycles at 36% of Ultimate.
BIAXIALLY STRAINED """
CYCLIC RESISTANCE 1
LH2 „SPV3d6_rNICKEL) ^ Q C (250 CYCLES)
Figure 36. 5 Mil Nickel Lined Specimen (SPY 3-16) After 250 Cycles at 36% of Ultimate
50
600
200
0.05 0.10
Hoop elongation, in.
0.15 0.20
Figure 37. Pressure vs Hoop Elongation. 71/2 in. Diameter Cylinder SPV-3-16; Nickel Liner
51
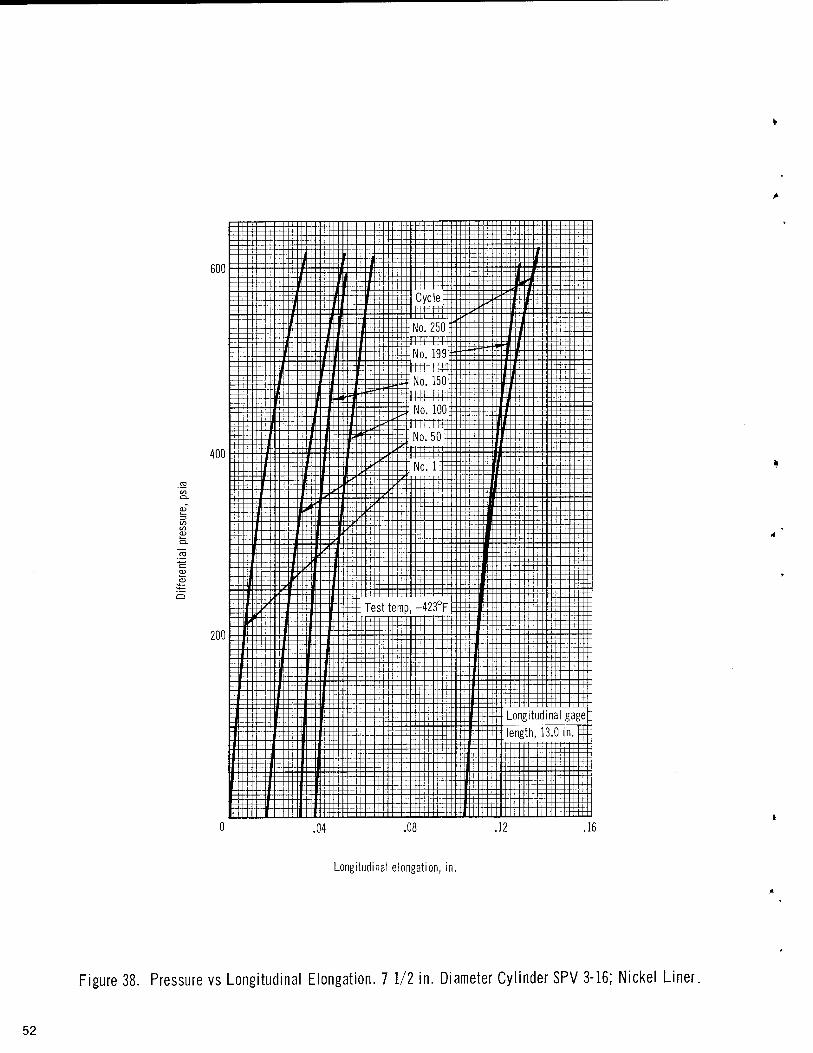
Longitudinal elongation, in.
Figure 38. Pressure vs Longitudinal Elongation. 7 1/2 in. Diameter Cylinder SPV 3-16; Nickel Liner.
52
.005
Hoop strain, in./in.
.010
Figure 39. Stress-Strain Diagram. 7 1/2 in. Diameter Cylinder SPV 3-16; Nickel Liner
53
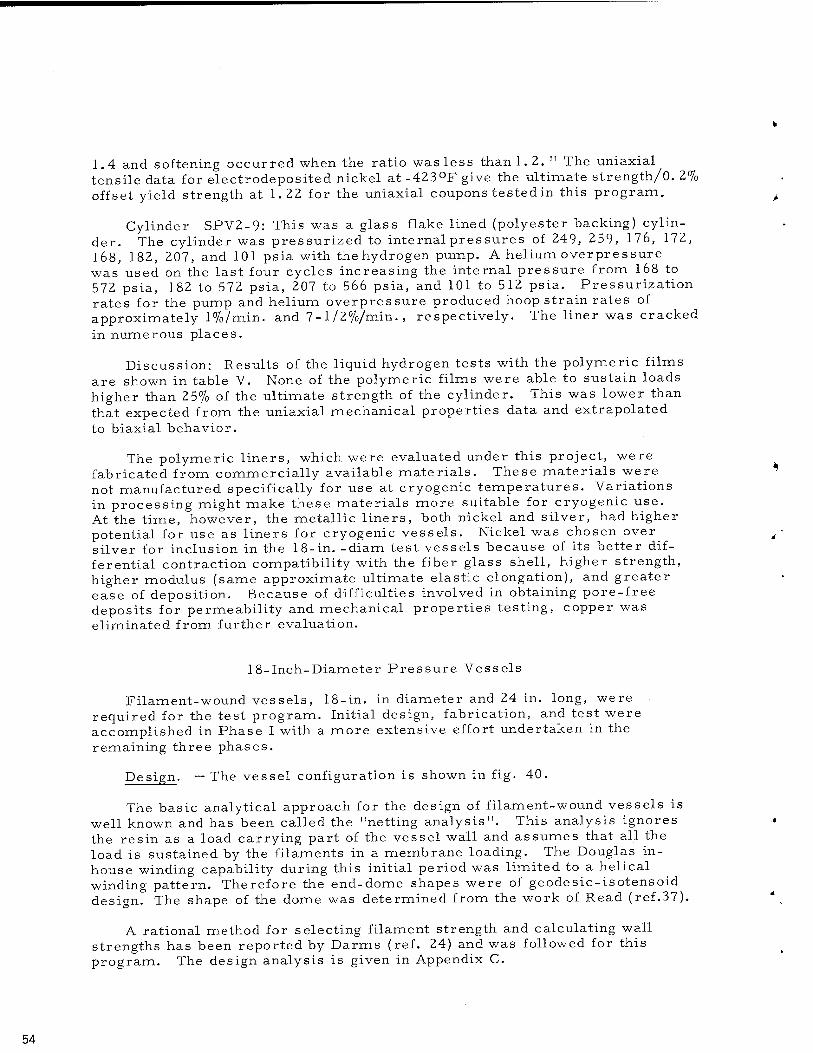
1.4 and softening occurred when the ratio was less thanl.Z. " The uniaxial tensile data for electrodeposited nickel at -423°F give the ultimate strength/0. 2% offset yield strength at 1.22 for the uniaxial coupons tested in this program.
Cylinder SPV2-9: This was a glass flake lined (polyester backing) cylin- der. The cylinder was pressurized to internal pressures of 249, 259, 176, 172, 168, 182, 207, and 101 psia with the hydrogen pump. A helium overpressure was used on the last four cycles increasing the internal pressure from 168 to 572 psia, 182 to 572 psia, 207 to 566 psia, and 101 to 512 psia. Pressurization rates for the pump and helium overpressure produced hoop strain rates of approximately 1%/min. and 7-1/2%/min., respectively. The liner was cracked in numerous places.
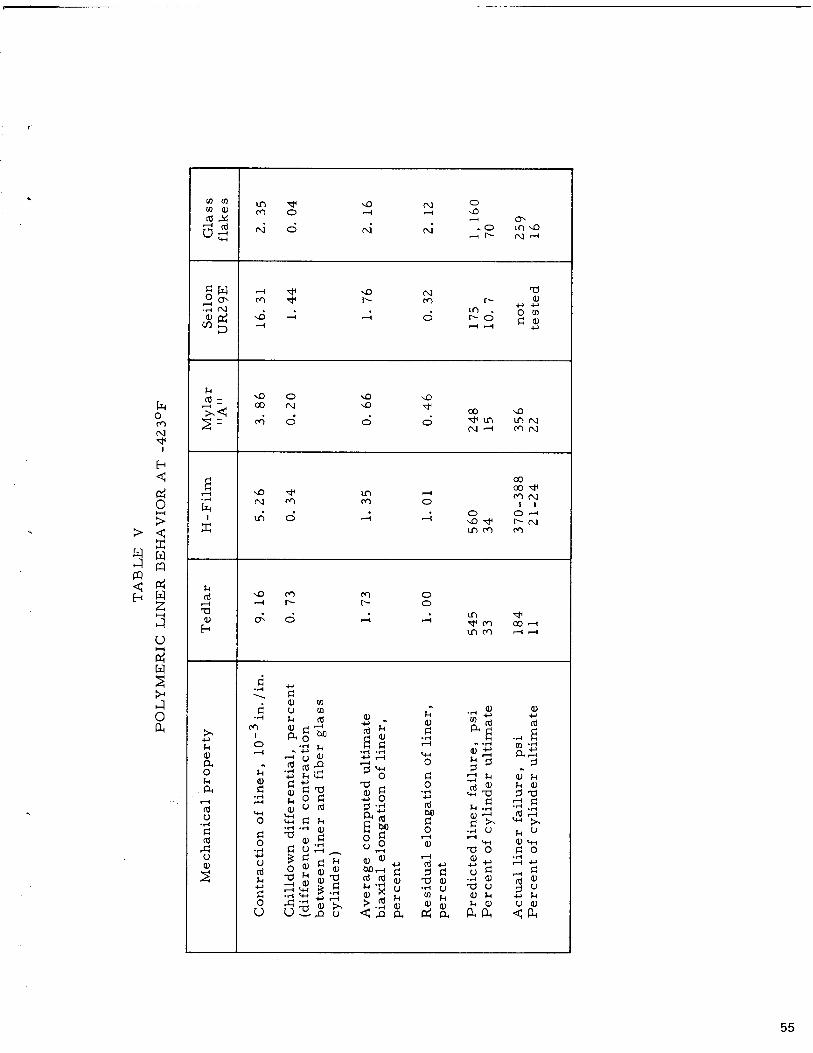
Discussion: Results of the liquid hydrogen tests with the polymeric films are shown in table V. None of the polymeric films were able to sustain loads higher than 25% of the ultimate strength of the cylinder. This was lower than that expected from the uniaxial mechanical properties data and extrapolated to biaxial behavior.
The polymeric liners, which were evaluated under this project, were fabricated from commercially available materials. These materials were not manufactured specifically for use at cryogenic temperatures. Variations in processing might make these materials more suitable for cryogenic use. At the time, however, the metallic liners, both nickel and silver, had higher potential for use as liners for cryogenic vessels. Nickel was chosen over silver for inclusion in the 18-in. -diam test vessels because of its better dif- ferential contraction compatibility with the fiber glass shell, higher strength, higher modulus (same approximate ultimate elastic elongation), and greater ease of deposition. Because of difficulties involved in obtaining pore-free deposits for permeability and mechanical properties testing, copper was eliminated from further evaluation.
18-Inch-Diameter Pressure Vessels
Filament-wound vessels, 18-in. in diameter and 24 in. long, were required for the test program. Initial design, fabrication, and test were accomplished in Phase I with a more extensive effort undertaken in the remaining three phases.
Design. — The vessel configuration is shown in fig. 40.
The basic analytical approach for the design of filament-wound vessels is well known and has been called the "netting analysis". This analysis ignores the resin as a load carrying part of the vessel wall and assumes that all the load is sustained by the filaments in a membrane loading. The Douglas in- house winding capability during this initial period was limited to a helical winding pattern. Therefore the end-dome shapes were of geodesic-isotensoid design. The shape of the dome was determined from the work of Read (ref.37).
A rational method for selecting filament strength and calculating wall strengths has been reported by Darms (ref. 24) and was followed for this program. The design analysis is given in Appendix C.
54
ft o CO CM
I
H <
O >
w g t-l CO
m
>
W
U i—i
W
O ft
CO 03 in ■* vO CM o CO CD CO o —H rH v£) to X .—I CT^
72 cd W MH
CM Ö CM CM* . O rH O CM rH
d w ogi rH "* vO CM T) co ■* r^- CO r- 0)
-t-i H-> • rH CM ( • , . iri . O en
d cl) -M
r£ »I vO ~H -^ O r- O WD
r-i rH .—1
rH
nj - vO o vß ^O *—* ~^ oo CM vO
■^ >>< 00 ND
S = CO O d d "* IT, in CM CM —< CO CM
vO ^ in rH
00 00 "* CO CM
1 1 •rH
ft CM CO CO o • • • ■ O O rH LO o rH ~H vO Tt< r~ CM
in co CO
u cd ^o CO CO o
t—i rH r~ t^- o
cA d p—! .—t m ■^ CO 00 ■-< in co rH ^H
d ■rH
d (U co
H_>
d •rl
CO 1
U en !-i cd <D r1 '""'
CD ,
a g •r-l -rH +J «—I i-H
u S) d
• rH
CU H->
cd
■rH g rH
<D OH O
o rH
u .53 ^ H-> rH <+H
rH
>+H
0 d
S.S CD rH u
a, i—i
cd u
■rH
d cd
<D d
•f-t r—1
<+H
0
o
Ö d T3
5 u td £ d h
H-> O
8 §
0 •rH -t->
cd bo d o
CD
'^rS
fH -rH
d ^ i—1
rH d) 3 XI
rH <->
4> <+H
rfl •H d o ,3 _^ u ^ T3 o d o U ID
2
H->
u cd u
S g g s ÖOrH Ö
rH
cd H->
2 d T3 CD •H CJ
-rH
- s rj U
d o U OH ft
<U rH
rH (Ü
ft ft
HJ rH
U CD
<q ft
55

Polar Wrap C00EDINME5 FOR DO WE TYPIGM- BOTH EMCb
V ß c 8.940
0.572 8.900 1.902 8.850 1 .116 6-800 1 .60! 8.750 (,9fc4 8,500 2.466 8.250 3.606 8.COO a.042. 7.750 3.5?4 7,500 3.4.62 7.250 3.844 7.000 4,032 &.750 4,201 6,500 4,65«- G.250 4.492 a.ooo 4.617 5,750 4.730 5.500 4,842. 5.250 4.925 5.0C0 5.008 4.750 5.086 4.50O 5.151 4-,250 5.ZI2. 4.000 5.2G.fc 3.750 5.2-14 6500 5.394 3000 5.42») 2.750 5.4GI 2,500 5491 2.250 5.498 2.200 5.505 2,150 5-5M 2.100 5.527 2.000 5-550 1.968
TXNGTFMT PL
5TMTT EN6 OHW
START WCWU
POLA« VNRK OR
(ONE- cvo-e.')
■ENDOf W0OP\Ki
ST* ,o<:
OMER-V*
TXPiCAL AT EMH PL^K£ OFT
Helical Wrap COOBDIN/VTES foe DOME TYPICAL B0THENC5
Y R 0 * 8.940
0.590 8.904 0.921 6-851 1.287 S.7fel i.(b=lO 6.C«27 .2.006 8,49t! 2.426 8.270 2,7k2 &.o4& 6 •04=? 7,826 «5.60& 7,599 3,561 T,57Cö &.72.S 7.152 4.077 G705 4*54 6 ,2.56 4.5<95 5.SII 4 792 5.5Co4 4.9Co2 4-917 t.cP>(o 4,470 5206> 4,02'b *b. 290 <b,57G 5.3kO 6.12^ 5-420 2G>82 5, 40JO 2,-26)5
1 5.500 l .786
OlNAEN^lON CODED TUUSj * TOLER.A.NCE. *■ -005>
Figure 40. Fiber Glass
56
-TXNfcF.MT PLNNE.
ENBOF WOOP -*JSAP STAKT OF ovttt. WRfc>P
| p005!^?^1) COVTlNfr PER. KCO!öG-1A>700<24-IPD*I
'^ | ' t.oo3 L .005 _. - - =^T L.ooslfooo NICKEL UHE«
\- ON/ER-V^ &S> (4- PLM ^
/6-
LK PLUME orT\N&£»*o( iNE% E.V. \>EKKTED
"II^DiÄ. 1 a HOLES (REP^
y—A.Oil's Dl^CREC)
IZEQUCVL'ÖP^CE-'ö
, ■, WITHIN tOlO (CEP)
'.BBC DI/k.CBEO
PLNNEOF T.\NS>PMCY
^- _OCATE THIS CUP / iBO° PROA LOCATED CUP 7 TYPiCAL 2 PLACES i,i2i° HELIX WEM= "I / q» FOE POL<\8 \nRNP] T
5/4 (T\P)
(£EF)
B 1
5WDl\(REF) THr^hi
\ll E ^VPPEO* (i PLACES} HtvNDNNORK WXEPTK&LE.
B -J VIEW 0 SCALE. 2/1
Fie.ee. C-LfVb'b (VVE-UV NNE/^ SEE, e-EVt&RAC ViOTE. *-\
-Fie>EE GLK-=t>Ccieüjr>AFEe.E.NT\M- v^ei^P, 90° TO O 5EE &SNERA.L NOTE" I
&ENEÄM. NOTEV. UNLESS. OTHERWISE SPECKED I C-tA^b P\&E«> 0.. %<W^|rtTS. UfcED TOS. CONTINUOUS RLfc.»*.EHTS
If. E/MOLM* (V ÜtiEÖ FOB. \NCMEH OOTtt 1. RESIN 'ÖH'bTENV EPOVf KSfelN - UH\CM C&WX. ERL* 0*10, 3 SEEAUZE &IKLT NWWDIZEL (pee TcouNCs D\N& TM.Q %4) 4 V£4S£L BUÜ FTTTIMC>6 FfcSfelCKTE-b PER DPS l 44-\MOOl<V
Fiber Glass Vessel Cryogenic Test Douglas Dwg. 1T03226
The integral end-fitting design has been based on smooth transition be- tween the shell and fitting and location of the tapered edge of the fitting beyond the dome inflection point. A fiber glass fitting was used to reduce strain compatibility loadings at the transition from dome to fitting. Detail sizing calculations are given in Appendix C.
Discontinuity stresses exist at the dome-cylinder junction for two reasons: the large hoop loading in the cylindrical section must be resisted by additional windings in the circumferential direction, which cause a dis- continuity in thickness at the junction; and the meridional radius of curva- ture is discontinuous at the transition point. The bending stresses which result cannot generally be considered negligible in the local area. The solution to minimize these stresses has been to overwind the junction, as shown in fig. 40. Fig. 41 shows the decrease in stress at the junction from overwinding; the approximately 36% increase in stress is reduced to approx- imately 13% (see Appendix D for detail analysis). Other work on disconti- nuity stresses by Parady (ref. 38) shows a nominal 25% stress increase, and Love (ref. 39) indicates a method to reduce stresses at the junction by a change of the dome shape. The latter causes additional (although less severe) stresses in the dome at other locations.
Fabrication. - Each 18-in. -diam vessel for Phase I was fabricated in the following way:
(1) A salt mandrel was cast on a steel shaft, and the salt was machined to the appropriate contour; then steel end-fitting mandrels were assembled on both ends of the steel shaft. The salt was then sealed with a coating of polyvinylchloride (PVC).
(2) The mandrel assembly was shipped to the plating vendor where the following steps were accomplished:
(A) The PVC coating was removed. (B) An epoxy seal coating was applied to the salt. (C) A conductive silver strike coating was applied to the
complete deposit surface. (D) An electrodeposited nickel liner was formed over the
required surface. (E) The mandrel was then returned to Douglas for further
fabrication.
(3) The integral long necked end-fittings were fabricated by a combi- nation filament-winding and hand layup technique similar to that used for the 7-1/2-in. -diam test cylinders. After end-fitting laminates were cured, transition flanges were machined to the dome contour.
57
4 6
No. of hoop layers
Figure 41. Decrease in Meridional Stress Vs No. of Layers.
58

(4) The structural shell was filament wound of fiber glass in helical and circumferential patterns.
(5) The resin system was cured.
(6) The steel end-fitting mandrels were removed, and the salt mandrel was washed out, and the vessel was then ready for test.
Two vessels, S/N 001 (fig. 42) and S/N 002, were fabricated in Phase I. Table VI is a review of the process data for all 18-in. -diam vessels.
Salt mandrel: A nonpermeable seal coat for the mandrel assembly was necessary to prevent leaching of the salt into the aqueous plating bath. Various seals of acrylic, polyvinylchloride, butyl rubber, and epoxy were evaluated. An epoxy seal coat was the most suitable of those tested.
Nickel liner: Specifications for the nickel liner material were as follows: yield strength, 55, 000 psi; ultimate strength, 85, 000 psi; and ultimate elongation, 12%. The quality control panels deposited in the same bath as the liners for vessels S/N 001 and 002 met this requirement,
5S>- ^r
Figure 42. Vessel S/N 001. Before Test.
59
< H <! Q
W Ü o ft
> w w in
H W
Ü
i-i
00
o TJ
CO S ^
n C 0)
n! 0 4) rt
Si h nj O U
in h
•t) 0)
o CO
> d u p rt bo o
-o rt bo fi f-i P
TJ
00
o
o 00 SS^ rt rt E rt x)
3 s
» 0 m 'rt nJ O
P £ -u 4)
3 U
a.s
J 01 ft
u nJ
g 0)
PS
& nJ
ttO
P TJ
TJ 0)
3
P TJ
TJ 4) QO nJ
E nt
TJ
>- (H . 4) fi > o 4) ■£ °> «i bu
ckle
d in c
yli
nd
rica
l w
ound
.
Waf
fle
shap
e r
buck
ling
bot
h p
erp
end
ic
Lei
to l
ongi
tudi
nal
axis
. rt
fi o ■v a
Tl (U X u 0
r-1 a
3 » » >. " 'x U ^ ni
d) . rt
-11
IS] .2 ^ C O h — 0 m '-j O '~-i
^ a
5U
1-1 2 «J „ 0) 3
01
u
t
rO
T) Ö rt
M
ß oi v § £ ^
J £ £ p.
h QJ
C « h £ ü "J ° ß g
CO
IN
J 3 J £ J HJ ^ a T3 <n aj nj
0 —i <u CO M ■—l 01
C 0 xt HS< ? sis 4)
a; 0) GO Ö
01 +j
m
p.
0 o CT- 1^ 0^
rt c
+J 0 ! 0 c
(M s M S
13 « nj
01 rt 0
.tJ £ « •£ 1 is E " 0
4)
> P S a p c s
? rt J
rt bo c
T)
Ü rt F-i
fe£ OI.H C
ft E
"0 a
ß rt '>• o A o .
ID rg ■* <T> o^ rg T3 ft oi 0)
0> rt -* rj ■^ "^ rt D rj 01
O^ a;
0) £ c m IDu ö c o
'£ ft
s ^ ^ rt m o o
c TJ
t> 01 ■r-i t- O .M s +5
"w J O^ ft 2 0
d £ ■^ (V] r- O r- •41 r-
E rt 01
ÜO
Ü Ü0 o o^ o CO CO o - c
rt £ i '^! '3
3 rt 0) in CO <n O M ^*-
s s-S -JE U ü E
0 T3 o
oo i^ TJ
c 0
u 0)
c
PS CO £ CT- CO o (M Tt<
c rt 0
01 0 ft QJ
■o 0
In 0) 0> «•S g Ö o ft c
1 0 « CO CO ™ •Sö'S rt
0) p; a <\j in o O —i m in S<5 0)
0
> ^ rt 00
-O < 5 i p Ö rt rt c
0)
u
u 0) c
Ö o
u
0!
0) M C nt
CO cr> o
in
O- > s ■*
£ 3 B
ft^ 5 e-s — <u o ? ■" O.
" 0
* ° «
0
0)
(1)
rt C
S 0>
E 0
p
c 0)
E
01
TJ
rt > 0)
-G TJ rt rt 0! ■ä „ S 0) ft
TJ
5
nt
0)
<
CO
NO -JD r- Z CO [^ 'S ^ S *i 3 rt T3 ^ t: ui ^ « -5 £ rt C
o
0)
TJ p u
s u
ft -c E c
0) o c
.2nj
U iß In <L
^ T3 ft 0
c ID 3
01 ,D o o
o o
m o o
o o
o o
O O
o o
0) u
H 01 0)
10 M rt J3 U TJ OJ
>
60
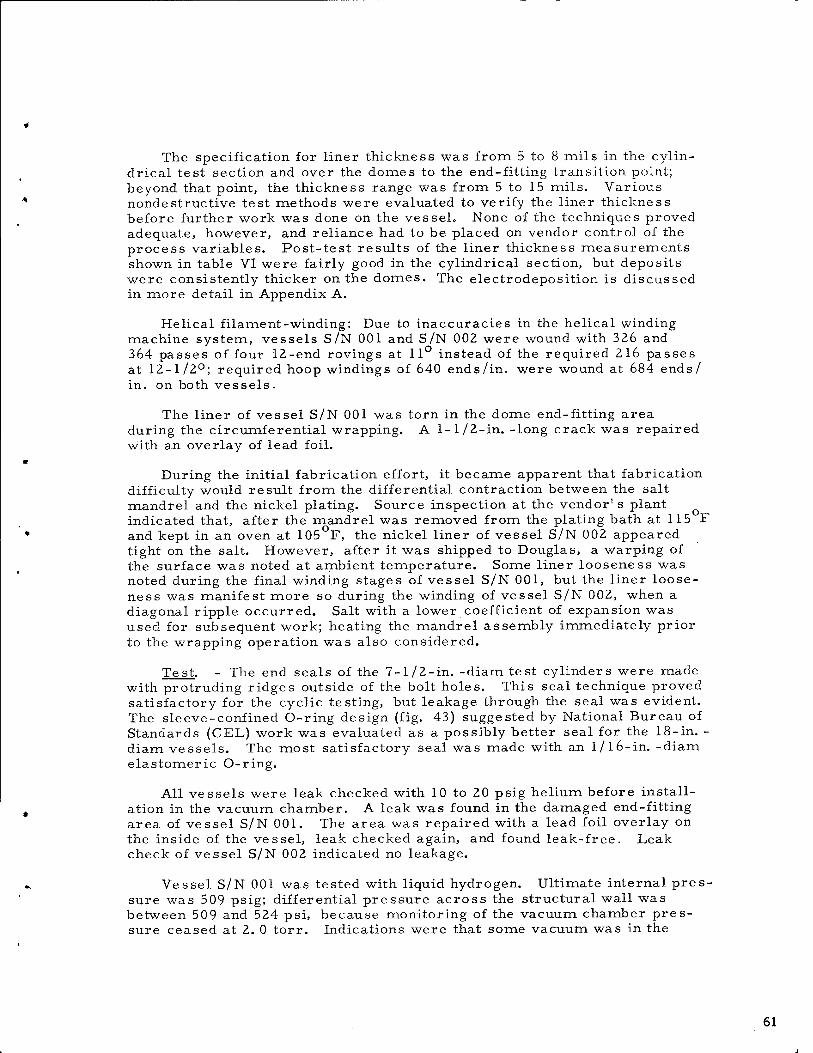
The specification for liner thickness was from 5 to 8 mils in the cylin- drical test section and over the domes to the end-fitting transition point; beyond that point, the thickness range was from 5 to 15 mils. Various nondestructive test methods were evaluated to verify the liner thickness before further work was done on the vessel. None of the techniques proved adequate, however, and reliance had to be placed on vendor control of the process variables. Post-test results of the liner thickness measurements shown in table VI were fairly good in the cylindrical section, but deposits were consistently thicker on the domes. The electrodeposition is discussed in more detail in Appendix A.
Helical filament-winding: Due to inaccuracies in the helical winding machine system, vessels S/N 001 and S/N 002 were wound with 326 and 364 passes of four 12-end rovings at 11° instead of the required 216 passes at 12-1/2°; required hoop windings of 640 ends/in. were wound at 684 ends/ in. on both vessels.
The liner of vessel S/N 001 was torn in the dome end-fitting area during the circumferential wrapping. A 1-1/2-in. -long crack was repaired with an overlay of lead foil.
During the initial fabrication effort, it became apparent that fabrication difficulty would result from the differential contraction between the salt mandrel and the nickel plating. Source inspection at the vendor's plant indicated that, after the mandrel was removed from the plating bath at 115 F and kept in an oven at 105 F, the nickel liner of vessel S/N 002 appeared tight on the salt. However, after it was shipped to Douglas, a warping of the surface was noted at ambient temperature. Some liner looseness was noted during the final winding stages of vessel S/N 001, but the liner loose- ness was manifest more so during the winding of vessel S/N 002, when a diagonal ripple occurred. Salt with a lower coefficient of expansion was used for subsequent work; heating the mandrel assembly immediately prior to the wrapping operation was also considered.
Test. - The end seals of the 7-1/2-in. -diam test cylinders were made with protruding ridges outside of the bolt holes. This seal technique proved satisfactory for the cyclic testing, but leakage through the seal was evident. The sleeve-confined O-ring design (fig. 43) suggested by National Bureau of Standards (CEL.) work was evaluated as a possibly better seal for the 18-in. - diam vessels. The most satisfactory seal was made with an 1/16-in. -diam elastomeric O-ring.
All vessels were leak checked with 10 to 20 psig helium before install- ation in the vacuum chamber. A leak was found in the damaged end-fitting area of vessel S/N 001. The area was repaired with a lead foil overlay on the inside of the vessel, leak checked again, and found leak-free. Leak check of vessel S/N 002 indicated no leakage.
Vessel S/N 001 was tested with liquid hydrogen. Ultimate internal pres- sure was 509 psig; differential pressure across the structural wall was between 509 and 524 psi, because monitoring of the vacuum chamber pres- sure ceased at 2. 0 torr. Indications were that some vacuum was in the
61
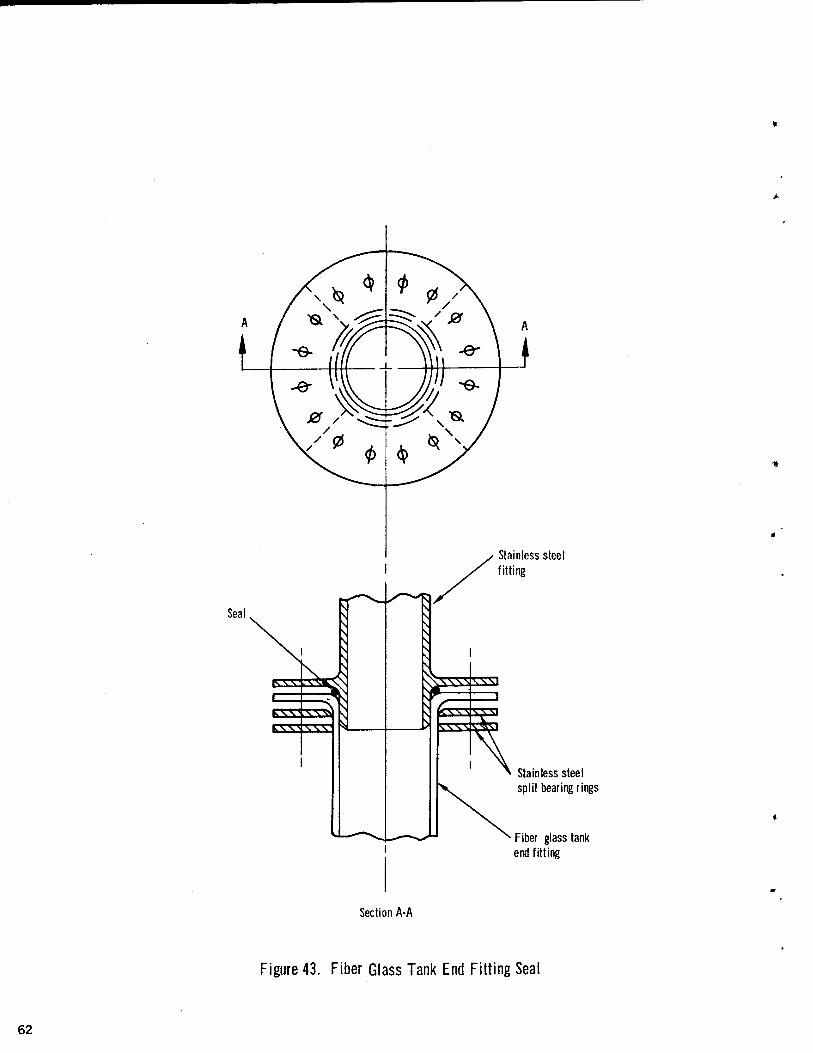
Stainless steel fitting
Stainless steel split bearing rings
Fiber glasstank end fitting
Section A-A
Figure 43. Fiber Glass Tank End Fitting Seal
62
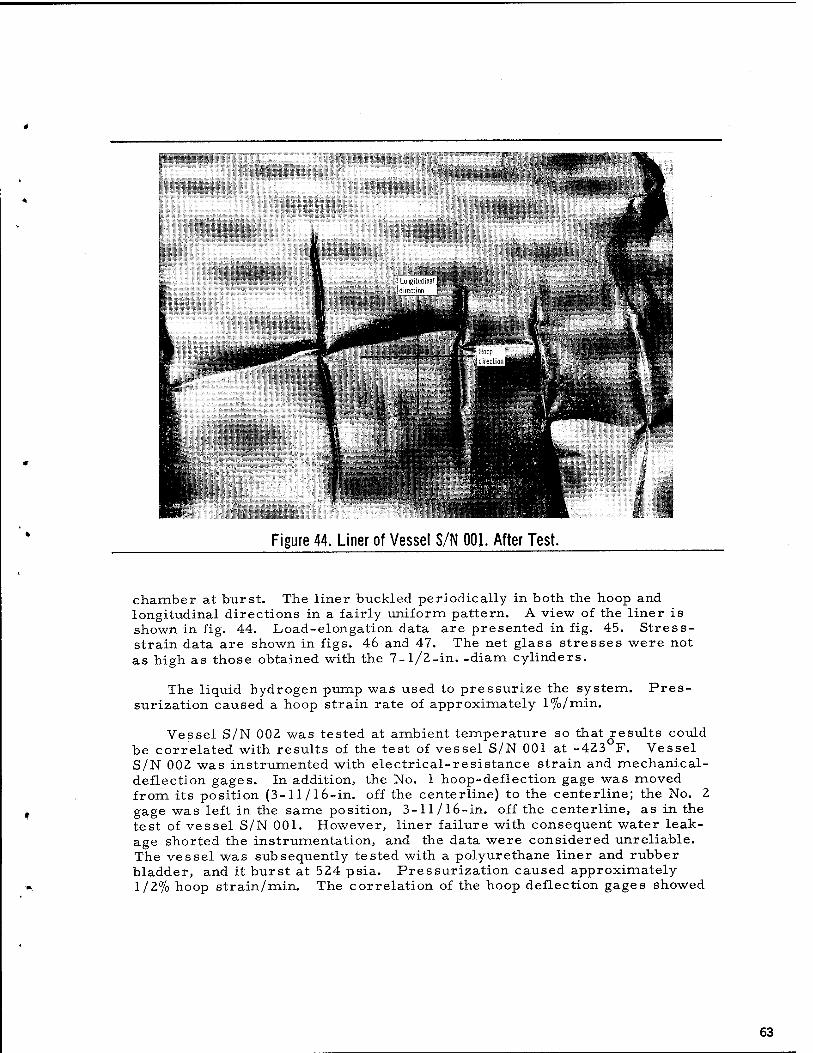
Figure 44. Liner of Vessel S/N 001. After Test.
chamber at burst. The liner buckled periodically in both the hoop and longitudinal directions in a fairly uniform pattern. A view of the liner is shown in fig. 44. Load-elongation data are presented in fig. 45. Stress- strain data are shown in figs. 46 and 47. The net glass stresses were not as high as those obtained with the 7-l/2-in. -diam cylinders.
The liquid hydrogen pump was used to pressurize the system, surization caused a hoop strain rate of approximately 1%/min.
Pres-
Vessel S/N 002 was tested at ambient temperature so that results could be correlated with results of the test of vessel S/N 001 at -423°F. Vessel S/N 002 was instrumented with electrical-resistance strain and mechanical- deflection gages. In addition, the No. 1 hoop-deflection gage was moved from its position (3-11/16-in. off the centerline) to the centerline; the No. 2 gage was left in the same position, 3-ll/l6-in. off the centerline, as in the test of vessel S/N 001. However, liner failure with consequent water leak- age shorted the instrumentation, and the data were considered unreliable. The vessel was subsequently tested with a polyurethane liner and rubber bladder, and it burst at 524 psia. Pressurization caused approximately 1/2% hoop strain/min. The correlation of the hoop deflection gages showed
63
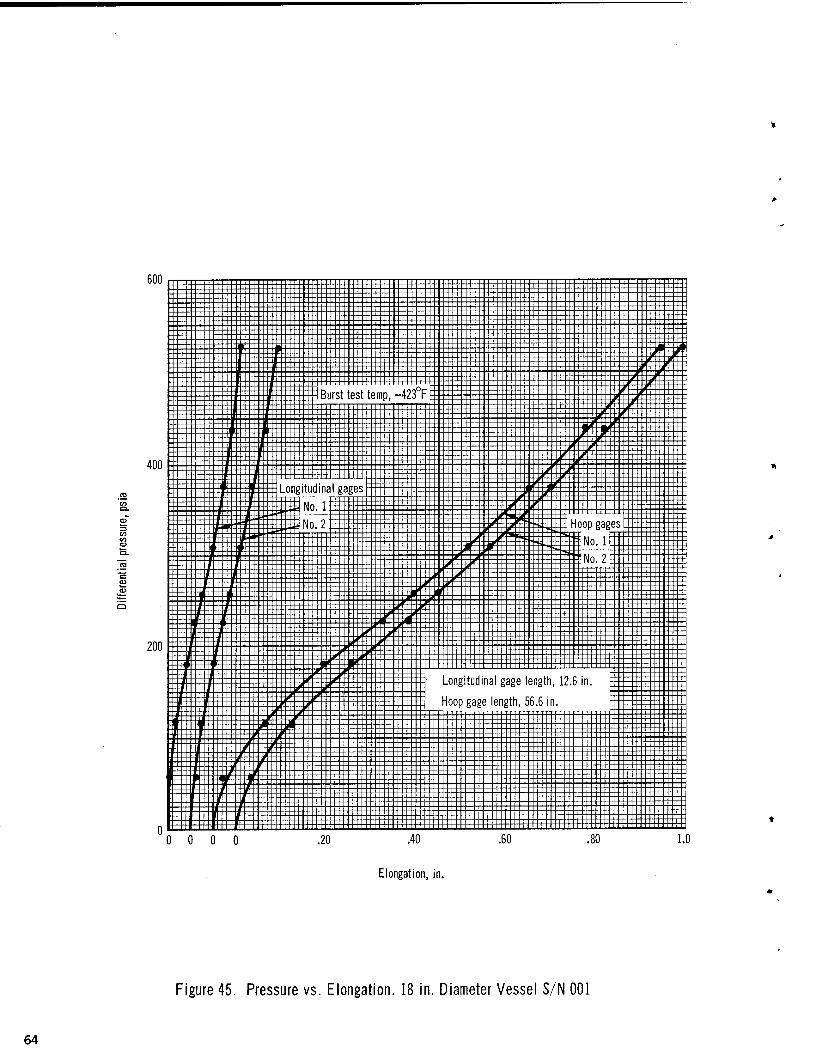
0 0 0 0
Elongation, in.
Figure 45. Pressure vs. Elongation. 18 in. Diameter Vessel S/N 001
64
.01
Hoop strain, in./in.
.02
Figure 46. Hoop Stress-Strain Diagram. 18 in. Diameter Vessel S/N 001.
65

Longitudinal strain, in./in.
Figure 47. Longitudinal Stress-Strain Diagram. 18 in. Diameter Vessel S/N 001.
66
a 38% differential increase for gage No. 1 over gage No. 2. If this ratio is applicable to test at cryogenic temperatures, a corrected stress-strain diagram of hoop strain for vessel S/N 001 is shown in fig. 48. All subse- quent 18-in. -diam vessels were tested with the No. 1 gage on its centerline.
General. - The tests of vessels S/N 001 and 002 concluded the Phase I effort.
The ultimate strength of the 18-in. -diam vessel was lower than expected at -423°F. The repeated pressurization of vessel S/N 002 caused a degra- dation of strength. The major cause of the low strengths was thought to lie, however, in the fabrication process. Inaccuracies in the winding pattern and guide-eye positioning and roping of the strand were more deleterious to the vessel strength than evident at the time. Major facilities modifications were made to the helical winding system for subsequent winding operations.
PHASE II - FABRICATION OF PRESSURE VESSELS
The objective of Phase II was the fabrication of small-scale 18-in. by 24-in. fiber glass pressure vessels for testing at -320°F and -423°F. Five vessels were fabricated in this phase. Process parameters are shown in table VI.
Helical Winding
Fabrication of vessel S/N 003 was initiated on the modified winding machine. During winding of the end fitting, the end-fitting mandrel became loose on the shaft assembly, and the liner deformed and cracked. It was damaged beyond repair, and the vessel was scrapped. (Apparently, this had the same cause as the tearing of the liner for vessel S/N 001. )
The modifications to the winding machine system did not satisfy the contractual requirements, and effective improvements could not be made in reasonable time; therefore, filament-winding of the next three structural shells was subcontracted. The fifth and last shell was wound at Douglas.
Polar Winding
The filament-winding subcontractor wound the structure shells of vessels S/N 004, S/N 005, and S/N 006 with a polar-winding machine. The design for the polar-wrapped vessel is given in Appendix C. Because the sub- contractor's longitudinal polar-wrap capability was limited to a minimum of 250 ends/circumferential in. /layer for the 9° in-plane contour, the expected pressure at burst was increased from 600 psi to 795 psi.
Vessel S/N 004. - This vessel was wound with 260 ends/circumferential in. /layer and 826 ends/in. in the longitudinal and hoop directions, respec- tively. The nickel liner was buckled into a symmetrical waffle pattern over the cylindrical portion of the vessel. The mandrel assembly had been avail- able for some time, and salt deterioration had obviously taken place. The mandrel had been heated to 110°Ffor 5 hours prior to the longitudinal wrapping in an attempt to expand the salt and support the liner. No signifi- cant improvement occurred. An originally scheduled, 3-hour heat soak between longitudinal and hoop wrapping was eliminated because the liner had buckled.
67
.01 .015
Hoop strain, in./in.
Figure 48. Hoop Stress-Strain Diagram (corrected). 18 in. Diameter Vessel S/N 001.
68
The liner of this vessel was reworked when porosity at the junction of the salt mandrel and the steel end-fitting mandrel was apparent. A lead foil overlay was applied to the interior of the vessel after fabrication to provide an added pressure barrier.
Vessel S/N 005. - Vessel S/N 005 was wound with 261 ends/ circumferential in. /layer and 821 ends/in. in the longitudinal and hoop directions, respectively. The liner was initially tight on the mandrel; con- sequently, the 5-hour heat soak prior to longitudinal wrapping and the 3- hour heat soakbetween the longitudinal and hoop wraps were waived. The liner evidenced no sign of buckling either during or after the winding operation.
The liner of the vessel had been reworked in the flat part of the dome- fitting area. In addition, a lead foil overlay was applied to the repaired area at the interior of the liner after fabrication.
Vessel S/N 006. - Vessel S/N 006 was wound with 261 ends/ circumferential in. /layer and 829 ends/in. in the longitudinal and hoop directions, respectively. During the longitudinal wrapping, the liner buckled circumferentially.
Quality of the liner for this vessel was poorer than others in the pre- ceding parts. Much rework had been done by the vendor to correct pinholes and delamination in the dome-flat area. A lead foil overlay was bonded to the interior of the vessel at the reworked dome-flat area after fabrication.
Comments. - Because securing satisfactory nickel liners on salt mandrel posed many difficulties, it was decided that the remaining fabrica- tion effort should be to establish the feasibility of a nickel liner for a filament-wound vessel. Therefore, an aluminum mandrel for the 18-in. - diam by 24-in. -long vessel was fabricated. A nickel liner was deposited upon the aluminum; after the structural shell was filament-wound and cured, the mandrel was etched with a caustic solution. Coupon testing was made with etched specimens prior to mandrel removal to ensure that the caustic caused no adverse affects on the nickel. Mechanical properties of electrodeposited-nickel specimens subjected to the caustic solution were compared with identical control specimens not subjected to the caustic solu- tion. No difference was noted.
After continued development by a new plating vendor, a nickel liner was deposited on the aluminum mandrel. The ultimate uniaxial elongation of 6% was below that specified, but analytical predictions of biaxiality effects (Appendix B) indicated that for a 1:1 strain field, the maximum strain expected of the material was approximately 3% (just about that of the filament- wound vessel). The liner was accepted.
Vessel S/N 007. - Vessel S/N 007 was wound with 190 ends/ circumferential in. /layer and 604 ends/in. in the longitudinal and hoop directions, respectively. The vessel was wound at Douglas with a polar- winding machine. During removal of the aluminum mandrel with the caustic etch solution, thermal expansion in the 190°F bath caused the straight-through shaft to put a tensile load on one dome, and buckles occurred in the dome when the dome mandrel thickness was reduced sufficiently to offer no support. One buckle was severe enough to cause fracture of both the nickel and fiber glass shell. The vessel was scrapped.
69
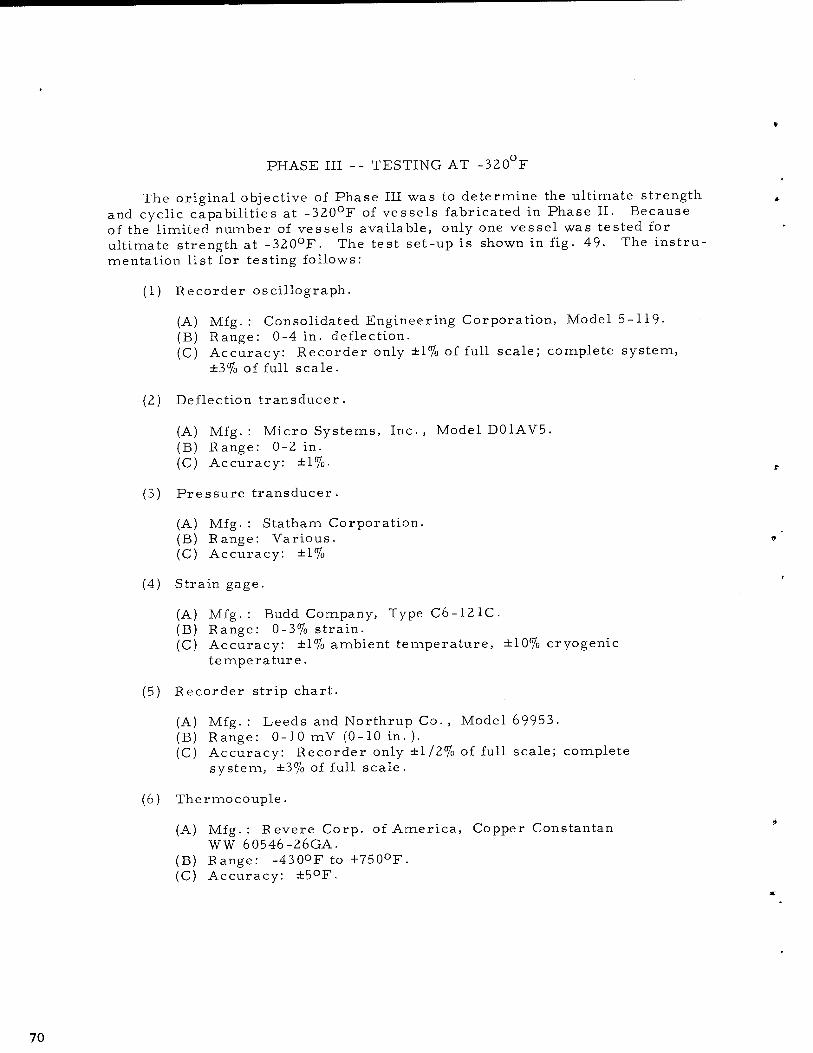
PHASE III -- TESTING AT -320°F
The original objective of Phase III was to determine the ultimate strength and cyclic capabilities at -320°F of vessels fabricated in Phase II. Because of the limited number of vessels available, only one vessel was tested for ultimate strength at -320°F. The test set-up is shown in fig. 49- The instru- mentation list for testing follows:
(1) Eecorder oscillograph.
(A) Mfg.: Consolidated Engineering Corporation, Model 5-119- (B) Eange: 0-4 in. deflection. (C) Accuracy: Eecorder only ±1% of full scale; complete system,
±3% of full scale.
(2) Deflection transducer.
(A) Mfg.: MicroSystems, Inc., Model D01AV5. (B) Eange: 0-2 in. (C) Accuracy: ±1%.
(3) Pressure transducer.
(A) Mfg. : Statham Corporation. (B) Eange: Various. (C) Accuracy: ±1%
(4) Strain gage.
(A) Mfg. : Budd Company, Type C6-121C. (B) Eange: 0-3% strain. (C) Accuracy: ±1% ambient temperature, ±10% cryogenic
temperature.
(5) Eecorder strip chart.
(A) Mfg.: Leeds and Northrup Co. , Model 69953. (B) Eange: 0-10 mV (0-10 in. ). (C) Accuracy: Eecorder only ±1/2% of full scale; complete
system, ±3% of full scale.
(6) Thermocouple.
(A) Mfg.: Eevere Corp. of America, Copper Constantan WW 60546-26GA.
(B) Eange: -430°F to +750°F. (C) Accuracy: ±5°F.
70
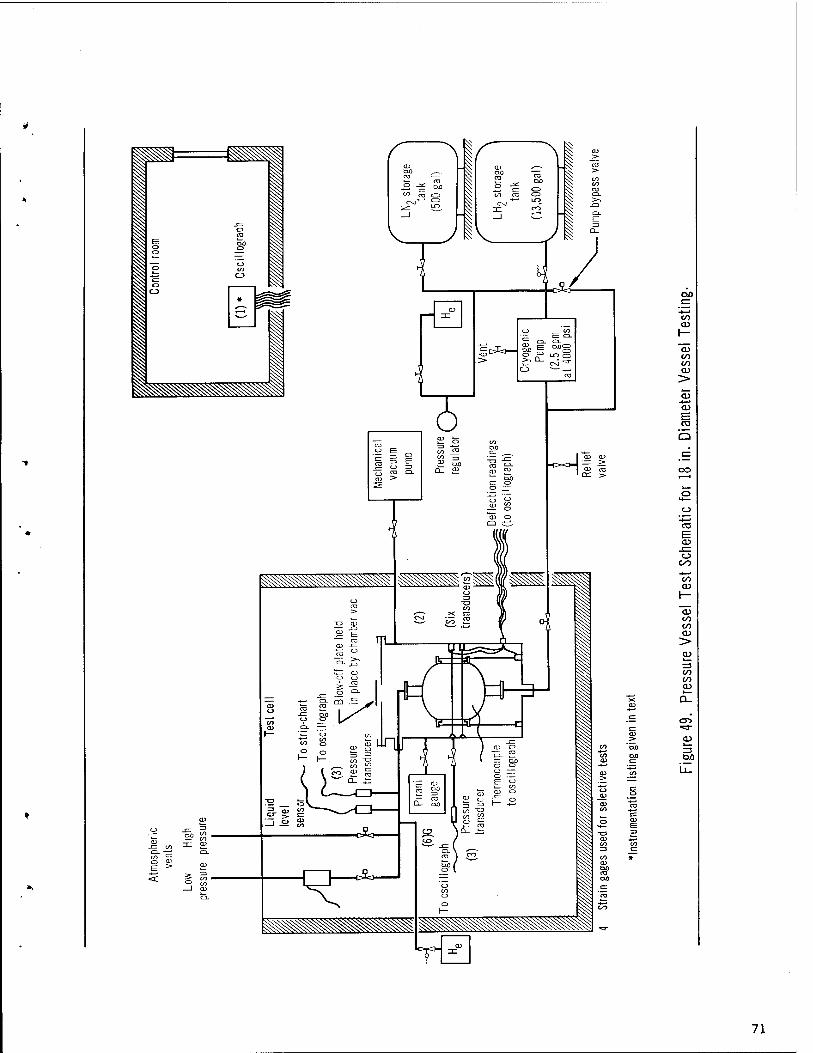
co <L>
co co cu
-*—» o> E
Q
o **— O
E CU
-£Z o CO
"cO CD
CO CO CO
•si- tu
GO
71
(7) Pirani vacuum gage.
(A) Mfg.: Consolidated Vacuum Corp. , Model GP-110. (B) Bange: 2-2, OOOu. (C) Accuracy: ±2 p. for 2-50 F-, ±5% for 50-500 |JL, not calibrated
due to compression of scale from 500-2, 000 u.
Vessel S/N 006
Vessel S/N 006 was proof pressured to 600 psia, after a previous cycle had to be aborted at 250 psia. The vessle leaked excessively on the burst (third) cycle at 595 psia. On two additional cycles at high pressurization rates, the pressure could not be held above 250 psia. Pressurization during the first three cycles caused approximately 0.7% hoop strain/min. Pressure elongation data for the proof cycle are shown in fig. 50. Stress-strain data are shown in figs. 51 and 52.
Examination of the liner after dismantling of the vessel indicated primary failure at one fitting. A radial crack was found leading from the 3-in. diam opening to the dome-flat area; another crack was tangential to the opening. The liner in the cylindrical section was buckled both longitudinally and circum- ferentially. A dye-check test of the liner post-test indicated numerous pin- holes which penetrated the liner; these were not apparent during the quality control dye-check acceptance test made on the exterior of the liner.
72

Elongation, in.
Figure 50. Pressure vs Elongation. 18 in. Diameter Vessel S/N 006
73

.010
Hoop strain, in./in.
Figure 51. Hoop Stress-Strain Diagram. 18 in. Diameter Vessel S/N 006.
74
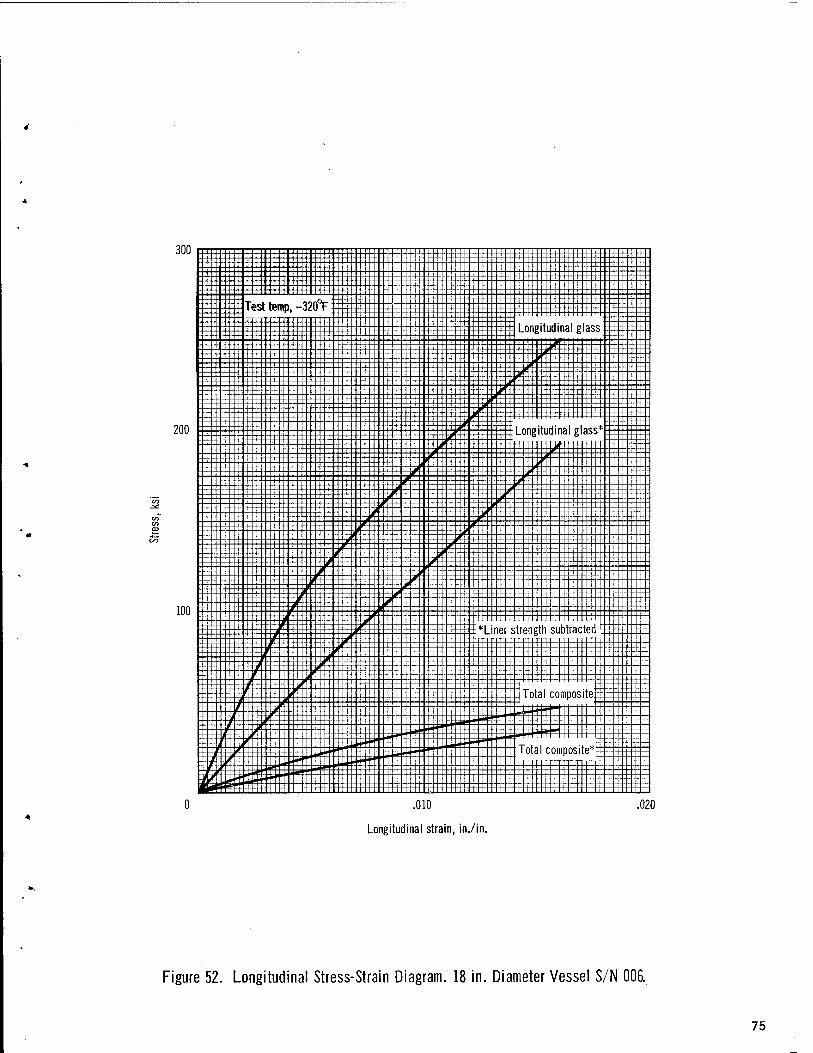
.010
Longitudinal strain, in./in.
020
Figure 52. Longitudinal Stress-Strain Diagram. 18 in. Diameter Vessel S/N 006.
75

PHASE IV -- TESTING AT -423°F
The original objective of Phase IV was to determine the ultimate strength and cyclic capabilities at -423°F of vessels fabricated in Phase II. Due to the limited number of vessels available, testing was confined to the determi- nation of the ultimate strength.
Vessel S/N 004
The vessel was pressurized to 249 psia, at which time the leakage was so great that no increase in pressure could be made. Two subsequent attempts to pressurize the vessel resulted in maximum pressures of 183 psia and 210 psia. Pressurization with the hydrogen pump caused approximately 0. 2% hoop strain/min.
. Examination of the liner by dye-check penetrant testing after dismantling of the vessel revealed many small cracks in the cylindrical section. (The liner had been buckled into a symmetrical waffle pattern during the winding operation. )
Vessel S/N 005
During the proof pressurization to 600 psia, the liner failed at 558 psia. Pressurization with the pump caused approximately 0. 7% hoop strain/min.
Rupture of the liner occurred circumferentially at the end-fitting-dome transition. Dye-check penetrant testing revealed cracks and pinholes in the cylindrical section. Figs. 53 and 54 show portions of the liner after the test.
Comments
Liner difficulties prevented the acquisition of substantial information from either Phase III or Phase IV testing.
In addition to the comments of the preceding sections and those outlined in table VII, the following general post-test points are applicable:
(1) Very little liner buckling occurred in the domes.
(2) Some portions of the liners could be stripped easily from the fiber- glass composite; others were tenaciously bonded. A scrim cloth would be advisable for future work of this type to prevent adhesive starvation during the winding operation. Liner surface treatment needs improving also.
(3) Some distress was evident at the end-fitting-dome transition. Apparently, even the low-modulus fiber-glass fitting was too rigid at the transition. Use of a more flexible resin system and reduction of the fitting diameter would provide relief.
76

E¥ m 0; xro^Y£"|>
Figure 53. Vessel S/N 005 High Liner Deformation
Strain lines in strike coat of nickel liner
■rä
Figure 54. Vessel S/N 005 Radial Strain Lines
77
<
< P Ü
i—i
H w W H
H J > W W CO J w m >
H w H W
<! i—i
P i
U i—i
i 00
0 £ H rr
ah
^ £
o d OH h
•^ HI <U
nl 1) 0) i/j
t!) Vl
c OJ m T!
en X T3
<D rt > PH
*rt3
S S 2 "" S u ß
<n „ O
!«2S V h C *. u u a
ft 3 5 h
s
£ 0)
ft J3
PQ > JH ,0
O 01
rt > u TJ ¥ 0) S) rn
^ P
J rt T) Q ni Oß rt CQ
i .9 -a .S
- .S
S J
j rt B rt ! rt " a ' O QJ J Iß
i S 2 « , rt M o
;»1rt l 1 Q rt 00 n
fi * £ o Ü - IJ S
f-< r-
»S is
rt S S « .2 * .3 ■ ÜJ fn u ^ nJ In d
3 o 3 o fi o Rj !
i3io.
*> « « 0) « ö ^ > ,fl J oi en .£ i-l
2 < ft
78
(4) Post-test examination of the 3-in. diam elastomeric O-rings revealed severe uneven distortion of the O-rings. A partial loss of vacuum in the vacuum chamber occurred during all of the cryogenic testing at chilldown, which indicated potential seal leakage. The seal was sat- isfactory for the ultimate strength tests, but for longer periods of pressure, an improved seal would be needed.
79
SUMMARY OF RESULTS
Results obtained during the course of the program include the following:
(1) Mechanical properties (yield strength, ultimate strength, modulus of elasticity, and ultimate elongation) and liner contraction were determined for films of Mylar "A", Tedlar BG30WH, H-Film, Seilon UR29E, glass flakes, and electrodeposited foils of nickel, silver, and copper at 75°, -320°, and -423°F.
(2) Permeability to nitrogen and hydrogen gas was measured on unstressed samples of the above films at 75°F. All of the polymer- ics showed some permeability to both gases; the metallics exhibited little, if any, permeability.
(3) Electrodeposited nickel was deposited which had sufficient total elon- gation at -423°Fto match the elongation at burst of a filament-wound vessel.
(4) Repeated pressure cycling of a biaxial cylinder to 36% of ultimate pressure at -423°F was accomplished with an electrodeposited nickel liner.
(5) The ultimate strength of S-994 fiber glass filaments in a biaxial cylinder increased approximately 20% when tested at -423°F com- pared to 75°F.
(6) Mandrel development with both salt and aluminum mandrels, together with the attendant effects on liner deposition and vessel fabrication, prevented a full evaluation of the fiber glass properties in a filament- wound vessel.
(7) The investigated polymeric films had a low total elongation at -423 F, which when coupled with their high-differential contraction rates (compared with the glass-resin composites), made them unsuitable for liners designed to take all of the strain in tension in filament- wound pressure vessels operating at high strains.
(8) Problem areas worthy of further investigation are the following:
(A) Improved analytical study of the liner-adhesive fiber glass mechanical interaction.
(B) More knowledge of mechanical behavior (strain cycling, biaxi- ality, etc. ) of the liner material.
(C) Greater process control of any electrodeposited material.
(D) Improved mandrel materials and mandrel sealing methods.
(E) Improved adhesion techniques (adhesives, adhesive-resin compatibility, liner surface treatment, etc. ).
81
APPENDIX A
ELECTRODEPOSITED NICKEL LINERS
Requirements
Based on previous work by General Dynamics/Astronautics (refs. 40 through 43) with nickel for structural use in cryogenic applications, the fol- lowing specifications were established for the electroformed nickel liner:
(1) Plating solution-sulfamate chloride (HVW).
(2) Temperature - maximum 125 F.
(3) Nickel purity - minimum 99% (W).
(4) Sulfur content - no greater than 0. 004% (W).
(5) Stress reducer concentration minimized.
All nickel liners in this program met the above specifications.
Based on the specific liner application, other conditions were specified as follows:
(1) Liner to be free of pinholes, cracks, and other porosity.
(2) Tensile properties at 70°F to 75°F (Federal Test Method Standard No. 151).
Elongation - 12% minimum
0. 2% offset yield strength - 55, 000 psi minimum
Ultimate strength - 85, 000 psi minimum
(3) Test-section thickness to be 0. 005 to 0. 008 in. and as uniform as possible.
(4) Liner to have smooth surface.
(5) The liner to have no porosity to prevent leakage under pressure.
The specified elongation was estimated to permit sufficient strain to prevent failure under biaxial conditions in the proposed environment.
The specified strength was believed sufficient to maintain metal integrity at severe cyclic strains.
83
Thickness was selected to assure impermeability. Thickness and thus weight probably could be reduced if the electrodeposition process could be made more reliable. It was desired to maintain a uniform liner thick- ness in areas of appreciable strain to minimize weight and obtain consistent elongation behavior. Consistent elongation behavior would eliminate overextension of the liner in localized areas and prevent premature failure.
Smooth liner surface was desired to facilitate surface preparation for adhesion and to prevent stress concentration points and damage to glass fiber from sharp dislocations.
Problems
For the 18-in. -diam test vessels, in particular, liner problems encoun- tered in this program at one time or another included porosity, low elonga- tion, low strength, nonuniform and out-of-specification thickness (both high and low values), and surface roughness. Contributing to these difficulties were tooling and lack of electrodeposition process control.
Two types of mandrels were used for the 18-in. -diam test vessel. One consisted of machined salt in the main body with steel end-fitting mandrels meeting the salt in the small cylindrical section just outside the dome/end- fitting radii. All parts were secured to a central hollow shaft. The hollow shaft was stiffened with an inner shaft, which also served to seal perforations in the outside shaft through to the salt. The second mandrel type was machined aluminum with a shaft extending through the body. The body and flanges were welded to the shaft.
Problems with the salt mandrel included sealing of the mandrel andmain- taining of the seal during handling and plating (this problem was particularly acute at the two salt/steel joints although not limited to these locations), and the tendency of the salt and nickel liner to separate, causing the liner to wrinkle during subsequent filament winding. The large differences in coeffi- cients of expansion between both salt and steel and salt and nickel were believed largely responsible for these difficulties despite efforts to eliminate heat cycles from initiation of sealing through plating completion. The mechanical construction of the mandrel allowed deflections during handling of the mandrel. The resulting movement at the salt/steel joints contributed to joint-seal difficulties.
Various sealing materials for the salt mandrel were evaluated. Acrylic lacquer was unsatisfactory because of incompatibility with the silver conduc- tive coating applied in the preparation of the mandrel for plating. PVC was unsatisfactory because it tended to blister. A butyl rubber formulation (dip and spray) required vulcanization at a temperature incompatible with the salt.
An epoxy spray coat was used for sealing,although it proved not entirely satisfactory. Failure of the conductive coating caused numerous pinholes and cracks in the nickel liner. Failure of the seal coat caused failure of the conductive coating, damage to the mandrel by dissolution of salt by plating
84
solution, and probable serious contamination of the plating bath with the salt (potassium nitrate and nitrite). Use of the sealant contributed in some cases to surface irregularities because of sloppy finishing of the coat. It could also cause loss of dimensional tolerances, although none was detected in the program.
Problems with the one aluminum mandrel included porosity in the welds and lack of control of dimensions. Porosity of the welds required filling and subsequent coating of the entire mandrel with conductive material. Out-of- tolerance dimensions were accepted because no substantial effects were antic- ipated subsequently.
The most serious problem with the nickel liners was porosity. All but two liners (for vessels S/N 003 and S/N 007) had pinholes, cracks, and/or interlaminar separations of nickel layers parallel to the nickel surfaces. Pin- holes and cracks were detected by dye-penetrant testing. Interlaminar sepa- rations were detected usually post-test. Pinholes appeared in various liners in all locations; cracks were generally confined to the end-fitting/do me and end-fitting/flange radii, or at the salt/steel joints. Some defects were detected by dye-penetrant check in areas previously showing no defects per the dye-check. Pinholes and cracks could have been caused either by failure to apply conductive coating to the entire surface of the plating area or to a failure of the coating after application. In addition, they could have been caused after plating either by mechanical or thermal stresses or by stresses induced in the nickel during the plating process.
Interlaminar separation invariably occurred in areas where a redeposit was attempted to close crack and pinholes in the previous deposit. Especially under cyclic conditions, presence of a separation or even a weakness allow- ing separation is intolerable. The liner will likely fail inter laminar ly, buckle and leak through the original defect. Interlaminar weakness can also be caused by an interruption in the plating process (e.g. , power failure, removal from the bath, etc. ).
Some tensile properties of the liner at 75 F were outside the specified range, and in the case of liners deposited on salt mandrels, some deteriora- tion of properties became apparent as additional liners were fabricated (probably caused by contamination of the plating solution with dissolved salt). Elongation was too low for one liner on a salt mandrel (vessel S/N 004, elongation 9%) and for the liner on the aluminum mandrel (vessel S/N 007, elongation 6%). Ultimate strength was low on one liner deposited on salt (vessel S/N 004, 80, 000 psi).
Measurement of tensile properties is made by test of specimens pre- pared from a flat coupon plated at the same time as the part. There are serious deficiencies in the method because of the possibility that the coupon is not representative of the nickel in the actual part. Some evidence exists that different properties exist in the final part within itself and in the coupon within its elf, depending on orientation in the plating tank. There has been a noticeable difference in mode of failure on one side compared to the other in some test specimens. One side of certain specimens has been observed to exhibit brittle type failure and the other, a ductile type. Selection of a test specimen configuration and its preparation are critical if meaningful data are
85
to be obtained. Burrs or grooves in specimen edges, jaw slippage, and uneven grip in the jaws of the testing machine, etc. , can influence results substantially. During this program, many specimens failed at one or another extensometer grip. Some failed outside the test section.
Thickness of the nickel liner was invariably nonuniform even in the straight cylindrical test section. Thickness was outside the specified range of 0. 005 in. to 0. 009 in. both high (to 0. 010 in. ) and low (0. 004 in. ). Two liners (vessels S/N 001 and S/N 006) were within specification at the mea- sured points in the test section. Difficulty in plating to sufficient thickness in the small radii at the ends of the end-fitting cylinders required a broaden- ing of tolerances in the surrounding areas so that enough nickel could be deposited at these locations. Even then, when nonshaped anodes were used, thickness at the radii was generally low. These were within noncritical areas of low strain. All thickness measurements were made post-test, because no satisfactory nondestructive method was available to measure nickel sections on salt or aluminum mandrels.
Surface of the nickel was not entirely smooth on any mandrel. Liners contained small pips on the outside surface either in localized areas or over the entire surface. These pips generally ranged to 0. 020-in. diam and height. Spacing between pips was roughly from 0. 1 in. to 0. 25 in. The need for cleanliness of the bath is demonstrated in Fig. A-l, which show photo- micrographs of sections through some pips of the vessel S/N 007 liner.
Recommendations
If salt mandrel use is contemplated in future work, a sealing method compatible with the electrodeposition process and dimensional tolerances must be developed. The method must prevent failure of the conductive coat- ing and damage to the mandrel by salt dissolution. A somewhat flexible sealant and conductive coating would be desirable so that the system would not fail because of exposure to environmental changes. A method of inspec- tion of the conductive coating must also be developed to assure total coverage. Such a method must not affect the subsequent electrodeposition process. Salt should be used in all plating areas to eliminate salt/metal joints and to avoid difficulties caused by differences in coefficient of expansion.
Aluminum mandrels should be fabricated with welds free of pits, pinholes, cracks, or other porosity in order to avoid extensive resurfacing.
No interruption of the plating process (e. g. , power failures) can be toler- ated because they may contribute to interlaminar weakness in the nickel. No rework should be attempted with present techniques. If there are pinholes, cracks, or other porosity present in the liner, the liner should be scrapped.
More accurate data on effect of electrodeposition process variables should be derived to achieve the desired properties. Electrodeposition of the part and test coupon, preparation of test specimens, and testing must be carefully monitored. Some consideration must be given to the preparation of specimens by cutting of specimens from an actual part (and thus destroying
86
jk»5E^ 'Siwfc' JL. c .,.^>v>. C-«.',,>
. ■"■ ■ ■-■■■■' i *'.f .li
Figure A-l. Photomicrographs, 18-ln. Diameter Vessel S/N 007 Liner (x 250)
87
the potential part) on some regular basis. Specimen configuration should correspond to ASTM standards. Test-section width should be tapered to the middle and the edges smoothed. Specimens should be gripped to distribute load evenly over the width of the coupon tabs. Thickness of the specimen should be determined in away to eliminate effects of pips.
Shaped anodes and controlled consistent agitation should be used in the plating bath to achieve uniform specification thickness with smooth surfaces. Other variables affecting these properties should be carefully controlled.
The first three liners deposited met all the important desired properties. They were deposited early in the program without complete bath control. However, subsequent liners were not as good. These results show the need for complete bath analysis and control.
The careful selection of suppliers who have technical manpower and equipment available, and who are willing to exercise close control of the myriad variables associated with electroforming a complete thin nickel foil, cannot be overemphasized.
88

APPENDIX B
BIAXIALITY CONVERSION CRITERIA
The metallic liner used as a gas and fluid barrier in the fiber-glass vessels is strained when the vessel is pressurized. The stress-strain diagram for the metal liner is altered when strained biaxially, as compared with uniaxial data. The applicable stress-strain diagram of the metal must be known to subtract the strength contribution of the metallic liner from the vessel stress-strain calculations properly.
The method to determine the desired biaxial stress-strain diagram is described by Harrington (ref. 44). It is necessary to consider elastic strain and plastic strain separately.
The general equation for elastic strain is given by
'lE =E ((rl -^2 "^ (1)
where
CTI > a?» and CP> are principal stresses
e, .p = principal strain (elastic) associated wither,
E = modulus of elasticity
I-1- = Poisson's ratio
Introducing a stress-state parameter K = a'7/(ri and cr, = 0 for a thin-walled
pressure vessel into [eq. (1)] yields
IE °1 ^-(1 -UK)
or
€1E " ^E" (2)
where ß = (1 - (J-K).
89
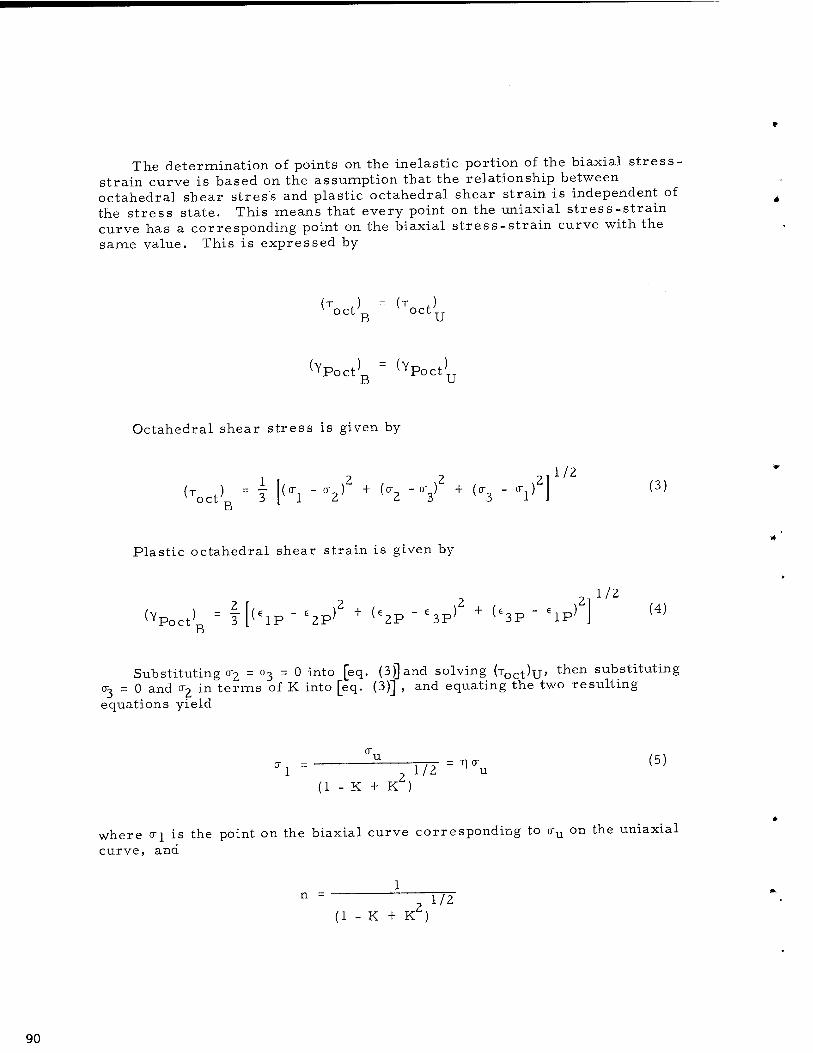
The determination of points on the inelastic portion of the biaxial stress- strain curve is based on the assumption that the relationship between octahedral shear stress and plastic octahedral shear strain is independent of the stress state. This means that every point on the uniaxial stress-strain curve has a corresponding point on the biaxial stress-strain curve with the same value. This is expressed by
(T-t}B = ^
(Ypoct^ = ^Poct^
Octahedral shear stress is given by
1 (T^'B = 3
(«Tj -o-/ + («r2 -er/ + (<r3 - o^)2 1/2
(3)
Plastic octahedral shear strain is given by
(V 2 r
Poet' 3 a (€1P- 62P} + (€2P " e3P} + (€3P " £1P)
1/2 (4)
Substituting <r2 = 03 = 0 into [eq. (3)] and solving (Toct)u, then substituting 03 = 0 and tr2 in terms of K into [eq. (3)] , and equating the two resulting equations yield
u T72=Tlöu
(5)
;i - K + K )
where crj is the point on the biaxial curve corresponding to cru on the uniaxial curve, and
1/2 (1 - K + K
90

Introducing the strain parameters ai - £2P/61P an<i G'3 = €3P/€1P and the equation of constancy of volume into [eq. (4)J yields
2e 1/2
<*Fbct>B -^k <* + °2 + *3> (6)
From the deformation theory of plasticity,
eip = A((ri -T -T-)
62P = A(-T-
+
,r2--r) (7)
63P = A(--y-i- + T3)
where A is the function of the stress state and the material. Substituting for o"2 in terms of K and 03 = 0 into [eq. (7)Jyields the strain parameters in terms of the stress parameter K:
a = -1 + 2K
2 2 - K (8)
-1 -K 2 -K (9)
By substituting into[eq. (4)1 for the biaxial and uniaxial conditions and equating the results produce the following equation:
uP IP
2 - K
2 X/2
(1 - K + K )
(10)
€1P =X £uP
91

2 - K
.(1 2 */2
- K + K )
where
and eipis the biaxial plastic strain corresponding to the uniaxial plastic strain «up-
Any point on the uniaxial stress-strain curve can be converted to a point on the biaxial stress-strain curve for any K by use of [eqs. (2), (5), and (10)]. This procedure is shown graphically in fig. Bl.
For the work on NAS3-2562, the stress parameter K was not known. However, from the strain data of each test, the strain parameter #£ could be determined and K found by solution of [eq. (8)]. The stress-strain curves for nickel in the hoop and longitudinal directions can be determined from uniaxial data at the test temperature. The biaxial curves are used to determine the load taken by the nickel liner. These biaxial stress-strain curves are shown in figs. B2 to B5.
The basic data required to calculate the plastic instability stress for any state of biaxial stress are derived from the uniaxial nominal stress- strain curve. This curve can be changed to the true uniaxial stress-strain curve by the following equations:
e = log (e + 1) u toe u
o- = S (e +1) uu u u
where
e = uniaxial true strain u
e = uniaxial nominal strain u
n- = uniaxial true stress u
S = uniaxial nominal stress u
It is possible to obtain a biaxial true stress-strain curve for any value of K from the uniaxial true stress-strain curve by methods previously outlined.
The general criterion for tensile instability in a pressure vessel is that plastic strain proceeds without an increase in internal pressure.
92
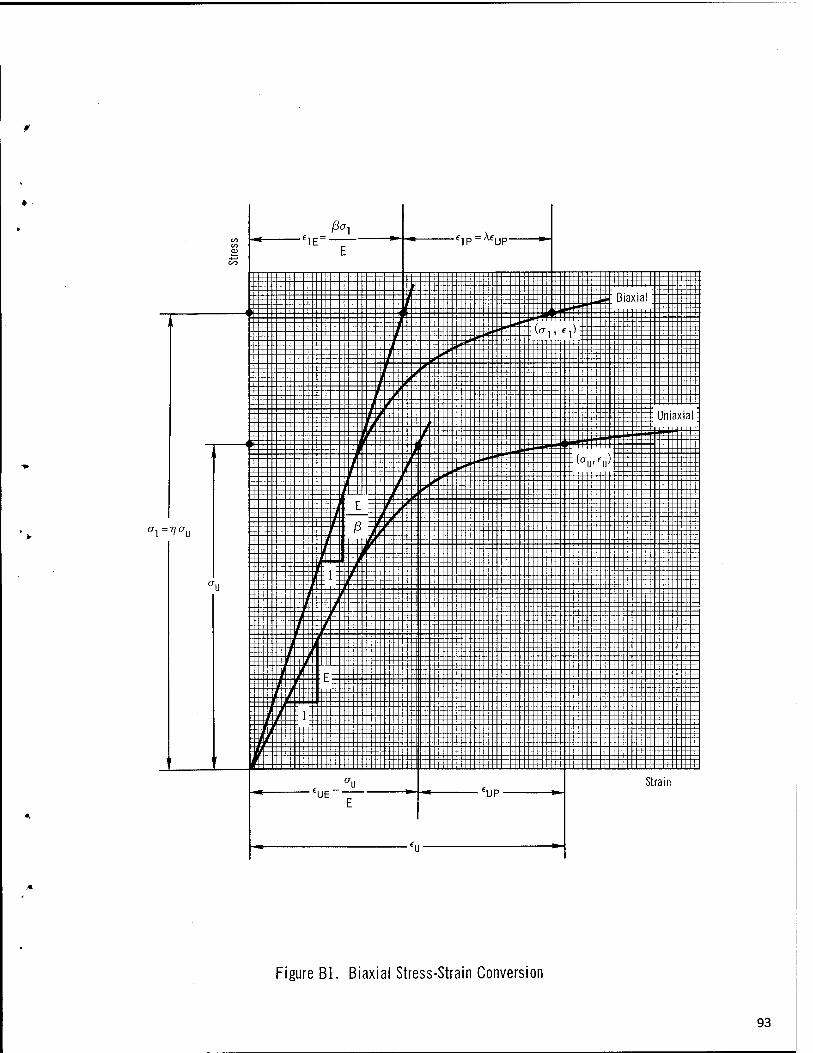
a}=T]au
Figure Bl. Biaxial Stress-Strain Conversion
93
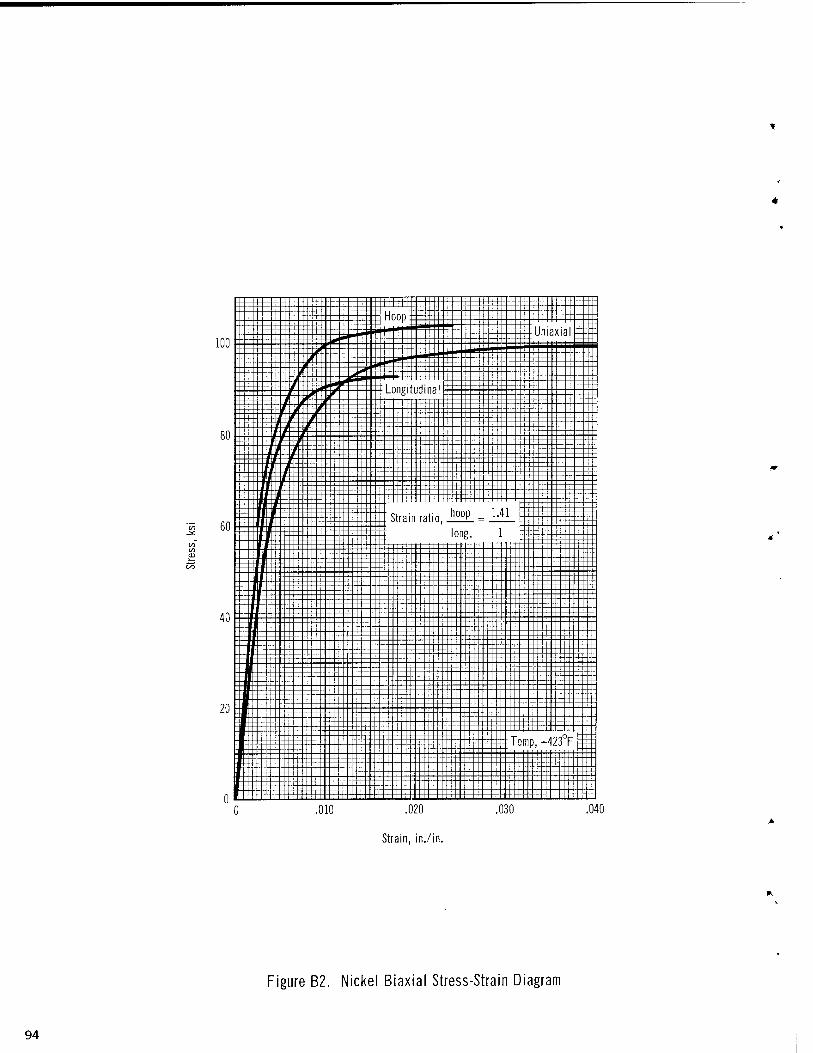
.010 .020
Strain, in./in.
Figure B2. Nickel Biaxial Stress-Strain Diagram
94
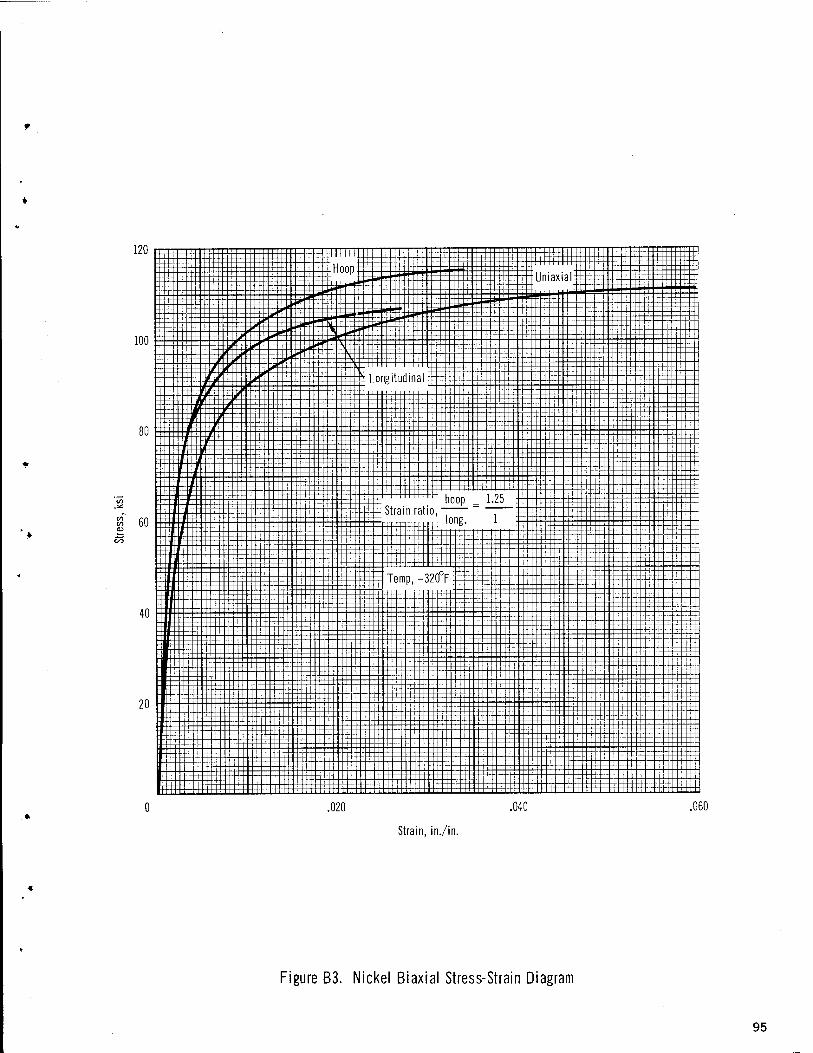
120
40
-r : 1| + --^44444fl+--4J:--||l-|-|-----| +H+H-:::::::::::^r::—4::::::x:
«ffffffHnnPffntttttti'T1' 1111 1 m''MTTTlTTTTiTI,, ■ ■ , 1 1 1 ! M P +H - tijflttl in 1 H| Uiiiaxinl , 11 | -i | |
Trift til 11 Longitudinal rttpd^jm^ [ Lji f^ltl^ljlJ4^
Tf 4+"H l 1 T^t T ::i:::::i:it:::i:::::::3
1 1 \\\\\\m T'TtT-rT 1 "OOP LZb ::: + ::::^::::::::::I::::::::::-::::::: I-TH-T-H—-+-—i— Sliain laLio, , , ----^-T ± T:j5^5:S"flTJli4T!T[| g' ' T T t " T
111 [ | 4^ 1111 ^~--^f-^--+^---\--~----"-j4-^~T~""~-3: TEIEX. TF ITxF gS|LgSEEEEEEEEEE£=SEEEEEEEEE:_EpI-EEE:EEEEiZ£EESElE:EE~:EEEEEEEE|^=EJ ^^^^ Temp, 320UFT jffm fftlWf^ TT allm|ffii|^j|j
i:jı:i:±::::::::::::±::^::::::::::i:::S:--TEjE |S±S+i2Et..
JP^ic:: iBwIffBilHwBM \w
T "yH—r T x" " " "i ....: - - . -- - - i
20
.020
Strain, in./in.
Figure B3. Nickel Biaxial Stress-Strain Diagram
95
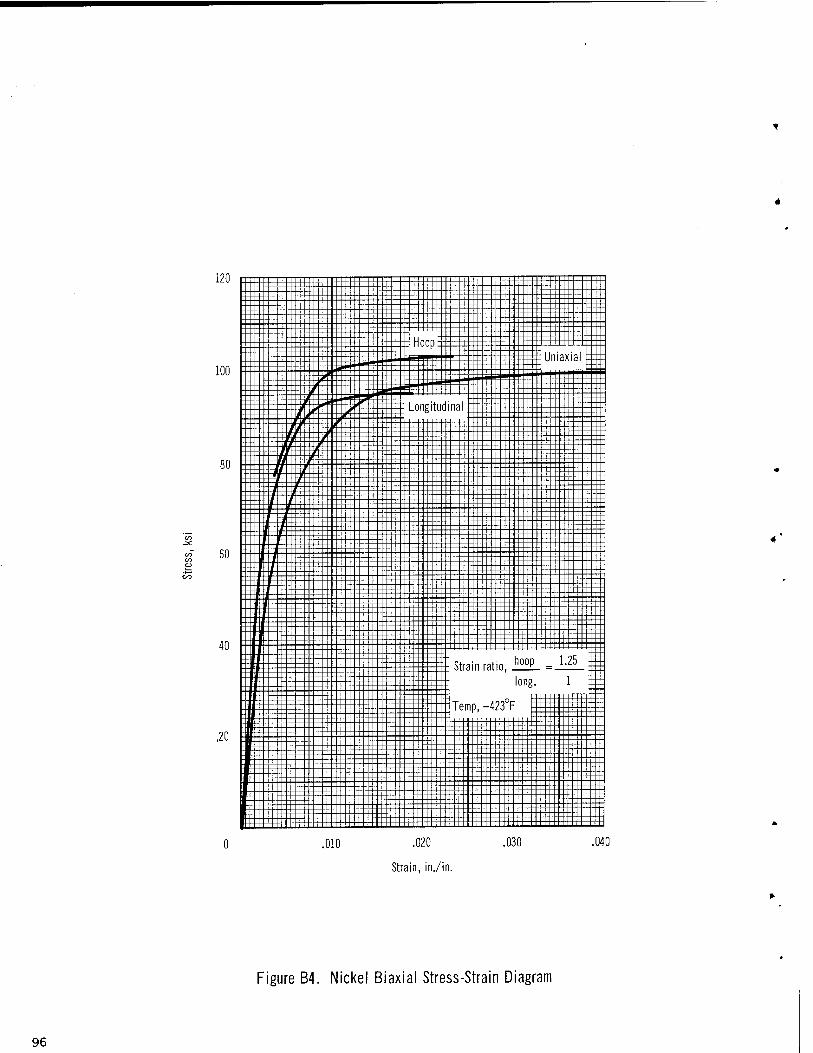
120
40
,20
.010 .020 .030
Strain, in./in.
Figure B4. Nickel Biaxial Stress-Strain Diagram
96

120
60
40
20
.010 .020 .030 .040
Strain, in./in.
Figure B5. Nickel Biaxial Stress-Strain Diagram
97
This can be expressed by dP/de = 0. It is shown by later work of Harrington (ref. 45) that for a pressure vessel this occurs when dq/dej = (3/2-K)<rj. The physical interpretation of this equation is that the slope of the true stress - strain curve at the point of maximum stress is equal to 3/2-K times that stress.
The plastic instability stress means that the metal cannot accept any more load and will strain freely to failure. The metal liners of filament wound pressure vessels are prevented from straining freely at this stress by the surrounding fiber glass. However, it may be desirable to select a metal whose stress-strain properties do not permit the point of plastic tensile instability to be reached at the working strain of the vessel.
Fig. B6 shows an example of a material that exhibits an ultimate elonga- tion of 12% in a uniaxial tensile test, but plastic tensile instability will occur at a strain of 1. 5% in a 1:1 biaxial strain field.
98

Strain, in./in.
Figure B6. Plastic Instability Determination
99
APPENDIX C
VESSEL DESIGN
Structural Shell—Helical Winding
The design procedure which has been followed is that outlined by Darms and Molho (ref. 46).
Allowable filament strengths in the longitudinal and hoop directions, respectively (Ffu.f 1 and FtUj f jj» are evaluated as functions of fitting diam- eter, vessel length, wall thickness, and vessel diameter. Governing factors for these parameters are given in figs. Cl through C4.
Then:
Ftu, f, 1
tu, f, h'
= 0. 89 F. K,K,K,K, tu, s 1 Z 3 4
where Ftu s represents the fiber ultimate tensile strength, the factor 0. 89 is determined from empirical analysis, and K, K-, K_ and K. are vessel design constants.
For design parameters of
internal pressure, p = 600 psi
vessel diameter, D = 17. 88 in. c
overall length from dome to dome.L = 24. 6 in.
cylindrical section length,L = 13. 5 in.
and assuming, F Q = 415, 000 psi
and geodesic-isotensoid domes,
the following factors are obtained: Kj = 1 , K2 = 1 for geodesic-isotensoid domes with equal end-fitting diameters.
The factor, K3, is obtained from fig. C3 (thickness effects) since for longitudinal filaments,
p> t . /D = -7-r=—— Referenced data indicates f<* c 4 Ftu, f,je
F+ , . =0. 825 F, tu, 1,5. t, u, s
600 - 0.438 x 10"3
4(0.825) (415,000)
101
l.U r-r-r-
0.6 N
0.4 ^.
\ v.l
Minimum practical. ,. diameter —v
~ A. ~
o11 1 LA 11i 111 M M M M11 1 1 M 1.0 1.1
Factor K
Figure Cl. Design Factor for Variation of Allowable Filament Stress as a Function of Boss Diameter
102

J.U
'S $
4.0
o
= 3.0 TO Longitudinal filamer 11 " *"" CD
CD
TO -o o "tr "ao S 2.0 CD CO
CD
1.0
0 * 0.9
Factor K„
Note: Balanced-in-plane head contours assumed
1.1
Figure C2. Design Factor for Variation of Allowable Filament Stress as a Function of Vessel Length
103
,uou 1 p- 1 1
1 1 1
1 1 I \ 1
fT>R 1 I 1— .UZJ I 1 T 1 1 1 1 J L Hoop filament \ Y I i J SÜ _\_\ __^
n^n 1 1 . Y"\ 1 j r i \ \ VJL- \ \ _\_ \
i i j \ \ \ \
mr V \ .UJ.Ü ~\ r \ \ \ i.
\ C J J t. \ \ j \ \ _i i
Y \ i ni« \ ^ ]
•U1U r" ^ \ t ~1
S C L 1L \. V __j |_
s s *\/x i VT^L _i
5 ^ ^ W
.005 S S I— T 1 J^S -_| 1 ^Sh ^ÜN
.... . ,.. , S^^k. ■ Longitudinal tilament ■ ss ^^
, ^^w.^^ ^**^ ^
"■s^ **»9--
^^■■^"»■iZE A ^_ 1™
v .70 .90 '1.10
Factor (^
Figure C3. Design Factor for Variation of Allowable Filament Stress as a Function of Wall Thickness
104
DU —
-4— -1 —1 J 1
~j~ 1 1 U *' 1 i —r Hoop ri lament 1
i 1
1 1 | 1 1 I I I j
I i_j 1 i /in - 1
. 1 I j
E= J "^' 1
o 1 Q | .-T 1
I 30 _ ± : t CO ■ |
X3 J
(/J - 1 1
CD 11
1 1 1 —4— I I
1 1 ?n —1— .... 1 1
i 1 1 A V, J i . % i
1 f T J J \ 1
II V, in J_ L
\ j ^ 1 i \
V t \ A
A. .1 ^ \
S v o'l 1 LAI 1 i 1 1 1 1 1 i 1 M 1 1 1 1 1 1 1 1 1 1 1 1 1 1 1 1 i 1 i 1 1 1 1 1 M 1 1 1 1 ilSil
0.6 0.7
Factor K,
0.9 1.0
Figure C4. Design Factor for Variation of Allowable Filament Stress as a Function of Vessel Diameter
105
where tf jj = equivalent filament thickness in the longitudinal direction. Therefore, K3 = 1. 10 from fig. C3.
For hoop filaments, p
t /D = rr-= Referenced data indicates f, h c 2 F , ,
tu,t' n F, - , = 0. 855 F, tu, f, h tu, s
600 = 0.846 x 10"3
2(0. 855) (415, 000)
where tf .n = equivalent filament thickness in the hoop direction. Therefore, K3 = i/o from fig. C3.
The factor, K4, is obtained from fig. C4 (diameter effects):
Longitudinal K^ = 0. 89
Hoop K4 = 0.965
Calculation of design allowable is thus
Longitudinal: F^ f> ^ = 0. 89 ^ K2 K3 K4 F^ g
= 0. 89 (1. 0) (1. 0) (0. 89) (1. 1) (415, 000)
= 361,000 psi
Hoop: Ftu f h = 0.89 (1-0) (1. 0) (1. 1) (0.965) (415,000)
= 391, 000 psi
Equivalent longitudinal thickness is
pa _ 600 (8. 940) tfj = 2ff = 2(361,000) (0.954)
tu, f,£
2 = 0. 00778 in. /in. perpendicular to the strand
where
a = helix angle of 12 -j .
Equivalent hoop thickness: . 2 pa tan a
t f' h Ftu, f, h 2 Ftu, f,jj
6°°/8nn
9n
4°> - 600(8. 940) (0.222)2
^>uuu 2(361,000)
0. 0133 in2/in.
106
Winding:
-5 2 Area/end = 2. 076 x 10 in.
Number of longitudinal ends/in. perpendicular to the strand (r). ) for the total cycle:
^ tr . /(Area) , f ,1 v 'end
0. 00778 in.2/in. v-5
= 376 ends/in. 2. 076 x 10
For the half cycle: 188 ends/in. /layer.
Number of longitudinal ends/circumferential in., r\. , for the total cycle:
•n = r\. cosa = tr . (cos a )/Area) , 'jj 'J2 p 1,1 v ' 'end
= 376 (0.976) = 368 ends/circ. in. or 184 ends/ circ. in. /layer.
(Note: A typographical error in Darms and Molho gives r\ = t, . /(Area) , (cosa) ). 1,1 x end
Number of ends/in. (hoop)
tr , /(Area) , f, h v 'end
0. 0133
2. 076 x 10' 640 ends/in.
End-Fitting Root
1/4"= t
wrrrrTTn//^ cn
mnrrm -|b=13/4-
- a = 3 3/4
107
Flexure. - From Roark (ref. 47, pp. 200 Case 21), taking a disk with inner edge fixed and supported and a uniform load over bearing surface:
At inner edge
Max stress cr = —ö~ r 4t2
(4 a4 (m+1) log b -a4(m+3) + b4 (m-1) + 4 a b )
a2(m+l) + b2(m-l)
where
n- = radial flexural stress r
w = uniformly applied load
m = reciprocal of Poisson's ratio
Assuming a resin-rich fiber-glass laminate with
m = 1/0. 35 = 2. 86,
then
a- = 48, 800 psi
Brink (ref. 48) reports an average of 77, 900 psi and 83, 200 psi flexural strength for two epoxy formulations at ambient temperature; average of 145,000 psi and 122,000 psi at -423°F. Therefore, <rr is satisfactory.
Shear.
avg
A I z 1.2, 4wir(a -b ) 3. 5
2,100 psi
where T is the shear stress. The possible Tmax = 1. 5(2,100) = 3,150 psi. MIL-HDBK-17 gives average values of interlaminar shear above 5,000 psi. Transverse shear strength across the glass plies should be higher. There- fore maximum expected shear of 3,150 psi is satisfactory.
Structural Shell - Polar Winding
Vendor Winding. - For a polar wrapping angle, ß, of 9 and the minimum limitation of 250 ends/circ. in. /layer for the longitudinal wrapping,
tr . - ü«(Area) ,/cos ß i,ü 'JT 'end'
= 500 (2.076 x 10"5)/0. 9877
= 0. 01051 in. /in.
108
The internal pressure, p, expected would be
p =
For polar wrapping:
Kj = 1.0; K2 = 0.99; Kß = 1. 1; and K4 = 0.89
and
F4 . , = 358,000 psi. tu,f,i r
then:
r, - (2) (358,000) (0.945) (0.01051) _ p - 8.940 v p
Hoop Wrap:
2 „ - pa pa tan p
f, h " F. . " 2 F, , . tu, f, h tu, £,l
_ 795 (8.940) 795 (8-940) (0. 1584)2
" 391,000 " 2 (358,000)
= 0.0179 in.2/in.
Number of hoop ends/in. (r| ) h'"
r\ = °-0179 = 864 ends/in. h 2.076 x 10
Douglas Winding. -- Longitudinal filament stress allowable:
F, , - = 0.89. K, K- K- K. F. tu, i,i 12 3 4 tu, s
= (0.89) (1.0) (0.99) (1.1) (0.89) (415,000)
= 358,000 psi
Hoop filament stress allowable:
F, = 391,000 psi tu,f,h
109
Equivalent longitudinal thickness:
pa _ 600 (8.940) tf^2F 2 -2(358,000) (0.974)
tu, £,i
= 0. 00769 in.2/in.
Number of ends/circ. in. (n^):
= 0-00769(0-9877) = ^ ends/circ. in.
Z.076 x 10
for the half cycle: 183 ends/in. /layer
Equivalent hoop thickness:
2 pa pa tan ß
*f, h " F. , ~ 2 F. ( . ' tu, f,h tu, f,i
_ 600 (8.940) 600 (8.940) (0. 1584)2
391,000 " 2 (358,000)
= 0. 0135 in.2/in.
Number of hoop ends/in. (TI^):
0.0135 ,cn , /. r\ = F- = 650 ends/in. h 2.076 x 10
110

APPENDIX D
DISCONTINUITY STRESSES AT THE DOME-CYLINDER JUNCTION FOR FIBER GLASS PRESSURE VESSELS
In the proximity of the dome-cylinder junction for filament-wound pres- sure vessels, discontinuity stresses are prevalent for two reasons: (1) the large-hoop loading in the cylindrical section must be resisted by additional windings in the circumferential direction; this causes a discontinuity in thickness at the equator; (2) the meridional radius of curvature is discontin- uous at the transition point, and the bending stresses that result cannot gener- ally be considered negligible in this local area.
The effect of the above sources of bending stress can be understood by calculating radial deflections due to internal pressure when the dome and cylinder are treated separately. Such an analysis will show that, at the equator, the cylinder will expand outward, while the dome will contract inward. Therefore, in order for the deflection and slope to become geo- metrically compatible, a bending moment and shearing force must be present in this area.
Quite obviously, the smaller the mismatch of radial deflection between the dome and cylinder, the smaller will be the effect of the discontinuity stresses. One method commonly employed for reducing the radial deflections is to provide additional hoop windings in the vicinity of the equator. This local overwinding (while increasing the wall thickness and, therefore, the stiffness) will also reduce the stress level. It must be realized that dis- continuity stresses can never be eliminated completely by this approach; however, by gradually tapering the overwinding thickness away from the equator, the discontinuities imposed at the ends of the overwinding can be made tolerable.
Before calculating discontinuity stresses, it is necessary to determine the properties of the composite fiber-glass material.
Determination of Composite Material Properties
The pressure vessel under consideration is filament wound with two balance layers. Since the strength of the vessel is considerably higher in the longitudinal direction, four additional hoop layers are wound on the cylinder to sustain the hoop pressure loads. The appearance of the pressure vessel is described in fig. Dl.
The overwinding near the equator referred to previously is shown in Sec- tion A of fig. Dl. Here, the method of tapering the thickness by offsetting the successive hoop windings may also be noted.
Since the actual design is to be supported by analysis, the number of additional layers is allowed to vary as a parameter. The material properties
111
Extra hoop layers
(overwind)
4 Hoop
2 Helix
Equator Section A
Figure Dl. Diagram of Pressure Vessel Winding
must, therefore, be obtained for several possible design thicknesses. In addition, the filamentary construction of the fiber glass composite requires the use of analysis methods which account for orthotropic behavior. Pro- perties such as the elastic modulus and Poisson's ratio are dependent upon orientation, and therefore will have different values in any two orthogonal directions. The directions of interest in this application will be described by the coordinates x and y (fig. Dl), coinciding with the directions of principal stress.
To determine the overall material properties for the composite, it is necessary to first calculate the effective properties of a single layer in the directions parallel and transverse to the fiber orientation. Following this procedure for all layers, the composite properties are evaluated by appro- priately combining the fiber orientation, thickness, and strength of each layer. The method, as described by Chao (ref. 49), is straightforward but involves much computation. For this reason, an IBM 7094 computer program was utilized to obtain the desired information. The results are shown in fig. D2.
Although the overwinding near the equator extends over a relatively short length , it will be assumed that the influence of the discontinuity loads will not extend beyond the length of overwind. Thus, for purposes of idealization, the cylinder will be assumed to have a constant thickness different from that of the dome.
112
No. of hoop layers
0.2
0.1
2 4 6
No. of hoop layers
10
Figure D2. Composite Material Properties for Two Helix Layers and a Varying Number of Hoop Layers
113
If the pressure vessel is now considered to be cut at the equator as shown in fig. D3, it will be found that only the meridional loading is in equilibrium at the edges of the two resultant structures. Consequently, a statically indeterminate moment and shear force exist which must be determined by geometric compatibility equations. These unknowns act equally and oppo- sitely as shown below.
I tltlltttttl C<
■<L
Figure D3. Pressure Vessel Free Body Idealization
To determine the degree of mismatch in deflection presently existing at the cut, the radial membrane deflections must be calculated. This may be done by computing the circumferential strain at the equator and then multi- plying this result by the hoop radius. The following equations express these deflections for the dome and cylinder, respectively.
PR ,o R d . ZE-T: <2 - T -%x)
'YA d
PR
(1)
2E t y„ c
(2 - |x yx'
114
where
" »
6, = radial deflection of the dome due to the pressure loading P
5, = radial deflection of the cylinder due to the pressure loading P
R - the circumferential radius of the dome and cylinder
a = the meridional radius of curvature of the dome at the equator
P = internal pressure, psi
E = modulus of elasticity of the dome composite in the y direction yd
E = modulus of elasticity of the cylinder composite in the y direction yc
t-, = thickness of the dome composite
t = thickness of the cylinder composite
|JL = Poisson's ratio of the dome composite giving the strain in the y- ^ direction caused by a stress in the x-direction
|JL = Poisson's ratio of the cylinder composite giving the strain in y the y-direction caused by a stress in the x-direction
"'Note that the cylinder deflection must be preceded by a minus sign since the pressure acts oppositely to the Xj -direction. The rotation of the cylinder edge due to the pressure loading is zero, and the rotation of the dome edge is negligible. Thus, one may write
d - c 6, =6^ =0 (2)
C-P ZP
where
6-, - rotation of the dome edge due to the pressure loading ^P
6? = rotation of the cylinder edge due to the pressure loading ZP
Because of the adopted sign convention, the relative difference in deflec- tion and rotation may be obtained by simple addition, that is,
115

61 = 61 +61 p p
8? +8? = 0
(3)
Next, the influence coefficients for dome and cylinder are needed to obtain the influence coefficients for the total system. According to Wills (ref. 50), these coefficients, for the dome, are the following:
1 11
x d
612 = 521 2D x, x d
(4)
d 22
Ddv, x d
where
6. , = radial deflection of the dome edge due to a unit shear force
6. = radial deflection of the dome edge due to a unit moment
6__ = rotation of the dome edge due to a unit moment
6 .. = rotation of the dome edge due to a unit shear force
Dd = x
x, d d
12(1 - (JLd H-d ) xy yx
\l =
E t ^dC
-.1/4
4R2Dd
x
modulus of elasticity of the dome composite in the x-direction.
Similarly, for the cylinder, the coefficients are:
116
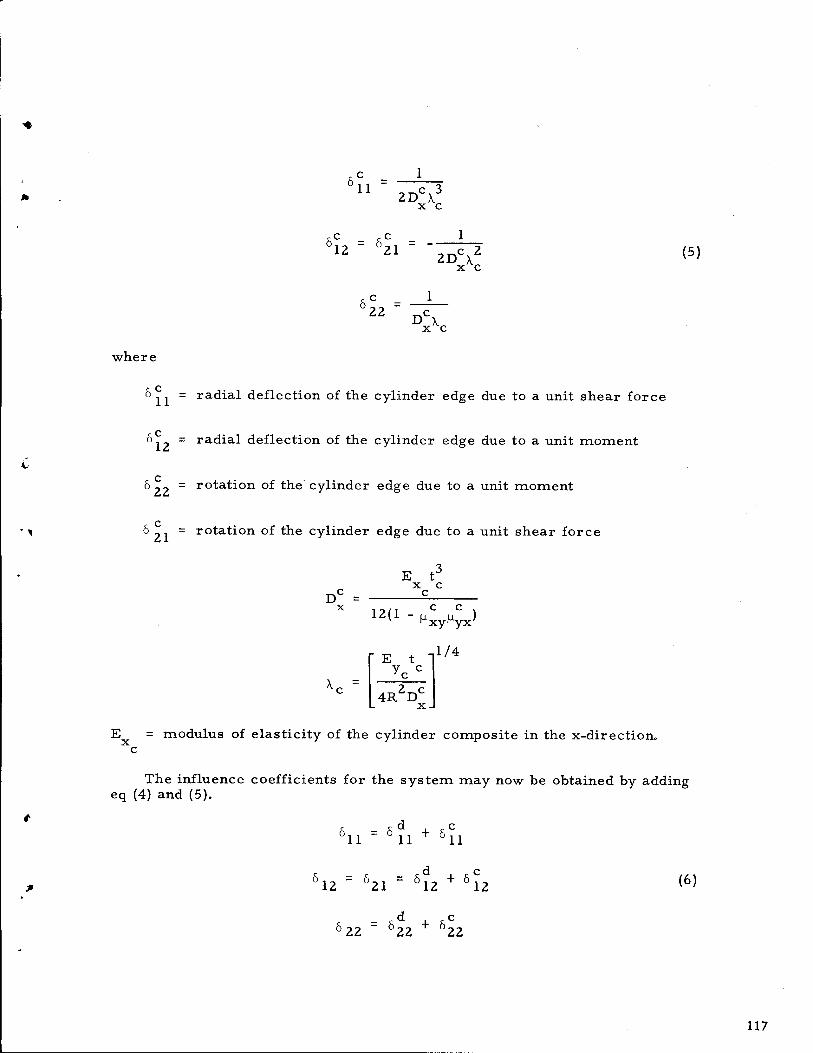
11 2DC\3
x c
612 = 621 2DCX2
x c (5)
22 DCX x c
where
^ 11 = ra^a-'- deflection of the cylinder edge due to a unit shear force
6, 2 = radial deflection of the cylinder edge due to a unit moment
8 22 = rotation of the cylinder edge due to a unit moment
6 y, = rotation of the cylinder edge due to a unit shear force
,3
DC = x
E f X c
c
12<X - f^P
^c =
E t yc
c
4R2DC
xJ
1/4
E = modulus of elasticity of the cylinder composite in the x-direction. c
The influence coefficients for the system may now be obtained by adding eq (4) and (5).
6n = 6ii + 6n
612 = 621 = 612 + 612 (6)
622 522 + 522
117
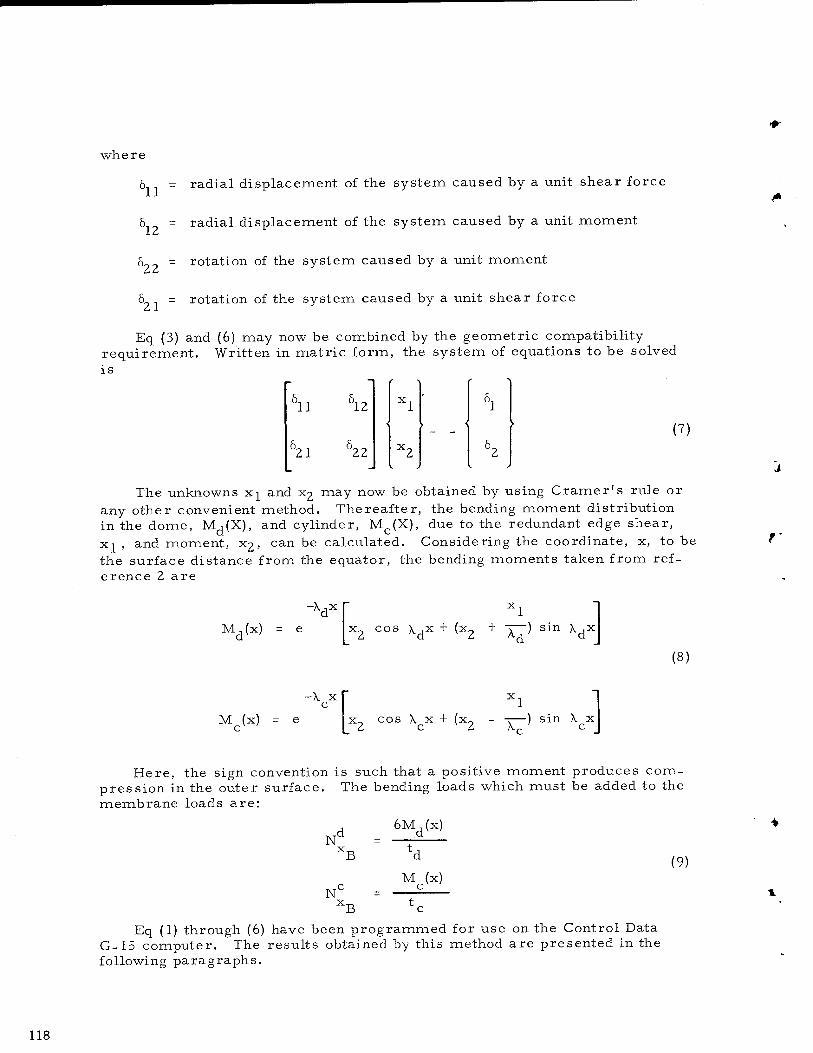
where
6 = radial displacement of the system caused by a unit shear force
12 radial displacement of the system caused by a unit moment
J22 rotation of the system caused by a unit moment
6 = rotation of the system caused by a unit shear force
Eq (3) and (6) may now be combined by the geometric compatibility requirement. Written in matric form, the system of equations to be solved is
11
21
r i '
\z xl 61 ' ►
22 x2 52 I J I J
(7)
The unknowns x± and x2 may now be obtained by using Cramer's rule or any other convenient method. Thereafter, the bending moment distribution in the dome, MJX), and cylinder, MC(X), due to the redundant edge shear, xi , and moment, x2, can be calculated. Considering the coordinate, x, to be the surface distance from the equator, the bending moments taken from ref- erence 2 are
-\dx
Md(x) = e x, cos \jX + (x9 + -r ) sin \ ,x
(8)
-X. x c M (x) = e
x.
x0 cos X. x + (x0 - -r—) sin X. x 2 c 2 \c c
Here, the sign convention is such that a positive moment produces com- pression in the outer surface. The bending loads which must be added to the membrane loads are:
N
N^
^B
6Md(x)
M (x) c
(9)
x B
Eq (1) through (6) have been programmed for use on the Control Data G-15 computer. The results obtained by this method are presented in the following paragraphs.
118
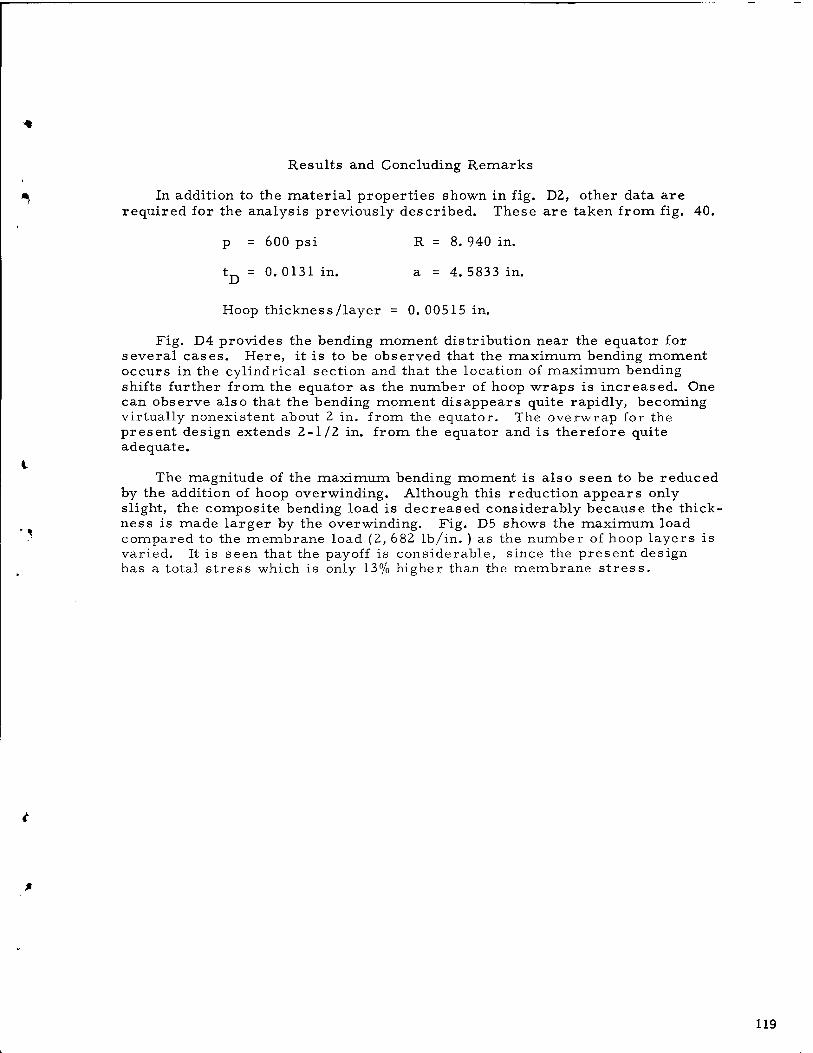
Results and Concluding Remarks
In addition to the material properties shown in fig. D2, other data are required for the analysis previously described. These are taken from fig. 40.
p = 600 psi R = 8. 940 in.
t = 0. 0131 in. a = 4. 5833 in.
Hoop thickness/layer = 0. 00515 in.
Fig. D4 provides the bending moment distribution near the equator for several cases. Here, it is to be observed that the maximum bending moment occurs in the cylindrical section and that the location of maximum bending shifts further from the equator as the number of hoop wraps is increased. One can observe also that the bending moment disappears quite rapidly, becoming virtually nonexistent about 2 in. from the equator. The overwrap for the present design extends 2-1/2 in. from the equator and is therefore quite adequate.
The magnitude of the maximum bending moment is also seen to be reduced by the addition of hoop overwinding. Although this reduction appears only slight, the composite bending load is decreased considerably because the thick- ness is made larger by the overwinding. Fig. D5 shows the maximum load compared to the membrane load (2, 682 lb/in. ) as the number of hoop layers is varied. It is seen that the payoff is considerable, since the present design has a total stress which is only 13% higher than the membrane stress.
119
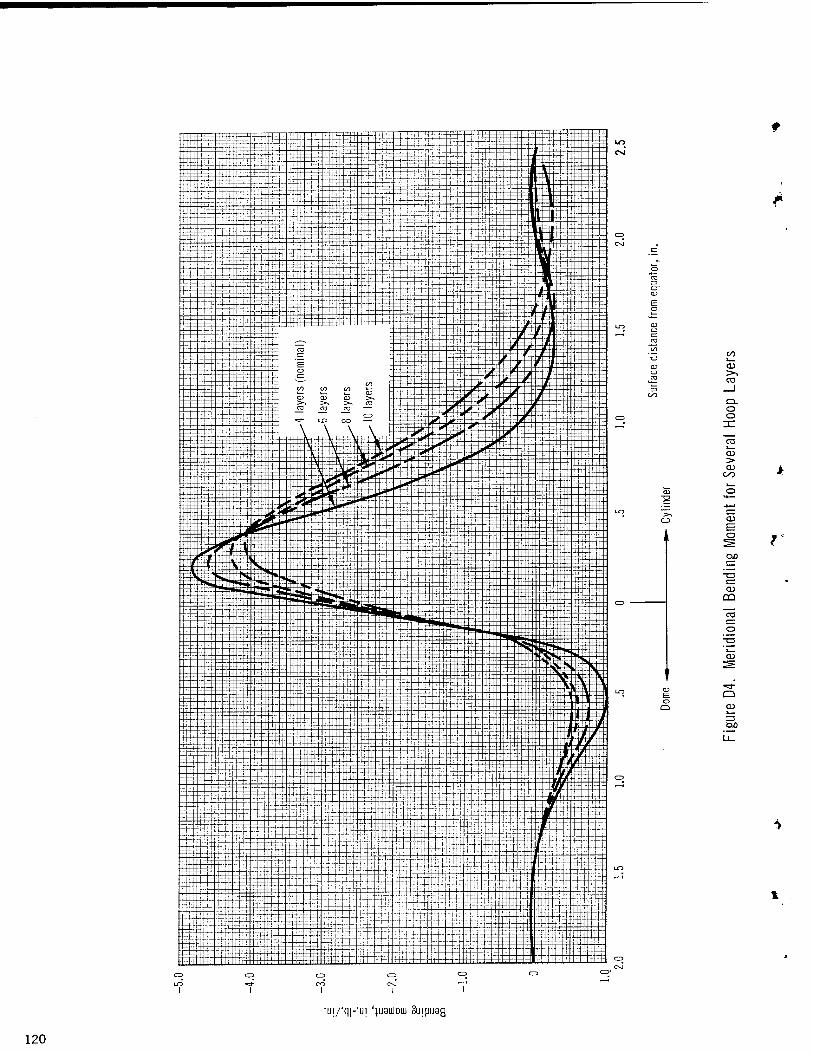
ffiffi^tffiiffiwJiisff^^
CD
o o
a> > CD
CO
CD
o
CD CÜ
O
CD
CD o LO ^r
I I
-u|/"q|-"ui '1U9U10W Suipuag
120

'^
PgjK W'W^\ ft ±i:W++j-++H+ -+-H1+ ---p-H-
36 EJE:::::EEJ:EL EHE
|H|:| I j 11 j-M-f-pF 1 H jt|'; |-tfa1= TuBr IHT 1"HT=i_ lir Tip"
32 j |::::|||S TTTTn+rTT:TTIT T~ Trt
'ff Ü M-|f% if] [ 1 m'If 4"T
28 :|±S:| IggÄlälll
lipBilJiili Hrl t'H T Hmam rtl44J+^JPf^
24 |::|i
crt ::p±:n::d 00 --H CD -fffl
<" "I n~ "i
ro :x;:;:;;d
CD :::::::::q E ::+:::::d <= :::^::.:3 CD :::::::iq M r i"m es :.:::::}::□ co H
1 16 lip] cz -44TJ CD iq o :::::::::d CD :;:::_^_B 0- ::;::±E::j
12 ;;||::]
EEEEEEEE|||;
vti
ffnfPiflll F
Ti H4-'-H+Hi] ' i' 1 I'll Hi' 1 •''' 1 ^n\ Eü!ÜMilll:
l«=^PP|EEp
Resent design mfFfmtfF^fffl1
8
4 p-ll
n MmM
|EE-EEEfc4
fftf ■-tp4"
: i s i^llEiiEE ■"■■i ri EE|||igffiMtEE
11 1 EE§[|EE:EEEEpig
iliilli|llf
■■■■I fliili 4 6
No. of hoop layers
10
Figure D5. Increase in Meridional Stress vs No. of Layers
121
r
REFERENCES
1. Hanson, M. P. ; Richards, H-T- ; and Hickel, R.O. : Preliminary In- vestigation of Filament-Wound Glass-Reinforced Plastics and Liners for Cryogenic Pressure Vessels. NASA TN D-Z741, 1965.
2. Toth, J.M. , Jr. : Barrier Films for Filament-Wound Fiberglass Cryogenic Vessels. Advances in Cryogenic Engineering, Vol. 9. K. D. Timmerhaus, ed., Plenum Press, 1964, pp. 537-544.
3. Mowers, R.E. : Program of Testing Nonmetallic Materials as Cryo- genic Temperatures. Rep. R-3498, Rocketdyne Division, North American Aviation, December 30, 1962.
4. Smith, T. L. : Measurement and Analysis of Small Deformation and Ultimate Tensile Properties of Amorphous Elastomers. Instron Engineering Corporation Application Series PC-5, Edited from a talk given at the Symposium on Analytical Methods in the Study of Stress Strain Behavior (Boston, Massachusetts), October 28, I960.
5. Miller, R-N-, et al: Properties of Foams, Adhesives, and Plastic Films at Cryogenic Temperatures. Industrial and Engineering Chem- istry, Product Research and Development, Vol. 1, No. 4, December 1962, pp. 257-261.
6. National Bureau of Standards: Cryogenic Materials Handbook. U.S. Department of Commerce: (Available from Office of Technical Services as PB171809-)
7. Scott, Rüssel B. : Cryogenic Engineering. D. Van Nostrand Co., Inc., 1959-
8. Norton, Francis J. : Permeation of Gases Through Solids. J. Appl. Physics, Vol. 28, January 1957, pp. 34-39-
9. Barrer, Richard M. : Diffusion in and Through Solids. Cambridge University Press, 1951.
10. Jost, W. : Diffusion. Academic Press, Inc.
11. Van Amerongen, G. J. : The Permeability of Different Rubbers to Gases and its Relation to Diffusivity and Solubility. J. Appl. Physics, Vol. 17, November 1964, pp. 972-985.
12. E.I. DuPont de Nemours and Co., Film Department - Industrial Sales. Permeability of Gases and Vapors through DuPont Industrial Films. Los Angeles, California.
13. Brubaker, D. W. ; and Kammermeyer, K. : Separation of Gases by Means of Permeable Membranes. Industrial and Engineering Chem- istry, Engineering and Process Development, Vol. 44, No. 6, June 1952, pp. 1465-1474.
123

14. Brubaker, D.W. ; and Kamme r me ye r, K- : Separation of Gases by Plastic Membranes. Industrial and Engineering Chemistry, Vol. 46, No. 4, April 1954, pp. 733-739-
15. Waack, R. ; et al: Permeability of Polymer Films to Gases and Vapors. Analytical Chemistry, Vol. 27, December 1955, pp. 2524-2527.
16. Bailey, CD. ; et al: Hydrogen Permeation Measurements on Vapor Barrier Materials for Cryogenic Insulations. (Preprint) 746D, National Aeronautic and Space Engineering and Manufacturing Meeting, Society of Automotive Engineers. September 1963.
17. Michaels, A. S. ; et al: Gas Permeability of Highly Oriented Dibutyl Maleate-Polyethylene Copolymer Films. Preprint 130, Chem. Eng. Dept. , M.I. T-, September 1962.
18. Tomashot, R. C : AF-944-A Superior Glass Fiber Reinforcement for Structural Composites. Rep. ASD-TDR-63-81, WPAFB, Ohio, March 1963.
19. Chafey, J.E.: Compilation of Materials Research Data. Rep. AE 62-0060, General Dynamics/Astronautics, September 1961.
20. Smith, M. B. ; and Susman, S. E. : Adhesives for Cryogenic Appli- cation (Preprint) 582c. National Aerospace Engineering and Manu- facturing Meeting, Society of Automotive Engineers (Los Angeles, California), October 1962.
21. McClintock, R. M. ; and Hiza, M. J. : Epoxy Resins as Cryogenic Structural Adhesives. Modern Plastics, Vol. 35, June 1958, pp. 172-174.
22. Hertz, J. : Cryogenic Adhesive Evaluation Study. Rep. ERR-AN-032, General Dynamics/Astronautics, January 1961.
23. Roseland, L. M. : Evaluation of Adhesives for Potential Cryogenic Usage on the S-IVB. Rep. SM-43086, Douglas Aircraft Co. , Inc. , April 1963.
24. Darms, F. J. ; and Molho, R. : Optimum Filament-Wound Construction for Cylindrical Pressure Vessels. Rep. ASD-TDR-67-878, WPAFB, Ohio, August 1962.
25. Climent, F-J-: Hydrostatic Test Procedures. Rep. 0627-II-F, Aerojet-General Corp. , July 1964. (Available from DDC as AD-604104. )
26. Kropschot, R. H. ; and Mikesell, R. P. : Strength and Fatigue of Glass at Very Low Temperatures. J. Appl. Physics, Vol. 28, No. 5, May 1956, pp. 610-614.
124
27. Charles, R.J. : Static Fatigue of Glass. J. Appl. Physics, Vol. 29, No. 11, November 1958, pp. 1554-1560.
28. Charles, R.J.: Dynamic Fatigue of Glass. J. Appl. Physics, Vol. 29, No. 12, December 1958, pp. 1657-1662.
29- Nadai, A. : Theory of Flow and Fracture of Solids. McGraw-Hill Book Co. , Inc. , 1950.
30. Freudenthal, A.M. : The Inelastic Behavior of Engineering Materials and Structures. John Wiley and Sons, Inc. , 1950.
31. Cottrell, A. H. : Dislocations and Plastic Flow in Crystals. Oxford University Press, 1953.
32. Conner, D.M. : Effect of Compressive Loads on Structural Fatigue at Elevated Temperature. Rep. ASD-TDR-62-448, WPAFB, Ohio, October 1962.
33. Sachs, G. ; et al: Low Cycle Fatigue of Pressure Vessel Materials. ASTM Proceedings, Vol. 60, I960, pp. 512-526.
34. Polakowski, N.H- : Suppression of the Bauschinger Effect and Changes in Flow Pattern of Ductile Metals Caused by Cyclic Torsional Strains. Preprint 63-74, Sixty-Sixth Annual Meeting of ASTM, June 1963.
35. Sessler, J. G. ; and Weiss, Volker: Low Cycle Fatigue Damage in Pressure Vessel Materials. ASME Journal of Basic Engineering, December 1963, pp. 539-547.
36. Smith, R.W.; Hirschberg, M. H. ; and Manson, S.S. : Fatigue Behavior of Materials Under Strain Cycling in Low and Intermediate Life Range. NASA TN D-1547, 1963.
37. Reed, W.S- : Equilibrium Shapes for Pressurized Fiber Glass Domes. Rep. SM-38564, Douglas Aircraft Co. , Inc., April 11, 1961.
38. Parady, V- G. : Secondary Reinforcing Systems for Spiralloy Struc- tures. Preprint 2917-63, AIAA Launch and Space Vehicle Shell Structures Conference, April 1963.
39. Love, G.G.: Structural Analysis of Orthotropic Shells--Minimizing Discontinuity Stresses in Filament-Wound Pressure Vessels. Pre- print 2919-63, AIAA Launch and Space Vehicle Shell Structures Conference, April 1963.
40. Girton, L. D. : Evaluation x5f Electroformed Nickel to 301 Stainless Steel Resistance Spotwelds at 78°F and -423°F. General Dynamics/ Astronautics, January 1962: (Available from DDC as AD-291522. )
125
41. Christian, J. ; and Scheck, W. G. : Interim Report on the Mechanical Properties of Electroformed Nickel at Room and Cryogenic Temper- atures. General Dynamics/Astronautics, April 1962: (Available from DDC as AD-284337. )
42. Christian, J. ; and Scheck, W. G. : Second Interim Report on the Mechanical Properties of Electroformed Nickel at Room and Cryogenic Temperatures. General Dynamics/Astronautics, May 1962: (Available from DDC as AD-291525. )
43. Christian, J. ; and Scheck, W. G. : Third Interim Report on the Mechani- cal Properties of Electroformed Nickel at Room and Cryogenic Tem- peratures. General Dynamics/Astronautics, June 1962: (Available from DDC as AD-291517. )
44. Harrington, N.M.: Biaxial Stress Strain Curves. Rep. SM-38786, Douglas Aircraft Co. , Inc. , June 23, I960.
45. Harrington, N.M. : Plastic Instability of Pressure Vessels. Rep. SM-38785, Douglas Aircraft Co. , Inc., August 29, I960.
46. Darms, J. ; and Molho, R. : Optimum Filament-Wound Construction for Cylindrical Pressure Vessels. Rep. ASD-TDR-62-878, WPAFB, Ohio, August 1962.
47. Roark, R. J. : Formulas for Stress and Strain. Third ed. , McGraw- Hill Book Co. , Inc., 1954.
48. Brink, N. O. : Determination of the Performance of Plastic Laminates Under Cryogenic Temperatures. Rep. ASD-TDR-62-794, WPAFB, Ohio, February 1963.
49. Chao, H. : Equations and Computing Program for Elastic Constants and Membrane Stresses in Fiberglass Shells. Report SM-44593, Douglas Aircraft Company, Inc. , September 9, 1963.
50. Wills, C : Discontinuity Stress at a Dome-Cylinder Joint in Fiber- glass Motor Cases. Technical Memo No. 98 (Structures), Douglas Aircraft Company, Inc. , October 2, 1962.
126
< PS a oz oo
o PS i iHH rt co £
lod ^ < to
co n co "H<; g,Hft m»o
d ft
c PS
< W H ^ PS PS rt 1 ft
co £ ^ O < «i 6 PS Z 2 ft ft
Ä 3- a; D ■
<! £ PS °n
ft •-■
CO
B " d
g * o.
ü (Ü O o >* E ä PS JH
to . £ ^° H u
to - +J
H PS o ft H
PS
PS
°s to •
> "
PS o< o ^J H in o to r*
«: to < Z
M V Ml
tf o ft ^ P
£ s
v. i
ö u ä ' CO QJ O
d C M
1 AS L ■"
!»;■
ii o +
o » u H rt £
I -S-B
•o a-a « , ■ „ tJ-Sh
* S TJ O n
Ö 0 3 QJ ^ ^ & Jd T3 ' .
Eg
J
<! PS
D
H
Ü
ß5 o PS B H rt to
'S h " O
So •a M
«< So
*g u Z s o
' n UJ
6 H i»
< O d < JB'1 ft ft □ o to« * to O g t < >< u I
OU^ s PS H . ! W <ü ( «to . i ft J?£
ft CO - O m £
^ PS
< o <;
PS o D H
H OS
ft CO ' OHS PS PS
ft ft i^
H
PS
o ft H
p. PS
i «
«-§ 2 U
J3 ^ O nJ H
S u t: « -
s i - « .5
^•«is
„ e
la-
£ tu
S "? xf J*"1*^ c
E"?*S: ' lU fll L. ^ I >H ^ ^ C
fr« ÜU ! o £ ri .
0) 00-
u ri nj
■oi - a u ö rt © o
Ü B U
(0 u
2 "Ö TS -" " (j R
cx-a »
H *; "
- r- ^ ^ cS -y «■S-o '
S3?
Saft
3D-*