Embed Size (px)
Citation preview

Investigation of Techniques for Accelerating the Construction of Bridge Deck Overlays
Final ReportApril 2016
Sponsored byFederal Highway AdministrationIowa Department of Transportation(InTrans Project 14-500)
About the Bridge Engineering Center
The mission of the Bridge Engineering Center (BEC) at Iowa State University is to conduct research on bridge technologies to help bridge designers/owners design, build, and maintain long-lasting bridges.
Disclaimer Notice
The contents of this report reflect the views of the authors, who are responsible for the facts and the accuracy of the information presented herein. The opinions, findings and conclusions expressed in this publication are those of the authors and not necessarily those of the sponsors.
The sponsors assume no liability for the contents or use of the information contained in this document. This report does not constitute a standard, specification, or regulation.
The sponsors do not endorse products or manufacturers. Trademarks or manufacturers’ names appear in this report only because they are considered essential to the objective of the document.
Non-Discrimination Statement
Iowa State University does not discriminate on the basis of race, color, age, ethnicity, religion, national origin, pregnancy, sexual orientation, gender identity, genetic information, sex, marital status, disability, or status as a U.S. veteran. Inquiries regarding non-discrimination policies may be directed to Office of Equal Opportunity, Title IX/ADA Coordinator, and Affirmative Action Officer, 3350 Beardshear Hall, Ames, Iowa 50011, 515-294-7612, email [email protected].
Iowa Department of Transportation Statements
Federal and state laws prohibit employment and/or public accommodation discrimination on the basis of age, color, creed, disability, gender identity, national origin, pregnancy, race, religion, sex, sexual orientation or veteran’s status. If you believe you have been discriminated against, please contact the Iowa Civil Rights Commission at 800-457-4416 or Iowa Department of Transportation’s affirmative action officer. If you need accommodations because of a disability to access the Iowa Department of Transportation’s services, contact the agency’s affirmative action officer at 800-262-0003.
The preparation of this report was financed in part through funds provided by the Iowa Department of Transportation through its “Second Revised Agreement for the Management of Research Conducted by Iowa State University for the Iowa Department of Transportation” and its amendments.
The opinions, findings, and conclusions expressed in this publication are those of the authors and not necessarily those of the Iowa Department of Transportation or the U.S. Department of Transportation Federal Highway Administration.
Technical Report Documentation Page
1. Report No. 2. Government Accession No. 3. Recipient’s Catalog No.
InTrans Project 14-500
4. Title and Subtitle 5. Report Date
Investigation of Techniques for Accelerating the Construction of Bridge Deck
Overlays
April 2016
6. Performing Organization Code
7. Author(s) 8. Performing Organization Report No.
Brent Phares, Travis Hosteng, Lowell Greimann, and Anmol Pakhale InTrans Project 14-500
9. Performing Organization Name and Address 10. Work Unit No. (TRAIS)
Bridge Engineering Center
Iowa State University
2711 South Loop Drive, Suite 4700
Ames, IA 50010-8664
11. Contract or Grant No.
12. Sponsoring Organization Name and Address 13. Type of Report and Period Covered
Iowa Department of Transportation
800 Lincoln Way
Ames, IA 50010
Federal Highway Administration
U.S. Department of Transportation
1200 New Jersey Avenue SE
Washington, DC 20590
Final Report
14. Sponsoring Agency Code
SPR RB09-014
15. Supplementary Notes
Visit www.intrans.iastate.edu and www.cptechcenter.org for color pdfs of this and other research reports.
16. Abstract
Use of bridge deck overlays is important in maximizing bridge service life. Overlays can replace the deteriorated part of the deck, thus
extending the bridge life. Even though overlay construction avoids the construction of a whole new bridge deck, construction still takes
significant time in re-opening the bridge to traffic. Current processes and practices are time-consuming and multiple opportunities may
exist to reduce overall construction time by modifying construction requirements and/or materials utilized. Reducing the construction
time could have an effect on reducing the socioeconomic costs associated with bridge deck rehabilitation and the inconvenience caused
to travelers.
This work included three major tasks with literature review, field investigation, and laboratory testing.
Overlay concrete mix used for present construction takes long curing hours and therefore an investigation was carried out to find fast-
curing concrete mixes that could reduce construction time. Several fast-cuing concrete mixes were found and suggested for further
evaluation.
An on-going overlay construction project was observed and documented. Through these observations, several opportunities were
suggested where small modifications in the process could lead to significant time savings.
With current standards of the removal depth of substrate concrete in Iowa, it takes long hours for the removal process. Four different
laboratory tests were performed with different loading conditions to determine the necessary substrate concrete removal depth for a
proper bond between the substrate concrete and the new overlay concrete. Several parameters, such as failure load, bond stress, and
stiffness, were compared for four different concrete removal depths.
Through the results and observations of this investigation several conclusions were made, which could reduce bridge deck overlay
construction time.
17. Key Words 18. Distribution Statement
bridge deck overlays—bridge deck rehabilitation—bridge service life—overlay
construction time—overlay curing time
No restrictions.
19. Security Classification (of this
report)
20. Security Classification (of this
page)
21. No. of Pages 22. Price
Unclassified. Unclassified. 91 NA
Form DOT F 1700.7 (8-72) Reproduction of completed page authorized

INVESTIGATION OF TECHNIQUES FOR
ACCELERATING THE CONSTRUCTION OF BRIDGE
DECK OVERLAYS
Final Report
April 2016
Principal Investigator
Brent Phares
Director, Bridge Engineering Center
Co-Principal Investigator
Travis Hosteng
Director, National Center for Wood Transportation Structures
Bridge Research Specialist, Bridge Engineering Center
Research Assistant
Anmol M. Pakhale
Authors
Brent Phares, Travis Hosteng, Lowell Greimann, and Anmol Pakhale
Sponsored by
the Iowa Department of Transportation and
the Federal Highway Administration
(InTrans Project 14-500)
Preparation of this report was financed in part
through funds provided by the Iowa Department of Transportation
through its Research Management Agreement
with the Institute for Transportation
A report from
Bridge Engineering Center
Iowa State University
2711 South Loop Drive, Suite 4700
Ames, IA 50010-8664
Phone: 515-294-8103 / Fax: 515-294-0467
www.bec.iastate.edu

v
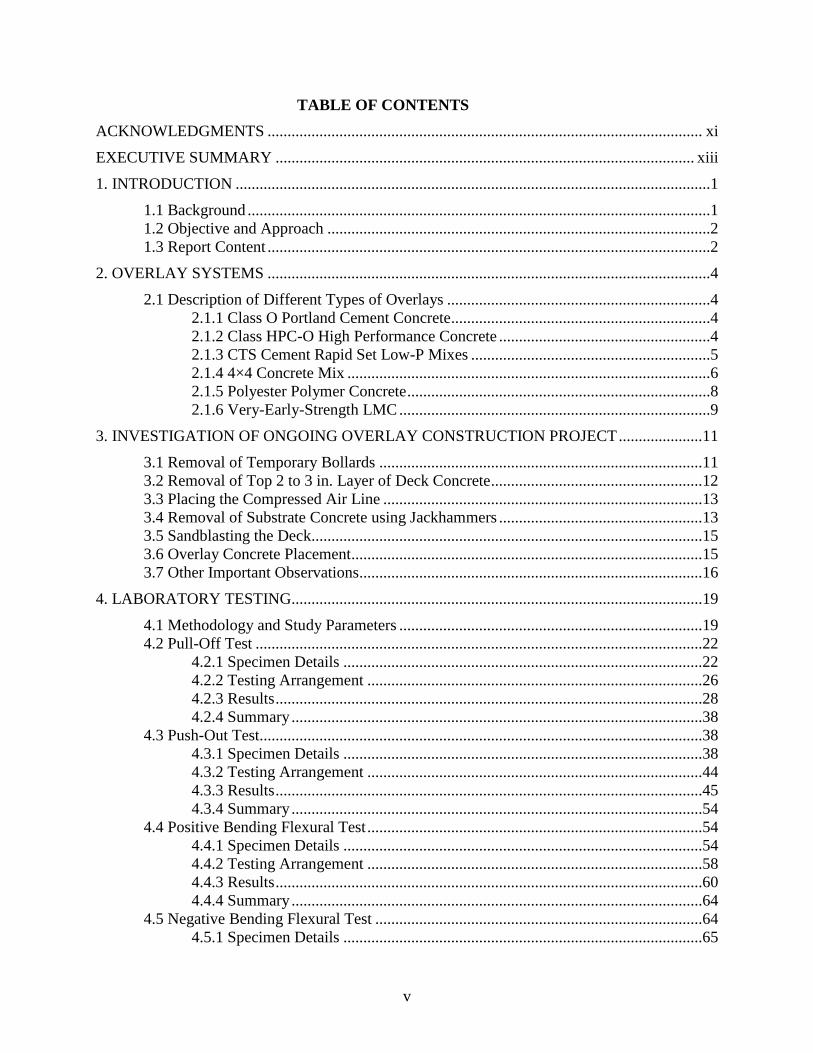
TABLE OF CONTENTS
ACKNOWLEDGMENTS ............................................................................................................. xi
EXECUTIVE SUMMARY ......................................................................................................... xiii
1. INTRODUCTION .......................................................................................................................1
1.1 Background ....................................................................................................................1 1.2 Objective and Approach ................................................................................................2 1.3 Report Content ...............................................................................................................2
2. OVERLAY SYSTEMS ...............................................................................................................4
2.1 Description of Different Types of Overlays ..................................................................4
2.1.1 Class O Portland Cement Concrete.................................................................4
2.1.2 Class HPC-O High Performance Concrete .....................................................4
2.1.3 CTS Cement Rapid Set Low-P Mixes ............................................................5 2.1.4 4×4 Concrete Mix ...........................................................................................6 2.1.5 Polyester Polymer Concrete ............................................................................8 2.1.6 Very-Early-Strength LMC ..............................................................................9
3. INVESTIGATION OF ONGOING OVERLAY CONSTRUCTION PROJECT .....................11
3.1 Removal of Temporary Bollards .................................................................................11
3.2 Removal of Top 2 to 3 in. Layer of Deck Concrete .....................................................12 3.3 Placing the Compressed Air Line ................................................................................13 3.4 Removal of Substrate Concrete using Jackhammers ...................................................13
3.5 Sandblasting the Deck..................................................................................................15 3.6 Overlay Concrete Placement........................................................................................15
3.7 Other Important Observations......................................................................................16
4. LABORATORY TESTING.......................................................................................................19
4.1 Methodology and Study Parameters ............................................................................19 4.2 Pull-Off Test ................................................................................................................22
4.2.1 Specimen Details ..........................................................................................22 4.2.2 Testing Arrangement ....................................................................................26
4.2.3 Results ...........................................................................................................28 4.2.4 Summary .......................................................................................................38
4.3 Push-Out Test...............................................................................................................38 4.3.1 Specimen Details ..........................................................................................38 4.3.2 Testing Arrangement ....................................................................................44
4.3.3 Results ...........................................................................................................45
4.3.4 Summary .......................................................................................................54
4.4 Positive Bending Flexural Test ....................................................................................54 4.4.1 Specimen Details ..........................................................................................54 4.4.2 Testing Arrangement ....................................................................................58 4.4.3 Results ...........................................................................................................60 4.4.4 Summary .......................................................................................................64
4.5 Negative Bending Flexural Test ..................................................................................64 4.5.1 Specimen Details ..........................................................................................65
vi
4.5.2 Testing Arrangement ....................................................................................68 4.5.3 Results ...........................................................................................................68 4.5.4 Summary .......................................................................................................73
5. CONCLUSIONS AND RECOMMENDATIONS ....................................................................74
5.1 Summary ......................................................................................................................74 5.2 Results and Conclusions ..............................................................................................74 5.3 Recommendations ........................................................................................................75
REFERENCES ..............................................................................................................................77
vii
LIST OF FIGURES
Figure 1. Temporary bollards being detached by workers ............................................................11 Figure 2. Milling machine removal of top layer of the deck .........................................................12 Figure 3. Area marked for more in-depth removal ........................................................................13
Figure 4. Removal of unsound concrete using jackhammer ..........................................................14 Figure 5. Deteriorated area of the deck after removal of the substrate concrete ...........................15 Figure 6. Ready-mixed concrete being placed on the deck ...........................................................16 Figure 7. Manhole discovered near the approach to the westbound lane ......................................17 Figure 8. Eastbound overlay construction schedule as observed ...................................................18
Figure 9. Different depths of concrete removal considered ...........................................................20 Figure 10. Pull-off test specimen schematic (Case 1) ....................................................................22 Figure 11. Pull-off test formwork for substrate concrete placement .............................................23
Figure 12. Pull-off test formwork for overlay concrete placement (Case 4) .................................24 Figure 13. Pull-off test steel plate with welded shear studs ...........................................................25 Figure 14. Tapping the steel plate to embed the shear studs on a pull-off test specimen ..............26
Figure 15. Testing arrangement for pull-off test ............................................................................27 Figure 16. Case 1 pull-off test specimen failure at concrete bond interface ..................................29
Figure 17. Case 1 pull-off test specimen failure in concrete overlay ............................................30 Figure 18. Case 2 pull-off test specimen failure at concrete bond interface ..................................31 Figure 19. Case 2 pull-off test specimen failure in concrete overlay ............................................32
Figure 20. Case 3 pull-off test specimen failure at concrete bond interface ..................................33 Figure 21. Case 4 pull-off test specimen failure at concrete bond interface ..................................34
Figure 22. Case 4 pull-off test specimen failure in concrete overlay ............................................35 Figure 23. Average load at failure versus concrete removal depth (pull-off test) .........................37
Figure 24. Average tensile stress at failure versus concrete removal depth (pull-off test) ............37 Figure 25. Push-out test specimen schematic (Case 1) ..................................................................39
Figure 26. Push-out test specimen schematic (Case 4) ..................................................................40 Figure 27. Push-out test formwork for substrate concrete placement ...........................................41 Figure 28. Pair of push-out test sub-specimens after concrete removal (Case 4) ..........................41
Figure 29. Push-out test formwork for overlay concrete placement ..............................................42 Figure 30. Application of grout for push-out test specimen ..........................................................43
Figure 31. Push-out test specimen after overlay concrete placement ............................................43 Figure 32. Testing arrangement for push-out test ..........................................................................44
Figure 33. Case 1 push-out test specimen failure at concrete bond interface ................................46 Figure 34. Case 2 push-out test specimen failure at concrete bond interface ................................47 Figure 35. Case 3 push-out test specimen failure at concrete bond interface ................................48 Figure 36. Case 4 push-out test specimen failure at concrete bond interface ................................49
Figure 37. Load versus deflection (push-out test) .........................................................................52 Figure 38. Average load versus concrete removal depth (push-out test) .......................................52 Figure 39. Average shear stress versus concrete removal depth (push-out test) ...........................53
Figure 40. Average stiffness versus concrete removal depth (push-out test) ................................53 Figure 41. Positive bending flexural test specimen schematic (Case 1) ........................................55 Figure 42. Positive bending flexural test formwork for substrate concrete placement .................56 Figure 43. Positive bending flexural test specimen after substrate concrete placement
(Case 4) ..............................................................................................................................57
viii
Figure 44. Positive bending flexural test specimen after roughening of substrate concrete
(Case 1) ..............................................................................................................................57 Figure 45. Application of grout to positive bending flexural test specimen (Case 1) ...................58 Figure 46. Testing arrangement for positive bending flexural test ................................................59
Figure 47. Case 1 positive bending flexural test specimen failure at concrete bond
interface..............................................................................................................................60 Figure 48. Case 2 positive bending flexural test specimen failure at concrete bond
interface..............................................................................................................................60 Figure 49. Case 3 positive bending flexural test specimen failure at concrete bond
interface..............................................................................................................................61 Figure 50. Case 4 positive bending flexural test specimen failure at concrete bond
interface..............................................................................................................................61 Figure 51. Average maximum load versus concrete removal depth (positive bending
flexural test) .......................................................................................................................63 Figure 52. Average elastic shear stress at maximum load at interface versus concrete
removal depth (positive bending flexural test) ..................................................................63 Figure 53. Average stiffness versus concrete removal depth (positive bending flexural
test) .....................................................................................................................................64 Figure 54. Negative bending flexural test specimen schematic .....................................................65 Figure 55. Negative bending flexural test formwork for substrate concrete placement ................66
Figure 56. Chipping of substrate concrete for negative bending flexural tests .............................66 Figure 57. Negative bending flexural test specimen after concrete removal to required
depth (Case 3) ....................................................................................................................67 Figure 58. Application of grout to negative bending flexural test specimen .................................67 Figure 59. Testing arrangement for negative bending flexural test ...............................................68
Figure 60. Case 1 negative bending flexural test specimen failure at concrete bond
interface..............................................................................................................................69 Figure 61. Case 2 negative bending flexural test specimen failure at concrete bond
interface..............................................................................................................................69
Figure 62. Case 3 negative bending flexural test specimen failure at concrete bond
interface..............................................................................................................................70
Figure 63. Case 4 negative bending flexural test specimen failure at concrete bond
interface..............................................................................................................................70
Figure 64. Average load versus concrete removal depth (negative bending flexural test) ............72 Figure 65. Average elastic shear stress versus concrete removal depth (negative bending
flexural test) .......................................................................................................................72 Figure 66. Average stiffness versus concrete removal depth (negative bending flexural
test) .....................................................................................................................................73
ix
LIST OF TABLES
Table 1. Properties of HPC concrete mix ........................................................................................5 Table 2. Properties of CTS Cement Rapid Set Low-P mixes ..........................................................6 Table 3. Properties of 4×4 concrete mix ..........................................................................................7
Table 4. Properties of polyester polymer concrete ..........................................................................8 Table 5. Properties of very-early-strength LMC ..............................................................................9 Table 6. C4 concrete mix strength values ......................................................................................21 Table 7. HPC-O concrete mix strength values ...............................................................................21 Table 8. Pull-off test results ...........................................................................................................36
Table 9. Push-out test results .........................................................................................................50 Table 10. Positive bending flexural test results .............................................................................62 Table 11. Negative bending flexural test results ............................................................................71


xi
ACKNOWLEDGMENTS
The research team would like to thank the Iowa Department of Transportation (DOT) for
sponsoring this research and to acknowledge the Federal Highway Administration (FHWA) for
state planning and research funding. Several Iowa DOT Office of Bridges and Structures
personnel provided input and support during the project and are also acknowledged.

xiii
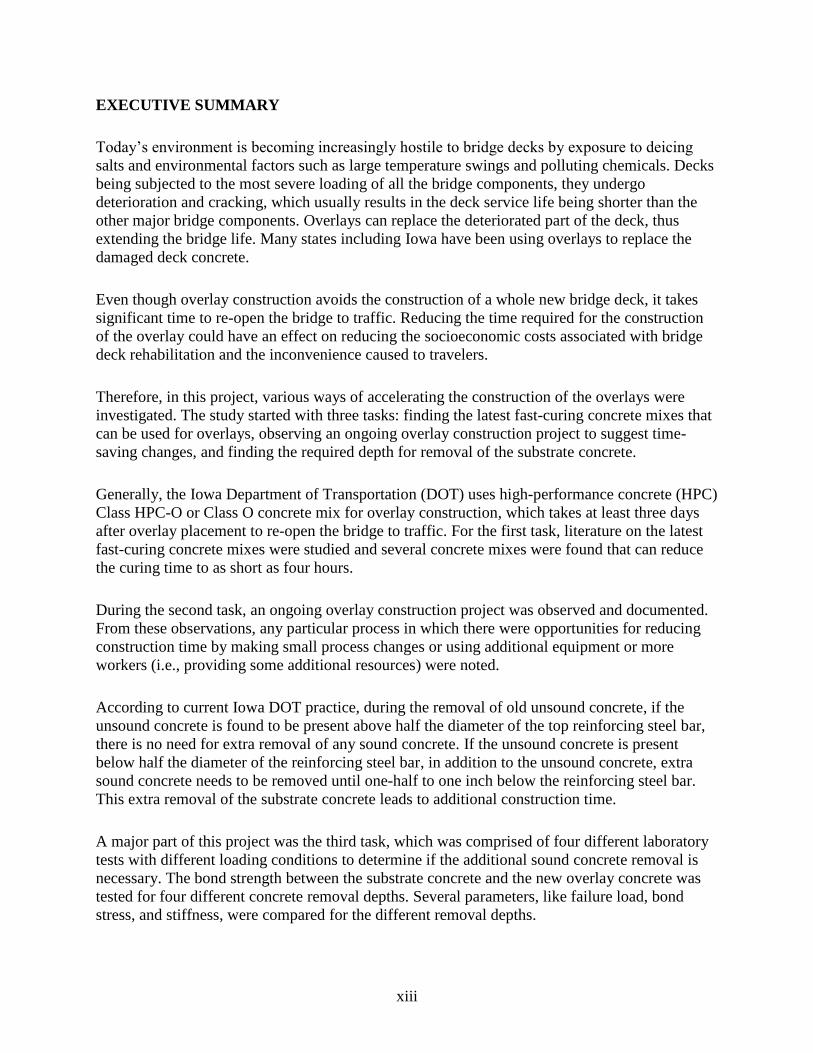
EXECUTIVE SUMMARY
Today’s environment is becoming increasingly hostile to bridge decks by exposure to deicing
salts and environmental factors such as large temperature swings and polluting chemicals. Decks
being subjected to the most severe loading of all the bridge components, they undergo
deterioration and cracking, which usually results in the deck service life being shorter than the
other major bridge components. Overlays can replace the deteriorated part of the deck, thus
extending the bridge life. Many states including Iowa have been using overlays to replace the
damaged deck concrete.
Even though overlay construction avoids the construction of a whole new bridge deck, it takes
significant time to re-open the bridge to traffic. Reducing the time required for the construction
of the overlay could have an effect on reducing the socioeconomic costs associated with bridge
deck rehabilitation and the inconvenience caused to travelers.
Therefore, in this project, various ways of accelerating the construction of the overlays were
investigated. The study started with three tasks: finding the latest fast-curing concrete mixes that
can be used for overlays, observing an ongoing overlay construction project to suggest time-
saving changes, and finding the required depth for removal of the substrate concrete.
Generally, the Iowa Department of Transportation (DOT) uses high-performance concrete (HPC)
Class HPC-O or Class O concrete mix for overlay construction, which takes at least three days
after overlay placement to re-open the bridge to traffic. For the first task, literature on the latest
fast-curing concrete mixes were studied and several concrete mixes were found that can reduce
the curing time to as short as four hours.
During the second task, an ongoing overlay construction project was observed and documented.
From these observations, any particular process in which there were opportunities for reducing
construction time by making small process changes or using additional equipment or more
workers (i.e., providing some additional resources) were noted.
According to current Iowa DOT practice, during the removal of old unsound concrete, if the
unsound concrete is found to be present above half the diameter of the top reinforcing steel bar,
there is no need for extra removal of any sound concrete. If the unsound concrete is present
below half the diameter of the reinforcing steel bar, in addition to the unsound concrete, extra
sound concrete needs to be removed until one-half to one inch below the reinforcing steel bar.
This extra removal of the substrate concrete leads to additional construction time.
A major part of this project was the third task, which was comprised of four different laboratory
tests with different loading conditions to determine if the additional sound concrete removal is
necessary. The bond strength between the substrate concrete and the new overlay concrete was
tested for four different concrete removal depths. Several parameters, like failure load, bond
stress, and stiffness, were compared for the different removal depths.

xiv
The results from the tests indicated that removing the additional sound concrete below half the
diameter of the reinforcing steel would not result in a significant difference in the bond strength.
1
1. INTRODUCTION
1.1 Background
Due to exposure to extreme environmental conditions, heavy-truck wheel loadings, and deicing
salts that corrode reinforcement, bridge decks are subject to the most severe conditions of all
bridge components. This usually results in deck service lives being less than the other major
bridge components.
Rehabilitating damaged deck slab concrete with an overlay system can significantly increase the
life of the reinforced concrete bridge deck and thus reducing the costs of constructing a new
bridge (Ramey and Oliver 1998). Published literature reveals that many states use overlay
systems to prolong bridge decks service lives.
Generally, the Iowa Department of Transportation (DOT) uses high-performance concrete (HPC)
Class HPC-O or Class O concrete for overlay construction. For the bridge to be open to traffic
after overlay construction, the overlay concrete must reach a flexural strength of 400 psi. HPC-O
concrete generally takes about three days to reach the required strength.
The Ohio DOT (ODOT) Office of Materials and Management Cement and Concrete Section
reported that CTS Cement Rapid Set mixes are able to achieve the flexural strength of 400 psi in
just two hours (Ohio DOT 2007). Part of this project was to identify if any other types of
concrete mixes could reduce the curing time by a marked amount.
One of the major concerns about the construction of an overlay is the time it takes to open the
bridge to traffic. As with other construction activities, attempts to minimize construction time
must not compromise the structural soundness or longevity of the bridge. However, reducing the
construction time could have a great effect on reducing societal costs and inconvenience to
travelers. In this research, various ways of accelerating the construction of overlays were
investigated.
Additionally, according to standard practice for overlay construction in Iowa, during removal of
existing concrete, if more than half of the reinforcing steel bar becomes exposed, additional
concrete needs to be removed so that the entire bar is exposed (Iowa DOT 2012). This process of
removing additional, possibly sound, existing concrete material can be a significant part of the
construction process, particularly if the work is completed using handheld tools. Although this
concrete removal approach has resulted in satisfactory performance for many years, questions
exist as to how, when, and why this requirement was enacted.
Thus, questions remain regarding how much removal is actually needed while still maintaining
adequate structural stability. Answers are particularly important if hydrodemolition is utilized to
remove the deteriorated material, because hydrodemolition equipment can usually be “dialed in”
to remove quite precise depths of concrete.
2
1.2 Objective and Approach
The primary objective of this project is to accelerate the construction of bridge deck overlays.
This objective is divided into three parts as follows:
1. Investigation into faster curing concrete alternatives for overlays
The time required to cure traditional concrete is one aspect of the construction process that
requires a notable amount of time. Current practice in Iowa requires three days of curing for
HPC-O concrete. However, new types of concrete have been introduced that require far less
curing time. Therefore, an investigation of other concrete mixes was completed by studying
the available literature.
2. Observation of the overlay construction process to identify any opportunities for reducing
construction time
In this activity, an ongoing overlay project was observed and documented. Throughout
construction, the process was carefully observed and the time required for each process was
noted. From these observations, any particular process in which there were opportunities for
reducing construction time by making small process changes or using additional equipment
or more workers (i.e., providing some additional resources) were noted, while we understand
that contractors decide means and methods.
3. Laboratory testing to determine the required amount of existing concrete that must be
removed
Removal of the substrate concrete to replace it with new overlay concrete requires a
significant amount of time in the construction of an overlay. The standard practice in Iowa
requires the contractor to remove the deteriorated substrate concrete, but if the removal depth
exceeds half the diameter of the reinforcing bar, it is required that the contractor remove the
concrete to 0.5 to 1 in. below the bar. To investigate the efficacy of this practice, laboratory
testing was completed to determine the relationship between removal depth and the bond
between the substrate concrete and the new overlay concrete.
1.3 Report Content
This report is divided into five chapters. After the introductory material provided in this chapter,
the second chapter includes a literature review of different types of fast-curing concrete
including information on properties. The third chapter contains a summary of a recently
completed bridge deck overlay with suggestions on process changes that may reduce overall
construction time.
3
The fourth chapter covers the laboratory testing completed to evaluate the needed amount of
substrate concrete removal. The chapter summarizes the methodology that was utilized and
includes details about the test procedure, specimen configuration, and testing arrangement. This
chapter also includes the results and discussion of the laboratory tests with the details on the
failures of the specimens.
The fifth chapter summarizes the entire project and includes conclusions and recommendations
for reducing the time associated with overlay construction.
4
2. OVERLAY SYSTEMS
2.1 Description of Different Types of Overlays
2.1.1 Class O Portland Cement Concrete
The Iowa DOT currently uses Class O Portland cement concrete (PCC) as an overlay concrete to
replace the unsound deck concrete during overlay construction. The water-to-cement (w/c) ratio
is intended to be controlled by the slump specified when these mixtures are used. A water-
reducing agent is typically required for this mix. Class O mixes require coarse aggregate
specifically intended for repair and overlay.
2.1.2 Class HPC-O High Performance Concrete
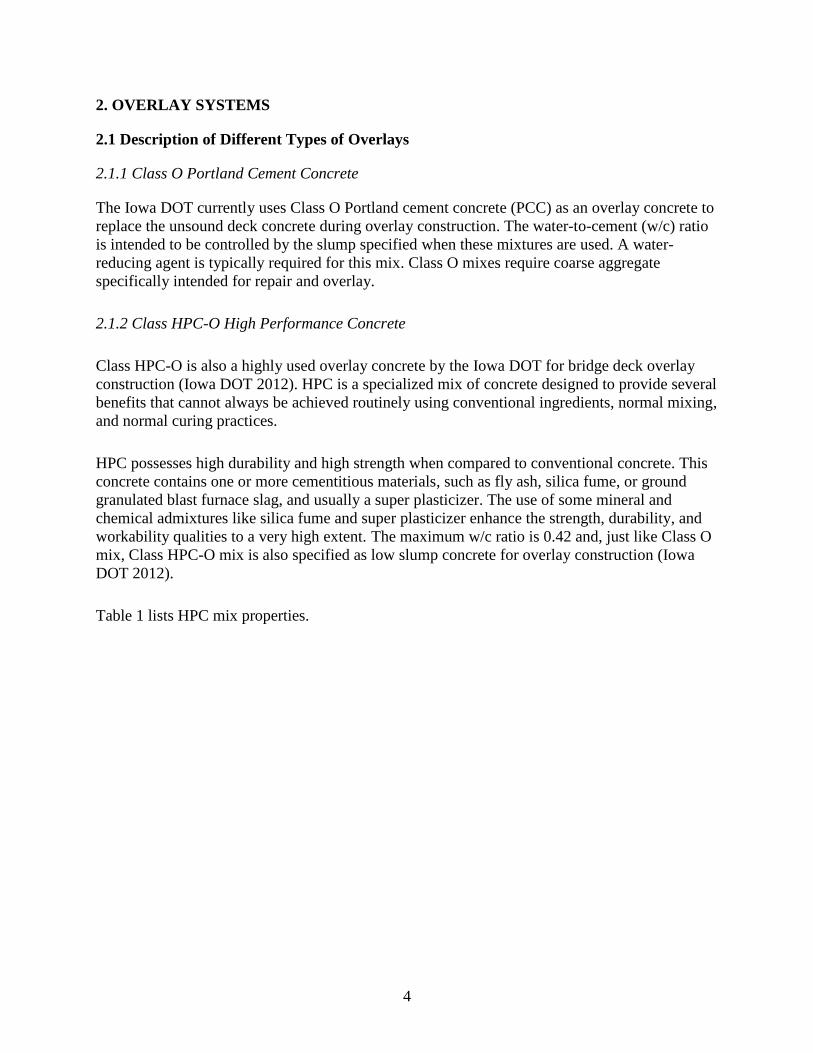
Class HPC-O is also a highly used overlay concrete by the Iowa DOT for bridge deck overlay
construction (Iowa DOT 2012). HPC is a specialized mix of concrete designed to provide several
benefits that cannot always be achieved routinely using conventional ingredients, normal mixing,
and normal curing practices.
HPC possesses high durability and high strength when compared to conventional concrete. This
concrete contains one or more cementitious materials, such as fly ash, silica fume, or ground
granulated blast furnace slag, and usually a super plasticizer. The use of some mineral and
chemical admixtures like silica fume and super plasticizer enhance the strength, durability, and
workability qualities to a very high extent. The maximum w/c ratio is 0.42 and, just like Class O
mix, Class HPC-O mix is also specified as low slump concrete for overlay construction (Iowa
DOT 2012).
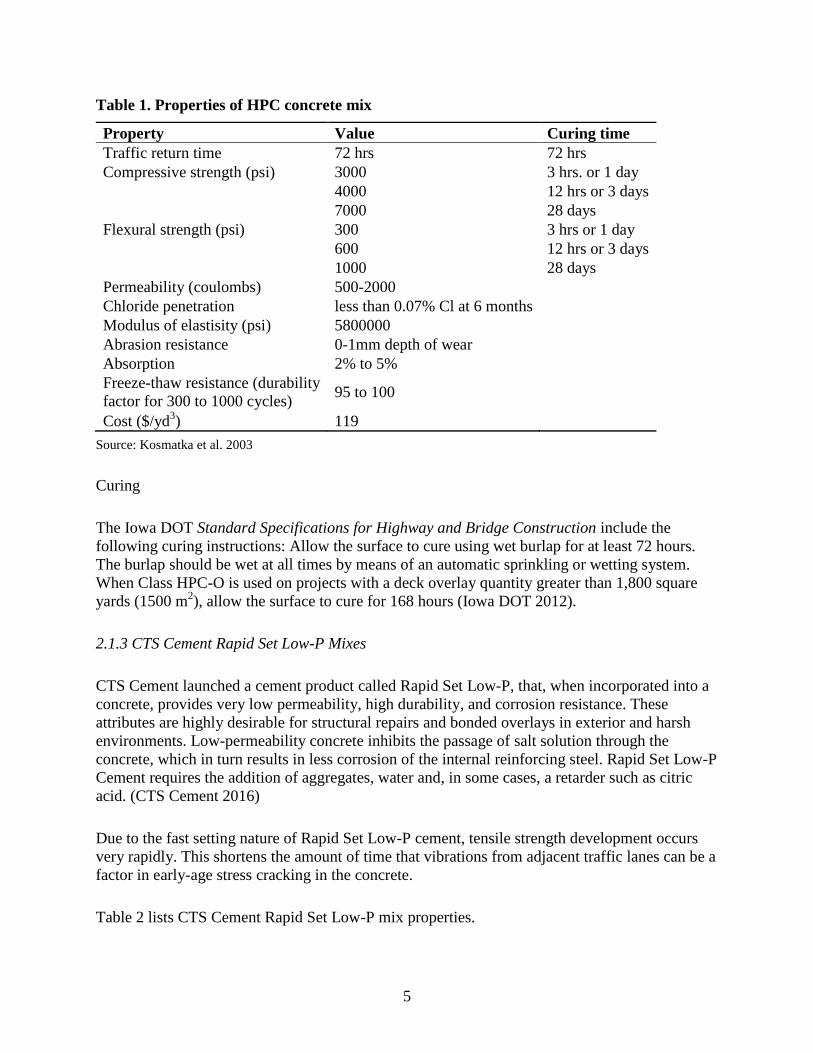
Table 1 lists HPC mix properties.
5
Table 1. Properties of HPC concrete mix
Property Value Curing time
Traffic return time 72 hrs 72 hrs
Compressive strength (psi) 3000 3 hrs. or 1 day
4000 12 hrs or 3 days
7000 28 days
Flexural strength (psi) 300 3 hrs or 1 day
600 12 hrs or 3 days
1000 28 days
Permeability (coulombs) 500-2000
Chloride penetration less than 0.07% Cl at 6 months
Modulus of elastisity (psi) 5800000
Abrasion resistance 0-1mm depth of wear
Absorption 2% to 5%
Freeze-thaw resistance (durability
factor for 300 to 1000 cycles) 95 to 100
Cost ($/yd3) 119
Source: Kosmatka et al. 2003
Curing
The Iowa DOT Standard Specifications for Highway and Bridge Construction include the
following curing instructions: Allow the surface to cure using wet burlap for at least 72 hours.
The burlap should be wet at all times by means of an automatic sprinkling or wetting system.
When Class HPC-O is used on projects with a deck overlay quantity greater than 1,800 square
yards (1500 m2), allow the surface to cure for 168 hours (Iowa DOT 2012).
2.1.3 CTS Cement Rapid Set Low-P Mixes
CTS Cement launched a cement product called Rapid Set Low-P, that, when incorporated into a
concrete, provides very low permeability, high durability, and corrosion resistance. These
attributes are highly desirable for structural repairs and bonded overlays in exterior and harsh
environments. Low-permeability concrete inhibits the passage of salt solution through the
concrete, which in turn results in less corrosion of the internal reinforcing steel. Rapid Set Low-P
Cement requires the addition of aggregates, water and, in some cases, a retarder such as citric
acid. (CTS Cement 2016)
Due to the fast setting nature of Rapid Set Low-P cement, tensile strength development occurs
very rapidly. This shortens the amount of time that vibrations from adjacent traffic lanes can be a
factor in early-age stress cracking in the concrete.
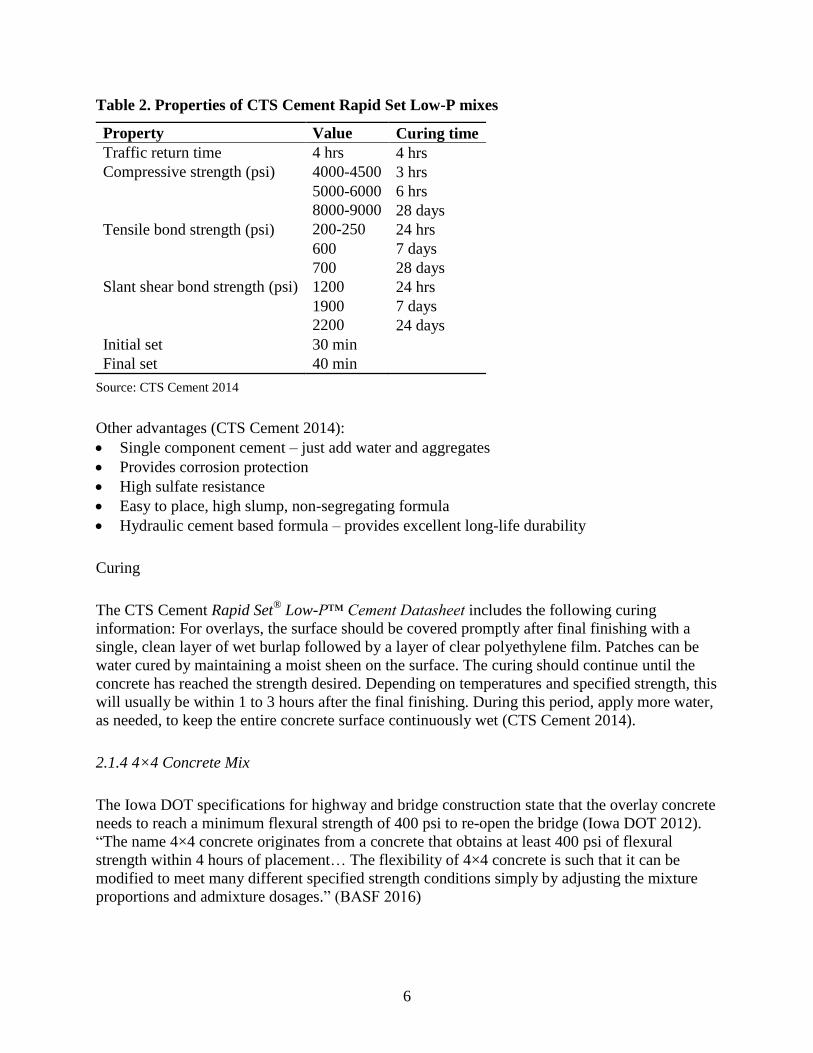
Table 2 lists CTS Cement Rapid Set Low-P mix properties.
6
Table 2. Properties of CTS Cement Rapid Set Low-P mixes
Property Value Curing time
Traffic return time 4 hrs 4 hrs
Compressive strength (psi) 4000-4500 3 hrs
5000-6000 6 hrs
8000-9000 28 days
Tensile bond strength (psi) 200-250 24 hrs
600 7 days
700 28 days
Slant shear bond strength (psi) 1200 24 hrs
1900 7 days
2200 24 days
Initial set 30 min
Final set 40 min
Source: CTS Cement 2014
Other advantages (CTS Cement 2014):
Single component cement – just add water and aggregates
Provides corrosion protection
High sulfate resistance
Easy to place, high slump, non-segregating formula
Hydraulic cement based formula – provides excellent long-life durability
Curing
The CTS Cement Rapid Set®
Low-P™ Cement Datasheet includes the following curing
information: For overlays, the surface should be covered promptly after final finishing with a
single, clean layer of wet burlap followed by a layer of clear polyethylene film. Patches can be
water cured by maintaining a moist sheen on the surface. The curing should continue until the
concrete has reached the strength desired. Depending on temperatures and specified strength, this
will usually be within 1 to 3 hours after the final finishing. During this period, apply more water,
as needed, to keep the entire concrete surface continuously wet (CTS Cement 2014).
2.1.4 4×4 Concrete Mix
The Iowa DOT specifications for highway and bridge construction state that the overlay concrete
needs to reach a minimum flexural strength of 400 psi to re-open the bridge (Iowa DOT 2012).
“The name 4×4 concrete originates from a concrete that obtains at least 400 psi of flexural
strength within 4 hours of placement… The flexibility of 4×4 concrete is such that it can be
modified to meet many different specified strength conditions simply by adjusting the mixture
proportions and admixture dosages.” (BASF 2016)
7
With 4×4 concrete, it is possible to proportion a mixture using locally available Portland
cements, aggregates, and selected admixtures. With 4×4 concrete, a synthetic high-range water-
reducing admixture is used to provide fluidity and strength, a hydration control admixture is used
to provide workability control, and an accelerating admixture provides early strength (Meyers
n.d.). Air-entraining admixtures can be used where the concrete has to be air-entrained (BASF
2011).
Smith, Alarcon, and Glauz mention that 4×4 concrete has met all of the technical and
performance expectations of the California DOT (Caltrans) highway engineers (Smith et al.
2001). For example, no cracks have been observed four hours after placement of the material.
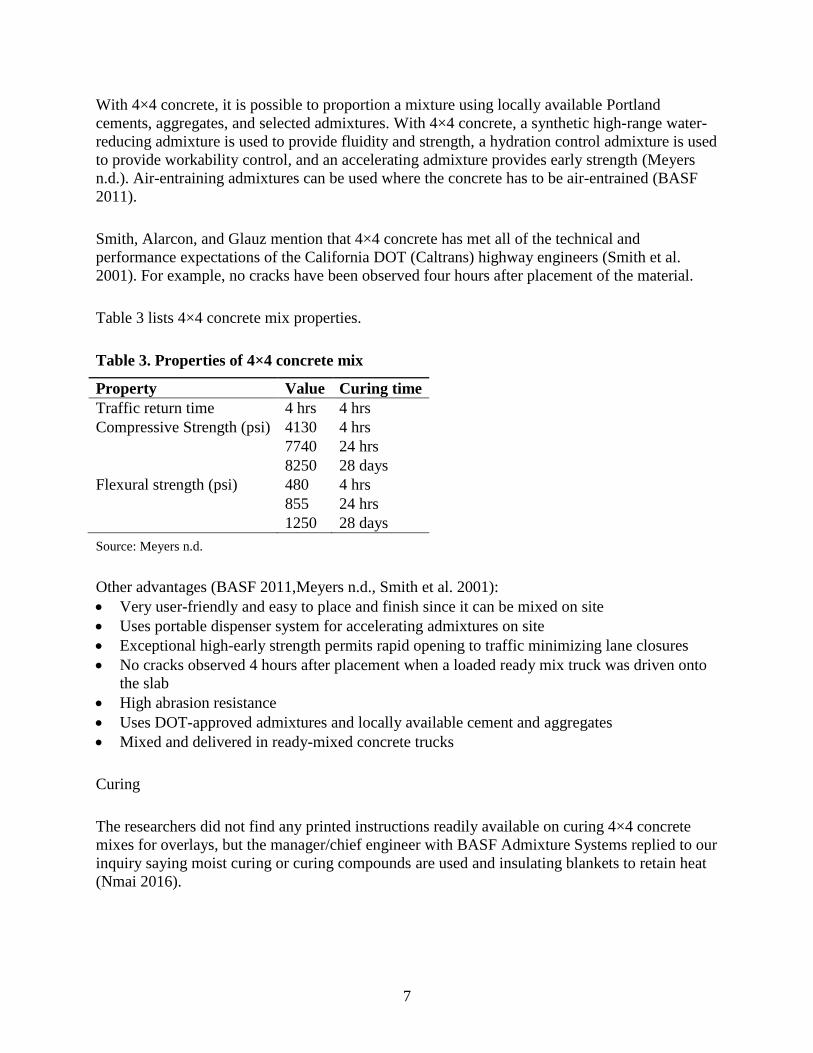
Table 3 lists 4×4 concrete mix properties.
Table 3. Properties of 4×4 concrete mix
Property Value Curing time
Traffic return time 4 hrs 4 hrs
Compressive Strength (psi) 4130 4 hrs
7740 24 hrs
8250 28 days
Flexural strength (psi) 480 4 hrs
855 24 hrs
1250 28 days
Source: Meyers n.d.
Other advantages (BASF 2011,Meyers n.d., Smith et al. 2001):
Very user-friendly and easy to place and finish since it can be mixed on site
Uses portable dispenser system for accelerating admixtures on site
Exceptional high-early strength permits rapid opening to traffic minimizing lane closures
No cracks observed 4 hours after placement when a loaded ready mix truck was driven onto
the slab
High abrasion resistance
Uses DOT-approved admixtures and locally available cement and aggregates
Mixed and delivered in ready-mixed concrete trucks
Curing
The researchers did not find any printed instructions readily available on curing 4×4 concrete
mixes for overlays, but the manager/chief engineer with BASF Admixture Systems replied to our
inquiry saying moist curing or curing compounds are used and insulating blankets to retain heat
(Nmai 2016).
8
2.1.5 Polyester Polymer Concrete
Polymer concrete is an expensive overlay material that can cost twice as much as conventional
PCC and slightly more than latex-modified concrete. However, an increasing number of highway
engineers are choosing polymer concrete for concrete bridge deck rehabilitation, finding that its
advantages as an overlay material might justify its high cost.
Some benefits of polymer concrete include improvement in abrasion and skid resistance of the
deck surface and also protection against corrosion of the internal steel reinforcement.
Additionally, it is impermeable to water, deicing salts, and chemicals that can accelerate
corrosion.
Polyester concrete is a composite of dry aggregate in an unsaturated or thermoset, polyester resin
binder. Certain polymer content, well-graded aggregates, fibers, and coupling agents influence
the various properties of polyester polymer concrete. When the liquid resin cures into a
hardened, cross-linked state, a polyester concrete is formed.
Maggenti stated that Caltrans’ use of polyester polymer concrete for 20 years has been successful
and proved to be very effective in terms of durability, crack resistance, chloride ion intrusion
resistance, bonding, ease of construction, and lane closure time (Maggenti 2001).
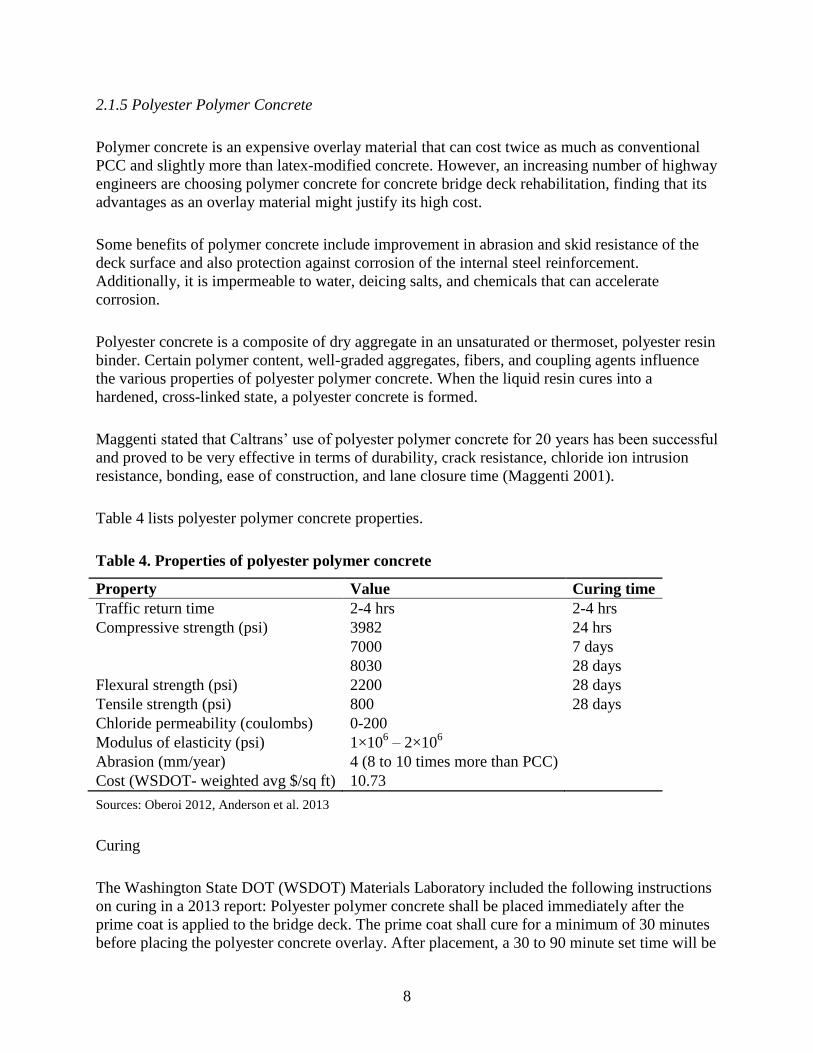
Table 4 lists polyester polymer concrete properties.
Table 4. Properties of polyester polymer concrete
Property Value Curing time
Traffic return time 2-4 hrs 2-4 hrs
Compressive strength (psi) 3982 24 hrs
7000 7 days
8030 28 days
Flexural strength (psi) 2200 28 days
Tensile strength (psi) 800 28 days
Chloride permeability (coulombs) 0-200
Modulus of elasticity (psi) 1×10⁶ – 2×10
6
Abrasion (mm/year) 4 (8 to 10 times more than PCC)
Cost (WSDOT- weighted avg $/sq ft) 10.73
Sources: Oberoi 2012, Anderson et al. 2013
Curing
The Washington State DOT (WSDOT) Materials Laboratory included the following instructions
on curing in a 2013 report: Polyester polymer concrete shall be placed immediately after the
prime coat is applied to the bridge deck. The prime coat shall cure for a minimum of 30 minutes
before placing the polyester concrete overlay. After placement, a 30 to 90 minute set time will be
9
produced by implementing initiators. Depending on environmental conditions such as weather,
accelerators or inhibitors may be added to the mix to help produce the specified cure time.
Traffic and construction equipment shall not be permitted on the polyester polymer concrete
overlay for at least two hours and until the polyester polymer overlay has reached a minimum
compressive strength of 3,000 psi as verified by the rebound number determined in accordance
with ASTM C805. No vehicles or personnel will be allowed to travel on the finished polyester
concrete overlay during the curing process.
The contractor will utilize a Schmidt hammer to determine the proper time to open the roadway
to traffic. A 3,000 psi reading on the rebound hammer will be achieved in order to open the
roadway to traffic (Anderson et al. 2013).
2.1.6 Very-Early-Strength LMC
Latex-modified concrete (LMC) is a PCC in which an admixture of styrene butadiene latex
particles suspended in water is used to replace a portion of the mixing water. LMC has been used
on highway bridges for overlay rehabilitation for more than 40 years (Sprinkel 1998).
Compared to concrete without latex, LMC is reported to be more resistant to intrusion of
chloride ions, to have higher tensile, compressive, and flexural strength, and to have greater
freeze-thaw resistance. The use of LMC overlays is one of the most popular ways to extend the
time to corrosion initiation. The resistance to chloride intrusion is said to be attributable to the
lower w/c ratio and a plastic film produced by the latex particles within the concrete (Sprinkel
1998).
Table 5 lists very-early-strength LMC properties.
Table 5. Properties of very-early-strength LMC
Property Value Curing time
Traffic return time 3 hrs 3 hrs
Compressive strength (psi) 3000 3 hrs
4000 6 hrs
6500 5 days
Chloride permeability (coulombs) 300-1400 28 days
0-10 1 year
0-60 9 years
Drying shrinkage (%) 0.02 170
Tensile adhesion bond strength (psi) 153-276 1-6 months
176-301 9-10 years
Cost ($/yd3) 140
Source: Sprinkel 2011

10
Curing
The overlay is to be covered quickly with wet burlap and polyethylene to provide a moist
environment during the three-hour curing period (Sprinkel 1998).
11
3. INVESTIGATION OF ONGOING OVERLAY CONSTRUCTION PROJECT
The acceleration of the construction of bridge deck overlays may be achieved by proper
management of time, labor, and materials. As part of this research, a team was sent to an ongoing
overlay construction site to investigate the time required for different activities and to observe
possible activities where construction time could be reduced.
Overlay construction for the bridge on IA 163 over Fourmile Creek, 1.7 miles west of US 65
(FHWA No. 40941, overlay project number BRFN-163-1(87)--39-77), was observed. The bridge
was 256 ft long and 56 ft wide For this research, the team observed overlay construction of only
the eastbound lanes. A summary of the team’s investigation of the construction activities
follows.
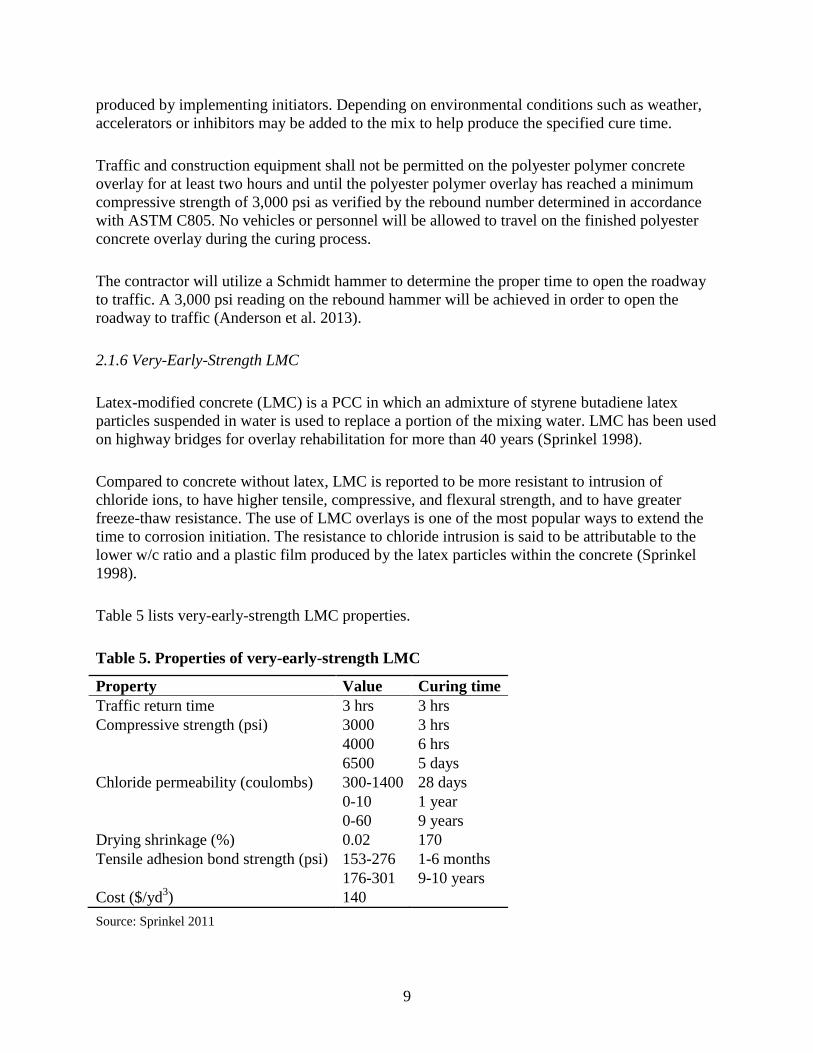
3.1 Removal of Temporary Bollards
Temporary bollards were installed on the bridge deck during construction of the westbound
overlay. These bollards were installed between the eastbound and westbound lanes to direct
traffic safely. The bollards that were used were bolted to the deck and had to be detached using a
hand drill as shown in the Figure 1.
Figure 1. Temporary bollards being detached by workers
It took two hours for 10 workers to remove all of the bollards.
12
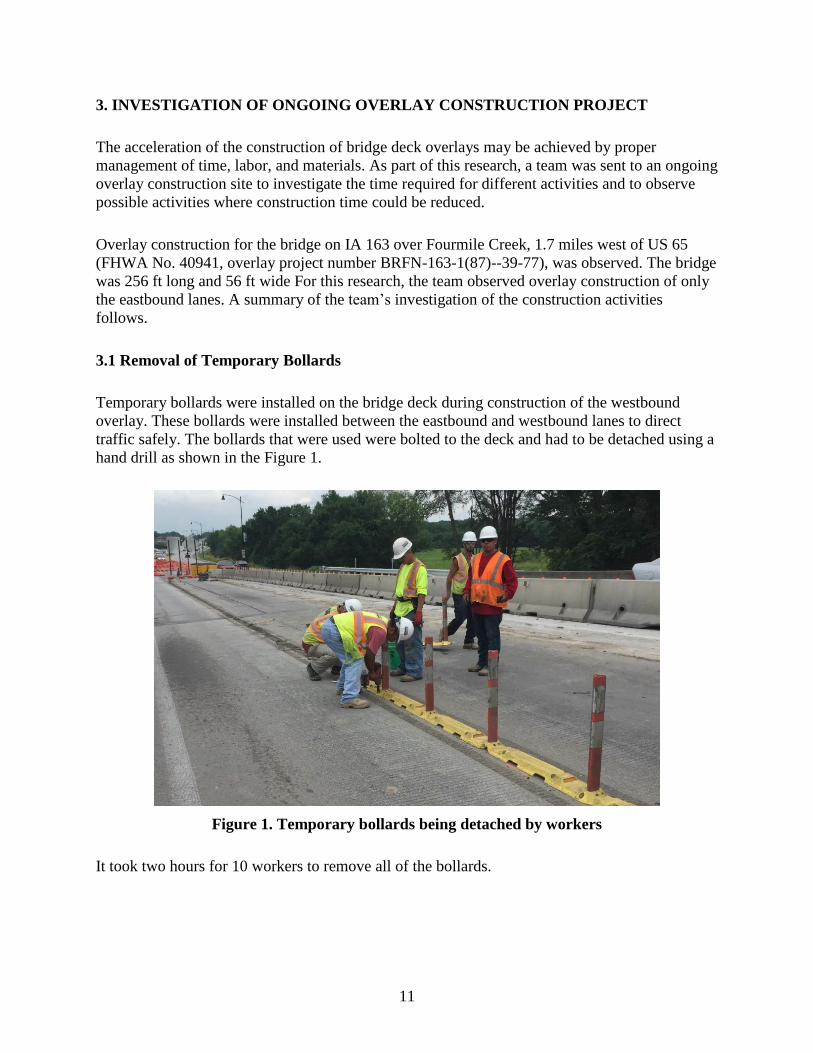
3.2 Removal of Top 2 to 3 in. Layer of Deck Concrete
After the temporary bollards were removed, a milling machine was lined up with the deck
surface and prepared for operation. Preparing the road milling machine took about an hour.
One person operated the machine and four workers watched over the machine and guided the
operator. The milled concrete was transferred to a dump truck by a conveyor connected to the
milling machine as shown in Figure 2.
Figure 2. Milling machine removal of top layer of the deck
In one pass from one end of the bridge to the other, the milling machine was able to remove
about 2 to 3 in. of concrete, so that there would be only 0.5 to 1 in. deep concrete on top of
reinforcing steel. The milling required an hour to finish one pass and, once a pass was done, it
took 15 to 20 minutes to turn around and start working on the next pass.
After half of the deck was milled, the cutting drum of the road milling machine was changed,
which took 30 to 45 minutes. The overall time for the removal of the top layer of concrete was
seven hours.
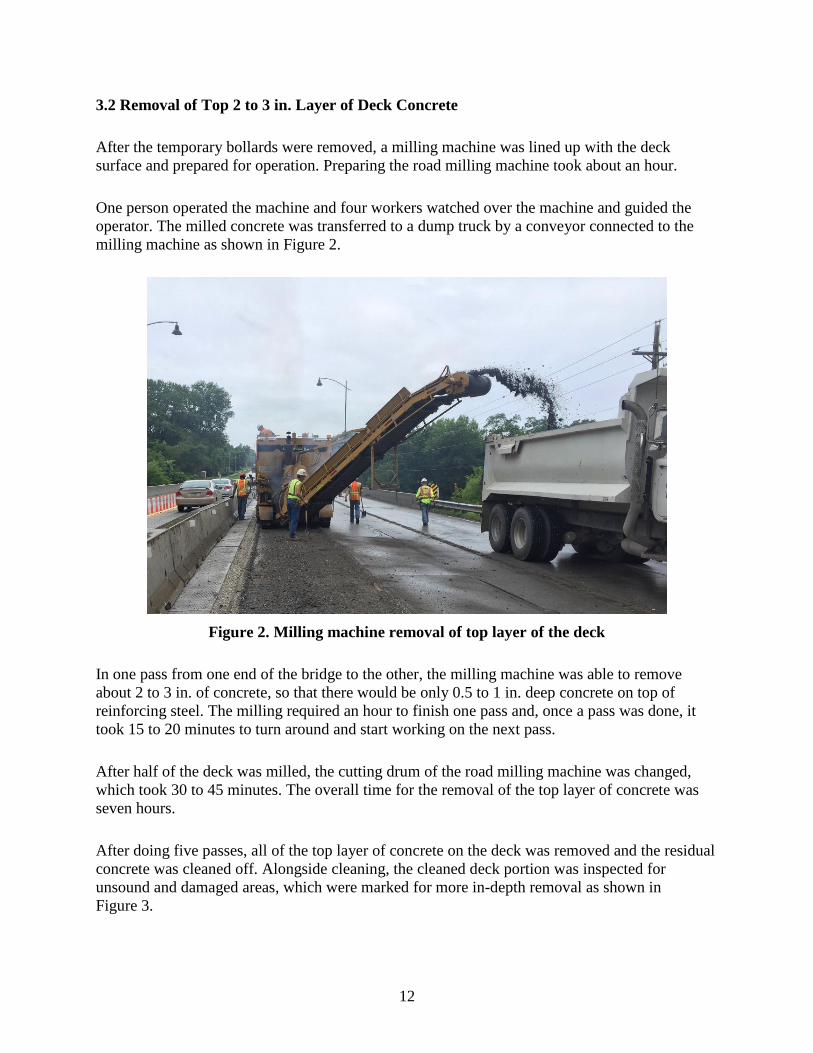
After doing five passes, all of the top layer of concrete on the deck was removed and the residual
concrete was cleaned off. Alongside cleaning, the cleaned deck portion was inspected for
unsound and damaged areas, which were marked for more in-depth removal as shown in
Figure 3.
13
Figure 3. Area marked for more in-depth removal
Throughout the removal of the top layer of concrete, three dump trucks were used to take milled
concrete from the construction site to the dump site. Even though three trucks were used, many
times, after a truck was filled with concrete, a new truck was not ready to continue the road
milling machine’s operation. Access to the bridge site required long travel times and, as a result,
a truck was not yet available at times and the milling operation had to be halted for several
minutes. Providing one more dump truck could reduce that downtime.
3.3 Placing the Compressed Air Line
Jackhammers were used to further remove the unsound concrete after removal of the top 2 to 3
in. layer. To power the jackhammers along the length of the bridge, a pipeline for compressed air
was installed on the outer side of the bridge railings. Five workers were working on the
installation of the compressed air pipeline while the top layer of the deck was being removed
using the milling machine.
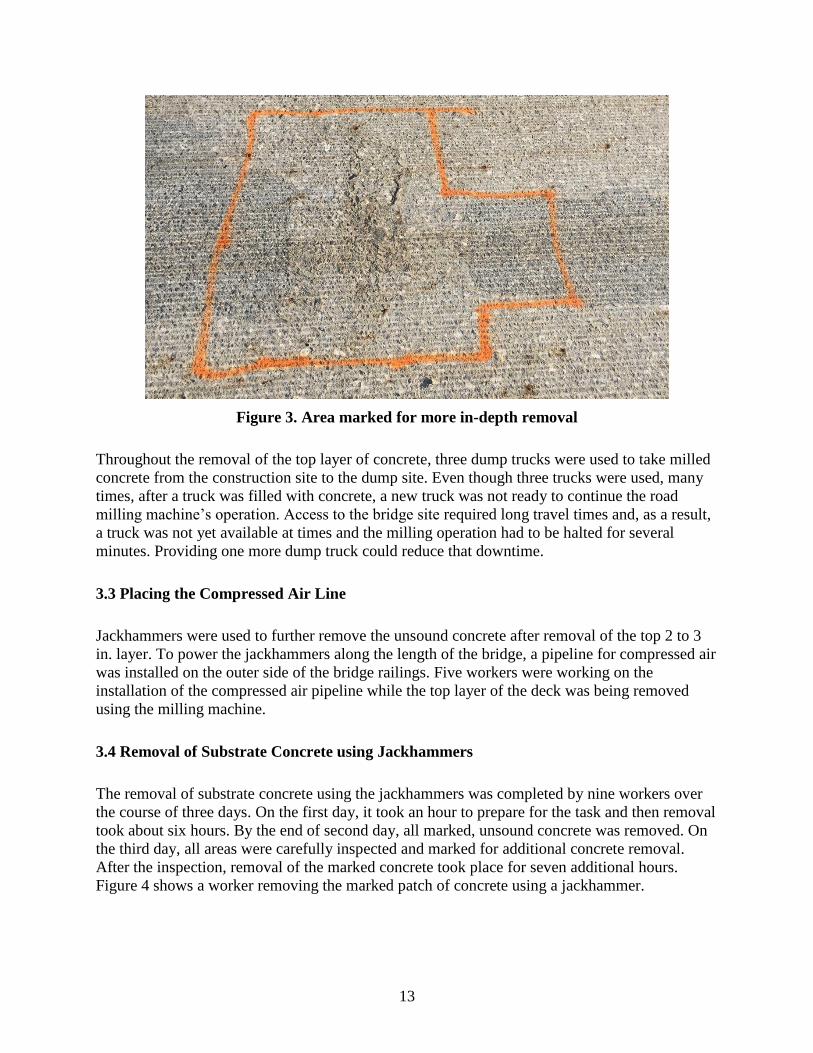
3.4 Removal of Substrate Concrete using Jackhammers
The removal of substrate concrete using the jackhammers was completed by nine workers over
the course of three days. On the first day, it took an hour to prepare for the task and then removal
took about six hours. By the end of second day, all marked, unsound concrete was removed. On
the third day, all areas were carefully inspected and marked for additional concrete removal.
After the inspection, removal of the marked concrete took place for seven additional hours.
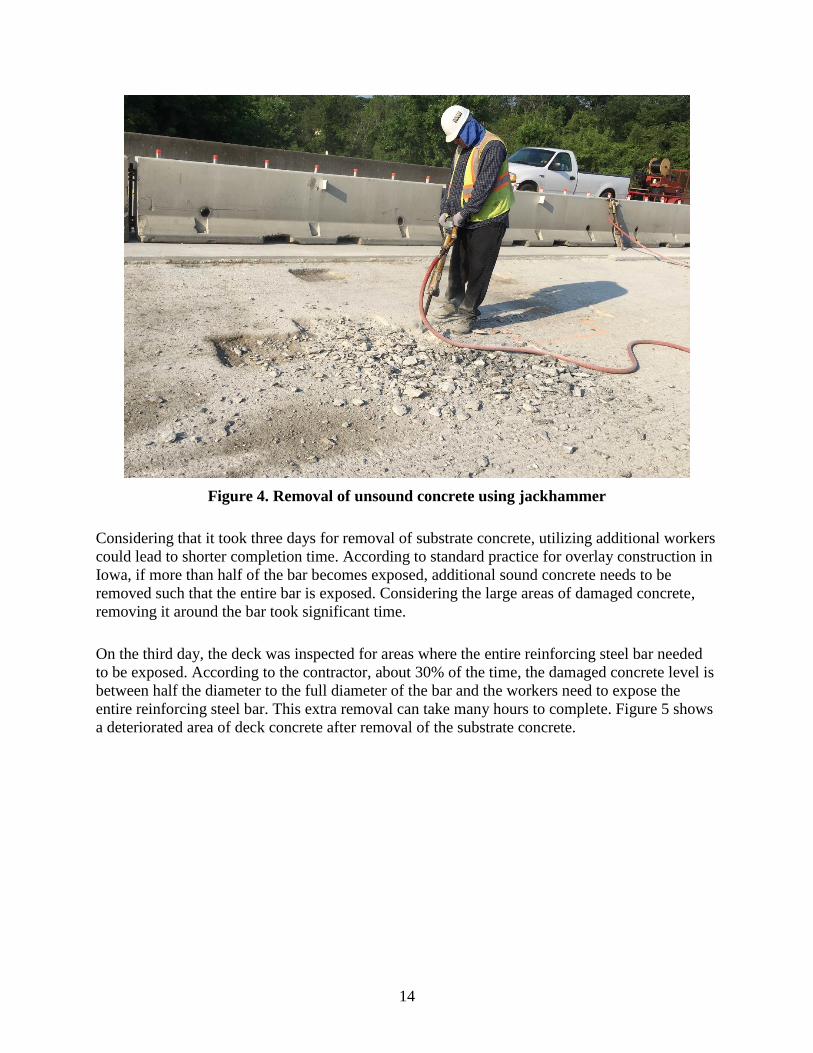
Figure 4 shows a worker removing the marked patch of concrete using a jackhammer.
14
Figure 4. Removal of unsound concrete using jackhammer
Considering that it took three days for removal of substrate concrete, utilizing additional workers
could lead to shorter completion time. According to standard practice for overlay construction in
Iowa, if more than half of the bar becomes exposed, additional sound concrete needs to be
removed such that the entire bar is exposed. Considering the large areas of damaged concrete,
removing it around the bar took significant time.
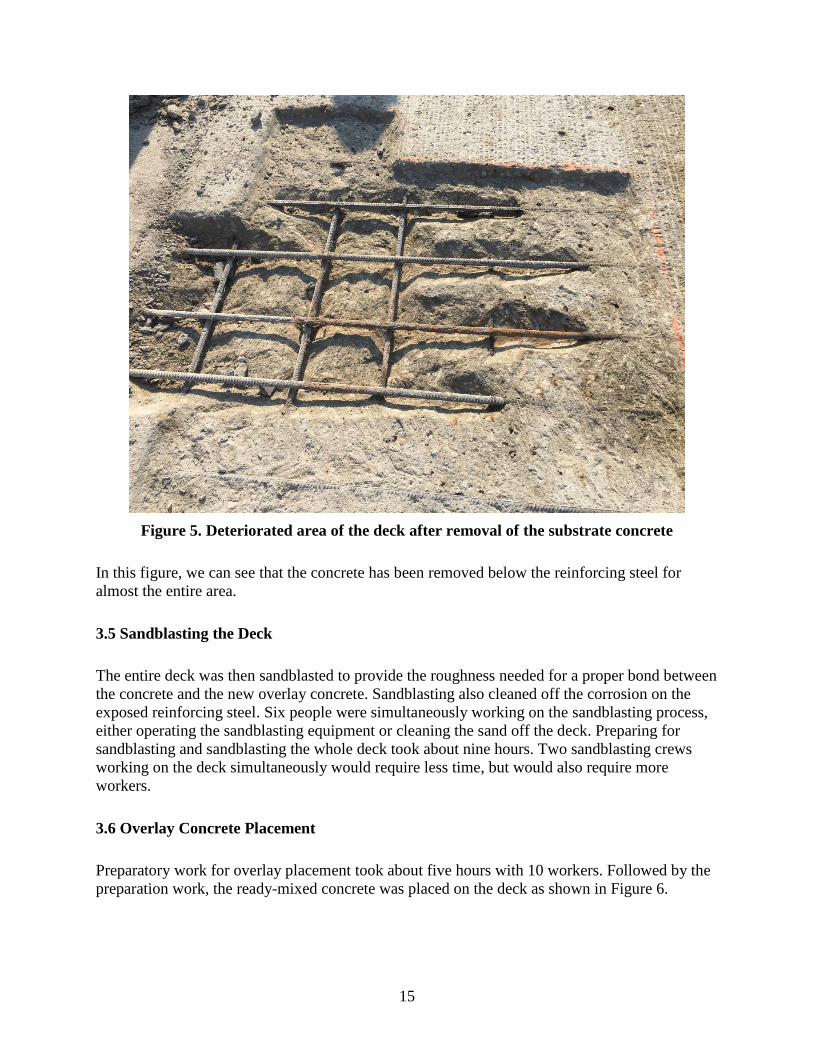
On the third day, the deck was inspected for areas where the entire reinforcing steel bar needed
to be exposed. According to the contractor, about 30% of the time, the damaged concrete level is
between half the diameter to the full diameter of the bar and the workers need to expose the
entire reinforcing steel bar. This extra removal can take many hours to complete. Figure 5 shows
a deteriorated area of deck concrete after removal of the substrate concrete.
15
Figure 5. Deteriorated area of the deck after removal of the substrate concrete
In this figure, we can see that the concrete has been removed below the reinforcing steel for
almost the entire area.
3.5 Sandblasting the Deck
The entire deck was then sandblasted to provide the roughness needed for a proper bond between
the concrete and the new overlay concrete. Sandblasting also cleaned off the corrosion on the
exposed reinforcing steel. Six people were simultaneously working on the sandblasting process,
either operating the sandblasting equipment or cleaning the sand off the deck. Preparing for
sandblasting and sandblasting the whole deck took about nine hours. Two sandblasting crews
working on the deck simultaneously would require less time, but would also require more
workers.
3.6 Overlay Concrete Placement
Preparatory work for overlay placement took about five hours with 10 workers. Followed by the
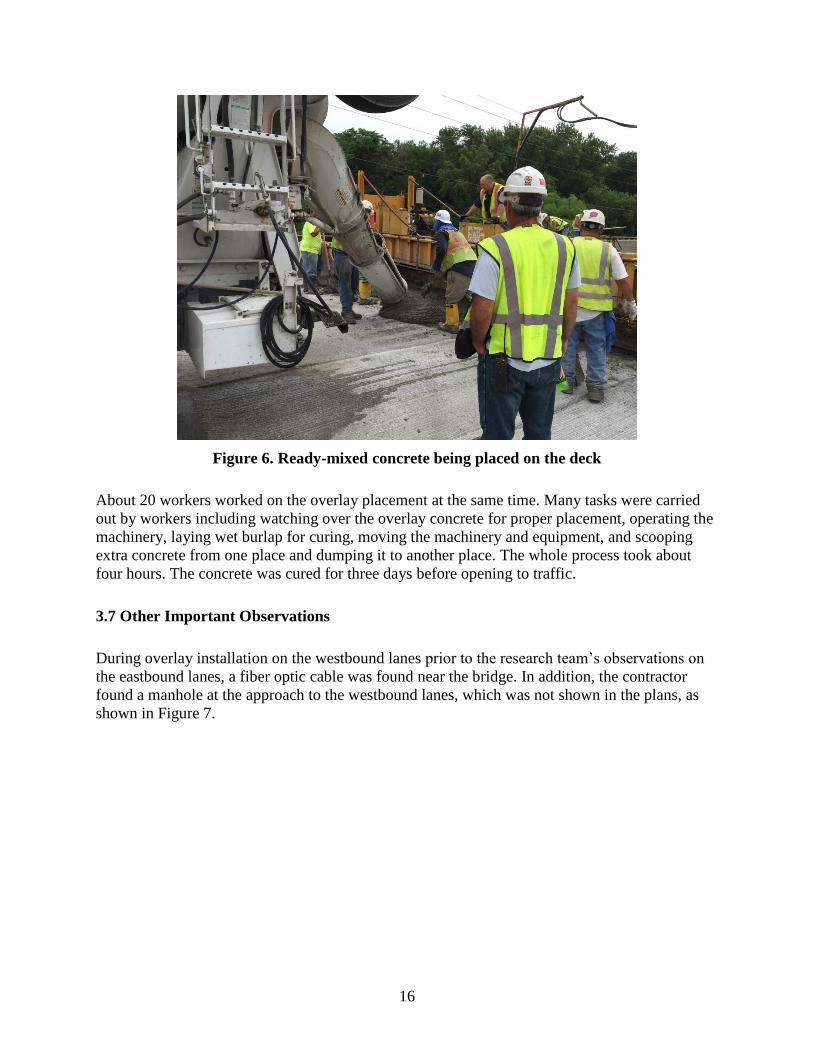
preparation work, the ready-mixed concrete was placed on the deck as shown in Figure 6.
16
Figure 6. Ready-mixed concrete being placed on the deck
About 20 workers worked on the overlay placement at the same time. Many tasks were carried
out by workers including watching over the overlay concrete for proper placement, operating the
machinery, laying wet burlap for curing, moving the machinery and equipment, and scooping
extra concrete from one place and dumping it to another place. The whole process took about
four hours. The concrete was cured for three days before opening to traffic.
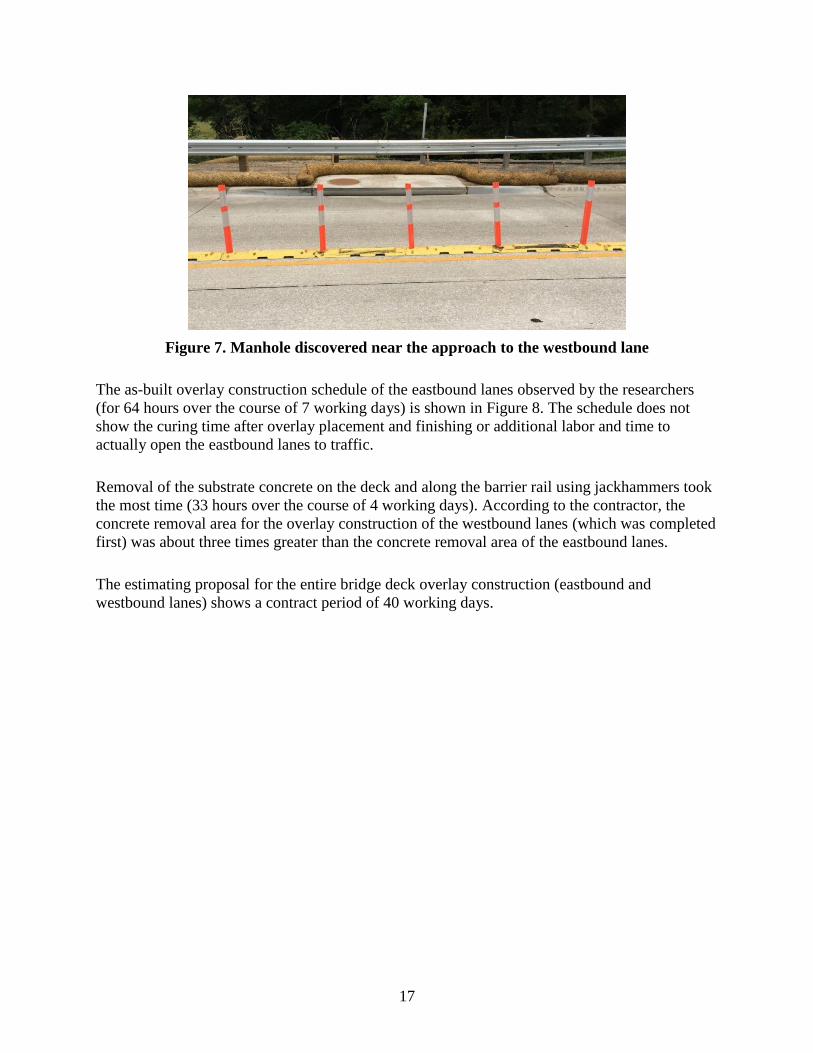
3.7 Other Important Observations
During overlay installation on the westbound lanes prior to the research team’s observations on
the eastbound lanes, a fiber optic cable was found near the bridge. In addition, the contractor
found a manhole at the approach to the westbound lanes, which was not shown in the plans, as
shown in Figure 7.
17
Figure 7. Manhole discovered near the approach to the westbound lane
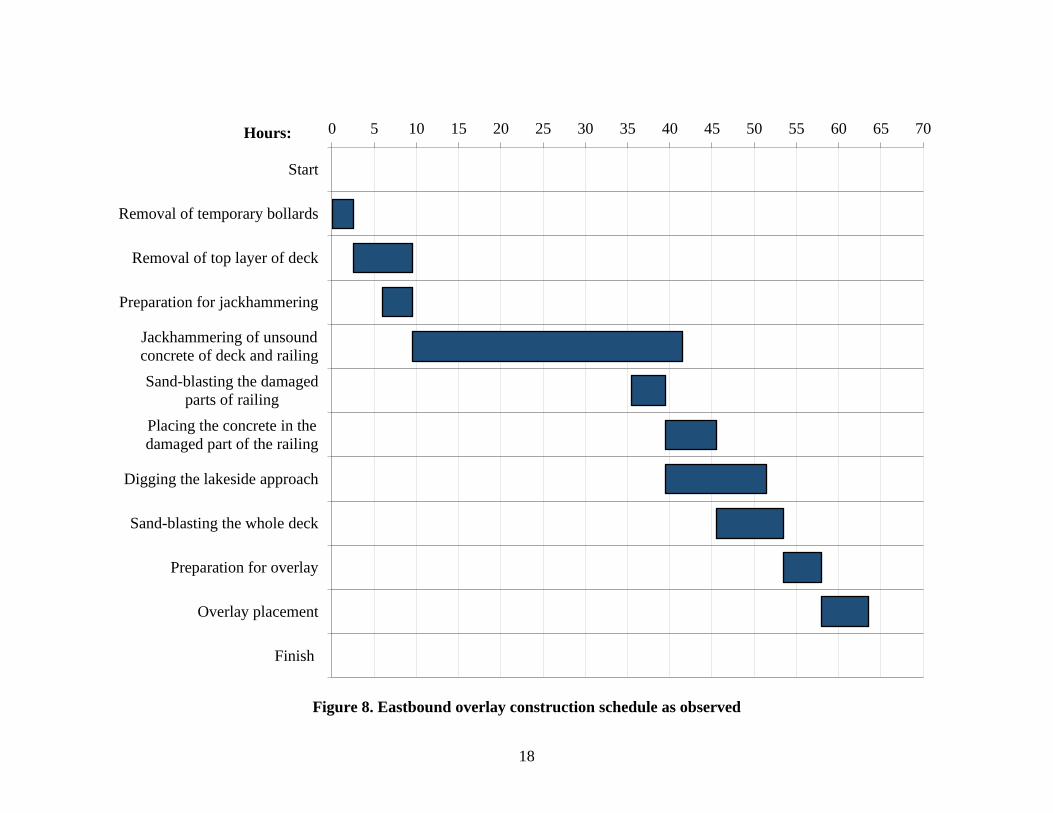
The as-built overlay construction schedule of the eastbound lanes observed by the researchers
(for 64 hours over the course of 7 working days) is shown in Figure 8. The schedule does not
show the curing time after overlay placement and finishing or additional labor and time to
actually open the eastbound lanes to traffic.
Removal of the substrate concrete on the deck and along the barrier rail using jackhammers took
the most time (33 hours over the course of 4 working days). According to the contractor, the
concrete removal area for the overlay construction of the westbound lanes (which was completed
first) was about three times greater than the concrete removal area of the eastbound lanes.
The estimating proposal for the entire bridge deck overlay construction (eastbound and
westbound lanes) shows a contract period of 40 working days.
18
Figure 8. Eastbound overlay construction schedule as observed
0 5 10 15 20 25 30 35 40 45 50 55 60 65 70
Start
Removal of temporary bollards
Removal of top layer of deck
Preparation for jackhammering
Jackhammering of unsound
concrete of deck and railing
Sand-blasting the damaged
parts of railing
Placing the concrete in the
damaged part of the railing
Digging the lakeside approach
Sand-blasting the whole deck
Preparation for overlay
Overlay placement
Finish
Hours:
19
4. LABORATORY TESTING
4.1 Methodology and Study Parameters
With this project, one of the approaches investigated for accelerating overlay construction was to
determine if the change in depth of overlay concrete affects the bond strength between the
substrate concrete and the new overlay concrete. Currently, if the concrete needs to be removed
up to half of the diameter of the reinforcing steel, then it is not necessary to remove it any
further; but, if there is a need to remove the concrete any deeper than half the diameter of the
reinforcing steel, it is removed to expose all of the bar plus an extra 0.5 to 1 in. of concrete. This
need for extra removal takes extra construction time.
Four different cases of reinforcing steel exposure were considered in four tests so that, the bond
strength between the substrate and the overlay concrete could be studied. Three specimens were
tested for every removal depth level.
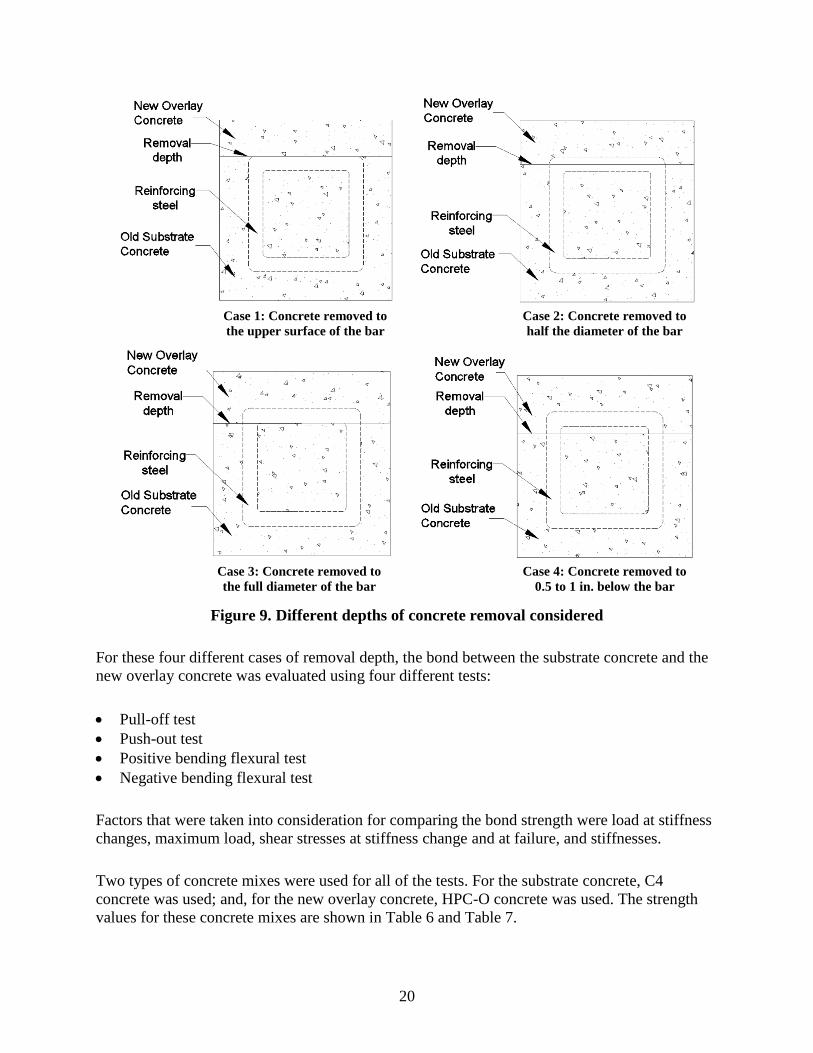
The following four cases of removal depth levels were considered, as also shown in Figure 9.
Case 1. Concrete removed down to the upper surface of the reinforcing steel
In this case, the substrate concrete was removed down to the top surface of the reinforcing
steel so that there would be virtually no exposure of the reinforcing steel to the new overlay
concrete.
Case 2. Concrete removed down to half the diameter of the reinforcing steel
The substrate concrete was removed up to half the diameter of the reinforcing steel leaving
the top half of the reinforcing steel exposed to the new overlay concrete.
Case 3. Concrete removed down to the full diameter of the reinforcing steel
In this third case, the substrate concrete was removed to the bottom of the reinforcing steel,
so that the entire diameter of the reinforcing bar would be exposed to the new overlay
concrete.
Case 4. Concrete removed down to the full diameter of the reinforcing steel plus an
additional 0.5 to 1 in. below it
To get deeper, an additional 0.5 to 1 in. concrete was removed in addition to the full bar
exposure condition.
20
Case 1: Concrete removed to Case 2: Concrete removed to
the upper surface of the bar half the diameter of the bar
Case 3: Concrete removed to Case 4: Concrete removed to
the full diameter of the bar 0.5 to 1 in. below the bar
Figure 9. Different depths of concrete removal considered
For these four different cases of removal depth, the bond between the substrate concrete and the
new overlay concrete was evaluated using four different tests:
Pull-off test
Push-out test
Positive bending flexural test
Negative bending flexural test
Factors that were taken into consideration for comparing the bond strength were load at stiffness
changes, maximum load, shear stresses at stiffness change and at failure, and stiffnesses.
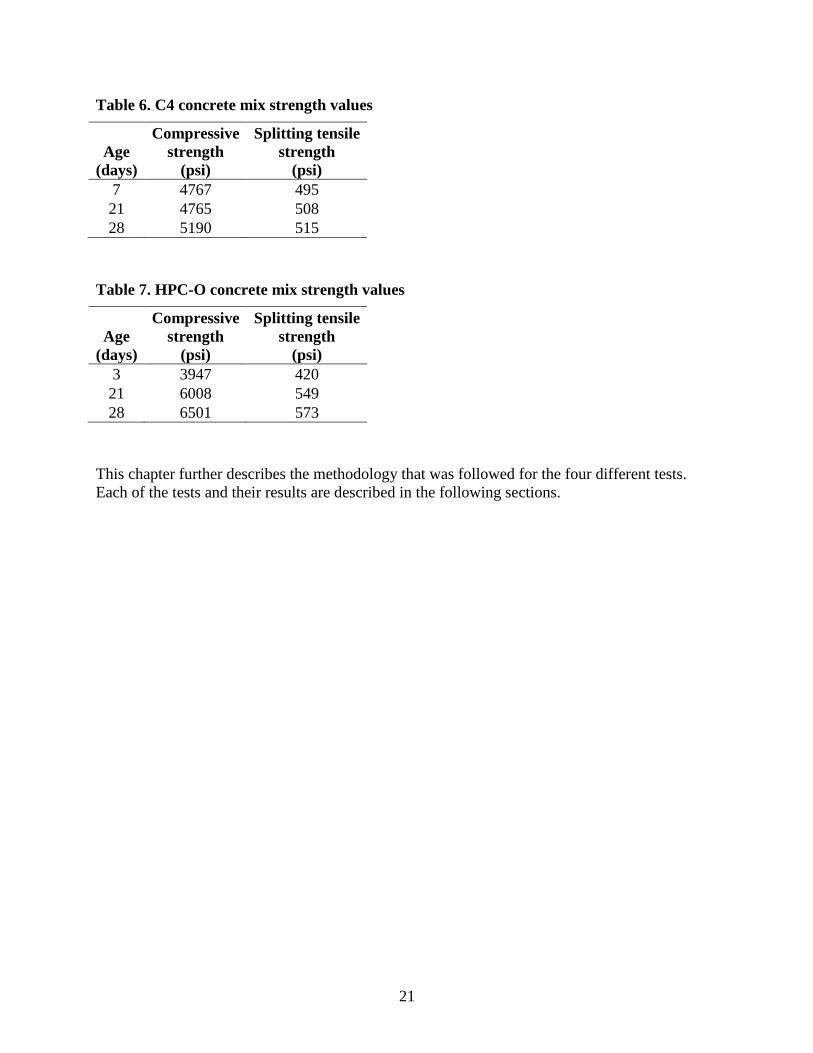
Two types of concrete mixes were used for all of the tests. For the substrate concrete, C4
concrete was used; and, for the new overlay concrete, HPC-O concrete was used. The strength
values for these concrete mixes are shown in Table 6 and Table 7.
21
Table 6. C4 concrete mix strength values
Age
(days)
Compressive
strength
(psi)
Splitting tensile
strength
(psi)
7 4767 495
21 4765 508
28 5190 515
Table 7. HPC-O concrete mix strength values
Age
(days)
Compressive
strength
(psi)
Splitting tensile
strength
(psi)
3 3947 420
21 6008 549
28 6501 573
This chapter further describes the methodology that was followed for the four different tests.
Each of the tests and their results are described in the following sections.
22
4.2 Pull-Off Test
The pull-off test was used to determine the tensile bond strength between the old concrete and
the new overlay concrete with variable removal depth levels.
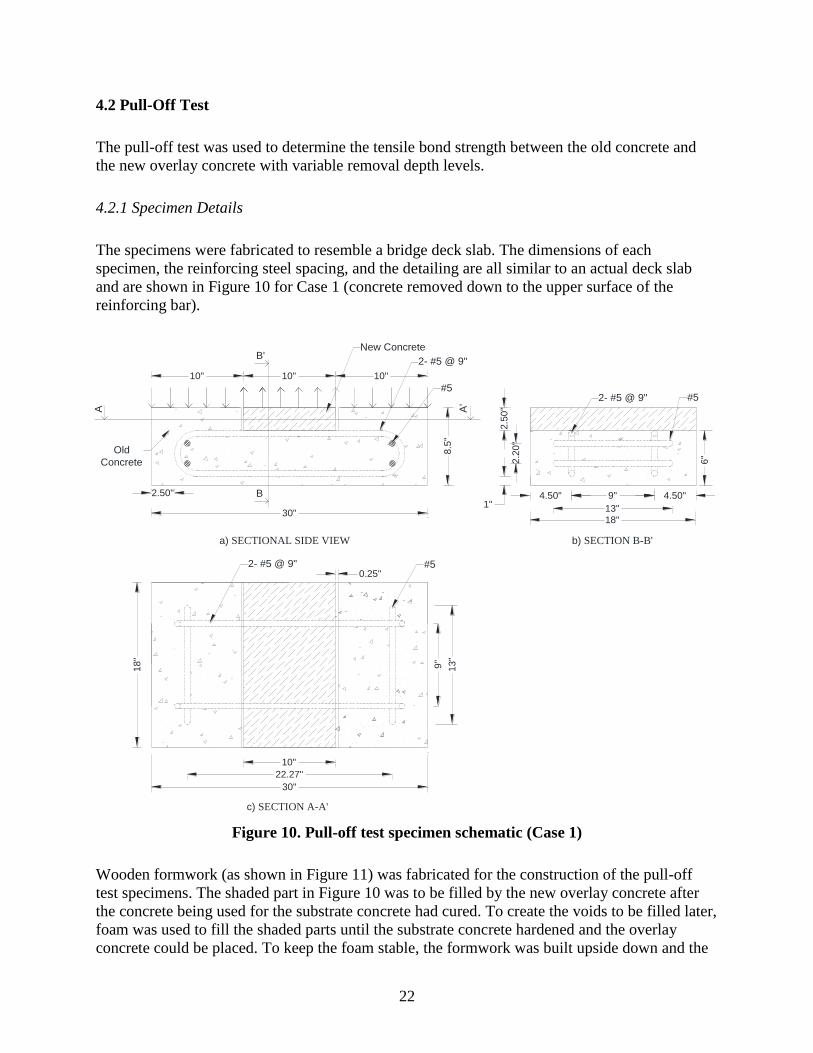
4.2.1 Specimen Details
The specimens were fabricated to resemble a bridge deck slab. The dimensions of each
specimen, the reinforcing steel spacing, and the detailing are all similar to an actual deck slab
and are shown in Figure 10 for Case 1 (concrete removed down to the upper surface of the
reinforcing bar).
30"
10"
#5
2- #5 @ 9"
Old
Concrete
New Concrete
9" 4.50"
8.5
"
18"2.2
0"
2.5
0"
6"
4.50"
9"
13"
13"
18"
30"
A A'
B
B'
10"
#5
#5
2- #5 @ 9"
2- #5 @ 9"
10" 10"
22.27"
0.25"
2.50"
b) SECTION B-B'
c) SECTION A-A'
a) SECTIONAL SIDE VIEW
1"
Figure 10. Pull-off test specimen schematic (Case 1)
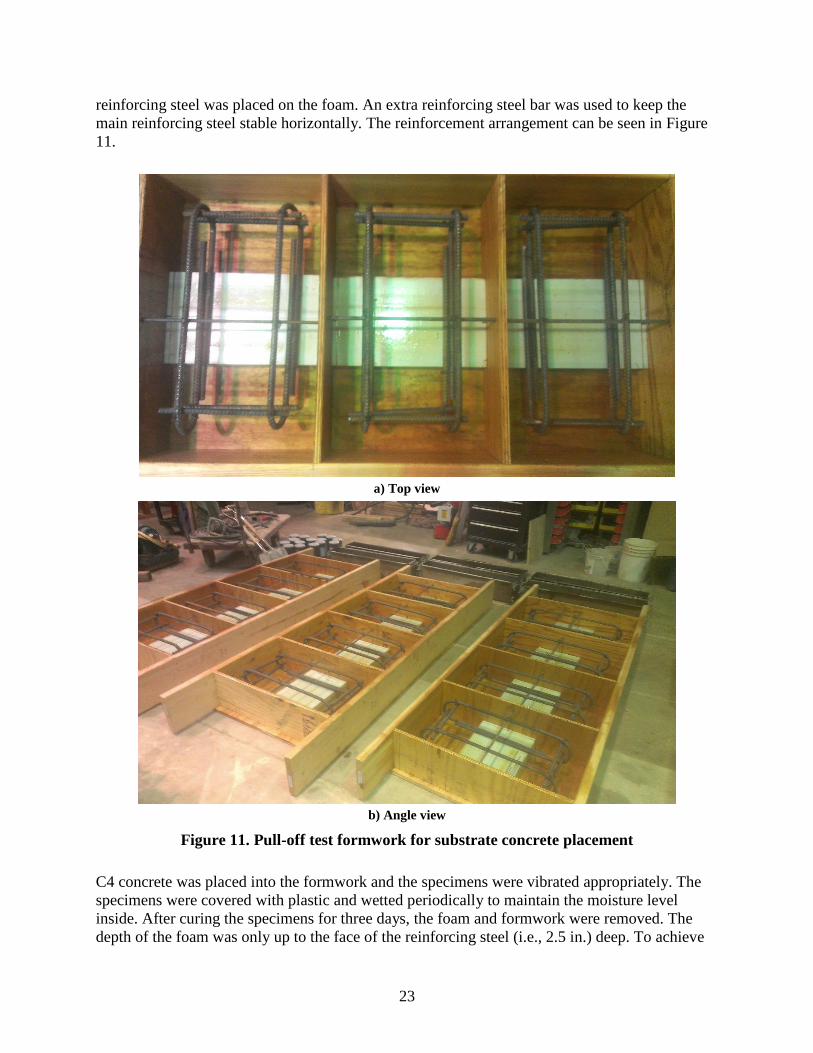
Wooden formwork (as shown in Figure 11) was fabricated for the construction of the pull-off
test specimens. The shaded part in Figure 10 was to be filled by the new overlay concrete after
the concrete being used for the substrate concrete had cured. To create the voids to be filled later,
foam was used to fill the shaded parts until the substrate concrete hardened and the overlay
concrete could be placed. To keep the foam stable, the formwork was built upside down and the
23
reinforcing steel was placed on the foam. An extra reinforcing steel bar was used to keep the
main reinforcing steel stable horizontally. The reinforcement arrangement can be seen in Figure
11.
a) Top view
b) Angle view
Figure 11. Pull-off test formwork for substrate concrete placement
C4 concrete was placed into the formwork and the specimens were vibrated appropriately. The
specimens were covered with plastic and wetted periodically to maintain the moisture level
inside. After curing the specimens for three days, the foam and formwork were removed. The
depth of the foam was only up to the face of the reinforcing steel (i.e., 2.5 in.) deep. To achieve
24
the different depth conditions, the portions where foam was used were chipped below the face of
the bar and the exposed C4 concrete was then roughened using a jackhammer (Case 1 specimens
only needed to have the C4 concrete roughened).
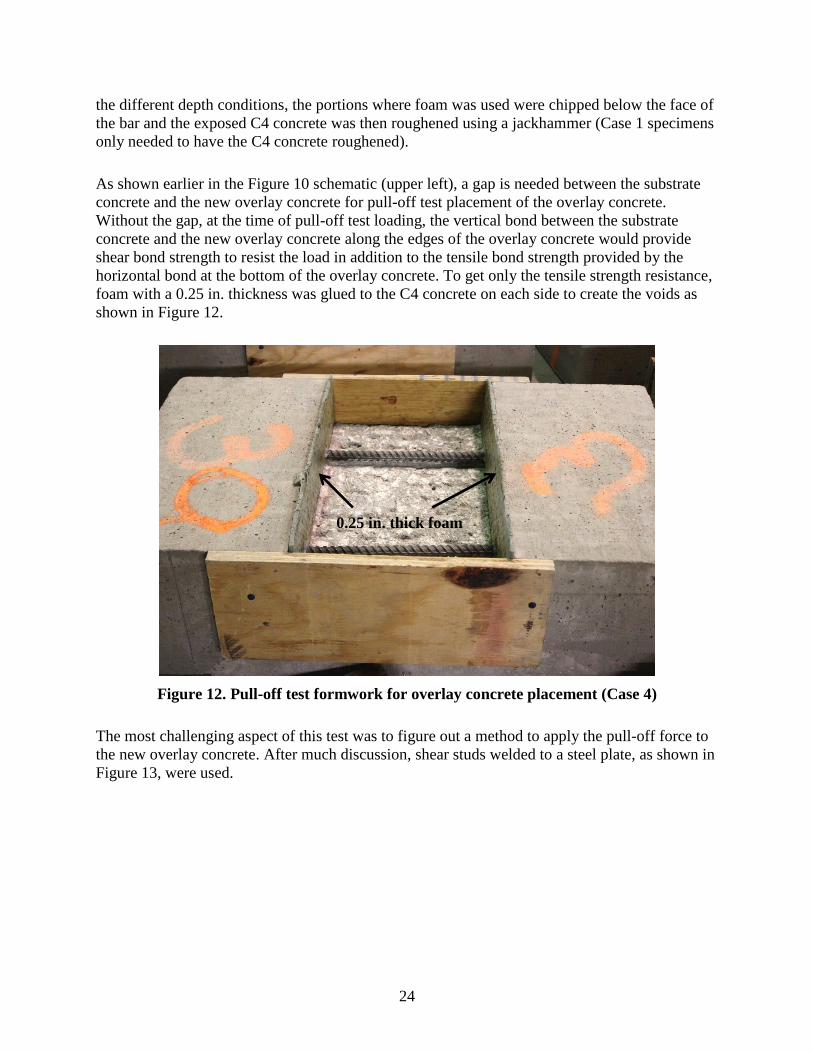
As shown earlier in the Figure 10 schematic (upper left), a gap is needed between the substrate
concrete and the new overlay concrete for pull-off test placement of the overlay concrete.
Without the gap, at the time of pull-off test loading, the vertical bond between the substrate
concrete and the new overlay concrete along the edges of the overlay concrete would provide
shear bond strength to resist the load in addition to the tensile bond strength provided by the
horizontal bond at the bottom of the overlay concrete. To get only the tensile strength resistance,
foam with a 0.25 in. thickness was glued to the C4 concrete on each side to create the voids as
shown in Figure 12.
Figure 12. Pull-off test formwork for overlay concrete placement (Case 4)
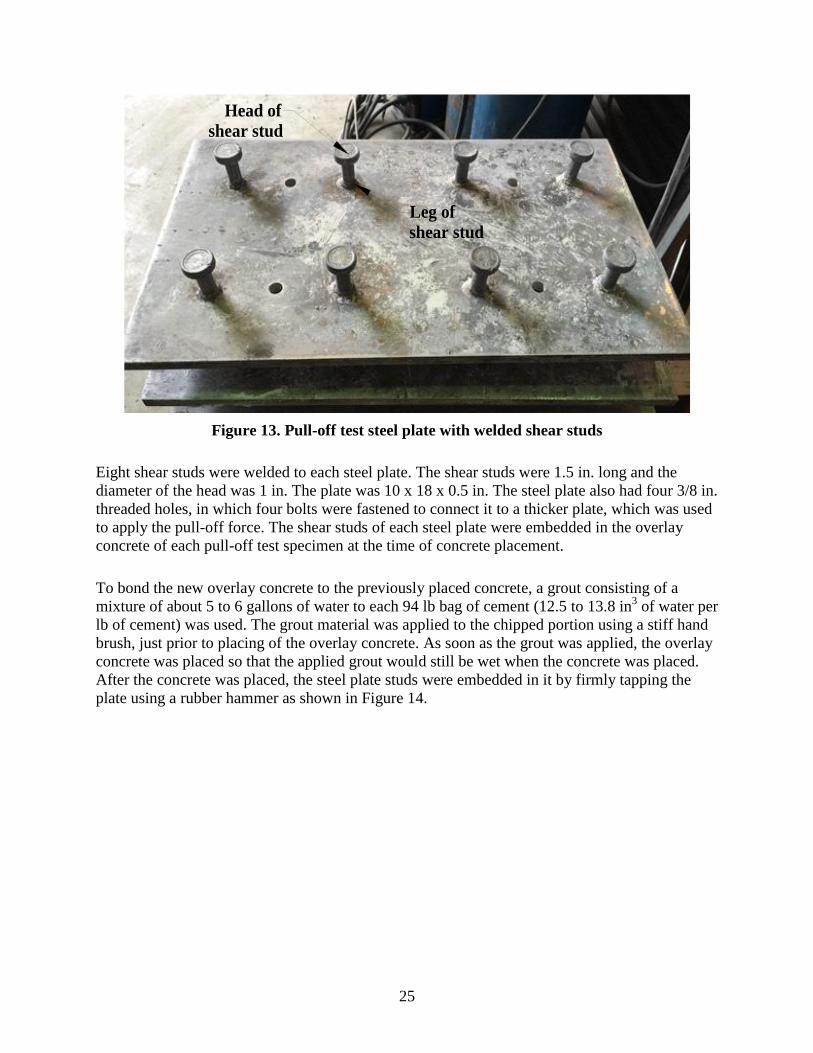
The most challenging aspect of this test was to figure out a method to apply the pull-off force to
the new overlay concrete. After much discussion, shear studs welded to a steel plate, as shown in
Figure 13, were used.
0.25 in. thick foam
25
Head of
shear stud
Leg of
shear stud
Figure 13. Pull-off test steel plate with welded shear studs
Eight shear studs were welded to each steel plate. The shear studs were 1.5 in. long and the
diameter of the head was 1 in. The plate was 10 x 18 x 0.5 in. The steel plate also had four 3/8 in.
threaded holes, in which four bolts were fastened to connect it to a thicker plate, which was used
to apply the pull-off force. The shear studs of each steel plate were embedded in the overlay
concrete of each pull-off test specimen at the time of concrete placement.
To bond the new overlay concrete to the previously placed concrete, a grout consisting of a
mixture of about 5 to 6 gallons of water to each 94 lb bag of cement (12.5 to 13.8 in3 of water per
lb of cement) was used. The grout material was applied to the chipped portion using a stiff hand
brush, just prior to placing of the overlay concrete. As soon as the grout was applied, the overlay
concrete was placed so that the applied grout would still be wet when the concrete was placed.
After the concrete was placed, the steel plate studs were embedded in it by firmly tapping the
plate using a rubber hammer as shown in Figure 14.
26
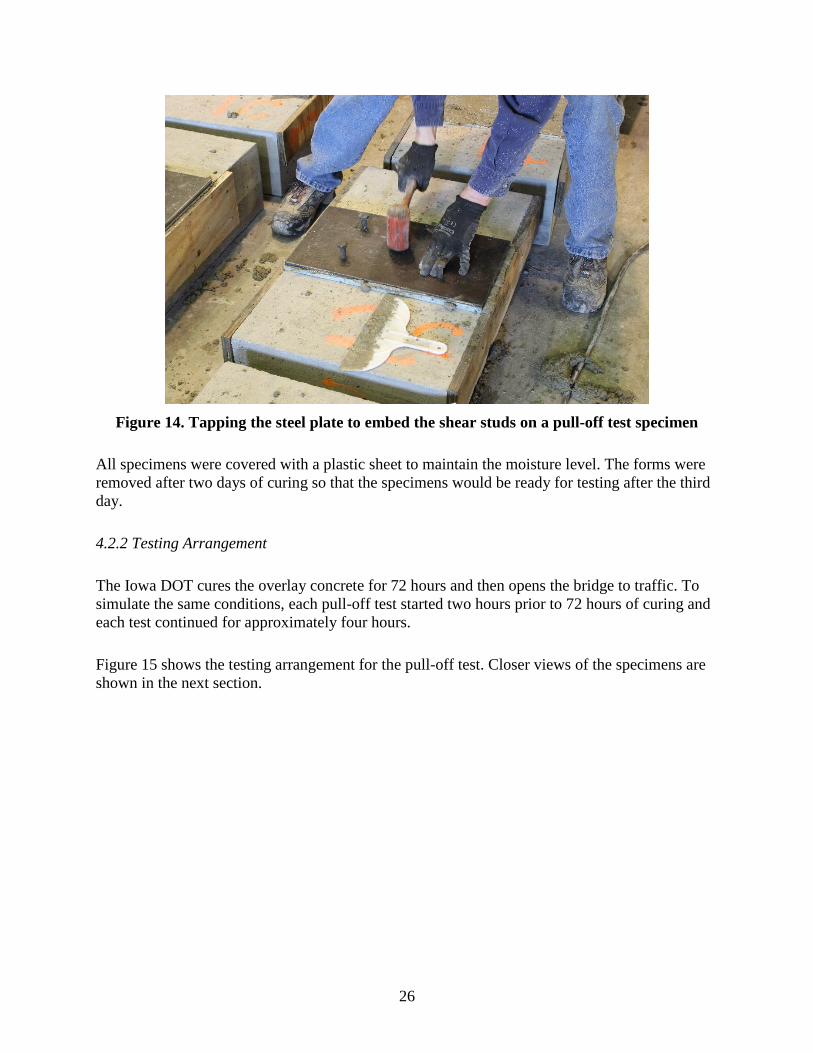
Figure 14. Tapping the steel plate to embed the shear studs on a pull-off test specimen
All specimens were covered with a plastic sheet to maintain the moisture level. The forms were
removed after two days of curing so that the specimens would be ready for testing after the third
day.
4.2.2 Testing Arrangement
The Iowa DOT cures the overlay concrete for 72 hours and then opens the bridge to traffic. To
simulate the same conditions, each pull-off test started two hours prior to 72 hours of curing and
each test continued for approximately four hours.
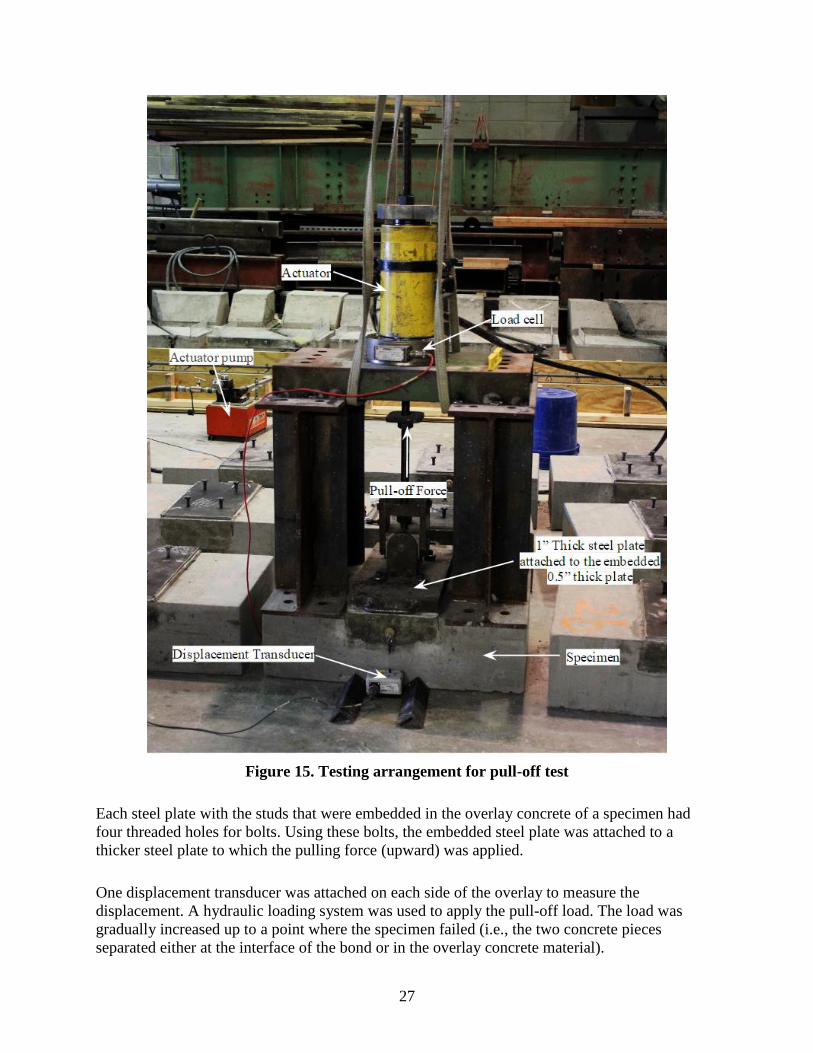
Figure 15 shows the testing arrangement for the pull-off test. Closer views of the specimens are
shown in the next section.
27
Figure 15. Testing arrangement for pull-off test
Each steel plate with the studs that were embedded in the overlay concrete of a specimen had
four threaded holes for bolts. Using these bolts, the embedded steel plate was attached to a
thicker steel plate to which the pulling force (upward) was applied.
One displacement transducer was attached on each side of the overlay to measure the
displacement. A hydraulic loading system was used to apply the pull-off load. The load was
gradually increased up to a point where the specimen failed (i.e., the two concrete pieces
separated either at the interface of the bond or in the overlay concrete material).

28
4.2.3 Results
The results from the pull-off tests and the comparisons between different parameters are
provided here. Observations of all tests made it clear that the shear studs created a potential
failure plane at the head of the shear studs. In fact, some specimens failed at the heads of the
shear studs in the overlay and some failed at the bond interface. In each case, a sudden failure
was observed. Following are the results for the different concrete removal depth levels studied
(Case 1 through 4).
29
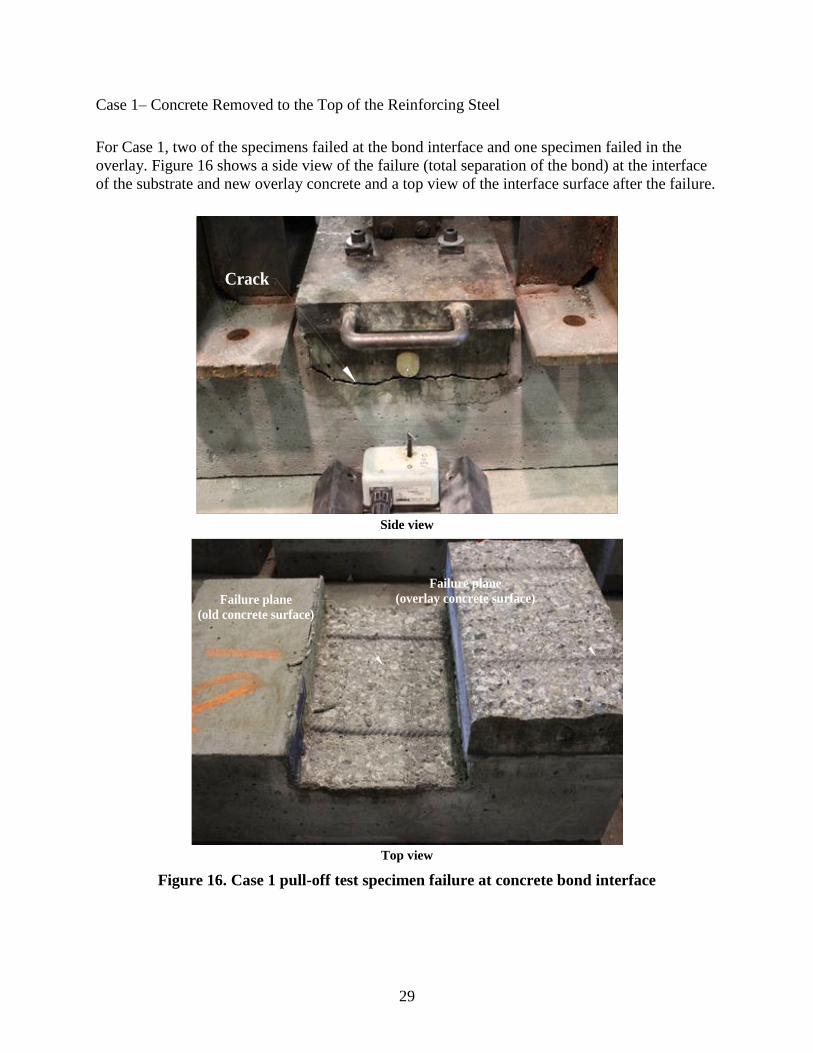
Case 1– Concrete Removed to the Top of the Reinforcing Steel
For Case 1, two of the specimens failed at the bond interface and one specimen failed in the
overlay. Figure 16 shows a side view of the failure (total separation of the bond) at the interface
of the substrate and new overlay concrete and a top view of the interface surface after the failure.
Crack
Side view
Failure plane
(old concrete surface)
Failure plane
(overlay concrete surface)
Top view
Figure 16. Case 1 pull-off test specimen failure at concrete bond interface
30
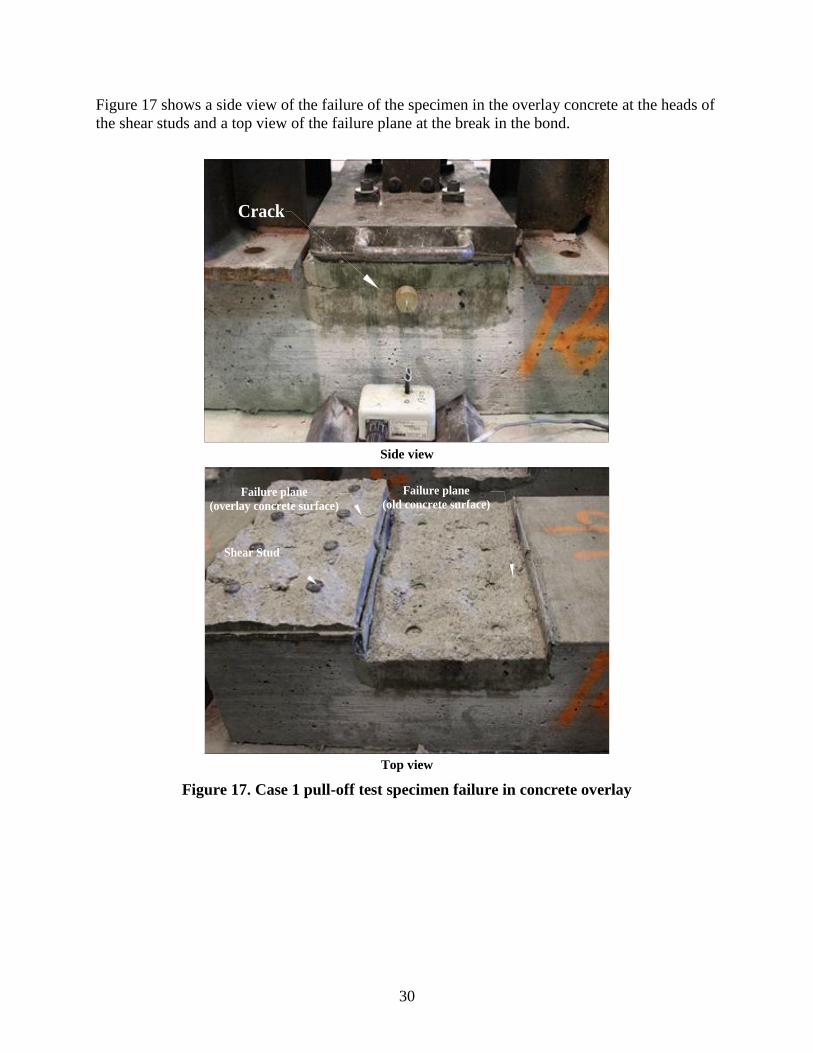
Figure 17 shows a side view of the failure of the specimen in the overlay concrete at the heads of
the shear studs and a top view of the failure plane at the break in the bond.
Crack
Side view
Failure plane
(overlay concrete surface)
Failure plane
(old concrete surface)
Shear Stud
Top view
Figure 17. Case 1 pull-off test specimen failure in concrete overlay
31
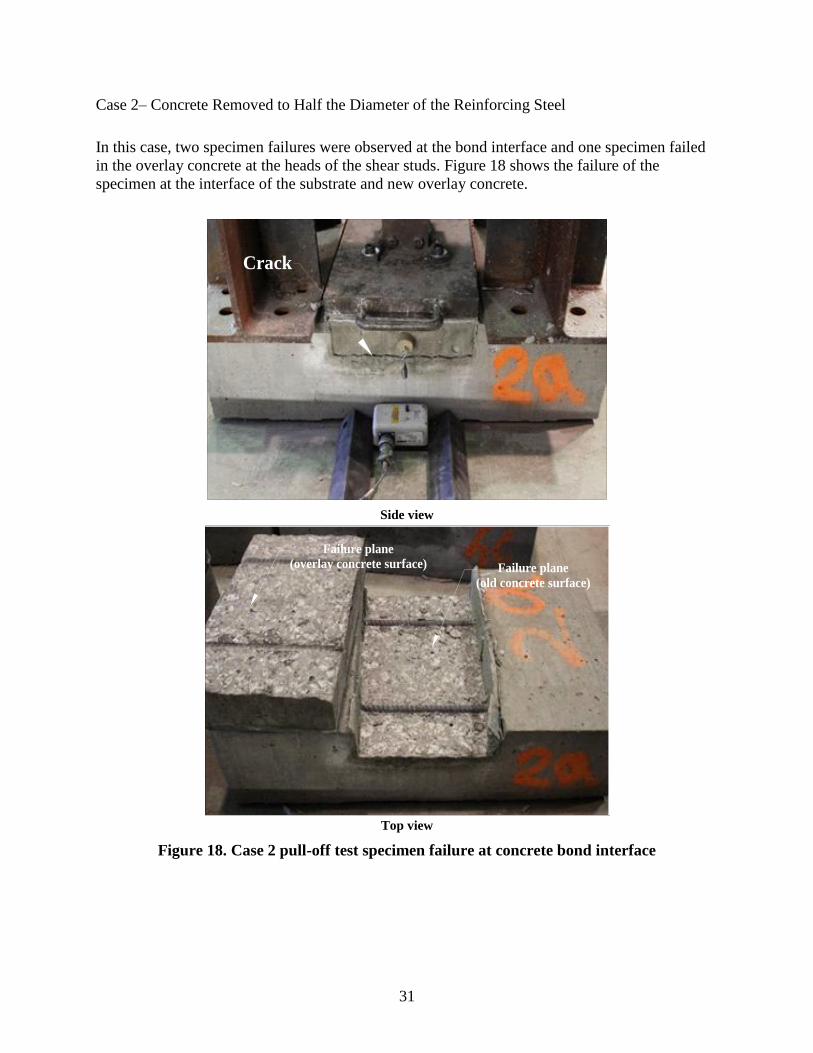
Case 2– Concrete Removed to Half the Diameter of the Reinforcing Steel
In this case, two specimen failures were observed at the bond interface and one specimen failed
in the overlay concrete at the heads of the shear studs. Figure 18 shows the failure of the
specimen at the interface of the substrate and new overlay concrete.
Crack
Side view
Failure plane
(overlay concrete surface) Failure plane
(old concrete surface)
Top view
Figure 18. Case 2 pull-off test specimen failure at concrete bond interface
32
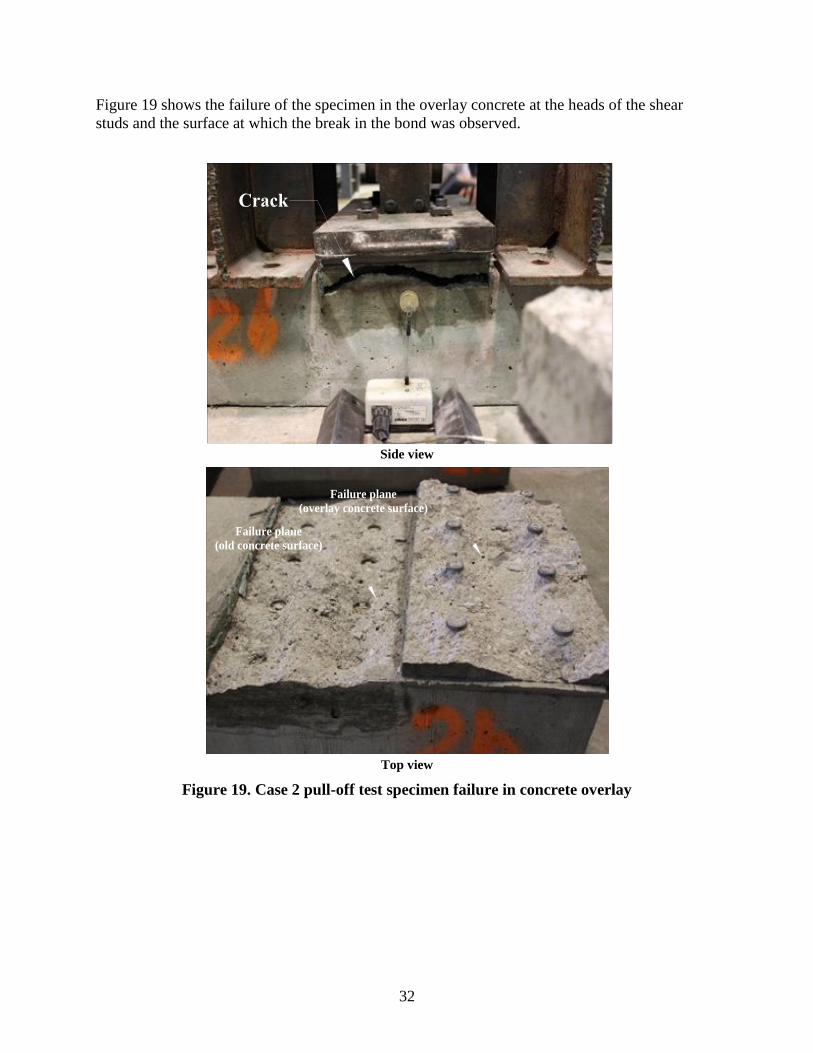
Figure 19 shows the failure of the specimen in the overlay concrete at the heads of the shear
studs and the surface at which the break in the bond was observed.
Side view
Failure plane
(old concrete surface)
Failure plane
(overlay concrete surface)
Top view
Figure 19. Case 2 pull-off test specimen failure in concrete overlay
33
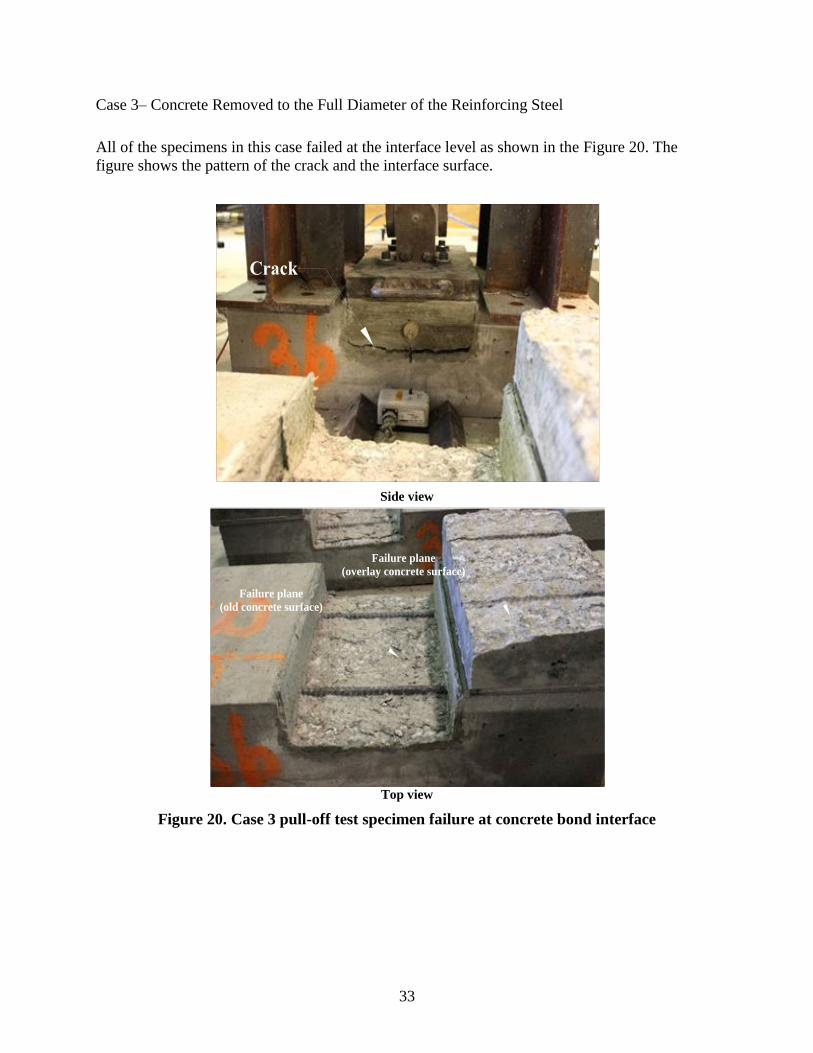
Case 3– Concrete Removed to the Full Diameter of the Reinforcing Steel
All of the specimens in this case failed at the interface level as shown in the Figure 20. The
figure shows the pattern of the crack and the interface surface.
Side view
Failure plane
(old concrete surface)
Failure plane
(overlay concrete surface)
Top view
Figure 20. Case 3 pull-off test specimen failure at concrete bond interface
34
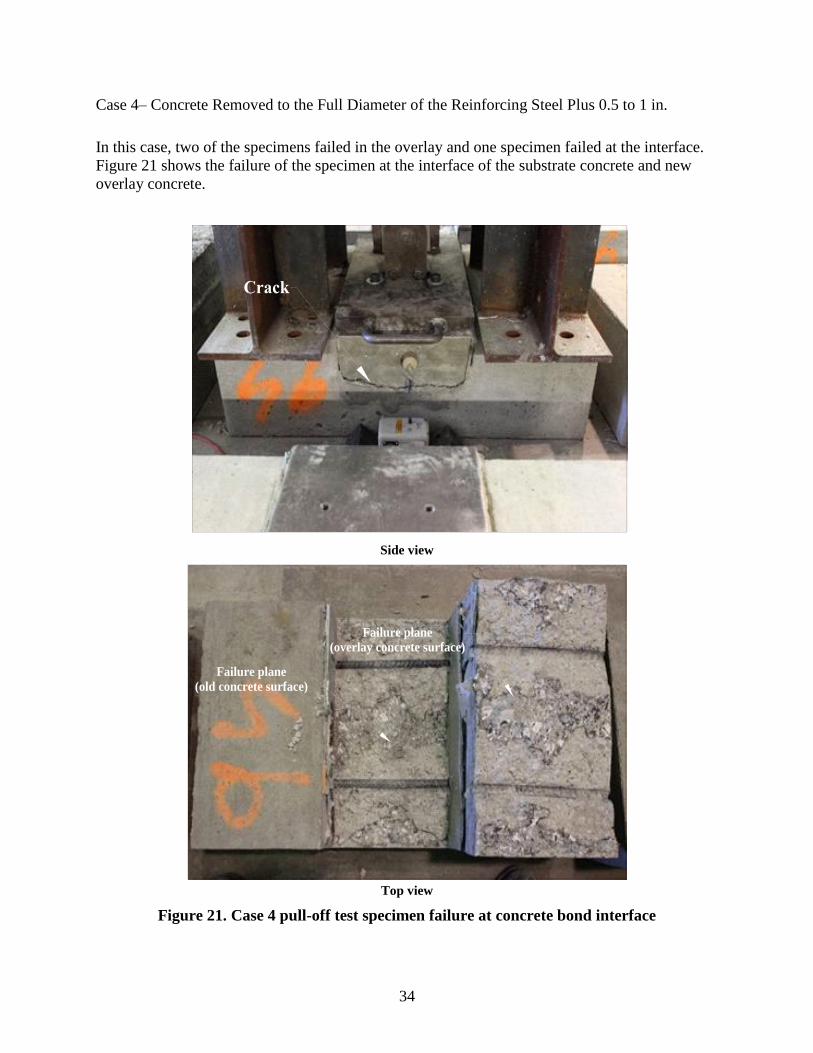
Case 4– Concrete Removed to the Full Diameter of the Reinforcing Steel Plus 0.5 to 1 in.
In this case, two of the specimens failed in the overlay and one specimen failed at the interface.
Figure 21 shows the failure of the specimen at the interface of the substrate concrete and new
overlay concrete.
Side view
Failure plane
(old concrete surface)
Failure plane
(overlay concrete surface)
Top view
Figure 21. Case 4 pull-off test specimen failure at concrete bond interface
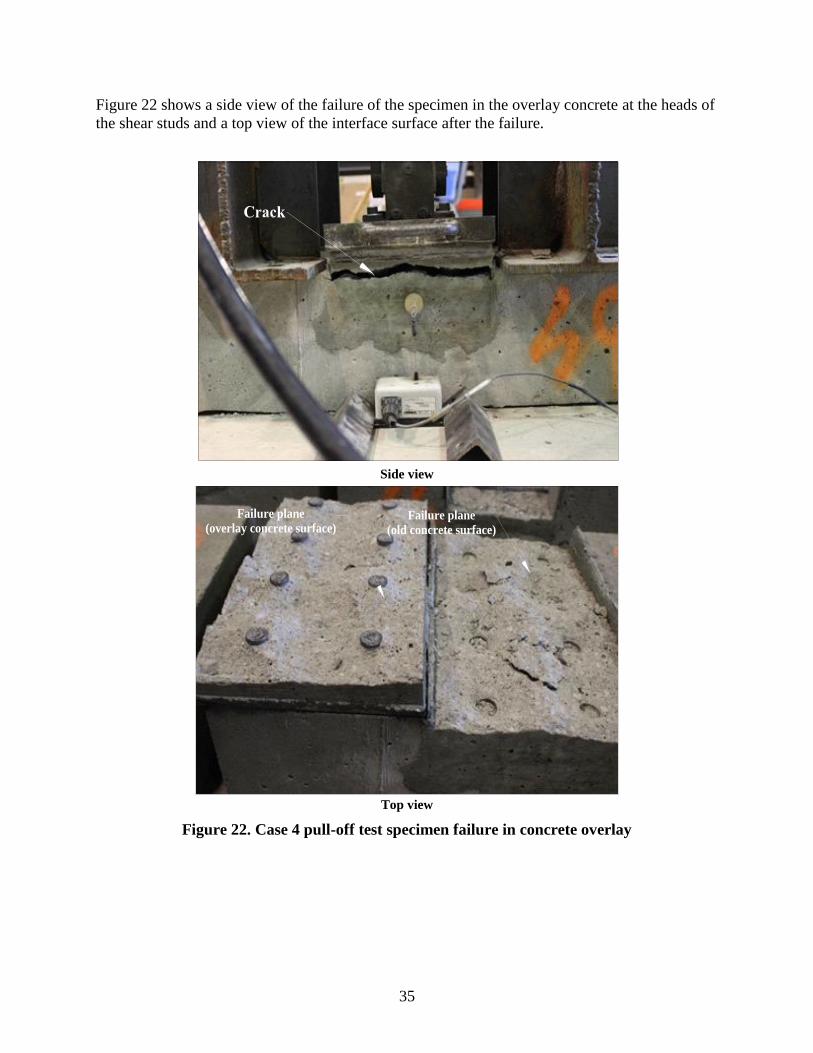
35
Figure 22 shows a side view of the failure of the specimen in the overlay concrete at the heads of
the shear studs and a top view of the interface surface after the failure.
Side view
Failure plane
(overlay concrete surface)Failure plane
(old concrete surface)
Top view
Figure 22. Case 4 pull-off test specimen failure in concrete overlay
36
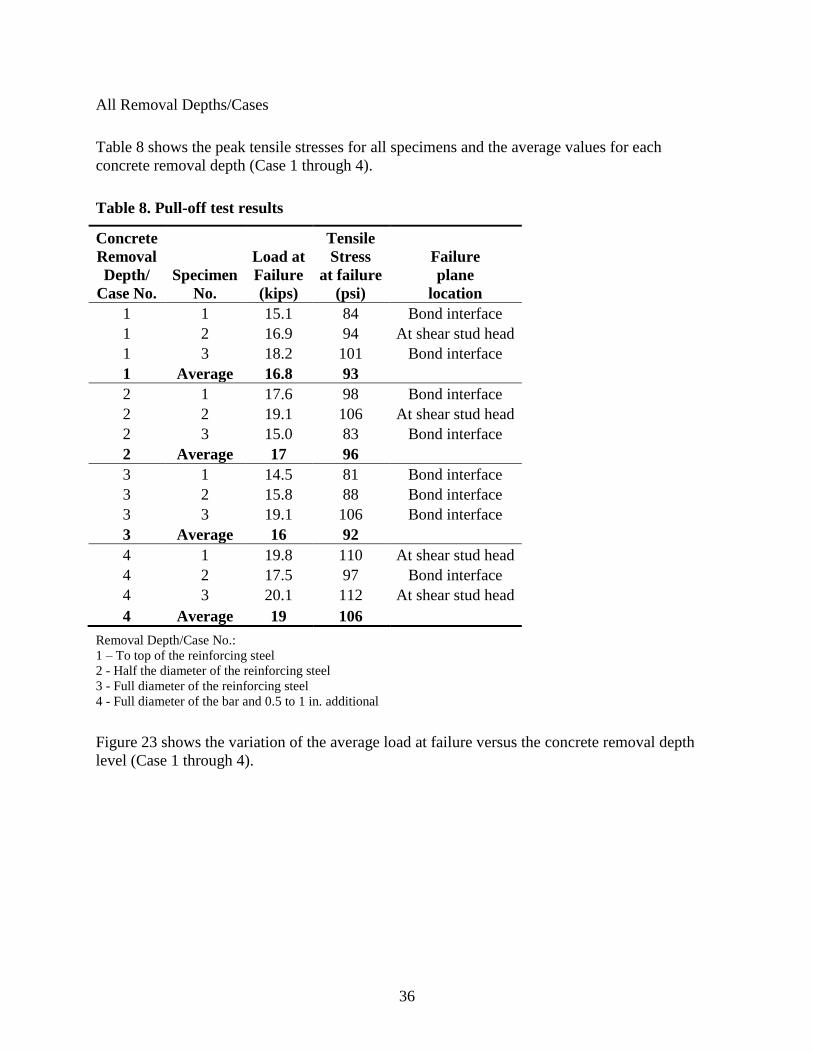
All Removal Depths/Cases
Table 8 shows the peak tensile stresses for all specimens and the average values for each
concrete removal depth (Case 1 through 4).
Table 8. Pull-off test results
Concrete
Removal
Depth/
Case No.
Specimen
No.
Load at
Failure
(kips)
Tensile
Stress
at failure
(psi)
Failure
plane
location
1 1 15.1 84 Bond interface
1 2 16.9 94 At shear stud head
1 3 18.2 101 Bond interface
1 Average 16.8 93
2 1 17.6 98 Bond interface
2 2 19.1 106 At shear stud head
2 3 15.0 83 Bond interface
2 Average 17 96
3 1 14.5 81 Bond interface
3 2 15.8 88 Bond interface
3 3 19.1 106 Bond interface
3 Average 16 92
4 1 19.8 110 At shear stud head
4 2 17.5 97 Bond interface
4 3 20.1 112 At shear stud head
4 Average 19 106
Removal Depth/Case No.:
1 – To top of the reinforcing steel
2 - Half the diameter of the reinforcing steel
3 - Full diameter of the reinforcing steel
4 - Full diameter of the bar and 0.5 to 1 in. additional
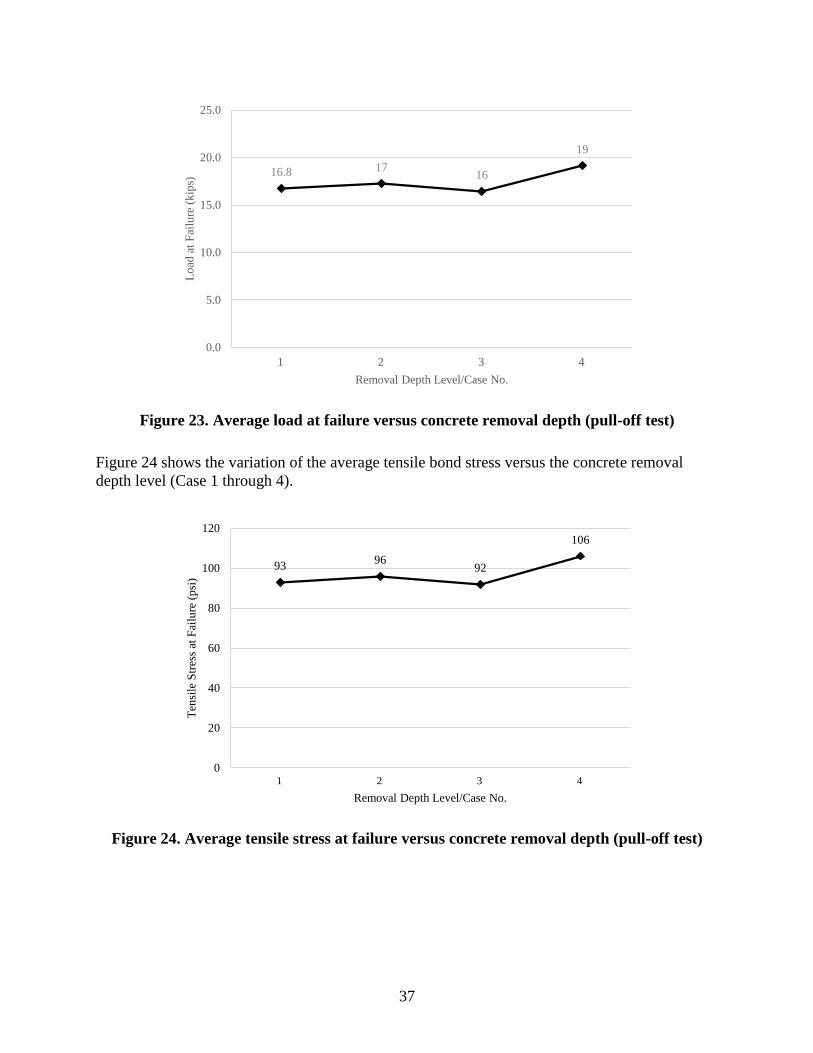
Figure 23 shows the variation of the average load at failure versus the concrete removal depth
level (Case 1 through 4).
37
Figure 23. Average load at failure versus concrete removal depth (pull-off test)
Figure 24 shows the variation of the average tensile bond stress versus the concrete removal
depth level (Case 1 through 4).
Figure 24. Average tensile stress at failure versus concrete removal depth (pull-off test)
16.8 17 16
19
0.0
5.0
10.0
15.0
20.0
25.0
1 2 3 4
Lo
ad a
t F
ailu
re (
kip
s)
Removal Depth Level/Case No.
93 96
92
106
0
20
40
60
80
100
120
1 2 3 4
Ten
sile
Str
ess
at F
ailu
re (
psi
)
Removal Depth Level/Case No.
38
4.2.4 Summary
Two failure plane locations were observed during pull-off testing. One failure plane was at the
bond interface between the substrate concrete and the new overlay concrete and the other failure
plane occurred at the shear studs in the overlay concrete. Even though a greater number of
specimens failed at the bond interface, no criteria could predict the location of failure. It is
possible that the load was not evenly distributed over the surface and perhaps the failure was
caused by peeling. As the depth of concrete removal increased, the reinforcing steel held down
more overlay concrete and retained that concrete upon the failure of the bond.
A very slight variation was seen in the peak load for the first three removal depth cases and the
fourth case had a slightly greater failure load compared to other three. The variation in the tensile
stress was similar to the variation of the peak load. Overall, the failure load and the stress at
failure had a 13% increase from Case 1 to Case 4, but Case 2 values were closer to Case 4
values.
4.3 Push-Out Test
The push-out test was used to determine the shear bond strength between the substrate concrete
and the overlay concrete for the four removal depths (Case 1 through 4). A shear load was
applied to the bond on each of the specimens and the shear stress at failure was calculated for
comparison between the four levels of concrete removal.
4.3.1 Specimen Details
The specimens for the push-out test were designed to determine shear strength. The bar spacing
used was similar to that for a typical deck slab. The shape and dimensions of the specimens are
shown in Figure 25 (Case 1) and Figure 26 (Case 4).
For each of the test specimens, two sub-specimens of substrate concrete (C4 mix) were prepared
and then bonded to each other with the overlay concrete between them. The two bonds between
the substrate concrete sub-specimens and the new overlay concrete (between them) were then
subjected to shear stresses to determine the shear strength.
The shaded portions in Figure 25 and Figure 26 represent the portion where the overlay concrete
was placed. Foam that was 2.5 in. thick, as shown in Figure 27, was used to create the voids in
the substrate concrete for placement of the overlay concrete later.
An additional steel bar was placed along the length on top of the reinforcement to prevent any
horizontal movement during the concrete placement.
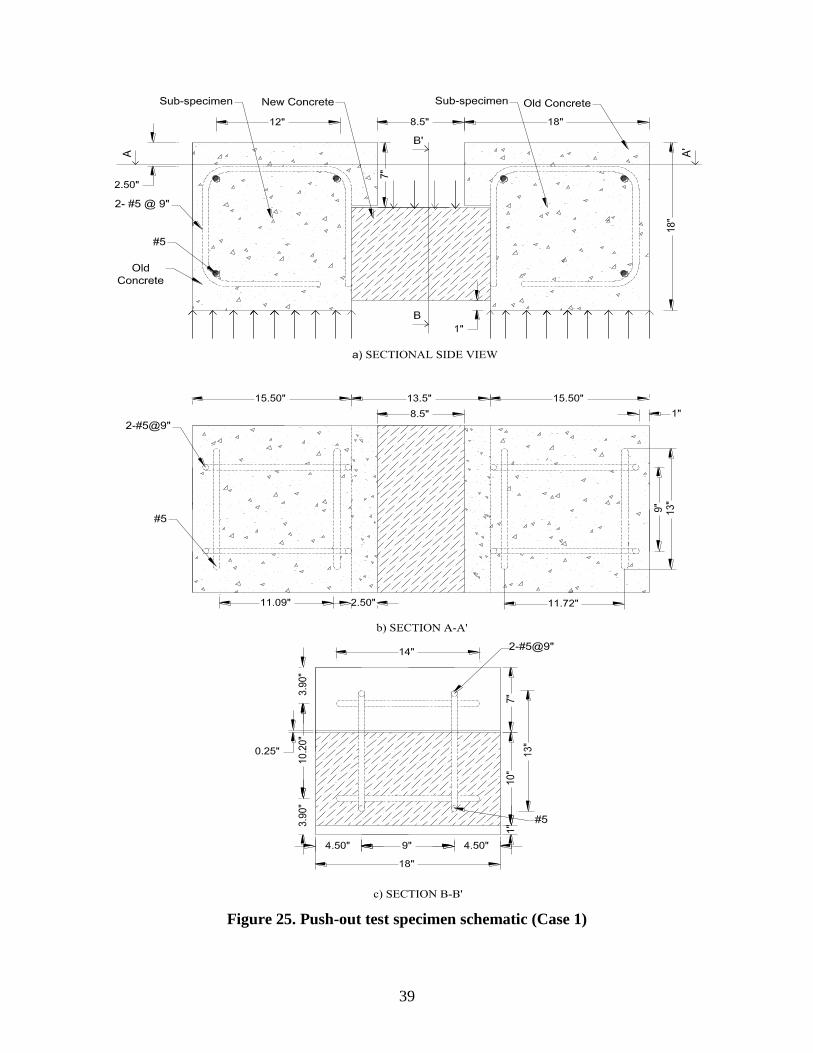
39
Figure 25. Push-out test specimen schematic (Case 1)
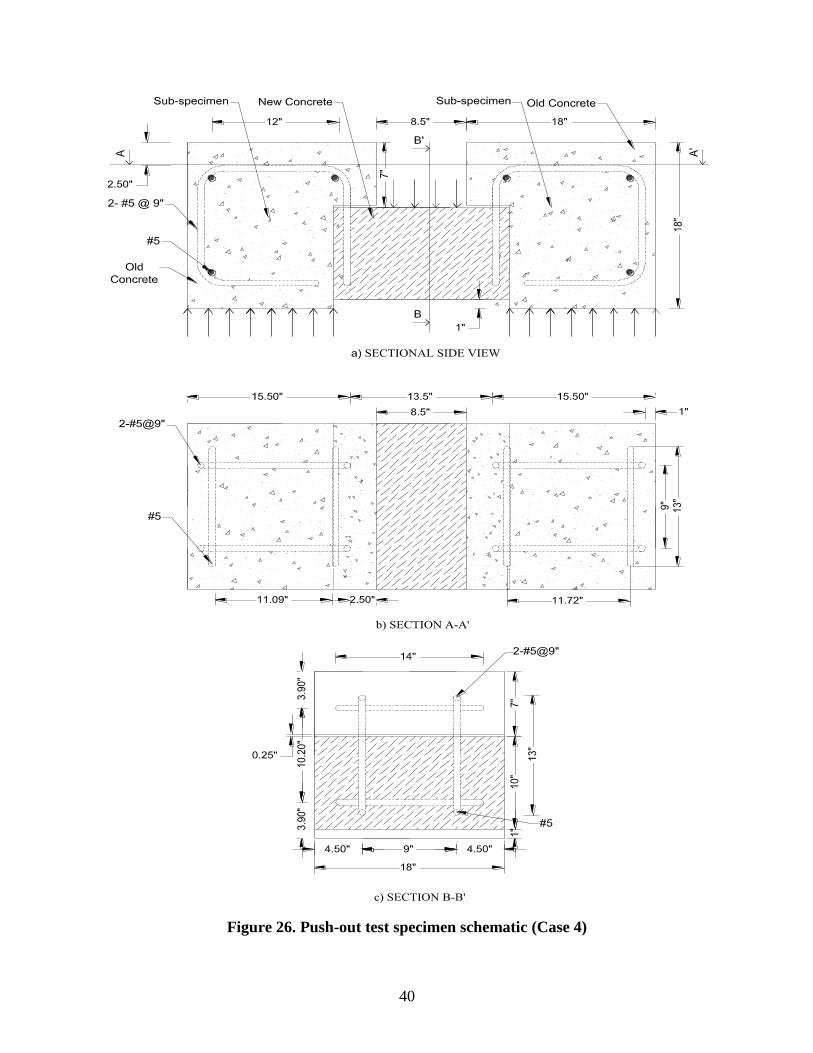
40
Figure 26. Push-out test specimen schematic (Case 4)
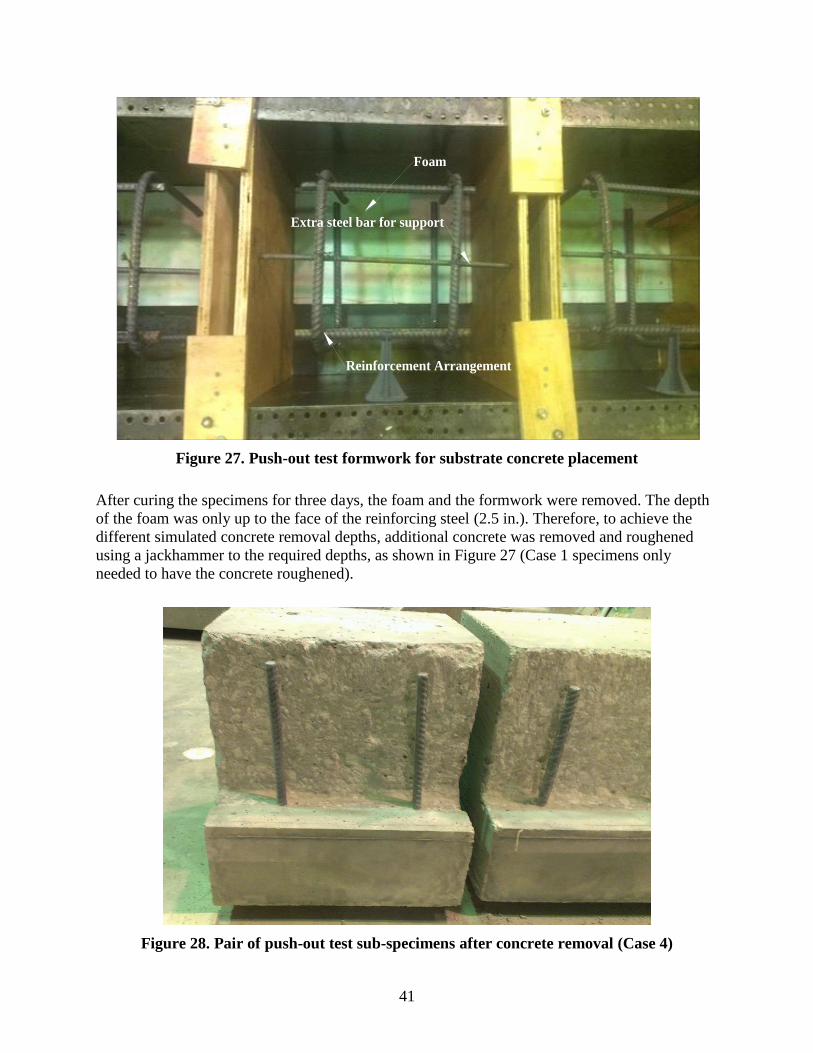
41
Extra steel bar for support
Foam
Reinforcement Arrangement
Figure 27. Push-out test formwork for substrate concrete placement
After curing the specimens for three days, the foam and the formwork were removed. The depth
of the foam was only up to the face of the reinforcing steel (2.5 in.). Therefore, to achieve the
different simulated concrete removal depths, additional concrete was removed and roughened
using a jackhammer to the required depths, as shown in Figure 27 (Case 1 specimens only
needed to have the concrete roughened).
Figure 28. Pair of push-out test sub-specimens after concrete removal (Case 4)
42
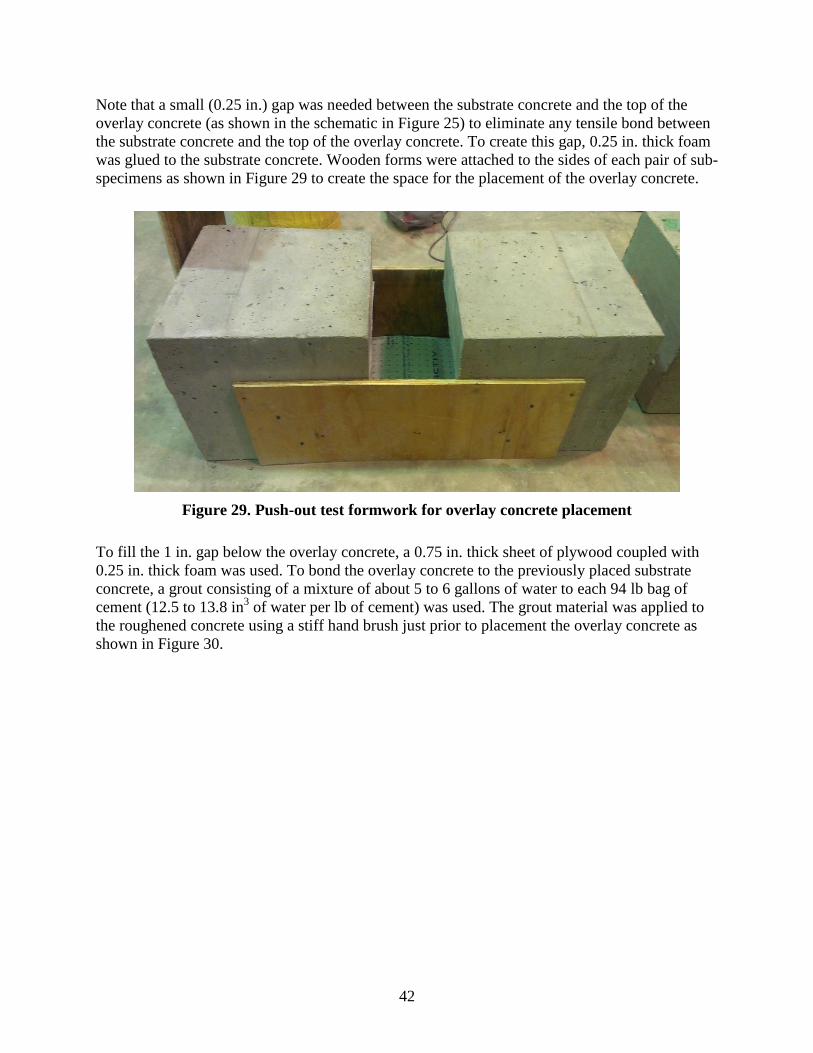
Note that a small (0.25 in.) gap was needed between the substrate concrete and the top of the
overlay concrete (as shown in the schematic in Figure 25) to eliminate any tensile bond between
the substrate concrete and the top of the overlay concrete. To create this gap, 0.25 in. thick foam
was glued to the substrate concrete. Wooden forms were attached to the sides of each pair of sub-
specimens as shown in Figure 29 to create the space for the placement of the overlay concrete.
Figure 29. Push-out test formwork for overlay concrete placement
To fill the 1 in. gap below the overlay concrete, a 0.75 in. thick sheet of plywood coupled with
0.25 in. thick foam was used. To bond the overlay concrete to the previously placed substrate
concrete, a grout consisting of a mixture of about 5 to 6 gallons of water to each 94 lb bag of
cement (12.5 to 13.8 in3 of water per lb of cement) was used. The grout material was applied to
the roughened concrete using a stiff hand brush just prior to placement the overlay concrete as
shown in Figure 30.
43
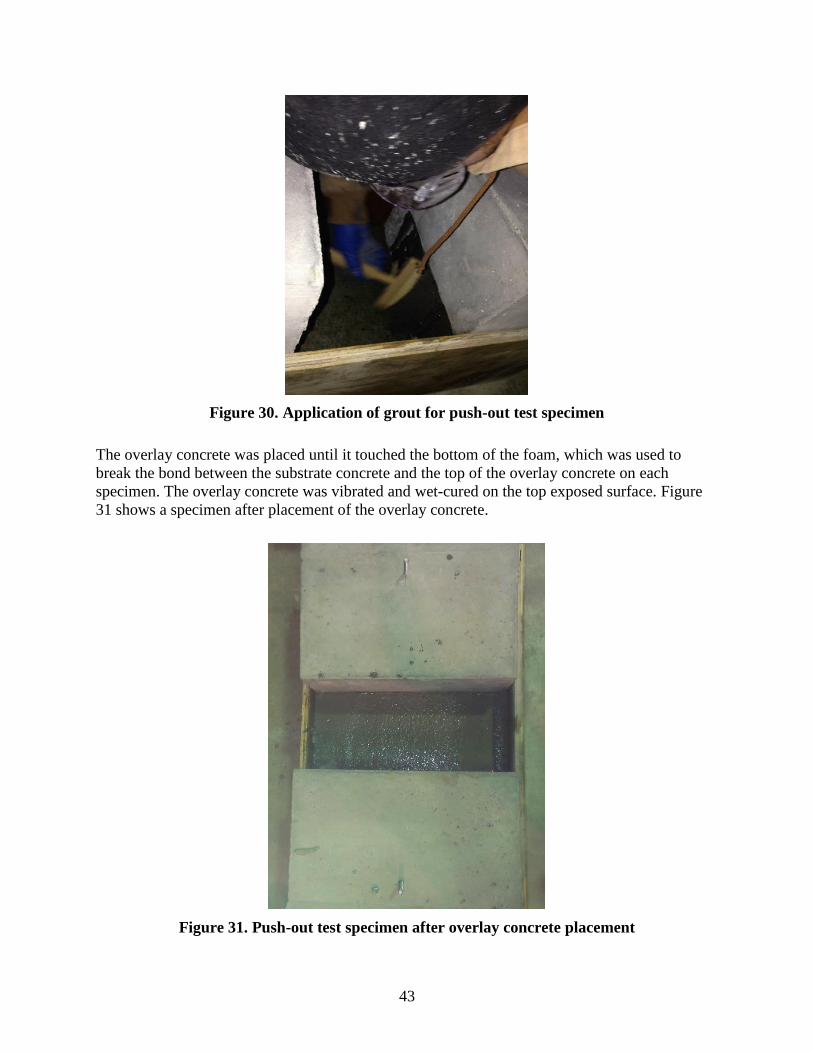
Figure 30. Application of grout for push-out test specimen
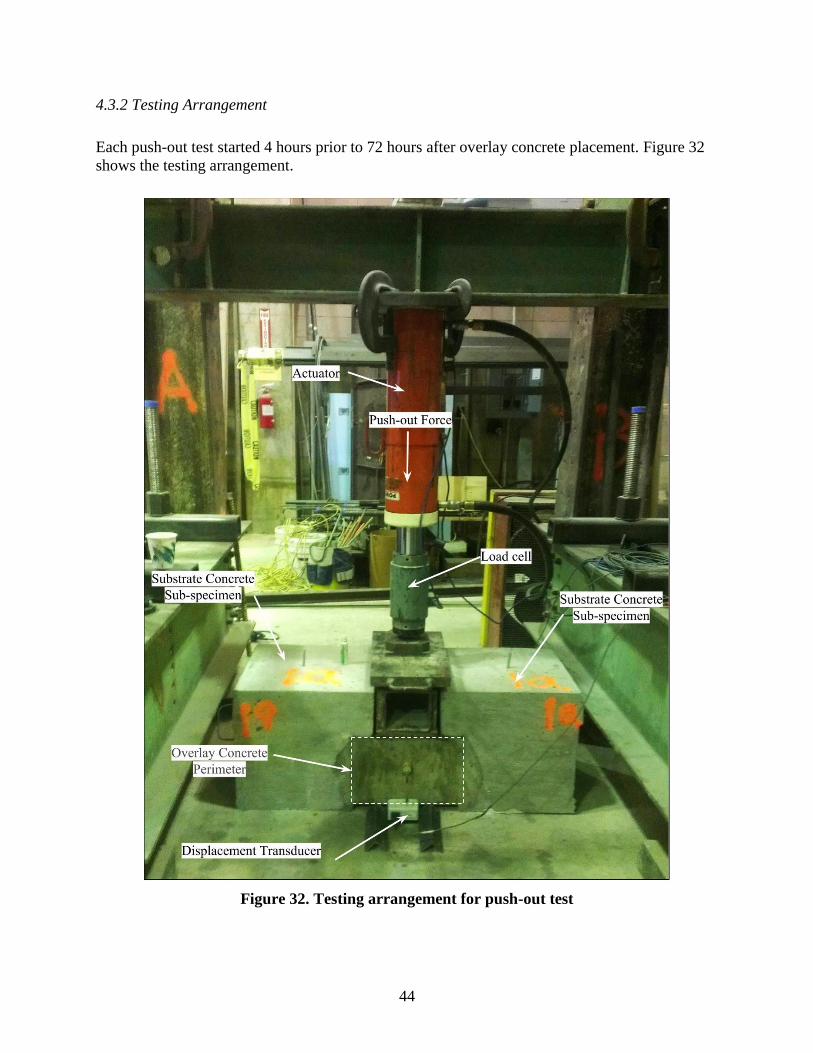
The overlay concrete was placed until it touched the bottom of the foam, which was used to
break the bond between the substrate concrete and the top of the overlay concrete on each
specimen. The overlay concrete was vibrated and wet-cured on the top exposed surface. Figure
31 shows a specimen after placement of the overlay concrete.
Figure 31. Push-out test specimen after overlay concrete placement
44
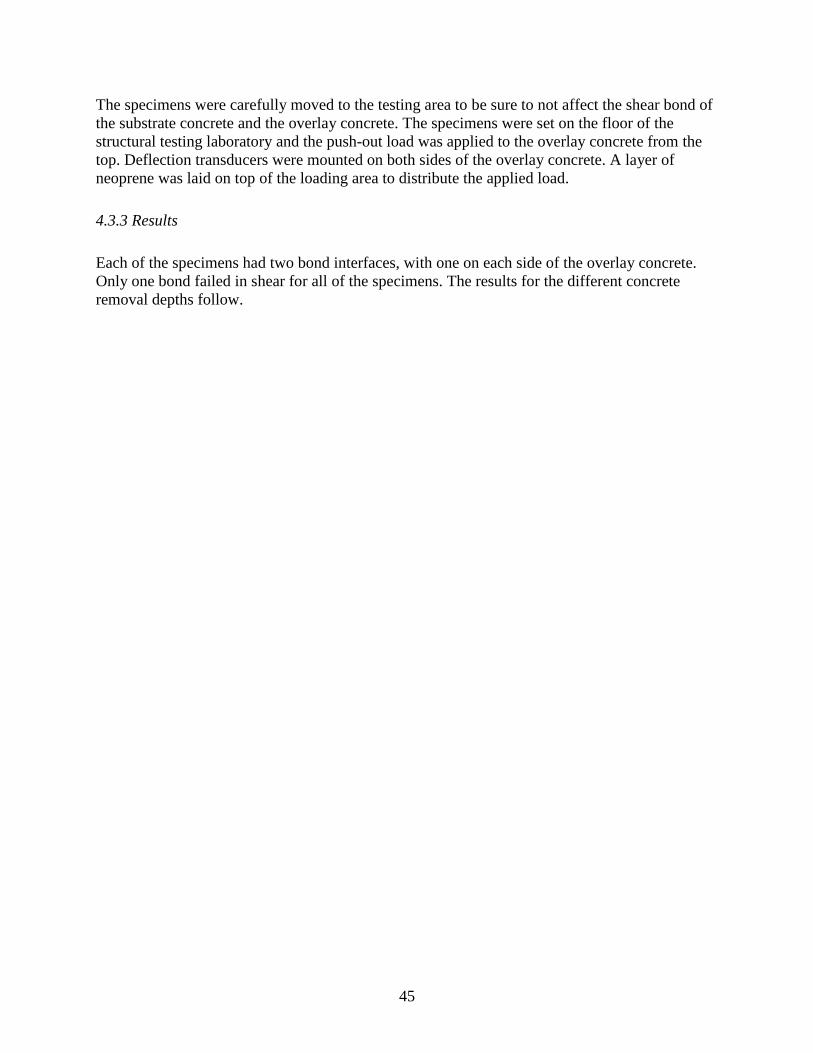
4.3.2 Testing Arrangement
Each push-out test started 4 hours prior to 72 hours after overlay concrete placement. Figure 32
shows the testing arrangement.
Figure 32. Testing arrangement for push-out test
45
The specimens were carefully moved to the testing area to be sure to not affect the shear bond of
the substrate concrete and the overlay concrete. The specimens were set on the floor of the
structural testing laboratory and the push-out load was applied to the overlay concrete from the
top. Deflection transducers were mounted on both sides of the overlay concrete. A layer of
neoprene was laid on top of the loading area to distribute the applied load.
4.3.3 Results
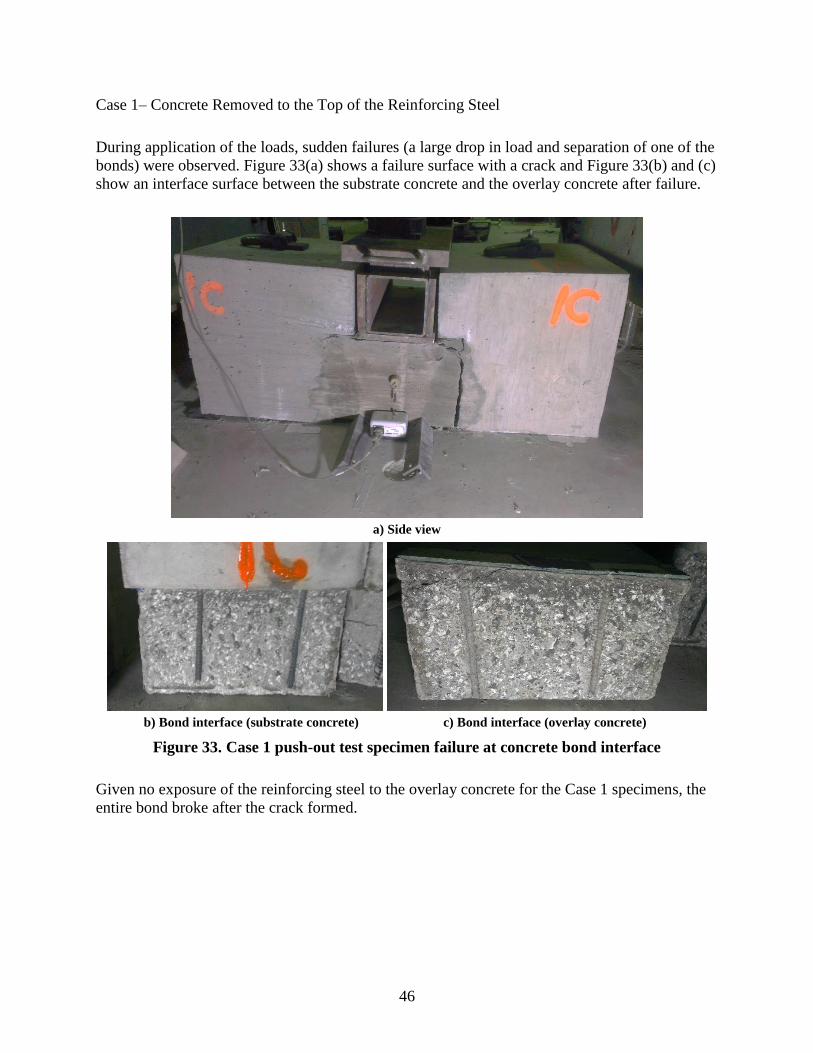
Each of the specimens had two bond interfaces, with one on each side of the overlay concrete.
Only one bond failed in shear for all of the specimens. The results for the different concrete
removal depths follow.
46
Case 1– Concrete Removed to the Top of the Reinforcing Steel
During application of the loads, sudden failures (a large drop in load and separation of one of the
bonds) were observed. Figure 33(a) shows a failure surface with a crack and Figure 33(b) and (c)
show an interface surface between the substrate concrete and the overlay concrete after failure.
a) Side view
b) Bond interface (substrate concrete) c) Bond interface (overlay concrete)
Figure 33. Case 1 push-out test specimen failure at concrete bond interface
Given no exposure of the reinforcing steel to the overlay concrete for the Case 1 specimens, the
entire bond broke after the crack formed.
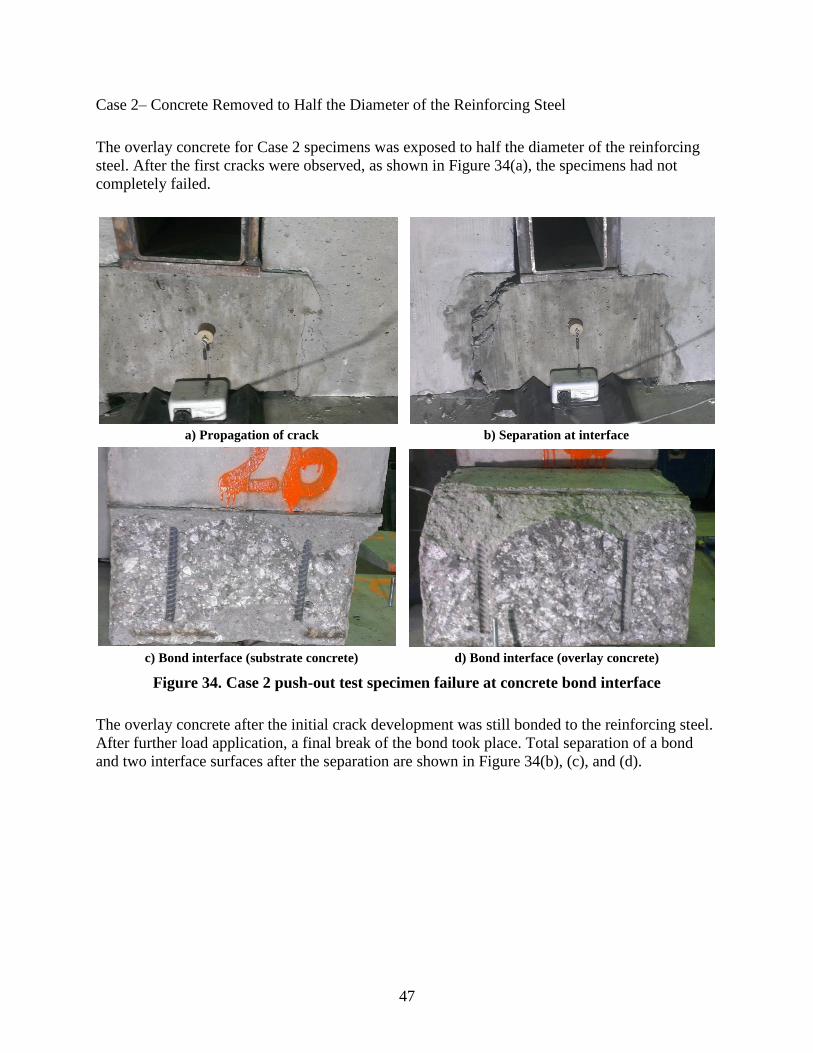
47
Case 2– Concrete Removed to Half the Diameter of the Reinforcing Steel
The overlay concrete for Case 2 specimens was exposed to half the diameter of the reinforcing
steel. After the first cracks were observed, as shown in Figure 34(a), the specimens had not
completely failed.
a) Propagation of crack b) Separation at interface
c) Bond interface (substrate concrete) d) Bond interface (overlay concrete)
Figure 34. Case 2 push-out test specimen failure at concrete bond interface
The overlay concrete after the initial crack development was still bonded to the reinforcing steel.
After further load application, a final break of the bond took place. Total separation of a bond
and two interface surfaces after the separation are shown in Figure 34(b), (c), and (d).
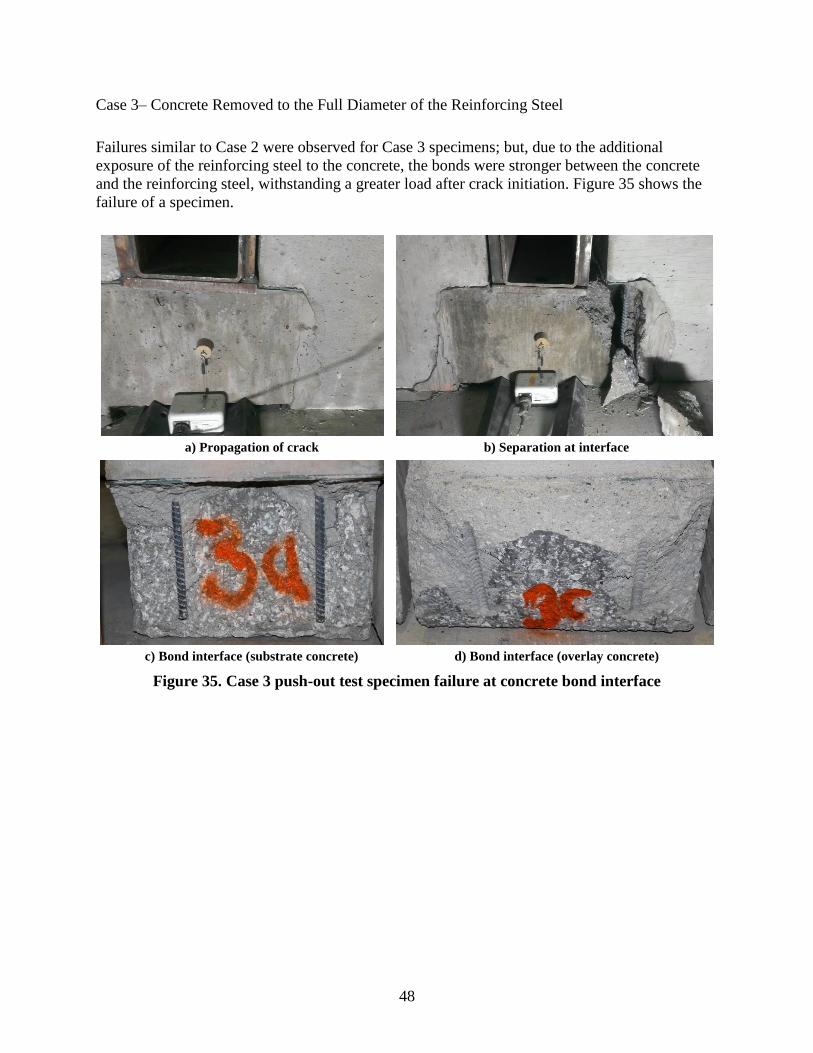
48
Case 3– Concrete Removed to the Full Diameter of the Reinforcing Steel
Failures similar to Case 2 were observed for Case 3 specimens; but, due to the additional
exposure of the reinforcing steel to the concrete, the bonds were stronger between the concrete
and the reinforcing steel, withstanding a greater load after crack initiation. Figure 35 shows the
failure of a specimen.
a) Propagation of crack b) Separation at interface
c) Bond interface (substrate concrete) d) Bond interface (overlay concrete)
Figure 35. Case 3 push-out test specimen failure at concrete bond interface
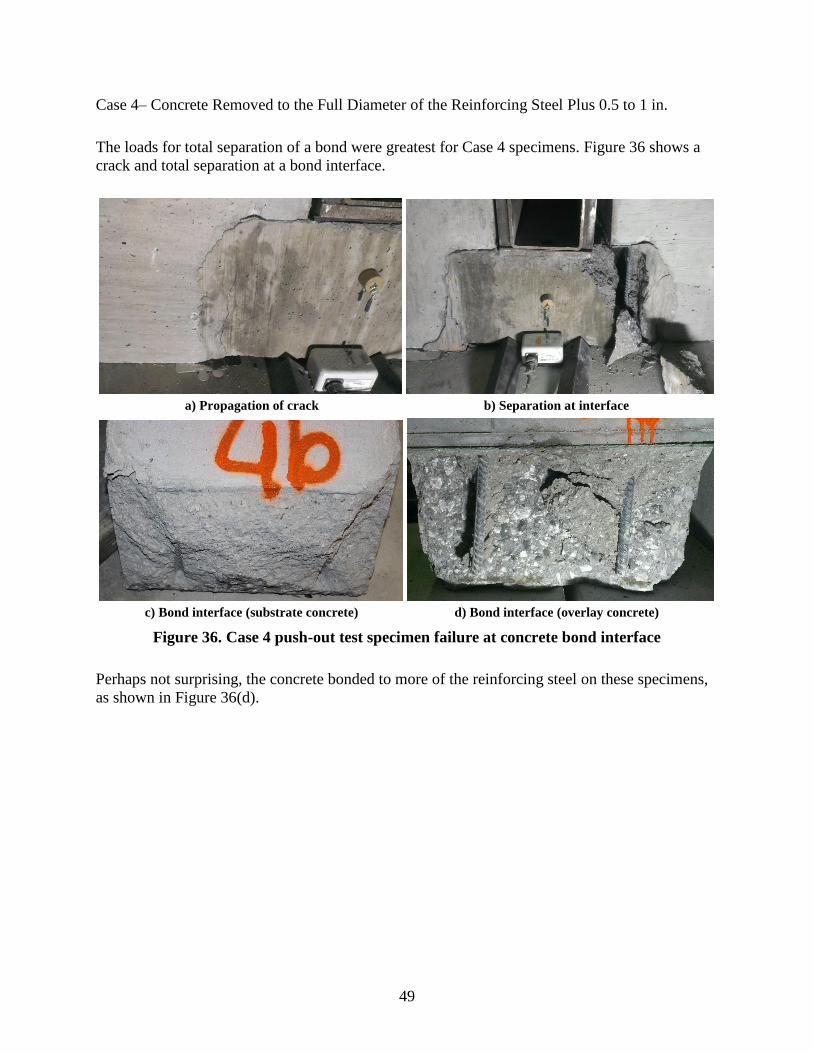
49
Case 4– Concrete Removed to the Full Diameter of the Reinforcing Steel Plus 0.5 to 1 in.
The loads for total separation of a bond were greatest for Case 4 specimens. Figure 36 shows a
crack and total separation at a bond interface.
a) Propagation of crack b) Separation at interface
c) Bond interface (substrate concrete) d) Bond interface (overlay concrete)
Figure 36. Case 4 push-out test specimen failure at concrete bond interface
Perhaps not surprising, the concrete bonded to more of the reinforcing steel on these specimens,
as shown in Figure 36(d).
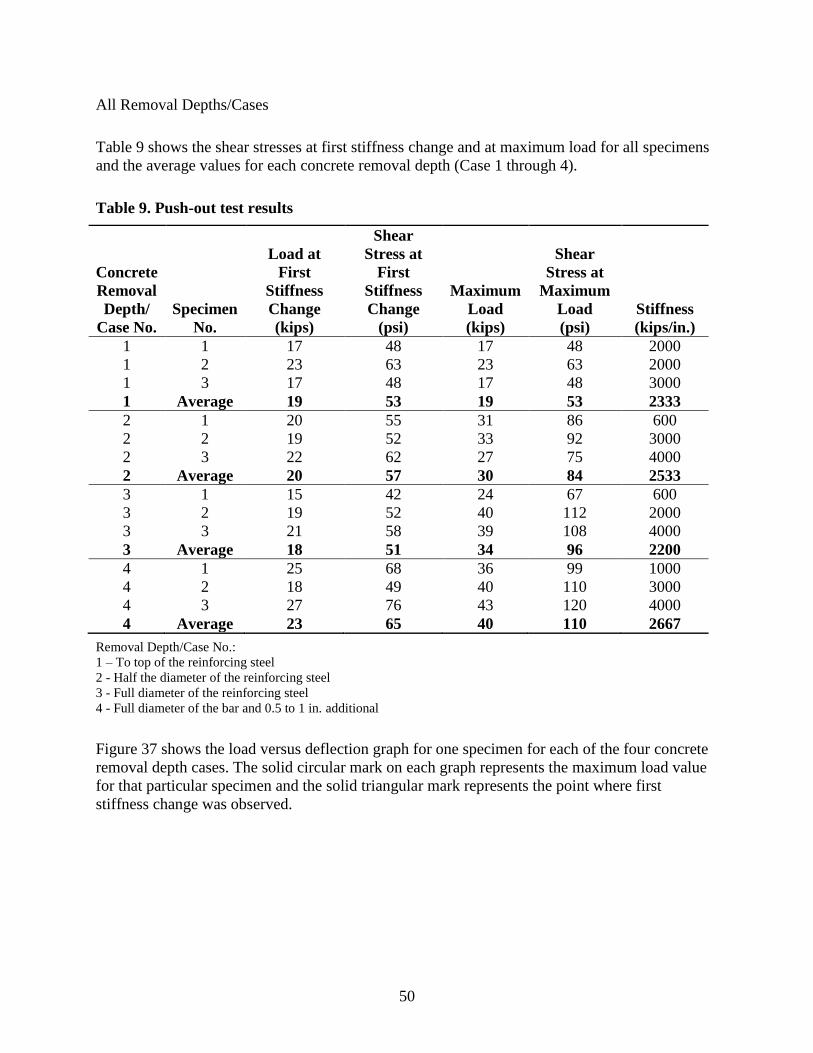
50
All Removal Depths/Cases
Table 9 shows the shear stresses at first stiffness change and at maximum load for all specimens
and the average values for each concrete removal depth (Case 1 through 4).
Table 9. Push-out test results
Concrete
Removal
Depth/
Case No.
Specimen
No.
Load at
First
Stiffness
Change
(kips)
Shear
Stress at
First
Stiffness
Change
(psi)
Maximum
Load
(kips)
Shear
Stress at
Maximum
Load
(psi)
Stiffness
(kips/in.)
1 1 17 48 17 48 2000
1 2 23 63 23 63 2000
1 3 17 48 17 48 3000
1 Average 19 53 19 53 2333
2 1 20 55 31 86 600
2 2 19 52 33 92 3000
2 3 22 62 27 75 4000
2 Average 20 57 30 84 2533
3 1 15 42 24 67 600
3 2 19 52 40 112 2000
3 3 21 58 39 108 4000
3 Average 18 51 34 96 2200
4 1 25 68 36 99 1000
4 2 18 49 40 110 3000
4 3 27 76 43 120 4000
4 Average 23 65 40 110 2667
Removal Depth/Case No.:
1 – To top of the reinforcing steel
2 - Half the diameter of the reinforcing steel
3 - Full diameter of the reinforcing steel
4 - Full diameter of the bar and 0.5 to 1 in. additional
Figure 37 shows the load versus deflection graph for one specimen for each of the four concrete
removal depth cases. The solid circular mark on each graph represents the maximum load value
for that particular specimen and the solid triangular mark represents the point where first
stiffness change was observed.
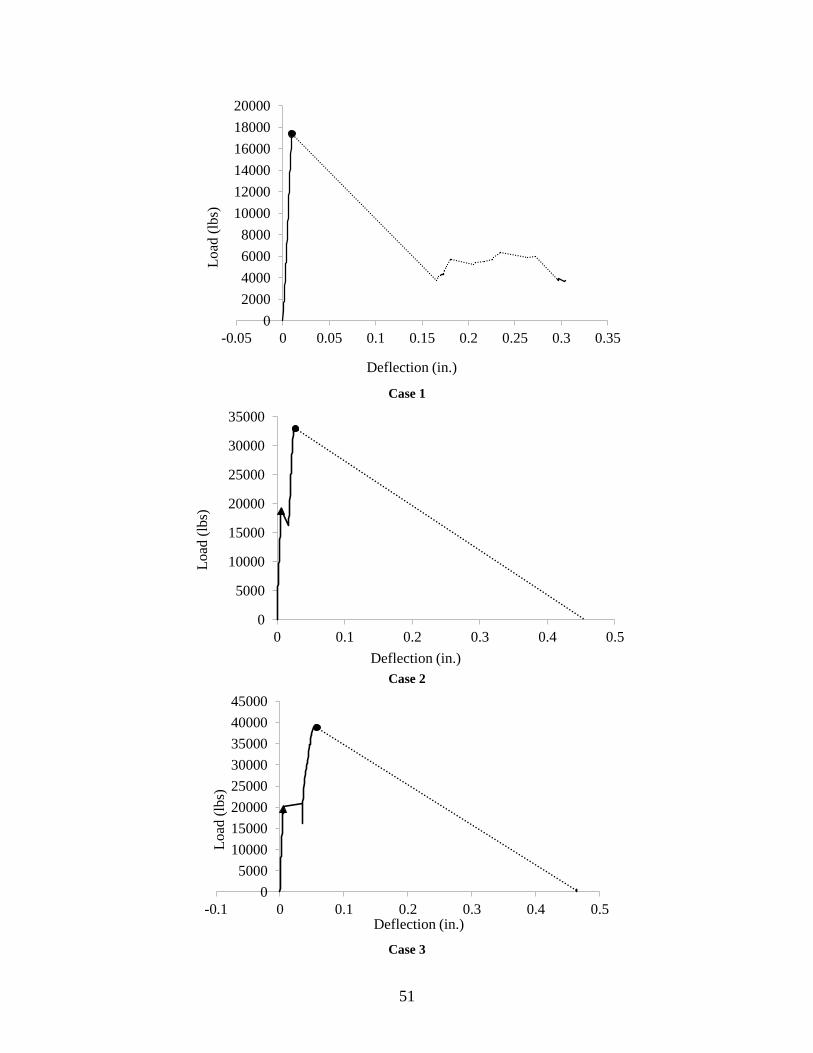
51
Case 1
Case 2
Case 3
0
2000
4000
6000
8000
10000
12000
14000
16000
18000
20000
-0.05 0 0.05 0.1 0.15 0.2 0.25 0.3 0.35
Lo
ad (
lbs)
Deflection (in.)
0
5000
10000
15000
20000
25000
30000
35000
0 0.1 0.2 0.3 0.4 0.5
Load
(lb
s)
Deflection (in.)
0
5000
10000
15000
20000
25000
30000
35000
40000
45000
-0.1 0 0.1 0.2 0.3 0.4 0.5
Lo
ad (
lbs)
Deflection (in.)
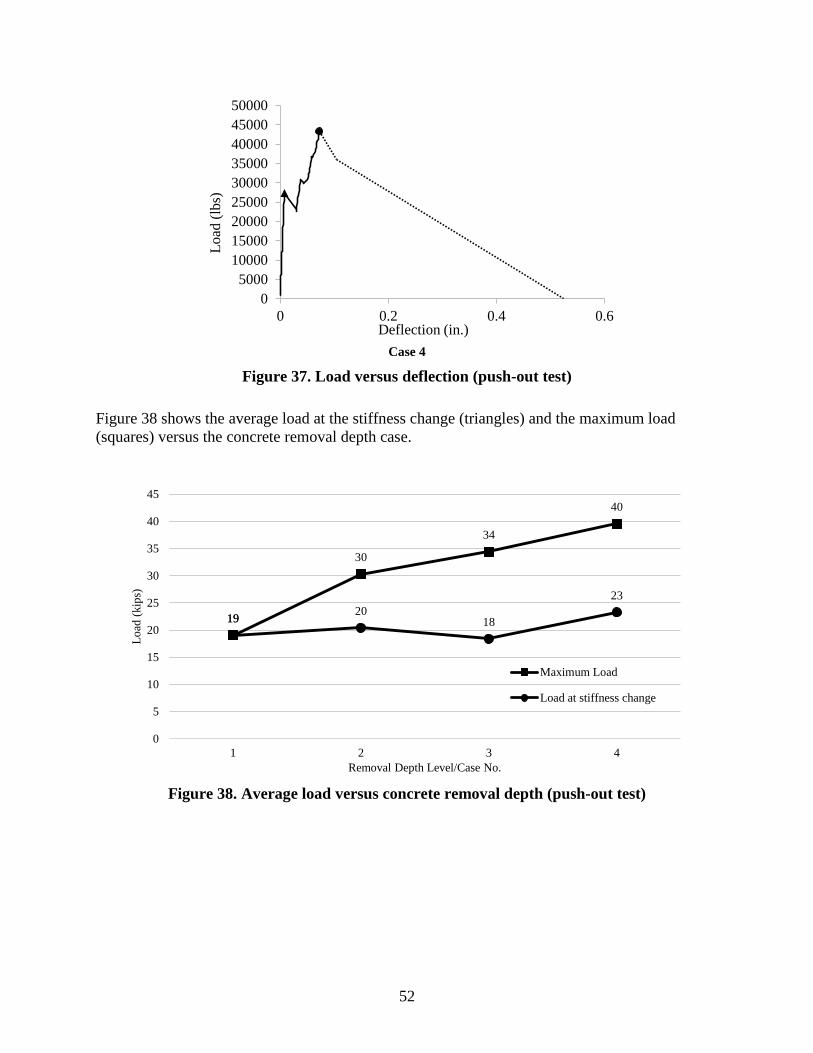
52
Case 4
Figure 37. Load versus deflection (push-out test)
Figure 38 shows the average load at the stiffness change (triangles) and the maximum load
(squares) versus the concrete removal depth case.
Figure 38. Average load versus concrete removal depth (push-out test)
0
5000
10000
15000
20000
25000
30000
35000
40000
45000
50000
0 0.2 0.4 0.6
Lo
ad (
lbs)
Deflection (in.)
19
30
34
40
19 20
18
23
0
5
10
15
20
25
30
35
40
45
1 2 3 4
Lo
ad (
kip
s)
Removal Depth Level/Case No.
Maximum Load
Load at stiffness change
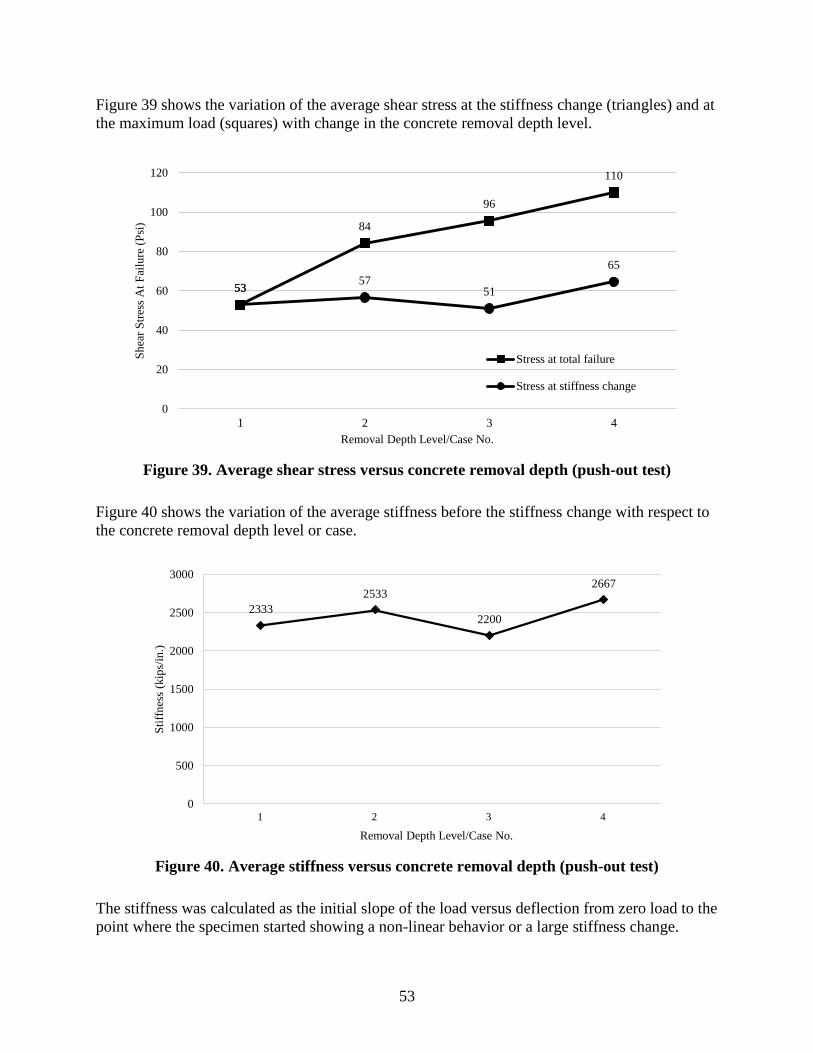
53
Figure 39 shows the variation of the average shear stress at the stiffness change (triangles) and at
the maximum load (squares) with change in the concrete removal depth level.
Figure 39. Average shear stress versus concrete removal depth (push-out test)
Figure 40 shows the variation of the average stiffness before the stiffness change with respect to
the concrete removal depth level or case.
Figure 40. Average stiffness versus concrete removal depth (push-out test)
The stiffness was calculated as the initial slope of the load versus deflection from zero load to the
point where the specimen started showing a non-linear behavior or a large stiffness change.
53
84
96
110
53 57
51
65
0
20
40
60
80
100
120
1 2 3 4
Sh
ear
Str
ess
At
Fai
lure
(P
si)
Removal Depth Level/Case No.
Stress at total failure
Stress at stiffness change
2333
2533
2200
2667
0
500
1000
1500
2000
2500
3000
1 2 3 4
Sti
ffn
ess
(kip
s/in
.)
Removal Depth Level/Case No.
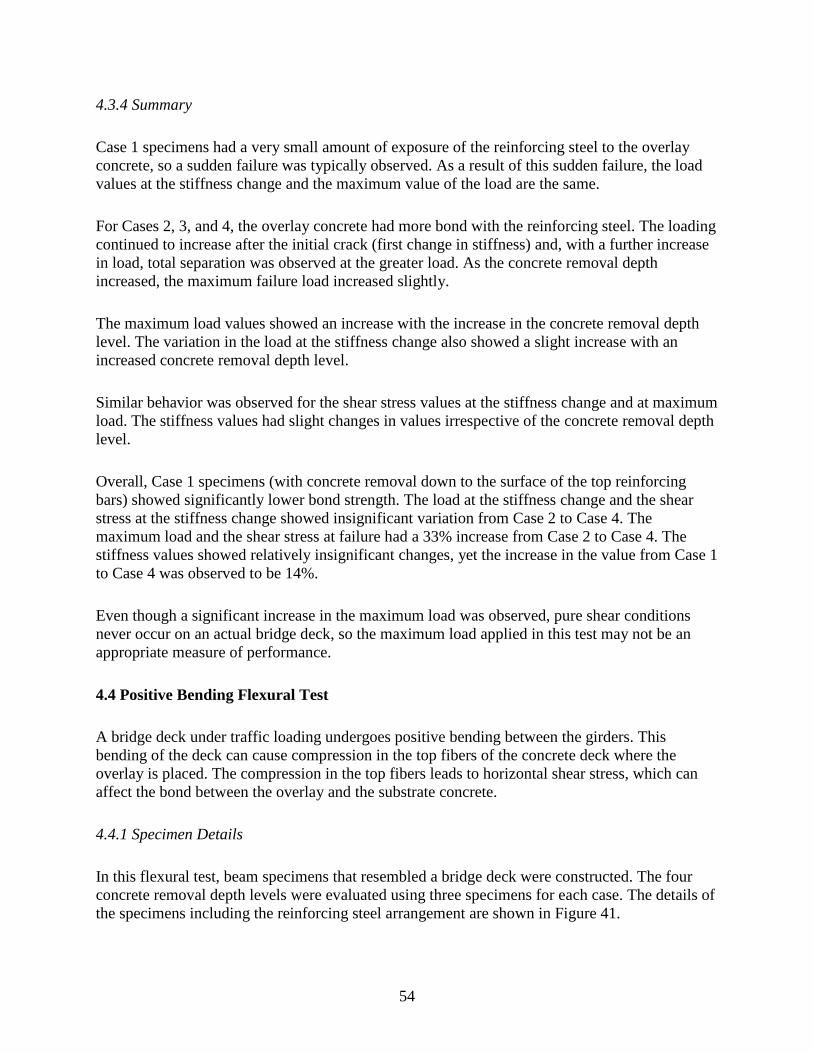
54
4.3.4 Summary
Case 1 specimens had a very small amount of exposure of the reinforcing steel to the overlay
concrete, so a sudden failure was typically observed. As a result of this sudden failure, the load
values at the stiffness change and the maximum value of the load are the same.
For Cases 2, 3, and 4, the overlay concrete had more bond with the reinforcing steel. The loading
continued to increase after the initial crack (first change in stiffness) and, with a further increase
in load, total separation was observed at the greater load. As the concrete removal depth
increased, the maximum failure load increased slightly.
The maximum load values showed an increase with the increase in the concrete removal depth
level. The variation in the load at the stiffness change also showed a slight increase with an
increased concrete removal depth level.
Similar behavior was observed for the shear stress values at the stiffness change and at maximum
load. The stiffness values had slight changes in values irrespective of the concrete removal depth
level.
Overall, Case 1 specimens (with concrete removal down to the surface of the top reinforcing
bars) showed significantly lower bond strength. The load at the stiffness change and the shear
stress at the stiffness change showed insignificant variation from Case 2 to Case 4. The
maximum load and the shear stress at failure had a 33% increase from Case 2 to Case 4. The
stiffness values showed relatively insignificant changes, yet the increase in the value from Case 1
to Case 4 was observed to be 14%.
Even though a significant increase in the maximum load was observed, pure shear conditions
never occur on an actual bridge deck, so the maximum load applied in this test may not be an
appropriate measure of performance.
4.4 Positive Bending Flexural Test
A bridge deck under traffic loading undergoes positive bending between the girders. This
bending of the deck can cause compression in the top fibers of the concrete deck where the
overlay is placed. The compression in the top fibers leads to horizontal shear stress, which can
affect the bond between the overlay and the substrate concrete.
4.4.1 Specimen Details
In this flexural test, beam specimens that resembled a bridge deck were constructed. The four
concrete removal depth levels were evaluated using three specimens for each case. The details of
the specimens including the reinforcing steel arrangement are shown in Figure 41.
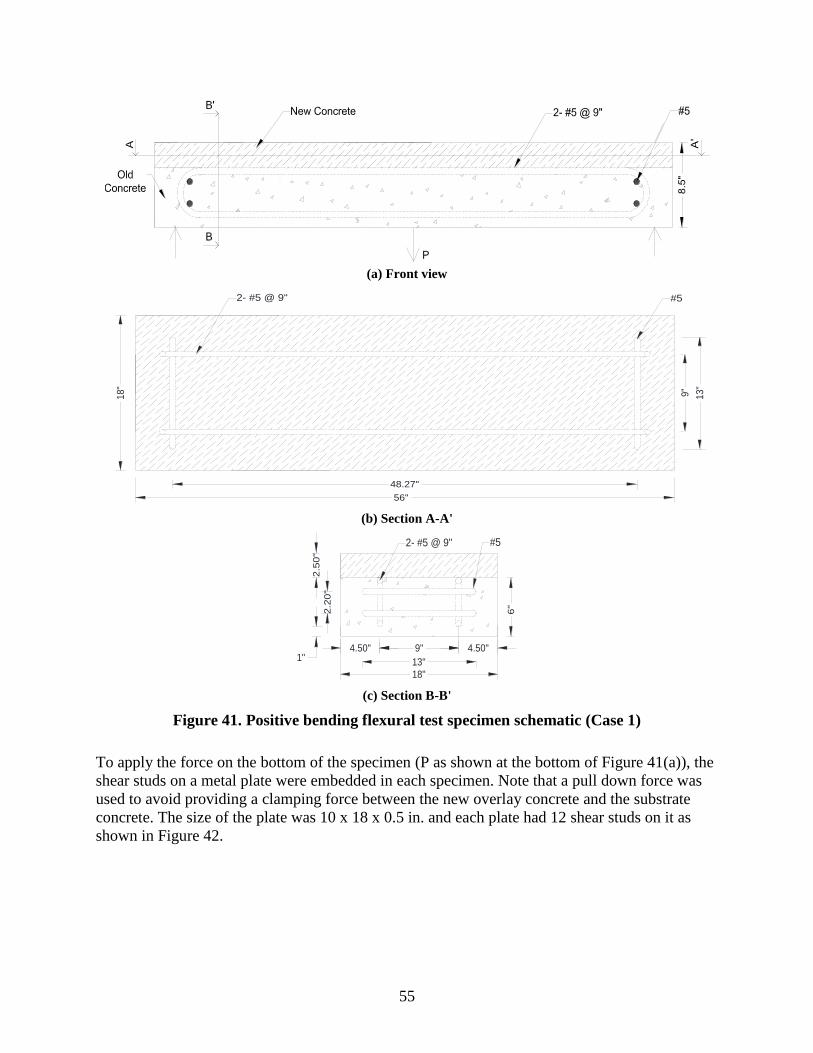
55
(a) Front view
18"
9"
13"
56"
#52- #5 @ 9"
48.27"
(b) Section A-A'
9" 4.50"
18"
2.2
0"
2.5
0"
6"
4.50"
13"
2- #5 @ 9" #5
1"
(c) Section B-B'
Figure 41. Positive bending flexural test specimen schematic (Case 1)
To apply the force on the bottom of the specimen (P as shown at the bottom of Figure 41(a)), the
shear studs on a metal plate were embedded in each specimen. Note that a pull down force was
used to avoid providing a clamping force between the new overlay concrete and the substrate
concrete. The size of the plate was 10 x 18 x 0.5 in. and each plate had 12 shear studs on it as
shown in Figure 42.
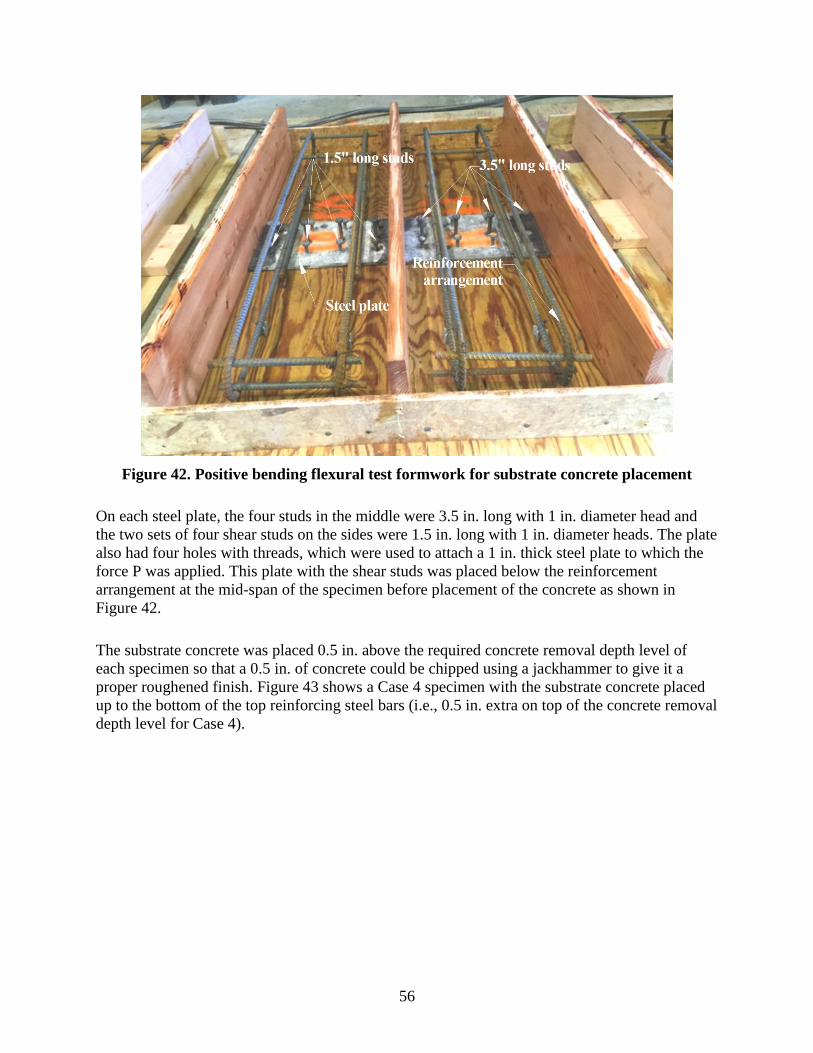
56
Figure 42. Positive bending flexural test formwork for substrate concrete placement
On each steel plate, the four studs in the middle were 3.5 in. long with 1 in. diameter head and
the two sets of four shear studs on the sides were 1.5 in. long with 1 in. diameter heads. The plate
also had four holes with threads, which were used to attach a 1 in. thick steel plate to which the
force P was applied. This plate with the shear studs was placed below the reinforcement
arrangement at the mid-span of the specimen before placement of the concrete as shown in
Figure 42.
The substrate concrete was placed 0.5 in. above the required concrete removal depth level of
each specimen so that a 0.5 in. of concrete could be chipped using a jackhammer to give it a
proper roughened finish. Figure 43 shows a Case 4 specimen with the substrate concrete placed
up to the bottom of the top reinforcing steel bars (i.e., 0.5 in. extra on top of the concrete removal
depth level for Case 4).
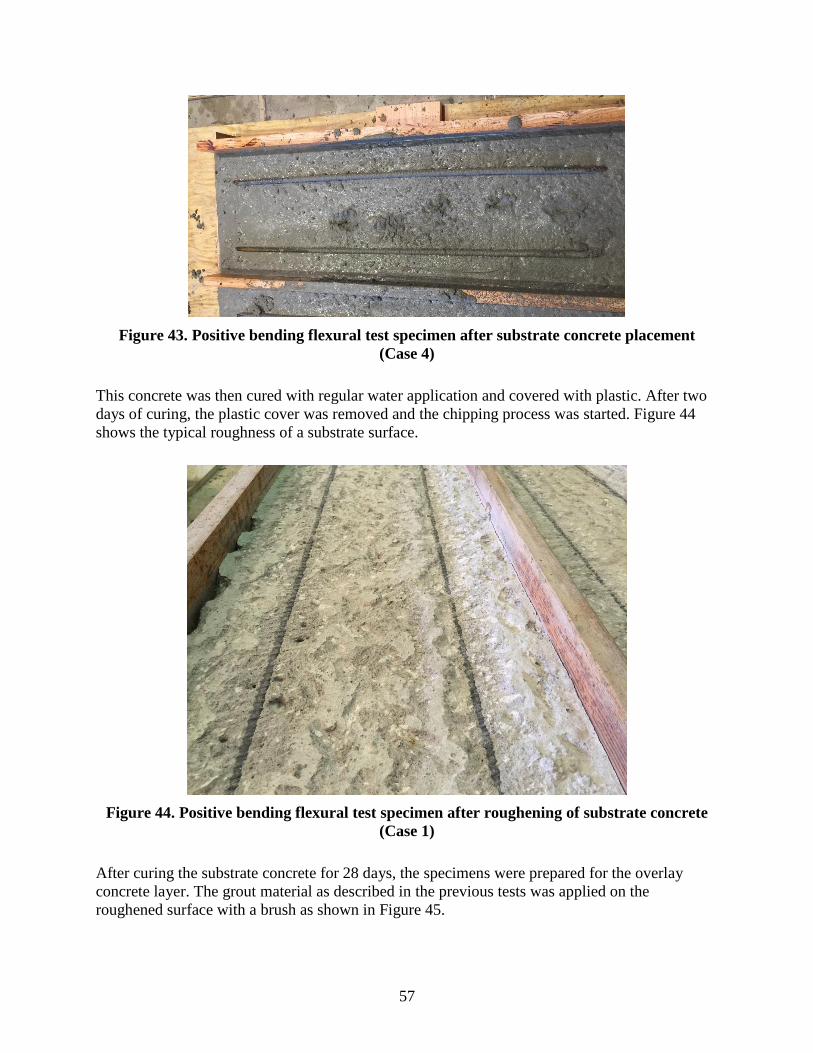
57
Figure 43. Positive bending flexural test specimen after substrate concrete placement
(Case 4)
This concrete was then cured with regular water application and covered with plastic. After two
days of curing, the plastic cover was removed and the chipping process was started. Figure 44
shows the typical roughness of a substrate surface.
Figure 44. Positive bending flexural test specimen after roughening of substrate concrete
(Case 1)
After curing the substrate concrete for 28 days, the specimens were prepared for the overlay
concrete layer. The grout material as described in the previous tests was applied on the
roughened surface with a brush as shown in Figure 45.
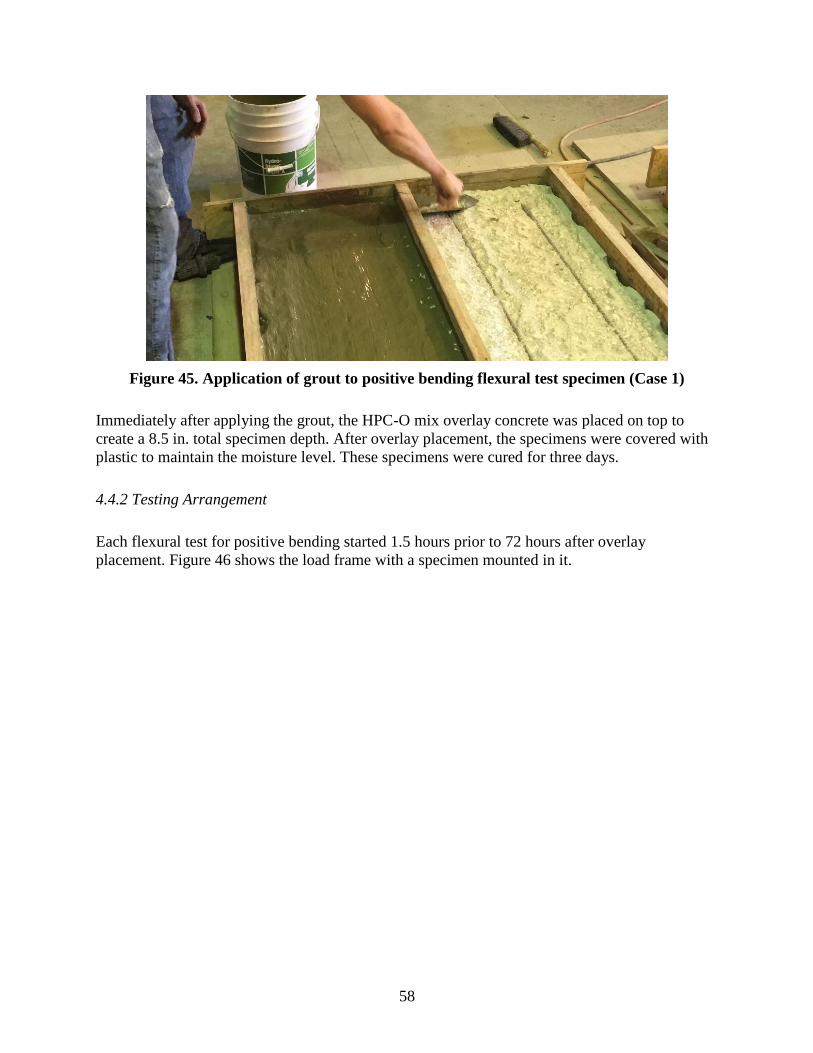
58
Figure 45. Application of grout to positive bending flexural test specimen (Case 1)
Immediately after applying the grout, the HPC-O mix overlay concrete was placed on top to
create a 8.5 in. total specimen depth. After overlay placement, the specimens were covered with
plastic to maintain the moisture level. These specimens were cured for three days.
4.4.2 Testing Arrangement
Each flexural test for positive bending started 1.5 hours prior to 72 hours after overlay
placement. Figure 46 shows the load frame with a specimen mounted in it.
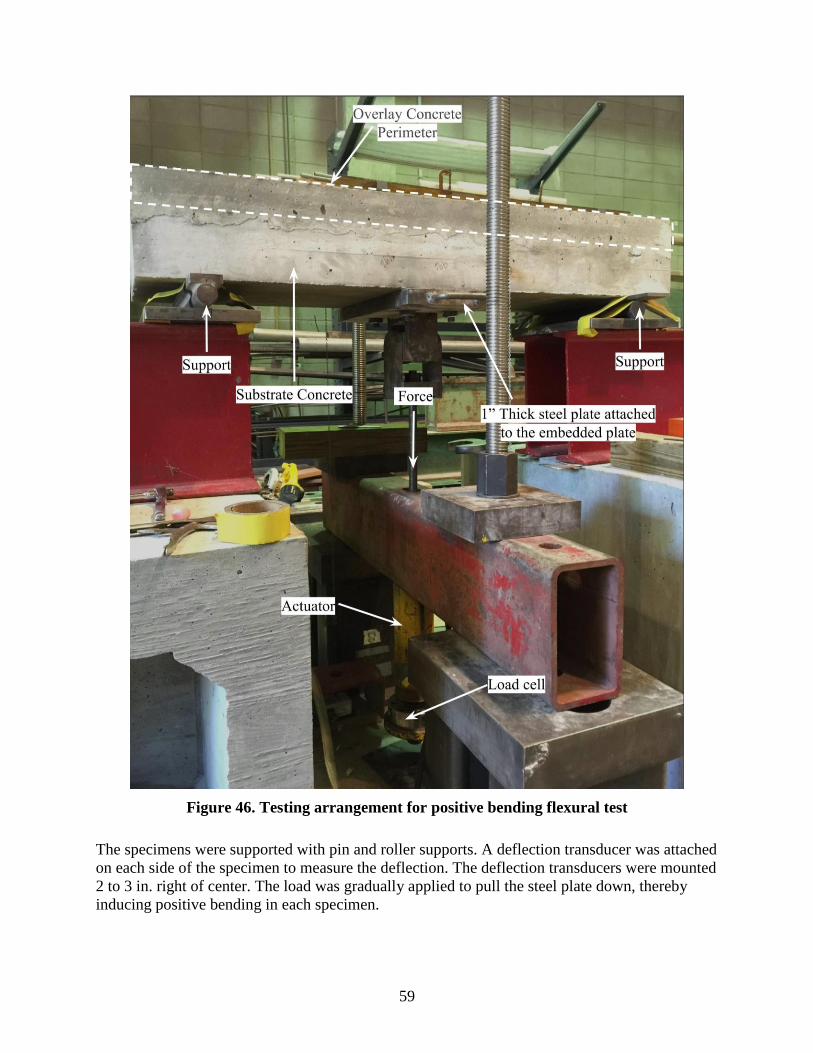
59
Figure 46. Testing arrangement for positive bending flexural test
The specimens were supported with pin and roller supports. A deflection transducer was attached
on each side of the specimen to measure the deflection. The deflection transducers were mounted
2 to 3 in. right of center. The load was gradually applied to pull the steel plate down, thereby
inducing positive bending in each specimen.
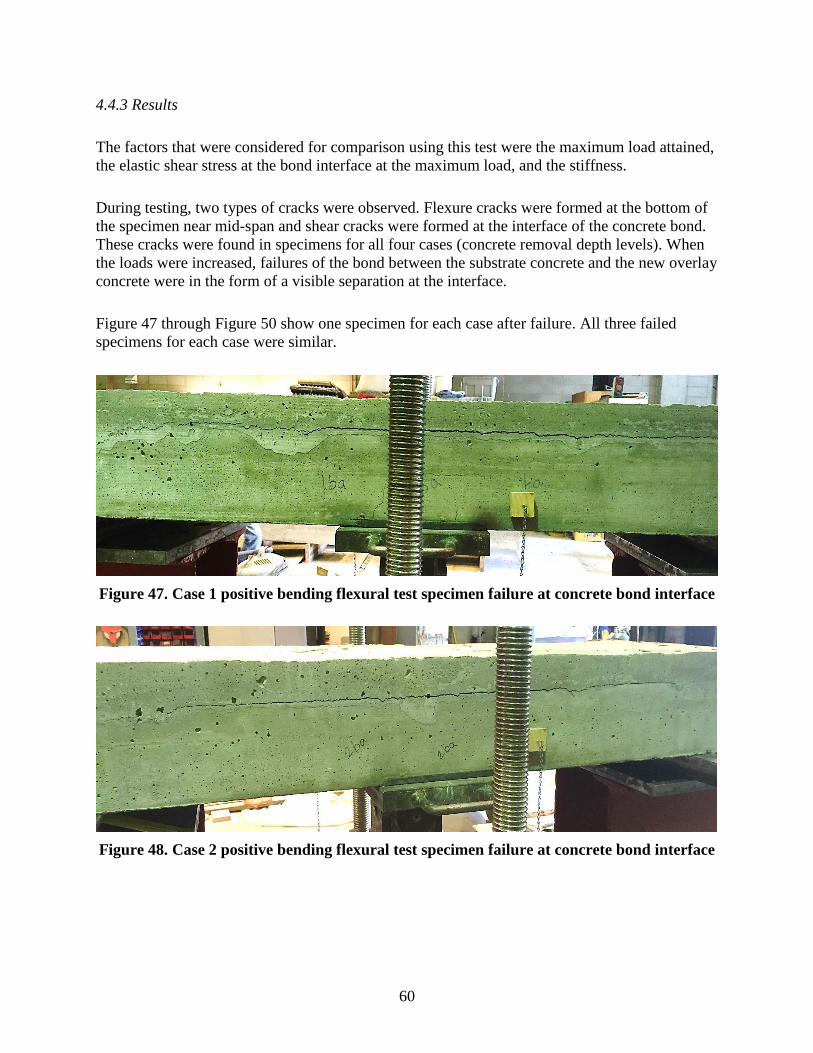
60
4.4.3 Results
The factors that were considered for comparison using this test were the maximum load attained,
the elastic shear stress at the bond interface at the maximum load, and the stiffness.
During testing, two types of cracks were observed. Flexure cracks were formed at the bottom of
the specimen near mid-span and shear cracks were formed at the interface of the concrete bond.
These cracks were found in specimens for all four cases (concrete removal depth levels). When
the loads were increased, failures of the bond between the substrate concrete and the new overlay
concrete were in the form of a visible separation at the interface.
Figure 47 through Figure 50 show one specimen for each case after failure. All three failed
specimens for each case were similar.
Figure 47. Case 1 positive bending flexural test specimen failure at concrete bond interface
Figure 48. Case 2 positive bending flexural test specimen failure at concrete bond interface
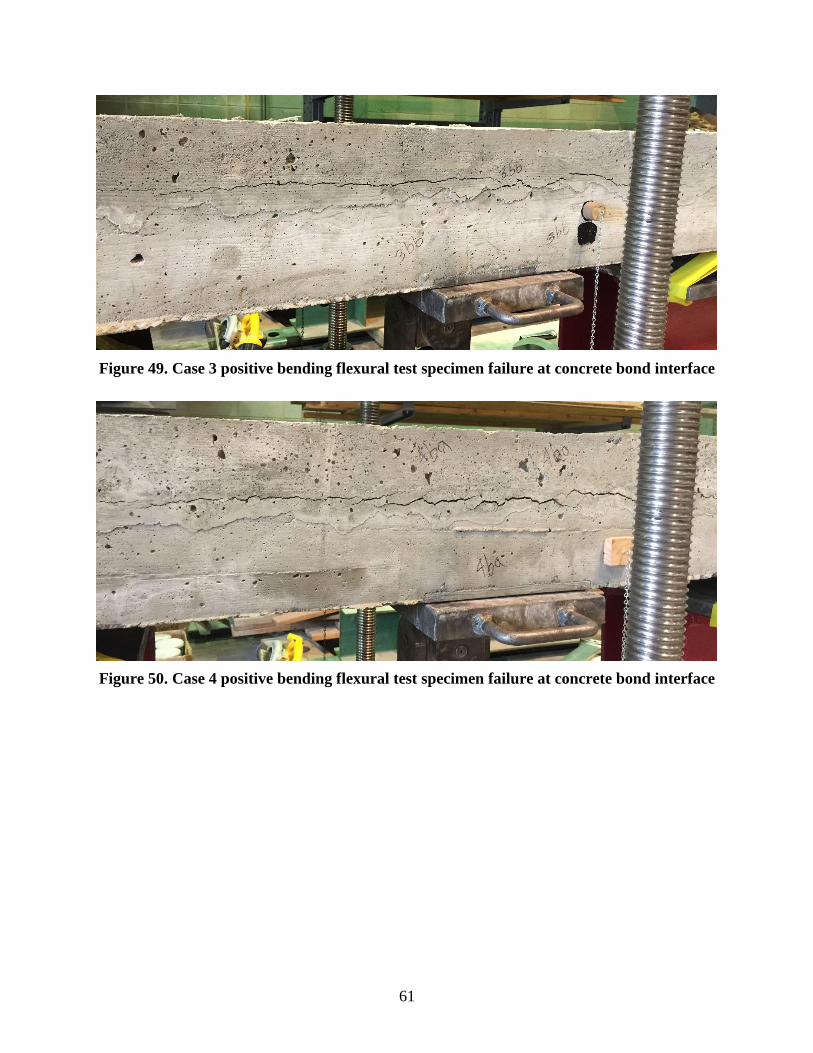
61
Figure 49. Case 3 positive bending flexural test specimen failure at concrete bond interface
Figure 50. Case 4 positive bending flexural test specimen failure at concrete bond interface
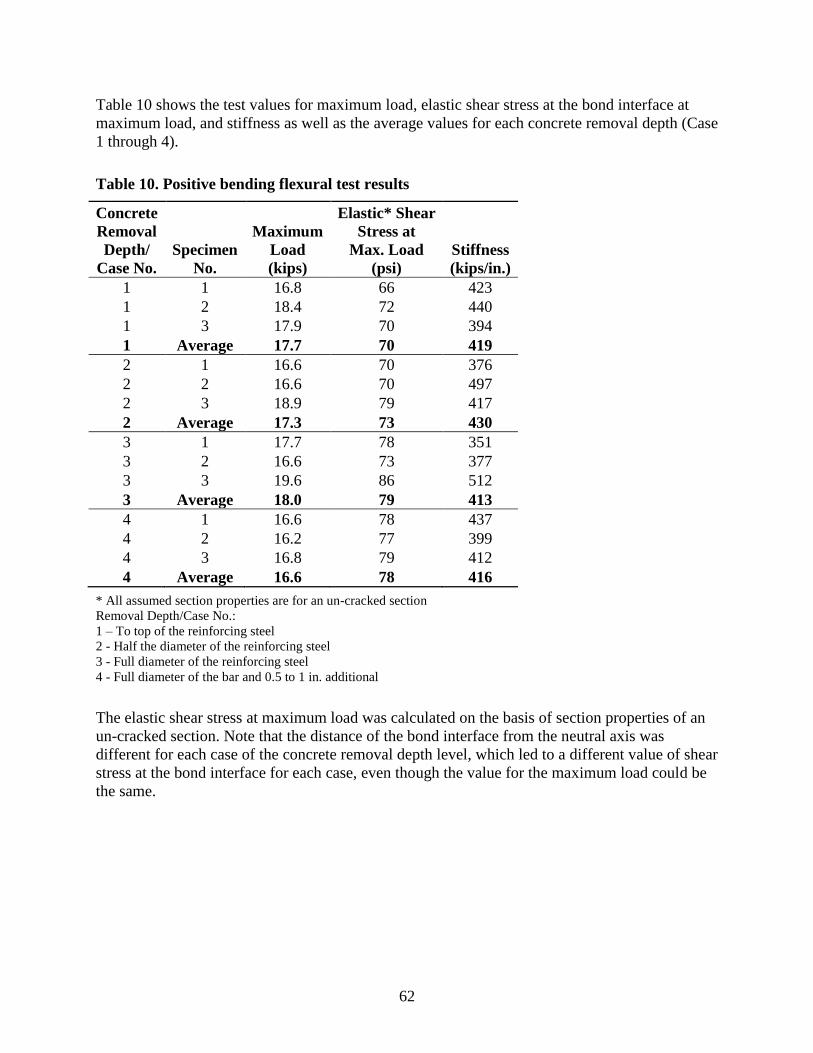
62
Table 10 shows the test values for maximum load, elastic shear stress at the bond interface at
maximum load, and stiffness as well as the average values for each concrete removal depth (Case
1 through 4).
Table 10. Positive bending flexural test results
Concrete
Removal
Depth/
Case No.
Specimen
No.
Maximum
Load
(kips)
Elastic* Shear
Stress at
Max. Load
(psi)
Stiffness
(kips/in.)
1 1 16.8 66 423
1 2 18.4 72 440
1 3 17.9 70 394
1 Average 17.7 70 419
2 1 16.6 70 376
2 2 16.6 70 497
2 3 18.9 79 417
2 Average 17.3 73 430
3 1 17.7 78 351
3 2 16.6 73 377
3 3 19.6 86 512
3 Average 18.0 79 413
4 1 16.6 78 437
4 2 16.2 77 399
4 3 16.8 79 412
4 Average 16.6 78 416
* All assumed section properties are for an un-cracked section
Removal Depth/Case No.:
1 – To top of the reinforcing steel
2 - Half the diameter of the reinforcing steel
3 - Full diameter of the reinforcing steel
4 - Full diameter of the bar and 0.5 to 1 in. additional
The elastic shear stress at maximum load was calculated on the basis of section properties of an
un-cracked section. Note that the distance of the bond interface from the neutral axis was
different for each case of the concrete removal depth level, which led to a different value of shear
stress at the bond interface for each case, even though the value for the maximum load could be
the same.
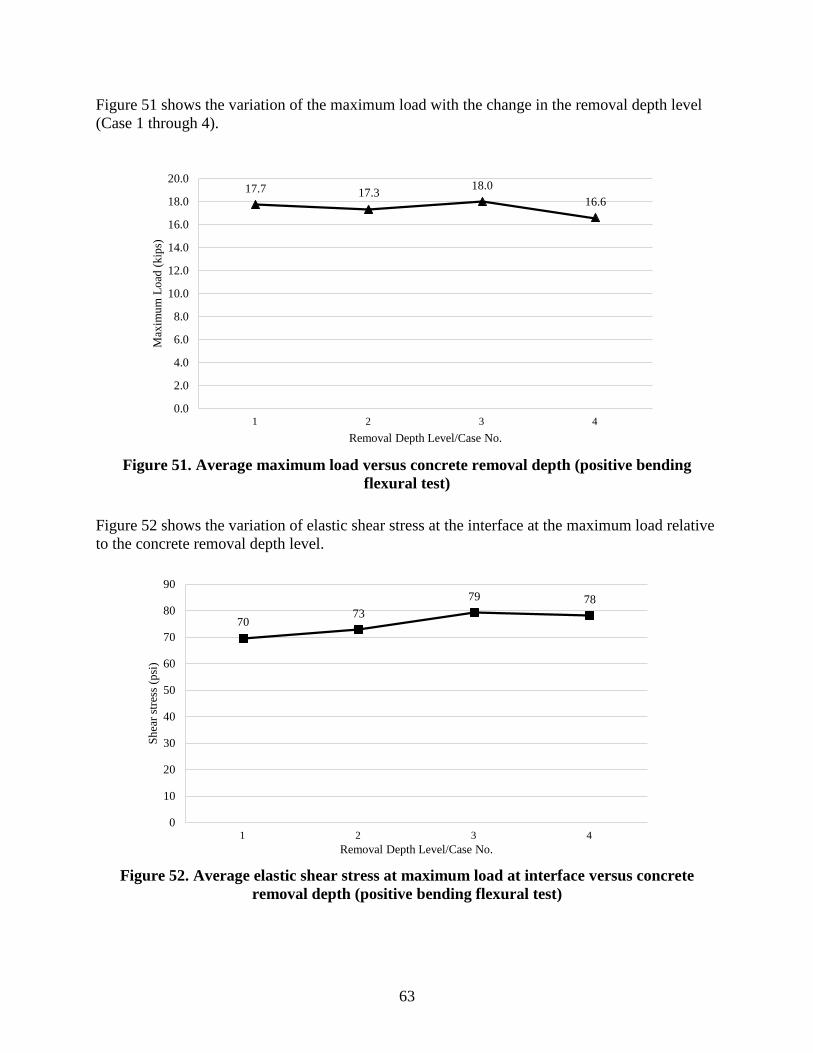
63
Figure 51 shows the variation of the maximum load with the change in the removal depth level
(Case 1 through 4).
Figure 51. Average maximum load versus concrete removal depth (positive bending
flexural test)
Figure 52 shows the variation of elastic shear stress at the interface at the maximum load relative
to the concrete removal depth level.
Figure 52. Average elastic shear stress at maximum load at interface versus concrete
removal depth (positive bending flexural test)
17.7 17.3 18.0
16.6
0.0
2.0
4.0
6.0
8.0
10.0
12.0
14.0
16.0
18.0
20.0
1 2 3 4
Max
imu
m L
oad
(kip
s)
Removal Depth Level/Case No.
70 73
79 78
0
10
20
30
40
50
60
70
80
90
1 2 3 4
Sh
ear
stre
ss (
psi
)
Removal Depth Level/Case No.
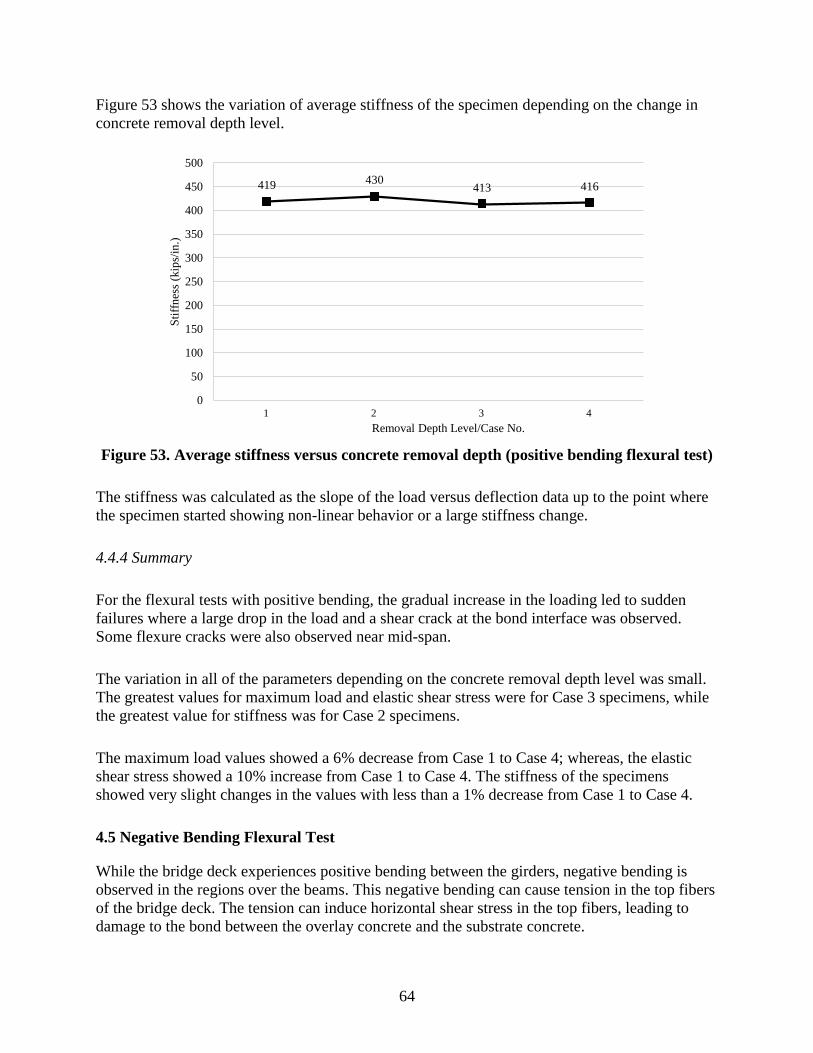
64
Figure 53 shows the variation of average stiffness of the specimen depending on the change in
concrete removal depth level.
Figure 53. Average stiffness versus concrete removal depth (positive bending flexural test)
The stiffness was calculated as the slope of the load versus deflection data up to the point where
the specimen started showing non-linear behavior or a large stiffness change.
4.4.4 Summary
For the flexural tests with positive bending, the gradual increase in the loading led to sudden
failures where a large drop in the load and a shear crack at the bond interface was observed.
Some flexure cracks were also observed near mid-span.
The variation in all of the parameters depending on the concrete removal depth level was small.
The greatest values for maximum load and elastic shear stress were for Case 3 specimens, while
the greatest value for stiffness was for Case 2 specimens.
The maximum load values showed a 6% decrease from Case 1 to Case 4; whereas, the elastic
shear stress showed a 10% increase from Case 1 to Case 4. The stiffness of the specimens
showed very slight changes in the values with less than a 1% decrease from Case 1 to Case 4.
4.5 Negative Bending Flexural Test
While the bridge deck experiences positive bending between the girders, negative bending is
observed in the regions over the beams. This negative bending can cause tension in the top fibers
of the bridge deck. The tension can induce horizontal shear stress in the top fibers, leading to
damage to the bond between the overlay concrete and the substrate concrete.
419 430 413 416
0
50
100
150
200
250
300
350
400
450
500
1 2 3 4
Sti
ffn
ess
(kip
s/in
.)
Removal Depth Level/Case No.
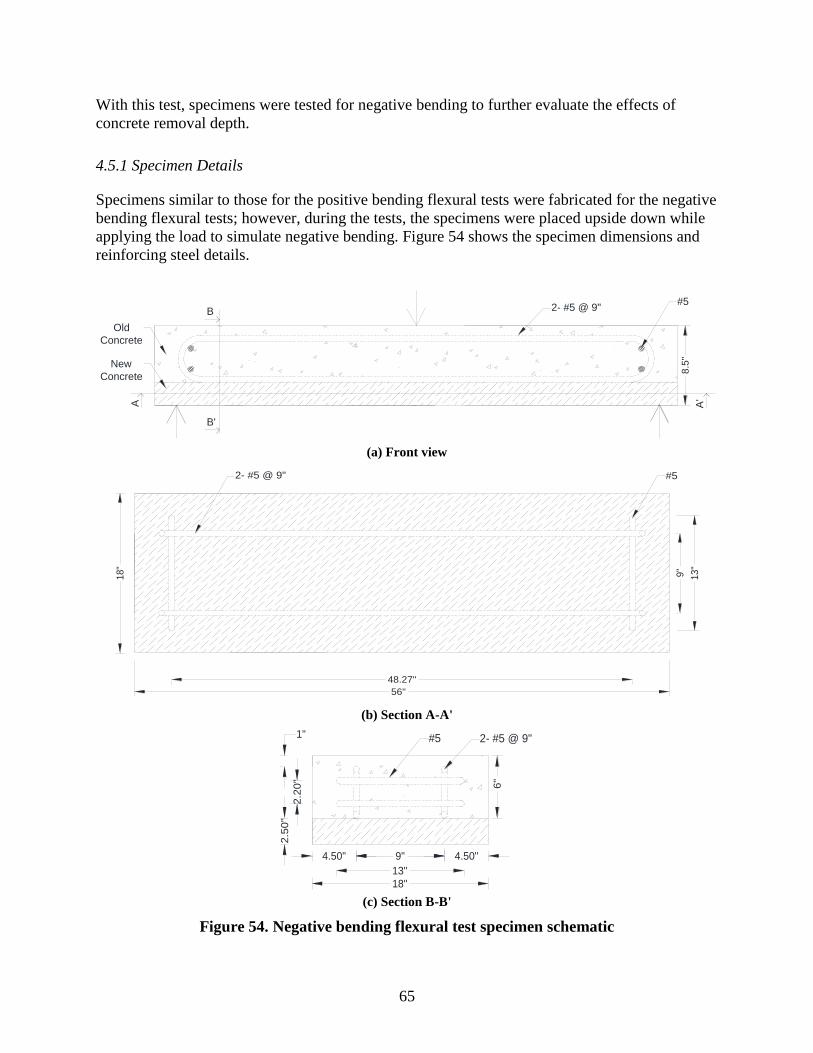
65
With this test, specimens were tested for negative bending to further evaluate the effects of
concrete removal depth.
4.5.1 Specimen Details
Specimens similar to those for the positive bending flexural tests were fabricated for the negative
bending flexural tests; however, during the tests, the specimens were placed upside down while
applying the load to simulate negative bending. Figure 54 shows the specimen dimensions and
reinforcing steel details.
#52- #5 @ 9"
Old
Concrete
New
Concrete
8.5
"
A A'
B
B'
(a) Front view
18
"
9"
13
"56"
#52- #5 @ 9"
48.27"
(b) Section A-A'
2.2
0"
2.5
0"
6"
2- #5 @ 9"#51"
9" 4.50"
18"
4.50"
13"
(c) Section B-B'
Figure 54. Negative bending flexural test specimen schematic
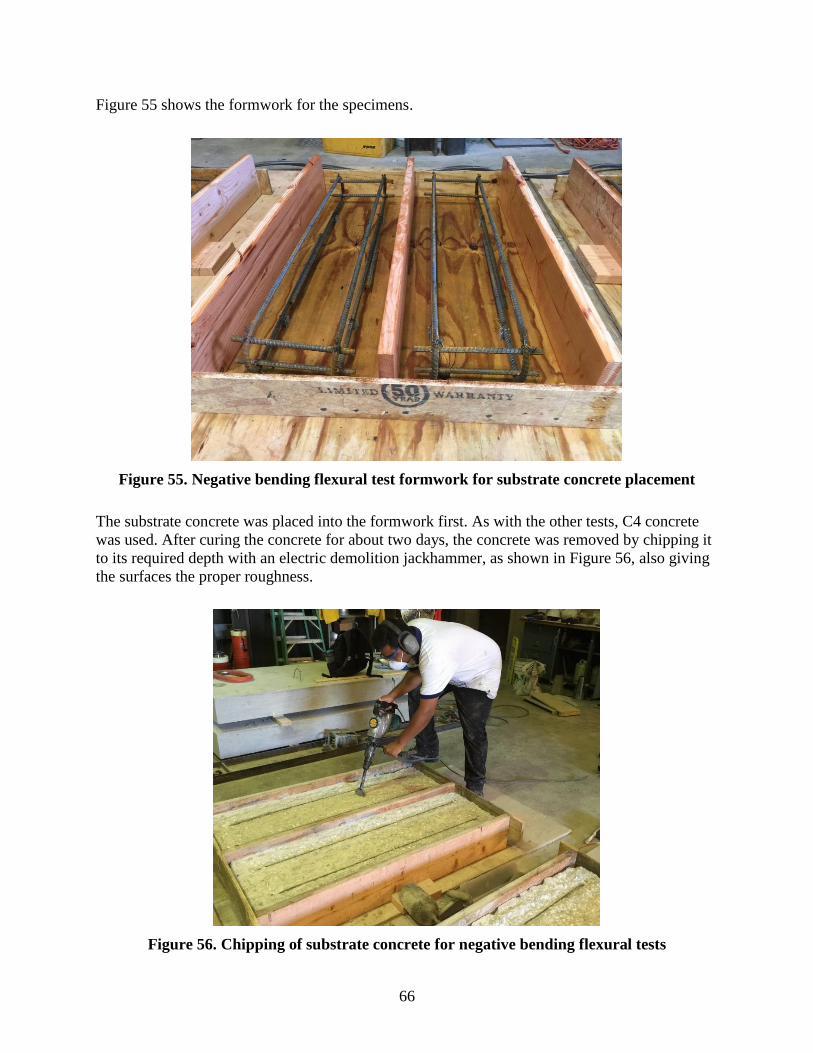
66
Figure 55 shows the formwork for the specimens.
Figure 55. Negative bending flexural test formwork for substrate concrete placement
The substrate concrete was placed into the formwork first. As with the other tests, C4 concrete
was used. After curing the concrete for about two days, the concrete was removed by chipping it
to its required depth with an electric demolition jackhammer, as shown in Figure 56, also giving
the surfaces the proper roughness.
Figure 56. Chipping of substrate concrete for negative bending flexural tests
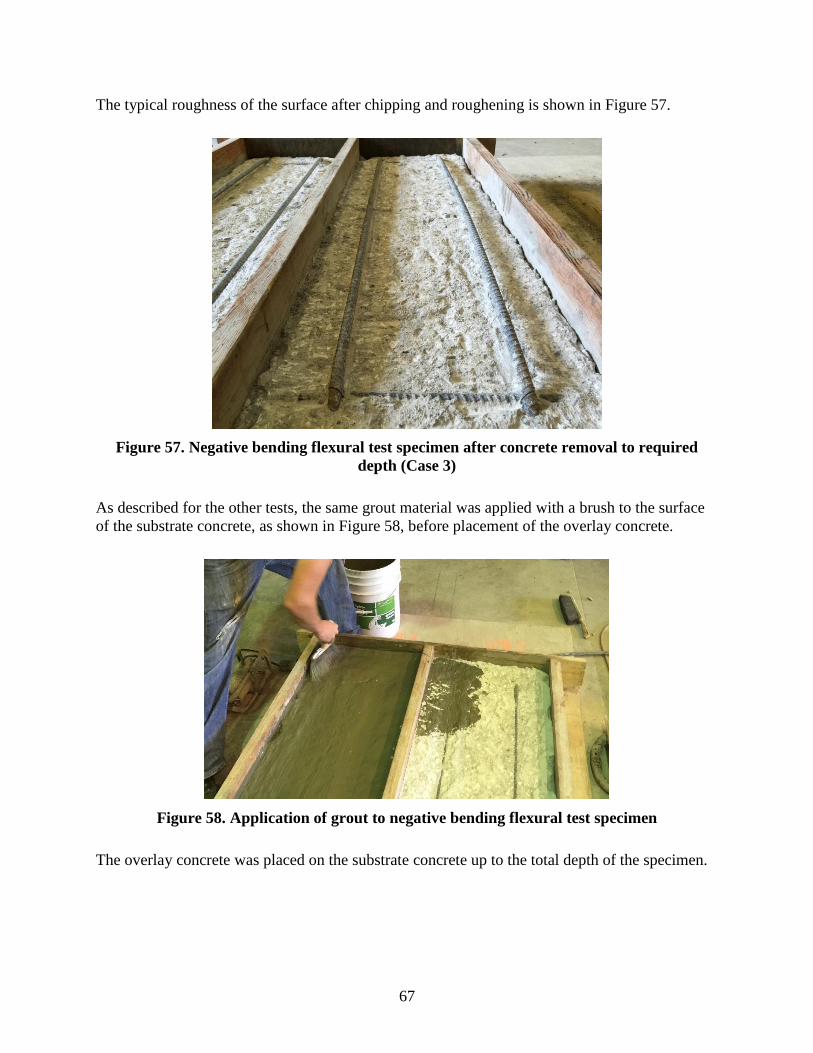
67
The typical roughness of the surface after chipping and roughening is shown in Figure 57.
Figure 57. Negative bending flexural test specimen after concrete removal to required
depth (Case 3)
As described for the other tests, the same grout material was applied with a brush to the surface
of the substrate concrete, as shown in Figure 58, before placement of the overlay concrete.
Figure 58. Application of grout to negative bending flexural test specimen
The overlay concrete was placed on the substrate concrete up to the total depth of the specimen.
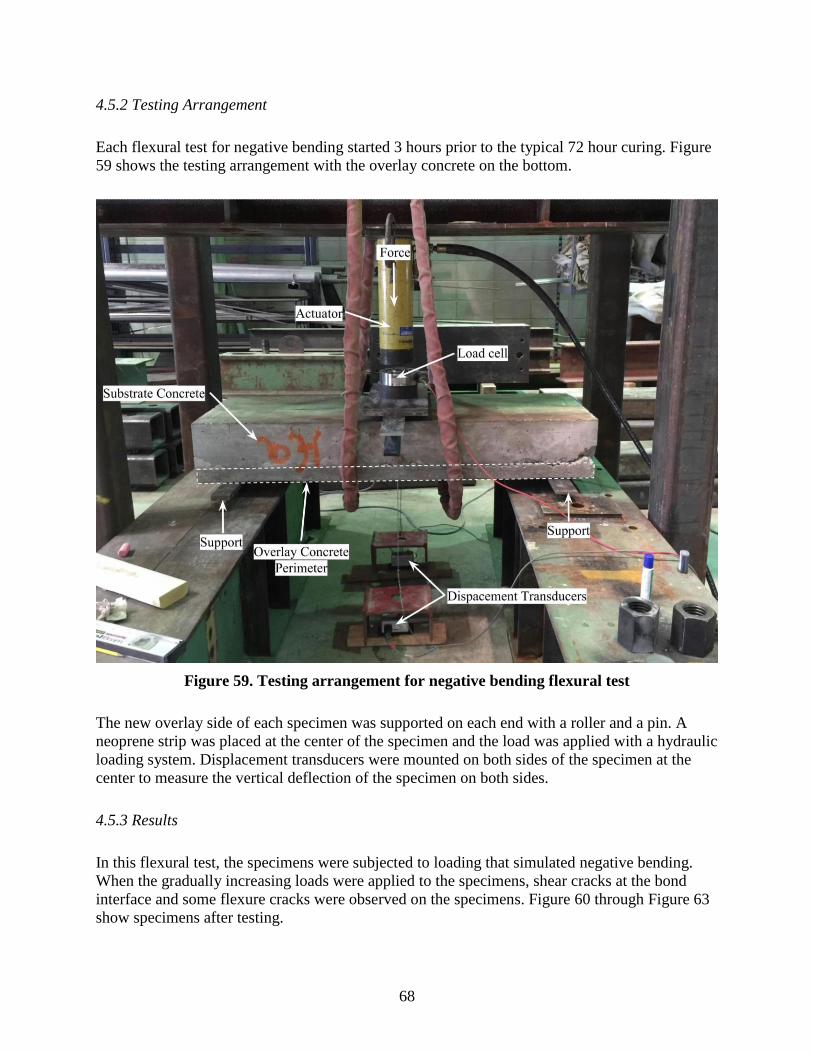
68
4.5.2 Testing Arrangement
Each flexural test for negative bending started 3 hours prior to the typical 72 hour curing. Figure
59 shows the testing arrangement with the overlay concrete on the bottom.
Figure 59. Testing arrangement for negative bending flexural test
The new overlay side of each specimen was supported on each end with a roller and a pin. A
neoprene strip was placed at the center of the specimen and the load was applied with a hydraulic
loading system. Displacement transducers were mounted on both sides of the specimen at the
center to measure the vertical deflection of the specimen on both sides.
4.5.3 Results
In this flexural test, the specimens were subjected to loading that simulated negative bending.
When the gradually increasing loads were applied to the specimens, shear cracks at the bond
interface and some flexure cracks were observed on the specimens. Figure 60 through Figure 63
show specimens after testing.
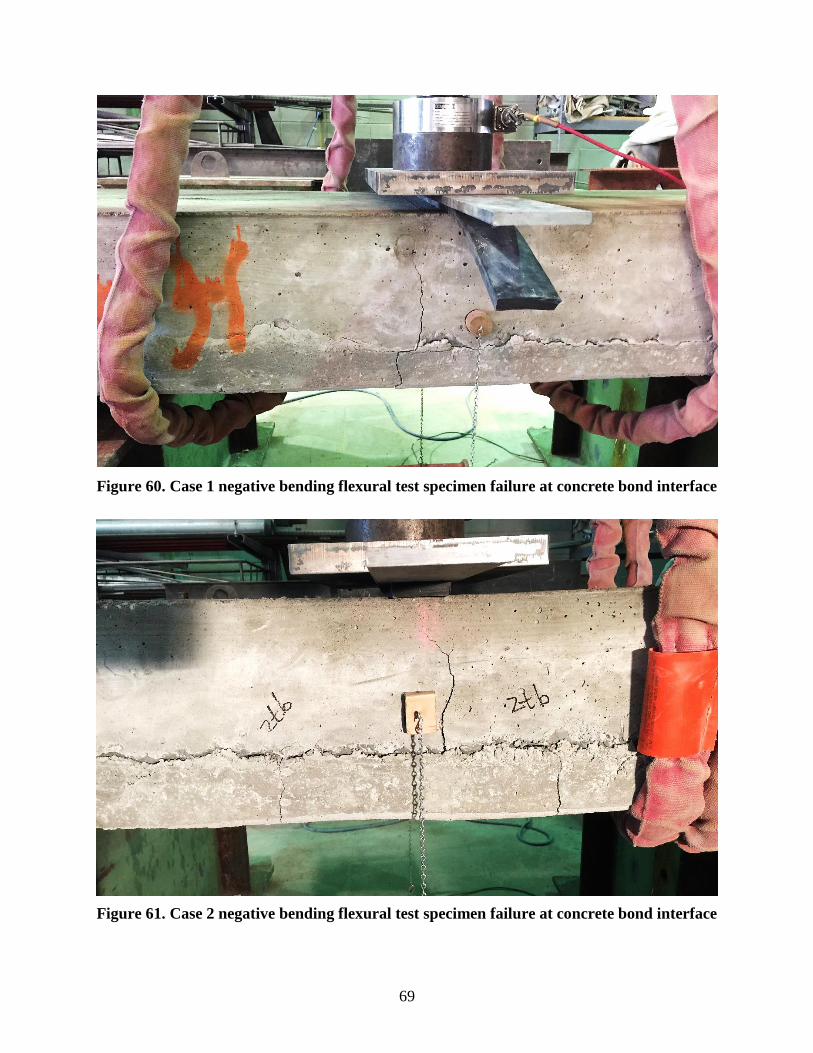
69
Figure 60. Case 1 negative bending flexural test specimen failure at concrete bond interface
Figure 61. Case 2 negative bending flexural test specimen failure at concrete bond interface
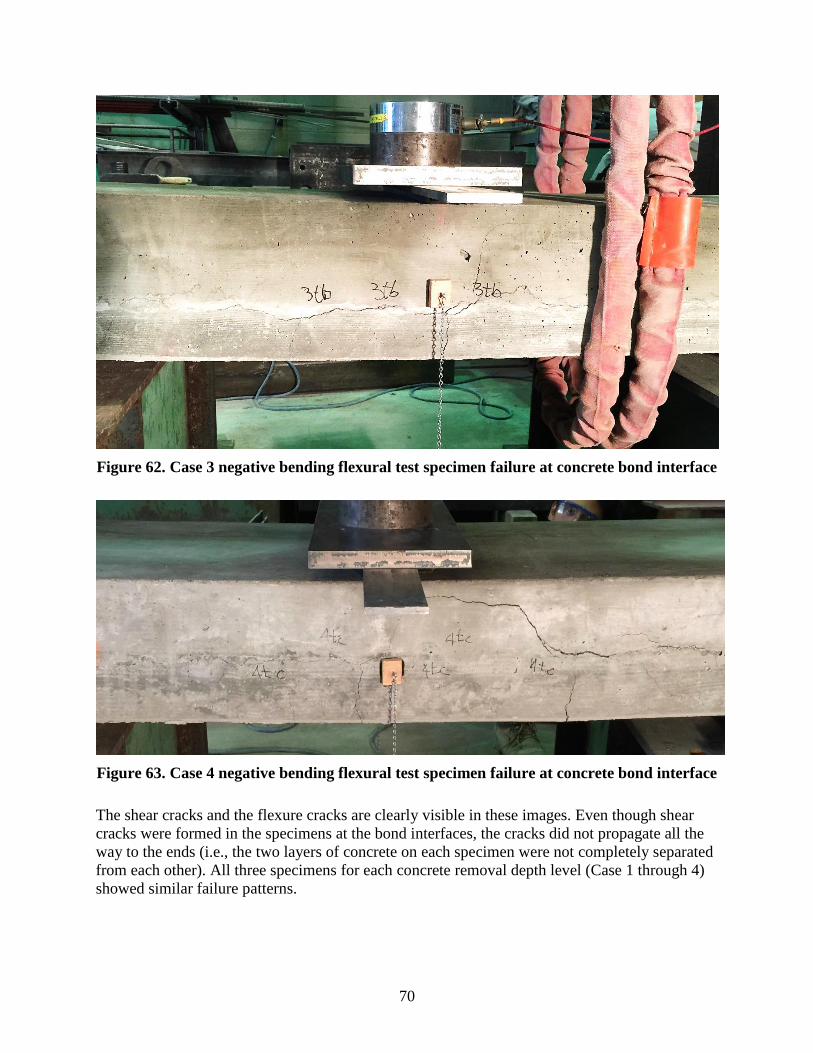
70
Figure 62. Case 3 negative bending flexural test specimen failure at concrete bond interface
Figure 63. Case 4 negative bending flexural test specimen failure at concrete bond interface
The shear cracks and the flexure cracks are clearly visible in these images. Even though shear
cracks were formed in the specimens at the bond interfaces, the cracks did not propagate all the
way to the ends (i.e., the two layers of concrete on each specimen were not completely separated
from each other). All three specimens for each concrete removal depth level (Case 1 through 4)
showed similar failure patterns.
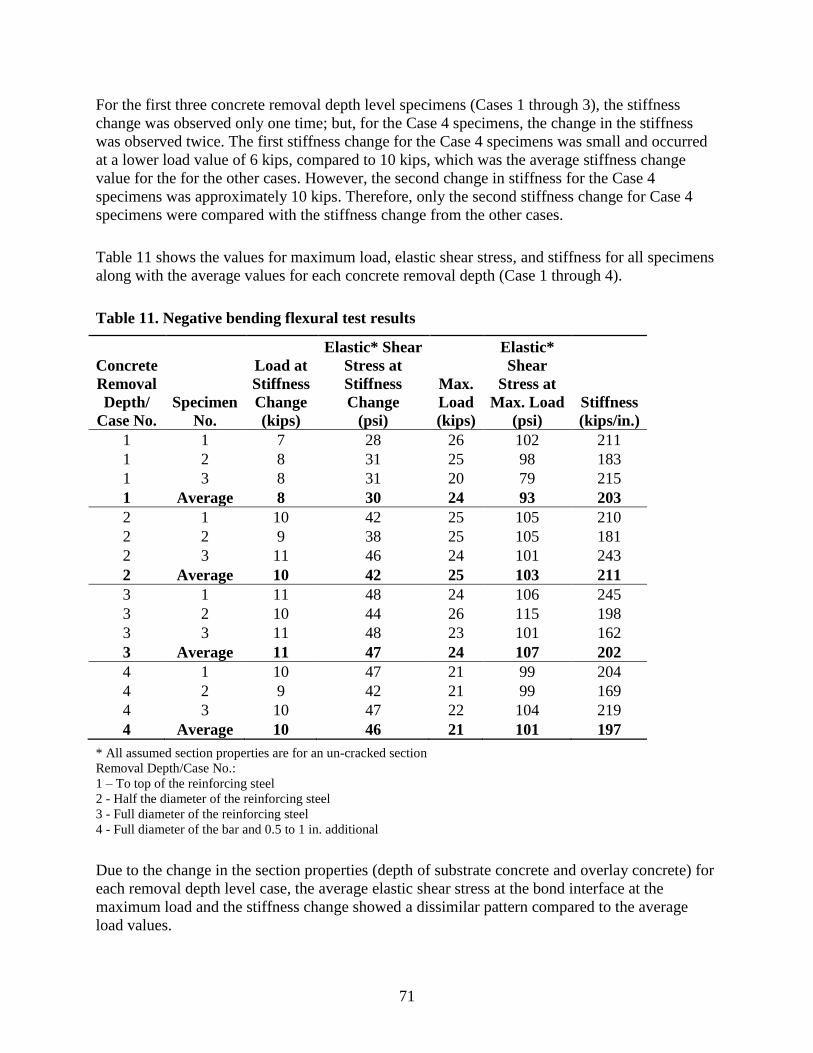
71
For the first three concrete removal depth level specimens (Cases 1 through 3), the stiffness
change was observed only one time; but, for the Case 4 specimens, the change in the stiffness
was observed twice. The first stiffness change for the Case 4 specimens was small and occurred
at a lower load value of 6 kips, compared to 10 kips, which was the average stiffness change
value for the for the other cases. However, the second change in stiffness for the Case 4
specimens was approximately 10 kips. Therefore, only the second stiffness change for Case 4
specimens were compared with the stiffness change from the other cases.
Table 11 shows the values for maximum load, elastic shear stress, and stiffness for all specimens
along with the average values for each concrete removal depth (Case 1 through 4).
Table 11. Negative bending flexural test results
Concrete
Removal
Depth/
Case No.
Specimen
No.
Load at
Stiffness
Change
(kips)
Elastic* Shear
Stress at
Stiffness
Change
(psi)
Max.
Load
(kips)
Elastic*
Shear
Stress at
Max. Load
(psi)
Stiffness
(kips/in.)
1 1 7 28 26 102 211
1 2 8 31 25 98 183
1 3 8 31 20 79 215
1 Average 8 30 24 93 203
2 1 10 42 25 105 210
2 2 9 38 25 105 181
2 3 11 46 24 101 243
2 Average 10 42 25 103 211
3 1 11 48 24 106 245
3 2 10 44 26 115 198
3 3 11 48 23 101 162
3 Average 11 47 24 107 202
4 1 10 47 21 99 204
4 2 9 42 21 99 169
4 3 10 47 22 104 219
4 Average 10 46 21 101 197
* All assumed section properties are for an un-cracked section
Removal Depth/Case No.:
1 – To top of the reinforcing steel
2 - Half the diameter of the reinforcing steel
3 - Full diameter of the reinforcing steel
4 - Full diameter of the bar and 0.5 to 1 in. additional
Due to the change in the section properties (depth of substrate concrete and overlay concrete) for
each removal depth level case, the average elastic shear stress at the bond interface at the
maximum load and the stiffness change showed a dissimilar pattern compared to the average
load values.
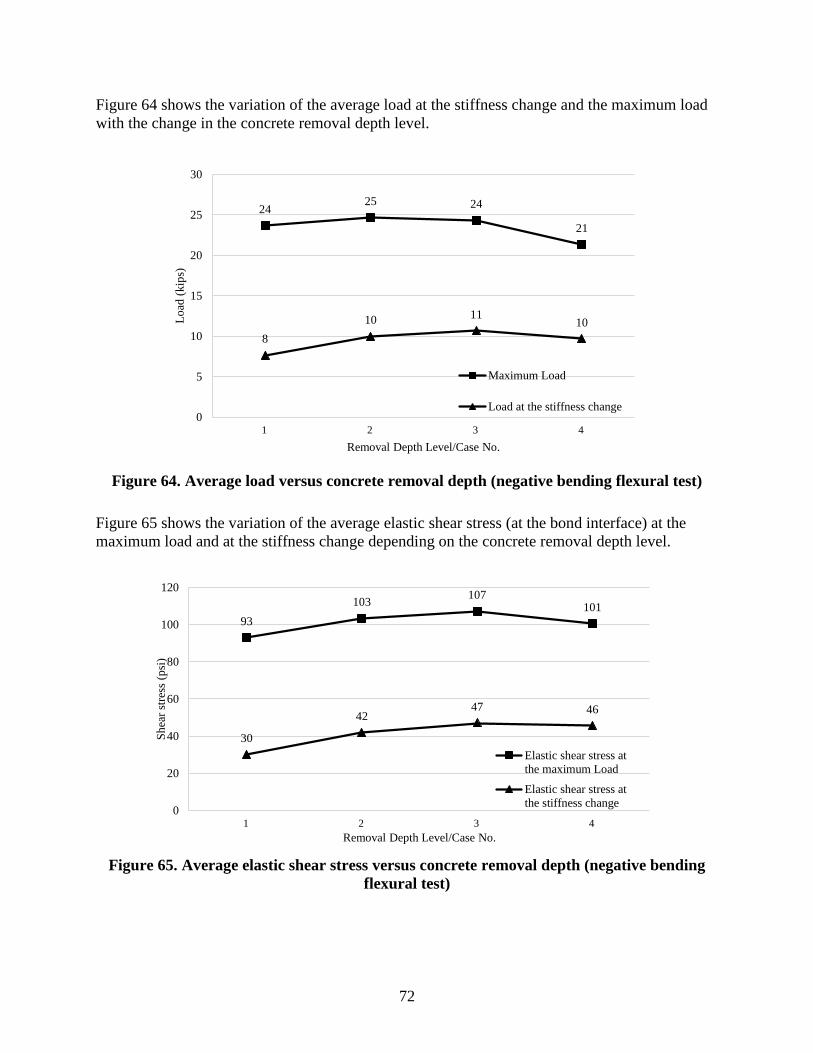
72
Figure 64 shows the variation of the average load at the stiffness change and the maximum load
with the change in the concrete removal depth level.
Figure 64. Average load versus concrete removal depth (negative bending flexural test)
Figure 65 shows the variation of the average elastic shear stress (at the bond interface) at the
maximum load and at the stiffness change depending on the concrete removal depth level.
Figure 65. Average elastic shear stress versus concrete removal depth (negative bending
flexural test)
24 25 24
21
8
10 11 10
0
5
10
15
20
25
30
1 2 3 4
Lo
ad (
kip
s)
Removal Depth Level/Case No.
Maximum Load
Load at the stiffness change
93
103 107
101
30
42 47 46
0
20
40
60
80
100
120
1 2 3 4
Sh
ear
stre
ss (
psi
)
Removal Depth Level/Case No.
Elastic shear stress at
the maximum Load
Elastic shear stress at
the stiffness change
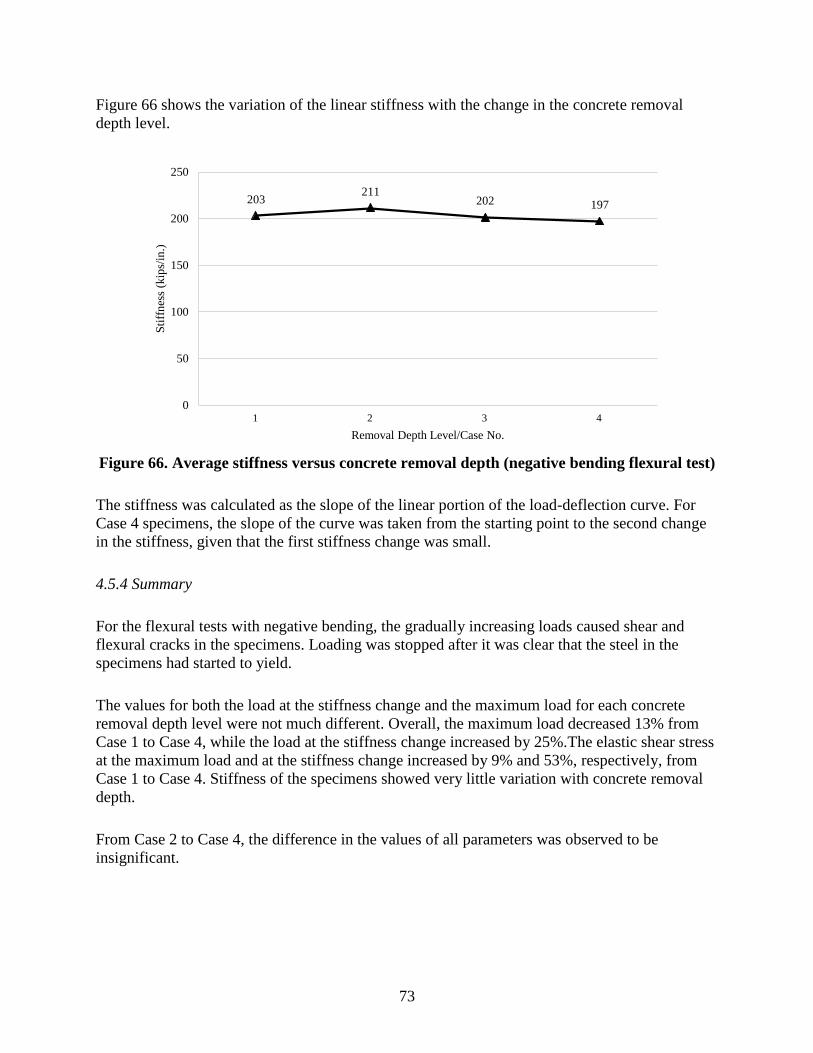
73
Figure 66 shows the variation of the linear stiffness with the change in the concrete removal
depth level.
Figure 66. Average stiffness versus concrete removal depth (negative bending flexural test)
The stiffness was calculated as the slope of the linear portion of the load-deflection curve. For
Case 4 specimens, the slope of the curve was taken from the starting point to the second change
in the stiffness, given that the first stiffness change was small.
4.5.4 Summary
For the flexural tests with negative bending, the gradually increasing loads caused shear and
flexural cracks in the specimens. Loading was stopped after it was clear that the steel in the
specimens had started to yield.
The values for both the load at the stiffness change and the maximum load for each concrete
removal depth level were not much different. Overall, the maximum load decreased 13% from
Case 1 to Case 4, while the load at the stiffness change increased by 25%.The elastic shear stress
at the maximum load and at the stiffness change increased by 9% and 53%, respectively, from
Case 1 to Case 4. Stiffness of the specimens showed very little variation with concrete removal
depth.
From Case 2 to Case 4, the difference in the values of all parameters was observed to be
insignificant.
203 211
202 197
0
50
100
150
200
250
1 2 3 4
Sti
ffn
ess
(kip
s/in
.)
Removal Depth Level/Case No.
74
5. CONCLUSIONS AND RECOMMENDATIONS
5.1 Summary
Overlay construction is a vital part of bridge preservation and accelerating overlay construction
is important in re-opening bridges to traffic as quickly as possible. To achieve the goal of
providing information that might reduce overlay construction time, the researchers performed
three major tasks.
Given that curing the overlay concrete consumes a major part of the overlay construction time,
for the first task, a variety of the latest fast-curing concrete mixes were studied based on their
performance for overlays and the curing time.
For the second task, the researchers observed and documented an ongoing overlay construction
site. Upon investigation, various means were noticed that could lead to a reduction in
construction time.
Finally, a vital part of this project was laboratory testing to study the influence of concrete
removal on the overlay bond and performance. Four different laboratory tests were performed
with four different concrete removal depth levels to determine if the change in depth of overlay
concrete affects the bond strength between the substrate concrete and the new overlay concrete.
5.2 Results and Conclusions
The literature review on fast-curing concrete mixes led to a conclusion that CTS Rapid Set
Low-P cement mixes, 4×4 concrete mix, polyester polymer concrete, and very-early-strength
LMC may be possible substitutes for Class HPC-O and O concrete, and therefore could be used
for overlay construction to reduce curing time without having any loss in the necessary strength
requirements.
Investigation of the ongoing overlay construction project concluded that some minor
improvements such as use of additional machinery like sandblasting setup, jackhammers (and the
workers using them), and dump trucks could lead to time savings.
Based on the laboratory testing to determine the required removal depth level, the following
results were found.
For the pull-off test, the load at failure and the tensile bond stress at failure showed slight
variation with respect to the concrete removal depth. This suggests that the removal of the
additional sound substrate concrete beyond half the diameter of the reinforcing steel bar
would not have a significant effect on the bond strength.
75
Push-out test results showed that the concrete removal depth Case 1 showed significantly
lower bond strength than the other removal depths. The load and the shear stress values at the
stiffness change for the concrete removal depths Case 2 through 4 showed insignificant
variation. The stiffness values for all cases showed very small variation. The load and the
shear stress at a stiffness change (i.e., crack development) are important parameters when it
comes to ensuring long-lasting structural performance of a bridge deck. The push-out test
indicates that the removal of the additional sound concrete below half the diameter of the
reinforcing steel bar would not result in a significant difference in the bond strength.
Results from flexural tests with positive bending showed that the maximum load, stiffness,
and elastic shear stress at the bond interface were slightly different for different concrete
removal depths. The results show that Case 2 provides sufficient bond strength and no
additional bond strength is achieved with additional sound concrete removal.
For the flexural tests with negative bending, the load at stiffness change, maximum load, and
elastic shear stresses showed relatively small change in values with changes in concrete
removal depths. This shows that the removal of sound concrete below half the diameter of
the reinforcing steel bar would not lead to a significant increase in bond strength.
Overall, from all of the laboratory tests, it can be concluded that the removal of the substrate
concrete to half the diameter of the reinforcing steel bar provides as much bond strength as
removing additional sound concrete. If unsound substrate concrete exists below half the diameter
of the reinforcing steel bar, removing only the unsound concrete would likely be sufficient.
5.3 Recommendations
The following recommendations are suggested based on the observations and results of this
project:
CTS Rapid Set Low-P cement mixes, 4×4 concrete mix, polyester polymer concrete, and
very-early-strength LMC should be further evaluated for use as overlay materials.
During overlay construction, additional machinery like sandblasting equipment,
jackhammers (and the workers using them), and dump trucks could be provided at times
when it would lead to time savings. Contractors could possibly look at potential means and
methods to help minimize closure time.
During the removal of the unsound substrate concrete on an actual bridge, a trial attempt
should be made with the following removal conditions:
If unsound concrete exists to or above half the diameter of the reinforcing steel bar, all
concrete should be removed to half the diameter of the reinforcing steel bar.
76
If unsound concrete exists below half the diameter of the reinforcing steel bar, all the
unsound concrete should be removed until the depth to which it exists, but no additional
sound concrete should be removed.
The performance of overlays should be evaluated over a period of years following
installation.
77
REFERENCES
Anderson, Keith W., Jeff S. Uhlmeyer, Mark Russell, Chad Simonson, Kevin Littleton, Dan
McKernan, and Jim Weston. 2013, Polyester Polymer Concrete Overlay. Washington
State Department of Transportation (WSDOT) Materials Laboratory. Olympia, WA.
BASF. 2011. 4×4™ Concrete System Product Information. BASF Corporation Admixture
Systems Master Builders. Cleveland, OH.
———. 2016 BASF 4×4 Concrete for Strength-on-Demand. BASF Corporation. Cleveland, OH.
www.master-builders-solutions.basf.us/en-us/functions-and-applications/producing-
concrete/4x4-concrete-for-strength-on-demand.
CTS Cement. 2014. Rapid Set®
Low-P™ Cement Datasheet. CTS Cement Manufacturing Corp.
Cypress, CA. www.ctscement.com/wp-content/uploads/2014/02/LOW-
P_CEMENT_Datasheet_DS_016_EN_3.pdf.
———. 2016. Rapid Set® Low-P Cement™. www.ctscement.com/low-p-cement/.
Iowa DOT. 2012. Standard Specifications for Highway and Bridge Construction. Series 2012.
Iowa Department of Transportation. Ames, IA.
www.iowadot.gov/specifications/Specificationsseries2012.pdf.
Kosmatka, Steven H., Beatrix Kerkhoff, and William C. Panarese. 2003. Design and Control of
Concrete Mixtures: The Guide to Applications, Methods, and Materials. 14th Edition.
Portland Cement Association, Skokie, IL.
Maggenti, Ric. 2001. Polyester Concrete in Bridge Deck Overlays Report. California
Department of Transportation (Caltrans) District 4 Bay Toll Bridge Program.
Meyers, Rod. n.d. High Early Strength Portland Cement Concrete for Rapid Concrete Repair.
4×4™ Concrete Master Builders. www.virginiadot.org/business/resources/bu-mat-05vcc-
rmeyer.pdf.
Nmai, Charles. 2016. Personal communication. BASF Corporation Admixture Systems.
Cleveland, OH. May 2, 2016.
Oberoi, Rajesh. 2012. Polyester Polymer Concrete. DDR Global Infrastructure Pvt. Ltd.
Gurgaon, Haryana, India.
Ohio DOT. 2007. High Early Strength Concrete Overlays. Ohio Department of Transportation
Office of Materials Management Cement & Concrete Section.
Ramey, G. Ed and Russell S. Oliver. 1998. Rapid Rehabilitation/Replacement of Bridge Decks.
Highway Research Center, Harbert Engineering Center, Auburn University for the
Alabama Department of Transportation.
Smith, Karl, Raul Alarcon, and Doran Glauz. 2001. Portland Cement Based Fast-Setting
Concrete Demonstration. California Department of Transportation (Caltrans) Materials
Engineering and Testing Services Office of Rigid Pavements and Structural Concrete.
Sacramento, CA.
Sprinkel, Michael. 1988. High early strength latex modified concrete. The Aberdeen Group. UK.
Sprinkel, Michael M. 1998. Very-Early-Strength Latex-Modified Concrete Overlay. Virginia
Transportation Research Council. Charlottesville, VA.
———. 2011. LMC Overlays for Bridge Deck Preservation. 2011 Southeast Bridge Preservation
Partnership Meeting, Raleigh, NC, April 13-15, 2011.