Embed Size (px)
Citation preview

Investigation of the application of remote sensing to estimate coverage of surface exposed (floating) filamentous algae in the
Coorong, South Australia
Hannah Auricht, Kenneth Clarke and Michelle Waycott
Goyder Institute for Water Research Technical Report Series No. 19/34
www.goyderinstitute.org

Goyder Institute for Water Research Technical Report Series ISSN: 1839-2725
The Goyder Institute for Water Research is a partnership between the South Australian Government through the Department for Environment and Water, CSIRO, Flinders University, the University of Adelaide, the University of South Australia and the International Centre of Excellence in Water Resource Management. The Institute enhances the South Australian Government’s capacity to develop and deliver science-based policy solutions in water management. It brings together the best scientists and researchers across Australia to provide expert and independent scientific advice to inform good government water policy and identify future threats and opportunities to water security.
This program is part of the Department for Environment and Water’s Healthy Coorong Healthy Basin Program, which is jointly funded by the Australian and South Australian governments.
Enquires should be addressed to: Goyder Institute for Water Research Level 4, 33 King William Street Adelaide, SA 5000 tel: 08 8236 5200 e-mail: [email protected]
Citation Auricht, H., Clarke K. and Waycott M. (2019) Investigation of the application of remote sensing to estimate coverage of surface exposed (floating) filamentous algae in the Coorong, South Australia. Goyder Institute for Water Research Technical Report Series No. 19/34.
© Crown in right of the State of South Australia, Department for Environment and Water.
Disclaimer This report has been prepared by the Goyder Institute for Water Research and contains independent scientific/technical advice to inform government decision-making. The independent findings and recommendations of this report are subject to separate and further consideration and decision-making processes and do not necessarily represent the views of the Australian Government or the South Australian Department for Environment and Water.

Remote sensing to estimate coverage of surface exposed (floating) filamentous algae in the Coorong | i
Contents Executive summary....................................................................................................................................... iii
Acknowledgments ........................................................................................................................................ iv
1 Introduction ............................................................................................................................................. 1
2 Methods .................................................................................................................................................. 3
2.1 Satellite imagery .............................................................................................................................. 3
2.2 Mapping inundation extents with Water Observations from Space layers .................................... 3
2.3 Production of Normalised Difference Vegetation Index (NDVI) and Floating Algae Index (FAI) . 3
3 Results ..................................................................................................................................................... 6
3.1 Visual analysis of raw imagery ......................................................................................................... 7
4 Discussion .............................................................................................................................................. 33
5 References ............................................................................................................................................. 35

ii | Remote sensing to estimate coverage of surface exposed (floating) filamentous algae in the Coorong
Figures Figure 1: Photo showing filamentous algae mats at Parnka Point (aka McCallum point). The photo was taken in November 2016, facing North, at a time when mats were extensive. On the ground and at this angle, algae mats appear large and are easily distinguished from open water. .......................................... 1
Figure 2: Digital elevation map of the Coorong. .......................................................................................... 5
Figure 3: Landsat 8 level 1 imagery as a false colour (red gun; NIR, green gun; red, blue gun; green) composite over the mid-region of the Coorong near Parnka Point on 17th October 2017. ......................... 7
Figure 4: PlanetScope false colour composite image (red gun; NIR, green gun; red, blue gun; green) over Parnka Point in the Coorong on 17th October 2017. ................................................................................... 8
Figure 5: Algae classified from NDVI for whole Coorong, 11th December 2017. ........................................ 9
Figure 6: Algae classified from NDVI for whole Coorong, 11th October 2018. .......................................... 10
Figure 7: Algae classified from NDVI, 8th October 2017. ............................................................................ 11
Figure 8: Algae classified from NDVI, 17th October 2017. .......................................................................... 12
Figure 9: Algae classified from NDVI, 9th November 2017. ........................................................................ 13
Figure 10: Algae classified from NDVI, 11th December 2017. ..................................................................... 14
Figure 11: Algae classified from NDVI, 18th September 2018..................................................................... 15
Figure 12: Algae classified from NDVI, 25th September 2018..................................................................... 16
Figure 13: Algae classified from NDVI, 11th October 2018. ........................................................................ 17
Figure 14: Algae classified from NDVI, 20th October 2018. ........................................................................ 18
Figure 15: Algae classified from NDVI, 5th November 2018. ...................................................................... 19
Figure 16: Algae classified from NDVI, 23rd December 2018. ..................................................................... 20
Figure 17: Algae classified from FAI for whole Coorong, 11th December 2017. ......................................... 21
Figure 18: Algae classified from FAI for whole Coorong, 11th October 2018. ............................................ 22
Figure 19: Algae classified from FAI, 8th October 2017. ............................................................................. 23
Figure 20: Algae classified from FAI, 17th October 2017. ........................................................................... 24
Figure 21: Algae classified from FAI, 9th November 2017. ......................................................................... 25
Figure 22: Algae classified from FAI, 11th December 2017. ........................................................................ 26
Figure 23: Algae classified from FAI, 18th September 2018. ....................................................................... 27
Figure 24: Algae classified from FAI, 25th September 2018. ....................................................................... 28
Figure 25: Algae classified from FAI, 11th October 2018. ........................................................................... 29
Figure 26: Algae classified from FAI, 20th October 2018. ........................................................................... 30
Figure 27: Algae classified from FAI, 5th November 2018. ......................................................................... 31
Figure 28: Algae classified from FAI, 23rd December 2018. ........................................................................ 32

Remote sensing to estimate coverage of surface exposed (floating) filamentous algae in the Coorong | iii
Executive summary
Background
The Coorong is widely regarded to be the most important waterbird wetland in the Murray-Darling Basin. It is a unique wetland that provides important ecological, cultural, social and economic values at local, national and international scales. In recent years, filamentous algae has been observed to bloom and form extensive mats, covering large areas of the southern and northern lagoons of the Coorong at the water’s surface, posing a risk to aquatic life. This study explored the ability to detect the distribution, scale, impact and potential to hindcast the presence of mat-forming filamentous algal blooms which reach the surface of Coorong waters, using remote sensing techniques. Mapping floating filamentous mats would enable managers to establish their spatial and temporal presence across the length of the Coorong. In particular, the aim of this study was to identify appropriate methods for hindcasting and mapping of filamentous algae mats, including methods which have the potential to establish the intensity of these blooms since the end of the millennium drought.
The focal area for this study was the shallower mid-section of the Coorong (near Parnka point) as it is in a position of overlap where the temporal frequency of Landsat satellite imagery is on average every 8 days (compared to the usual 16 days). Normalised Difference Vegetation Index (NDVI) and Floating Algae Index (FAI) products were produced from Landsat imagery. Daily Water Observations from Space (WOfS) were also used to constrain the mapping of algae to areas which were inundated, and reduce the risk of mapping exposed wet or dry sand as algae mat. Maps showing NDVI and FAI were produced for 10 relatively cloud-free dates, falling between September and December of 2017 and 2018.
Outcomes
Overall, the observed spatial and temporal patterns of mapped algae appear to coincide with the expected spatial and temporal behaviours of floating algae mats. The values for both indices (NDVI and FAI) increase from September to December in 2017 and 2018 and are highest in shallower areas (e.g. the north-west of Parnka Point), consistent with field observations. However, these results must be interpreted with caution because of the absence of high-quality contemporaneous field data for accuracy assessment, and the potential for confusion with other cover types due to the spectrally complex location.
Recommendations
Further refinement of the FAI and NDVI methods is required and investigation of other methods, possibly based on the temporal phenomenology of algae mat formation is encouraged. Investigation of the application of Sentinel-2 imagery (which has a high spatial and temporal resolution) and the use of other indices or ratios (such as the Normalised Difference Chlorophyll Index (NDCI)) are other possible approaches worth considering. The use of Landsat imagery to hindcast presence and extent of algae mats should be sufficient for gaining an understanding of bloom intensity pre and post- millennium drought. However, all future remote sensing methods development (FAI/NDVI/or other from Landsat/Sentinel-2 or other sources) should integrate field data collection contemporaneous with satellite imagery acquisitions. This would reduce uncertainty and help to further develop accuracy of methods.
These results provide evidence of significant potential to develop an accurate measure of floating algae mat extent from remote sensing data. If development is successful, this method could be applied to new and historic remote sensing data which would enable quantification of the extent and persistence of new blooms as well as investigation of the historical spatial dynamics of mat forming algae in this region. Knowledge gained from these investigations may also assist in the development of early warning methods aimed at initiating management intervention to mitigate the formation of algal mat blooms.

iv | Remote sensing to estimate coverage of surface exposed (floating) filamentous algae in the Coorong
Acknowledgments This 2019 research was commissioned and funded from the Healthy Coorong, Healthy Basin Program of the South Australian Department for Environment and Water, which is jointly funded by the Australian and South Australian Governments.
We wish to acknowledge support from the Department for Environment and Water (DEW) Healthy Coorong Healthy Basin (HCHB) team, particularly Jody O’Connor, Bec Quin, Matt Gibbs and for contributions made by other HCHB leadership team members for discussion leading to improving the scope of this work. We thank Emma O’Loughlin for supporting additional field work and site observations. We thank David Paton and his team for their ongoing willingness to share data and to work to improve the health of the Coorong. We would also like to thank Geoff Gallasch, President of the Coorong Shack Owners Association for valuable discussions and insight into the changing nature of the Coorong waters over both longer and shorter time frames. Valuable insights were provided through input from individuals and groups at community consultation meetings coordinated by DEW for the HCHB and Project Coorong initiative.

Remote sensing to estimate coverage of surface exposed (floating) filamentous algae in the Coorong | 1
1 Introduction The Coorong is an iconic wetland in South Australia was listed under the Ramsar Convention in 1985, primarily for its importance to a wide diversity of waterbirds. The Coorong has experienced extensive filamentous algal blooms in recent years (Collier et al. 2017). These algal blooms are hypothesised to result from degraded water quality (Brookes et al. 2018) and are comprised of three regionally common, native, green algal species, Ulva paradoxa with Cladophora sp. and Rhizoclonium sp. These blooms form extensive, visible surface mats in the late austral spring/early summer, blocking light from the surface and smothering ecologically important seagrass (Ruppia tuberosa).
Filamentous algae have been observed to begin appearing in the water column throughout the Coorong in August or September, and form extensive mats at the surface (in areas larger than 100 m2) by late October/early November. Ad hoc in-field observations and local knowledge suggest that in most years these filamentous algae mats have usually senesced, died and degraded by mid-late December, although they have been observed as late as February. Vast expanses of filamentous algae mats were observed in November 2016 (Figure 1).
Figure 1: Photo showing filamentous algae mats at Parnka Point (aka McCallum point) (photographer Michelle Waycott). The photo was taken in November 2016, facing North, at a time when mats were extensive. On the ground and at this angle, algae mats appear large and are easily distinguished from open water.
There is current evidence that filamentous algal blooms play a negative role to the health of the Southern Coorong, including the prevention of a number of crucial ecological functions. For example, Ruppia tuberosa is a keystone species in the Coorong which is partially responsible for maintaining water quality, trapping sediment and providing habitat for invertebrates and fish, and food for waterbirds (Collier et al. 2017). Mechanical tangling of Ruppia tuberosa seagrass’ flowering structures in the algae mats leads to their dislodgement and incomplete seed set. Once dislodged, they form large matted areas of dead and dying algae biomass, which are being seen to result in black ooze and anoxic sediments (Brookes et al. 2018).

2 | Remote sensing to estimate coverage of surface exposed (floating) filamentous algae in the Coorong
Although these algae mats have been detected in the Coorong environment for some time, there has been anecdotal evidence that these large-scale blooms are more dominant in the southern Coorong since the end of the millennium drought. It is crucial to better understand the distribution, scale and impact of these blooms to assist with management moving forward. Exploring our ability to hindcast such events has potential to provide managers of the Coorong with the ability to predict future events, improving the condition of the Coorong ecosystem.
The research approach of this study utilised two available remote sensing data sources and investigated the size and extent of filamentous algae mats and their apparent contrast to clear water from observation on the ground. This work provides an initial investigation into the application of satellite imagery for mapping algae mats that reach the water’s surface, where they may be differentiated from water column algae (both filamentous and phytoplankton).
Determining an appropriate method to map and monitor the occurrence and extent of algae mats has the potential to assist managers in identifying when, and under what conditions these mats begin to form. This knowledge can inform the implementation of interventive actions, aimed at preventing or reducing detrimental impacts to water quality and ecological function across the Coorong.

Remote sensing to estimate coverage of surface exposed (floating) filamentous algae in the Coorong | 3
2 Methods
2.1 Satellite imagery
Landsat 8 Operational Land Imager (OLI) (as cloud free as possible) scenes were acquired over the Coorong region of South Australia for September – December 2017 and 2018. This imagery was downloaded using Earth Explorer and the bulk download application developed by the United States Geological Society (USGS) (https://earthexplorer.usgs.gov/). Landsat 8 imagery has a spatial resolution of approximately 30 m and a revisit time of 16 days. However, the mid-section of the Coorong, near Parnka Point, is in an area of overlap between neighbouring Landsat paths, meaning as the satellite orbits it captures imagery over this area at a higher temporal frequency.
To supplement the limited spatial resolution of the Landsat imagery, 4 band PlanetScope imagery was also acquired for the Coorong’s mid-region surrounding Parnka Point. PlanetScope imagery can be accessed and downloaded for free for academic investigations via their explorer tool (https://www.planet.com/explorer/) and has a finer spatial resolution than Landsat (3 m).
2.2 Mapping inundation extents with Water Observations from Space layers
Water Observations from Space layers (WOfS) were obtained from Digital Earth Australia (DEA) via https://data.dea.ga.gov.au. WOfS is a remote sensing product which measures inundation extent and frequency across Australia, and is produced from Landsat imagery by Geoscience Australia at a resolution of 25 m. A WOfS layer was downloaded for each date corresponding to the already collected Landsat imagery and used to constrain further image processing to inundated areas. These layers also enabled pixels affected by cloud cover or cloud shadow to be masked from the final outputs. The WOfS ‘filtered summary’ layer, a measure of long-term inundation frequency, was also downloaded and used to indicate the full inundation extent of the Coorong by constraining the layer to areas classified as ‘wet’ or inundated more than one percent of the time. This captures all areas of the Coorong that are prone to inundation (i.e., inundated more than one percent of the time) and minimises the impact of any potential rare misclassifications.
A digital elevation model of the Coorong was also obtained from the Department of Environment and Water and used to indicate shallow areas where reflectance from the benthos (sand) may be more likely to contribute to higher reflectance and therefore influence spectral analysis and NDVI products.
2.3 Production of Normalised Difference Vegetation Index (NDVI) and Floating Algae Index (FAI)
Due to the urgency of this investigation, using a method which could be applied in a timely manner to map filamentous algae mats in the Coorong was preferred. Acolite, developed by the Royal Belgian Institute of Natural Sciences, is a tool is for processing Landsat (5/7/8) and Sentinel-2 (A/B) imagery, and can be downloaded and installed via: https://github.com/acolite/acolite. One of the key features of this tool is that it is simple to use to produce a variety of algorithm products from satellite imagery. It can also perform the necessary atmospheric correction required for remote sensing over water bodies. In addition to atmospheric correction, the Acolite tool was also used to produce Normalised Difference Vegetation Indices (NDVI) and floating algae indices (FAI) for each Landsat image across the smaller mid-region near Parnka Point. Two cloud free dates (one from 2017 and one from 2018) were also selected to produce whole of Coorong NDVI and FAI maps.
The NDVI has long been used to analyse satellite imagery to investigate the presence and ‘vigour’ of vegetation (Myneni et al. 1995; Sellers 1985, 1987). It is based on the contrast between red and near infra-red reflectance (NIR). There is a large difference in red and near infra-red reflectance for green vegetation

4 | Remote sensing to estimate coverage of surface exposed (floating) filamentous algae in the Coorong
and water, and a smaller difference for other cover types. Output values range between -1 and 1 with typical values of 0.6 – 0.8 for strongly growing vegetation with high chlorophyll concentrations; 0.1 – 0.2 for dead vegetation or dry soil; and values less than -0.2 for open water. NDVI has been applied to satellite data in previous studies to detect floating algae in open oceans (e.g. Hu and He (2008), Prangsma and Roozekrans (1989), Hu et al. (2017); Kahru et al. (1993)). For this study, it was assumed that algae mats (which are expected to contain substantial amounts of chlorophyll) floating on the surface of Coorong waters would have greater NDVI values than the surrounding water. To expand on our previous explanation, this is because water typically has very low reflectance (or high absorption) in the NIR and red bands compared to vegetation, and consequently negative NDVI values. Conversely, green vegetation (including algae) typically has higher reflectance in the near and short-wave infrared bands. However, in a spectrally complex, shallow, eutrophic system such as the Coorong, higher NDVI could also result from exceptionally high chlorophyll-a in the water column, exposed sandy areas, very shallow seagrass meadows (with leaves at the water surface), other emergent vegetation, or beached algal mats. For the purposes of this investigation, NDVI values ≥ -0.15 were classified as floating or beached algae, while values < -0.15 were classified as open water. In the absence of field data this threshold was selected based on expert knowledge, local geographic knowledge and interpretation of the imagery.
In addition to NDVI, the floating algae index (FAI) developed by Hu (2009) was also calculated on each Landsat date. The FAI can be described as the difference between reflectance at vegetation’s “red edge” (the rapid increase in reflectance from the red to the NIR) and a linear baseline between the red band and short-wave infrared band. FAI has proven to have some advantages over NDVI for the purpose of detecting floating algae in coastal and open ocean waters. Namely, FAI is less sensitive to atmospheric and environmental observing conditions (i.e. aerosol type and thickness, solar/viewing geometry and sun-glint) and can ‘see’ though thin cloud cover (Hu 2009). FAI thresholds in this study were based on the work of Hu et al. (2010). FAI values ≥ 0.02 were classified as floating or beached algae (100% algae cover), while values < 0.02 were classified as open water. Using this threshold, areas which are still mostly covered by algae (e.g. 50 – 99%) but have <100% algae cover, could be classified as water. These classifications are therefore most likely to be a conservative estimate.

Remote sensing to estimate coverage of surface exposed (floating) filamentous algae in the Coorong | 5
Figure 2: Digital elevation map of the Coorong.

6 | Remote sensing to estimate coverage of surface exposed (floating) filamentous algae in the Coorong
3 Results It was important to determine whether filamentous algae mats could be distinguished from background green waters in raw imagery. Initial visual interpretation of false colour Landsat imagery (see Figure 3) revealed some areas elevated in NIR in the water. Visual investigation of the higher resolution (3 m) PlanetScope imagery also revealed similar areas with higher NIR reflectance (refer Figure 4). This is unlikely to occur unless the satellite view of the water surface is obstructed by something containing significant chlorophyll, and is therefore a likely indicator of the presence of large areas of algae mats. However, without the contemporaneous field data (originally planned to coincide with this work, but which could not be conducted due to logistical reasons of seasonal timing) it is impossible to be certain that the higher NIR values were due to algae mats or to derive any specific relationship of near infrared reflectance and algae mat cover, regardless of imagery resolution.
Despite the lack of certainty in identifying algae mats from raw imagery, NDVI and FAI products were selected because they have been shown to function relatively well in spectrally complex environments, such as the Coorong. NDVI maps also show more pixels are classified as algae compared to the same dates as FAI maps, however this is a function of threshold selection for each product. Both the NDVI and FAI maps (refer Figure
5 to Figure 28) indicate that algae may be present in each image date, in particular in shallower regions to the north west of Parnka Point (see Figure 2 for digital elevation model of the Coorong). The most pixels classified above the NDVI and FAI thresholds (classed as floating algae) occur in late October and December. Extensive cloud cover during November periods limited the ability to estimate algae cover during this period (Figures 9, 15, 21, 26 and 27). However, for November maps, in areas which are not masked by cloud, there does seem to be higher values of NDVI and FAI compared to September and early October maps (Figures 6, 11, 12, 19, 23 and 24). These initial findings are consistent with field observations of the occurrence of algae mats (Waycott, M. 2019, the University of Adelaide, pers. comm.) and suggest that these remote sensing techniques are likely to be appropriate for mapping and hindcasting of floating filamentous algae mats in the Coorong.

Remote sensing to estimate coverage of surface exposed (floating) filamentous algae in the Coorong | 7
3.1 Visual analysis of raw imagery
Figure 3: Landsat 8 level 1 imagery as a false colour (red gun; NIR, green gun; red, blue gun; green) composite over the mid-region of the Coorong near Parnka Point on 17th October 2017.Green vegetation has higher reflectance in the NIR and appears a bright red in false colour composite imagery. It is expected that floating algae would have high NIR reflectance compared to water, submerged vegetation or chlorophyll-a in the water column. The pinkish-purple areas in the water (e.g. the areas highlighted in yellow polygons) suggest the presence of floating filamentous algae mats.

8 | Remote sensing to estimate coverage of surface exposed (floating) filamentous algae in the Coorong
Figure 4: PlanetScope false colour composite image (red gun; NIR, green gun; red, blue gun; green) over Parnka Point in the Coorong on 17th October 2017. Green vegetation has higher reflectance in the NIR and appears a bright red in false colour composite imagery. It is expected that floating algae would have high NIR reflectance compared to water, submerged vegetation or chlorophyll-a in the water column. The pink areas in the water (e.g. areas within yellow polygons) suggest the presence of floating or beached filamentous algae mats.
Remote sensing to estimate coverage of surface exposed (floating) filamentous algae in the Coorong | 9
3.1.1 NDVI MAPS – WHOLE OF COORONG
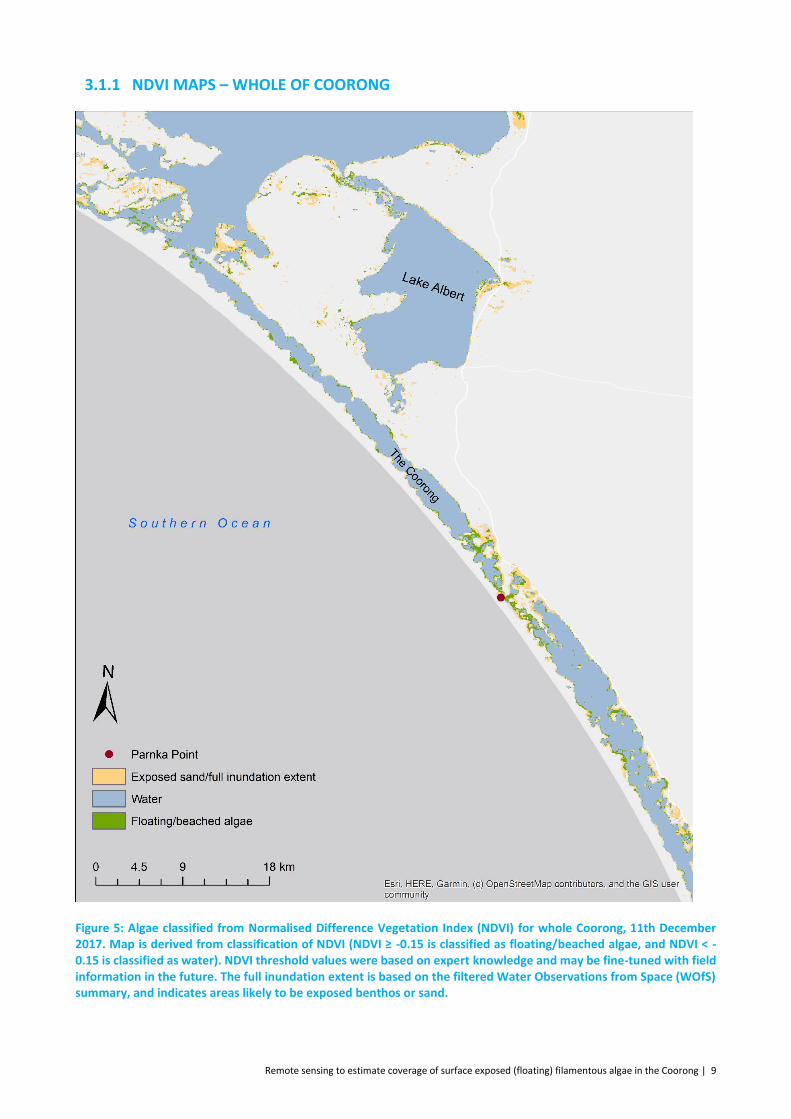
Figure 5: Algae classified from Normalised Difference Vegetation Index (NDVI) for whole Coorong, 11th December 2017. Map is derived from classification of NDVI (NDVI ≥ -0.15 is classified as floating/beached algae, and NDVI < -0.15 is classified as water). NDVI threshold values were based on expert knowledge and may be fine-tuned with field information in the future. The full inundation extent is based on the filtered Water Observations from Space (WOfS) summary, and indicates areas likely to be exposed benthos or sand.

10 | Remote sensing to estimate coverage of surface exposed (floating) filamentous algae in the Coorong
Figure 6: Algae classified from Normalised Difference Vegetation Index (NDVI) for whole Coorong, 11th October 2018. Map is derived from classification of NDVI (NDVI ≥ -0.15 is classified as floating/beached algae, and NDVI < -0.15 is classified as water). NDVI threshold values were based on expert knowledge, and may be fine-tuned with field information in the future. The full inundation extent is based on the filtered Water Observations from Space (WOfS) summary, and indicates areas likely to be exposed benthos or sand.

Remote sensing to estimate coverage of surface exposed (floating) filamentous algae in the Coorong | 11
3.1.2 NDVI FOCUS AREA – PARNKA POINT
Figure 7: Algae classified from Normalised Difference Vegetation Index (NDVI), 8th October 2017. Map is derived from classification of NDVI (NDVI ≥ -0.15 is classified as floating/beached algae, and NDVI < -0.15 is classified as water). NDVI threshold values were based on expert knowledge, and may be fine-tuned with field information in the future. The full inundation extent is based on the filtered Water Observations from Space (WOfS) summary, and indicates areas likely to be exposed benthos or sand.
12 | Remote sensing to estimate coverage of surface exposed (floating) filamentous algae in the Coorong
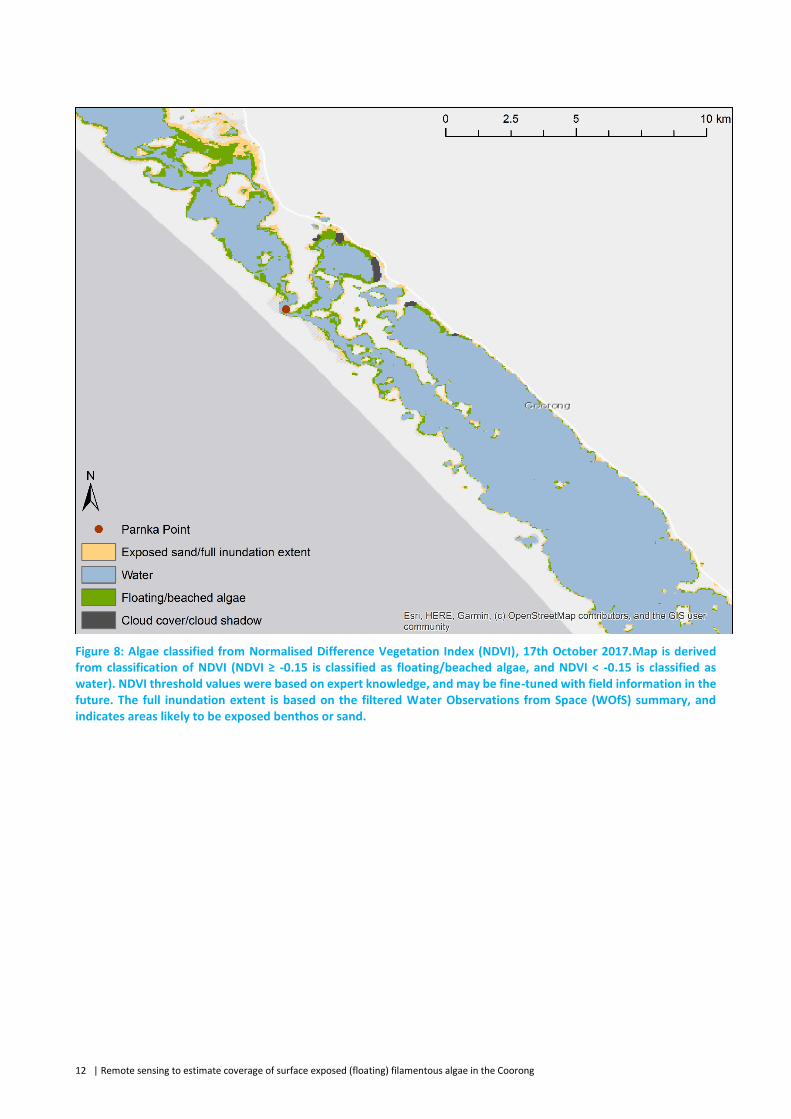
Figure 8: Algae classified from Normalised Difference Vegetation Index (NDVI), 17th October 2017.Map is derived from classification of NDVI (NDVI ≥ -0.15 is classified as floating/beached algae, and NDVI < -0.15 is classified as water). NDVI threshold values were based on expert knowledge, and may be fine-tuned with field information in the future. The full inundation extent is based on the filtered Water Observations from Space (WOfS) summary, and indicates areas likely to be exposed benthos or sand.

Remote sensing to estimate coverage of surface exposed (floating) filamentous algae in the Coorong | 13
Figure 9: Algae classified from Normalised Difference Vegetation Index (NDVI), 9th November 2017.Map is derived from classification of NDVI (NDVI ≥ -0.15 is classified as floating/beached algae, and NDVI < -0.15 is classified as water). NDVI threshold values were based on expert knowledge, and may be fine-tuned with field information in the future. The full inundation extent is based on the filtered Water Observations from Space (WOfS) summary, and indicates areas likely to be exposed benthos or sand.

14 | Remote sensing to estimate coverage of surface exposed (floating) filamentous algae in the Coorong
Figure 10: Algae classified from Normalised Difference Vegetation Index (NDVI), 11th December 2017.Map is derived from classification of NDVI (NDVI ≥ -0.15 is classified as floating/beached algae, and NDVI < -0.15 is classified as water). NDVI threshold values were based on expert knowledge, and may be fine-tuned with field information in the future. The full inundation extent is based on the filtered Water Observations from Space (WOfS) summary, and indicates areas likely to be exposed benthos or sand.

Remote sensing to estimate coverage of surface exposed (floating) filamentous algae in the Coorong | 15
Figure 11: Algae classified from Normalised Difference Vegetation Index (NDVI), 18th September 2018. Map is derived from classification of NDVI (NDVI ≥ -0.15 is classified as floating/beached algae, and NDVI < -0.15 is classified as water). NDVI threshold values were based on expert knowledge, and may be fine-tuned with field information in the future. The full inundation extent is based on the filtered Water Observations from Space (WOfS) summary, and indicates areas likely to be exposed benthos or sand.

16 | Remote sensing to estimate coverage of surface exposed (floating) filamentous algae in the Coorong
Figure 12: Algae classified from Normalised Difference Vegetation Index (NDVI), 25th September 2018. Map is derived from classification of NDVI (NDVI ≥ -0.15 is classified as floating/beached algae, and NDVI < -0.15 is classified as water). NDVI threshold values were based on expert knowledge, and may be fine-tuned with field information in the future. The full inundation extent is based on the filtered Water Observations from Space (WOfS) summary, and indicates areas likely to be exposed benthos or sand.

Remote sensing to estimate coverage of surface exposed (floating) filamentous algae in the Coorong | 17
Figure 13: Algae classified from Normalised Difference Vegetation Index (NDVI), 11th October 2018. Map is derived from classification of NDVI (NDVI ≥ -0.15 is classified as floating/beached algae, and NDVI < -0.15 is classified as water). NDVI threshold values were based on expert knowledge, and may be fine-tuned with field information in the future. The full inundation extent is based on the filtered Water Observations from Space (WOfS) summary, and indicates areas likely to be exposed benthos or sand.

18 | Remote sensing to estimate coverage of surface exposed (floating) filamentous algae in the Coorong
Figure 14: Algae classified from Normalised Difference Vegetation Index (NDVI), 20th October 2018. Map is derived from classification of NDVI (NDVI ≥ -0.15 is classified as floating/beached algae, and NDVI < -0.15 is classified as water). NDVI threshold values were based on expert knowledge, and may be fine-tuned with field information in the future. The full inundation extent is based on the filtered Water Observations from Space (WOfS) summary, and indicates areas likely to be exposed benthos or sand.

Remote sensing to estimate coverage of surface exposed (floating) filamentous algae in the Coorong | 19
Figure 15: Algae classified from Normalised Difference Vegetation Index (NDVI), 5th November 2018. Map is derived from classification of NDVI (NDVI ≥ -0.15 is classified as floating/beached algae, and NDVI < -0.15 is classified as water). NDVI threshold values were based on expert knowledge, and may be fine-tuned with field information in the future. The full inundation extent is based on the filtered Water Observations from Space (WOfS) summary, and indicates areas likely to be exposed benthos or sand.

20 | Remote sensing to estimate coverage of surface exposed (floating) filamentous algae in the Coorong
Figure 16: Algae classified from Normalised Difference Vegetation Index (NDVI), 23rd December 2018. Map is derived from classification of NDVI (NDVI ≥ -0.15 is classified as floating/beached algae, and NDVI < -0.15 is classified as water). NDVI threshold values were based on expert knowledge, and may be fine-tuned with field information in the future. The full inundation extent is based on the filtered Water Observations from Space (WOfS) summary, and indicates areas likely to be exposed benthos or sand.

Remote sensing to estimate coverage of surface exposed (floating) filamentous algae in the Coorong | 21
3.1.3 FAI MAPS – WHOLE OF COORONG
Figure 17: Algae classified from Floating Algae Index (FAI) for whole Coorong, 11th December 2017. Map is derived from classification of FAI (FAI ≥ 0.02 is classified as floating/beached algae, and FAI < 0.02 is classified as water). FAI threshold values were based on expert knowledge, and may be fine-tuned with field information in the future. The full inundation extent is based on the filtered Water Observations from Space (WOfS) summary, and indicates areas likely to be exposed benthos or sand.

22 | Remote sensing to estimate coverage of surface exposed (floating) filamentous algae in the Coorong
Figure 18: Algae classified from Floating Algae Index (FAI) for whole Coorong, 11th October 2018. Map is derived from classification of FAI (FAI ≥ 0.02 is classified as floating/beached algae, and FAI < 0.02 is classified as water). FAI threshold values were based on expert knowledge, and may be fine-tuned with field information in the future. The full inundation extent is based on the filtered Water Observations from Space (WOfS) summary, and indicates areas likely to be exposed benthos or sand.

Remote sensing to estimate coverage of surface exposed (floating) filamentous algae in the Coorong | 23
3.1.4 FAI FOCUS AREA – PARNKA POINT
Figure 19: Algae classified from Floating Algae Index (FAI), 8th October 2017. Map is derived from classification of FAI (FAI ≥ 0.02 is classified as floating/beached algae, and FAI < 0.02 is classified as water). FAI threshold values were based on expert knowledge, and may be fine-tuned with field information in the future. The full inundation extent is based on the filtered Water Observations from Space (WOfS) summary, and indicates areas likely to be exposed benthos or sand.

24 | Remote sensing to estimate coverage of surface exposed (floating) filamentous algae in the Coorong
Figure 20: Algae classified from Floating Algae Index (FAI), 17th October 2017. Map is derived from classification of FAI (FAI ≥ 0.02 is classified as floating/beached algae, and FAI < 0.02 is classified as water). FAI threshold values were based on expert knowledge, and may be fine-tuned with field information in the future. The full inundation extent is based on the filtered Water Observations from Space (WOfS) summary, and indicates areas likely to be exposed benthos or sand.

Remote sensing to estimate coverage of surface exposed (floating) filamentous algae in the Coorong | 25
Figure 21: Algae classified from Floating Algae Index (FAI), 9th November 2017. Map is derived from classification of FAI (FAI ≥ 0.02 is classified as floating/beached algae, and FAI < 0.02 is classified as water). FAI threshold values were based on expert knowledge, and may be fine-tuned with field information in the future. The full inundation extent is based on the filtered Water Observations from Space (WOfS) summary, and indicates areas likely to be exposed benthos or sand.

26 | Remote sensing to estimate coverage of surface exposed (floating) filamentous algae in the Coorong
Figure 22: Algae classified from Floating Algae Index (FAI), 11th December 2017.Map is derived from classification of FAI (FAI ≥ 0.02 is classified as floating/beached algae, and FAI < 0.02 is classified as water). FAI threshold values were based on expert knowledge, and may be fine-tuned with field information in the future. The full inundation extent is based on the filtered Water Observations from Space (WOfS) summary, and indicates areas likely to be exposed benthos or sand.

Remote sensing to estimate coverage of surface exposed (floating) filamentous algae in the Coorong | 27
Figure 23: Algae classified from Floating Algae Index (FAI), 18th September 2018.Map is derived from classification of FAI (FAI ≥ 0.02 is classified as floating/beached algae, and FAI < 0.02 is classified as water). FAI threshold values were based on expert knowledge, and may be fine-tuned with field information in the future. The full inundation extent is based on the filtered Water Observations from Space (WOfS) summary, and indicates areas likely to be exposed benthos or sand.

28 | Remote sensing to estimate coverage of surface exposed (floating) filamentous algae in the Coorong
Figure 24: Algae classified from Floating Algae Index (FAI), 25th September 2018. Map is derived from classification of FAI (FAI ≥ 0.02 is classified as floating/beached algae, and FAI < 0.02 is classified as water). FAI threshold values were based on expert knowledge, and may be fine-tuned with field information in the future. The full inundation extent is based on the filtered Water Observations from Space (WOfS) summary, and indicates areas likely to be exposed benthos or sand.

Remote sensing to estimate coverage of surface exposed (floating) filamentous algae in the Coorong | 29
Figure 25: Algae classified from Floating Algae Index (FAI), 11th October 2018. Map is derived from classification of FAI (FAI ≥ 0.02 is classified as floating/beached algae, and FAI < 0.02 is classified as water). FAI threshold values were based on expert knowledge, and may be fine-tuned with field information in the future. The full inundation extent is based on the filtered Water Observations from Space (WOfS) summary, and indicates areas likely to be exposed benthos or sand.

30 | Remote sensing to estimate coverage of surface exposed (floating) filamentous algae in the Coorong
Figure 26: Algae classified from Floating Algae Index (FAI), 20th October 2018. Map is derived from classification of FAI (FAI ≥ 0.02 is classified as floating/beached algae, and FAI < 0.02 is classified as water). FAI threshold values were based on expert knowledge, and may be fine-tuned with field information in the future. The full inundation extent is based on the filtered Water Observations from Space (WOfS) summary, and indicates areas likely to be exposed benthos or sand.
Remote sensing to estimate coverage of surface exposed (floating) filamentous algae in the Coorong | 31
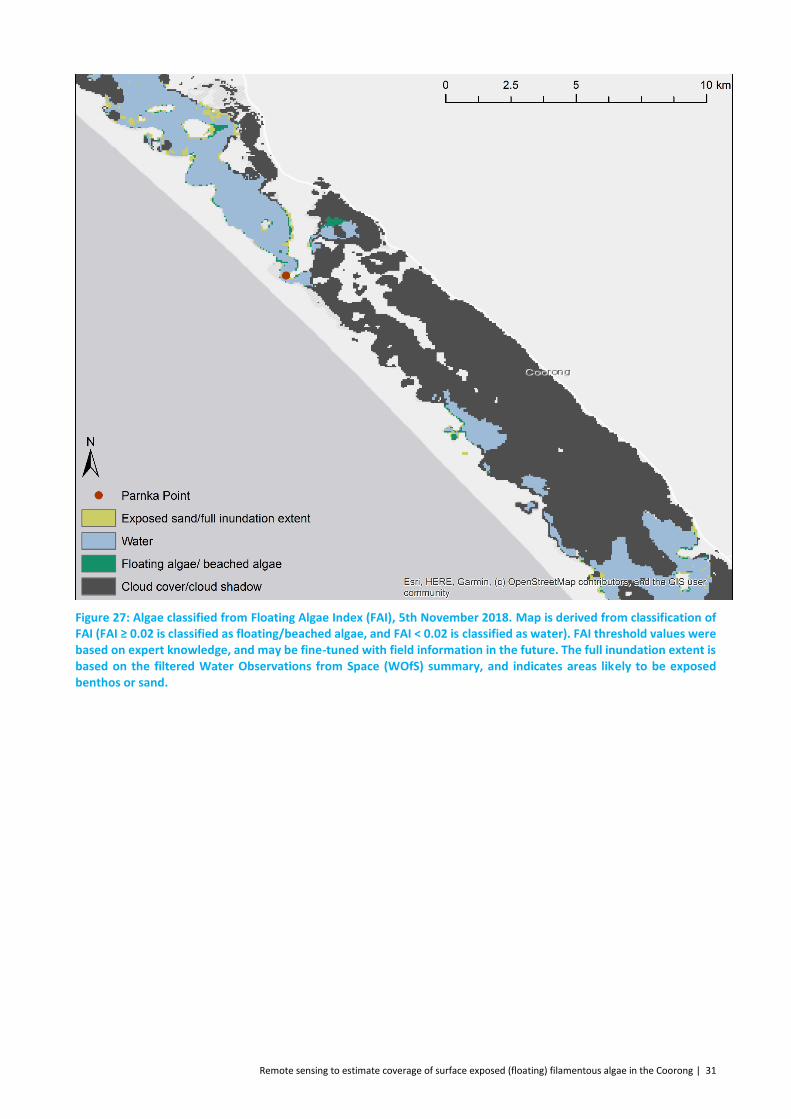
Figure 27: Algae classified from Floating Algae Index (FAI), 5th November 2018. Map is derived from classification of FAI (FAI ≥ 0.02 is classified as floating/beached algae, and FAI < 0.02 is classified as water). FAI threshold values were based on expert knowledge, and may be fine-tuned with field information in the future. The full inundation extent is based on the filtered Water Observations from Space (WOfS) summary, and indicates areas likely to be exposed benthos or sand.

32 | Remote sensing to estimate coverage of surface exposed (floating) filamentous algae in the Coorong
Figure 28: Algae classified from Floating Algae Index (FAI), 23rd December 2018.Map is derived from classification of FAI (FAI ≥ 0.02 is classified as floating/beached algae, and FAI < 0.02 is classified as water). FAI threshold values were based on expert knowledge, and may be fine-tuned with field information in the future. The full inundation extent is based on the filtered Water Observations from Space (WOfS) summary, and indicates areas likely to be exposed benthos or sand.

Remote sensing to estimate coverage of surface exposed (floating) filamentous algae in the Coorong | 33
4 Discussion The potential for satellite remote sensing to detect and map floating algae mats in the Coorong, South Australia was examined. It focussed on Parnka Point, a location known to have large scale filamentous algal mats forming surface areas across the times assessed. These initial examinations were based on the floating algae index (FAI) and normalised difference vegetation index (NDVI) generated from Landsat 8 imagery (30 m resolution), and visual interpretation of PlanetScope imagery (3 m resolution). The findings were promising: the observed spatial and temporal patterns coincide with the expected spatial and temporal behaviour of the floating algae mats. However, without field data contemporaneous to imagery acquisitions, formal accuracy assessment is not possible and results must be interpreted with caution.
Filamentous algae mats were mapped in all image dates (between September and December 2017 and 2018) above the NDVI and FAI thresholds. However, it is worth noting that distinguishing algal mats from aquatic vegetation, sand bars and elevated background chlorophyll-a with remote sensing techniques in shallow lagoons and lakes (like the Coorong) is challenging. Consequently, the relatively few studies which have attempted to map the presence and prevalence of floating algae in such environments using remotely sensed imagery have almost always combined imagery analysis with in situ field data (e.g. Cannizzaro et al. (2019), Liu et al. (2015), Ma et al. (2008)). This often enables authors to refine and tailor analysis to their particular study areas. We used NDVI and FAI for initial investigation of the presence/absence and extent of filamentous algae mats in the Coorong due to their ability to function despite this spectral complexity and their demonstrated ability to identify floating algae in other similar environments. By limiting mapping to inundated pixels (using WOfS) we also expected to have excluded areas of exposed sediments and minimised the potential for inaccurate mapping.
In this study the classification of probable-algae-extent was based on application of specific threshold values to FAI and NDVI imagery, with these values based on expert knowledge and generalisation from published literature. In this case the chosen threshold values resulted in fewer pixels being classified as algae/beached algae in the FAI product than in the NDVI. However, different threshold choice could have resulted in the opposite case. We note that threshold choice will be key to these methods, and choice of too-low threshold values will likely result in over classification of algae-mats, and vice versa. As an example, we note that in the NDVI and FAI maps for the whole Coorong extent there appears to be some misclassifications near to the Murray Mouth where sand bars are mapped as algae. Despite the intricacies associated with these parameters and in light of our initial results it is evident that further investigation of the potential for satellite remote sensing of algal mats in the Coorong is warranted.
Future studies should either attempt to further refine the FAI or NDVI methods demonstrated herein, or investigate other methods possibly based on the temporal phenomenology of the algae mat formation. The normalised difference chlorophyll index (NDCI) (Mishra and Mishra 2012) is one such possible method and is capable of measuring chlorophyll-a concentration in turbid waters. For the purpose of hindcasting filamentous algae mats, we suggest that Landsat data is suitable. Although Landsat 5 and 7 are older sensors (Landsat 5 operating from 1988) and have arguably reduced capabilities and reliability compared to Landsat 8 (operating since 2013), they should be sufficient for gaining insight to the spatial and temporal changes of filamentous algae mats prior to and following the millennium drought. However, in the case that Landsat 5 and 7 data is found to be unsuitable for this purpose, Sentinel-2 data could be used, although this would limit hindcasting to 2015. Sentinel-2 data has finer spatial resolution than Landsat at approximately 10 m and the benefit of two thermal bands which can be used to discriminate water from non-water which would reduce the dependency of the current method on WOfS. Further, Sentinel-2 data is supported by the Acolite tool, so results could be compared to Landsat products in the future. An updated digital elevation model will also help to inform researchers of mapped shallow areas where index values may need to be interpreted with particular care.
Regardless, all further remote sensing methods development (FAI/NDVI or other indices and ratios from any source) will require field data collection contemporaneous with satellite imagery acquisitions. This field data should record representative numbers of sample locations of key cover classes including: open water (over bare sand/sediment); open water (over seagrass no attached filamentous algae); open water (over seagrass

34 | Remote sensing to estimate coverage of surface exposed (floating) filamentous algae in the Coorong
with attached filamentous algae, but not mat forming); algae mat (filamentous algae mat formed to be floating); algae mat (beached - wet); algae mat (beached - dry); dry sand/sediment; and wet sand/sediment. This data would enable development and testing of mapping methods to distinguish these essential cover classes, as well as enabling assessment of mapping accuracy. Ideally, this field data could also be used to develop probabilistic models (going further than thresholds of NDVI and FAI) with a wide range of input variables (e.g. temperature, depth) to account for influencing factors and develop a way to predict algal mat formation.
This study has identified a relatively simple method, using the Acolite tool, to process Landsat imagery to NDVI and FAI products and map filamentous algae mats in a spectrally complex shallow lagoon. There is significant potential to develop an accurate measure of floating algae mat extent from remote sensing data. Such a measure could be applied to new and historic remote sensing data, enabling quantification of the extent of new blooms and investigation of the historical spatial dynamics of mat forming algae in this region. Refinement of the methods shown in this study to map algae coverage over time will improve understanding of how, when and why these mats form and help to explain their impact on the Coorong system, as well as how extreme events (e.g. droughts and flooding) may exacerbate their impacts. Finally, knowledge gained from these initial investigations may allow for the development of remote sensing early warning methods, helping to prevent such blooms occurring to a detrimental extent.

Remote sensing to estimate coverage of surface exposed (floating) filamentous algae in the Coorong | 35
5 References Brookes, J., Dalby, P., Dittmann, S., O’Connor, J., Paton, D., Quin, R., Rogers, D., Waycott, M., and Ye, Q.
(2018). Recommended actions for restoring the ecological character of the South Lagoon of the Coorong. Goyder Institute for Water Research Technical Report Series No. 18/04, Adelaide, South Australia. ISSN: 1839- 2725.
Cannizzaro, J.P., Barnes, B.B., Hu, C., Corcoran, A.A., Hubbard, K.A., Muhlbach, E., Sharp, W.C., Brand, L.E., & Kelble, C.R. (2019). Remote detection of cyanobacteria blooms in an optically shallow subtropical lagoonal estuary using MODIS data. Remote Sensing of Environment, 231, 111227
Collier, C., van Dijk, K.-J., Erftemeijer, P., Foster, N., Hipsey, M., O'Loughlin, E., Ticli, K. and Waycott, M. (2017) Optimising Coorong Ruppia habitat: Strategies to improve habitat conditions for Ruppia tuberosa in the Coorong (South Australia) based on literature review, manipulative experiments and predictive modelling. M. Waycott, Ed. Report to Department of Environment and Natural Resources (DEWNR). Adelaide, South Australia, University of Adelaide, School of Biological Sciences. A University of Adelaide and State Herbarium of South Australia, South Australia, 169 pp.
Hu, C. (2009). A novel ocean color index to detect floating algae in the global oceans. Remote Sensing of Environment, 113, 2118-2129
Hu, C., & He, M.-X. (2008). Origin and Offshore Extent of Floating Algae in Olympic Sailing Area. Eos, Transactions American Geophysical Union, 89, 302-303
Hu, C.M., Li, D.Q., Chen, C.S., Ge, J.Z., Muller-Karger, F.E., Liu, J.P., Yu, F., & He, M.X. (2010). On the recurrent Ulva prolifera blooms in the Yellow Sea and East China Sea. Journal of Geophysical Research-Oceans, 115
Hu, L., Hu, C., & Ming-Xia, H.E. (2017). Remote estimation of biomass of Ulva prolifera macroalgae in the Yellow Sea. Remote Sensing of Environment, 192, 217-227
Kahru, M., Leppanen, J.M., & Rud, O. (1993). Cyanobacterial blooms cause heating of the sea surface. Marine Ecology-progress Series - MAR ECOL-PROGR SER, 101, 1-7
Liu, X., Zhang, Y., Shi, K., Zhou, Y., Tang, X., Zhu, G., & Qin, B. (2015). Mapping Aquatic Vegetation in a Large, Shallow Eutrophic Lake: A Frequency-Based Approach Using Multiple Years of MODIS Data. Remote Sensing, 7
Ma, R., Duan, H., Gu, X., & Zhang, S. (2008). Detecting Aquatic Vegetation Changes in Taihu Lake, China Using Multi-temporal Satellite Imagery. Sensors, 8
Mishra, S., & Mishra, D. (2012). Normalized difference chlorophyll index: A novel model for remote estimation ofchlorophyll-aconcentration in turbid productive waters. Remote Sensing of Environment, 117, 394-406
Myneni, R.B., Hall, F.G., Sellers, P.J., & Marshak, A.L. (1995). The interpretation of spectral vegetation indexes. IEEE Transactions on Geoscience and Remote Sensing, 33, 481-486
Prangsma, G.J., & Roozekrans, J.N. (1989). Using NOAA AVHRR imagery in assessing water quality parameters. International Journal of Remote Sensing, 10, 811-818
Sellers, P.J. (1985). Canopy reflectance, photosynthesis and transpiration. International Journal of Remote Sensing, 6, 1335-1372
Sellers, P.J. (1987). Canopy reflectance, photosynthesis, and transpiration, II. The role of biophysics in the linearity of their interdependence. Remote Sensing of Environment, 21, 143-183

The Goyder Institute for Water Research is a partnership between the South Australian Government through the Department for Environment and Water, CSIRO, Flinders University, the University of Adelaide, the University of South Australia, and the International Centre of Excellence
in Water Resource Management.


