Embed Size (px)
Citation preview

Investigation of the Cost of Future Naval Amphibious Capability
Andrew J Jones
1 (MRINA), Rob W Armstrong
2 (AMRINA)
1. Principal Naval Architect, BMT Defence Services Ltd, Future Platforms Team.
2. Naval Architect, BMT Defence Services Ltd, Future Platforms Team.
Through the creation of a large number of concept designs, the cost and vessel impact of
deploying and supporting amphibious operations has been investigated. The investigation has
looked at capabilities such as the transportation and delivery of vehicles, landing craft, aviation
and embarked troops in a number of platform types such as LPDs, LHDs and Ro-Ros. A series of
trends describing the costs of the capability have been investigated to estimate the cost of
individual capabilities within a design. Over the timeframe of the study, vessel manning is
predicted to change and a method of predicting the crew requirement has been developed to
investigate the impact of reduced manning on amphibious platform designs. This is the first of two
stages of work; in the second stage the requirements for a task group will be investigated to
determine the best way to deploy capability at a fleet level. .
KEY WORDS: Ship design; naval vessel design; sealift; human factors and
manning; computer supported design; cost modelling.
NOMENCLATURE CCSS – Command and Combat Support Ship
CGT – Compensated Gross Tonnage
LPH – Landing Platform Helicopter
LPD – Landing Platform Dock
LHD – Landing Helicopter Dock
LitM – Littoral Maneuver
LSD(A) – Landing Ship Dock (Auxiliary)
LwL – Length on Waterline
RFA – Royal Fleet Auxiliary
RN – Royal Navy
ROM – Rough Oder of Magnitude
RoRo – Roll on Roll off
UPC – Unit Purchase Cost
TLC- Through Life Cost
INTRODUCTION The out of service dates of a number of UK amphibious classes
are predicted to occur around the mid 2030’s. This coincidence
of out of service dates provides an opportunity for the
distribution of amphibious capability across the different classes
to be reassessed. BMT conducted a study to investigate a large
number of possible concept designs to inform planning
decisions. This paper analyses the designs created to investigate
how amphibious capability can most cost effectively be
deployed and the appropriate distribution of capability between
naval, naval auxiliary and commercial shipping. This
exploration of the design space could assist with setting
requirements for a number of classes from where further
exploration of the design space and analysis of alternatives can
be considered as described by Singer (2009) and Mebane
(2011).
Whilst looking to the mid 2030’s, the concept designs created
represent an evolution of current amphibious vessel designs and

Jones, Andrew J Investigating the Cost of Future Naval Amphibious Capability
2
continue the doctrine and thinking of today’s approach to littoral
maneuver. They represent realistic and feasible combinations of
capability and provide a sensible basis the development of
platform design trends.
As there is significant pressure on navies around the world to
reduce crew size, a statistical model of possible technologies
and changes to naval doctrine was created allowing the
reduction in crew size in the timeframe of the study to be
estimated and the impact on the platform and costs identified.
UNDERSTANDING AMPHIBIOUS PLATFORMS
Amphibious Platform Capability The primary role of the platforms investigated is to support the
landing and sustainment of a military force in the littoral
environment. This requires a significant range of capabilities to
be deployed by the platforms including but not limited to:
command and control, transportation and offload of heavy
equipment and personnel, aviation facilities, medical facilities
and stores. These capabilities, and the requirement to operate as
part of a task group, also drive a number of platform
characteristics such as speed, range and maneuverability.
Hullform Design Drivers These capabilities and requirements have a significant impact on
the hullform of the platform. As shown by Watson (1962
&1976), commercial vessels can typically be described by one
of three categories;
1. Volume driven, such as passenger ferries;
2. Linear driven, such as container ships;
3. Deadweight driven, such as bulk carriers and tankers.
For existing vessels, these categories can be seen by comparing
the deadweight to vessel length as shown in Fig.1. When
existing amphibious vessels (LPD, LPH, LSDA) are also plotted
by estimating their equivalent deadweight, they can be seen to
form a region between the linear and volume driven design
regions.
Fig.1 Commercial and Amphibious Hullform Design Drivers.
Amphibious vessel hullforms are typically developed
specifically for the role due to the need to dock down and have
slow speed maneuverability but, as can be seen, there is some
overlap with commercial hullforms at lower deadweight, and
commercial shipping is used by several navies to support
amphibious operations.
This study has used a number of existing amphibious and
commercial hullforms as the basis of the study, but has not
looked at redistributing capability across other naval vessels
such as frigates and destroyers as the relatively high payload
and volume demands are not compatible with these vessel types
without significantly compromising their primary role.
Breadth of Study To deliver and sustain littoral maneuvers at a task group level, a
large amount of equipment, vehicles, stores and troops are
required. The total capability to be delivered into a theatre of
operations by a future task group can be met by varying the
number, capacity and/or role(s) of the individual platforms.
Within each capability area a large number of variations of
requirement are possible. A range was defined for each
capability area to ensure that the designs studied covered the
breadth of possible UK requirements in the mid-2030s
timeframe. Due to the large number of possible combinations of
capabilities a reduced subset of the combinations were selected.
This approach was selected rather than investigating the impact
of individual changes to a capability around a baseline design, in
order to ensure that the interactions between the capabilities and
their impact on the different designs was captured. The range of
the capabilities investigated are shown in Table 1 below, where
the lower bound shown excludes “None” capability.
Table 1. Range of Capability by Capability Area
Capability
Area
Lower Bound
(Low)
Upper Bound
(Excellent)
Command
and Control
Ships own
operations
LitM operations room and
planning spaces
Logistics Ships own
operations
Ammunitions, Stores,
Fuel and Containerized
stores in support of LitM,
RAS
Surface
Maneuver
Landing craft
personnel
Landing craft utility,
personnel and Mexeflote
Aviation Landing and
refuel for single
medium
helicopter
Control, support,
maintenance and refueling
of up to 12 medium
helicopters
Embarked
Force
Force protection Commando group
Vehicles Limited, light
vehicles only
Full heavy and light
vehicle load
Medical Sick Bay
(NATO Role 1)
Casualty Receiving and
Treatment (NATO Role 3)
35 capability combinations were defined as a baseline design set
to cover the full range of possibilities from traditional role
specific platforms to more multi-role platforms. Quantitatively
Jones, Andrew J Investigating the Cost of Future Naval Amphibious Capability
3
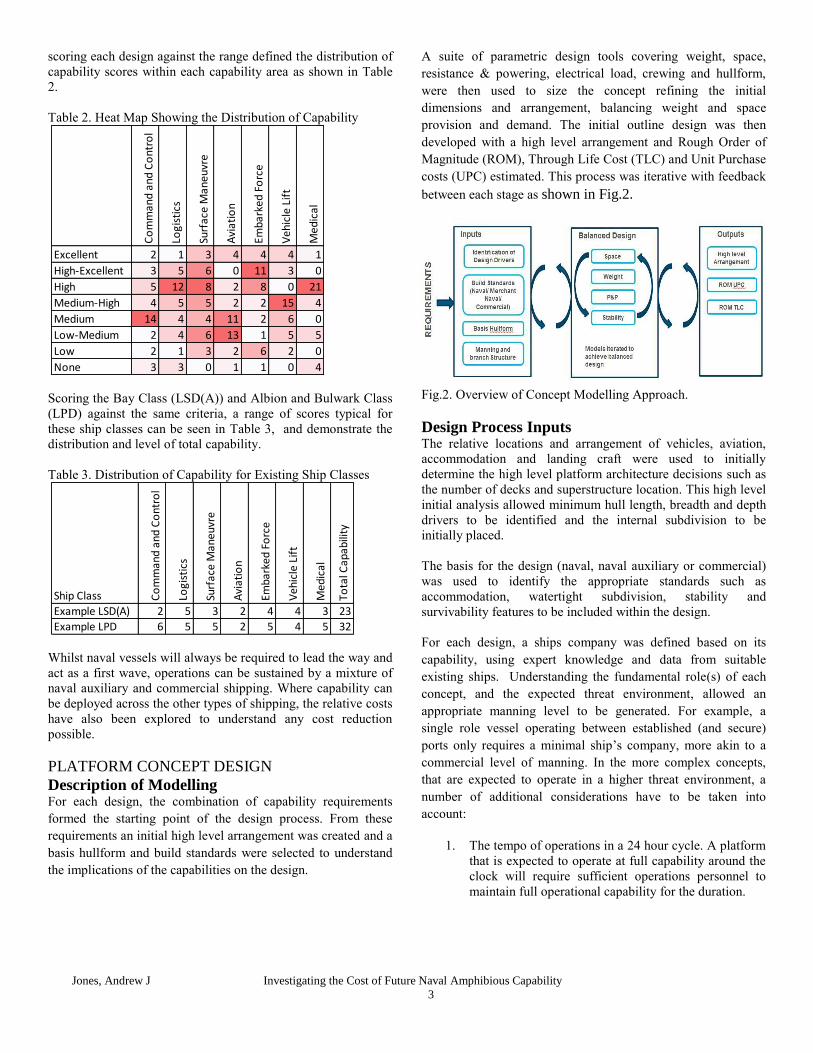
scoring each design against the range defined the distribution of
capability scores within each capability area as shown in Table
2.
Table 2. Heat Map Showing the Distribution of Capability
Scoring the Bay Class (LSD(A)) and Albion and Bulwark Class
(LPD) against the same criteria, a range of scores typical for
these ship classes can be seen in Table 3, and demonstrate the
distribution and level of total capability.
Table 3. Distribution of Capability for Existing Ship Classes
Whilst naval vessels will always be required to lead the way and
act as a first wave, operations can be sustained by a mixture of
naval auxiliary and commercial shipping. Where capability can
be deployed across the other types of shipping, the relative costs
have also been explored to understand any cost reduction
possible.
PLATFORM CONCEPT DESIGN
Description of Modelling For each design, the combination of capability requirements
formed the starting point of the design process. From these
requirements an initial high level arrangement was created and a
basis hullform and build standards were selected to understand
the implications of the capabilities on the design.
A suite of parametric design tools covering weight, space,
resistance & powering, electrical load, crewing and hullform,
were then used to size the concept refining the initial
dimensions and arrangement, balancing weight and space
provision and demand. The initial outline design was then
developed with a high level arrangement and Rough Order of
Magnitude (ROM), Through Life Cost (TLC) and Unit Purchase
costs (UPC) estimated. This process was iterative with feedback
between each stage as shown in Fig.2.
Fig.2. Overview of Concept Modelling Approach.
Design Process Inputs The relative locations and arrangement of vehicles, aviation,
accommodation and landing craft were used to initially
determine the high level platform architecture decisions such as
the number of decks and superstructure location. This high level
initial analysis allowed minimum hull length, breadth and depth
drivers to be identified and the internal subdivision to be
initially placed.
The basis for the design (naval, naval auxiliary or commercial)
was used to identify the appropriate standards such as
accommodation, watertight subdivision, stability and
survivability features to be included within the design.
For each design, a ships company was defined based on its
capability, using expert knowledge and data from suitable
existing ships. Understanding the fundamental role(s) of each
concept, and the expected threat environment, allowed an
appropriate manning level to be generated. For example, a
single role vessel operating between established (and secure)
ports only requires a minimal ship’s company, more akin to a
commercial level of manning. In the more complex concepts,
that are expected to operate in a higher threat environment, a
number of additional considerations have to be taken into
account:
1. The tempo of operations in a 24 hour cycle. A platform
that is expected to operate at full capability around the
clock will require sufficient operations personnel to
maintain full operational capability for the duration.
Co
mm
and
an
d C
on
tro
l
Logi
stic
s
Surf
ace
Man
euvr
e
Avi
atio
n
Emb
arke
d F
orc
e
Veh
icle
Lif
t
Med
ical
Excellent 2 1 3 4 4 4 1
High-Excellent 3 5 6 0 11 3 0
High 5 12 8 2 8 0 21
Medium-High 4 5 5 2 2 15 4
Medium 14 4 4 11 2 6 0
Low-Medium 2 4 6 13 1 5 5
Low 2 1 3 2 6 2 0
None 3 3 0 1 1 0 4
Ship Class Co
mm
and
and
Co
ntro
l
Logi
stic
s
Surf
ace
Man
euvr
e
Avi
atio
n
Emba
rked
Fo
rce
Veh
icle
Lif
t
Med
ical
Tota
l Cap
abili
ty
Example LSD(A) 2 5 3 2 4 4 3 23
Example LPD 6 5 5 2 5 4 5 32
Jones, Andrew J Investigating the Cost of Future Naval Amphibious Capability
4
2. The threat environment the ship is expected to operate
in. In addition to maintaining navigational safety and
maintenance, a vessel operating in a high threat
environment has to have sufficient crew to be able to
fight both the external battle (engaging the enemy,
landing troops and operating air and surface
connectors) and the internal battle (damage control,
and repair functions post damage control).
3. The length of time the ship is expected to remain on
operations and its distance from a secure port. A small
Ship’s Company can support 24 hour operations for a
limited time (of the order of days), before rotating crew
is required limiting its distance from a secure port. For
a vessel that can be deployed globally, a larger Ship’s
Company is required to sustain 24 hour operation over
a lengthy deployment (of the order of months).
4. The level of automation of the systems, machinery and
role required. Propulsion machinery and command
systems can be manpower intensive and, as capability
increases, the manpower required typically also
increases.
To generate the manning required for each concept, the most
appropriate ‘real world’ vessel was selected based on the
requirements to act as a starting point. This set of reference
vessels included the RN Albion Class LPD, RFA Bay Class
LSD(A), Point Class Strategic RoRo, Danish Absalon Class
CCSS, USN Wasp Class LHD and French Mistral Class LHD. It
is recognized that different Navies have varied manning
philosophies, with Danish and French ships relatively lean
manned and USN ships comparatively heavily manned. For the
study, the current UK complementing philosophy was
maintained with options to reduce manning investigated as
described later.
The Ship’s Company generated for each concept defined the
branch and rank structure proposed to allow key skills and ranks
to be identified.
Balanced Design BMT’s suite of parametric concept design tools were used to
quickly achieve a balanced design for each concept design.
These tools were validated and then tailored for the study using
existing amphibious platforms and allow the space, weight,
stability and power and propulsion architecture to be iteratively
balanced.
Hullform resistance was predicted using the methodology
described by Holtrop (1978, 1982 & 1984), with indicative
equipment selected based on a wide range of manufacturers
data. This covered mechanical, hybrid, partial and full electrical
propulsion architectures with fixed pitched propellers,
controllable pitched propellers or podded propulsors. The
electrical load was parametrically scaled from basis vessels and,
where appropriate, individual equipment items were included as
required. Generic operational profiles based on the primary
capability of the ship (supporting surface maneuver, air
maneuver or a mix of the two), the operating profile, including
maximum and cruise speeds required and vessel range, were
used to generate total fuel loads. The most efficient power and
propulsion architecture capable of meeting the maneuvering
requirements for each concept was selected.
The intact stability of the concept was checked by numerical
integration of the proposed hullform and comparison of the ratio
of the transverse metacenter (GM) to the waterline beam, to
existing amphibious ships.
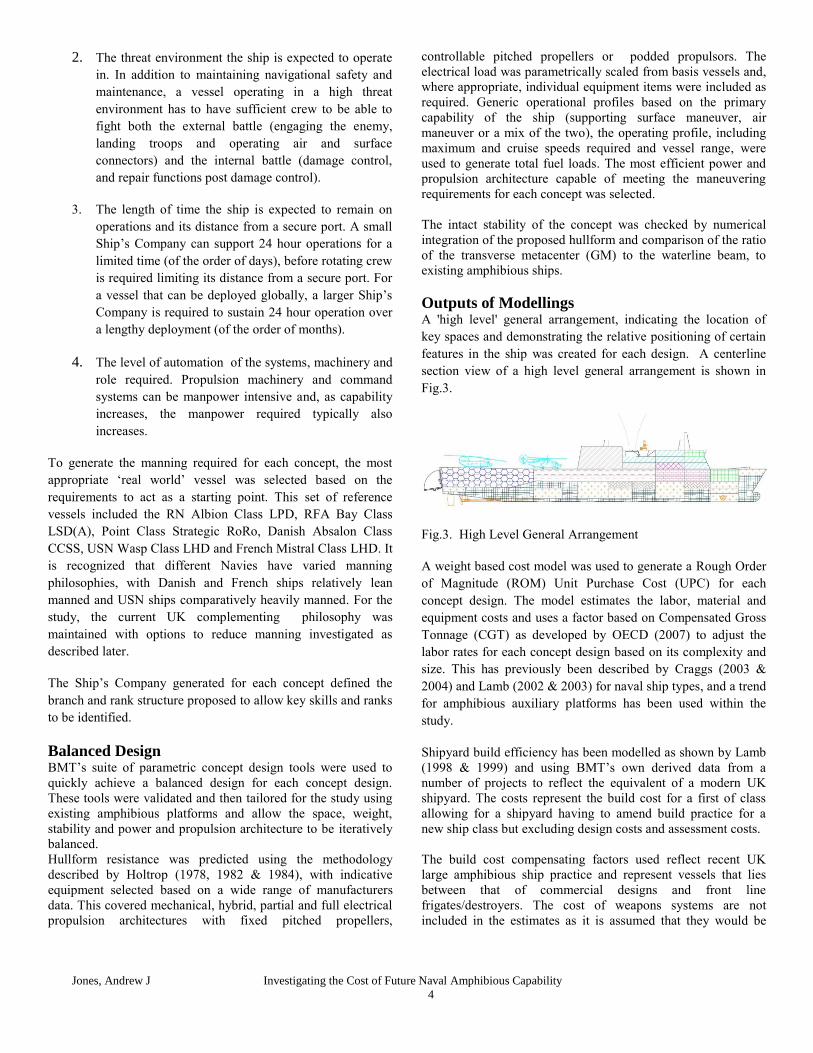
Outputs of Modellings A 'high level' general arrangement, indicating the location of
key spaces and demonstrating the relative positioning of certain
features in the ship was created for each design. A centerline
section view of a high level general arrangement is shown in
Fig.3.
Fig.3. High Level General Arrangement
A weight based cost model was used to generate a Rough Order
of Magnitude (ROM) Unit Purchase Cost (UPC) for each
concept design. The model estimates the labor, material and
equipment costs and uses a factor based on Compensated Gross
Tonnage (CGT) as developed by OECD (2007) to adjust the
labor rates for each concept design based on its complexity and
size. This has previously been described by Craggs (2003 &
2004) and Lamb (2002 & 2003) for naval ship types, and a trend
for amphibious auxiliary platforms has been used within the
study.
Shipyard build efficiency has been modelled as shown by Lamb
(1998 & 1999) and using BMT’s own derived data from a
number of projects to reflect the equivalent of a modern UK
shipyard. The costs represent the build cost for a first of class
allowing for a shipyard having to amend build practice for a
new ship class but excluding design costs and assessment costs.
The build cost compensating factors used reflect recent UK
large amphibious ship practice and represent vessels that lies
between that of commercial designs and front line
frigates/destroyers. The cost of weapons systems are not
included in the estimates as it is assumed that they would be

Jones, Andrew J Investigating the Cost of Future Naval Amphibious Capability
5
provided to the ship as government supplied equipment, or be
developed under another project.
A Through Life Cost (TLC) model was also created to capture
the range of costs that will be associated to the ship during an
assumed 30 year life including:
1. Manpower;
2. Fuels and lubricants;
3. Consumables (i.e. commissaries, engineering spares,
etc);
4. Maintenance periods and refits/mid-life
updates/docking periods.
All costs assumed a generic annual inflation rate of 2.5%,
except manpower which was assumed to be 4.5% in line with
current UK inflation.
Manpower costs for the crew have been based on capitation
rates including pensions and taxes but excluding other
allowances. The costs do not include a shore margin or
specialist crew such as aviators or medical staff who are
provided at a fleet level, or recruitment and retention
allowances.
Fuel and lubricant costs have been estimated for each design by
assuming a proportion of time spent in harbor and at cruise and
full speed based on existing vessels. This assumes 66% of time
spent at sea of which 94% of the time is spent at an economical
cruise speed and 6% of time spent at maximum speed. The
commercial cost of fuel has been assumed and does not include
the fully burdened cost of energy.
The maintenance cost of each design has been estimated based
on the complexity of the vessel. Each capability area was
subjectively weighed for its contribution to the TLC based on
BMT’s engineering judgement. The range of requirements for
each capability area was then also assessed for their impact on
TLC allowing each design to be scored and given a relative
complexity score.
The complexity scores were then used to rank the designs.
Based on analysis of equivalent existing ships, the range of costs
were found to be between 5 and 9% UPC/annum. Where 5%
represents the more commercial vessel types and 9% represents
the most complex vessels within the design set.
The complexity weighting was also used to estimate a midlife
upgrade cost for each platform as a % of UPC. With an
equivalent range of between 5 and 20% of the UPC found.
Modelling of Lean Manning Given current pressure to reduce crew size to minimize both
acquisition and through life costs, significant change to the crew
size is possible between now and the delivery of the vessels.
This required a methodology to be derived to assess how the
crew size might reduce compared to current manning practice
and structures.
A significant number of potential lean manning technologies
and changes to naval doctrine could be applicable to the designs
and both military and public domain information were reviewed
including Johnson (2005), Malone (2013) and Post (2013). The
applicable themes under which manpower savings could be
achieved were identified as a number of drivers and these are
summarized in Table 4.
Table 4. Lean Manning Drivers.
D1 Operations Room Manning Structure
D2 Bridge Manning Structure
D3 Automation of Weapons Systems
D4 Reduced/ Unmanned Ship Control Centre
D5 Automation of Logistics/ Stores Accounting
D6
Combining Combat System Operation and
Maintenance
D7 Removal of Steward Branch
D8 Automation of Damage Control Monitoring
D9
Direct Entry into Naval Service from Other
Industries
D10 Combat Management Systems Improvements
D11 Use of Unmanned Aviation Vehicles
D12 Improvements in Food Preparation and Delivery
D13 Remote Monitoring of Systems from Shore
For a crew saving to be achieved, individual roles must be
removed within the same branch for all the vessel operating
states as individuals within the crew fulfil different roles at
different states. A typical UK Watch and Station Bill for an
amphibious platform was used to identify the driving states and
roles for the analysis:
1. State 1 – Action
2. State 2 – Defence Watches
3. State 3 – Cruising
Enabling technologies are required in conjunction with the
drivers identified in order to remove the roles across the vessel
states. The enabling changes to technology and doctrine
identified are shown in Table 5.

Jones, Andrew J Investigating the Cost of Future Naval Amphibious Capability
6
Table 5. Lean Manning Enablers.
E1 Reduced Seamanship Burden - Improved Mooring
and Berthing
E2 Reduced Seamanship Burden - Reduced Requirement
to RAS
E3 Reduced Seamanship Burden - Automated RAS
equipment
E4 Reduced Ship's Husbandry Burden - Improved
Cleaning and Upper Deck Maintenance
E5 Improved Damage Control - Fixed Eductors in all
sections/ Automated Drain Down Valves/ 'Self
Healing'/ Re-routing Ring Main (and Other
Pipework)
As each of the drivers and enablers identified has a subjective
probability of reaching maturity, and none are certain of
reaching maturity, a model was constructed to allow a reduction
in crew to be estimated for a chosen confidence level.
The individual probability of each driver and enabler reaching
maturity in the timeframe of the study was subjectively
assessed. This was based on the state of the art for the
technology, if it had been achieved in a commercial or naval
application with another navy and the navy's perceived appetite
for the change. The associated impacts for each driver and
enabler were also estimated, to capture the changes that would
be required to maintain the equivalent level of capability:
1. Manpower saving - saving achieved for each branch in
each state, used as a new input to the concept model;
2. Weight impact - additional weight of systems and
equipment to replace personnel;
3. Space impact –additional space required for equipment
and systems to replace personnel;
4. Electrical impact – additional power demand for
equipment and systems required to replace personnel;
5. Equipment cost - change to UPC equipment costs
required to replace personnel.
As several enablers could be combined to achieve the full
benefit of one driver, probability trees were constructed to allow
the probability of each outcome to be predicted. The outcomes
for all the drivers were then sorted to discount combined
options, and to stop double accounting by manpower savings
released by an enabler being taken across multiple drivers.
In order to account for the probabilistic nature of the drivers and
enablers, a simulation was performed. This looked at the
outcomes of all of the possible combinations of enablers and
drivers that were captured in the analysis and acknowledges that
the enablers and drivers may or may not reach maturity. Whilst
there may be additional enablers and drivers not captured, a
sufficient number and range of options were considered to allow
the simulation to provide a realistic assessment.
The simulation also helped to mitigate any error in the
subjective probability of an enabler or driver occurring. By
averaging over a large number of outcomes, the sensitivity of
the model to any uncertainty in the individual manpower saving
or ship impacts is also reduced. The simulation allowed for a
statistical distribution to be derived and the data to be applied as
an input to the design process. The cumulative distribution
derived from this simulation is illustrated in Fig.4, which shows
the likelihood of reducing the crew number by a given
percentage.
Fig. 4. Cumulative Probability vs % Reduction in Naval Crew
The other inputs to the modelling were determined by creating
similar distributions for space, weight, power and UPC. A
cumulative probability of 50% was chosen for the study (as
likely as not to save at least that proportion of the crew)
resulting in a 30% reduction being selected for the study.
Not all drivers and enablers are appropriate for each design. For
less complex vessels with small starting crew numbers, a
number of the combat management system technologies are not
appropriate. Removing these from the analysis resulted in only a
small change in crew reduction, and ship impacts, but had a
large impact on equipment costs.
The outputs from the lean manning model are shown in Table 6;
these are additional requirements necessary to support a
manning reduction and are in addition to any effect of changing
the crew number.
Table 6. Lean Manning Model Inputs to Design Process.
Model Item Output
Reduction in Crew 30%
Weight Impact 45te
Space Impact 86m2
Electrical Impact 45 kW
UPC impact (Complex vessels) £9.5M
UPC impact (Simple Vessels) £6.2M
Jones, Andrew J Investigating the Cost of Future Naval Amphibious Capability
7
RESULTS
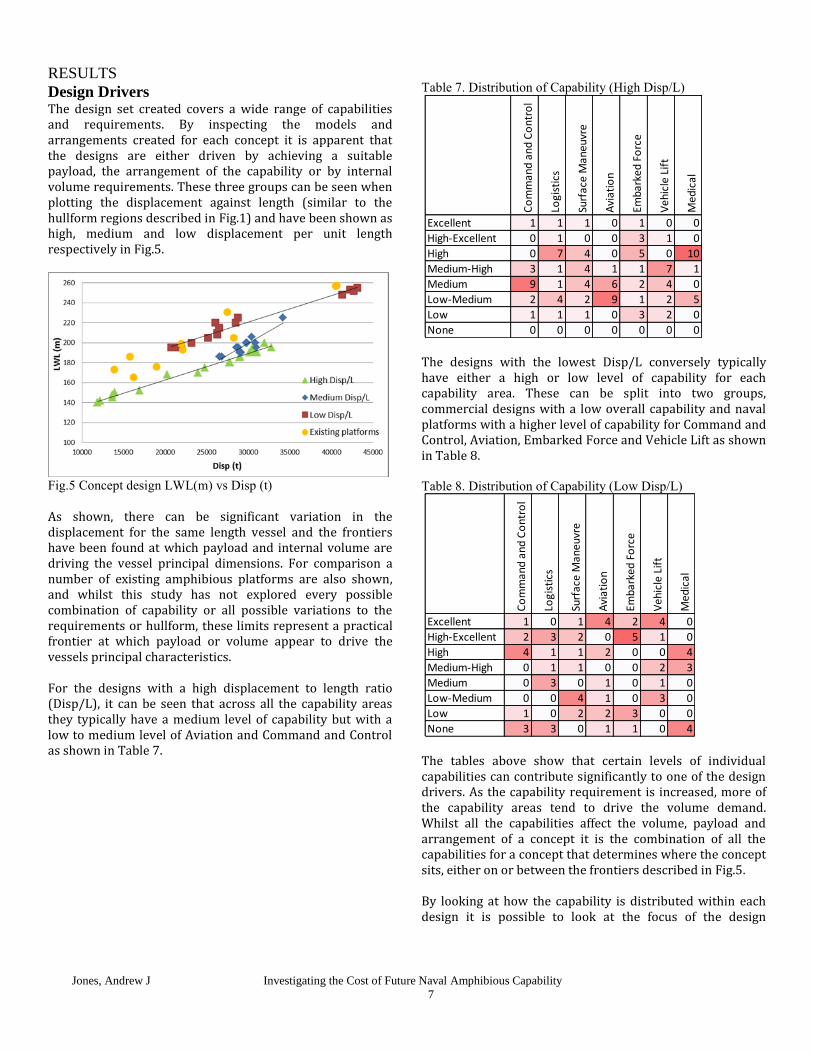
Design Drivers The design set created covers a wide range of capabilities and requirements. By inspecting the models and arrangements created for each concept it is apparent that the designs are either driven by achieving a suitable payload, the arrangement of the capability or by internal volume requirements. These three groups can be seen when plotting the displacement against length (similar to the hullform regions described in Fig.1) and have been shown as high, medium and low displacement per unit length respectively in Fig.5.
Fig.5 Concept design LWL(m) vs Disp (t)
As shown, there can be significant variation in the displacement for the same length vessel and the frontiers have been found at which payload and internal volume are driving the vessel principal dimensions. For comparison a number of existing amphibious platforms are also shown, and whilst this study has not explored every possible combination of capability or all possible variations to the requirements or hullform, these limits represent a practical frontier at which payload or volume appear to drive the vessels principal characteristics. For the designs with a high displacement to length ratio (Disp/L), it can be seen that across all the capability areas they typically have a medium level of capability but with a low to medium level of Aviation and Command and Control as shown in Table 7.
Table 7. Distribution of Capability (High Disp/L)
The designs with the lowest Disp/L conversely typically have either a high or low level of capability for each capability area. These can be split into two groups, commercial designs with a low overall capability and naval platforms with a higher level of capability for Command and Control, Aviation, Embarked Force and Vehicle Lift as shown in Table 8. Table 8. Distribution of Capability (Low Disp/L)
The tables above show that certain levels of individual capabilities can contribute significantly to one of the design drivers. As the capability requirement is increased, more of the capability areas tend to drive the volume demand. Whilst all the capabilities affect the volume, payload and arrangement of a concept it is the combination of all the capabilities for a concept that determines where the concept sits, either on or between the frontiers described in Fig.5. By looking at how the capability is distributed within each design it is possible to look at the focus of the design
Co
mm
and
an
d C
on
tro
l
Logi
stic
s
Surf
ace
Man
euvr
e
Avi
atio
n
Emb
arke
d F
orc
e
Veh
icle
Lif
t
Med
ical
Excellent 1 1 1 0 1 0 0
High-Excellent 0 1 0 0 3 1 0
High 0 7 4 0 5 0 10
Medium-High 3 1 4 1 1 7 1
Medium 9 1 4 6 2 4 0
Low-Medium 2 4 2 9 1 2 5
Low 1 1 1 0 3 2 0
None 0 0 0 0 0 0 0
Co
mm
and
an
d C
on
tro
l
Logi
stic
s
Surf
ace
Man
euvr
e
Avi
atio
n
Emb
arke
d F
orc
e
Veh
icle
Lif
t
Med
ical
Excellent 1 0 1 4 2 4 0
High-Excellent 2 3 2 0 5 1 0
High 4 1 1 2 0 0 4
Medium-High 0 1 1 0 0 2 3
Medium 0 3 0 1 0 1 0
Low-Medium 0 0 4 1 0 3 0
Low 1 0 2 2 3 0 0
None 3 3 0 1 1 0 4
Jones, Andrew J Investigating the Cost of Future Naval Amphibious Capability
8
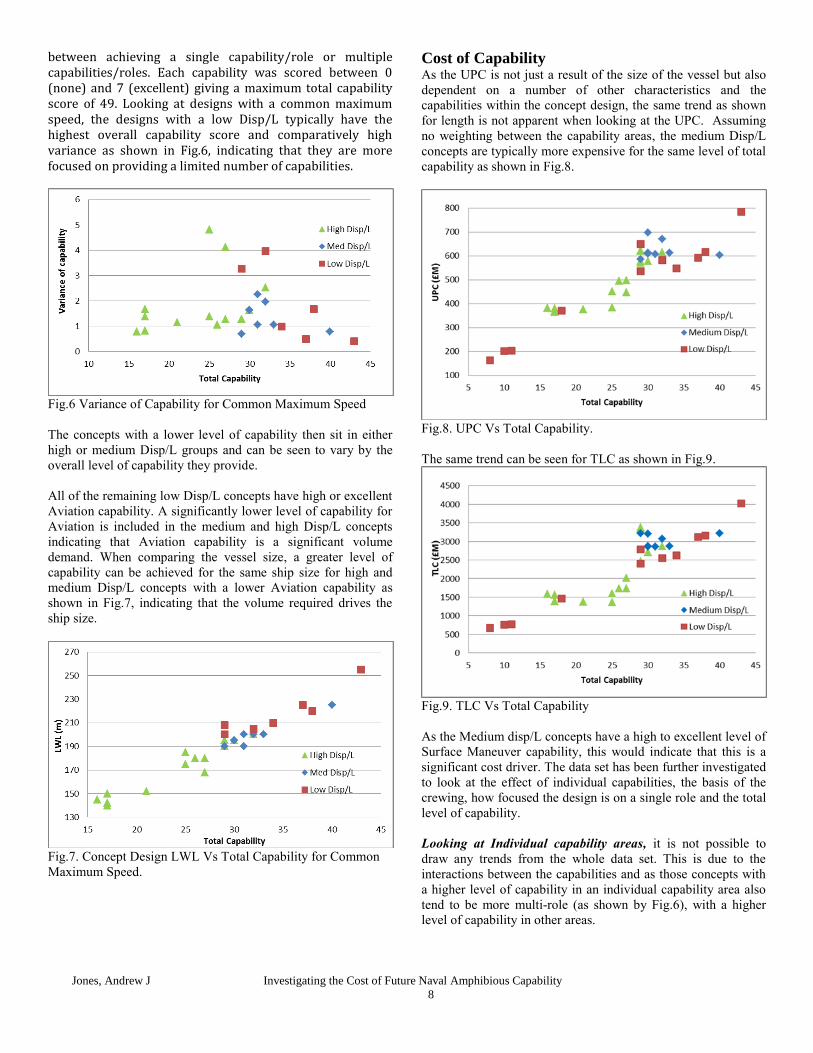
between achieving a single capability/role or multiple capabilities/roles. Each capability was scored between 0 (none) and 7 (excellent) giving a maximum total capability score of 49. Looking at designs with a common maximum speed, the designs with a low Disp/L typically have the highest overall capability score and comparatively high variance as shown in Fig.6, indicating that they are more focused on providing a limited number of capabilities.
Fig.6 Variance of Capability for Common Maximum Speed
The concepts with a lower level of capability then sit in either
high or medium Disp/L groups and can be seen to vary by the
overall level of capability they provide.
All of the remaining low Disp/L concepts have high or excellent
Aviation capability. A significantly lower level of capability for
Aviation is included in the medium and high Disp/L concepts
indicating that Aviation capability is a significant volume
demand. When comparing the vessel size, a greater level of
capability can be achieved for the same ship size for high and
medium Disp/L concepts with a lower Aviation capability as
shown in Fig.7, indicating that the volume required drives the
ship size.
Fig.7. Concept Design LWL Vs Total Capability for Common
Maximum Speed.
Cost of Capability As the UPC is not just a result of the size of the vessel but also
dependent on a number of other characteristics and the
capabilities within the concept design, the same trend as shown
for length is not apparent when looking at the UPC. Assuming
no weighting between the capability areas, the medium Disp/L
concepts are typically more expensive for the same level of total
capability as shown in Fig.8.
Fig.8. UPC Vs Total Capability.
The same trend can be seen for TLC as shown in Fig.9.
Fig.9. TLC Vs Total Capability
As the Medium disp/L concepts have a high to excellent level of
Surface Maneuver capability, this would indicate that this is a
significant cost driver. The data set has been further investigated
to look at the effect of individual capabilities, the basis of the
crewing, how focused the design is on a single role and the total
level of capability.
Looking at Individual capability areas, it is not possible to
draw any trends from the whole data set. This is due to the
interactions between the capabilities and as those concepts with
a higher level of capability in an individual capability area also
tend to be more multi-role (as shown by Fig.6), with a higher
level of capability in other areas.

Jones, Andrew J Investigating the Cost of Future Naval Amphibious Capability
9
Only a few of the data points represent a change in only one of
the capability areas, with no points suitable for analysis of the
Command and Control, Vehicle Lift and Embarked Force
capability areas. The suitable data points are shown in Fig.10.
Fig.10. UPC Comparison of Individual Capability Changes
These points show an increase in cost for increasing capability,
except for Logistics where no significant increase can be seen.
For Surface Maneuver, little increase in cost is seen between a
low to medium capability level, but a significant increase in cost
is seen from medium to high/excellent. For Aviation and
Medical, a significant increase in cost is seen between a high to
excellent level of capability.
Looking at the TLC for the same data points, the same trends
can be seen, except that there is a larger increase in the cost of
providing a high Logistics capability that can be seen in Fig.11.
Fig.11. TLC Comparison of Individual Capability Changes
The basis of the crewing is a contributing factor to the UPC
modelling, with commercial or naval auxiliary crewing used
where possible to reduce the cost of a concept. The concepts by
crew are shown in Fig.12.
Fig.12. UPC Vs Capability for Different Crewing Basis
For the concepts investigated, commercial crewing has only
been used for very low capability concepts and naval auxiliary
crewing only used for low to medium capability concepts. This
is due to the operating environment defined for each concept.
Commercial crewing is only applicable for those concepts
operating between secure ports. Naval auxiliary crewing has
been used for those concepts that would typically operate in a
relatively benign threat environment or under the protection of a
task group. The most capable concepts with naval auxiliary
crewing would be required to operate in an equivalent role to the
naval vessels to exploit their capability; this appears to remove
any reduction in UPC achieved by using a naval auxiliary crew.
The effect of just changing the crew from Naval to naval
auxiliary is shown in Fig.12 as Crew Type 1, where no real
difference has been observed.
At the higher capability level, no cost benefit can be seen. This
is also demonstrated by the number of crew required as shown
in Fig.13, where the higher capability concepts with naval
auxiliary crews have equivalent manpower to naval vessels of a
similar capability.
Fig.13. Crew Complement Vs Total Capability
As crewing costs are a significant element of the TLC, the effect
of commercial and naval auxiliary manning on costs can be seen
in Fig.14.
Jones, Andrew J Investigating the Cost of Future Naval Amphibious Capability
10
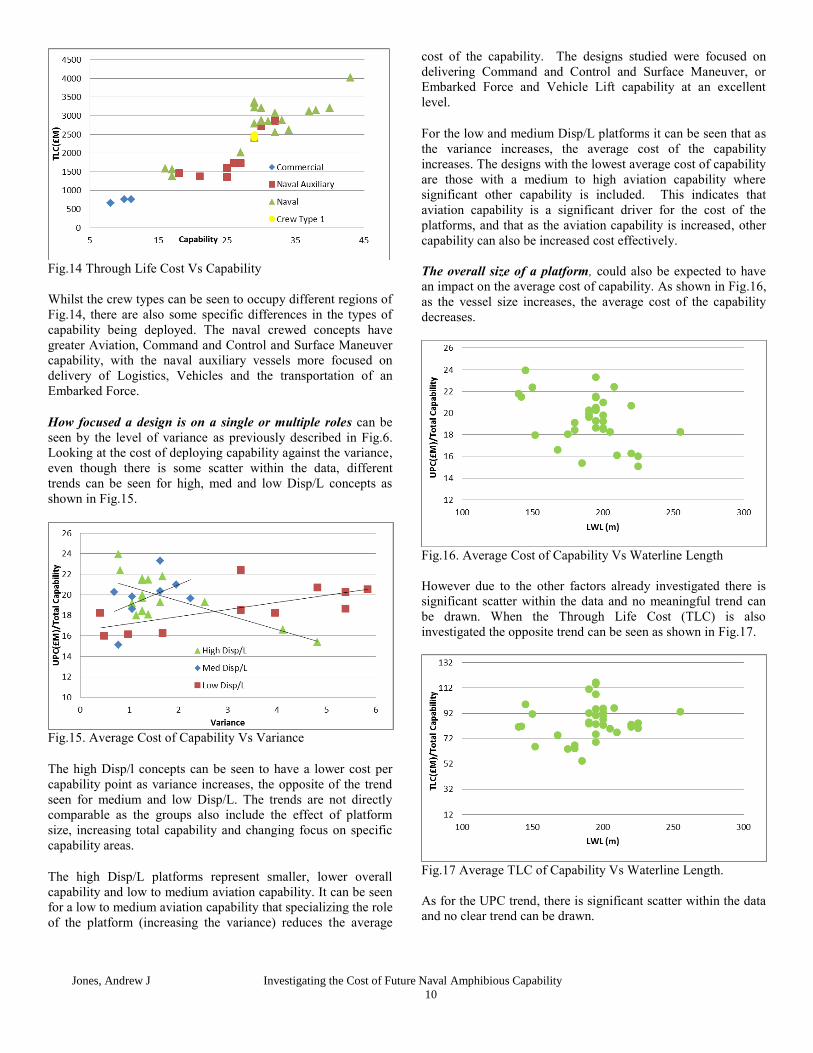
Fig.14 Through Life Cost Vs Capability
Whilst the crew types can be seen to occupy different regions of
Fig.14, there are also some specific differences in the types of
capability being deployed. The naval crewed concepts have
greater Aviation, Command and Control and Surface Maneuver
capability, with the naval auxiliary vessels more focused on
delivery of Logistics, Vehicles and the transportation of an
Embarked Force.
How focused a design is on a single or multiple roles can be
seen by the level of variance as previously described in Fig.6.
Looking at the cost of deploying capability against the variance,
even though there is some scatter within the data, different
trends can be seen for high, med and low Disp/L concepts as
shown in Fig.15.
Fig.15. Average Cost of Capability Vs Variance
The high Disp/l concepts can be seen to have a lower cost per
capability point as variance increases, the opposite of the trend
seen for medium and low Disp/L. The trends are not directly
comparable as the groups also include the effect of platform
size, increasing total capability and changing focus on specific
capability areas.
The high Disp/L platforms represent smaller, lower overall
capability and low to medium aviation capability. It can be seen
for a low to medium aviation capability that specializing the role
of the platform (increasing the variance) reduces the average
cost of the capability. The designs studied were focused on
delivering Command and Control and Surface Maneuver, or
Embarked Force and Vehicle Lift capability at an excellent
level.
For the low and medium Disp/L platforms it can be seen that as
the variance increases, the average cost of the capability
increases. The designs with the lowest average cost of capability
are those with a medium to high aviation capability where
significant other capability is included. This indicates that
aviation capability is a significant driver for the cost of the
platforms, and that as the aviation capability is increased, other
capability can also be increased cost effectively.
The overall size of a platform, could also be expected to have
an impact on the average cost of capability. As shown in Fig.16,
as the vessel size increases, the average cost of the capability
decreases.
Fig.16. Average Cost of Capability Vs Waterline Length
However due to the other factors already investigated there is
significant scatter within the data and no meaningful trend can
be drawn. When the Through Life Cost (TLC) is also
investigated the opposite trend can be seen as shown in Fig.17.
Fig.17 Average TLC of Capability Vs Waterline Length.
As for the UPC trend, there is significant scatter within the data
and no clear trend can be drawn.
Jones, Andrew J Investigating the Cost of Future Naval Amphibious Capability
11
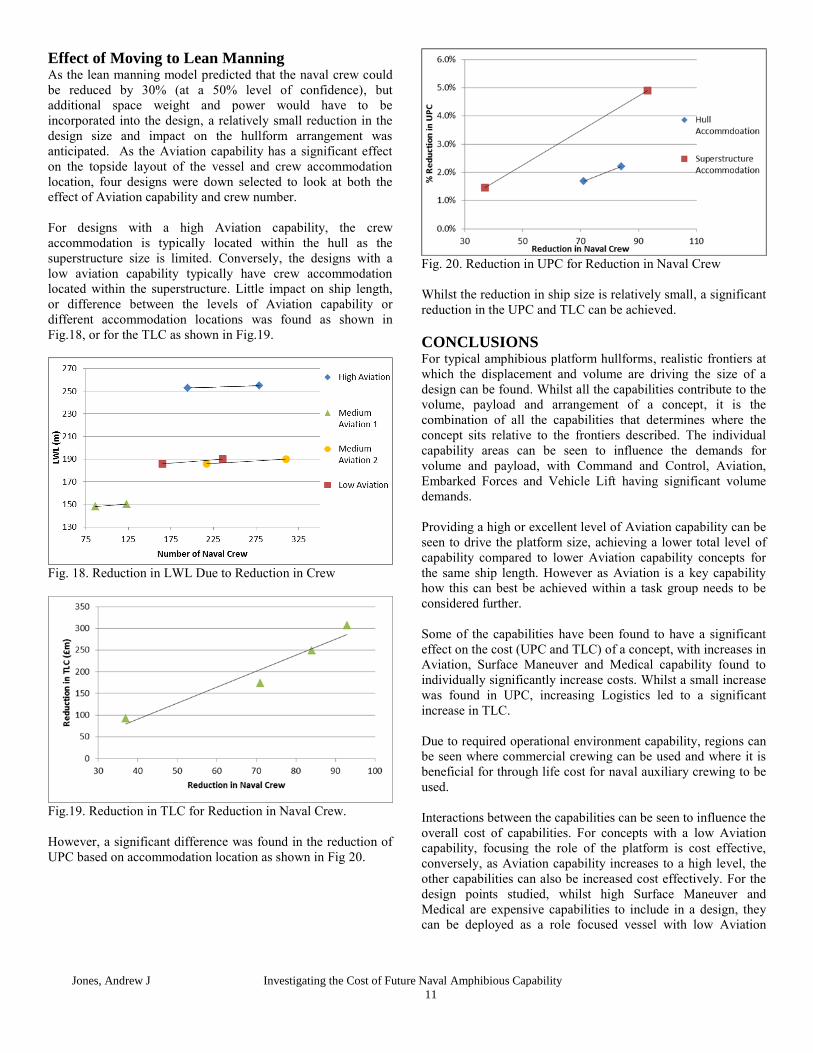
Effect of Moving to Lean Manning As the lean manning model predicted that the naval crew could
be reduced by 30% (at a 50% level of confidence), but
additional space weight and power would have to be
incorporated into the design, a relatively small reduction in the
design size and impact on the hullform arrangement was
anticipated. As the Aviation capability has a significant effect
on the topside layout of the vessel and crew accommodation
location, four designs were down selected to look at both the
effect of Aviation capability and crew number.
For designs with a high Aviation capability, the crew
accommodation is typically located within the hull as the
superstructure size is limited. Conversely, the designs with a
low aviation capability typically have crew accommodation
located within the superstructure. Little impact on ship length,
or difference between the levels of Aviation capability or
different accommodation locations was found as shown in
Fig.18, or for the TLC as shown in Fig.19.
Fig. 18. Reduction in LWL Due to Reduction in Crew
Fig.19. Reduction in TLC for Reduction in Naval Crew.
However, a significant difference was found in the reduction of
UPC based on accommodation location as shown in Fig 20.
Fig. 20. Reduction in UPC for Reduction in Naval Crew
Whilst the reduction in ship size is relatively small, a significant
reduction in the UPC and TLC can be achieved.
CONCLUSIONS
For typical amphibious platform hullforms, realistic frontiers at
which the displacement and volume are driving the size of a
design can be found. Whilst all the capabilities contribute to the
volume, payload and arrangement of a concept, it is the
combination of all the capabilities that determines where the
concept sits relative to the frontiers described. The individual
capability areas can be seen to influence the demands for
volume and payload, with Command and Control, Aviation,
Embarked Forces and Vehicle Lift having significant volume
demands.
Providing a high or excellent level of Aviation capability can be
seen to drive the platform size, achieving a lower total level of
capability compared to lower Aviation capability concepts for
the same ship length. However as Aviation is a key capability
how this can best be achieved within a task group needs to be
considered further.
Some of the capabilities have been found to have a significant
effect on the cost (UPC and TLC) of a concept, with increases in
Aviation, Surface Maneuver and Medical capability found to
individually significantly increase costs. Whilst a small increase
was found in UPC, increasing Logistics led to a significant
increase in TLC.
Due to required operational environment capability, regions can
be seen where commercial crewing can be used and where it is
beneficial for through life cost for naval auxiliary crewing to be
used.
Interactions between the capabilities can be seen to influence the
overall cost of capabilities. For concepts with a low Aviation
capability, focusing the role of the platform is cost effective,
conversely, as Aviation capability increases to a high level, the
other capabilities can also be increased cost effectively. For the
design points studied, whilst high Surface Maneuver and
Medical are expensive capabilities to include in a design, they
can be deployed as a role focused vessel with low Aviation

Jones, Andrew J Investigating the Cost of Future Naval Amphibious Capability
12
capability or added to a high to excellent Aviation capability
platform cost effectively.
Looking at the average cost of capability, no clear benefit can be
seen of moving to a large platform over a smaller platform
although this would need to be looked at further at a fleet level
to include the respective numbers of the platforms required.
A method for predicting the future crewing requirement has
been demonstrated. The impact of moving to lean manning for
naval crewed platforms has been estimated and the platform
impacts of lean manning were found to be relatively small, with
a small overall change to the platform size but a significant
reduction in the UPC and TLC.
ACKNOWLEDGEMENTS The Authors wish to thank David Lander (DSTL) for his
support throughout the study, Tom Smith (BMT) for support
in the statistical analysis conducted and BMT for the kind
permission and resources granted to complete the
investigation. All findings, ideas, opinions and errors herein
are those of the authors and are not those of BMT Defence
Services Limited.
REFERENCES D. Singer, N. Doerry, M.Buckley. What is Set-Based Design?,
ASNE Naval Engineers Journal, Vol 121, 2009
W. Mebane, C. Carlson, C. Dowd, D. Singer, M. Buckley. Set-
Based Design and the Ship to Shore Connector. ASNE
Naval engineers Journal, Vol 123, 2011.
NATO, Allied Joint Medical Support Doctrine, AJP-4.10 (A).
2006
D.G.M. Watson. Estimating Preliminary Dimensions in Ship
Design. Trans. IESS Vol 105, 1962.
D.G.M. Watson, A.W. Gilfillan. Some Ship Design Methods.
RINA 1976
J. Holtrop, G.C.J. Mennen. A Statistical Re-Analysis of
Resistance and Propulsion Data, International
Shipbuilding Progress, Vol 31, 1984
J. Holtrop, G.G.J. Mennen. An Approximate power prediction
method, International Shipbuilding Progress, Vol 29,
1982
J. Holtrop, G.G.J. Mennen. A Statistical power prediction
method, International Shipbuilding Progress, Vol 25,
1978
Organization for Economic Co-Operation and Development.
Compensated Gross Ton (CGT) System. 2007
J. Craggs.et al. Naval CGT Coefficients and Shipyard Learning.
Journal of Ship Production, Vol 20, 2004.
J. Craggs.et al. Methodology Used to Calculate Naval
Compensated Gross Tonnage Factors. Journal of Ship
Production, Vol 19, 2003.
T. Lamb. Discussion of Methodology Used to Calculate Naval
Compensated Gross Tonnage Factors .Journal of Ship
Production, Vol 19, 2003.
T. Lamb, R.P. Knowles. A Productivity metric for Naval Ships.
Ship Production Symposium 1999.
T. Lamb. A Productivity and technology metric for shipbuilding.
SNAME Great Lakes and Great Rivers Section Meeting
1998.
T. Lamb. The development of Gross Tonange Compensation
Coefficients for Naval Shipbuilding Based on Direct
Productivity Calculations. ASNE, manufacturing
Technology for Ship Construction and Repair
Conference 2002.
S.Erichsen. The Effect of Learning When Building Ships. Journal
of Ship Production.Vol 10. 1994
Office of the Assistant Secretary of Defense for Readiness &
Force Management. Defence Manpower Requirements
Report, Fiscal Year 2014. Total Force Planning &
Requirements Directorate, 2013.
J.A. Johnson et al. Human Systems Integration/Manning
Reduction for LHD-Type Ships. Technology Review
Journal, 2005.
T.B. Malone, J.R. Bost. HSI Top-Down Requirements Analysis
for Ship Manpower Reduction. WA:SPIE, 2000.
W.M. Post et al. Human Factors in Operational Maintenance –
Methods for Socio-Technical System Analysis applied
to OPV Operational Maintenance. TNO [Netherlands],
2013.