Embed Size (px)
Citation preview

Dublin Institute of TechnologyARROW@DIT
Articles School of Physics
2005-01-01
Investigation of the Effect of Subcutaneous Fat onImage Quality Performance of 2D ConventionalImaging and Tissue Harmonic ImagingJacinta BrowneDublin Institute of Technology, [email protected]
Amanda WatsonWestern Infirmary Glasgow
Peter HoskinsUniversity of Edinburgh
Alex ElliottWestern Infirmary Glasgow
Follow this and additional works at: http://arrow.dit.ie/scschphyart
Part of the Physics Commons
This Article is brought to you for free and open access by the School ofPhysics at ARROW@DIT. It has been accepted for inclusion in Articles byan authorized administrator of ARROW@DIT. For more information,please contact [email protected], [email protected],[email protected].
Recommended CitationBrowne, J., Watson, A., Hoskins, P., Elliott, A.: Investigation of the Effect of Subcutaneous Fat on Image Quality Performance of 2DConventional Imaging and Tissue Harmonic Imaging. Ultrasound in Medicine and Biology, Vol. 31 (7), pp.957-964. 2005.doi:10.1016/j.ultrasmedbio.2005.03.012

1
INVESTIGATION OF THE EFFECT OF SUBCUTANEOUS FAT
ON IMAGE QUALITY PERFORMANCE OF 2D
CONVENTIONAL IMAGING AND TISSUE HARMONIC
IMAGING
JACINTA E BROWNE 1 , AMANDA J WATSON 1 , PETER R HOSKINS 2 AND
ALEX T ELLIOTT 1
Department of Clinical Physics, Western Infirmary, Glasgow, UK 1
Department of Medical Physics, University of Edinburgh, UK 2
Correspondence Address
Dr Jacinta E Browne,
School of Physics,
Dublin Institute of Technology,
Kevin Street,
Dublin 8,
Ireland.
Email: [email protected]
Running Title: EFFECT OF FAT LAYERS ON 2D IMAGE QUALITY

2
INVESTIGATION OF THE EFFECT OF SUBCUTANEOUS FAT
ON IMAGE QUALITY PERFORMANCE OF 2D
CONVENTIONAL IMAGING AND TISSUE HARMONIC
IMAGING
ABSTRACT
Tissue harmonic imaging (THI) has been reported to improve contrast resolution,
tissue differentiation and overall image quality in clinical examinations. However, a
study carried out previously by the authors (Browne et al 2004) found improvements
only in spatial resolution and not in contrast resolution or anechoic target detection.
This result may have been due to the homogeneity of the phantom. Biological tissues
are generally inhomogeneous and THI has been reported to improve image quality in
the presence of large amounts of subcutaneous fat. The aims of the study were to
simulate the distortion caused by subcutaneous fat to image quality and thus
investigate further the improvements reported in anechoic target detection and contrast
resolution performance with THI compared with 2D conventional imaging. In
addition, the effect of three different types of fatmimicking layer on image quality was
examined. The abdominal transducer of two ultrasound scanners with 2D conventional
imaging and THI were tested, the 4C1 (AspenAcuson, Siemens Company, CA, USA)
and the C52 (ATL HDI 5000, ATL / Philips, Amsterdam, The Netherlands). An ex
vivo subcutaneous pig fat layer was used to replicate beam distortion and phase
aberration seen clinically in the presence of subcutaneous fat. Three different types of
fatmimicking layers (olive oil, lard and lard with fish oil capsules) were evaluated.
The subcutaneous pig fat layer demonstrated an improvement in anechoic target
3
detection with THI compared with 2D conventional imaging, but no improvement was
demonstrated in contrast resolution performance; a similar result was found in a
previous study conducted by this research group (Browne et al 2004) while using this
tissuemimicking phantom without a fat layer. Similarly, while using the layers of olive
oil, lard and lard with fish oil capsules, improvements due to THI were found in
anechoic target detection but, again, no improvements were found for contrast
resolution for any of the layer combinations. Therefore, it was felt that the lack of
improvement in contrast resolution performance may be due to the test phantom
design and not to whether a layer was present that caused beam distortion and phase
aberrations. (Email: [email protected])
Key Words: Computerised image analysis program, Tissue harmonic imaging, quality
control, anechoic target detection, contrast resolution performance, fatmimicking
layer.

4
INTRODUCTION
Tissue harmonic imaging is a relatively recent greyscale ultrasound imaging mode that
has been clinically reported as improving image quality (Desser and Jeffrey 2001),
particularly in patients who are difficult to scan with conventional ultrasound imaging,
despite improvements made to transducer technology, such as piezoelectric materials
with lower acoustic impedance, which have occurred during recent decades (Claudon
et al 2002). The primary cause of image degradation (noise and clutter) is the
composition of the body wall, in which fat, skin layer thickness and hydration level are
some of the principal causes of ultrasound beam distortion and scattering.
Additionally, lateral and slice thickness side lobes and reverberation artifacts contribute
to generation of image clutter. Often, image degradation occurs as the sound beam
traverses the layers of fat and muscle comprising the body wall. In conventional B
mode imaging, the sound beam must pass through the body wall twice. The result of
this round trip through the body wall layer and tissue of different impedance is image
clutter (noise). The amount of harmonics that each slight pulse distortion generates at
any given instant remains infinitesimal; the cumulative harmonic intensities increase as
the pulse propagates through tissue (tissue harmonic intensity is virtually zero at the
skin and increases with depth up to the point where tissue attenuation overcomes this
buildup and causes them to decrease again). The amplitude of the harmonics is
related to the nonlinear parameter B/A, which is an inherent characteristic of the tissue.
At all depths, tissue harmonic intensity remains lower than that of the fundamental.
Therefore, in the case of tissue harmonic imaging, the contribution of lateral and slice
thickness side lobes and reverberation artifacts to image degradation is minimal
compared with fundamental imaging, because the distorted and scattered energy is
5
much weaker than the transmitted energy and therefore generates much weaker
harmonics. Consequently, the main distortion and scattering caused by the skin and fat
layer is at reception of the harmonic signal and not for transmission of the fundamental
beam. Furthermore, it has been demonstrated that the harmonic beam profile at the
transducer focal zone is narrower and its sidelobe levels are lower than those of the
fundamental beam, resulting in improved lateral resolution. The second harmonic
signal amplitude, used for image formation in tissue harmonic imaging, varies with the
square of the amplitude of the fundamental, resulting in small regional variations in the
amplitude of the fundamental translating into larger variations in the amplitude of the
second harmonic. This accentuates ultrasound features such as shadowing, posterior
acoustic enhancement and comettail artifacts, which improves lesion detection and
characterisation. All of these give rise to the reported improvements in contrast
resolution and lateral resolution in THI images compared with fundamental mode
images (Averkiou et al 1997; Christopher 1997; Desser and Jeffrey 2001; Li and
Zagzebski 2000; Tranquart et al 1999; Ward et al 1997). Despite these clinical studies
being conducted to evaluate the improvements in image quality, there have been
limited technical evaluations to provide quantitative information about the
improvements in image quality with THI (Browne et al 2004). In a previous study, the
authors of this paper investigated the imaging performance of compound imaging,
tissue harmonic imaging and harmonic compound imaging compared with 2D
conventional imaging (Browne et al 2004) and improvements were found for axial and
lateral resolution and slice thickness, with no improvements in anechoic target
detection or contrast resolution performance being detected with tissue harmonic
imaging and improvements in contrast resolution and anechoic target detection with
compound imaging and harmonic compound imaging. These results were not

6
representative of what has been reported clinically and it was felt that the absence of
improvement in anechoic target detection and contrast resolution may have been due
to the homogeneous nature of the test object used. Therefore, the aims of this current
study were to investigate whether greater improvements in anechoic target detection
and contrast resolution image quality performance could be found with THI compared
with 2D conventional imaging when a layer of subcutaneous pig fat was used with the
test phantom. In addition, studies were carried out with a view to developing a fat
mimicking layer, based on the information obtained from the use of a subcutaneous pig
fat layer.
METHODS
Equipment
The ultrasound scanners used in this study were the HDI 5000 (Philips/ATL, Bothell,
USA) and an Acuson Aspen (Acuson / Siemens, CA, USA), both highend systems
dedicated for general ultrasound examinations. The two curvilinear abdominal
2 5 MHz transducers, 4C1 and C52, were used in this study. Both transducers had
tissue harmonic imaging mode in addition to 2D conventional imaging mode which
was also evaluated.
Tissue and FatMimicking Phantoms
The anechoic target detection and contrast resolution measurements were performed
using the GammexRMI model 403GS LE (Gammex RMI, WI, USA) general purpose
test object (Fig 1); the tissuemimicking material used in the phantom was an
7
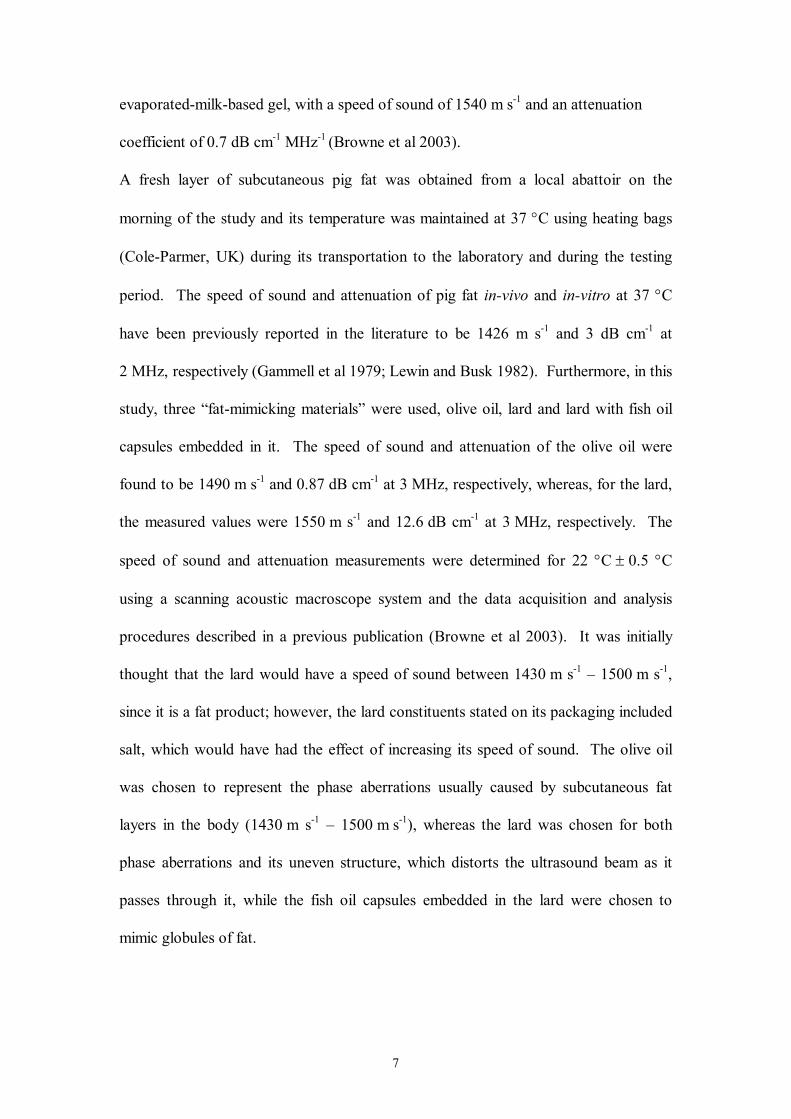
evaporatedmilkbased gel, with a speed of sound of 1540 m s 1 and an attenuation
coefficient of 0.7 dB cm 1 MHz 1 (Browne et al 2003).
A fresh layer of subcutaneous pig fat was obtained from a local abattoir on the
morning of the study and its temperature was maintained at 37 °C using heating bags
(ColeParmer, UK) during its transportation to the laboratory and during the testing
period. The speed of sound and attenuation of pig fat invivo and invitro at 37 °C
have been previously reported in the literature to be 1426 m s 1 and 3 dB cm 1 at
2 MHz, respectively (Gammell et al 1979; Lewin and Busk 1982). Furthermore, in this
study, three “fatmimicking materials” were used, olive oil, lard and lard with fish oil
capsules embedded in it. The speed of sound and attenuation of the olive oil were
found to be 1490 m s 1 and 0.87 dB cm 1 at 3 MHz, respectively, whereas, for the lard,
the measured values were 1550 m s 1 and 12.6 dB cm 1 at 3 MHz, respectively. The
speed of sound and attenuation measurements were determined for 22 °C ± 0.5 °C
using a scanning acoustic macroscope system and the data acquisition and analysis
procedures described in a previous publication (Browne et al 2003). It was initially
thought that the lard would have a speed of sound between 1430 m s 1 – 1500 m s 1 ,
since it is a fat product; however, the lard constituents stated on its packaging included
salt, which would have had the effect of increasing its speed of sound. The olive oil
was chosen to represent the phase aberrations usually caused by subcutaneous fat
layers in the body (1430 m s 1 – 1500 m s 1 ), whereas the lard was chosen for both
phase aberrations and its uneven structure, which distorts the ultrasound beam as it
passes through it, while the fish oil capsules embedded in the lard were chosen to
mimic globules of fat.

8
Test Protocol
The image quality parameters measured in this study were anechoic target detection
and contrast resolution.
In order to evaluate the effect of the fat layer on these image quality parameters
performance of two transducers (4C1 curvilinear transducer : Acuson Aspen; and C52
curvilinear transducer : Philips ATL HDI 5000), the following procedure was used.
Initially, a 1 cm layer of pig fat was coupled using ultrasonic jelly to the Gammex RMI
test phantom to evaluate its effect on the image quality. Differentsized fat layers were
initially used in this study but it was found that fat layers larger than 1 cm were very
attenuating and images of the anechoic targets at depths greater than 3 cm could not be
obtained nor could images of the contrast targets be obtained. The temperature of the
pig fat layer was maintained at 37°C ± 1°C using heating bags (ColeParmer, UK) in
order to replicate invivo thermal conditions. The appropriate target within the test
object was imaged firstly using 2D conventional imaging and then using the THI mode.
The image was optimised and captured using a frame grabber (VideoPort, MRT, USA)
for offline analysis using a computerised image analysis program developed by the
Medical Physics Department, Nottingham City Hospital (Gibson et al 2001). A
description of how the computerised image analysis program measures anechoic target
detection and contrast resolution and the associated measurement uncertainties are
described elsewhere (Browne et al 2004; Gibson et al 2001). All of the images
captured were 700 x 500 [pixel] 2 with an 8bit depth resolution. The 4C1 and C52
transducers were tested with the “abdominal” application settings and the optimisation
procedure involved adjusting the 2D overall gain and the timegaincontrols, as well as
choosing the appropriate number of focal zones to give the best possible image of the
test phantom target under test. The position and number of focal zones were kept

9
constant between 2D conventional imaging and THI. The acoustic output power
settings used for the 4C1 and the C52 curvilinear transducers was 100 % and it
remained constant for both 2D conventional imaging and THI. The transducer was
fixed in place throughout the test period of both imaging modes (2D conventional
imaging and THI), using a clamp and retort stand. This was the procedure used for
determining both anechoic target detection performance and contrast resolution
performance for 2D conventional imaging and THI for the two curvilinear abdominal
transducers.
Anechoic Target Detection This examines the scanner’s ability to detect and accurately
display round, negative contrast objects of various sizes at different depths within the
test object. This test combines aspects of spatial and contrast resolutions into a single
test, gives an indication of the scanner’s ability to detect cysts and is an indirect
measure of the scanner’s noise level.
Anechoic target detection was determined by the computerised image analysis program
by drawing a regionofinterest around the array of anechoic targets and calculating the
correlation coefficient between the detected target and an ideal target using a matched
filter. The correlation coefficient, R, was then transformed into the Zcoefficient,
which is the normal distribution of the correlation coefficient calculated as follows
(Altman 1991):
[ ] Z coefficient R R = + − ( )ln ( ) ( ) 1 2 1 1 .
The uncertainty (95 % CI) in the anechoic target detection measurement due to
reanalysis using the USQA program was ± 1 %; this represents the uncertainty in
comparison between different imaging modes with the probe clamped.

10
Contrast Resolution This describes the scanner’s contrast dynamic range and gives an
indication of the low and high contrast detectabilities. The ability of a scanner to
display a low contrast or a high contrast lesion in a tissue background is limited by the
noise or the saturation point of the scanner, respectively, and, as such, the contrast
resolution of a scanner may be representative of dynamic range gradient. Contrast
resolution can be evaluated by imaging cylinders with different scattering levels from
the surrounding material, which are present in most test objects.
Contrast resolution was measured using the prototype computerised image analysis
program by placing two points at opposite positions on the contrast target’s imaged
circumference. The program then drew two circles, one within the target and the other
outside the target. The contrast resolution of each of the targets was determined by
calculating the ratio of the mean pixel intensity of the target (Min) and the mean pixel
intensity of the background (Mout):
Contrast Resolution = (Min/Mout).
The uncertainty (95 % CI) in the visibility index measurement due to reanalysis using
the USQA program was ± 3 %; this represents the uncertainty in comparison between
different imaging modes with the probe clamped.
Furthermore, this procedure was used to determine which of the three different types
of fatmimicking layer best replicated the effect produced by the fat layer. The effect
of the three different types of fatmimicking layers on the image quality parameters was
investigated, in order to identify a suitable fatmimicking layer for performance and
quality control testing. The temperature of the test phantoms and the fatmimicking
layers was maintained at 22°C ± 2°C (room temperature, normal testing conditions)
during testing of the two ultrasound scanners and their respective transducers. The
11
two ultrasound scanners and their respective transducers were evaluated using three
different test phantom combination, as follows: test phantom and 1 cm olive oil layer;
test phantom and 1 cm lard layer; and test phantom and 1 cm lard layer embedded with
fish oil capsules (<1 mm). The olive oil was poured into the imaging wells of the test
phantoms, while the lard layers were coupled to the test phantoms using ultrasonic
jelly. The image qualities of the two ultrasound scanners’ curvilinear abdominal
transducers were evaluated using the three test phantom combinations described
above, using the same procedure as that previously outlined for the subcutaneous pig
fat layer.
12
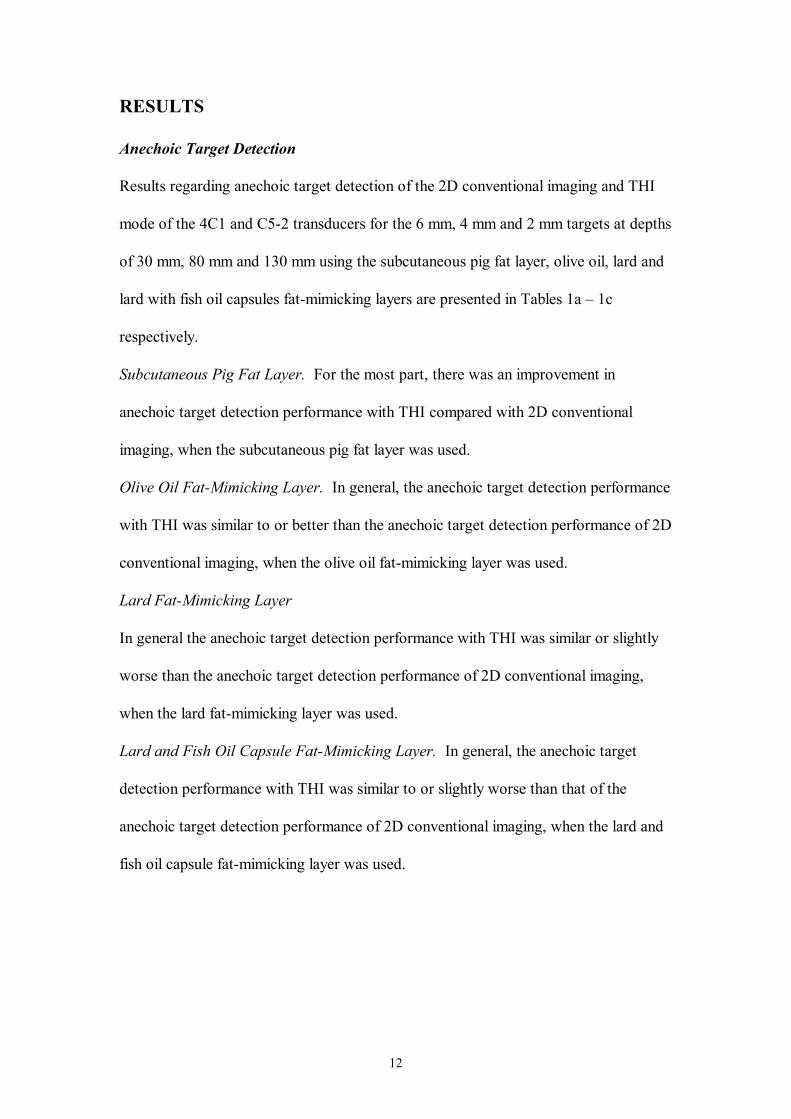
RESULTS
Anechoic Target Detection
Results regarding anechoic target detection of the 2D conventional imaging and THI
mode of the 4C1 and C52 transducers for the 6 mm, 4 mm and 2 mm targets at depths
of 30 mm, 80 mm and 130 mm using the subcutaneous pig fat layer, olive oil, lard and
lard with fish oil capsules fatmimicking layers are presented in Tables 1a – 1c
respectively.
Subcutaneous Pig Fat Layer. For the most part, there was an improvement in
anechoic target detection performance with THI compared with 2D conventional
imaging, when the subcutaneous pig fat layer was used.
Olive Oil FatMimicking Layer. In general, the anechoic target detection performance
with THI was similar to or better than the anechoic target detection performance of 2D
conventional imaging, when the olive oil fatmimicking layer was used.
Lard FatMimicking Layer
In general the anechoic target detection performance with THI was similar or slightly
worse than the anechoic target detection performance of 2D conventional imaging,
when the lard fatmimicking layer was used.
Lard and Fish Oil Capsule FatMimicking Layer. In general, the anechoic target
detection performance with THI was similar to or slightly worse than that of the
anechoic target detection performance of 2D conventional imaging, when the lard and
fish oil capsule fatmimicking layer was used.
13
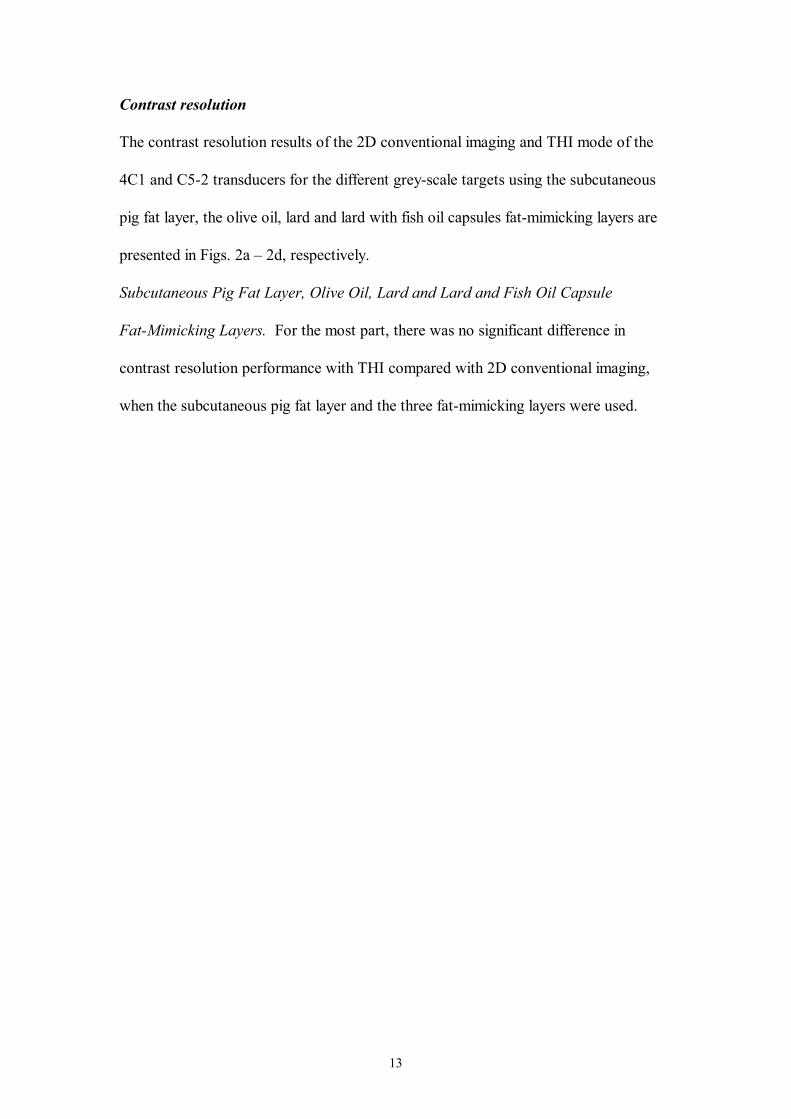
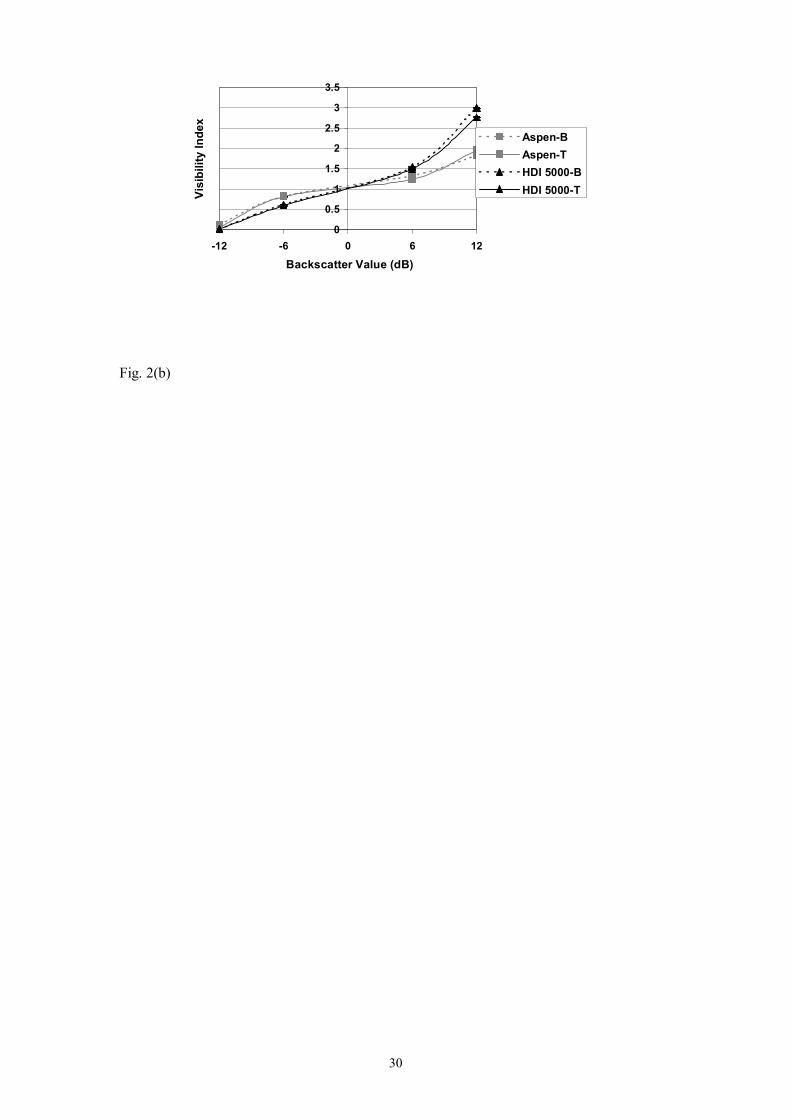
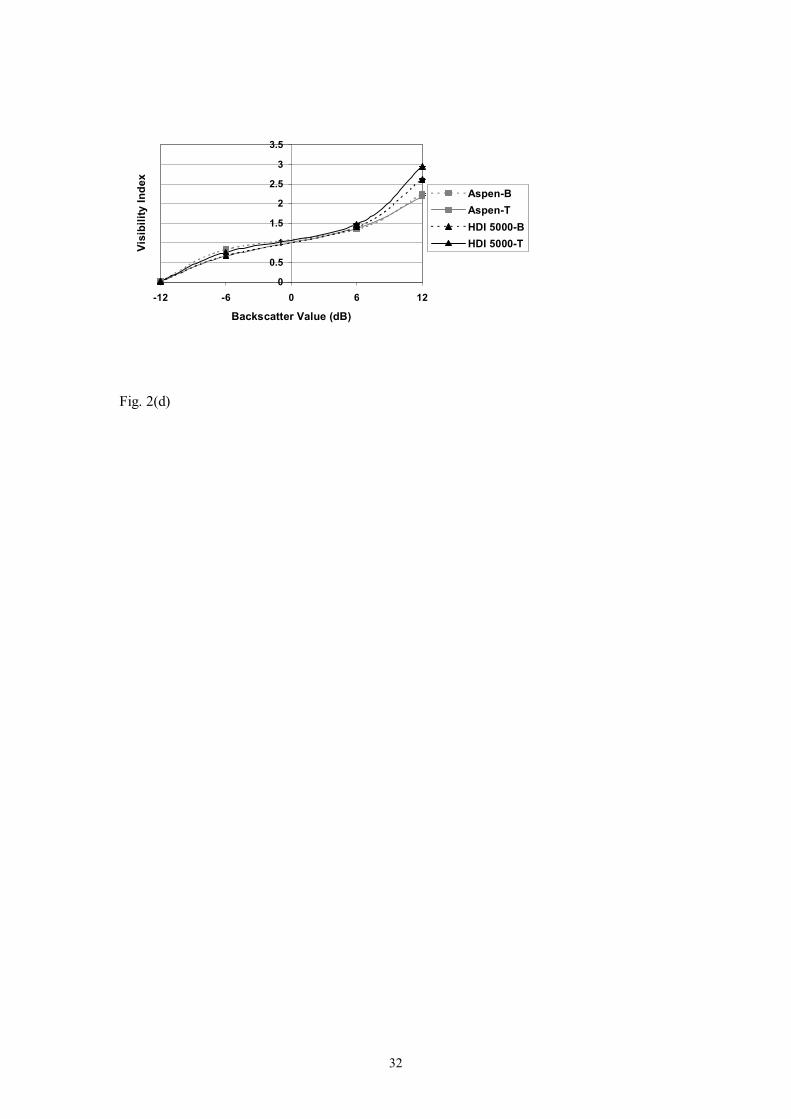
Contrast resolution
The contrast resolution results of the 2D conventional imaging and THI mode of the
4C1 and C52 transducers for the different greyscale targets using the subcutaneous
pig fat layer, the olive oil, lard and lard with fish oil capsules fatmimicking layers are
presented in Figs. 2a – 2d, respectively.
Subcutaneous Pig Fat Layer, Olive Oil, Lard and Lard and Fish Oil Capsule
FatMimicking Layers. For the most part, there was no significant difference in
contrast resolution performance with THI compared with 2D conventional imaging,
when the subcutaneous pig fat layer and the three fatmimicking layers were used.
14
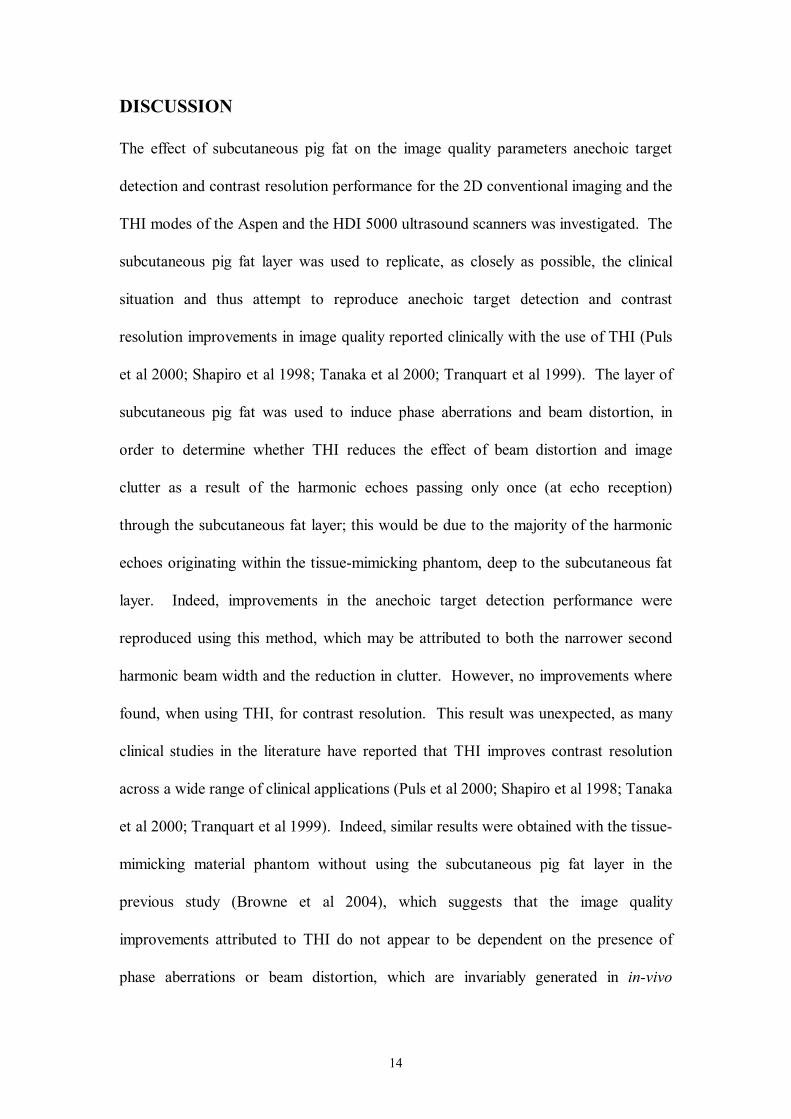
DISCUSSION
The effect of subcutaneous pig fat on the image quality parameters anechoic target
detection and contrast resolution performance for the 2D conventional imaging and the
THI modes of the Aspen and the HDI 5000 ultrasound scanners was investigated. The
subcutaneous pig fat layer was used to replicate, as closely as possible, the clinical
situation and thus attempt to reproduce anechoic target detection and contrast
resolution improvements in image quality reported clinically with the use of THI (Puls
et al 2000; Shapiro et al 1998; Tanaka et al 2000; Tranquart et al 1999). The layer of
subcutaneous pig fat was used to induce phase aberrations and beam distortion, in
order to determine whether THI reduces the effect of beam distortion and image
clutter as a result of the harmonic echoes passing only once (at echo reception)
through the subcutaneous fat layer; this would be due to the majority of the harmonic
echoes originating within the tissuemimicking phantom, deep to the subcutaneous fat
layer. Indeed, improvements in the anechoic target detection performance were
reproduced using this method, which may be attributed to both the narrower second
harmonic beam width and the reduction in clutter. However, no improvements where
found, when using THI, for contrast resolution. This result was unexpected, as many
clinical studies in the literature have reported that THI improves contrast resolution
across a wide range of clinical applications (Puls et al 2000; Shapiro et al 1998; Tanaka
et al 2000; Tranquart et al 1999). Indeed, similar results were obtained with the tissue
mimicking material phantom without using the subcutaneous pig fat layer in the
previous study (Browne et al 2004), which suggests that the image quality
improvements attributed to THI do not appear to be dependent on the presence of
phase aberrations or beam distortion, which are invariably generated in invivo

15
conditions. The 2 mm anechoic target detection result for conventional Bmode
imaging of the Aspen 4C1 transducer with the subcutaneous fat layer was found to be
Z = 0.65 at a depth of 80 mm, while the larger targets 4 mm and 6 mm at 80 mm were
not detected for conventional Bmode imaging of the Aspen 4C1 transducer. This is a
surprising result, as it would be expected that the larger targets would be easier to
detect compared with the smaller targets: this odd result may be due to the computer
algorithm detecting a speckle pattern in the image. The authors are currently
investigating the difference in detectability of the different size targets for human
observers and the computer analysis program. This lack of improvement in contrast
resolution performance with THI may be may be due to a combination of two factors,
the backscatter values of the targets embedded in the test phantom and the lack of
contrast targets of varying size at a range of depths within the test phantom. This
latter factor would facilitate the measurement of the contrastdetail performance of the
ultrasound scanner (Hall et al 1993; Lopez et al 1987; Lopez et al 1992). M c Cormack
et al 2002 detected improvements in contrast resolution with THI for a range of
ultrasound scanners using a prototype test phantom which had sets of conical targets
of varying backscatter at a range of depths. The contrastdetail analysis results
obtained in this study were found to have a good correlation with clinical perception of
contrast resolution for the same ultrasound scanners (McCormack et al 2002). This
result suggests that a new approach to evaluating contrast resolution may need to be
investigated. Furthermore, the use of the current design of tissuemimicking phantom
in combination with a fat layer was possibly not appropriate for the evaluation of the
contrast enhancements attributed to THI
16
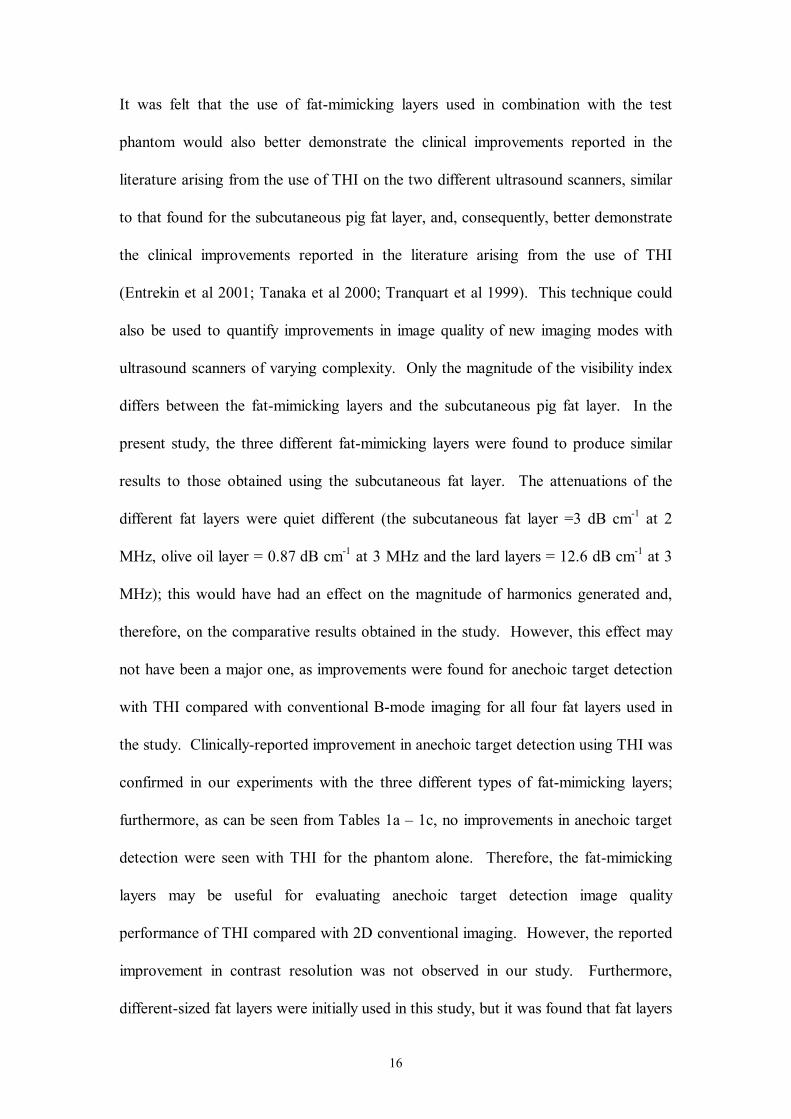
It was felt that the use of fatmimicking layers used in combination with the test
phantom would also better demonstrate the clinical improvements reported in the
literature arising from the use of THI on the two different ultrasound scanners, similar
to that found for the subcutaneous pig fat layer, and, consequently, better demonstrate
the clinical improvements reported in the literature arising from the use of THI
(Entrekin et al 2001; Tanaka et al 2000; Tranquart et al 1999). This technique could
also be used to quantify improvements in image quality of new imaging modes with
ultrasound scanners of varying complexity. Only the magnitude of the visibility index
differs between the fatmimicking layers and the subcutaneous pig fat layer. In the
present study, the three different fatmimicking layers were found to produce similar
results to those obtained using the subcutaneous fat layer. The attenuations of the
different fat layers were quiet different (the subcutaneous fat layer =3 dB cm 1 at 2
MHz, olive oil layer = 0.87 dB cm 1 at 3 MHz and the lard layers = 12.6 dB cm 1 at 3
MHz); this would have had an effect on the magnitude of harmonics generated and,
therefore, on the comparative results obtained in the study. However, this effect may
not have been a major one, as improvements were found for anechoic target detection
with THI compared with conventional Bmode imaging for all four fat layers used in
the study. Clinicallyreported improvement in anechoic target detection using THI was
confirmed in our experiments with the three different types of fatmimicking layers;
furthermore, as can be seen from Tables 1a – 1c, no improvements in anechoic target
detection were seen with THI for the phantom alone. Therefore, the fatmimicking
layers may be useful for evaluating anechoic target detection image quality
performance of THI compared with 2D conventional imaging. However, the reported
improvement in contrast resolution was not observed in our study. Furthermore,
differentsized fat layers were initially used in this study, but it was found that fat layers

17
larger than 1 cm are very attenuating and images of the anechoic targets at depths
greater than 3 cm could not be obtained, nor could images of the contrast targets be
obtained.

18
CONCLUSIONS
In this paper, it was found that THI improved anechoic target detection performance
with the use of a subcutaneous pig fat layer compared with 2D conventional imaging
and that a similar trend in the results was found for three different types of fat
mimicking layers evaluated; only the magnitude differed. However, THI was not
found to improve contrast resolution with any of the different fatlayers. This might be
due to the particular backscattering properties of the targets relative to those of the
surrounding medium and to the particular method used to determine the contrast
resolution (only four different backscattering targets at one set depth). Therefore, it
was felt that the lack of improvement in contrast resolution performance might be due
to the test phantom design and not to whether a layer was present that caused beam
distortion and phase aberrations. It was also found that the use of fatmimicking layers
replicated the effect of a subcutaneous pig fat layer on the image quality parameters
anechoic target detection and contrast resolution and may, therefore, be useful for
evaluating the image quality performance of THI compared with 2D conventional
imaging.

19
REFERENCES
Averkiou MA, Roundhill DN, and Powers JE. A new imaging technique based on the
nonlinear properties of tissues. IEEE Ultrasonics Symposium. 1997;15611566.
Browne JE, Ramnarine KV, Watson AJ, and Hoskins PR. Assessment of the Acoustic
Properties of Common TissueMimicking Test Phantoms. Ultrasound in Medicine and
Biology. 2003;29:10531060.
Browne JE, Watson AJ, Gibson NM, Dudley NJ, and Elliott AT. Objective
Measurements of Image Quality. Ultrasound in Medicine and Biology. 2004;30:229
237.
Christopher T. Finite amplitude distortionbased inhomogeneous pulse echo ultrasonic
imaging. Ieee Transactions on Ultrasonics Ferroelectrics and Frequency Control.
1997;44:125139.
Claudon M, Tranquart F, Evans DH, Lefevre F, and Correas JM. Advances in
ultrasound. European Radiology. 2002;12:718.
Desser TS and Jeffrey RB. Tissue harmonic imaging techniques: Physical principles
and clinical applications. Seminars in Ultrasound Ct and Mri. 2001;22:110.
Entrekin RR, Porter BA, Sillesen HH, Wong AD, Cooperberg PL, and Fix CH. Real
time spatial compound imaging: Application to breast, vascular, and musculoskeletal
ultrasound. Seminars in Ultrasound Ct and Mri. 2001;22:5064.

20
Gammell RM, Le Croisette DH, and Heyser RC. Temperature and frequency
dependence of ultrasonic attenuation in selected tissues. Ultrasound in Medicine and
Biology. 1979;5:269277.
Gibson NM, Dudley NJ, and Griffith K. A computerised quality control testing system
for Bmode ultrasound. Ultrasound in Medicine and Biology. 2001;27:16971711.
Hall TJ, Insana MF, Soller NM, and Harrison LA. Ultrasound ContrastDetail Analysis
A PreliminaryStudy in Human Observer Performance. Medical Physics.
1993;20:117127.
Lewin PA and Busk H. In vivo ultrasonic measurements of tissue properties. IEEE
Ultrasonics Symposium. 1982;709712.
Li YD and Zagzebski JA. Computer model for harmonic ultrasound imaging. IEEE
Transactions on Ultrasonics Ferroelectrics and Frequency Control. 2000;47:1000
1013.
Lopez H, Loew MH, Butler PF, and Hill MH. A ClinicalEvaluation of ContrastDetail
Analysis of Ultrasound Images. Ultrasonic Imaging. 1987;9:4950.
Lopez H, Loew MH, and Goodenough DJ. Objective Analysis of Ultrasound Images
by Use of A Computational Observer. Ieee Transactions on Medical Imaging.
1992;11:496506.

21
McCormack S, Evans JA, and Metcalfe SC. Assessing the improvement in contrast
detail resolution using tissue harmonic imaging. Ultrasound Quality Assurance 2002:
Bmode, Doppler and New Modalities.
Puls I, Berg D, Maurer M, Schliesser M, Hetzel G, and Becker G. Transcranial
sonography of the brain parenchyma: Comparison of Bmode imaging and tissue
harmonic imaging. Ultrasound in Medicine and Biology. 2000;26:189194.
Shapiro RS, Wagreich J, Parsons RB, StancatoPasik A, Yeh HC, and Lao R. Tissue
harmonic imaging sonography: Evaluation of image quality compared with
conventional sonography. American Journal of Roentgenology. 1998;171:12031206.
Tanaka S, Oshikawa O, Sasaki T, Ioka T, and Tsukuma H. Evaluation of tissue
harmonic imaging for the diagnosis of focal liver lesions. Ultrasound in Medicine and
Biology. 2000;26:183187.
Tranquart F, Grenier N, Eder V, and Pourcelot L. Clinical use of ultrasound tissue
harmonic imaging. Ultrasound in Medicine and Biology. 1999;25:889894.
Ward B, Baker AC, and Humphrey VF. Nonlinear propagation applied to the
improvement of resolution in diagnostic medical ultrasound. Journal of the Acoustical
Society of America. 1997;101:143154.

22
Table 1a. Zcoefficient of the 6 mm anechoic target as a function of depth for 2D
conventional imaging and THI of the 4C1 and C52 curvilinear abdominal
transducers in the general purpose test object with the subcutaneous pig fat
layer, the olive oil, the lard and the lard and fish oil capsules fatmimicking
layers.
Type of layer Depth of anechoic
target
4C1 2D imaging
4C1 THI
C52 2D imaging
C52 THI
Focal points at 40, 110 and 150mm
Error (± 0.01)
Focal points at 20, 50, 90 and 140mm Error (± 0.01)
Subcutaneous fat 30mm 0.81 0.92 0.96 1.03 80 mm 0 0.58 0.8 1.0 140 mm 0 0 0 0 Olive oil 30 mm 0.99 0.86 0.98 1.05 80 mm 0.87 0.84 0.75 0.83 140 mm 0 0 0 0 Lard 30 mm 1.09 1.01 1.12 1.14 80 mm 1.08 1.02 0.89 0.66 140 mm 0 0 0 0
Lard and fish oil capsules 30 mm 0.96 0.89 0.68 1.0 80 mm 0.83 0.69 0.85 0.82 140 mm 0 0 0 0
Phantom alone
30 mm 1.14 0.87 1.09 0.79 80 mm 0.89 0.94 0.97 0.73 140 mm 0.71 0.57 0.72 0
23
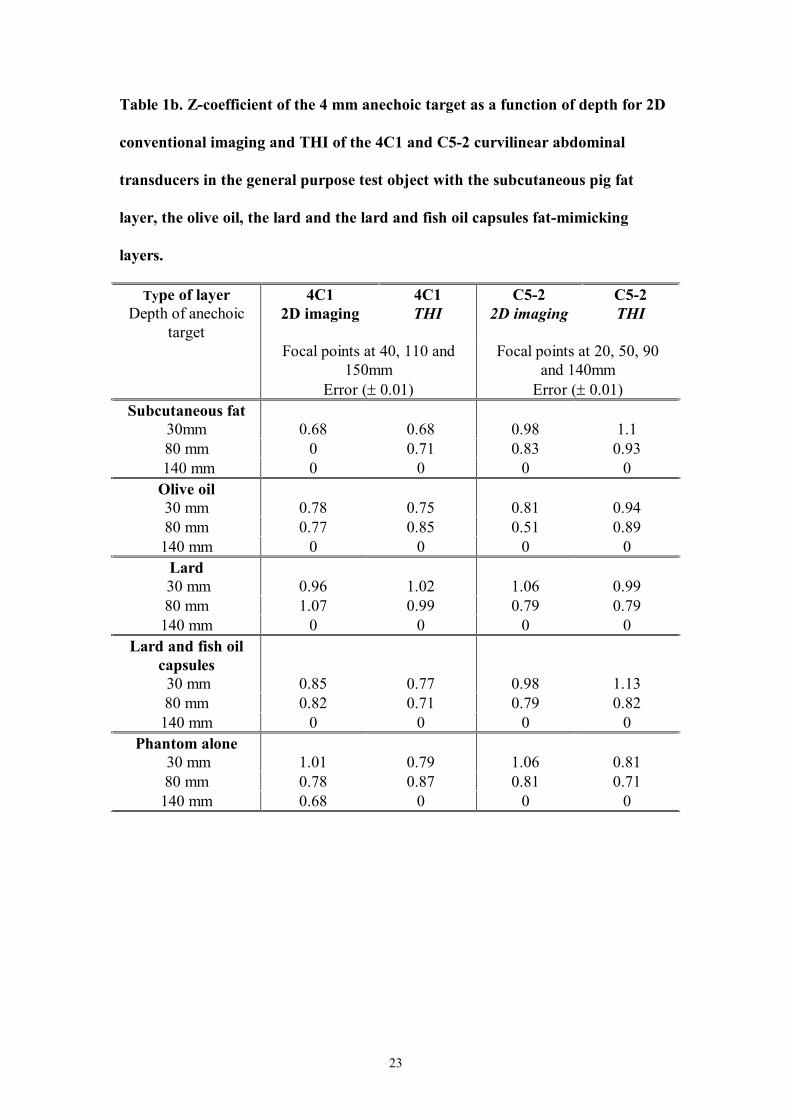
Table 1b. Zcoefficient of the 4 mm anechoic target as a function of depth for 2D
conventional imaging and THI of the 4C1 and C52 curvilinear abdominal
transducers in the general purpose test object with the subcutaneous pig fat
layer, the olive oil, the lard and the lard and fish oil capsules fatmimicking
layers.
Type of layer Depth of anechoic
target
4C1 2D imaging
4C1 THI
C52 2D imaging
C52 THI
Focal points at 40, 110 and 150mm
Error (± 0.01)
Focal points at 20, 50, 90 and 140mm Error (± 0.01)
Subcutaneous fat 30mm 0.68 0.68 0.98 1.1 80 mm 0 0.71 0.83 0.93 140 mm 0 0 0 0 Olive oil 30 mm 0.78 0.75 0.81 0.94 80 mm 0.77 0.85 0.51 0.89 140 mm 0 0 0 0 Lard 30 mm 0.96 1.02 1.06 0.99 80 mm 1.07 0.99 0.79 0.79 140 mm 0 0 0 0
Lard and fish oil capsules 30 mm 0.85 0.77 0.98 1.13 80 mm 0.82 0.71 0.79 0.82 140 mm 0 0 0 0
Phantom alone 30 mm 1.01 0.79 1.06 0.81 80 mm 0.78 0.87 0.81 0.71 140 mm 0.68 0 0 0
24
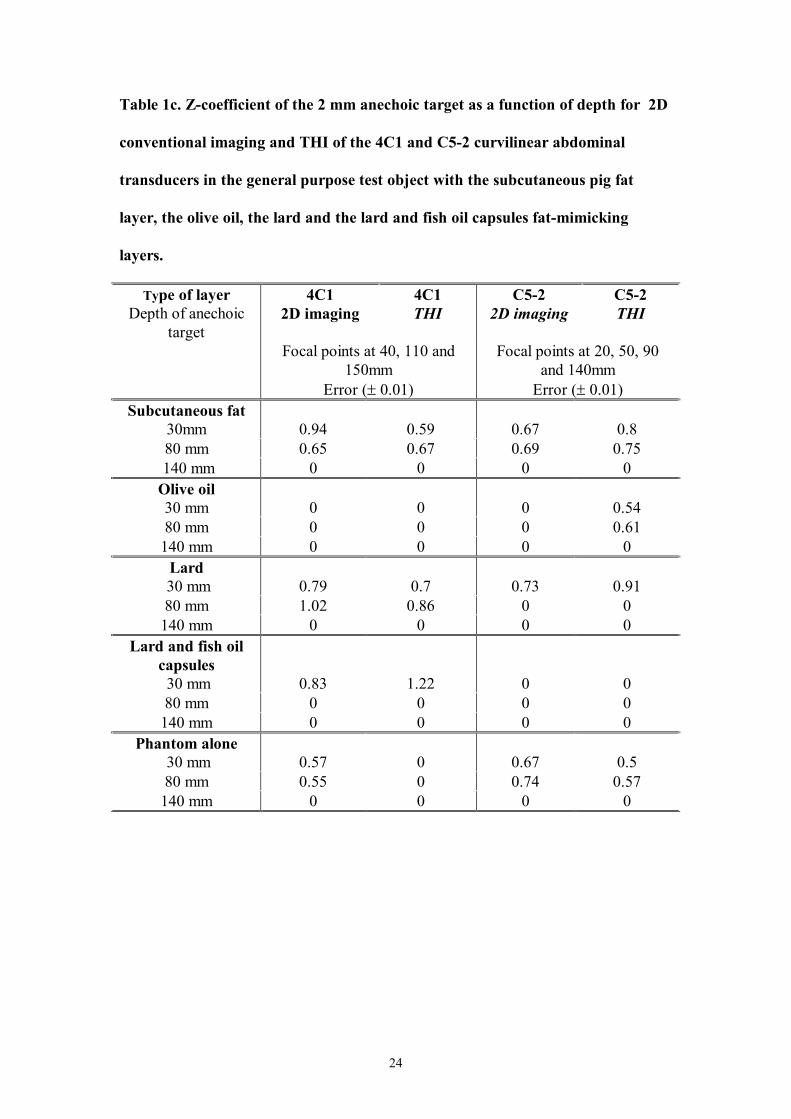
Table 1c. Zcoefficient of the 2 mm anechoic target as a function of depth for 2D
conventional imaging and THI of the 4C1 and C52 curvilinear abdominal
transducers in the general purpose test object with the subcutaneous pig fat
layer, the olive oil, the lard and the lard and fish oil capsules fatmimicking
layers.
Type of layer Depth of anechoic
target
4C1 2D imaging
4C1 THI
C52 2D imaging
C52 THI
Focal points at 40, 110 and 150mm
Error (± 0.01)
Focal points at 20, 50, 90 and 140mm Error (± 0.01)
Subcutaneous fat 30mm 0.94 0.59 0.67 0.8 80 mm 0.65 0.67 0.69 0.75 140 mm 0 0 0 0 Olive oil 30 mm 0 0 0 0.54 80 mm 0 0 0 0.61 140 mm 0 0 0 0 Lard 30 mm 0.79 0.7 0.73 0.91 80 mm 1.02 0.86 0 0 140 mm 0 0 0 0
Lard and fish oil capsules 30 mm 0.83 1.22 0 0 80 mm 0 0 0 0 140 mm 0 0 0 0
Phantom alone 30 mm 0.57 0 0.67 0.5 80 mm 0.55 0 0.74 0.57 140 mm 0 0 0 0
25
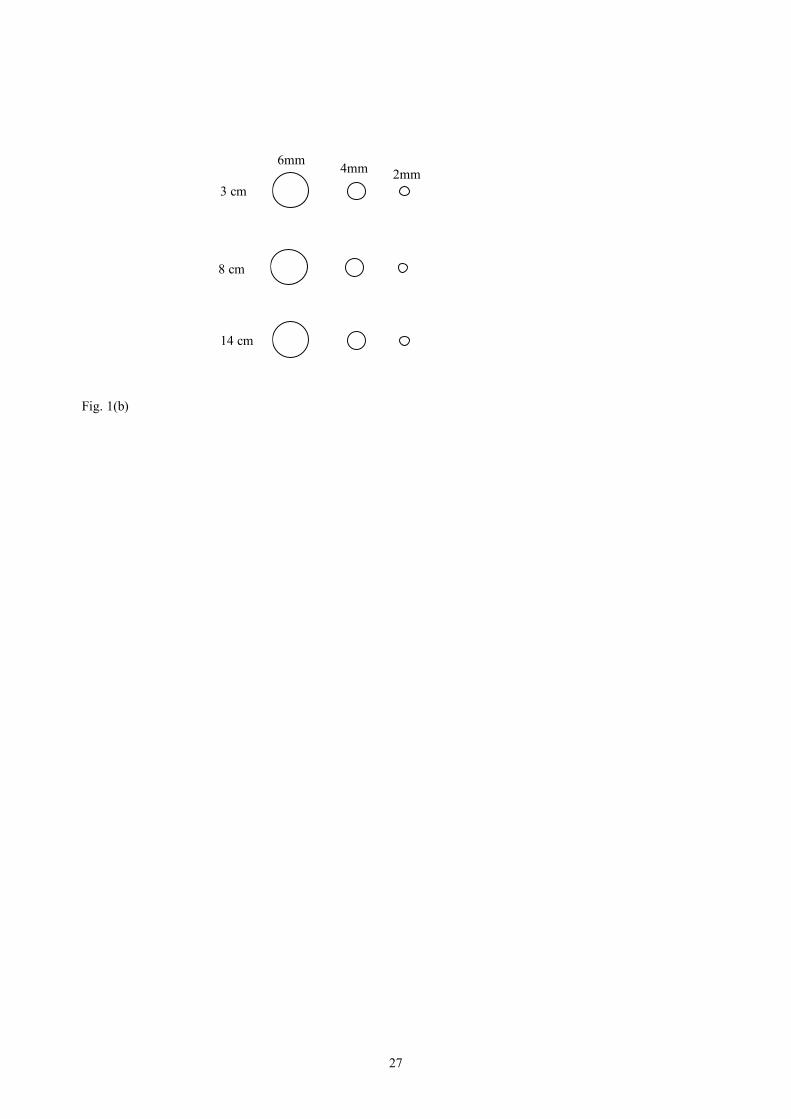
Fig. 1. (a) The RMI 403 GS LE multipurpose greyscale phantom; (b) Anechoic target
group: RMI 403 GS LE test object; (c) Contrast target group: RMI 403 GS LE test
object.
Fig. 2. Contrast resolution of the Bmode (B) and THI (T) mode of the 4C1 and C52
transducers. (a) Model 403GS LE test phantom and pig fat layer; (b) Model 403GS LE test
phantom and olive oil layer; (c) Model 403GS LE test phantom and lard layer;(c) Model
403GS LE test phantom and lard & fish oil capsules layer.
Fig. 3. 2D conventional images of the anechoic targets using the 4C1 transducer. (a)
Subcutaneous pig fat layer; (b) Olive oil fatmimicking layer; (c) Lard fatmimicking
layer and (d) Lard and fish oil capsules fa mimicking layer.

26
Fig. 1(a)
27
Fig. 1(b)
6mm 4mm 2mm 3 cm
8 cm
14 cm

28
Fig. 1(c)
+12dB +6dB 6dB 12dB

29
Fig. 2(a)
0
0.5
1
1.5
2
2.5
3
3.5
12 6 0 6 12
Backscatter Value (dB)
Visibility Inde
x
AspenB AspenT HDI 5000B HDI 5000T
30
Fig. 2(b)
0
0.5
1
1.5
2
2.5
3
3.5
12 6 0 6 12
Backscatter Value (dB)
Visibility Index
AspenB AspenT HDI 5000B HDI 5000T

31
Fig. 2(c)
0
0.5
1
1.5
2
2.5
3
3.5
12 6 0 6 12
Backscatter Value (dB)
Visibility Inde
x
AspenB AspenT HDI 5000B HDI 5000T
32
Fig. 2(d)
0
0.5
1
1.5
2
2.5
3
3.5
12 6 0 6 12
Backscatter Value (dB)
Visibility Inde
x
AspenB AspenT HDI 5000B HDI 5000T

33
Fig. 3
(a)
(c)
(b)
(d)