Embed Size (px)
Citation preview
Investigation of the neutral voltage in an unearthed network
Causes, effect and mitigation
MATTIAS HERMANSSON
Department of Energy and Environment Division of Electrical Power Engineering
CHALMERS UNIVERSITY OF TECHNOLOGY Göteborg, Sweden 2007

ii
Investigation of the neutral voltage in an unearthed networkCauses, effect and mitigation MATTIAS HERMANSSON © MATTIAS HERMANSSON, 2007 Department of Energy and Environment Chalmers University of Technology SE-412 96 Gothenburg Sweden Telephone +46 (0)31 – 772 1000

iii
Investigation of the neutral voltage in an unearthed network Causes, effect and mitigation MATTIAS HERMANSSON Department of Energy and Environment Electric Power Engineering division Chalmers University of Technology
Abstract
This report has been performed as a master thesis work at Forsmarks Kraftgrupp AB covering 20 university credits. The thesis investigated a problem with excessive neutral voltage at one of the internal systems in the power plant. The measurement of the neutral voltage is used as the indication of the presence of earth faults in these systems.
Initially, the layout of the power plant was studied as a starting point of the analyses. Discussions were then held with various persons working at the plant who had in-depth knowledge of the operation and design of these systems. Theoretical analysis of different typical loads that are connected was done and measurements of leakage currents on the one phase outputs were carried out. The statistical analysis of the fault occurrence frequency has also been performed.
The statistical analysis has not shown any significant repetitiveness; i.e. the fault does not occur at specific time intervals, nor any easily discernable cause of the faults. It has however been noticed that the faults are main occurred during one half of the year, from August to January, while in the remaining months, almost no faults were observed. The reason for the faults to occur only during autumn and winter has unfortunately not been found by this thesis.
The results of the measurements show that the amplitude of the leakage currents of the one-phase outputs are several times larger than the combined earth current, which shows the unsuitability of the measurement setup for this type of system. The recommendation has been made by this report that the monitoring equipment be changed.
Keywords: Neutral voltage, zero sequence, unbalance, unearthed network
iv
Acknowledgements
For their invaluable help during the making of this project I wish to thank everyone at FME, with special attention to Tommy Jansson, my supervisor at Forsmarks Kraftgrupp AB; Hans Thyr, Claes Jonsson, Fredrik Lundmark and Simon Medén for helping me do my measurements and Christer Johansson (FMK) for helping me getting the thesis work to begin with. Furthermore I want to thank all the people I’ve discussed the problem with to determine plausible causes, you are all too many to name.
I also wish to thank my examiner Tuan Le Ahn for his help during the project as well as Filip Pettersson who has helped me get information and papers normally only available from within Chalmers’ network.
v
Table of contents
Abstract ................................................................................................................................ iii Acknowledgements .............................................................................................................. iv Table of contents .................................................................................................................... v List of figures ....................................................................................................................... vi List of tables ........................................................................................................................ vii Chapter 1 - Introduction.......................................................................................................... 1
1.1. Background .................................................................................................................1 1.2. Scope of report ............................................................................................................1
Chapter 2 - Description of investigated system ....................................................................... 2 2.1. System description .......................................................................................................2 2.2. Parent systems .............................................................................................................4 2.3. Issue description ..........................................................................................................6
Chapter 3 - Method ................................................................................................................. 7 3.1. Theoretical analysis .....................................................................................................7 3.2. Measurements ..............................................................................................................7
3.2.1. Older measurements ..............................................................................................8 3.2.2. Present measurements ...........................................................................................8 3.2.3. Measurement problems .........................................................................................9
3.3. Discussed causes ..........................................................................................................9 3.3.1. Conditions at Forsmark .........................................................................................9 3.3.2. Conditions at other plants .................................................................................... 10
3.4. Statistics .................................................................................................................... 10 Chapter 4 - Results and analysis ........................................................................................... 11
4.1. Older theories ............................................................................................................ 11 4.2. Influence of power electronics ................................................................................... 12
4.2.1. Ringing phenomena ............................................................................................ 15 4.3. Result of theoretical analysis ...................................................................................... 15 4.4. Result of statistical analysis ....................................................................................... 16 4.5. Measurement analysis ................................................................................................ 20
4.5.1. Analysis of older measurements .......................................................................... 20 4.5.2. Analysis of new measurements............................................................................ 21
Chapter 5 - Conclusions........................................................................................................ 30 5.1. From theoretical analysis ........................................................................................... 30 5.2. From statistical analysis ............................................................................................. 30 5.3. From measurement analysis ....................................................................................... 30
Chapter 6 - Recommendations .............................................................................................. 32 6.1. Further investigation .................................................................................................. 32 6.2. Source of unbalance ................................................................................................... 32 6.3. Rebalancing system ................................................................................................... 32 6.4. Alarm frequency reduction ......................................................................................... 32 6.5. Altered measurement compromise ............................................................................. 33
Appendix A. References ................................................................................................. 34

vi
List of figures
Figure 2.1: An overview of system 656 and parent systems. [1] ..............................................3 Figure 2.2: Earthing equipment and neutral voltage measurement converter ...........................4 Figure 2.3: Overview of topmost systems. [3] .........................................................................5 Figure 2.4: Overview of middle systems. [4] ..........................................................................5 Figure 2.5: Illustration of raised base level influence on alarm frequency ...............................6 Figure 3.1: Measurement setup for measuring leakage currents. .............................................8 Figure 4.1: FFT of the phase A voltage and earth current. ..................................................... 11 Figure 4.2: FFT for leakage currents in sub B ....................................................................... 12 Figure 4.3: Reduced equivalent circuit of a power supply unit with passive power factor
correction...................................................................................................................... 13 Figure 4.4: Reduced equivalent circuit of a PSU with active power factor correction ............ 13 Figure 4.5: Leakage current for output MB13 ....................................................................... 14 Figure 4.6: Equivalent circuit of three-phase circuit with impedance to earth ........................ 15 Figure 4.7: Alarm frequency analysis since 2003 .................................................................. 17 Figure 4.8: Number of alarms per day since Jul 2003 ............................................................ 18 Figure 4.9: Number of alarms each day of the week; between August 2003 and January 2007
..................................................................................................................................... 19 Figure 4.10: Number of alarms each month of the year; between August 2003 and January
2007 ............................................................................................................................. 19 Figure 4.11: Phasor diagram over voltages and currents of sub D measured 2005-10-24 ....... 21 Figure 4.12: Phase voltages and currents for sub A at fundamental frequency (50 Hz) .......... 22 Figure 4.13: FFT of voltages on sub B .................................................................................. 23 Figure 4.14: Complex voltages at the fundamental frequency for sub B ................................ 24 Figure 4.15: Leakage current phasors of sub B ..................................................................... 25 Figure 4.16: Phase voltages and -currents; and neutral voltage for sub C .............................. 26 Figure 4.17: Leakage current phasors of sub C ..................................................................... 27 Figure 4.18: Phasor diagram of the voltages for sub D; including earth voltage .................... 28 Figure 4.19: Phasor diagram of leakage currents in sub D ..................................................... 29

vii
List of tables
Table 4.1 Zero sequence of older measurements and newly measured neutral voltage .......... 21 Table 4.2 Sequence voltages and currents for sub A ............................................................. 22 Table 4.3 Leakage currents for sub B; RMS and % of earth current ..................................... 25 Table 4.4 Sequence voltages and currents for sub C .............................................................. 26

1
Chapter 1 - Introduction
The following two sections introduces the report with some background on the properties of
unearthed electrical systems, and the protection they need, and the scope of the report with
some reasons to why it is valuable to know the system’s properties and a short introduction
into the different analyses performed.
1.1. Background
In an unearthed electrical system there is a problem with detecting one phase to ground faults as there is no intentional connection to earth that can complete the circuit for the fault current. Therefore these systems may have an unknown fault, since the systems continue to work even though one of the phases has a connection to earth. This can lead to hazardous environment for workers, unnecessarily high currents in the earth conductor and, in case of high temperature and humidity, rapid decay of insulation material and insulators.
In such systems measurements are required to find earth faults, as the fault current is very low and therefore does not trigger the fuses. One method used to measure this is to measure the neutral voltage which gives an indication if there is a fault somewhere in the system. As cable lengths and complexity increase, the capacitance of the system increase and therefore the naturally occurring neutral voltage increases due to the capacitive current to earth. This may in turn lead to unnecessary tripping of the alarm. In the worst case scenario this directly affects the operator’s alertness and thus also the detection of real faults.
Since this type of earthing is normally used in systems with high demands on reliability, and where it is acceptable that a fault is not immediately cleared, steps must be taken to ensure that the alarm does not trip when there is not an actual fault. This is also necessary to limit the fault frequency which could lead to operators ignoring the alarm.
1.2. Scope of report
Because of the issues presented in the previous section, it is important to know the state of the system at normal operating conditions. It is also important to know this if alterations to the system are done, to determine the impact of the change and if the system still behaves as expected and as originally intended.
This report will present the analysis of such a system that has the problem with high neutral voltage in normal operation. The report will present the results of phase voltage balance analysis and analysis of the different leakage currents. An extended statistical analysis of the alarm frequency, with the intent to determine any periodicity of the faults is also performed. Previous work has investigated if harmonics may be the culprit and the measurements done in this work will also verify if the harmonics have any effect on the neutral voltage.

2
Chapter 2 - Description of investigated system
To facilitate a thorough investigation of the system, and to enable a correct determination of
the likely fault location, knowledge of the system is necessary. A short description of the
system analyzed, and of some parent systems are presented in the next sections.
2.1. System description
The analyzed system (656) is a high reliability system fed by both uninterruptible power supply (UPS) and a diesel generator backup through a transformer connected Dy with the neutral connected to a voltage transformer for voltage monitoring. All loads are connected line to line which decreases every third harmonic current that could otherwise have created a neutral voltage. Since a high reliability is desirable the system has four parallel systems, called subs, which are denoted as sub A to sub D. These subs are supposed to be equal but some minor differences are present as some process related protective equipment is only connected to one or two of the subs. An overview of the system with parent systems is shown in Figure 2.1.
The system analyzed is a part of system 656 with the voltage level of 230 V, though the voltage levels shown in the figure below are the older levels that are no longer valid. The other part of this system has a voltage level of 525 V and it feeds the 230 V part through the transformer 656TX51 noted above. The 525 V part is normally fed from an UPS with bypass possible from the diesel generator backuped system 654.
The loads are connected line to line, either as three phase loads or one phase loads connected between two phases, which eliminates the need for a separate neutral conductor. This has the benefit that third harmonic current is eliminated, i.e. it doesn’t create any neutral current and therefore no neutral voltage, and that one phase to neutral faults do not occur. Phase to phase fault may still occur but these are impossible to separate from load current unless the fault current is high enough to trip the mini circuit breaker.

3
Figure 2.1: An overview of system 656 and parent systems. [1]
The earthing and monitoring equipment connected to the neutral is shown in Figure 2.2. The measurement converter converts the voltage from ac to dc quantities using a simple bridge rectifier which is then measured by the protective equipment.
656TX101
200 kVA
0.5/0.5 kV
656XX01
654XX01
500 V AC
656TX51
50 kVA
500/220 V
656XX51220 V AC
500 V AC

4
+−+−
+−
+
-
TransformerEarthingequipment
Measurementconverter
Figure 2.2: Earthing equipment and neutral voltage measurement converter
The neutral is connected to ground through a voltage measurement transformer, which has a time relay on the secondary side that trips the alarm when the voltage is higher than the limit during a set time limit. The system can be analyzed as an unearthed system because the impedance seen on the primary side of the transformer is larger than 4000 Ω, clearly inductive with more than 60° lagging phase angle. An average high impedance earthing resistor is between 30-600 Ω [2], depending on voltage level, which limits the fault current to around 1-10 A depending on application and since the impedance in this system is nearly 10 times the larger of these values the analysed system can be considered unearthed.
Loads on the system are for example relays, controllers, measurement equipment and valve motors. The loads are mostly small, one phase and there is a large number of them and they are mostly related to security functions. It is therefore imperative that the system is up and running as much as possible. It is also clear that unnecessary trips should be avoided in every possible way to not disrupt the security functions.
2.2. Parent systems
The system feeding system 656 is at voltage level 525 V with a backup diesel generator. This system is fed by either of two external 400 kV systems and by the regional 70 kV grid or by in-house turbines. If all these supply sources fail the system feeds itself from the diesel generator. Figure 2.3 shows a schematic of the interconnections of the parent system to our investigated system. In this figure, the four different subs are also visible with the logical connection between A / C and B / D.

5
Figure 2.3: Overview of topmost systems. [3]
In Figure 2.3 the systems connecting to the investigated systems are shown. The system in question, system 656, is connected to the lowest part of the schema, system 644, through system 654 and 655 which are the diesel backed up systems. Figure 2.4 shows how the systems are connected together.
654XX01 2000 kVA 6.6/0.5 kV
500 V AC
644XX01 6.6 kV
DG 651G101
Outputs
Figure 2.4: Overview of middle systems. [4]
Figure 2.4 shows how the middle systems with the diesel generator are connected both to the investigated system and to the topmost system shown earlier in this chapter.

6
2.3. Issue description
The issue being analyzed in this report is a problem with neutral voltage. The system, which is earthed only through the measurement equipment, has a high voltage on the neutral which at the worst affected sub is around 60-70 % of the alarm level. When that voltage goes above a certain value an alarm is triggered. This problem first appeared some time after the revision in 2003, but it is unclear if anything was done at that time that may have triggered it. There is no data on the voltage from before the first alarm and therefore it will never be known if the voltage was already high before this time.
While the issue in itself does not present a real problem, the consequence of it would be that the operator’s alertness may suffer when too many alarms go off. It is also a potential problem that the voltage is high since that may indicate a currently unknown problem even though the voltage is normally below the alarm trigger level.
1 2 3 4 5 6 7 8 9 100
1
2
3
4
5
6
7
8
Alarm level
Figure 2.5: Illustration of raised base level influence on alarm frequency
Figure 2.5 illustrates the influence raised base level have on the number of alarms. Both the curves have the same variations, but the green also have an extra offset added and this results in an extra alarm being triggered at point 2 on the x-scale, since the alarm level has been exceeded for the green curve but not the blue on. This alarm may not have been an issue if there hadn’t been an offset on the green curve.
7
Chapter 3 - Method
The work has been divided into several parts which will be presented below under different
subheadings. Firstly theoretical analysis of electrical parameters has been done to establish a
minimum value of the neutral voltage and a basis for further analysis. There is also an
analysis of the direct causes of the problem including measurements of voltage and current in
the system and investigation of the effects which different loads have with special emphasis on
power electronic equipment, such as switched-mode power supplies. A thorough investigation
of fault statistics has also been performed with the intent of finding any repetitive patterns,
process related sources or other non electrical sources. Lastly, the problem has been
discussed with several persons in an attempt to discern what views exist on the cause of the
problem.
3.1. Theoretical analysis
A neutral voltage could be caused by unbalance in voltages. If one of the phases does not have the same voltage as the others, negative- and zero-sequence voltages will be present. The voltage unbalance could be caused by many different factors, for instance transformer or load unbalance. The capacitive phase to earth current is also a suspect and since the system largely comprises of long cables that have high capacitance per metre, the capacitive current could be relatively high.
The theoretical analysis done in this report is calculations of the minimum zero sequence voltage created by the voltage imperfections due to the transformer. The analysis of the capacitive phase to earth current was not performed due to difficulties in determining the total length of cables in the system, or the capacitance of those cables and their connections.
3.2. Measurements
At the start of this work there were already some measurements done in the scope of a previous master thesis work. This has proved to be valuable as it enables comparisons of new data with previous data. These older measurements are presented here with a short analysis first and after that the new measurements are presented and commented.
The measurements were analysed using Fast Fourier Transform (FFT) to determine their properties. FFT is an algorithm for calculating the Discrete Fourier Transform (DFT) of a signal in a computer. The DFT calculates the complex frequency content of a time-limited signal, which can be used to determine the phase angle and amplitude of the input signal.
The FFT is also used to calculate the Total Harmonic Distortion (THD) of the signal using the equation (3.1). The THD is a measurement of how much distortion the signal contains.
%1002 1
⋅= ∑∞
=n
n
s
sTHD (3.1)
In this equation the THD is given in percent, s, s2 … sn is the DFT result of the signal.

8
3.2.1. Older measurements
Measurements performed in an older thesis work shows that the system is likely well behaved in that the neutral voltage is nearly identical to the calculated zero-sequence voltage as possible [5]. The phase current is severely distorted which makes the zero-sequence current difficult to analyse visually. The accuracy of the current clamps is not good enough either to make any analysis on the earth or leakage current. The measurements from this previous report also state that the RMS line-to-line voltage is approximately 230 V.
The conclusion that can be drawn from these measurements is that the fault has been present for a long time, and that the levels haven’t changed much since then. It is however, impossible to determine the cause of the problem by studying the older measurements alone.
3.2.2. Present measurements
Measurements have been carried out on the subs respective two-phase outputs. These are named MA11 to MD16 where the second letter signifies which sub, A through D, and the second number signifying the number of the output, 1 to 6 or 7 depending on which sub. Sub B and C have seven outputs while A and D have six.
Figure 3.1 shows the setup used to measure the leakage currents. A current clamp was put around both of the output’s conductors resulting in a subtraction of one of the phase currents with the other, thus yielding the total current that doesn’t return through one of the phase conductors.
Load
Currentmeasurement
Figure 3.1: Measurement setup for measuring leakage currents.
The planned initial measurements were current of the seven different outputs of each of the sub in the system and current and voltage on the transformer, including the earth current and neutral voltage. After the current measurements on the outputs differential measurements were planned. These measurements gave the difference in the currents going in and out of the one-phase loads, which when summed up should be identical to the earth fault current. Unfortunately one of the loads on the system was not measured as the current clamp didn’t fit physically over the conductors. The angle of the leakage current tells which phase-to-earth admittance has the most dominant properties for each of the outputs and this may give clues if and how any fault impedance is present.
Measurements done later, measuring only one phase voltage and the respective output’s leakage current has shown that the system in fact is not very nicely conditioned. The leakage currents are clearly above specifications of the entire system with one output as high as ten
9
times the alarm trigger level. The reason this does not create a continuous flow of alarms is due to the phase angle of the leakage currents. When the currents are summed up in the earth conductor the resulting earth currents are much lower than the individual output leakage currents. In the quite unlikely, but not impossible, scenario that two outputs have rather large phase to earth fault currents, but with opposite phases, these currents could go undetected for a long time. A balanced three phase fault would also go unnoticed, provided that the fault impedance is large enough to not trip the breakers. These scenarios are not very likely, but they can not be ignored, even though the loads are only connected between two of the phases.
3.2.3. Measurement problems
The initial measurements were a disappointment. The measurement devices were too inaccurate to give any meaningful result so new ones had to be found. The problem was solved by not using the Argus equipment but instead use a regular digital oscilloscope. However, the downside to this procedure is that only a few cycles can be saved. As the voltages and currents are rather stable this does not present a very large problem in reality.
Another issue that might be a problem is the current clamp that has a bandwidth of 1000 Hz, which may also be a problem in the measurements. To determine the effect this issue has, a digital low-pass filter could be applied to the signal to determine how much of the distortions remain when the frequency is limited to the bandwidth of the current clamp. A Butterworth filter is a good filter implementation due to its ideal pass-band characteristics.
Against this stands the fact that the same result is found in all the measured outputs, in similar state but with different amplitudes. Therefore it is plausible that there actually exists some kind of high frequency signal, but that the amplitude and phase may be incorrectly measured. When a low-pass Butterworth filter with a cut-off frequency of 1000 Hz, which is the guaranteed bandwidth of the current clamp, is applied, the resonance is still present, but with a limited amplitude and duration. This shows that the resonance is likely not in the current clamp but actually present on the system.
3.3. Discussed causes
Different theories on the cause of the problems were discussed with various persons at Forsmark, and at the other nuclear power plants in Sweden. The conditions are presented for different nuclear power plants in the following sections.
3.3.1. Conditions at Forsmark
In discussion with persons working at Forsmarks Kraftgrupp AB, some interesting ideas have been suggested as to the cause of the problem. Some of these have been studied more closely as they were determined to be plausible, whereas other ideas have been put aside as not very plausible.
One of the theories that were deemed plausible enough to warrant closer investigation was the theory that the high level were caused by harmonic content of the current drawn from the transformer. If a high enough third harmonic was present then this current could create a neutral voltage since it is a zero sequence current that could contribute to the voltage.
Other theories were that modern switch-mode power supplies affected the voltage with their power factor correction circuit; that the many loads present each contribute some, but not

10
much, and that the number of loads makes the current high; and that one or more load may be linked to weather or process parameters that only occur seldom. The theory with power supply units has been analysed theoretically, but not practically as the provisions for doing these test were not available. Other theories have only been analysed quickly to determine if they may be causing the problem.
3.3.2. Conditions at other plants
The other two nuclear power plants in Sweden also have systems with high demands on reliability. If they have been designed with the same type of system earthing they may experience similar problems.
3.3.2.1. Ringhals
There have been similar systems at Ringhals 1 but never any real problems with excessive neutral voltages exist. These systems have however had an overhaul on the monitoring equipment and currently use more advanced equipment that is capable of determining the distance to the faults which makes finding the faults considerably easier. The change has also come about to make the systems more reliable as ground faults are found quicker and therefore making double faults more unlikely.
3.3.2.2. Oskarshamn
Oskarshamn nuclear power plant does not have any similar problems on their systems. They have however not changed any of the rotating converters for power electronics based converters; the former which may have better voltage balance controllability. The other big difference is that they only employ different kinds of impedance earthing, instead of unearthed systems and this leads to fault currents that are easier to detect.
3.4. Statistics
The fault occurrence frequency data has been extracted from the Plant Vision Explorer program which has lists of all different alarms in the plant. These lists have been exported into Matlab for quick and easy analysis. The statistical analyses that have been performed are sorted on year, month, day of month and day of year. Frequency analysis has also been performed to determine if there is any kind of repetitiveness in the data.
11
Chapter 4 - Results and analysis
The results and analyses presented herein is the product of the combined measurements and
theoretical studies. They have been grouped by order of simplicity, where the earliest
conclusions are listed first.
4.1. Older theories
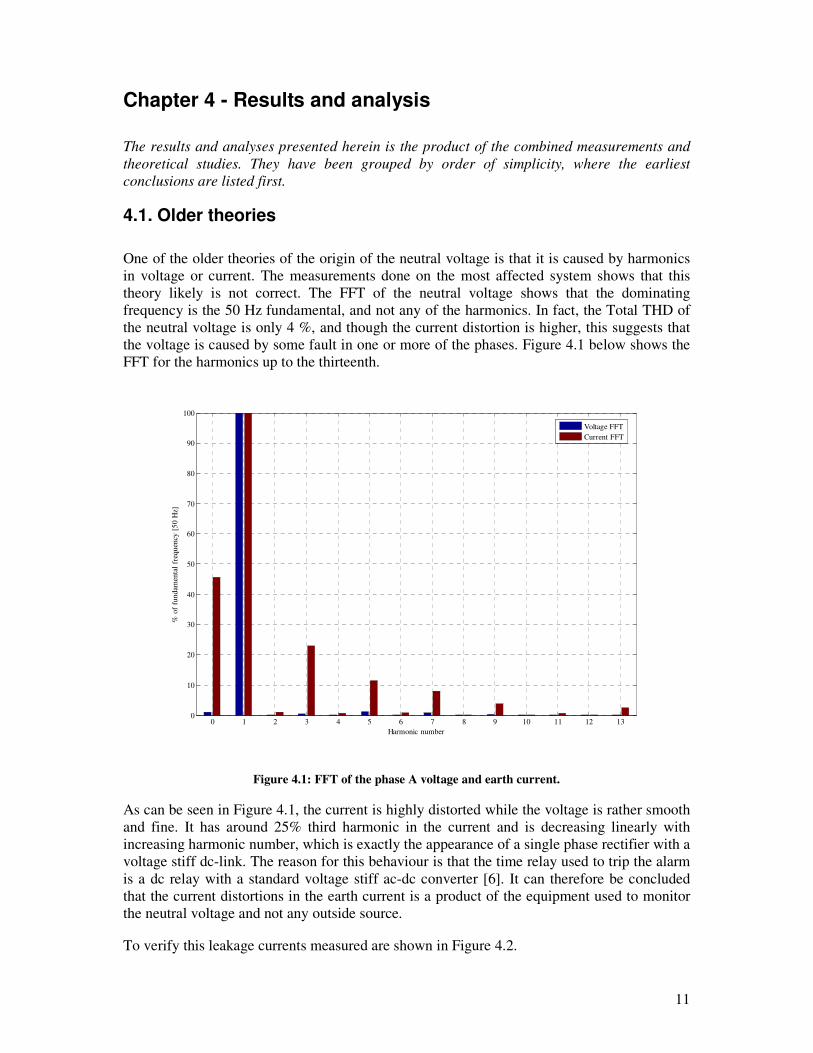
One of the older theories of the origin of the neutral voltage is that it is caused by harmonics in voltage or current. The measurements done on the most affected system shows that this theory likely is not correct. The FFT of the neutral voltage shows that the dominating frequency is the 50 Hz fundamental, and not any of the harmonics. In fact, the Total THD of the neutral voltage is only 4 %, and though the current distortion is higher, this suggests that the voltage is caused by some fault in one or more of the phases. Figure 4.1 below shows the FFT for the harmonics up to the thirteenth.
0 1 2 3 4 5 6 7 8 9 10 11 12 130
10
20
30
40
50
60
70
80
90
100
Harmonic number
% o
f fu
ndam
enta
l fr
eque
ncy
[50
Hz]
Voltage FFT
Current FFT
Figure 4.1: FFT of the phase A voltage and earth current.
As can be seen in Figure 4.1, the current is highly distorted while the voltage is rather smooth and fine. It has around 25% third harmonic in the current and is decreasing linearly with increasing harmonic number, which is exactly the appearance of a single phase rectifier with a voltage stiff dc-link. The reason for this behaviour is that the time relay used to trip the alarm is a dc relay with a standard voltage stiff ac-dc converter [6]. It can therefore be concluded that the current distortions in the earth current is a product of the equipment used to monitor the neutral voltage and not any outside source.
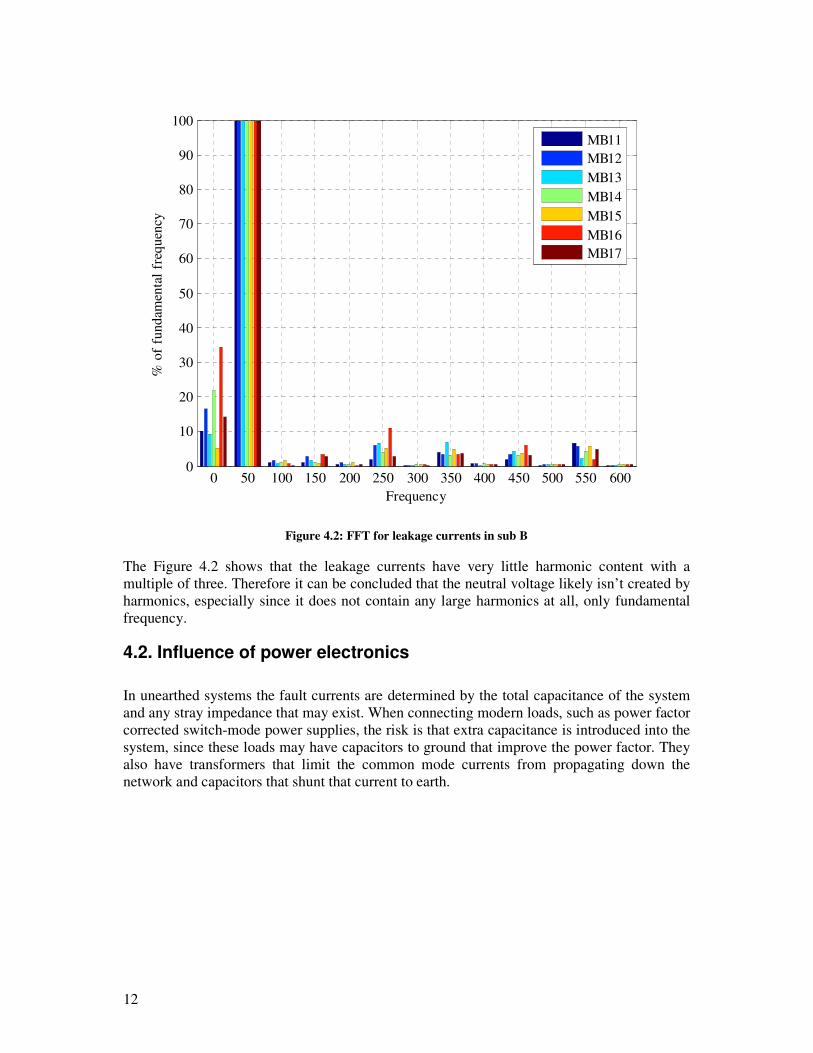
To verify this leakage currents measured are shown in Figure 4.2.
12
0 50 100 150 200 250 300 350 400 450 500 550 6000
10
20
30
40
50
60
70
80
90
100
Frequency
% o
f fu
ndam
enta
l fr
eque
ncy
MB11MB12
MB13
MB14
MB15
MB16MB17
Figure 4.2: FFT for leakage currents in sub B
The Figure 4.2 shows that the leakage currents have very little harmonic content with a multiple of three. Therefore it can be concluded that the neutral voltage likely isn’t created by harmonics, especially since it does not contain any large harmonics at all, only fundamental frequency.
4.2. Influence of power electronics
In unearthed systems the fault currents are determined by the total capacitance of the system and any stray impedance that may exist. When connecting modern loads, such as power factor corrected switch-mode power supplies, the risk is that extra capacitance is introduced into the system, since these loads may have capacitors to ground that improve the power factor. They also have transformers that limit the common mode currents from propagating down the network and capacitors that shunt that current to earth.
13
+−+−
+
-
Vdc
Passive PFC circuitPower lineequivalent circuit Rectifier circuit
Cy
Cx
Cy
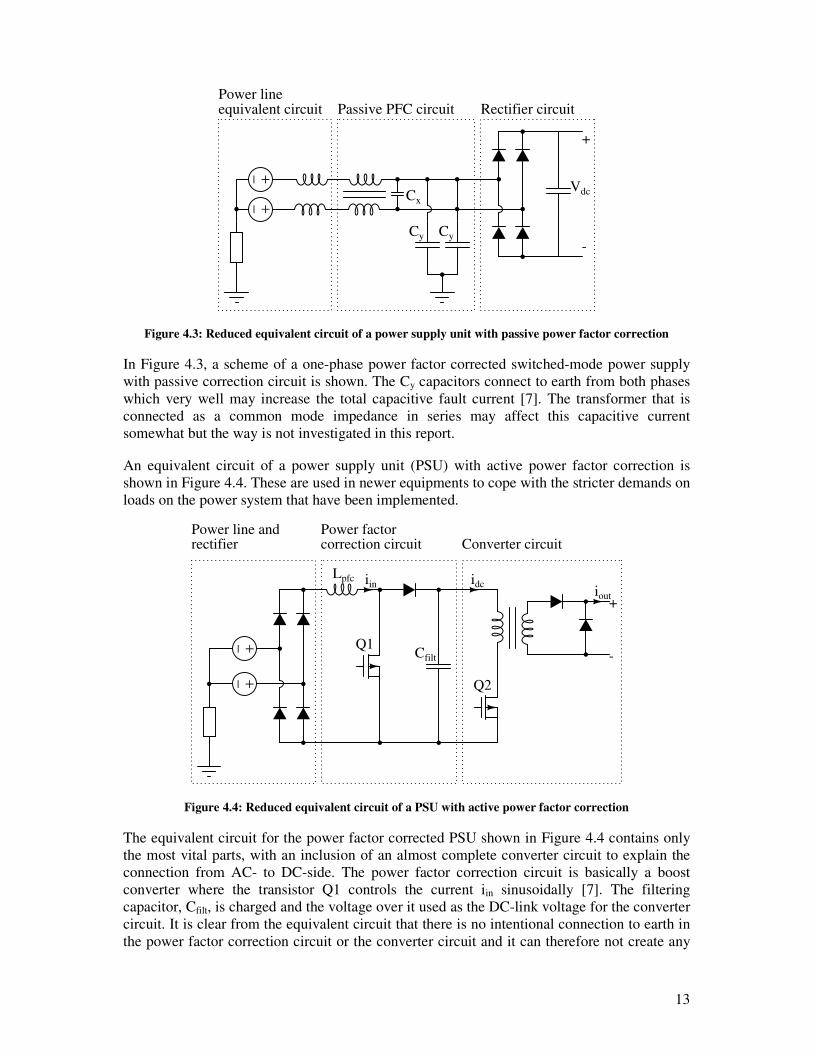
Figure 4.3: Reduced equivalent circuit of a power supply unit with passive power factor correction
In Figure 4.3, a scheme of a one-phase power factor corrected switched-mode power supply with passive correction circuit is shown. The Cy capacitors connect to earth from both phases which very well may increase the total capacitive fault current [7]. The transformer that is connected as a common mode impedance in series may affect this capacitive current somewhat but the way is not investigated in this report.
An equivalent circuit of a power supply unit (PSU) with active power factor correction is shown in Figure 4.4. These are used in newer equipments to cope with the stricter demands on loads on the power system that have been implemented.
+−+−
iin idciout
+
-Cfilt
Lpfc
Power factorcorrection circuit Converter circuit
Power line andrectifier
Q1
Q2
Figure 4.4: Reduced equivalent circuit of a PSU with active power factor correction
The equivalent circuit for the power factor corrected PSU shown in Figure 4.4 contains only the most vital parts, with an inclusion of an almost complete converter circuit to explain the connection from AC- to DC-side. The power factor correction circuit is basically a boost converter where the transistor Q1 controls the current iin sinusoidally [7]. The filtering capacitor, Cfilt, is charged and the voltage over it used as the DC-link voltage for the converter circuit. It is clear from the equivalent circuit that there is no intentional connection to earth in the power factor correction circuit or the converter circuit and it can therefore not create any

14
midpoint voltage by itself. There could however be an intentional earth connection on the secondary side of the converter transformer, but as there is no other galvanic connection there is no current flowing to earth.
The difference between the two types of PFCs is, in the area of relevance for this report, the intentional connection to earth. In the passive circuit there is a connection to earth through a capacitor whereas the active circuit have no intentional connection to earth at all. This capacitive connection that the passive circuit have could be trouble in the analysed system. The capacitive current could contribute to the total leakage current of the system and therefore create excessive midpoint voltage.
It has also been noted that the leakage currents have a quite interesting appearance. This behaviour is presented in Figure 4.5
0 30 60 90 120 150 180 210 240 270 300 330 360 390 420 450 480 510 540-200
-150
-100
-50
0
50
100
150
200
Vol
tage
[V
]
0 30 60 90 120 150 180 210 240 270 300 330 360 390 420 450 480 510 540-60
-45
-30
-15
0
15
30
45
60
Phase angle [deg]
Cur
rent
[m
A]
Phase A voltage [V]
Phase C voltage [V]
Leakage current [mA]
Figure 4.5: Leakage current for output MB13
It is seen from this figure that the leakage current is either 30 degrees after Phase C or 90 degrees before Phase A. There is clear waveform distortion in the voltage at the same phase angles as the leakage current has its resonance phenomenon compared to phase C which is relatively distortion free. Combined with the 90 degrees phase lead it is likely that this current is created by capacitive current from phase A to ground.
Where the voltage swing comes from is difficult to determine, but a reasonable guess is that the UPS is creating these swings as a by-product of its switching operation. It may also be caused by large loads that are connected to the parent system, especially with loads as thyristor bridge rectifiers which draws an extremely non-linear current. Other plausible culprits are diode bridge rectifiers with voltage stiff dc-link, and although the phase angle is quite high for single phase loads, for this system that is connected line to line the distortions
15
end up at almost the same phase angles as an ideal single phase bridge rectifier would have its diode commutation.
4.2.1. Ringing phenomena
During the measurement process a strange ringing phenomena was detected in the leakage current. The current had a superimposed 1800 Hz sinusoidal signal at specific phase angles of the voltage. An example of the phenomena is visible in the previously shown figure; Figure 4.5.
It was at first regarded as a problem in connected loads, as the voltages seemed unaffected. However, when examined more closely it was detected that the voltage indeed had some disturbance also at these precise angles. It was therefore concluded that the phenomena was caused by the UPS’ switching rather than load influence.
4.3. Result of theoretical analysis
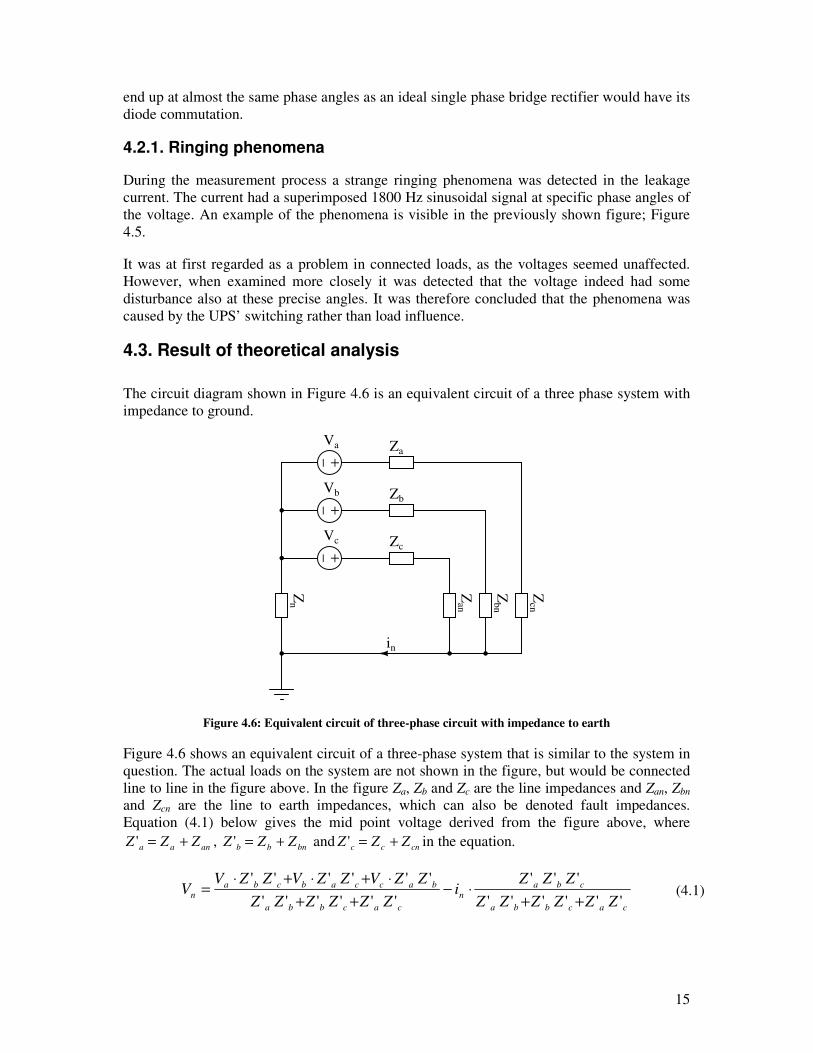
The circuit diagram shown in Figure 4.6 is an equivalent circuit of a three phase system with impedance to ground.
+−+−
+−
Zcn
Zbn
Zan
Zc
Zb
ZaVa
Vb
Vc
Zn
in
Figure 4.6: Equivalent circuit of three-phase circuit with impedance to earth
Figure 4.6 shows an equivalent circuit of a three-phase system that is similar to the system in question. The actual loads on the system are not shown in the figure, but would be connected line to line in the figure above. In the figure Za, Zb and Zc are the line impedances and Zan, Zbn and Zcn are the line to earth impedances, which can also be denoted fault impedances. Equation (4.1) below gives the mid point voltage derived from the figure above, where
anaa ZZZ +=' , bnbb ZZZ +=' and cncc ZZZ +=' in the equation.
cacbba
cban
cacbba
baccabcban
ZZZZZZ
ZZZi
ZZZZZZ
ZZVZZVZZVV
''''''
'''
''''''
''''''
++⋅−
++
⋅+⋅+⋅= (4.1)

16
To test the equation it is possible to set one or more of the impedances to infinity, which is equivalent to there not existing any phase to earth path for the current. With Zbn = ∞ and Zcn = ∞ the equation reduces to equation (4.2).
ana
cb
cba
n
cb
cba
n ZiVZZ
ZZZi
ZZ
ZZVV '
''
'''
''
''−=⋅−
⋅= (4.2)
This yields the expected equation for a simple reduction of the three phase system shown
above. When solving this for a one phase to earth fault in phase a, substituting n
n
nZ
Vi = yields
equation (4.3) below.
an
an
nZZ
VZV
'+= (4.3)
Since the earth impedance is constant, albeit unknown, the only variable is the fault impedance
aZ ' which has the effect, expectedly; that increasing it yields lower earth voltage,
while decreasing it gives higher earth voltage. The equation shows that the previously assumed behaviour of the system is correct, and that there is a possibility to calculate the fault impedance theoretically. When having more than one phase faults the result is a voltage divider that weighs the voltages with the fault impedances to give the total neutral voltage.
4.4. Result of statistical analysis
The statistical analysis on fault frequency has not given any significant information that can solve the issue with the high neutral voltage. The statistical distribution over a week is quite even, and the yearly distribution doesn’t give any clue. What can be said though is that the problem is repetitive by nature since one alarm is very likely to be followed by several others, sometimes within seconds. This could possibly be because when the voltage is high only small fluctuations is needed to trigger the alarm, which is set to trigger after 3.15 seconds.
Frequency analysis supports this theory to some extent. There is a large spike at around 12 months, which is as of now unexplained and also spikes at 110 to 155 days are observed. In Figure 4.7 below the three largest spikes have been marked with the period time.

17
0 100 200 300 400 500 6000
0.5
1
1.5
2
2.5
Period = 372
Period = 109.4118
Period = 155
Ala
rms
Period [days]
Figure 4.7: Alarm frequency analysis since 2003
As is shown in Figure 4.7 there is a slight overweight on longer time periods, though the precision is not very good at those period lengths. The most likely reason to the emphasis on long periods is the fact that there have been a few large isolated disruptions which happened to occur at random, large intervals and that these happens to be separated by that number of days. Figure 4.8 below shows the alarm distribution since the first alarm in August 2003.

18
01-Jul-2003 01-Jan-2004 01-Jul-2004 01-Jan-2005 01-Jul-2005 01-Jan-2006 01-Jul-2006 01-Jan-20070
20
40
60
80
100
120
Date
Num
ber
of a
larm
s pe
r da
y
Figure 4.8: Number of alarms per day since Jul 2003
Figure 4.8 shows the number of alarms per day since the alarms started showing up. It is clear from this plot that the likelihood of multiple alarms the same day is high since there are short periods that have a large amount of alarms and longer periods with a low amount of alarms per day.
The figure above shows the distribution over time since the first alarm but it is not possible to determine from that figure if there may be some kind of repetitiveness in the alarms and due to that Figure 4.9 and Figure 4.10 presents the number of alarms sorted on day of week and month, respectively.

19
Monday Tuesday Wednesday Thursday Friday Saturday Sunday0
100
200
300
400
500
600
Day of week
Num
ber
of a
larm
s
Figure 4.9: Number of alarms each day of the week; between August 2003 and January 2007
The number of alarms sorted by day of week does not really present anything interesting. Figure 4.9 shows an even distribution of alarms during the week. Thursday and Friday have a bit more alarms, but it is not an overwhelming number of alarms and therefore it is not likely that there is any statistical significance to the difference.
Jan Feb Mar Apr May Jun Jul Aug Sep Nov Dec Jan0
200
400
600
800
1000
1200
Num
ber
of a
larm
s
Month of year
Figure 4.10: Number of alarms each month of the year; between August 2003 and January 2007

20
The number of alarms sorted by day of month, shown in Figure 4.10, definitely has an interesting appearance compared to Figure 4.9. The number of alarms in February to July is so very much lower than the number of alarms in August to January that it is reasonable to analyse the differences and try to determine the reason. This has however proved to be quite difficult as the number of variables that affects the system is large. It may although be possible to draw the conclusion that the problem at least in part, is affected by something relating to time of year.
Analysis of the alarms of the entire process has not yielded any clue in finding the cause of the issue at hand. There is simply too much data to analyze for it to be feasible to do manually. The records of previous work orders has only in some, already known cases, been related to the problem.
4.5. Measurement analysis
The measurement analysis consists of a short presentation with analysis of the older measurements and continues with analysis of the newer measurements. Lastly there will be a short comparison between the different measurements.
4.5.1. Analysis of older measurements
The measurements from the previous thesis work [5] were not done in the same way as the new measurements. The old measurements use earth as a reference while the new measurements have the phase and earth voltages measured separately. By mistake the first measurements on the A sub were measured line to line while the others were measured phase to earth. The first measurement was thus removed from the analysis.
After performing FFT analysis on the measurements the complex voltages were plotted in a phasor diagram and the sequence voltages were calculated Figure 4.11 below shows the result.
The phasor diagram below, Figure 4.11, shows that there is quite a bit of phase angle difference between the measured voltages and what the voltages should be ideally. There is also a rather large mismatch in voltage magnitude. Subtracting the calculated zero sequence voltage clears almost all of these problems. As loads are connected between phases this zero sequence voltage does not affect the voltage that loads are experiencing.

21
-250 -200 -150 -100 -50 0 50 100 150 200 250-200
-150
-100
-50
0
50
100
150
200
Real voltage
Imag
inar
y vo
ltag
eVoltage Phase AVoltage Phase B
Voltage Phase C
Current Phase A
Current Phase B
Current Phase CZero sequence voltage
Figure 4.11: Phasor diagram over voltages and currents of sub D measured 2005-10-24
A comparison between the newer measurements to the older measurement’s zero sequence component are shown in Table 4.1. The difference in percent is very small, especially for the magnitude. The magnitude differs only by about 4 %, while the difference in angle is somewhat below 6 %.
Table 4.1 Zero sequence of older measurements and newly measured neutral voltage
Zero sequence component of older measurements
Measured neutral voltage new measurements.
°−∠ 8.1123.20 V °−∠ 7.1196.19 V
The foremost thing that can be deduced from looking at the earlier measurements are that the problem has been present for quite some time, and that it at least to some extent is similar to now. The fact that both the magnitude and the angle are almost similar suggests that the fault has been this way for quite some time.
4.5.2. Analysis of new measurements
In the process of doing the measuring and analysis of measurements some interesting details have come up. Firstly, since the digital oscilloscope only had two inputs it was only possible to measure two quantities at a time. It was determined that one of the input channels was to be used as a reference, measuring one of the phase voltages that was determined to be quite stable and usable as a reference. The other channel was used to measure the earth current and the different output’s leakage currents. The neutral voltage was also measured together with

22
the earth current. This was the only measured value that wasn’t measured with the phase voltage as a reference. Instead it was thought to be more interesting having a measurement with both neutral voltage and the earth current.
Firstly sub A was measured and due to the low output of the leakage clamp these measurements were not as useful as they could have been. The measurements on this sub was however the only measurements done with all the voltages and phase currents at the same time which gave true phase angles between voltages and between voltage and current.
-200 -150 -100 -50 0 50 100 150 200
-150
-100
-50
0
50
100
150
Real axis
Imag
inar
y ax
is
Phase A voltagePhase B voltage
Phase C voltage
Mid-point voltage
Phase A current
Phase B currentPhase C current
Figure 4.12: Phase voltages and currents for sub A at fundamental frequency (50 Hz)
Figure 4.12 shows a phasor diagram of the phase voltages and currents of sub A and from that figure it is possible to visually determine that the voltages are not symmetrical. The asymmetry is not large, but it is seen from phase B and C not being equally close to the -100 V real line. The currents are quite unsymmetrical with phase C current quite a bit lower than the other two. The phase angle of the currents are the expected lagging, and in a reasonable range somewhere around 15-30 degrees. The uneven loading of the transformer may be the reason that the voltages are not symmetrical. Table 4.2 presents the sequence voltages and currents. It is noteworthy to see that the properties seen in Figure 4.12 are reflected in the decomposed sequence voltages and currents.
Table 4.2 Sequence voltages and currents for sub A
Voltage Current Zero sequence °∠ 4.17910.1 V °−∠ 98.337.1 A Positive sequence °−∠ 2.598.189 V °−∠ 93.1049.35 A

23
Negative sequence °−∠ 6.13083.3 V °−∠ 9.641.18 A
Calculating the amount of unbalance in the voltages and currents in Table 4.2 above yields some interesting results. The amount of unbalance in the voltages is just above 2 % but the unbalance in the current is greater than 50 %. The standard [8] says that the voltage unbalance should not be over 2 %, which is just exceeded in this case. This uneven loading may contribute to the differing voltages on the terminals of the transformer.
The neutral voltage of sub A, which is not visible in Figure 4.12 due to the small amplitude, is nearly perfectly in phase with the zero sequence voltage. The difference is only about 1º, and though the neutral voltage has a lot higher amplitude, almost 7 V compared to little more than 1 V for the zero sequence, the zero sequence would certainly be one of the reasons that there is a neutral voltage present.
Analyzing the frequency content of the voltages on sub A was only performed hastily since the appearance is rather similar to sub B, but for sub B the resolution was markedly higher and was therefore selected for analysis. The figure below, Figure 4.13, shows the FFT for the seven lowest harmonics and the DC offset for sub B.
0 50 100 150 200 250 300 3500
20
40
60
80
100
120
140
Frequency [Hz]
Vol
tage
[V
]
Phase A
Phase BPhase C
Figure 4.13: FFT of voltages on sub B
The harmonics above 350 Hz in Figure 4.13 are very small and can be neglected. As is clearly visible the voltages are very nicely shaped as almost perfect sine waves with nearly no dc offset. Frequencies above 350 Hz is well below one volt each.

24
-200 -150 -100 -50 0 50 100 150 200
-150
-100
-50
0
50
100
150
Real voltage
Imag
inar
y vo
ltag
ePhase A voltage
Phase B voltagePhase C voltage
Mid-point voltage
Figure 4.14: Complex voltages at the fundamental frequency for sub B
The complex voltages in Figure 4.14 appear to be quite badly balanced. It appears as though the A phase is shifted about 10º from its correct position, the reason for this however lies in measurement problems, as the voltages were not measured at the same time, since the oscilloscope only had two inputs.
The leakage currents for the single phase outputs were measured and the phasor diagram is shown in Figure 4.15.

25
-0.15 -0.1 -0.05 0 0.05 0.1 0.15
-0.1
-0.05
0
0.05
0.1
Real current
Imag
inar
y cu
rren
tMB11
MB12MB13
MB14
MB15
MB16MB17
Total
Figure 4.15: Leakage current phasors of sub B
As evident from Figure 4.15 the currents cancel each other out somewhat, but there is a significant resulting current that increases the total earth current. The main noteworthy thing in this phasor diagram is the fact that the output MB15 is significantly worse in the leakage current aspect since it has double the voltage of the second largest output.
In Table 4.3 the leakage current in mA RMS and the ratio leakage to earth current is presented. The interesting thing in this table is that the leakage currents are in all but one case larger than the total earth current, significantly larger in fact. This shows that the assumption earlier that the leakage currents cancel each other out is likely to be true.
Table 4.3 Leakage currents for sub B; RMS and % of earth current
Output Leakage current [mArms]
Leakage current [% of earth current]
MB11 21.8 279 MB12 13.0 166 MB13 23.3 297 MB14 9.9 126 MB15 50.7 645 MB16 6.8 87
MB17 15.2 194
Earth current 7.8 100
26
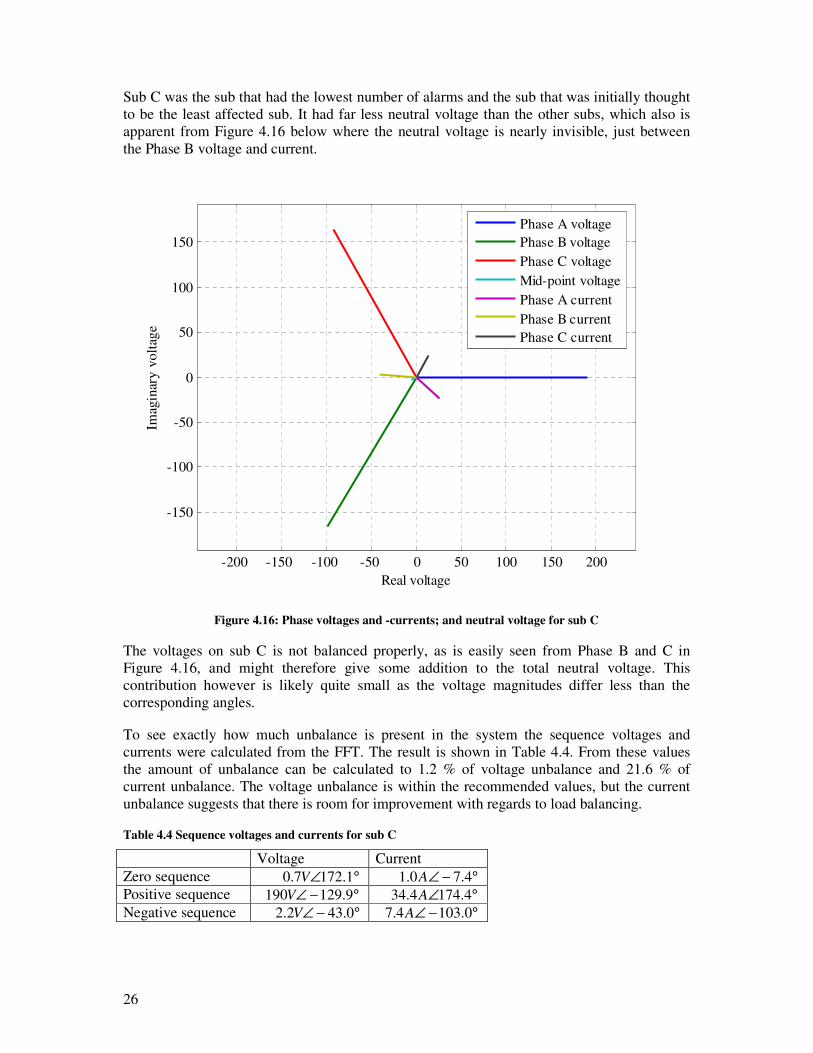
Sub C was the sub that had the lowest number of alarms and the sub that was initially thought to be the least affected sub. It had far less neutral voltage than the other subs, which also is apparent from Figure 4.16 below where the neutral voltage is nearly invisible, just between the Phase B voltage and current.
-200 -150 -100 -50 0 50 100 150 200
-150
-100
-50
0
50
100
150
Real voltage
Imag
inar
y vo
ltag
e
Phase A voltagePhase B voltage
Phase C voltage
Mid-point voltage
Phase A current
Phase B currentPhase C current
Figure 4.16: Phase voltages and -currents; and neutral voltage for sub C
The voltages on sub C is not balanced properly, as is easily seen from Phase B and C in Figure 4.16, and might therefore give some addition to the total neutral voltage. This contribution however is likely quite small as the voltage magnitudes differ less than the corresponding angles.
To see exactly how much unbalance is present in the system the sequence voltages and currents were calculated from the FFT. The result is shown in Table 4.4. From these values the amount of unbalance can be calculated to 1.2 % of voltage unbalance and 21.6 % of current unbalance. The voltage unbalance is within the recommended values, but the current unbalance suggests that there is room for improvement with regards to load balancing.
Table 4.4 Sequence voltages and currents for sub C
Voltage Current Zero sequence °∠ 1.1727.0 V °−∠ 4.70.1 A Positive sequence °−∠ 9.129190V °∠ 4.1744.34 A Negative sequence °−∠ 0.432.2 V °−∠ 0.1034.7 A
27
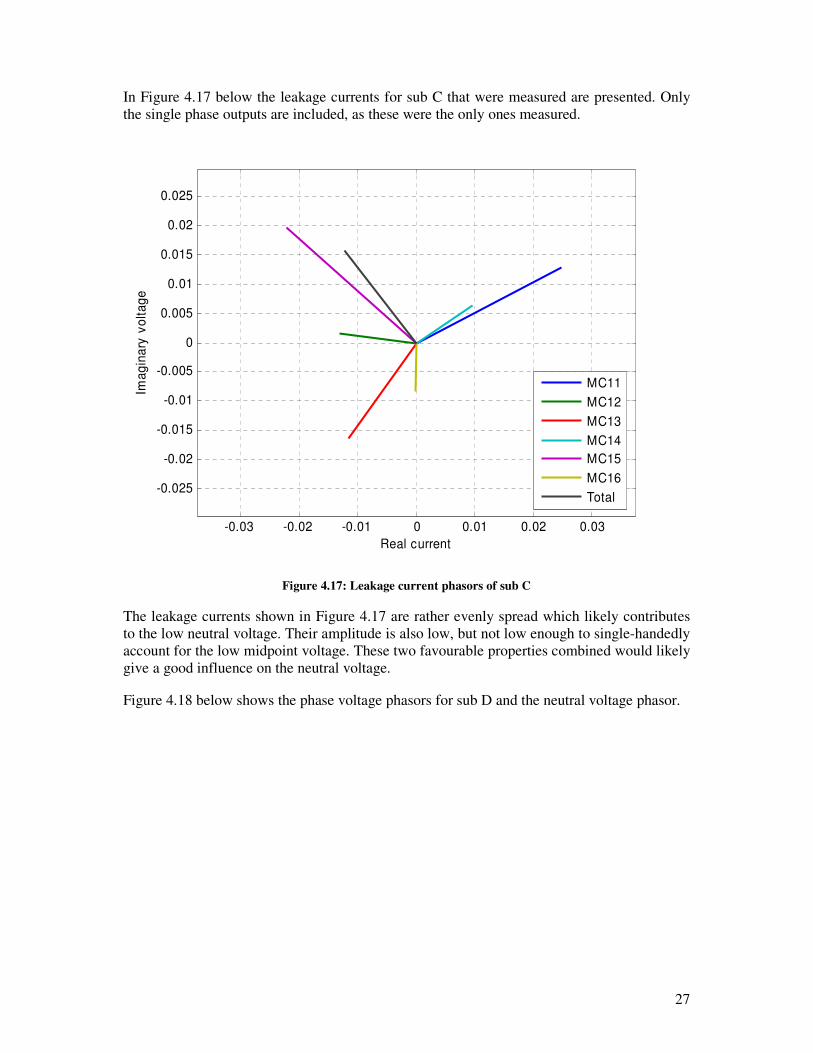
In Figure 4.17 below the leakage currents for sub C that were measured are presented. Only the single phase outputs are included, as these were the only ones measured.
-0.03 -0.02 -0.01 0 0.01 0.02 0.03
-0.025
-0.02
-0.015
-0.01
-0.005
0
0.005
0.01
0.015
0.02
0.025
Real current
Ima
gin
ary
vo
lta
ge
MC11
MC12
MC13
MC14
MC15
MC16
Total
Figure 4.17: Leakage current phasors of sub C
The leakage currents shown in Figure 4.17 are rather evenly spread which likely contributes to the low neutral voltage. Their amplitude is also low, but not low enough to single-handedly account for the low midpoint voltage. These two favourable properties combined would likely give a good influence on the neutral voltage.
Figure 4.18 below shows the phase voltage phasors for sub D and the neutral voltage phasor.

28
Figure 4.18: Phasor diagram of the voltages for sub D; including earth voltage
The earth voltage as seen in Figure 4.18 is very nearly completely in phase with phase B. It is in fact not very easy to locate the phasor in the above diagram as it is almost drowned out by the green phasor. This is likely caused by some conductance between the B phase and earth. When comparing the earth voltage in Figure 4.18 with the zero sequence voltage in Figure 4.11 shows that they are nearly exactly identical both in magnitude and phase. The conclusion that can be drawn is that the fault has been present for a very long time, likely a long time prior to the earliest measurements.
-200 -150 -100 -50 0 50 100 150 200
-150
-100
-50
0
50
100
150
Imaginary voltage
Real voltage
Phase APhase BPhase CEarth current
-200 -150 -100 -50 0 50 100 150 200
-150
-100
-50
0
50
100
150Im
agin
ary
volt
age
Real voltage
Phase A
Phase BPhase C
Earth voltage
29
-0.05 -0.04 -0.03 -0.02 -0.01 0 0.01 0.02 0.03 0.04 0.05
-0.04
-0.03
-0.02
-0.01
0
0.01
0.02
0.03
0.04
Real current
Imag
inar
y cu
rren
tMD11MD12
MD13
MD14
MD15
MD16Total
Figure 4.19: Phasor diagram of leakage currents in sub D
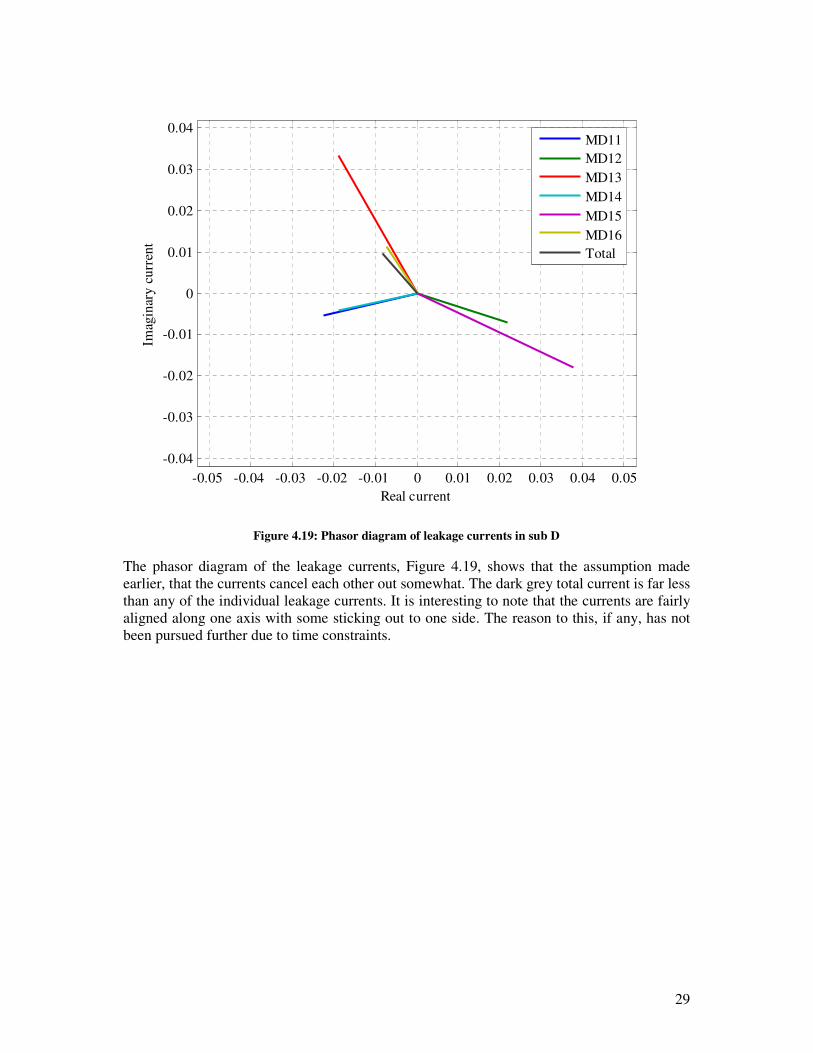
The phasor diagram of the leakage currents, Figure 4.19, shows that the assumption made earlier, that the currents cancel each other out somewhat. The dark grey total current is far less than any of the individual leakage currents. It is interesting to note that the currents are fairly aligned along one axis with some sticking out to one side. The reason to this, if any, has not been pursued further due to time constraints.

30
Chapter 5 - Conclusions
The conclusions drawn from the theoretical calculations, statistical analysis and
measurements are presented in the sections next.
5.1. From theoretical analysis
The theoretical analysis has shown that the intuitive results are correct; the neutral voltage increase when the fault impedance decrease, resulting in a maximum of line voltage in the neutral when the fault is a bolted fault. The analysis also shows that multiple phase faults are weighted with respect to the fault impedance so that the lowest fault impedance dominates the neutral voltage.
5.2. From statistical analysis
In analysing the statistical distribution of faults some interesting things have come up. Unfortunately the analysis has not yielded a lot of information, but the main thing to note is the fact that most of the faults are recorded during the winter period. Persons knowledgeable about the process could maybe determine one or more plausible explanations for this behaviour, and perhaps also guess one or more sources. It is likely however that this requires quite extensive knowledge about the entire plant.
Unfortunately the level prior to the first alarm is not known, nor what the levels were when the plant was new or the expected design levels. This makes it hard to draw any real conclusions as there is little data to compare with, prior to the first alarm. The only earlier measurements are from 2005 and these measurements are consistent with the measurements in this report, and this suggests that the levels are quite stable, if a bit high though.
5.3. From measurement analysis
The differences between the subs, with regards to leakage currents, are that the C sub that is perceived to be the best conditioned also has the lowest leakage currents, but the amplitudes are not much lower than the other’s. In fact the other two measured subs have one or two outputs with high leakage and several others with leakages in the same region as the C sub’s. The main difference that could explain the dramatic difference in neutral voltage is the angles. The leakage currents in sub C is a lot more balanced around the circle than the other two measured subs, which has the bulk of its leakage current along only one axis.
The voltage levels in the system show some amount of unbalance, but still mostly within limits set by the standard. The source of this unbalance has not been determined, but it is suspected that it at least in part has an effect on the neutral voltage.
In analysing the problem at hand the conclusion is that while the neutral voltage levels are high, they are not alarmingly high and should therefore not pose an immediate threat to the system’s operation.
The levels may however lead to secondary problems, such as degradation of operator alertness which results in the alarms being ignored, even when there could be an actual fault

31
present. They also may cause the insulation to fail more rapidly than if there had been no voltage on the neutral present.

32
Chapter 6 - Recommendations
The recommendation part has been split into categories depending on topic as the
recommendations differ significantly in influence and extent. Some are just recommendation
to continue investigation and should not directly result in invasive actions, others are rather
invasive and only listed as reference and to suggest further analysis of impact.
6.1. Further investigation
Since it is not possible to disconnect any of the outputs during operation it might be prudent to disconnect one or more of the outputs during revision to determine the effect this action has on the neutral voltage and thereby establish a starting point in the search for causes.
Especially the output MB15 should be examined more closely as it have a very large leakage current, that most likely could be classified as not normal. Checking up on the reason for this leakage could prove valuable as the other Mx15-outputs also have large leakage.
6.2. Source of unbalance
It is likely that the neutral voltage is in part caused by unbalance in the voltage from the transformer. This may be because the windings are not exactly equal, or because the primary side voltages are unbalanced. The uneven load of the systems may also contribute if the series impedance of the transformer is high. The current is very unevenly distributed with the current in one of the phases not even half of that of the other ones; combining this with series impedance of the transformer yields voltage unbalance and from that neutral voltage.
As this voltage unbalance is a possible culprit in creating the neutral voltage further investigations to determine the true source would be advantageous. Continuing measurements upstream to see if the unbalance is present at the 500 V level or even at the supply UPS could lead to discovery of the underlying reason, at least for the unbalance. Mitigation of any unbalance found here could possibly result in less unbalance in lower parts of the system.
6.3. Rebalancing system
Since the current of the phases is very different from one another there could be some gains made from balancing the currents more than they currently are. If the internal impedance of the transformer is high this operation may give at least some results.
There is also a benefit of this in that the transformer would more equally loaded between legs which distributes the magnetic field in the transformer core better. This may in turn reduce the harmonics created by the transformer and also distributes the heat more evenly across transformer legs.
6.4. Alarm frequency reduction
Instead of measuring the neutral voltage of the system, which is only an indication of a fault, there is the possibility to measure the leakage currents of the individual outputs. This would also have the added benefit of increased selectivity as the alarms would pinpoint the source of

33
the problems more accurately. The functionality is the same as in the residual current circuit breaker common in many households, except for the interrupting action that would be unwanted in the analysed system.
The downside to this solution is that it may be too sensitive to naturally occurring leakage currents. These currents are likely to be higher than the average household leakage current since the environment in which this system partly resides has a high temperature and humidity.
This solution would be akin to the solution used at Ringhals nuclear power plant where the monitoring is done using Bender type impedance sensing equipment. This may be an acceptable way to go since that type of protective equipment has already been accepted for use at nuclear power plants in Sweden.
There is also the problem that this is an extremely invasive solution to the problem. It would require large amounts of work to analyse the problems associated with the changed monitoring properties.
6.5. Altered measurement compromise
Since changing the complete measuring and monitoring system is next to undoable it may be that a less invasive compromise could be found. Apart from detecting the level of the neutral voltage there may be some gains in changing the alarm to a deriving alarm that senses quick changes in voltage which would be more likely to correspond to actual faults. When the changes in voltage level are slow it is more likely to be degradation of insulation or changes in environment. The quick changes however are more likely to be due to faults somewhere in the system. A neutral voltage measurement with fixed alarm level is still needed though, but the level may be increased significantly to allow for more naturally occurring leakage.
As the measuring system is used to detect faults on the system it may be possible to keep most of the neutral equipment such as transformers et cetera.
There might however be a problem with it being too sensitive to naturally occurring faults, such as creepage currents in high humidity surroundings. A solution like this would have to be carefully analyzed to determine the impact of the new, more accurate, fault monitor. It may be that a fixed limit is not acceptable on its own, but that also a floating limit is needed. This could also be wanted since real faults would give a distinct change in the leakage that should give a quick warning, whereas continuous change in leakage admittance due to environmental parameters should not raise the alarm as early. That way the slow degrading of isolation would not raise an alarm until there is an actual need to do something about it but allowing for real faults to be detected.

34
Appendix A. References
[1] cF1C (2006). System 656 batterisäkrat växelspänningsnät, ställverk, FINAL SAFETY
ANALYSIS REPORT, R-Dok F1-FSAR-656 rev 9,2006-02-13
[2] Nelson, John P. & Sen, Pankaj K. (1999). High-Resistance Grounding of Low-Voltage Systems: A Standard for the Petroleum and Chemical Industry. IEEE
TRANSACTIONS ON INDUSTRY APPLICATIONS, vol. 35, no. 4, July/August, pp. 941-948
[3] Svensson, Kurt (2004). FORSMARK 1 och 2 – System 644, KFE för 6 kV ställverk, Rapport FT-2004-98, 2004-11-01
[4] Janson, Michael (2006). System 654 – Dieselsäkrat nätställverk, FINAL SAFETY
ANALYSIS REPORT, R-Dok F1-FSAR-654 rev 12.05, 2006-11-28
[5] Thyr, Hans (2006). Statusbestämning av Övertonshalten för Forsmark 1 och 2
[6] ASEA (1979). Tidrelä typ RXKB 1, Utgåva 1 maj, Katalog RK 31-14
[7] Mohan, Ned; Undeland, Tore & Robbins, William (2003). Power Electronics - Converters, applications and design. Hoboken: John Wiley & Sons, Inc
[8] SIS (Swedish Standards Institute) (2000).Voltage characteristics of electricity supplied by public distribution systems, Standard SS-EN50160 rev 2, 2000-12-01
[9] Dalder, Jaap (2005). Power System Design, Course notes 2005 Part 1-2, Gothenburg: Chalmers University of Technology