Embed Size (px)
Citation preview

Drink. Water Eng. Sci., 9, 57–67, 2016www.drink-water-eng-sci.net/9/57/2016/doi:10.5194/dwes-9-57-2016© Author(s) 2016. CC Attribution 3.0 License.
Investigation of the relationship between drinking waterquality based on content of inorganic components andlandform classes using fuzzy AHP (case study: south of
Firozabad, west of Fars province, Iran)
Marzieh Mokarram1 and Dinesh Sathyamoorthy2
1Marzieh Mokarram (Department of Range and Watershed Management, College of Agricultureand Natural Resources of Darab, Shiraz University, Iran
2Dinesh Sathyamoorthy (Science & Technology Research Institute for Defence (STRIDE),Ministry of Defence, Malaysia
Correspondence to: Marzieh Mokarram ([email protected])
Received: 15 April 2016 – Published in Drink. Water Eng. Sci. Discuss.: 9 June 2016Revised: 22 September 2016 – Accepted: 5 October 2016 – Published: 28 October 2016
Abstract. In this study, the fuzzy analytic hierarchy process (AHP) is used to study the relationship betweendrinking water quality based on content of inorganic components and landform classes in the south of Firoz-abad, west of Fars province, Iran. For determination of drinking water quality based on content of inorganiccomponents, parameters of calcium (Ca), chlorine (Cl), magnesium (Mg), thorium (TH), sodium (Na), electricalconductivity (EC), sulfate (SO4), and total dissolved solids (TDS) were used. It was found that 8.29 % of thestudy area has low water quality; 64.01 %, moderate; 23.33 %, high; and 4.38 %, very high. Areas with suitabledrinking water quality based on content of inorganic components are located in parts of the south-eastern andsouth-western parts of the study area. The relationship between landform class and drinking water quality basedon content of inorganic components shows that drinking water quality based on content of inorganic compo-nents is high in the stream, valleys, upland drainages, and local ridge classes, and low in the plain small andmidslope classes. In fact we can predict water quality using extraction of landform classes from a digital eleva-tion model (DEM) by the Topographic Position Index (TPI) method, so that streams, valleys, upland drainages,and local ridge classes have more water quality than the other classes. In the study we determined that withoutmeasurement of water sample characteristics, we can determine water quality by landform classes.
1 Introduction
Landform characteristics can affect the direction of watermovement and water quality. Hence, in the different land-forms, there is different water quality (Bise, 2013). To thisend, studies on the relationship between landform classesand water quality have received significant attention. For ex-ample, William and Randall (2007) investigated runoff andwater quality from three soil landform units on the MancosShale. A survey of sediment basins in steep, dissected shaleuplands indicated that an average of 1.25 Mg ha yr−1 of sed-iment is produced by that landform unit; carefully designed
and located basin plugs can be used effectively to trap sed-iment, water, and salt from dissected shale uplands. Mehdiet al. (2012) determined agricultural land use scenarios formodelling future water quality. The results showed that thereis relationship between types of land use and water quality.The impact of land use on water quality was evaluated byHuang et al. (2013). The results indicated that there was sig-nificant negative correlation between forest land and grass-land and the water pollution, and the built-up area had nega-tive impacts on the water quality, while the influence of thecultivated land on the water quality was very complex.
Published by Copernicus Publications on behalf of the Delft University of Technology.

58 M. Mokarram and D. Sathyamoorthy: Relationship between drinking water quality and landform classes
Table 1. Descriptive statistics of the parameters for evaluation of water quality (Fars Regional Water Authority).
Parameters Unit Minimum Maximum Mean SD
Calcium (Ca) mg L−1 0 596 195 89Chlorine (Cl) mg L−1 25 437 84 45Sodium (Na) mg L−1 0 458 51 45Electrical conductivity (EC) d s m−1 0.39 1.75 0.71 0.15Magnesium (Mg) mg L−1 0 569 182 80Sulfate (SO4) mg L−1 0 584 137 73Thorium (TH) mg L−1 0 473 180 77Total dissolved solids (TDS) mg L−1 0 954 295 117
Table 2. Drinking water quality based on content of inorganic com-ponent standards (WHO; Shobha et al., 2013).
Parameters Permissiblelimit (mg L−1)
Calcium (Ca) 200Chlorine (Cl) 200Magnesium (Mg) 150Thorium (TH) 500Sodium (Na) 200Electrical conductivity (EC) 3000Sulfate (SO4) 200Total dissolved solids (TDS) 500
In addition, different algorithms have been employed forthe determination of water quality. Demissie et al. (2012)developed a complementary modelling framework to han-dle systematic error in physically based groundwater flowmodel applications that used data-driven models of the er-rors during the calibration phase. The effectiveness of fourerror-correcting data-driven models, namely, artificial neuralnetworks (ANN), support vector machines (SVM), decisiontrees (DT), and instance-based weighting (IBW), was exam-ined for forecasting head prediction errors and subsequentlyupdating the head predictions at existing and proposed ob-servation wells. Rule-based modelling (Manoucher et al.,2010) was used for spatial prediction of groundwater qual-ity in Beaufort West, in the Karoo region of South Africa.The groundwater quality data from about 100 bore wells witha 30-year span collected between 1970 and 2007 were used.The variables used in the analyses included chemicals such aschloride, sulfate, magnesium, sodium, phosphates, and cal-cium. These were used as predictors for groundwater qualityand electrical conductivity. Aliabadi and Soltanifard (2014)used fuzzy inference for determination of the impact of wa-ter and soil electrical conductivity and calcium carbonate onwheat crop use. The inference system estimated the perfor-mance using soil EC, water EC, and calcium carbonate in thesoil as input parameters, and also analysed them.
The aim of this study is the determination of the relation-ship between landform classes and drinking water qualitybased on content of inorganic components in southern Firoz-abad, Iran. In this study, drinking water quality based oncontent of inorganic components is evaluated using param-eters of calcium (Ca), chlorine (Cl), magnesium (Mg), tho-rium (TH), sodium (Na), electrical conductivity (EC), sulfate(SO4), and total dissolved solids (TDS). According to eachof the factors for evaluation of water quality with differentunits (fuzzy method), for preparing the water quality mapfrom factors (AHP) and investigation of spatial (geographicinformation system – GIS) water quality in the study, it isproposed that the most appropriate method to prepare drink-ing water quality based on content of inorganic componentsmaps is the fuzzy analytic hierarchy process (AHP method)in a GIS environment. It is expected that the determination ofthe relationship between landform classes and drinking waterquality based on content of inorganic components will allowfor the prediction of drinking water quality based on con-tent of inorganic components based on landform classes, sothat the study determined that without measurement of watersample characteristics using a DEM and extraction landformclasses by the TPI method, we can determine water qualityby landform classes.
The methodology employed in this study is summarized inFig. 1.
2 Material and method
2.1 Case study
This study was carried out south of Firozabad, west of Farsprovince, Iran. It has an area of 722.91 km2, and is locatedbetween a longitude of 28◦36–28◦57 N and a latitude of52◦16–52◦46 E (Fig. 2). The altitude of the study area rangesfrom the lowest of 1134 m to the highest of 2885 m. Thestudy area is abundantly watered by springs and the perennialFirozabad River. The main agricultural produce consists ofgrain, fruit, and vegetables, while the partly wooded moun-tains are used for pasture (Sharifi-Rad et al., 2014). The as-sessment of land suitability for agricultural production in the
Drink. Water Eng. Sci., 9, 57–67, 2016 www.drink-water-eng-sci.net/9/57/2016/
M. Mokarram and D. Sathyamoorthy: Relationship between drinking water quality and landform classes 59
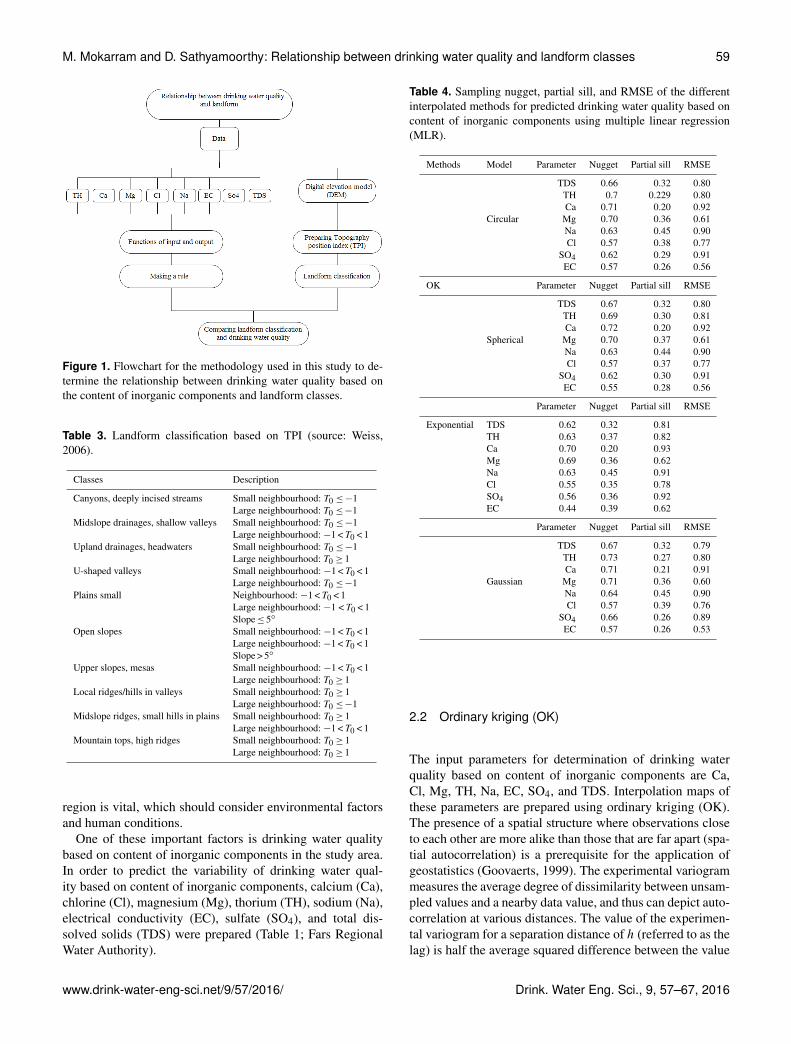
Figure 1. Flowchart for the methodology used in this study to de-termine the relationship between drinking water quality based onthe content of inorganic components and landform classes.
Table 3. Landform classification based on TPI (source: Weiss,2006).
Classes Description
Canyons, deeply incised streams Small neighbourhood: T0 ≤−1Large neighbourhood: T0 ≤−1
Midslope drainages, shallow valleys Small neighbourhood: T0 ≤−1Large neighbourhood: −1 < T0 < 1
Upland drainages, headwaters Small neighbourhood: T0 ≤−1Large neighbourhood: T0 ≥ 1
U-shaped valleys Small neighbourhood: −1 < T0 < 1Large neighbourhood: T0 ≤−1
Plains small Neighbourhood: −1 < T0 < 1Large neighbourhood: −1 < T0 < 1Slope≤ 5◦
Open slopes Small neighbourhood: −1 < T0 < 1Large neighbourhood: −1 < T0 < 1Slope > 5◦
Upper slopes, mesas Small neighbourhood: −1 < T0 < 1Large neighbourhood: T0 ≥ 1
Local ridges/hills in valleys Small neighbourhood: T0 ≥ 1Large neighbourhood: T0 ≤−1
Midslope ridges, small hills in plains Small neighbourhood: T0 ≥ 1Large neighbourhood: −1 < T0 < 1
Mountain tops, high ridges Small neighbourhood: T0 ≥ 1Large neighbourhood: T0 ≥ 1
region is vital, which should consider environmental factorsand human conditions.
One of these important factors is drinking water qualitybased on content of inorganic components in the study area.In order to predict the variability of drinking water qual-ity based on content of inorganic components, calcium (Ca),chlorine (Cl), magnesium (Mg), thorium (TH), sodium (Na),electrical conductivity (EC), sulfate (SO4), and total dis-solved solids (TDS) were prepared (Table 1; Fars RegionalWater Authority).
Table 4. Sampling nugget, partial sill, and RMSE of the differentinterpolated methods for predicted drinking water quality based oncontent of inorganic components using multiple linear regression(MLR).
Methods Model Parameter Nugget Partial sill RMSE
TDS 0.66 0.32 0.80TH 0.7 0.229 0.80Ca 0.71 0.20 0.92
Circular Mg 0.70 0.36 0.61Na 0.63 0.45 0.90Cl 0.57 0.38 0.77
SO4 0.62 0.29 0.91EC 0.57 0.26 0.56
OK Parameter Nugget Partial sill RMSE
TDS 0.67 0.32 0.80TH 0.69 0.30 0.81Ca 0.72 0.20 0.92
Spherical Mg 0.70 0.37 0.61Na 0.63 0.44 0.90Cl 0.57 0.37 0.77
SO4 0.62 0.30 0.91EC 0.55 0.28 0.56
Parameter Nugget Partial sill RMSE
Exponential TDS 0.62 0.32 0.81TH 0.63 0.37 0.82Ca 0.70 0.20 0.93Mg 0.69 0.36 0.62Na 0.63 0.45 0.91Cl 0.55 0.35 0.78SO4 0.56 0.36 0.92EC 0.44 0.39 0.62
Parameter Nugget Partial sill RMSE
TDS 0.67 0.32 0.79TH 0.73 0.27 0.80Ca 0.71 0.21 0.91
Gaussian Mg 0.71 0.36 0.60Na 0.64 0.45 0.90Cl 0.57 0.39 0.76
SO4 0.66 0.26 0.89EC 0.57 0.26 0.53
2.2 Ordinary kriging (OK)
The input parameters for determination of drinking waterquality based on content of inorganic components are Ca,Cl, Mg, TH, Na, EC, SO4, and TDS. Interpolation maps ofthese parameters are prepared using ordinary kriging (OK).The presence of a spatial structure where observations closeto each other are more alike than those that are far apart (spa-tial autocorrelation) is a prerequisite for the application ofgeostatistics (Goovaerts, 1999). The experimental variogrammeasures the average degree of dissimilarity between unsam-pled values and a nearby data value, and thus can depict auto-correlation at various distances. The value of the experimen-tal variogram for a separation distance of h (referred to as thelag) is half the average squared difference between the value
www.drink-water-eng-sci.net/9/57/2016/ Drink. Water Eng. Sci., 9, 57–67, 2016

60 M. Mokarram and D. Sathyamoorthy: Relationship between drinking water quality and landform classes
Figure 2. Location of the study area (DEM with a spatial resolution of 30 m; source: http://earthexplorer.usgs.gov).
Table 5. Pair-wise comparison matrix for drinking water quality based on content of inorganic components.
Parameters Ca Cl Na EC Mg SO4 TH TDS Weight
Ca 1 2 3 4 5 6 7 8 0.33Cl 0.5 1 2 3 4 5 6 7 0.23Na 0.33 0.5 1 2 3 4 5 6 0.16EC 0.25 0.33 0.5 1 2 3 4 5 0.11Mg 0.2 0.2 0.33 0.5 1 2 3 4 0.07SO4 0.16 0.16 0.2 0.33 0.5 1 2 3 0.05TH 0.14 0.14 0.16 0.2 0.33 0.5 1 2 0.03TDS 0.12 0.12 0.14 0.16 0.2 0.33 0.5 1 0.02
at z(xi) and the value at z (xi +h) (Oliver, 1990):
γ (h)=1
2Nh
N (h)∑i=1[z(xi)− z(xi +h)]2, (1)
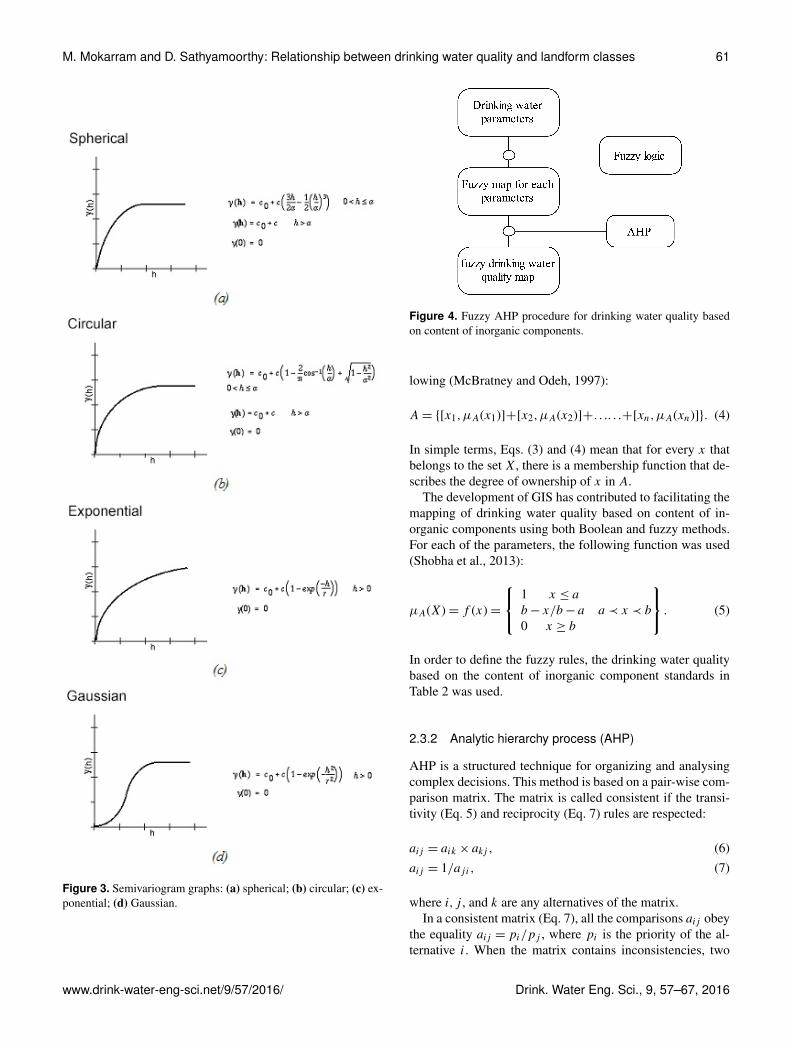
where N is the number of pairs of sample points z(xi) andz(xi +h) separated by distance h and γ (h) is the semi-variogram. From the analysis of the experimental vari-ogram, a suitable model is then fitted, usually by weightedleast squares and four parameters: sill, range, nugget, andanisotropy. Sill refers to the variance value at which the curvereaches the plateau sill. The total separation distance from thelowest variance to the sill is known as the range. Semivari-ogram modelling is a key step between spatial descriptionand spatial prediction. The main application of kriging is theprediction of attribute values at unsampled locations. Thereare several models for semivariogram graphs. Figure 3 showsthe general shapes and equations of the mathematical modelsused to describe the semivariance (McBratney and Webster,1986).
In order to compare the different interpolation techniques,we examined the difference between known and predicteddata using the root mean squared error (RMSE; Eq. 2):
RMSE=
√√√√ 1N
N∑i=1{z(xi)− z(xi)}2, (2)
where z(xi) is the predicted value, z(xi) is the observed(known) value, and N is the number of values in the dataset(Johnston et al., 2001).
2.3 Fuzzy AHP
2.3.1 Fuzzy classification
Fuzzy logic was initially developed by Zadeh (1965) as ageneralization of classic logic. He defined a fuzzy set bymembership functions from properties of objects. A member-ship function assigns to each object a grade ranging between0 and 1. The value 0 means that x is not a member of thefuzzy set, while the value 1 means that x is a full member ofthe fuzzy set. Traditionally, thematic maps represent discreteattributes based on Boolean memberships, such as polygons,lines, and points. Mathematically, a fuzzy set can be definedas follows (Mc Bratney and Odeh, 1997):
A= {x,µA(x)} for each xεX, (3)
where µA is the membership function (MF) that defines thegrade of membership of x in fuzzy set A. MF takes val-ues between and including 1 and 0 for all A, with µA = 0meaning that x does not belong to A and µA =1 mean-ing that it belongs completely to A. Alternatively, 0 <µA(x)< 1 implies that x belongs to a certain degree to A. If X ={x1,x2, . . .,xn}, the previous equation can be written as fol-
Drink. Water Eng. Sci., 9, 57–67, 2016 www.drink-water-eng-sci.net/9/57/2016/
M. Mokarram and D. Sathyamoorthy: Relationship between drinking water quality and landform classes 61
Figure 3. Semivariogram graphs: (a) spherical; (b) circular; (c) ex-ponential; (d) Gaussian.
Figure 4. Fuzzy AHP procedure for drinking water quality basedon content of inorganic components.
lowing (McBratney and Odeh, 1997):
A= {[x1,µA(x1)]+[x2,µA(x2)]+. . .. . .+[xn,µA(xn)]}. (4)
In simple terms, Eqs. (3) and (4) mean that for every x thatbelongs to the set X, there is a membership function that de-scribes the degree of ownership of x in A.
The development of GIS has contributed to facilitating themapping of drinking water quality based on content of in-organic components using both Boolean and fuzzy methods.For each of the parameters, the following function was used(Shobha et al., 2013):
µA(X)= f (x)=
1 x ≤ a
b− x/b− a a ≺ x ≺ b
0 x ≥ b
. (5)
In order to define the fuzzy rules, the drinking water qualitybased on the content of inorganic component standards inTable 2 was used.
2.3.2 Analytic hierarchy process (AHP)
AHP is a structured technique for organizing and analysingcomplex decisions. This method is based on a pair-wise com-parison matrix. The matrix is called consistent if the transi-tivity (Eq. 5) and reciprocity (Eq. 7) rules are respected:
aij = aik × akj , (6)aij = 1/aji, (7)
where i,j , and k are any alternatives of the matrix.In a consistent matrix (Eq. 7), all the comparisons aij obey
the equality aij = pi/pj , where pi is the priority of the al-ternative i. When the matrix contains inconsistencies, two
www.drink-water-eng-sci.net/9/57/2016/ Drink. Water Eng. Sci., 9, 57–67, 2016
62 M. Mokarram and D. Sathyamoorthy: Relationship between drinking water quality and landform classes
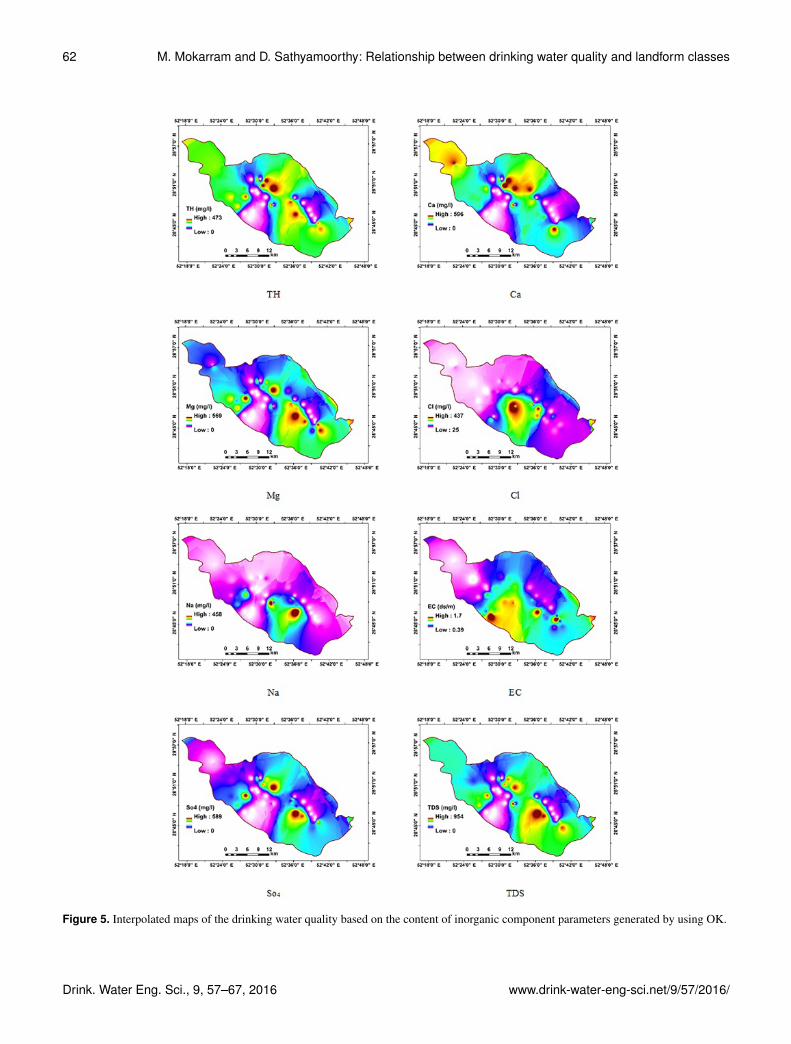
Figure 5. Interpolated maps of the drinking water quality based on the content of inorganic component parameters generated by using OK.
Drink. Water Eng. Sci., 9, 57–67, 2016 www.drink-water-eng-sci.net/9/57/2016/
M. Mokarram and D. Sathyamoorthy: Relationship between drinking water quality and landform classes 63
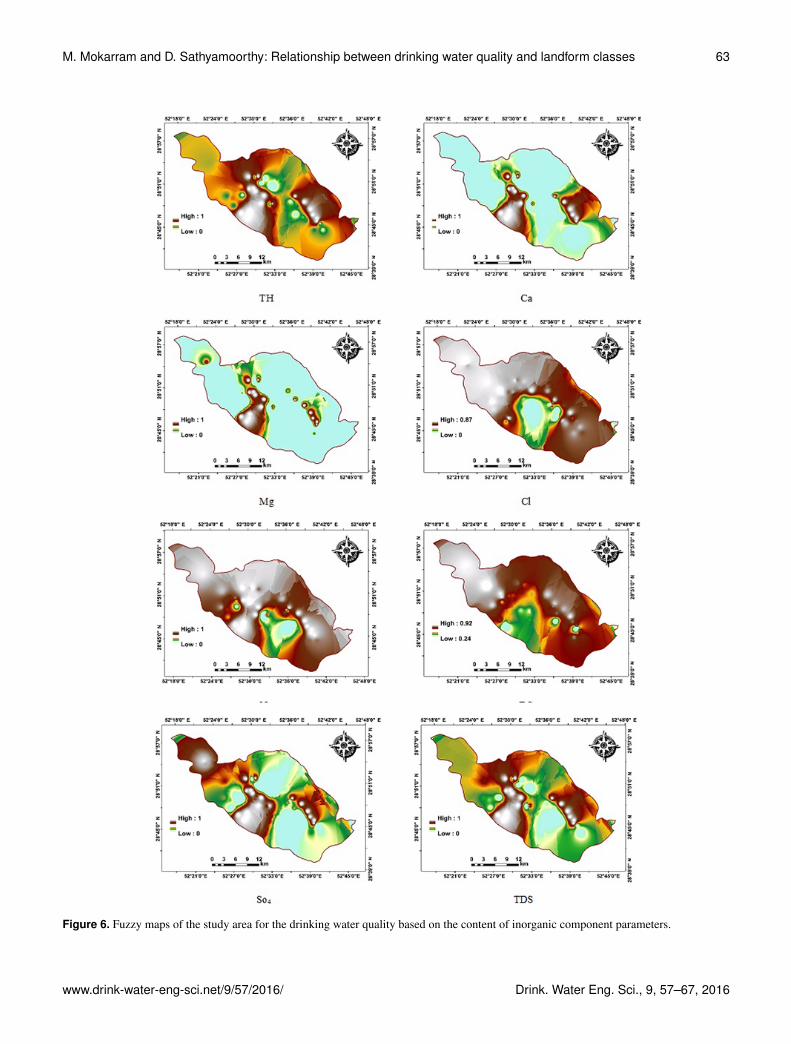
Figure 6. Fuzzy maps of the study area for the drinking water quality based on the content of inorganic component parameters.
www.drink-water-eng-sci.net/9/57/2016/ Drink. Water Eng. Sci., 9, 57–67, 2016
64 M. Mokarram and D. Sathyamoorthy: Relationship between drinking water quality and landform classes
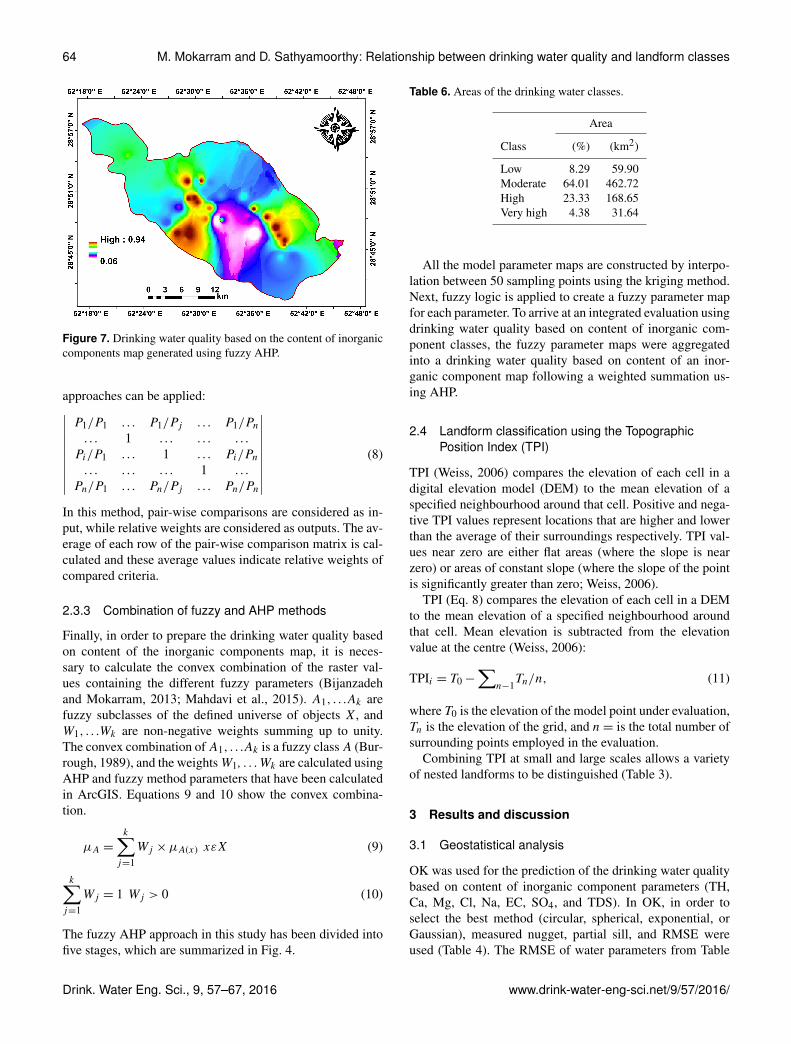
Figure 7. Drinking water quality based on the content of inorganiccomponents map generated using fuzzy AHP.
approaches can be applied:∣∣∣∣∣∣∣∣∣∣P1/P1 . . . P1/Pj . . . P1/Pn. . . 1 . . . . . . . . .
Pi/P1 . . . 1 . . . Pi/Pn. . . . . . . . . 1 . . .
Pn/P1 . . . Pn/Pj . . . Pn/Pn
∣∣∣∣∣∣∣∣∣∣(8)
In this method, pair-wise comparisons are considered as in-put, while relative weights are considered as outputs. The av-erage of each row of the pair-wise comparison matrix is cal-culated and these average values indicate relative weights ofcompared criteria.
2.3.3 Combination of fuzzy and AHP methods
Finally, in order to prepare the drinking water quality basedon content of the inorganic components map, it is neces-sary to calculate the convex combination of the raster val-ues containing the different fuzzy parameters (Bijanzadehand Mokarram, 2013; Mahdavi et al., 2015). A1, . . .Ak arefuzzy subclasses of the defined universe of objects X, andW1, . . .Wk are non-negative weights summing up to unity.The convex combination ofA1, . . .Ak is a fuzzy classA (Bur-rough, 1989), and the weightsW1, . . . Wk are calculated usingAHP and fuzzy method parameters that have been calculatedin ArcGIS. Equations 9 and 10 show the convex combina-tion.
µA =
k∑j=1
Wj ×µA(x) xεX (9)
k∑j=1
Wj = 1 Wj > 0 (10)
The fuzzy AHP approach in this study has been divided intofive stages, which are summarized in Fig. 4.
Table 6. Areas of the drinking water classes.
Area
Class (%) (km2)
Low 8.29 59.90Moderate 64.01 462.72High 23.33 168.65Very high 4.38 31.64
All the model parameter maps are constructed by interpo-lation between 50 sampling points using the kriging method.Next, fuzzy logic is applied to create a fuzzy parameter mapfor each parameter. To arrive at an integrated evaluation usingdrinking water quality based on content of inorganic com-ponent classes, the fuzzy parameter maps were aggregatedinto a drinking water quality based on content of an inor-ganic component map following a weighted summation us-ing AHP.
2.4 Landform classification using the TopographicPosition Index (TPI)
TPI (Weiss, 2006) compares the elevation of each cell in adigital elevation model (DEM) to the mean elevation of aspecified neighbourhood around that cell. Positive and nega-tive TPI values represent locations that are higher and lowerthan the average of their surroundings respectively. TPI val-ues near zero are either flat areas (where the slope is nearzero) or areas of constant slope (where the slope of the pointis significantly greater than zero; Weiss, 2006).
TPI (Eq. 8) compares the elevation of each cell in a DEMto the mean elevation of a specified neighbourhood aroundthat cell. Mean elevation is subtracted from the elevationvalue at the centre (Weiss, 2006):
TPIi = T0−∑
n−1Tn/n, (11)
where T0 is the elevation of the model point under evaluation,Tn is the elevation of the grid, and n= is the total number ofsurrounding points employed in the evaluation.
Combining TPI at small and large scales allows a varietyof nested landforms to be distinguished (Table 3).
3 Results and discussion
3.1 Geostatistical analysis
OK was used for the prediction of the drinking water qualitybased on content of inorganic component parameters (TH,Ca, Mg, Cl, Na, EC, SO4, and TDS). In OK, in order toselect the best method (circular, spherical, exponential, orGaussian), measured nugget, partial sill, and RMSE wereused (Table 4). The RMSE of water parameters from Table
Drink. Water Eng. Sci., 9, 57–67, 2016 www.drink-water-eng-sci.net/9/57/2016/

M. Mokarram and D. Sathyamoorthy: Relationship between drinking water quality and landform classes 65
Figure 8. TPI maps generated using (a) small (3 cells) and (b) large (45 cells) neighbourhoods
Figure 9. Landform classification using the TPI method.
4 shows that the lowest RMSE is the Gaussian method. Fur-thermore, these results indicate that the Gaussian model forOK is the best semivariogram model to show the strong spa-tial dependency for the water variable.
Each of the water parameter maps that were predicted byOK are shown in Fig. 5. The lowest SO4, TDS, Na, Mg, TH,and Ca were 0, while the highest values for the parameterswere 589, 954, 458, 569, 473, and 569 mg L− respectively.The lowest values for EC and Cl were 0.39 and 25 mg L−
respectively, while the highest were 1.7 and 437 respectively.In the total, the results showed that, except for Ca and Mg,the other parameters had high values in the study area.
3.2 Fuzzy method
The fuzzy maps prepared for the drinking water quality basedon content of inorganic component parameters are shownin Fig. 6, where MF is closer to 0 with decreasing drink-ing water quality based on content of inorganic components,while MF is closer to 1 with increasing drinking water qual-ity based on content of inorganic components (Soroush et al.,2013). Next, the AHP method was applied to the fuzzy pa-rameter maps. The pair-wise comparison matrices used forpreparation of the weights for each parameter in AHP aregiven in Table 5. The drinking water quality based on con-tent of the inorganic components map generated using fuzzyAHP is shown in Fig. 7.
www.drink-water-eng-sci.net/9/57/2016/ Drink. Water Eng. Sci., 9, 57–67, 2016
66 M. Mokarram and D. Sathyamoorthy: Relationship between drinking water quality and landform classes
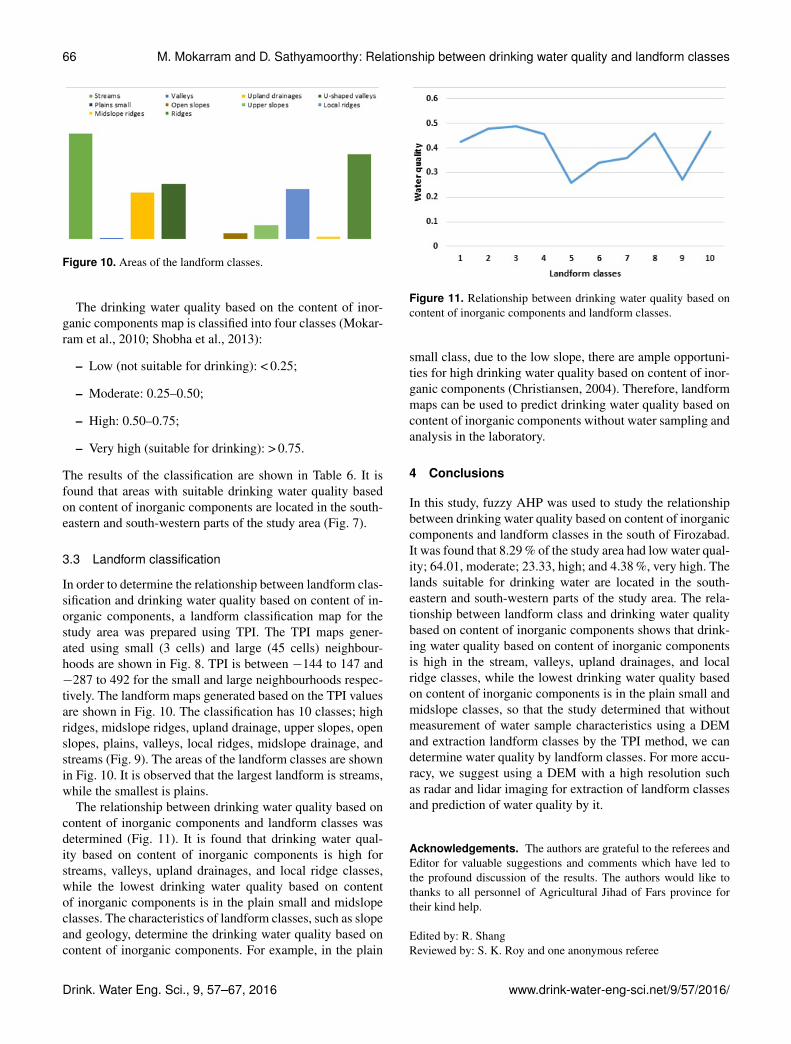
Figure 10. Areas of the landform classes.
The drinking water quality based on the content of inor-ganic components map is classified into four classes (Mokar-ram et al., 2010; Shobha et al., 2013):
– Low (not suitable for drinking): < 0.25;
– Moderate: 0.25–0.50;
– High: 0.50–0.75;
– Very high (suitable for drinking): > 0.75.
The results of the classification are shown in Table 6. It isfound that areas with suitable drinking water quality basedon content of inorganic components are located in the south-eastern and south-western parts of the study area (Fig. 7).
3.3 Landform classification
In order to determine the relationship between landform clas-sification and drinking water quality based on content of in-organic components, a landform classification map for thestudy area was prepared using TPI. The TPI maps gener-ated using small (3 cells) and large (45 cells) neighbour-hoods are shown in Fig. 8. TPI is between −144 to 147 and−287 to 492 for the small and large neighbourhoods respec-tively. The landform maps generated based on the TPI valuesare shown in Fig. 10. The classification has 10 classes; highridges, midslope ridges, upland drainage, upper slopes, openslopes, plains, valleys, local ridges, midslope drainage, andstreams (Fig. 9). The areas of the landform classes are shownin Fig. 10. It is observed that the largest landform is streams,while the smallest is plains.
The relationship between drinking water quality based oncontent of inorganic components and landform classes wasdetermined (Fig. 11). It is found that drinking water qual-ity based on content of inorganic components is high forstreams, valleys, upland drainages, and local ridge classes,while the lowest drinking water quality based on contentof inorganic components is in the plain small and midslopeclasses. The characteristics of landform classes, such as slopeand geology, determine the drinking water quality based oncontent of inorganic components. For example, in the plain
Figure 11. Relationship between drinking water quality based oncontent of inorganic components and landform classes.
small class, due to the low slope, there are ample opportuni-ties for high drinking water quality based on content of inor-ganic components (Christiansen, 2004). Therefore, landformmaps can be used to predict drinking water quality based oncontent of inorganic components without water sampling andanalysis in the laboratory.
4 Conclusions
In this study, fuzzy AHP was used to study the relationshipbetween drinking water quality based on content of inorganiccomponents and landform classes in the south of Firozabad.It was found that 8.29 % of the study area had low water qual-ity; 64.01, moderate; 23.33, high; and 4.38 %, very high. Thelands suitable for drinking water are located in the south-eastern and south-western parts of the study area. The rela-tionship between landform class and drinking water qualitybased on content of inorganic components shows that drink-ing water quality based on content of inorganic componentsis high in the stream, valleys, upland drainages, and localridge classes, while the lowest drinking water quality basedon content of inorganic components is in the plain small andmidslope classes, so that the study determined that withoutmeasurement of water sample characteristics using a DEMand extraction landform classes by the TPI method, we candetermine water quality by landform classes. For more accu-racy, we suggest using a DEM with a high resolution suchas radar and lidar imaging for extraction of landform classesand prediction of water quality by it.
Acknowledgements. The authors are grateful to the referees andEditor for valuable suggestions and comments which have led tothe profound discussion of the results. The authors would like tothanks to all personnel of Agricultural Jihad of Fars province fortheir kind help.
Edited by: R. ShangReviewed by: S. K. Roy and one anonymous referee
Drink. Water Eng. Sci., 9, 57–67, 2016 www.drink-water-eng-sci.net/9/57/2016/
M. Mokarram and D. Sathyamoorthy: Relationship between drinking water quality and landform classes 67
References
Aliabadi, K. and Soltanifard, H.: The Impact Of Water And SoilElectrical Conductivity And Calcium Carbonate On Wheat CropUsing A Combination Of Fuzzy Inference System And GIS, In-ternational Journal of Scientific & Technology Research, 3, 118–124, 2014.
Bijanzadeh, E. and Mokarram, M.: The use of fuzzy-AHP methodsto assess fertility classes for wheat and its relationship with soilsalinity: east of Shiraz, Iran: A case study, Aust. J. Crop Sci., 7,1699–1706, 2013.
Bise, C. J.: Modern American Coal Mining: Methods and Appli-cations, Society for Mining Metallurgy & Exploration, ISBN:9780873353526, 2013.
Burrough, P. A.: Fuzzy Mathematical Methods for Soil Survey andLand Suitability, J. Soil Sci., 40, 477–492, 1989.
Christiansen, D. E.: Riverbed elevations and water quality of theMissouri River at Sioux City, Iowa, 2002–03: US GeologicalSurvey Scientific Investigations Report 2004–5079, 14 pp., 2004.
Demissie, Y., Yan, E., and Wu, M.: Assessing Regional Hydrol-ogy and Water Quality Implications of Large-Scale Biofuel Feed-stock Production in the Upper Mississippi River Basin, Environ.Sci. Technol., 46.16, 9174–9182, doi:10.1021/es300769k, 2012.
Goovaerts, P.: Geostatistics in Soil Science: State-of- the-Art andPerspectives, Geoderma, 89, 1–45, 1999.
Huang, J., Zhan, J., Yan, H., Wu, F., and Deng, X.: Evaluation ofthe Impacts of Land Use on Water Quality: a case study in theChaohu lake basin, The Scientific World Journal, 329187, 7 pp.,2013.
Johnston, K., Hoef, J. M. V., Krivoruchko, K., and Lucas, N.: UsingArcGISTM Geostatistical Analyst, ESRI. 380, New York, 2001.
Mahdavi, A., Niknejad, M., and Karami, O.: A fuzzy multi-criteriadecision method for locating ecotourism development, CaspianJ. Env. Sci., 13, 221–236, 2015.
Manoucher, A., Mini Karim, C., and Annette, J.: A comparisonon a different rule based statistical models for modeling ge-ogenic groundwater contamination, J. Environ. Model. Softw.,25, 1650–1657, 2010.
McBratney, A. B. and Odeh, I. O. A.: Application of Fuzzy sets insoil science: Fuzzy logic. Fuzzy measurements and Fuzzy deci-sions, Geoderma, 77, 85–113, 1997.
McBratney, A. B. and Webster, R.: Choosing Functions for Semi-variograms of Soil Properties and Fitting Them to Sampling Es-timates, J. Soil Sci., 37, 617–639, 1986.
Mehdi, B. B., Ludwig, R., and Lehner, B.: Determining agricul-tural land use scenarios in a mesoscale Bavarian watershedfor modelling future water quality, Adv. Geosci., 31, 9–14,doi:10.5194/adgeo-31-9-2012, 2012.
Mokarram, M., Rangzan, K., Moezzi, A., and Baninemehc, J.: Landsuitability evaluation for wheat cultivation by fuzzy theory ap-proache as compared with parametric method. The internationalarchives of the photogrametry, Remote Sens. Spatial InformationSci., 38, 1440–145, 2010.
Oliver, M. A.: Kriging: A Method of Interpolation for GeographicalInformation Systems, International Journal of Geographic Infor-mation Systems 4, 313–332, 1990.
Sharifi-Rad, J., Hoseini-Alfatemi, S. M., Sharifi-Rad, M., and Set-zer, W. N.: Chemical composition, antifungal and antibacteri-alActivities of essential oil from lallemantia Royleana (benth. Inwall.) Benth, J. Food Safety, 35 19–25, 2014.
Shobha, G., Gubbi, J., Raghavan, K. S., Kaushik, K., andPalaniswami, M.: A novel fuzzy rule based system for assess-ment of ground water potability: A case study in South India,IOSR Journal of Computer Engineering (IOSR-JCE), 15, 35–41,2013.
Soroush, F., Mousavi, S. F., and Gharechahi, A.: A fuzzy indus-trial water quality index: case study of zayandehrud river system,IJST, Transactions of Civil and Environmental Engineering, 35,131–136, 2013.
Weiss, A.: Topographic Position and landforms Analysis, Posterpresentation, ESRI user Conference, San Diego, C.A., 2006.
William, L. J. and Randall, P. J.: Runoff and water quality fromthree soil landform units on mancos shale, J. Am. Water Resour.Assoc., 18, 995–1001, 2007.
Zadeh, L. H.: Fuzzy sets, Information and Control, 8, 338–353,1965.
www.drink-water-eng-sci.net/9/57/2016/ Drink. Water Eng. Sci., 9, 57–67, 2016