Embed Size (px)
Citation preview
ORIGINAL PAPER
Investigation of the weathering layer using seismicrefraction and high-resolution seismic reflection methods,NE of Riyadh city
Ghunaim T. Al-Anezi & Abdullah M. Al-Amri &Haider Zaman
Received: 1 November 2010 /Accepted: 27 January 2011 /Published online: 19 February 2011# Saudi Society for Geosciences 2011
Abstract Five seismic refraction and five high-resolutionseismic reflection (HRSR) profiles were carried out innortheastern part of Riyadh city to investigate depth ofthe weathering layer. Results obtained from seismicrefraction survey reveal the depths of weathering layerat 12, 25, 17, 12, and 16 m, respectively. On the otherhand, HRSR stack sections illustrate the depths ofweathering layer at 14, 28, 20, 13, and 18 m,respectively. The weathering layer is composed ofalluvial sediments and gravel, which is underlain by asequence of limestone and dolomite layer. Seismicresults from site no. 2 have been found to be in goodagreement with lithological information reported fromthe adjacent water well. The HRSR data generallyreveal better signal-to-noise ratio and enhanced resolu-tion compared to the refraction data. Although, theHRSR data failed in achieving high-quality commonmidpoint (CMP) stacking profile at site no. 3, it providean improved image of the subsurface features than therefraction data, recognizing it as a potential seismictechnique.
Keywords Seismic refraction . High-resolution seismicreflection . Stack sections . The weathering layer
Introduction
The seismic method (particularly seismic reflection)represents one of the most important geophysicaltechniques for oil and gas exploration (Kearey andBrooks 1984) due to its high accuracy, high resolution,and deep penetration. On relatively reduced scale, thismethod has been applied to groundwater, environmentaland civil engineering problems, and to some extent,mineral exploration (Burger et al. 1992). One of theaffective tools in shallow exploration is the seismicrefraction, which can be used for engineering andenvironmental investigations, including the depth ofbedrock, depth of the ground water, and lateral/verticalchanges in lithology. In addition, investigation of thesubsurface structural features, such as cracks in the rockbodies, is an attractive target for shallow seismic refraction(Sheriff and Geldart 1999).
The shallow seismic reflection technique is relativelystraightforward in terms of conceptual perspective.Ideally, a high-frequency, short-duration pulse of acous-tic energy is generated at the earth's surface, and thearrival times and magnitudes of “echos” are measured andare reflected from subsurface acoustic horizons (i.e., watertable, bedrock, lithologic and facies contacts, etc.) andreturned to the earth's surface (Steeples 2000). During thepast 30 years, growing interest in engineering andenvironmental problems has increased the application ofseismic reflection to study shallow targets of hydrogeo-logical, engineering, environmental, archeological, andgeotechnical aspects. The most important considerationconnected with this method is the recording of reflectionswith broad bandwidth (spectra shifted towards highfrequency) and the attenuation of the coherent noise (air
G. T. Al-Anezi (*)King Abdulaziz City for Science & Technology,P.O. Box 6086, Riyadh 11442, Saudi Arabiae-mail: [email protected]
A. M. Al-Amri :H. ZamanDepartment of Geology and Geophysics, King Saud University,Riyadh, Saudi Arabia
Arab J Geosci (2012) 5:1347–1358DOI 10.1007/s12517-011-0290-y
wave and ground roll) in a much possible way (Feroci etal. 2000). However, the main challenge in using high-resolution seismic reflection (HRSR) data for estimatingnear surface features is the maintenance of high
frequency reflections from shallow interfaces in the faceof attenuation and possible aliasing. In order to acquirehigh-resolution seismic data for shallow subsurfaceinvestigations, spacing between source and receivermust be established perfectly to ensure un-aliasing ofthe data.
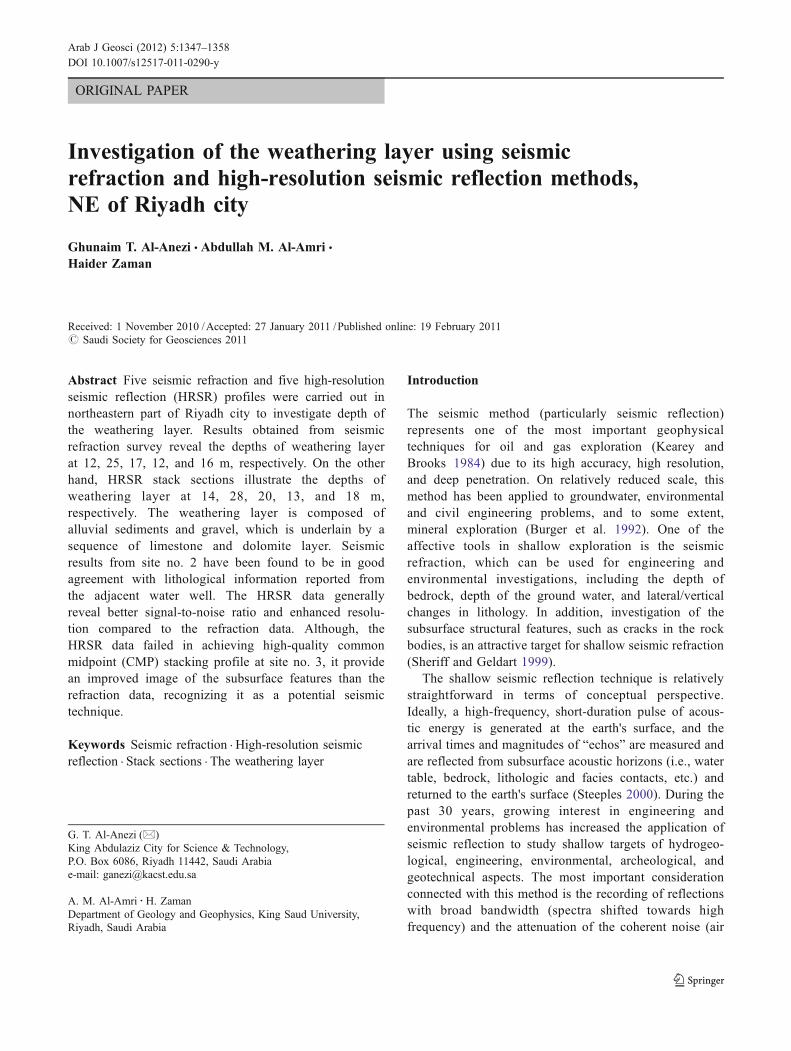
Keeping in view the usefulness of these methods, datafrom five seismic refractions and five HRSR profiles wereacquired in the study area (Fig. 1). Main objective of thisstudy is to determine the thickness of near-surfacesedimentary layer, a so-called weathering or low-velocitylayer.
Geologic setting
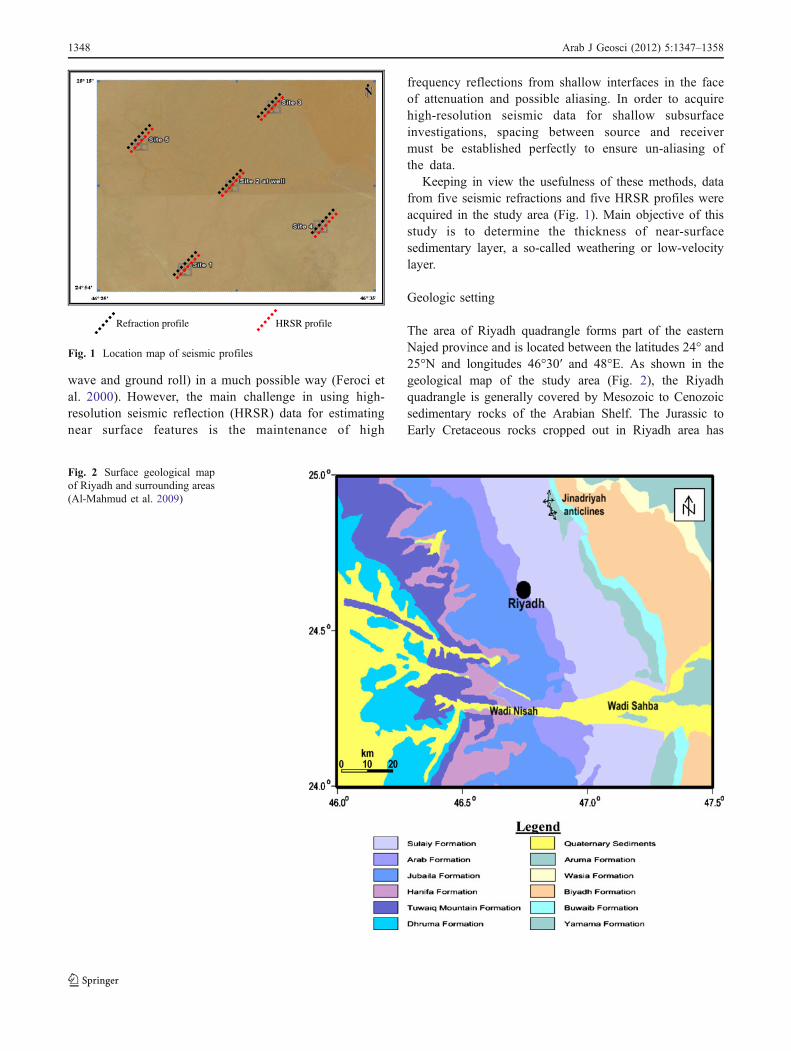
The area of Riyadh quadrangle forms part of the easternNajed province and is located between the latitudes 24° and25°N and longitudes 46°30′ and 48°E. As shown in thegeological map of the study area (Fig. 2), the Riyadhquadrangle is generally covered by Mesozoic to Cenozoicsedimentary rocks of the Arabian Shelf. The Jurassic toEarly Cretaceous rocks cropped out in Riyadh area has
Refraction profile HRSR profile
Fig. 1 Location map of seismic profiles
Fig. 2 Surface geological mapof Riyadh and surrounding areas(Al-Mahmud et al. 2009)
1348 Arab J Geosci (2012) 5:1347–1358

been assigned to a newly named Diriyah Supergroup(Vaslet et al. 1991) that consists of:
(1) Byradah group, comprising the Late Permian toTriassic deposits, mostly cropped out in western partof the quadrangle.
(2) Shaqra group of the Middle to Late Jurassic age.(3) Thamama group of the Early Cretaceous age.
About 30% of the Riyadh city (especially its central andeastern parts) is covered by recent sediments, which is
mainly composed of clay, silt, sand, and gravel deposits(Al-Othaman 2002).
Acquisition of the seismic data
In order to record seismic data for present study, a multi-channel signal enhancement seismograph of GEOMET-RICS INC. (Geode and Strata Visor NZ model) has beenused (Fig. 3).
Five seismic refraction profiles have been acquired in thetarget area using hammer as a source of energy. The intra-
Fig. 3 Seismic data acquisitionsystem
Table 1 Acquisition parameters for seismic refraction profiles
Data formatting SEG2
Geometry In-line-end-on offset
Number of receivers 32
Receiver spacing 3 m
Receiver type Model, GS–20 DH, response, 365 Ω,40 Hz, 0.70 damping
Shot spacing −5,0, 46.5, 93, 98 m
Source type Hammer (6 Kg)
Minimum offset 1 m
Maximum Offset 98 m
Number of stacking 10
Sampling interval 0.25 ms
Record length 1 s
Filter type Out
Gain Out
Table 2 Acquisition parameters for HRSR profiles
Data formatting SEGD
Geometry Split spread
Number of receivers 48
Receiver spacing 1 m
Receiver type Model, GS–20 DH, response, 365 Ω,40 Hz, 0.70 damping
Shot spacing 1 m
Source type Hammer (6 Kg)
Minimum offset 0.5 m
Maximum Offset 24.5 m
Number of stacking 5
Sampling interval 0.125 ms
Record length 1 s
Filter type Out
Gain Out
Arab J Geosci (2012) 5:1347–1358 1349
geophones spacing of 3 m have been used for all five profiles.The first shot is a normal shot within 5-m distance fromgeophone 1 (geophone 1 at 0 m), the second shot at a 0 m, thethird one (a midpoint shot) at 46.5-m distance betweengeophone 16 and 17, the fourth one at 93 m at geophone 32,and the last one (a reverse shot) at 98 m next to geophone 32.Among these five shots, only three shot-points distributed
throughout the profile have been chosen. Acquisition param-eters of all the seismic refraction profiles are listed in Table 1.
In addition to seismic refraction, five HRSR profileswere acquired at different locations in the study area usinghammer as a source of energy. For all five profiles, intra-geophone spacing of 1 m has been maintained. Acquisitionparameters of all these profiles are listed below in Table 2.
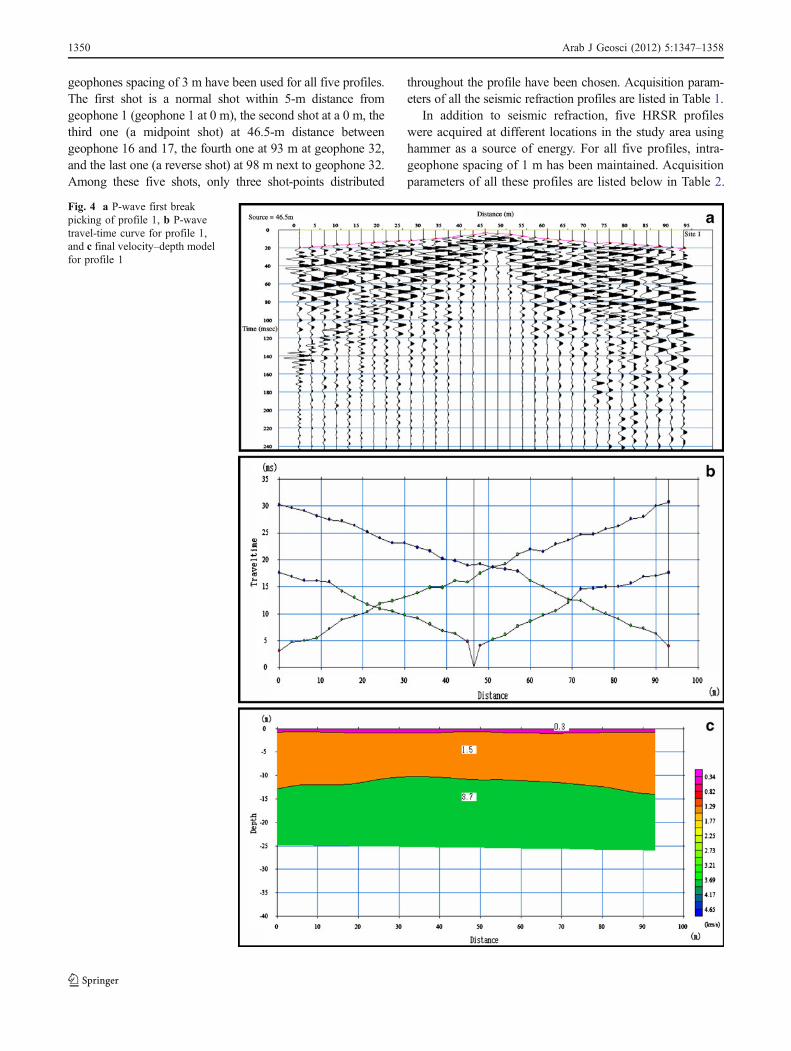
Fig. 4 a P-wave first breakpicking of profile 1, b P-wavetravel-time curve for profile 1,and c final velocity–depth modelfor profile 1
1350 Arab J Geosci (2012) 5:1347–1358

Analysis and interpretation of the seismic refraction data
Seismic refraction method has been widely used indetermining the thickness and velocities of the near-surface layers. In order to apply this method successfully,an accurate picking of the first arrival times is required.
Using SeisImager Software Package (Geometrics Inc.,2005), the first break picking was made for the digitizedseismic waveforms from all channels along the surveyedprofiles. After picking a first break from all profiles, thetravel time–distance (T–D) curves have been established foreach of them. Following this, the layers assignment
Fig. 5 a P-wave first breakpicking for profile 2, b P-wavetravel-time curve for profile 2,and c Final velocity–depthmodel for profile 2
Arab J Geosci (2012) 5:1347–1358 1351
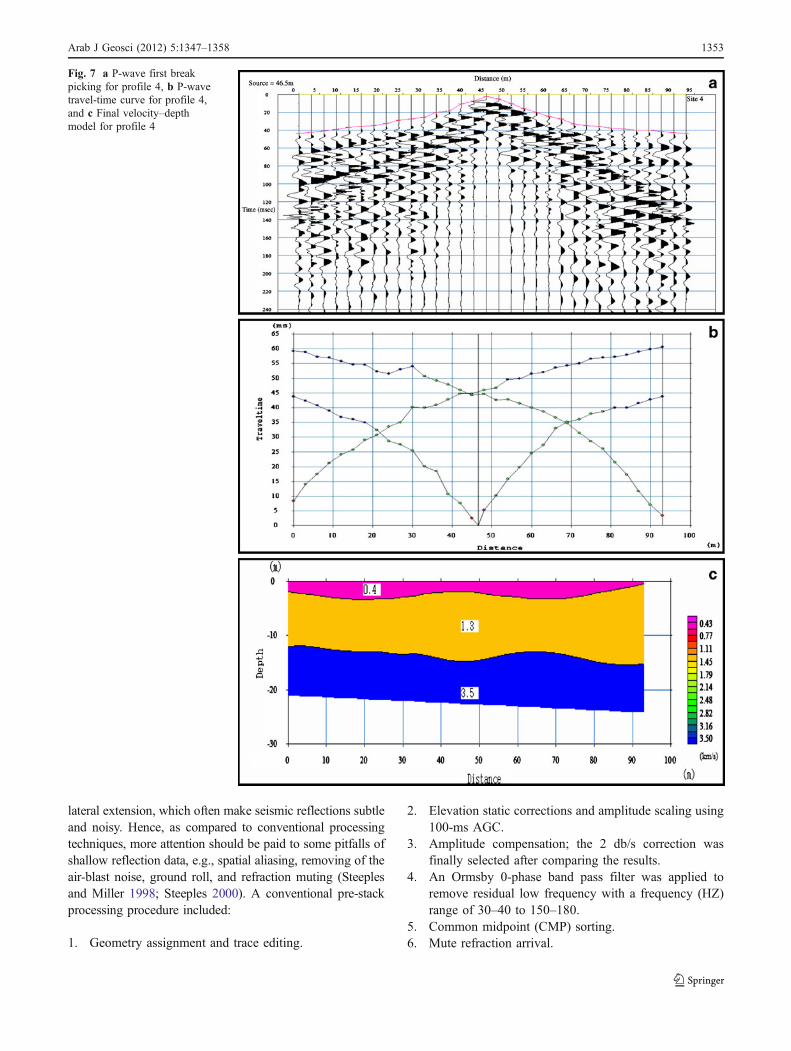
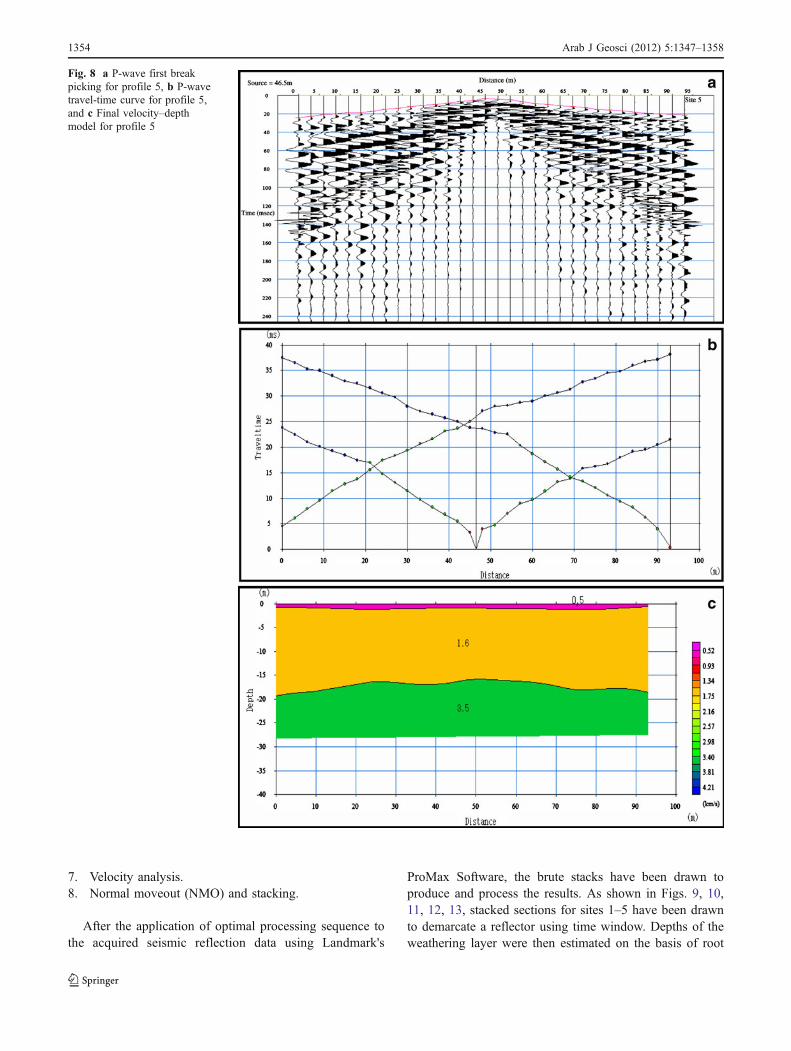
procedure has been achieved for each T–D curve. Finally,depth models for the detected layers under each profilehave been constructed as a step forward in the processingprocedure (Figs. 4, 5, 6, 7 and 8). After the estimation ofground model profiles for various velocities and depths(Table 3), it has been noticed that a thin and limited layer oflose sediments is present just under the ground surface,which has been added to the overall thickness of theweathering layer.
Analysis and interpretation of the HRSR data
The acquired HRSR data was processed to enhance signal-to-noise (S/N) ratio, for which Landmark's ProMax SoftwarePackage has been used. In general, the processing procedureof shallow seismic reflection data is similar to that ofconventional seismic reflection data (Steeples and Miller1990; Feroci et al. 2000). However, the near-surface layersgenerally carry low-velocity values that vary abruptly with
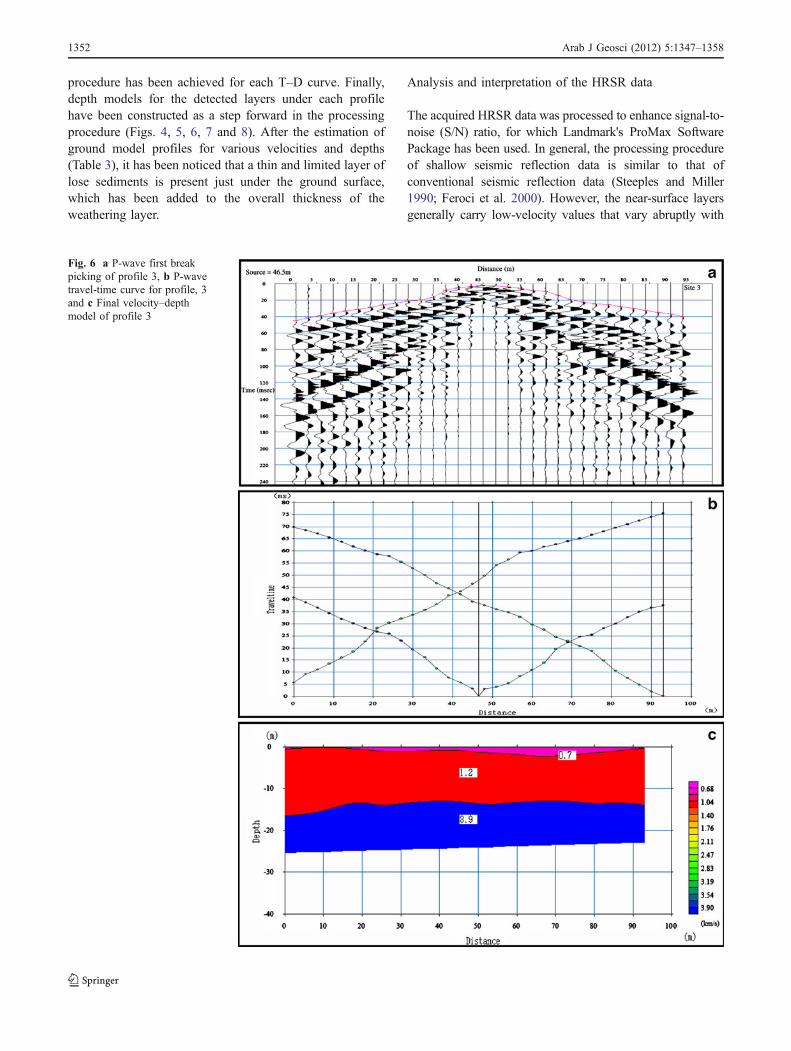
Fig. 6 a P-wave first breakpicking of profile 3, b P-wavetravel-time curve for profile, 3and c Final velocity–depthmodel of profile 3
1352 Arab J Geosci (2012) 5:1347–1358
lateral extension, which often make seismic reflections subtleand noisy. Hence, as compared to conventional processingtechniques, more attention should be paid to some pitfalls ofshallow reflection data, e.g., spatial aliasing, removing of theair-blast noise, ground roll, and refraction muting (Steeplesand Miller 1998; Steeples 2000). A conventional pre-stackprocessing procedure included:
1. Geometry assignment and trace editing.
2. Elevation static corrections and amplitude scaling using100-ms AGC.
3. Amplitude compensation; the 2 db/s correction wasfinally selected after comparing the results.
4. An Ormsby 0-phase band pass filter was applied toremove residual low frequency with a frequency (HZ)range of 30–40 to 150–180.
5. Common midpoint (CMP) sorting.6. Mute refraction arrival.
Fig. 7 a P-wave first breakpicking for profile 4, b P-wavetravel-time curve for profile 4,and c Final velocity–depthmodel for profile 4
Arab J Geosci (2012) 5:1347–1358 1353
7. Velocity analysis.8. Normal moveout (NMO) and stacking.
After the application of optimal processing sequence tothe acquired seismic reflection data using Landmark's
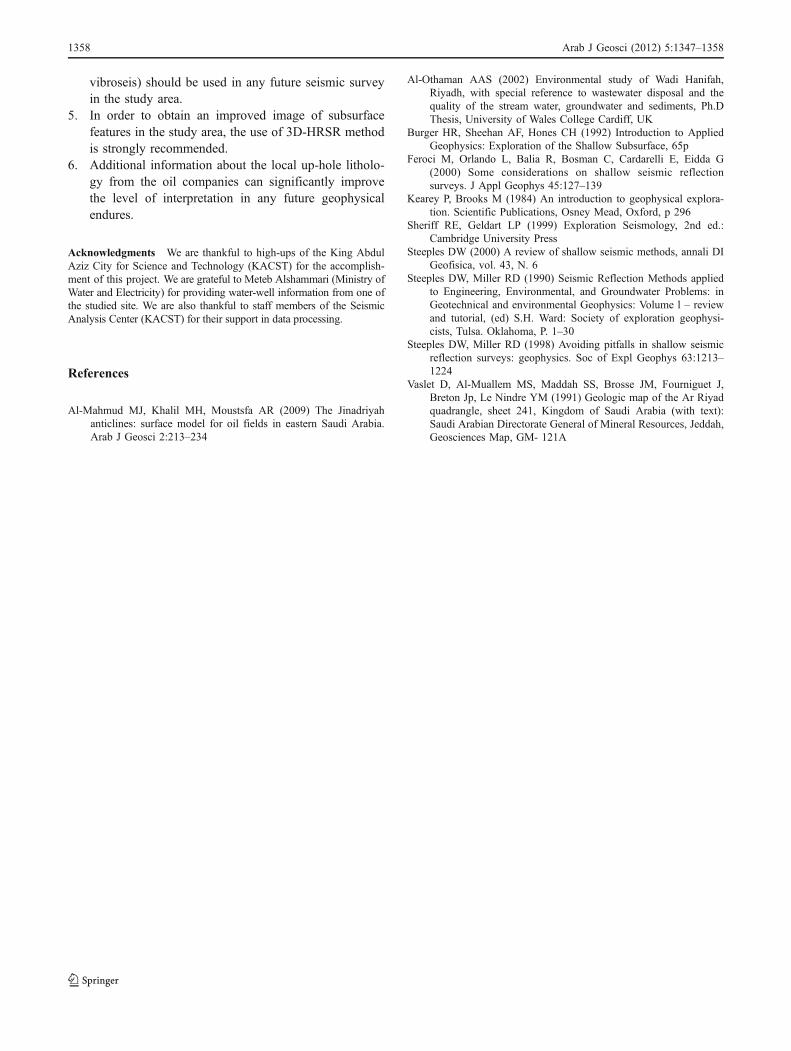
ProMax Software, the brute stacks have been drawn toproduce and process the results. As shown in Figs. 9, 10,11, 12, 13, stacked sections for sites 1–5 have been drawnto demarcate a reflector using time window. Depths of theweathering layer were then estimated on the basis of root
Fig. 8 a P-wave first breakpicking for profile 5, b P-wavetravel-time curve for profile 5,and c Final velocity–depthmodel for profile 5
1354 Arab J Geosci (2012) 5:1347–1358
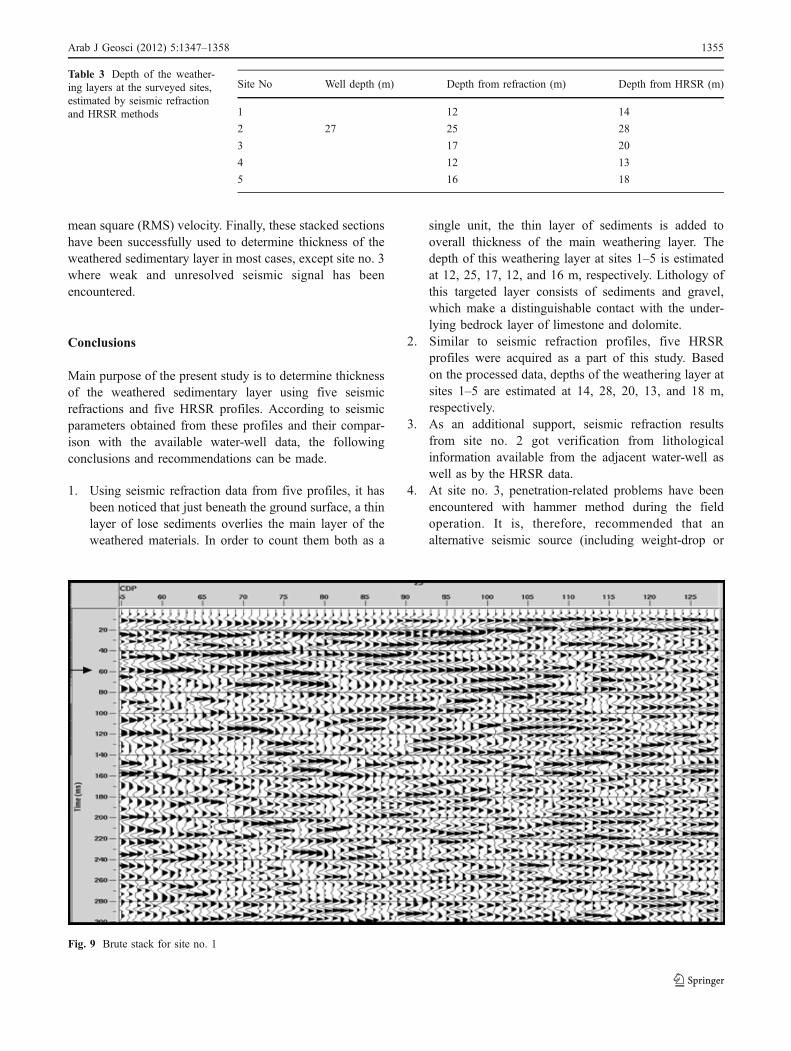
mean square (RMS) velocity. Finally, these stacked sectionshave been successfully used to determine thickness of theweathered sedimentary layer in most cases, except site no. 3where weak and unresolved seismic signal has beenencountered.
Conclusions
Main purpose of the present study is to determine thicknessof the weathered sedimentary layer using five seismicrefractions and five HRSR profiles. According to seismicparameters obtained from these profiles and their compar-ison with the available water-well data, the followingconclusions and recommendations can be made.
1. Using seismic refraction data from five profiles, it hasbeen noticed that just beneath the ground surface, a thinlayer of lose sediments overlies the main layer of theweathered materials. In order to count them both as a
single unit, the thin layer of sediments is added tooverall thickness of the main weathering layer. Thedepth of this weathering layer at sites 1–5 is estimatedat 12, 25, 17, 12, and 16 m, respectively. Lithology ofthis targeted layer consists of sediments and gravel,which make a distinguishable contact with the under-lying bedrock layer of limestone and dolomite.
2. Similar to seismic refraction profiles, five HRSRprofiles were acquired as a part of this study. Basedon the processed data, depths of the weathering layer atsites 1–5 are estimated at 14, 28, 20, 13, and 18 m,respectively.
3. As an additional support, seismic refraction resultsfrom site no. 2 got verification from lithologicalinformation available from the adjacent water-well aswell as by the HRSR data.
4. At site no. 3, penetration-related problems have beenencountered with hammer method during the fieldoperation. It is, therefore, recommended that analternative seismic source (including weight-drop or
Fig. 9 Brute stack for site no. 1
Site No Well depth (m) Depth from refraction (m) Depth from HRSR (m)
1 12 14
2 27 25 28
3 17 20
4 12 13
5 16 18
Table 3 Depth of the weather-ing layers at the surveyed sites,estimated by seismic refractionand HRSR methods
Arab J Geosci (2012) 5:1347–1358 1355
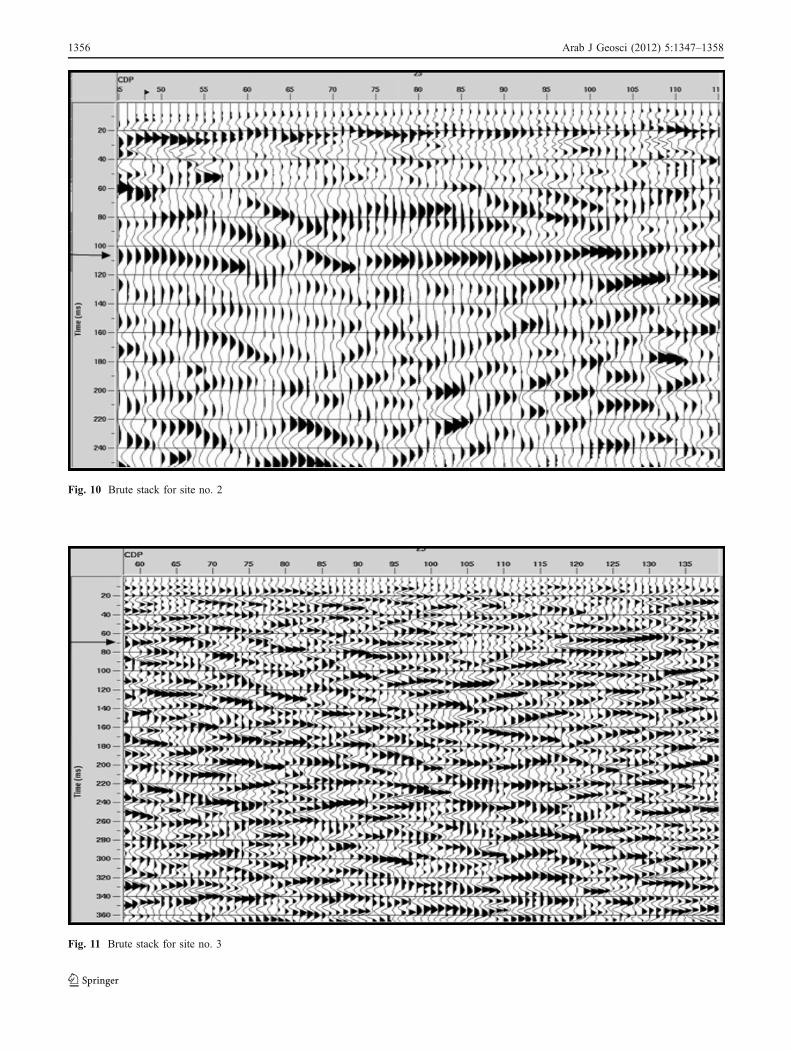
Fig. 11 Brute stack for site no. 3
Fig. 10 Brute stack for site no. 2
1356 Arab J Geosci (2012) 5:1347–1358
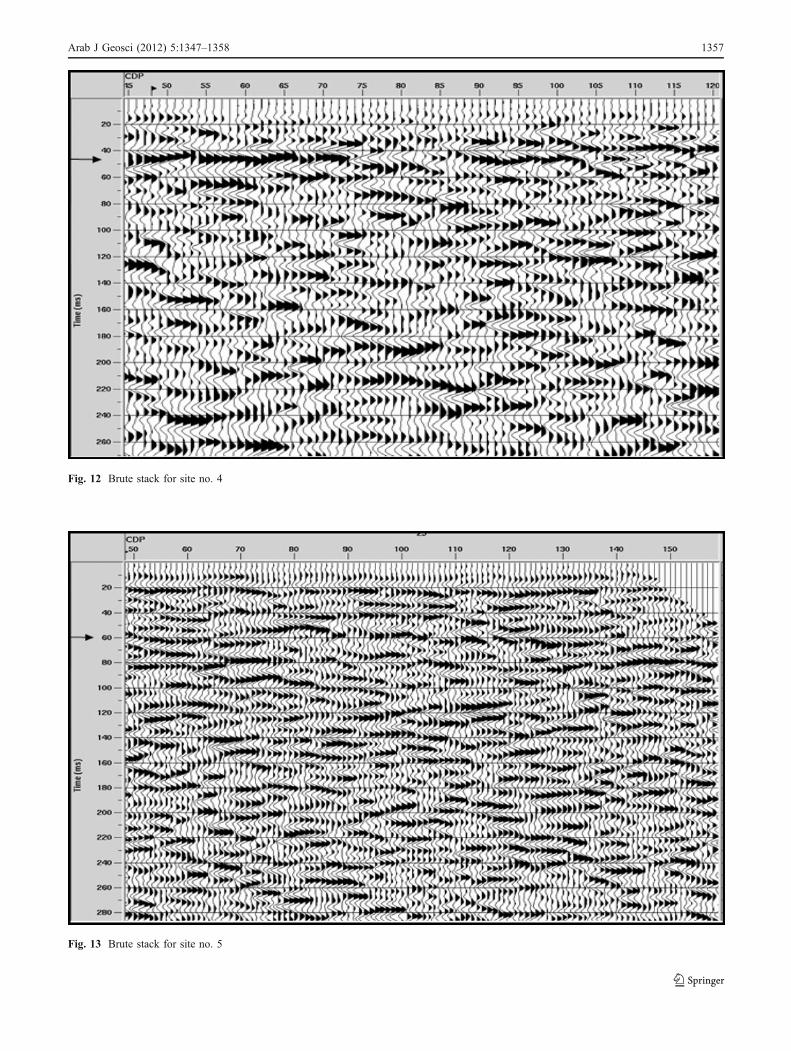
Fig. 13 Brute stack for site no. 5
Fig. 12 Brute stack for site no. 4
Arab J Geosci (2012) 5:1347–1358 1357
vibroseis) should be used in any future seismic surveyin the study area.
5. In order to obtain an improved image of subsurfacefeatures in the study area, the use of 3D-HRSR methodis strongly recommended.
6. Additional information about the local up-hole litholo-gy from the oil companies can significantly improvethe level of interpretation in any future geophysicalendures.
Acknowledgments We are thankful to high-ups of the King AbdulAziz City for Science and Technology (KACST) for the accomplish-ment of this project. We are grateful to Meteb Alshammari (Ministry ofWater and Electricity) for providing water-well information from one ofthe studied site. We are also thankful to staff members of the SeismicAnalysis Center (KACST) for their support in data processing.
References
Al-Mahmud MJ, Khalil MH, Moustsfa AR (2009) The Jinadriyahanticlines: surface model for oil fields in eastern Saudi Arabia.Arab J Geosci 2:213–234
Al-Othaman AAS (2002) Environmental study of Wadi Hanifah,Riyadh, with special reference to wastewater disposal and thequality of the stream water, groundwater and sediments, Ph.DThesis, University of Wales College Cardiff, UK
Burger HR, Sheehan AF, Hones CH (1992) Introduction to AppliedGeophysics: Exploration of the Shallow Subsurface, 65p
Feroci M, Orlando L, Balia R, Bosman C, Cardarelli E, Eidda G(2000) Some considerations on shallow seismic reflectionsurveys. J Appl Geophys 45:127–139
Kearey P, Brooks M (1984) An introduction to geophysical explora-tion. Scientific Publications, Osney Mead, Oxford, p 296
Sheriff RE, Geldart LP (1999) Exploration Seismology, 2nd ed.:Cambridge University Press
Steeples DW (2000) A review of shallow seismic methods, annali DIGeofisica, vol. 43, N. 6
Steeples DW, Miller RD (1990) Seismic Reflection Methods appliedto Engineering, Environmental, and Groundwater Problems: inGeotechnical and environmental Geophysics: Volume l – reviewand tutorial, (ed) S.H. Ward: Society of exploration geophysi-cists, Tulsa. Oklahoma, P. 1–30
Steeples DW, Miller RD (1998) Avoiding pitfalls in shallow seismicreflection surveys: geophysics. Soc of Expl Geophys 63:1213–1224
Vaslet D, Al-Muallem MS, Maddah SS, Brosse JM, Fourniguet J,Breton Jp, Le Nindre YM (1991) Geologic map of the Ar Riyadquadrangle, sheet 241, Kingdom of Saudi Arabia (with text):Saudi Arabian Directorate General of Mineral Resources, Jeddah,Geosciences Map, GM- 121A
1358 Arab J Geosci (2012) 5:1347–1358