Embed Size (px)
Citation preview

n3l - Int'l Summer School and Workshop on Non-Normal and Nonlinear
E�ects in Aero- and Thermoacoustics, June 18 � 21, 2013, Munich
INVESTIGATION OF VORTEX FORMATIONIN THE VICINITY OF PARALLEL PLATES IN
OSCILLATING FLOW USING PARTICLEIMAGE VELOCIMETRY
M. Rezk, A.H. Ibrahim1, T. Nigim, A. I. Abd El-Rahman1, A.A. Elbeltagy and EhabAbdel-Rahman+
School of Sciences and Engineering, American University in Cairo11835 New Cairo, Egypt
+ Corresponding author: [email protected]
Oscillating flows differ significantly from steady flows in many terms including onset ofturbulence, flow morphology, amount of turbulence and heat transfer characteristics dur-ing sudden expansion and contraction. This work uses Particle Image Velocimetry mea-surements to capture the vortex generation and flow morphology at the edges of a set ofparallel plates in an oscillating flow driven by an electrodynamic loudspeaker inside a ther-moacoustic resonator. The current work investigates the temporal development of the vor-tex at different points along the acoustic cycle, examines the effects of plate thickness, plateseparation and drive ratio on the flow morphology around the stack edge. This is of partic-ular interest to thermoacoustic engines and refrigerators where the vortex structures gen-erated at the inlets and exits of thermoacoustic stacks play a role in the non-linear lossesthat dissipate flow energy into heat and thus degrade the performance. The work presentsmeasured velocity field for different cases. Results visualize and quantify how the vortexsize and the size of the disturbance zone increase with the plate thickness and how the sizeof vortex-vortex interaction along the same plate or between two different plates decreases.Increasing the plate separation does not seem to affect the vortex size nor the size of the dis-turbance zone but it reduces the vortex-vortex interaction along the same plate. Increasingthe drive ratio increases the vortex size, the vortex-vortex interaction and the size of thedisturbance zone and greatly affects the dissipation of flow energy into heat. This work vi-sualizes and quantifies these effects for a range of values of dimensionless numbers.
1 Introduction
Oscillating flows of near-zero mean differ significantly from steady flows. Limited work has been madeto identify onset of turbulence, vortex generation, entrance length, and flow morphology and heattransfer characteristics [1] [2] [3] [4]. For example, Peacock and Stairmand [5] reported that laminaroscillating flows have shorter entrance length than in straight flows which impacts the developmentof the flow. These differences are very critical during sudden contraction or expansion as encounteredduring entrance and exit of stack pores in thermoacoustic engines or refrigerators because the conse-quent flow separation dissipates flow energy into heat.
The disturbance caused when a flow passes around an obstacle, especially a circular cylinder, iswell understood in steady flows where vorticity is created close to the cylinder surface due to the no-
1On leave from Mechanical Power Department, Faculty of Engineering, Cairo University, Giza, Egypt

M. Rezk, A.H. Ibrahim, T. Nigim, A. I. Abd El-Rahman, A.A. Elbeltagy and Ehab Abdel-Rahman
slip boundary condition. The flow does not experience disturbance in creeping flows (Re <1). As theReynolds number increases, twin vortices appear (4<Re<40), followed by a vortex street (40<Re<200),and flow instability (Re>200), before turbulent characteristics become dominant (Re>5000).
The flow morphology in oscillating flow is certainly less understood than in steady flows, particularlyfor the multi-plates forming the stacks used in thermoacoustic devices. The plate thickness and plateseparation should be optimized to reduce the blockage made to the flow and to maximize the heat-transfer zone and minimize the viscous dissipation zone for the working fluid used.
Several investigations are made on the flow morphology around a single cylinder in an oscillatingflow [6] or around a set of plates in an oscillatory flow. Jaworski et al. used Particle Image Velocimetry(PIV) to study the flow morphology around the stack edges [7]. Aben et al. studied the influence ofdifferent stack parameters and stack edge shapes on the generated vortex structures [8]. Berson et al.used PIV to study the formation of vortex structures at the edge of stacks at different plate thicknesses,plate spacings, number of plates and operating frequency [9]. Mao et al. developed an experimentalsetup using PIV to visualize the flow inside a parallel plate stack’s channels [10]. Shi et al. studied severalvortex wake patterns occurring at the end of a parallel plate stack and categorized them into eight wakepatterns according to the wake morphology [11].
An important aspect in the operation of thermoacoustic refrigerators is the drive ratio, defined as theratio of dynamic pressure amplitude to the average mean pressure. Operation at low drive ratios com-plies with the linear theory presented by Rott [12] and Swift [13]. Operation at higher drive ratios shouldgenerate more refrigeration power if non-linearities are controlled. Non-linear effects take the formsof turbulence, vortex formation, streaming, and generation of harmonics and these effects essentiallyreduce the performance of the thermoacoustics devices and thus should be deeply understood andreduced.
Several non-dimensional numbers typically are used to describe dimensionally-similar cases. Themost important numbers are described here: The Reynolds number, (Re); The Strouhal number (St);and the Womersley number (Wo). The Reynolds number is defined as V D
ν , where V is a velocity scale,
D is a length scale and ν is the kinematic viscosity. The Strouhal number is defined as f DV where f is
the operational frequency and the Womersley number asp
Re.St . In this work, the length scale D is theplate separation, the velocity scale is the average velocity at a point 6.5 mm away from the stack edge.The Keulegan-Carpenter number, defined as V
ωL , where ω is the angular oscillation frequency and L is
the plate length, presents the ratio of the displacement amplitude Vω to the stack length L. This partic-
ular number describes the significance of the stack end effects such that the two sides of the stack donot interact with each other for low values of the Keulegan-Carpenter number because the gas parceldisplacement is much less then the plate length.
The current work uses PIV measurements to visualize the vortex generation at the edges of a set ofparallel plates in an oscillating flow driven by a loudspeaker inside a thermoacoustic resonator. The cur-rent work studies the effects of plate thickness, plate separation and drive ratio on the flow morphologyat the edge of parallel plate stacks. This is of particular interest to thermoacoustic engines and refrig-erators where the vortex generated at the inlets and exits of thermoacoustic stacks play a role in thenon-linear losses that dissipate flow energy into heat. The range of Reynolds number, Strouhal num-ber, Womersley and Keulegan-Carpenter numbers used in this work are 8 to 280, 0.3 to 8, 8 to 17, and0.006 to 0.207 respectively. The low Reynolds and Womersley numbers indicate that the flow is far fromturbulence, the Strouhal number describes the vortex shedding from the stack while the low Keulegan-Carpenter number indicates that the plate length is much longer than gas parcel displacement meaningthat the two sides of the stack do not see each others.
2 Experimental setup
A quartz thermoacoustic resonator (615 mm in length, 48 mm × 48 mm inner cross section) houses astanding wave generated using an electrodynamic commercial loudspeaker (Pioneer TS-G1013R, maxi-mum power rating of 110 W, rated power of 20 W). The loudspeaker is placed inside an enclosure volume
2

M. Rezk, A.H. Ibrahim, T. Nigim, A. I. Abd El-Rahman, A.A. Elbeltagy and Ehab Abdel-Rahman
(265 mm × 240 mm × 230 mm, made of glass), as shown in Figure 1.
Figure 1: Schematic of the thermoacoustic resonator.
The loudspeaker is driven by a power amplifier (B & K Amplifier Type 2743) connected to a functiongenerator (Tektronix AFG 3021B). In this configuration, the speaker is able to generate a standing waveof drive ratio up to 1.92 %.
The acoustic flow generated from the loudspeaker passes parallel to a set of plates. In this work, threedifferent sets of plates are used to provide different plate thicknesses and different plate separations.
The first set has four plates (plate thickness of 7 mm, plate separation of 3 mm and plate length of 9cm), the second set has three plates (plate thickness of 7 mm, plate separation of 6 mm and plate lengthof 9 cm), and the third set has four plates (plate thickness of 4 mm, plate separation of 6 mm and platelength of 8 cm).
In order to visualize the flow pattern around the plates, (PIV) is used. The laser light sheet is generatedusing a Litron Class 4 Nd:YLF laser (527 nm wavelength, supplied by Dantec Dynamics model LDY303-PIV) and is directed normal to the resonator wall to lighten a horizontal plan in the middle of theresonator. Two consecutive PIV frames separated by 185 µs are taken repetitively at a rate of 2700 pairsper second using a CCD camera (Photron SA1.1, maximum frame rate of 5400 frames/s, a resolutionof 1024×1024 Pixels2, a pixel depth value of 12, connected to a 60 mm Nikon AF macro prime lens andhoused on a 3-D mechanism). A National Instruments timer box of (Model number 80N77) is used tosynchronization the laser light pulses and the CCD camera. The captured images are analyzed usingthe adaptive correlation technique in the software Dynamic Studio (version 2.3, supplied by DantecDynamics). Titanium dioxide particles (0.4 micrometer in diameter, 4000 kg/m3, supplied by Du Pont)are used as seeding particles introduced to the resonator via a home-made seeder of a converging-diverging nozzle connected to an air-step.
The resonator is opened regularly every three to four runs to clean deposits from the seeds. Black tapeis used to reduce laser glare. Figure 2 shows a schematic of the experimental setup.
Prior to measuring the flow structures around the plates in different flow configurations, PIV is usedto measure the gas parcel velocity along the resonator axis and the measurements are compared toDeltaEC simulations. These measurements are made for validation purpose with no stack or plates in-
3

M. Rezk, A.H. Ibrahim, T. Nigim, A. I. Abd El-Rahman, A.A. Elbeltagy and Ehab Abdel-Rahman
Figure 2: Schematic for the experimental setup.
side the resonator. During this process, the resonator is operated at its acoustic resonance frequency(129 Hz) and the speaker is tested in the lab to determine its mechanical resonance frequency, effectivecone area, DC resistance, Bl-product, lumped stiffness and lumped mass, and mechanical resistanceprior to the PIV measurements in order to properly model its performance using DeltaEC.
3 Results and discussion
This section describes the main results of this work. First, the measured gas parcel velocities aroundthe stack are validated and the validation results are presented in section 3.1. Then, the developmentof the vortex structure with respect to the acoustic cycle in and out of the parallel plates is analyzedin subsection 3.2. The effects of different plate thicknesses are presented in subsection 3.3, those ofdifferent plate separations are presented in subsection 3.4 and the effects of different drive ratios arepresented in subsection 3.5
3.1 Validation
For the sake of validation, gas parcel velocity is measured using PIV at different points across the lengthof the resonator when no stack is placed inside the resonator. The resonator is driven with a drive ratioof 0.73% at 129 Hz. The PIV system is used to measure temporal gas parcel velocity at several locationsalong the length of the resonator and to identify the dynamic pressure amplitude. At each measurementlocation 2728 images (of two-frames each separated by 185 µs) are taken at a rate of 2700 Hz giving atotal measurement period of about one second. This laser triggering rate at the resonance acousticfrequency used results in about 21 points per acoustic cycle. The field of view observed by the CCDcamera is 31 × 31 mm2. Adaptive correlation technique is used to analyze the raw images and producevector maps using a 128×128 Pixels2 interrogation area and a moving average filter. Numerical resultsare computed using DeltaEC software. The comparison between the experimental and DeltaEC results
4

M. Rezk, A.H. Ibrahim, T. Nigim, A. I. Abd El-Rahman, A.A. Elbeltagy and Ehab Abdel-Rahman
are presented in Figure 3. This result is considered a reasonable agreement and thus the work proceedsto measuring gas parcel velocities around the stack edges.
Figure 3: Measured and DeltaEC simulations for the gas parcel velocity distribution in an empty res-onator at a drive ratio of 0.73%.
3.2 Temporal development of vortex structure with respect to free-stream velocity
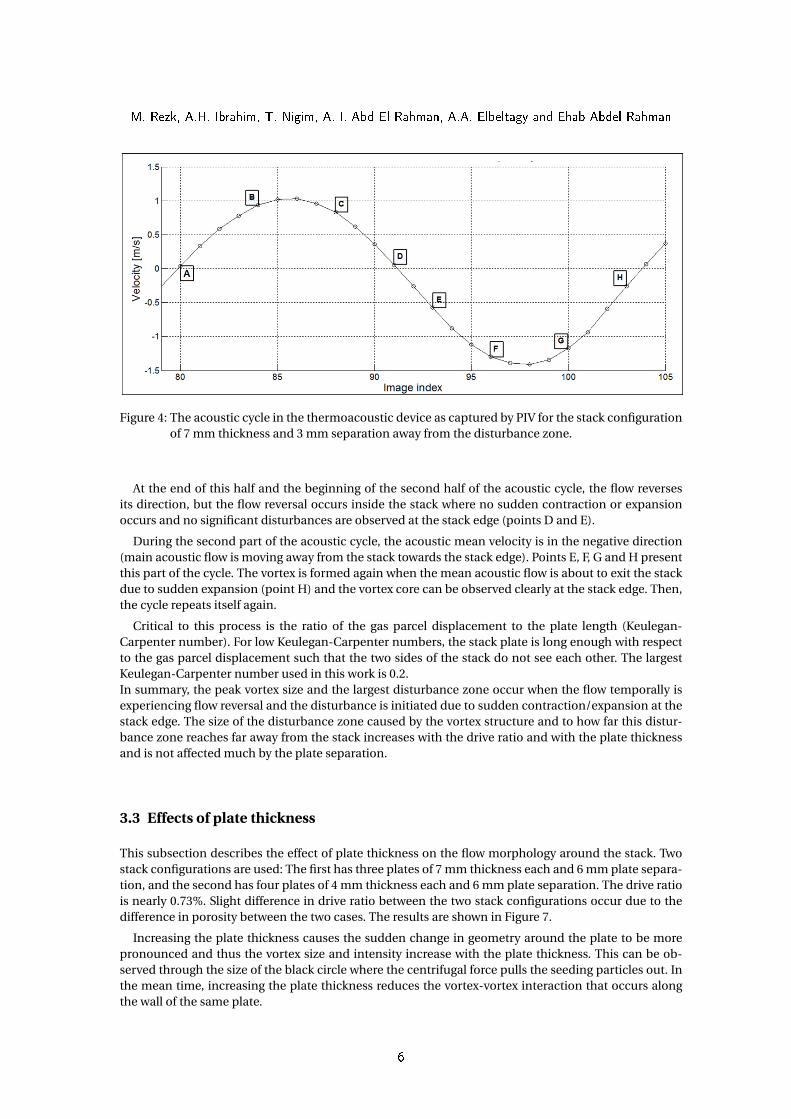
The temporal behaviour of the vortex structure is studied at eight points along the acoustic cycle. Figure4 shows the averaged value of velocity versus time which shows the sinusoidal acoustic velocity gener-ated by the loudspeaker. The configuration used is a stack of four plates of 7 mm thickness each, 3 mmplate separation and 9 cm plate length.
The vortex experiences a large centrifugal force that forces the seeding particles outside of the vortexcore and thus the vortex core appears as a black dot in the raw PIV images and appear with no correla-tion vectors in the vector maps. Guiding visual aids are used to highlight the vortex position in all thevector maps and white arrows are used to point to the black dots representing the vortex core in the rawPIV images. The values of the mean acoustic velocity 6.5 mm away from the stack edge, the Reynoldsnumber, the Strouhal number, the Womersley number and the Keulegan–Carpenter number are statedbelow each figure.
The acoustic cycle consists of two halves: The first half is when the acoustic mean velocity is in thepositive direction (main acoustic flow is moving towards the stack) and is represented by points A, B, Cand D.
At the beginning of this part (point A), the acoustic mean velocity is very low because the flow has justexperienced flow reversal and the mean kinetic energy in the flow cannot prevent flow separation whenthe flow experiences sudden contraction at the stack edge. Flow separation at the stack edge occursand a vortex is formed and can be observed clearly at the stack edge in the raw PIV image and in thecorresponding vector map.
As the acoustic mean velocity increases during the remaining part of this half, the mean kinetic en-ergy of the flow increases while the vortex is pulled between the two plates into the stack away from thestack edge. Both effects reduce the vortex size and intensity and the vortex at the stack edge becomesweaker (point D for example).
5
M. Rezk, A.H. Ibrahim, T. Nigim, A. I. Abd El-Rahman, A.A. Elbeltagy and Ehab Abdel-Rahman
Figure 4: The acoustic cycle in the thermoacoustic device as captured by PIV for the stack configurationof 7 mm thickness and 3 mm separation away from the disturbance zone.
At the end of this half and the beginning of the second half of the acoustic cycle, the flow reversesits direction, but the flow reversal occurs inside the stack where no sudden contraction or expansionoccurs and no significant disturbances are observed at the stack edge (points D and E).
During the second part of the acoustic cycle, the acoustic mean velocity is in the negative direction(main acoustic flow is moving away from the stack towards the stack edge). Points E, F, G and H presentthis part of the cycle. The vortex is formed again when the mean acoustic flow is about to exit the stackdue to sudden expansion (point H) and the vortex core can be observed clearly at the stack edge. Then,the cycle repeats itself again.
Critical to this process is the ratio of the gas parcel displacement to the plate length (Keulegan-Carpenter number). For low Keulegan-Carpenter numbers, the stack plate is long enough with respectto the gas parcel displacement such that the two sides of the stack do not see each other. The largestKeulegan-Carpenter number used in this work is 0.2.In summary, the peak vortex size and the largest disturbance zone occur when the flow temporally isexperiencing flow reversal and the disturbance is initiated due to sudden contraction/expansion at thestack edge. The size of the disturbance zone caused by the vortex structure and to how far this distur-bance zone reaches far away from the stack increases with the drive ratio and with the plate thicknessand is not affected much by the plate separation.
3.3 Effects of plate thickness
This subsection describes the effect of plate thickness on the flow morphology around the stack. Twostack configurations are used: The first has three plates of 7 mm thickness each and 6 mm plate separa-tion, and the second has four plates of 4 mm thickness each and 6 mm plate separation. The drive ratiois nearly 0.73%. Slight difference in drive ratio between the two stack configurations occur due to thedifference in porosity between the two cases. The results are shown in Figure 7.
Increasing the plate thickness causes the sudden change in geometry around the plate to be morepronounced and thus the vortex size and intensity increase with the plate thickness. This can be ob-served through the size of the black circle where the centrifugal force pulls the seeding particles out. Inthe mean time, increasing the plate thickness reduces the vortex-vortex interaction that occurs alongthe wall of the same plate.
6

M. Rezk, A.H. Ibrahim, T. Nigim, A. I. Abd El-Rahman, A.A. Elbeltagy and Ehab Abdel-Rahman
Figure 5: Points A through D on the acoustic cycle: The stack configuration is made of four plates of 7mm plate thickness and 3 mm plate separation. The vector map of velocity (left) and the rawPIV image (right).
7

M. Rezk, A.H. Ibrahim, T. Nigim, A. I. Abd El-Rahman, A.A. Elbeltagy and Ehab Abdel-Rahman
Figure 6: Point E through H on the acoustic cycle: Same stack configuration as in Figure 5.8

M. Rezk, A.H. Ibrahim, T. Nigim, A. I. Abd El-Rahman, A.A. Elbeltagy and Ehab Abdel-Rahman
Figure 7: Effect of plate thickness on the flow morphology around the stack edge. Two plate thicknessesare used (7 mm and 4 mm) with a plate separation of 6 mm and about 0.73% drive ratio in eachcase. Raw PIV image (top) and vector map of velocity (bottom).
9

M. Rezk, A.H. Ibrahim, T. Nigim, A. I. Abd El-Rahman, A.A. Elbeltagy and Ehab Abdel-Rahman
3.4 Effects of plate separation
This subsection describes the effect of plate separation on the flow morphology around the stack. Twostack configurations are used: The first has four plates of 7 mm thickness each and 3 mm plate sepa-ration, and the second has three plates of 7 mm thickness each and 6 mm plate separation. The driveratio is nearly 0.73%. Slight difference in drive ratio between the two stack configurations occur due tothe difference in porosity between the two cases. The results are shown in Figure 8.
Figure 8: Effect of plate separation on the flow morphology around the stack edge. Two plate separationsare used (3 mm and 6 mm) with a plate thickness of 7 mm and about 0.73% drive ratio in eachcase. Raw PIV image (top) and vector map of velocity (bottom).
Increasing the plate separation reduces the vortex-vortex interaction along the walls of differentplates and thus reduces the overall size of the disturbance zone. At large plate separation, the two vor-tices that form along the walls of different plates are separated from each other and can be identified
10

M. Rezk, A.H. Ibrahim, T. Nigim, A. I. Abd El-Rahman, A.A. Elbeltagy and Ehab Abdel-Rahman
separately. At small separation the two vortices strongly interact with each other giving rise to morecomplicated flow morphology.
3.5 Effects of drive ratio
This subsection describes the effect of drive ratio on the flow morphology around the stack. Two driveratios are used, namely 0.76% (right part of Figure 8) and 1.82% (Figure 9). These drive ratios are appliedto the stack configuration made of three plates of 7 mm thickness each and 6 mm plate separation. Thecomparison shows how increasing the drive ratio increases the size of the vortex core, the vortex-vortexinteractions along the wall of the same plate or between two different vortices, increases the size of thedisturbance zone, and greatly dissipates the flow energy into heat thus reducing the overall coefficientof performance of the thermoacoustic refrigerator.
Figure 9: Flow morphology at a drive ratio of 1.82% for a stack configuration of three plates of 7 mmplate thickness and 6 mm plate separation. Vector map of velocity (left) and raw PIV image(right).
4 Summary and conclusions
The thermoacoustic device is operated with a set of parallel plates of different plate thicknesses andplate separations and at different drive ratios in order to visualize, using PIV, the flow morphology atthe stack edges. The temporal development of the vortex at different points along the acoustic cycle ispresented and analyzed. The effects of plate thickness, plate separation and drive ratio on the size ofthe vortex core, the size of the disturbance zone away from the stack, and the vortex-vortex interactionsare presented and analyzed. The work visualizes and quantifies the above effects. Comparisons withcomputational Fluid Dynamic simulations currently are in progress.
References
[1] M. Hino, M. Kashiwayangi, M. Nakayama, and T. Hara. Experiments on the turbulence statisticsand the structure of a reciprocating oscillating flow. Journal of Fluid Mechanics, 131:363–399, 1983.
11

M. Rezk, A.H. Ibrahim, T. Nigim, A. I. Abd El-Rahman, A.A. Elbeltagy and Ehab Abdel-Rahman
[2] P. Merkli and H. Thomann. Transition to turbulence in oscillating pipe flow. Journal of Fluid Me-chanics, 68:567–576, 1975.
[3] S. I. Sergeev. Fluid oscillations in pipes at moderate reynolds numbers. Fluid Dynamics, 1(1):121–122, 1966.
[4] R. Akhavan, R. D. Kamm, and A. H. Shapiro. An investigation of transition to turbulence in boundedoscillatory stokes flows. Journal of Fluid Mechanics, 131:423–444, 1983.
[5] J. A. Peacock and J. W. Stairmand. Film gauge calibration in oscillatory pipe flow. Journal of PhysicsEducation: Scientific Instruments, 16:571–576, 1983.
[6] D. Nehari, V. Armenio, F. Ballio, and L. Adjlout. A 3d investigation of the dynamic loads over anarray of in-line cylinders at low {KC} and re numbers. Ocean Engineering, 31(11–12):1503 – 1535,2004.
[7] A. Jaworski, X. Mao, X. Mao, and Z. Yu. Entrance effects in the channels of the parallel plate stackin oscillatory flow conditions. Experimental Thermal and Fluid Science, 33:495–502, 2009.
[8] P.C.H. Aben, P.R. Bloemen, and J.C.H. Zeegers. 2-d piv measurements of oscillatory flow aroundparallel plates. Experiments in Fluids, 46(4):631–641, 2009.
[9] Arganthaël Berson, Marc Michard, and Philippe Blanc-Benon. Measurement of acoustic veloc-ity in the stack of a thermoacoustic refrigerator using particle image velocimetry. Heat and MassTransfer, 44(8):1015–1023, 2008.
[10] Xiaoan Mao, Zhibin Yu, ArturJ. Jaworski, and David Marx. Piv studies of coherent structures gener-ated at the end of a stack of parallel plates in a standing wave acoustic field. Experiments in Fluids,45(5):833–846, 2008.
[11] Lei Shi, Zhibin Yu, and Artur J. Jaworski. Vortex shedding flow patterns and their transitions in os-cillatory flows past parallel-plate thermoacoustic stacks. Experimental Thermal and Fluid Science,34(7):954 – 965, 2010.
[12] N. Rott. Thermoacoustics. Advances in Applied Mechanics, 20:135 – 175, 1980.
[13] G. Swift. Thermoacoustics: A unifying perspective for some engines and refrigerators. AcousticalSociety of America, 2001.
12