Embed Size (px)
Citation preview

International Journal of Advanced Scientific Technologies in Engineering and Management Sciences (IJASTEMS-ISSN:2454-356X) Volume.1,Issue.1.June2015
Page 17
Investigation on Consumer Buying Behavior
A.Srinivas,
Assistant Professor,
Chilkur Balaji Institute of Technology,
Hyderaba
Abstract:- The purpose of this empirical investigation is to find out the consumer buying behavior (CBB). This paper find factors possibly
influence the buying behavior of customers. The attitude or behavior perspective of the consumer. The empirical investigation aims to find
the viewpoint on consumers’ re-purchase or stop purchase intentions. Consumers decisions are significantly affected by their behavioral and
expected actions. Vigilant study review with potential has done to validate the empirical investigation work here. The selected study is
representing the factors that are significantly affecting on consumer buying behavior. The organized study of empirical work research is a
need to assess that the CBB is dependent on the attitudinal or behavioral aspect.
I.INTRODUCTION
Consumer buying behavior (CBB) is the sum total of a
consumer's attitudes, preferences, intentions and decisions
regarding the consumer's behavior in the marketplace when
purchasing a product or service. The study of consumer
behavior draws upon social science disciplines of
anthropology, psychology, sociology, and economics.
The standard model of consumer behavior consists of six
methodical and structured processes. They are Problem
recognition, Information search, Evaluation of alternatives,
Purchase decision, Purchase and Post-purchase evaluation.
After the post-purchase evaluation there is a change in the
consumer behavior, as if the consumer satisfies or receives
more than the expectation then he will inform about the
product to others and if he feels the product has not met his
expectations nor it gave him any satisfaction then the
consumer will behave in a different way either by not
buying the product nor insist other to go for the product or
complaint against the product or service.
The consumer buying behavior is seen in four different
ways. They are:
1. Complex buying behavior: This type of behavior
involves a high degree of consumer involvementthe
buying process with the consumer seeing a great
difference among brand choices. The example of
our consumer buying a car is an example of complex buying
behavior.
2. Habitual buying behavior. A typical consumer's
involvement in the buying process is low because the
consumer doesn't see much difference between available
brands in habitual buying behavior. The purchase of a food
commodity such as a sack of flour or sugar is a good
example.
3. Variety-Seeking buying behavior: Some buying
situations are characterized by low consumer involvement
but significant brand differences. Here consumers are often
observed to do a lot of brand’ switching. An example occurs
in purchasing cookies. The consumer has some beliefs,
chooses a brand of cookies without much evaluation, and
evaluates it during consumption. But next time, the
consumer may reach for another brand out of boredom or a
wish for a different taste. Brand switching occurs for the
sake of variety rather than dissatisfaction.
4. Dissonance-Reducing buying behavior: Sometimes the
consumer is highly, involved in a purchase but sees little
difference in the brands. The high involvement is again
based on the fact that the purchase is expensive, infrequent,
and risky. In this case, the buyer will Store around to learn
what is, available but will buy fairly quickly because brand
differences are not pronounced. The buyer may respond
primarily to a good price or to purchase convenience.
Consumer buying behaviors is a study based on purchaser
buying behaviors, with different directions, i.e. re-purchase
or stop purchasing.
Buying Behavior is the decision processes and acts of
people involved in buying and using products.
Need to understand:

International Journal of Advanced Scientific Technologies in Engineering and Management Sciences (IJASTEMS-ISSN:2454-356X) Volume.1,Issue.1.June2015
Page 18
Why consumers make the purchases that they
make?
What factors influence consumer purchases?
The changing factors in our society.
Consumer Buying Behavior refers to the buying behavior of
the ultimate consumer. A firm needs to analyze buying
behavior for:
Buyers’ reactions to a firms marketing strategy has
a great impact on the firm’s success.
The marketing concept stresses that a firm should
create a Marketing Mix (MM) that satisfies
customers, therefore need to analyze the what,
where, when and how consumers buy.
Marketers can better predict how consumers will
respond to marketing strategies.
Literature Review:
Consumer buying behavior is the study of individuals,
groups, or organizations and the processes they use to select,
secure, and dispose of products, services, experiences, or
ideas to satisfy needs and the impacts that these processes
have on the consumer and society.
Viewing consumer behavior in such a broad context
suggests it is actually a subset of human behavior. That is
factors affecting individuals in their daily lives also
influence their purchase activities. They are: Internal
influences such as learning and motives, and external factors
such as social expectations and constraints.
In fact it is often difficult to draw a distinct line between
consumer-related behavior and other aspects of human
behavior.
The behavioral science disciplines that have most
contributed to our understanding of consumers are:
Psychology is an academic and applied discipline that
involves the scientific study of mental functions and
behaviors. It has four sub-factors that influence in CBB.
They are Motivation, Perception, Learning and Ability &
Attitude.
H1: There is a positive association of Psychology on CBB.
Sociology is the scientific study of social behavior, its
origins, development, organization, and institutions. It is a
social science that uses various methods of empirical
investigation and critical analysis to develop a body of
knowledge about social order, social disorder and social
change., Social psychology is the scientific study of how
people's thoughts, feelings, and behaviors are influenced by
the actual, imagined, or implied presence of others. In this
definition, scientific refers to the empirical method of
investigation.
H2: Sociology has a great impact on CBB.
Economics is the social science that studies economic
activity to gain an understanding of the processes that
govern the production, distribution and consumption of
goods and services in an economy.
H3: Economics has a positive impact on CBB.
Anthropology is the scientific study of humans, past and
present, that draws and builds upon knowledge from the
social sciences and life sciences, as well as the humanities.
H4: Anthropology of a customer has a positive impact on
CBB.
Consumers are often studied because certain decisions are
significantly affected by their behavioral and expected
actions. For this reason, consumer behavior is said to be an
applied discipline. Such applications can exist at two
different levels of analysis. They are:
i) The micro perspective involves
understanding consumers for the
purpose of helping firm or
organization
ii) The societal perspective or macro or
aggregate level we know that
consumers collectively influence
economic and social conditions
within an entire society.
Proposed Research Model
II.RESEARCH METHODOLOGY
The nature of the current research is descriptive. Herein am
going to explain about a particular situation instead of
interpreting and making decisions’ judgments. Descriptive
Psychological
Factor
Consumer
Buying
Behavior
Economical
Factor
Societal
Factor
Anthropology
Factor
International Journal of Advanced Scientific Technologies in Engineering and Management Sciences (IJASTEMS-ISSN:2454-356X) Volume.1,Issue.1.June2015
Page 19
research’s is all about describing people who take part in the
study. The objective of the study is to develop the
hypotheses that reflect the current situation. The research
provides information about the current scenario.
Data / Sample size Papers of questionnaires were provided
to the public in the localities of Hyderabad and Secundrabad
and they were requested to think a situation relating a
product or service failure that had happened to them (Yuksel
et al. 2006; Levesque and McDougall, 1991). And asked
them to respond that the post purchase evaluation leads to
re-purchase or not. The target population of the study
consists of students, employees, businessmen, unemployed
and housewives. The population samples of 150 respondents
were asked to participate in a questionnaire. The population
for this research is customer of Hyderabad and
Secundrabad. The current study utilizes a known probability
sampling technique that is “convince sampling”.
Convenience sampling is a sampling technique that obtains
and collects the relevant information from the sample or the
unit of the study that are conveniently available (Zikmunt
1997). Convince sampling is normally used for collecting a
large number of completed surveys speedily and with
economy (Lym et al. 2010).
Measure/Instruments The survey method of the current
study address two major purposes; first is to analyze the
relationship of different variables in decision making of
customer buying behavior. Second, to collect information
about the different characteristic of the respondents that can
be used to understand the variation in re-purchase for
different categories. For this study a Questionnaire method
has been used as the data gathering method. The
questionnaire consisting of two sections, the first section
aims to find out some of the personal demographic features,
such as sex, age, income, educational level and current
status of the respondents, the second section consisting of
questions which are able to collect the information related to
the study.
Procedure The questionnaire was distributed among 200
respondents in Hyderabad and Secundrabad. These
respondents are selected based on the criteria above
mentioned. Before giving the questionnaire, the purpose of
the study and question were explained to the respondent so
they can easily fill the questionnaire with relevant
responses. A total of 150 questionnaires were selected and
rest of the questionnaire was not included in the further
analysis due to incomplete or invalid responses. After
collecting the completed questionnaire, these questionnaires
were coded and entered into the SPSS sheet for regression
analysis.Reliability Analysis Overall Cronbach‟s alphas of
over study are more than acceptable and recommended
value 0.50 by Nunnally, (1970) and 0.60 by Moss et al.
(1998). This shows that all the 16 items were reliable and
valid to measure the opinion of consumers towards customer
complaining behavior.
EMPIRICAL FINDINGS AND DATA ANALYSIS
5.1 Introduction
The main objective of this empirical study is to find out the
effectiveness of some elements on the buying behaviors’ of
customers. This chapter shows the analyses of the data
gathered from the survey questionnaire. Section 5.2 gives
the basic information of the respondents, section 5.3 looks at
the influence factors in relation to the general population,
and section 5.4 looks at the extra suggestions made by the
respondents. Section 5.5 gives a brief description of the chi-
square goodness of fit test, and section 5.6 looks at the
cluster analysis of the respondents. About 100
questionnaires were distributed across schools and shopping
centres whereby 95 were valid because 5 respondents were
below 18 years. The data was analyzed by the researcher
based on the literature, theories and the use of SPSS.
The questionnaire is divided into three sections. The first
section looks at the basic information
of the responder, the second section deals with the questions
about the influencing factors, and the last section asks for
further suggestions. The English version of the
questionnaire and its Finnish version are in the appendices I
and II respectively.
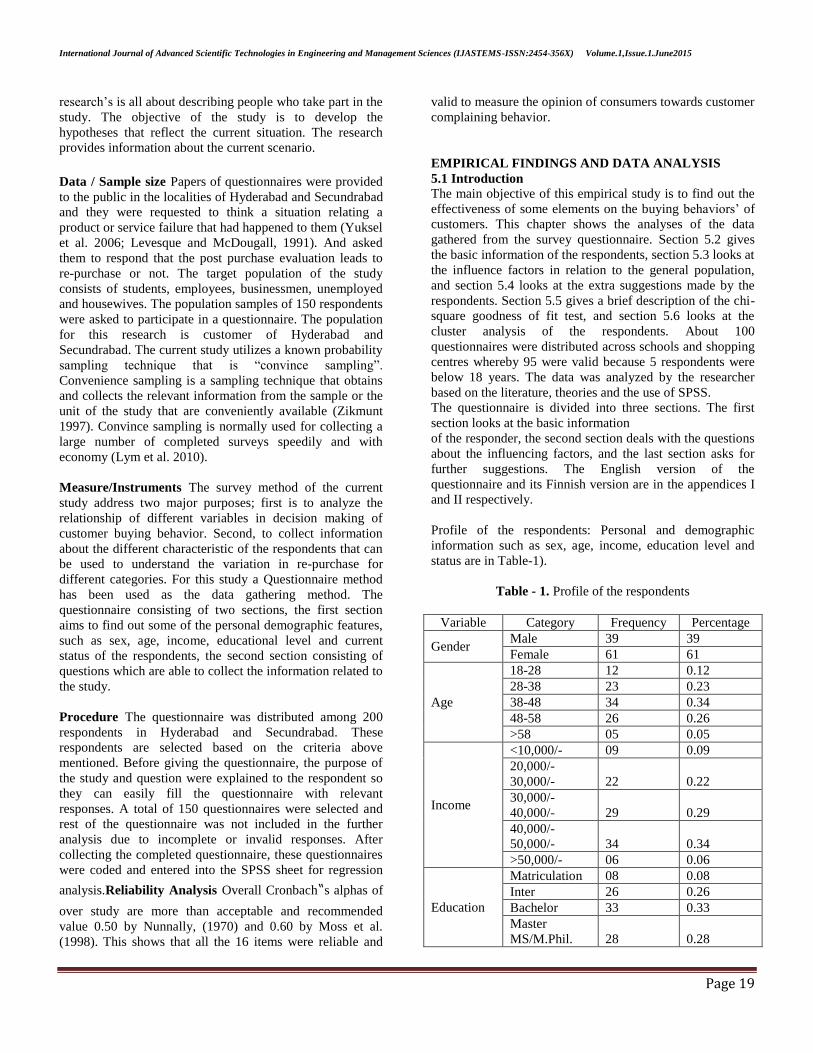
Profile of the respondents: Personal and demographic
information such as sex, age, income, education level and
status are in Table-1).
Table - 1. Profile of the respondents
Variable Category Frequency Percentage
Gender Male 39 39
Female 61 61
Age
18-28 12 0.12
28-38 23 0.23
38-48 34 0.34
48-58 26 0.26
>58 05 0.05
Income
<10,000/- 09 0.09
20,000/-
30,000/- 22 0.22
30,000/-
40,000/- 29 0.29
40,000/-
50,000/- 34 0.34
>50,000/- 06 0.06
Education
Matriculation 08 0.08
Inter 26 0.26
Bachelor 33 0.33
Master
MS/M.Phil. 28 0.28

International Journal of Advanced Scientific Technologies in Engineering and Management Sciences (IJASTEMS-ISSN:2454-356X) Volume.1,Issue.1.June2015
Page 20
Ph.D 05 0.05
Status
Student 28 0.28
Employed 32 0.32
Businessman 12 0.12
House-wife 28 0.28
5.3 Influencing factors
There are 10 questions posed in the questioner to the
customers to know about the factors that influence their
buying behavior. Based on these questions the factors which
influence the buying behaviors of customers can be
determined.
Using the formula P ± Zc* (P*(1-P)/N)
where P is the percentage of the sample which agree or
disagree with the tested variable,
Zc is the confidence interval, and
N is the sample size, estimates were made to show the
percentages of the general population which agree or
disagree with the questions.
P - Zc* (P*(1-P)/N) gives the lowest value and P +
Zc* (P*(1-P)/N) also gives the highest or upper value for
the estimation. Those who chose “do not know” were not
considered in the estimation of the general population.
N is 102, and Zc (confidence interval) at 95% is 1.96.
Save your customer’s time
Question: I buy mostly from the shop which is closest to
me. This question links to access convenience which
eventually saves customer’s time. The aim is to find out if
customers consider the distances from their destinations to
shops when going out for shopping.
Figure 4: The effect of closeness location of shop on
customer’s buying decision
The result of this question shows that 70 of the respondents
which constitute 68% agree that they buy mostly from the
shop which is closest to them. On the other hand, 26
respondents who constitute 26% do not buy mostly from a
shop just because it is closer to them.
10 (10%) out of the 102 respondents do not know the effect
of the closeness of a shop on their buying decisions.
Using the formula P ± Zc*SQRT (P*(1-P)/N), N= 102,
Zc=1.96.
26% of the sample population disagree (P=26.00%),
therefore between 17.49% and 34.51% of the general
population disagree. 68% of the sample population agree
(P=68.00%), then between 58.95% and 77.05% of the
general population agree. Comparatively, the upper value of
disagreed population (34.51%) is below the lower value of
the agreed population (58.95%) which means the factor has
a strong influence on customers’ buying behaviours.
Question: I buy mostly from the shop which is located
where transportation or transiting is easier (access
convenience). The aim is to find out if customers consider
which shop they can transport their goods back home
without wasting time.
Figure 5: The effect of easy transportation on customer’s
buying decision
Out of the 102 respondents, 76 of them which constitute
74% agree that they mostly buy from shops which are
located in places where transporting and or transiting of
their goods back home is easier. 16 (16%) out of the 102
respondents disagree to the fact that easy access to
transportation is a factor to be considered when thinking of
which shop to visit.
Using the formula P ± Zc*SQRT (P*(1-P)/N), N= 102,
Zc=1.96.
16% of the sample population disagree (P= 16.00%),
therefore between 8.89% and 23.11% of the general
population disagree. 74% of the sample population agree
(P= 74.00%), therefore between 65.49% and 82.51% of the
general population agree.
Comparatively, the upper value of disagreed population
(23.11%) is far below the lower value of the agreed
population (65.49%) which means the factor has a very
strong influence on customers’ buying behaviours.
Question: I buy mostly from the shop where the needed
items can easily be located (search convenience). This
question is to find out if customers consider which shop they
can easily find what they need without wasting much time.
Figure 6: The effect of finding the needed items on
customer’s buying decision
The result shows that 75 of the respondents which constitute
73% agree that they buy mostly from the shop where the
needed items can easily be obtained on time. On the other
hand, 17 respondents who constitute 17% do not buy mostly
from a shop just because the needed items can easily be
located.
10 (10%) out of 102 respondents do not know the effect of
easy location of the needed items on their buying decisions.
Using the formula P ± Zc*SQRT (P*(1-P)/N), N= 102,
Zc=1.96.
17% of the sample population disagree (P= 17.00%),
therefore between 9.71% and 24.29% of the general
population disagree. 73% of the sample population agree
(P= 73.00%), therefore between 64.38% and 81.62% of the
general population agree.
Comparatively, the upper value of disagreed population
(24.29%) is far below the lower value of the agreed
population (64.38%) which means the factor has a strong
influence on customers’ buying behaviours.
Question: I buy mostly from the shop where I spend less
time in my transaction (transaction convenience). This
question is to find out if customers think of which shop they
can pick what they want and pay for it as quickly as
possible.
Figure 7: The effect of easy transaction on customer’s
buying decision
From the result, it shows that 35 of the respondents which
constitute 34% disagree that spending less time in
transaction affect their buying decision on which shop to
buy their goods and services from. On the other hand, 29

International Journal of Advanced Scientific Technologies in Engineering and Management Sciences (IJASTEMS-ISSN:2454-356X) Volume.1,Issue.1.June2015
Page 21
respondents who constitute 29% buy mostly from a shop
where they can pick and pay for what they want as quickly
as possible.
As much as 38 (37%) out of 102 do not know the effect of
spending less time in a transaction on their buying decisions.
Using the formula P ± Zc*SQRT (P*(1-P)/N), N= 102,
Zc=1.96.
34% of the sample population disagree (P= 34.00%),
therefore between 24.81% and 43.19% of the population
disagree. 29% of the sample population agree (P= 29.00%),
therefore between 20.19% and 37.81% of the general
population agree.
Comparatively, the upper value of disagreed population
(43.19%) is above the upper value of the agreed population
(37.81%) which means the factor has no influence on
customers’ buying behaviours.
Fair Prices
Question: I buy mostly from the shop which offers low
prices. This question is to determine if customers look for
shops which offer low prices irrespective of the nature of the
goods.
Figure 8: The effect of low prices on customer’s buying
decision
The result indicates that 52 of the respondents which
constitute 51% agree that they buy from shops which offer
low prices for their goods and services. This shows that
customers compare prices of goods sold in various shops
and finally choose to buy from shops which offer low prices
for their goods and services. On the other hand, 32
respondents who constitute 31% do not buy mostly from a
shop because it offers low prices for goods and services.
This indicates that low prices for goods and services do not
influence their decision to buy mostly from such shop.
As much as 18 (18%) out of 102 do not know the effect of
low prices of goods and services on their buying decisions.
Using the formula P ± Zc*SQRT (P*(1-P)/N), N= 102,
Zc=1.96.
31% of the sample population disagree (P= 31.00%),
therefore between 22.02% and 39.98% of the population
disagree. 51% of the sample population agree (P= 51.00%),
therefore between 41.30% and 60.70% of the general
population agree.
Comparatively, the upper value of disagreed population
(39.98%) is below the lower value of the agreed population
(41.30%) which means the factor has a strong influence on
customers’ buying behaviours.
Question: I buy mostly from the shop which offers fair
prices (low prices for goods of low quality and high prices
for goods of high quality). The aim is to find out if
customers visit shops which offer fair prices for their goods.
Figure 9: The effect of fair prices on customer’s buying
decision
The outcome of this question indicates that 63 of the
respondents which constitute 62% agree that they buy
mostly from shops which offer fair prices for their goods
and services. This implies customers compare prices of
goods sold in various shops and finally choose to buy from
shops which offer low prices for goods of low quality and
high prices for goods of high quality.
On the other hand, 27 respondents who constitute 26% do
not buy mostly from a shop because it offers fair prices for
goods and services. This indicates that fair prices for goods
and services do not influence their decision to buy mostly
from such shops. Out of 102, 12 (12%) of the respondents
do not know the effect of fair prices of goods and services
on their buying decisions.
Using the formula P ± Zc*SQRT (P*(1-P)/N), N= 102,
Zc=1.96.
26% of the sample population disagree (P= 26.00%),
therefore between 17.49% and 34.51% of the general
population disagree. 62% of the sample population agree
(P= 62.00%), therefore between 52.58% and 71.42% of the
general population agree.
Comparatively, the upper value of disagreed population
(34.51%) is below the lower value of the agreed population
(52.58%) which means the factor has a strong influence on
customers’ buying behaviours.
Treat customers with respect
Question: I buy mostly from the shop where I am treated
with respect. This question is to determine if customers
think of which shops they are treated with respect.
Figure 10: The effect of treating customers with respect on
customer’s buying decision
From the result, as many as 67 (66%) out of 102
respondents agree that they buy mostly from shops where
they are treated with respect. On the other hand, 10
respondents who constitute 10% do not buy repeatedly from
a particular shop because they are treated with much respect.
Out of 102, as many as 25 (24%) of the respondents do not
know the effect of how they are treated by shop attendants
on their buying decisions.
Using the formula P ± Zc*SQRT (P*(1-P)/N), N= 102,
Zc=1.96.
10% of the sample population disagree (P= 10.00%),
therefore between 4.18% and 15.82% of the general
population disagree. 66% of the sample population agree
(P= 66.00%), therefore between 56.81% and 75.19% of the
general population agree.
Comparatively, the upper value of disagreed population
(15.82%) is below the lower value of the agreed population
(56.81%) which means the factor has a strong influence on
customers’ buying behaviours. This implies customers are
influenced by how they are treated by the attendants when
deciding on which shop that they should buy their goods and
services. Customers prefer buying repeatedly from shops
where they are given the due respect irrespective of how
much they are buying, age, gender, and race.
Solve customer’s problem

International Journal of Advanced Scientific Technologies in Engineering and Management Sciences (IJASTEMS-ISSN:2454-356X) Volume.1,Issue.1.June2015
Page 22
Question: I buy mostly from the shop where the attendants
are experts in the area of the business. The aim is to find out
if customers are attracted to shops where the attendants have
enough knowledge in their areas of business and can help
them solve their problems.
Figure 11: The effect of expert shop attendants on
customer’s buying decision
About 54% (55/102) respondents agree that they buy mostly
from shops where the sales personnel have credible
knowledge in their area of the business. On the contrary, 29
(29%) of the respondents disagree with the fact that shop
attendants who are experts in their area of the business
influence their decision to buy repeatedly from the shop. In
all, 18 (17%) of the respondents do not know the effect of
expert shop attendants on their buying decisions.
Using the formula P ± Zc*SQRT (P*(1-P)/N), N= 102,
Zc=1.96.
29% of the sample population disagree (P= 29.00%),
therefore between 20.19% and 37.81% of the general
population disagree. 54% of the sample population agree
(P= 54.00%), therefore between 44.33% and 63.67% of the
population agree.
Comparatively, the upper value of disagreed population
(37.81%) is below the lower value of the agreed population
(44.33%) which means the factor has a strong influence on
customers’ buying behaviours. The result indicates that
customers prefer buying repeatedly from shops where the
attendants have credible knowledge in their area of the
business. The implication is that customers feel more
satisfied when they are served by expert attendants, and by
so doing they are influenced to buy repeatedly from such
shops.
Question: I buy mostly from the shop which offers
additional services for free. The question aims to find out if
customers visit shops where they can enjoy extra services
for free.
Figure 12: The effect of free additional services on
customer’s buying decision
About 43% (44/102) respondents agree that they buy mostly
from shops where additional services are offered for free.
On the contrary, as many as 31 (31%) of the respondents
disagree with the fact that enjoying extra services for free
influence their decisions to buy repeatedly from such shops.
Surprisingly, 27 (26%) of the respondents do not know the
effect of free extra services on their buying decisions.
Using the formula P ± Zc*SQRT (P*(1-P)/N), N= 102,
Zc=1.96.
31% of the sample population disagree (P= 31.00%),
therefore between 22.02% and 39.98% of the general
population disagree. 43% of the sample population agree
(P= 43.00%), therefore between 33.39% and 52.61% of the
population agree.
Comparatively, the upper value of disagreed population
(39.98%) is above the lower value of the agreed population
(33.39%) and below the upper value (52.61%) which means
the factor has little influence on customers’ buying
behaviours. It is obvious from the result that shops which
offer free extra services to their customers end up attracting
and retaining more customers. Again, customers prefer
buying repeatedly from shops which give surprises in the
form of extra services that cannot be obtained from other
service providers for free.
Question: I buy mostly from the shop which sells current
and fashionable or trendy goods. The question aims to find
out if customers are attracted to visit shops where they can
find new goods that fit the new life style.
Figure 13: The effect of current and trendy goods on
customer’s buying decision
Looking at this result, about 43% (44/102) of the
respondents accept that shops which sell current and trendy
goods influence them to buy mostly from such shops. On
the contrary, 39% (40/102) of the respondents do not agree
with this fact. Finally, as many as 18% (18/102) of the
respondents do not know the effect of the type of goods and
services offered by shops on their buying decisions.
Using the formula P ± Zc*SQRT (P*(1-P)/N), N= 102,
Zc=1.96.
39% of the sample population disagree (P= 39.00%),
therefore between 29.53% and 48.47% of the general
population disagree. 43% of the sample population agree
(P= 43.00%), therefore between 33.39% and 52.61% of the
general population agree.
Comparatively, the upper value of disagreed population
(48.47%) is above the lower value of the agreed population
(33.39%) and below the upper value (52.61%) which means
the factor has little influence on customers’ buying
behaviours. This indicates that the factor is not very strong
to influence customers to decide which shop they should
visit mostly. Despite the strength of this factor, the result
means customers are influenced to buy repeatedly from a
particular shop based on the fact that the goods sold are
current, fashionable or trendy.
Connect to customer’s emotion
Question: I buy mostly from the shop where attendants
show concern about my problems. This question is to
determine if customer are influenced to visit shops where
the attendants show a sense of love, care, and concern about
their problems.
Figure 14: The effect of shop attendants’ emotional care on
customer’s buying decision
The result of this question shows that 53 (52%) respondents
agree that they prefer buying from shops where the
attendants show much concern about their problems. 27
(27%) out of 102 respondents disagree with the idea that
they are attracted to buy mostly from shops where the
attendants show emotional concern about their problems.
The remaining 22 (21%) of the respondents do not know the
effect of shop attendants’ emotional care on their buying
decisions.

International Journal of Advanced Scientific Technologies in Engineering and Management Sciences (IJASTEMS-ISSN:2454-356X) Volume.1,Issue.1.June2015
Page 23
Using the formula P ± Zc*SQRT (P*(1-P)/N), N= 102,
Zc=1.96.
27% of the sample population disagree (P= 27.00%),
therefore between 18.38% and 35.62% of the general
population disagree. 52% of the sample population agree
(P= 52.00%), therefore between 43.31% and 62.69% of the
general population agree.
Comparatively, the upper value of disagreed population
(35.62%) is below the lower value of the agreed population
(43.31%) which means the factor has a strong influence on
customers’ buying behaviours. In effect, the result indicates
that customers are influenced to buy repeatedly from shops
where the attendants demonstrate emotional concern about
their problems. This kind of attitude boosts customers’
confidence in the shop attendants, and, as a result, the
customers end up feeling satisfied with the services obtained
from them.
Motivating customers
Question: I buy mostly from the shop which offers regular
sales promotion. This is to find out if customers are
influenced to visit shops which offer regular sales
promotion.
Figure 15: The effect of regular sales promotion on
customer’s buying decision
The result of this question shows that 52 (51%) respondents
agree that they prefer buying from shops which offer regular
sales promotion. 30 (29%) out of 102 respondents disagree
with the idea that they are attracted to buy mostly from a
particular shop because it offers regular sales promotion.
The remaining 20 (20%) of the respondents do not know the
effect of regular sales promotion on their buying decisions.
Using the formula P ± Zc*SQRT (P*(1-P)/N), N= 102,
Zc=1.96.
29% of the sample population disagree (P= 29.00%),
therefore between 20.19% and 37.81% of the general
population disagree. 51% of the sample population agree
(P= 51.00%), therefore between 41.30% and 60.70% of the
general population agree.
Comparatively, the upper value of disagreed population
(37.81%) is below the lower value of the agreed population
(44.30%) which means the factor has a strong influence on
customers’ buying behaviours. The result finally implies
customers are influenced to buy repeatedly from a particular
shop which offers regular sales promotion. This, in effect,
shows that customers are price sensitive and also prefer
enjoying instant benefit from their transactions.
Question: I buy mostly from the shop which has the best
rewards for loyal customers. This question is to find out if
customers are influenced to visit shops which give their
loyal customers the best reward packages.
Figure 16: The effect of best rewards on customer’s buying
decision
29% (30/102) of the respondents agree that they prefer
buying from shops which grants the best rewards to loyal
customers. 25 (25%) out of 102 respondents disagree with
the idea that they are attracted to buy mostly from a
particular shop because it offers the best rewards to loyal
customers. Surprisingly as many as 47 (46%) of the
respondents do not know the effect of the best rewards to
customers on their buying decisions.
Using the formula P ± Zc*SQRT (P*(1-P)/N), N= 102,
Zc=1.96.
25% of the sample population disagree (P= 25.00%),
therefore between 16.60% and 33.40% of the general
population disagree. 29% of the sample population agree
(P= 29.00%), between 20.19% and 37.81% of the general
population agree.
Comparatively, the upper value of disagreed population
(33.40%) is above the lower value of the agreed population
(20.19%) and below the upper value (37.81%) which means
the factor has little influence on customers’ buying
behaviours. Based on the result, it shows that customers are
influenced to buy most of the time from the shop which
grants the best rewards to loyal customers. The implication
is that if customers know how much rewards or benefits
granted by a particular shop, then, comparatively, they are
influenced to buy repeatedly from the shop which grants the
best rewards or benefits.
Looking at the grand rate (46%) of respondents which do
not know the effect of this fact, the reason may be due to the
fact that customers do not know how much rewards or
benefits granted to loyal customers by the various shops.
Question: I buy mostly from the shop which granted me
with the first card. This question is to determine if
customers are influenced by the conditions of the customer
cards.
Figure 17: The effect of first customer card on customer’s
buying decision
From the result, 72% (74/102) of the respondents do not
accept the fact that they are influenced to buy repeatedly
from a particular shop because the shop offered them with
their first regular customer cards. Only 14% (14/102) of the
respondents are of the view that they are influenced to buy
mostly from the shop which granted them with their first
customer cards.
The remaining 14% (14/102) of the respondents do not
know the effect of first regular customer card on their
buying decisions.
Using the formula P ± Zc*SQRT (P*(1-P)/N), N= 102,
Zc=1.96.
72% of the sample population disagree (P= 72.00%),
therefore between 63.29% and 80.71% of the general
population disagree. 14% of the sample population agree
(P= 14.00%), therefore between 7.27% and 20.73% of the
general population agree.
Comparatively, the upper value of disagreed population
(80.71%) is far above the upper value of the agreed
population (20.73%) which means the factor has no
influence at all on customers’ buying behaviours. The result
implies customers do not buy from a particular shop because
that shop granted them with their first regular customer
International Journal of Advanced Scientific Technologies in Engineering and Management Sciences (IJASTEMS-ISSN:2454-356X) Volume.1,Issue.1.June2015
Page 24
cards. Moreover, how long a particular card has been with a
customer has no positive effect on the customer’s decision
to buy repeatedly from such shops.
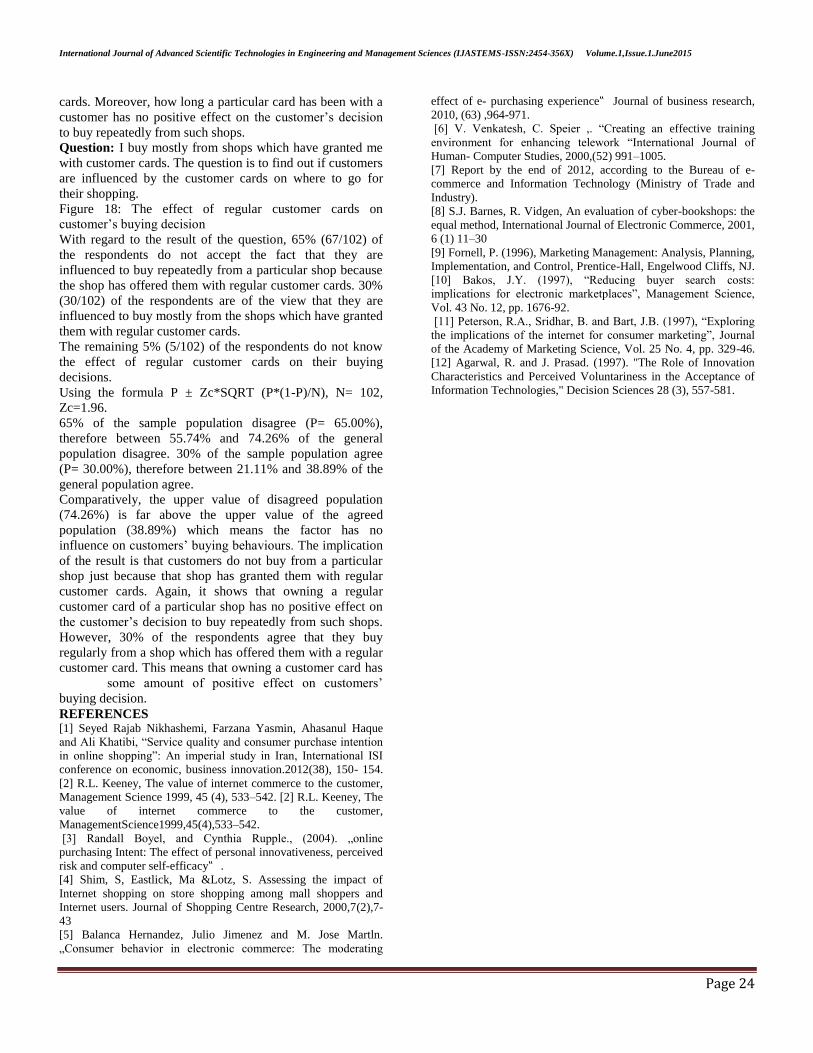
Question: I buy mostly from shops which have granted me
with customer cards. The question is to find out if customers
are influenced by the customer cards on where to go for
their shopping.
Figure 18: The effect of regular customer cards on
customer’s buying decision
With regard to the result of the question, 65% (67/102) of
the respondents do not accept the fact that they are
influenced to buy repeatedly from a particular shop because
the shop has offered them with regular customer cards. 30%
(30/102) of the respondents are of the view that they are
influenced to buy mostly from the shops which have granted
them with regular customer cards.
The remaining 5% (5/102) of the respondents do not know
the effect of regular customer cards on their buying
decisions.
Using the formula P ± Zc*SQRT (P*(1-P)/N), N= 102,
Zc=1.96.
65% of the sample population disagree (P= 65.00%),
therefore between 55.74% and 74.26% of the general
population disagree. 30% of the sample population agree
(P= 30.00%), therefore between 21.11% and 38.89% of the
general population agree.
Comparatively, the upper value of disagreed population
(74.26%) is far above the upper value of the agreed
population (38.89%) which means the factor has no
influence on customers’ buying behaviours. The implication
of the result is that customers do not buy from a particular
shop just because that shop has granted them with regular
customer cards. Again, it shows that owning a regular
customer card of a particular shop has no positive effect on
the customer’s decision to buy repeatedly from such shops.
However, 30% of the respondents agree that they buy
regularly from a shop which has offered them with a regular
customer card. This means that owning a customer card has
some amount of positive effect on customers’
buying decision.
REFERENCES [1] Seyed Rajab Nikhashemi, Farzana Yasmin, Ahasanul Haque
and Ali Khatibi, “Service quality and consumer purchase intention
in online shopping”: An imperial study in Iran, International ISI
conference on economic, business innovation.2012(38), 150- 154.
[2] R.L. Keeney, The value of internet commerce to the customer,
Management Science 1999, 45 (4), 533–542. [2] R.L. Keeney, The
value of internet commerce to the customer,
ManagementScience1999,45(4),533–542.
[3] Randall Boyel, and Cynthia Rupple., (2004). „online
purchasing Intent: The effect of personal innovativeness, perceived
risk and computer self-efficacy‟ .
[4] Shim, S, Eastlick, Ma &Lotz, S. Assessing the impact of
Internet shopping on store shopping among mall shoppers and
Internet users. Journal of Shopping Centre Research, 2000,7(2),7-
43
[5] Balanca Hernandez, Julio Jimenez and M. Jose Martln.
„Consumer behavior in electronic commerce: The moderating
effect of e- purchasing experience‟ Journal of business research,
2010, (63) ,964-971.
[6] V. Venkatesh, C. Speier ,. “Creating an effective training
environment for enhancing telework “International Journal of
Human- Computer Studies, 2000,(52) 991–1005.
[7] Report by the end of 2012, according to the Bureau of e-
commerce and Information Technology (Ministry of Trade and
Industry).
[8] S.J. Barnes, R. Vidgen, An evaluation of cyber-bookshops: the
equal method, International Journal of Electronic Commerce, 2001,
6 (1) 11–30
[9] Fornell, P. (1996), Marketing Management: Analysis, Planning,
Implementation, and Control, Prentice-Hall, Engelwood Cliffs, NJ.
[10] Bakos, J.Y. (1997), “Reducing buyer search costs:
implications for electronic marketplaces”, Management Science,
Vol. 43 No. 12, pp. 1676-92.
[11] Peterson, R.A., Sridhar, B. and Bart, J.B. (1997), “Exploring
the implications of the internet for consumer marketing”, Journal
of the Academy of Marketing Science, Vol. 25 No. 4, pp. 329-46.
[12] Agarwal, R. and J. Prasad. (1997). "The Role of Innovation
Characteristics and Perceived Voluntariness in the Acceptance of
Information Technologies," Decision Sciences 28 (3), 557-581.