Embed Size (px)
Citation preview

FDG PET, which has been used extensively to differentiatepost-treatment change and viable tumor in the brain (13,14),has not been routinely applied to image neoplastic involvementof the spinal cord. Evaluation of the spinal cord with PET is, inpart, limited by scanner spatial resolution, with compromisedsensitivity for the detection ofhypermetabolic lesions smaller insize than approximately 2.5 times the scanner spatial resolution(15, 16). However, current whole-body PET scanners withresolutions of 4—6mm FWHM are well suited to extendingimaging of CNS tumors below the neck.
Since the normal spinal cord is comprised ofa relatively largeamount of axonal white matter, it manifests lower FDG uptakethan cortical brain tissue on PET imaging. The glucose metabolic rate of white matter is approximately one-third to onefourth that of white matter (1 7); therefore, tumor-to-background contrast should be more favorable in the spinal cordthan in cortical brain regions. This has been verified by DiChiro et al. (1 1 ), who reported a glucose metabolic rate of 1.7mg/lOO gm brain tissue/mm for normal spinal cord (comparedto values of6.0—7.0 for midbrain pons area) using a tomograph.Holtoff et al. (9) reported glucose metabolic rates that weremildly lower than those of cerebral gray matter in two cases ofPNET. Tumor-to-white matter ratios in these two cases wereapproximately 1.9 and 1.1. Interestingly, this group reportedglucose metabolic rates of nearly twice that of PNET in thehistologically similar medulloblastoma. In accord with thefindings of Holtoffet al. (9), the spinal cord PNET lesion in ourcase was hypermetabolic relative to the unaffected spinal cordbut similar in FDG uptake to the cerebellum. Prior radiationtherapy to the entire neural axis may have diffusely loweredbaseline FDG uptake in all nontumor CNS tissue, furthercontributing to increased lesion-to-spinal cord contrast.
CONCLUSIONThe most clinically useful role of FDG PET imaging in
patients with CNS neoplasms has been in the diagnosis ofsuspected tumor recurrence. In this setting, CT or MRI may beindeterminant due to anatomical distortion from surgical-,radiation- and/or chemotherapy-induced changes (18). PET has
been effectively used to noninvasively distinguish active tumorfrom post-treatment effects in the brain. This case report illustratesthat, with the recent progress in PET technology, it is now feasibleto use FDG PET in the evaluation of spinal cord neoplasms.
REFERENCESI . Ishikawa M, Kikuchi H, Miyatake 5, Oda Y, Yonekura Y, Nichizawa S. Glucose
consumption in recurrent gliomas. Neurosurgery l993;33:28—33.2. Patronas NJ, Di Chiro G, Kufta C, et al. Prediction of survival in glioma patients by
means of positron emission tomography. J Neurosurg 1985;62:816—822.3. Alavi JB, Alavi A, Chawluk J, et al. Positron emission tomography in patients with
glioma. A predictor of prognosis. Cancer 1988;62:l074—l078.4. Hoffman JM, Lowe Vi, Brown M, Burger P. Hanson MW, Coleman RE. The
prognostic and diagnostic usefulness of FOG-PET in primary brain tumor management[Abstracti. J NucI Med l993;34:37P.
5. Mineura K, Sasajima T, Kowada M, et al. Perfusion and metabolism in predicting the
survival of patients with cerebral gliomas. Cancer 1994;73:2386—2394.6. Rosenfeld 55, Hoffman JM, Coleman RE, Glantz MJ, Hanson MW, Schold SC.
Studies of primary central nervous system lymphoma with fluorine-18-fluorodeoxyglucose positron emission tomography. J Nucl Med I992;33:532—536.
7. Kuwabara Y, lchiya Y, Otsuka M, et al. High ‘8F-FDGuptake in primary cerebrallymphoma: a PET study. J Comput Assist Tomogr l988;12:47—48.
8. Di Chiro G, Hatazawa J, Katz DA, Rizzoli HV, De Michele DJ. Glucose utilization byintracranial meningiomas as an index of tumor aggressivity and probability ofrecurrence: a PET study. Radiologj@l987;164:52l—526.
9. HolthoffVA, Herholz K, Berthold F, et al. In vivo metabolism ofchildhood posteriorfossa tumors and primitive neuroectodermal tumors before and after treatment. Cancer1993;72:1394—403.
10. Griffeth LK, Rich KM. Dehdashti F, et al. Brain metastases from non-central nervoussystem tumors: evaluation with PET. Radiology l993;l86:37—44.
I I. Di Chiro G, OIdfield E, Bairamian D, et al. Metabolic imaging of the brain stem andspinal cord: studies with positron emission tomography using ‘8F-2-deoxyglucoseinnormal and pathological cases. J Comput Assist Tomogr 1983;7:937—945.
12. Sasajima T, Mineura K. Itoh Y, et al. Spinal cord ependymoma: a positron emissiontomographic study with (‘‘C-methyl)-L-methionine.Neuroradiology l996;38:53—55.
13. Doyle WK, Budinger TF, Valk PE, Levin VA, Gutin PH. Differentiation of cerebralradiation necrosis from tumor recurrence by MF-FDG and 82Rb positron emissiontomography. J Comput Assist Tomogr l987;l I :563—570.
14. GIants Mi, Hoffman JM, Coleman RE, et al. Identification of early recurrence ofprimary central nervous system tumors by ‘8F-fluorodeoxyglucosepositron emissiontomography. Ann Neurol 1991;29:347—355.
15. Hoffman El, Huang SC, Phelps ME Quantitation in positron emission CT: I. Effectof object size. J Comput Assist Tomogr 1979:3:299—308.
16. Kessler RM, Ellis JR. Eden M. Analysis of emission tomographic scan data:limitations imposed by resolution and background. J Comput Assist Tomogr l984;8:514—522.
I 7. Mazziotta JC, Phelps ME, Plummer D, Kuhl DE. Quantitation in positron emissiontomography: 5. Physical-anatomical effects. J Comput Assist Tomogr l981;5:734—743.
18. Dooms GC, Hecht 5, Brant-Zawadski M, Berthiaume Y, Norman D, Newton TH.Brain radiation lesions: MR imaging. Radiology l986;158:l49—l55.
Gjedde-Patlak plot to obtain the influx rate constant of the radioligand. Resutts There was selective radk@and binding in thekidneys, mainly located in the cortex. Within the time intervalbetween 95 and 115 mm postinjection, the radioactivity retained inthe kidneys was 109 ±27 and 42 ±4 nCVmVmCiof the injecteddose for the control and inhibition studies, respectively. The influxrate constant of the radioligand decreased from a baseline of0.0298 ±0.0156 to a post-MK-996 value of 0.0098 ±0.0052.Conclusion: These results demonstrate distinct binding of 11C-L-159,884 in the renal cortex with a specificbindingcomponentsuitable for quantitative PET imaging of angiotensin IVAT1receptors.
Antagonists of the angiotensin IIAT1 receptor subtype have beenrecentty introduced for treatment of arterial hypertension and forpharmacological studies of these receptors. The purpose of thiswork was to label such an antagonist with 11C and test theapplicability ofthe radioligand for PET studies. Methods The potentand selective nonpeptide AT, antagonist L-159,884 was labeledwith ‘1C and injected intravenously into six dogs. Renal accumulation and kinetics ofthe radioligand were imaged with PET at baselineand after receptor blockade with 1 mg/kg MK-996. lime-activitycurves were derived from the renal cortex and were analyzed by the
____ KeyWordsPET;kidney;carbon-i1;substitutedbenzoylsuttonReceived Jan. 16, 1997; re@nsionaccepted Oct. 13, 1997. amides; dogs; angiotensin receptorsFor correspondence or reprints contact Zsolt Szabo, MD, PhD, Divisionof Nuclear
Medicine, The Johns Hopkins Medical Institutions, Nelson Buildrig B1-119, 600 North J Nuci Med 1998 [email protected] St. Baltimore, MD 21030.
ANGIOTENSIN Il/AT1 RECEPTORS •Szabo et al. 1209
Investigation of Angiotensin TI/AT1Receptors withCarbon-i 1-L-1 59,884: A Selective AT1 AntagonistZsolt Szabo, Pan Fu Kao, H. Donald Burns, Raymond E. Gibson, Terence G. Hamill, Hayden T. Ravert, Sang Eun Kim,William B. Mathews, John L. Musachio, Ursula Scheffel and Robert F. DannalsDivision ofNuclear Medicine, The Johns Hopkins Medical Institutions, Baltimore, Maryland; and Department ofPharmacology, Merck Research Laboratories, West Point, Pennsylvania
TheAT1angiotensinII(MgII)receptormediatesallknownphysiological effects of Ang II, including regulation of arterialblood pressure, heart rate, aldosterone secretion, renal bloodflow, glomerular filtration, and sodium and water reabsorption(1—3).The renin-angiotensin system, largely by way ofthe AT1receptors, is also implicated in renovascular disease and otherforms of arterial hypertension (4—7).
Despite the importance of the AT1 receptor subtype, there isno direct technique available for its in vivo investigation. Atpresent, these receptors can only be quantitated ex vivo inanimals or postmortem in human tissues. This article reportsdetails of PET studies of AT1 receptors using a I‘C-labeledsubstituted benzoyl sulfonamide, a nonpeptide AT1-selectiveAng II receptor antagonist.
Substituted benzoyl sulfonamides appear more suitable forPET than the clinically used nonpeptide AT, antagonist, losartan; they are more potent, and unlike losartan, they do notrequire metabolic conversion to bind with subnanomolar affinity to AT, receptors (8). The drug MK-996 is a potentnonpeptide AT1-selective antagonist (9) that has been shown toimprove arterial blood pressure in patients with mild-to-moderate essential hypertension (10). In this study, a ‘‘C-labeledmethoxy-substituted analog of MK-996, N-[[4'-[(2-ethyl-5,7-dimethyl-3H-imidazo[4,5-B]pyridin-3-yl)methyl][ 1, 1‘-biphenyl]—2-yl]sulfonyl]-4-methoxybenzamide (L-l59,884), was injected intravenously into dogs, and its accumulation andkinetics in the kidneys were studied. The kidneys were selectedfor imaging because of the abundance and physiological significance of AT1 receptors in this organ.
The time-activity curves derived from the renal cortex wereanalyzed by the Gjedde-Patlak plot. From this graph, the influxrate constant was derived, and the effect of the receptorantagonist MK-996 on radioligand binding was quantified.
MATERIALS AND METhODS
Radiotracer SynthesisThe normethyl precursor L-l62,9l4, obtained from Merck Re
search Laboratories (Rahway, NJ), was labeled by ‘‘Cmethylation(11). The resulting ‘‘C-L-159,884was isolated by reverse phasehigh-performance liquid chromatography (HPLC). The averagesynthesis time was 18 mm from the end of bombardment, and thenondecay-corrected radiochemical yield was 5% at an averagespecific activity of 2980 mCi/@mol. [See Hamill et al. (12) for amore detailed description of this synthesis.]
Animal Pre@onThe experimental protocol was approved by the Animal Care
and Use Committee of the Johns Hopkins Medical Institutions. Sixbeagle dogs, weighing 7.7—14.6kg (1 1.0 ±2.3 kg), were used forthe experiments. The animals fasted for at least 12 hr, given waterad libitum and premedicated with 0.3—0.4ml of acepromazineinjected intramuscularly on the day of the experiment. A 20-gauge2-in. venous catheter was placed into the right frontal leg ulnarvein, through which anesthesia was introduced by injection ofsodium pentobarbital (25—30mgfkg) and was maintained later withadditional pentobarbital at an average dose of 3 mg/kg/hr. Anothercatheter was inserted into the contralateral ulnar vein for radiotracer administration.
Oxygen saturation of circulating blood was measured with apulse oximeter (Nellcor, Hayward, CA) placed on the tongue of theanimal. Circulatory volume was maintained by intravenous infusion of isotonic saline. A 22-gauge cannula was inserted in theanterior tibial or distal femoral artery for continuous pressuremonitoring (Model 90603A, Spacelabs, Medical, Inc., Redmond,WA). Electrocardiogram, heart rate and core temperature were
[email protected]@@-----@---
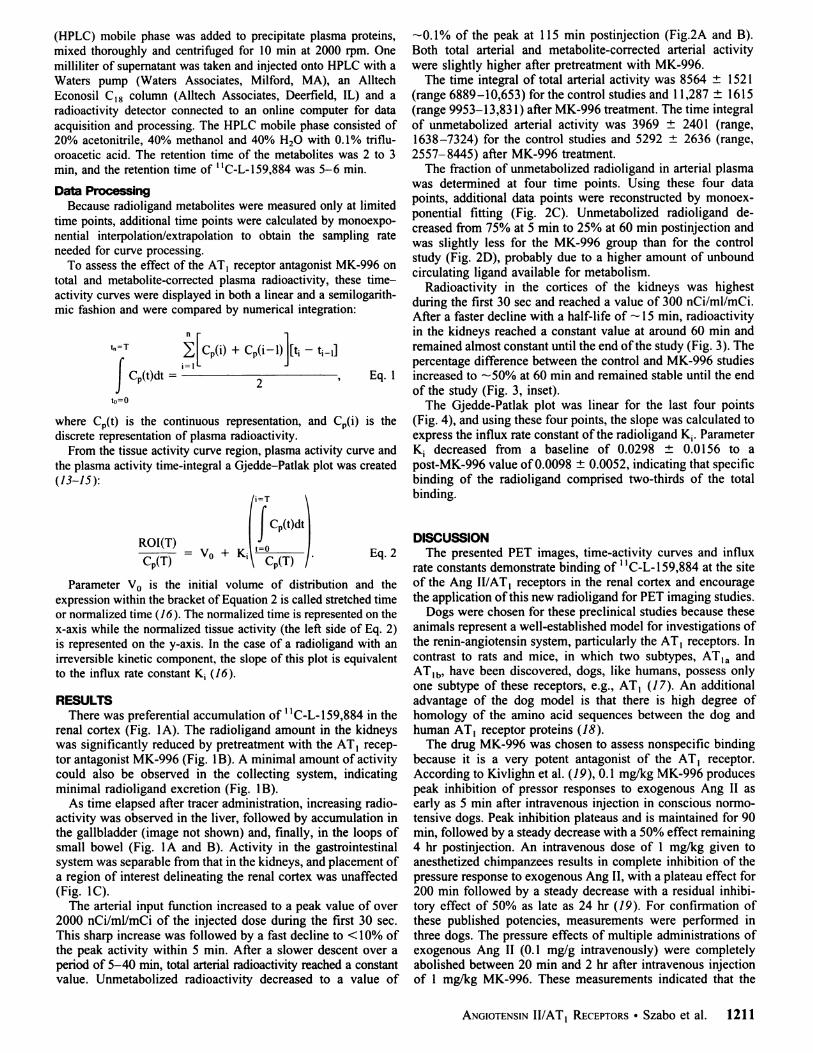
FiGURE1. Images of midabdominalarea of dog obtained 55-115 mmpostinjection“C-L-159,884.(A@Controlstudy. (B)Study after pretreatmentwith 1 mg/kg MK-996.(C)Region of interest used to derive time-actMtycurves fromrenalcortex. Hotspots outs@earea of kidneyare due to traceraccumulationinsmallbowel.LX= leftkidney.
monitored continuously. In particular, the electrocardiogram wasobserved for ST segment changes and arrhythmias.
PET ImagingPET studies were performed with a GE 4096+ (GE Medical
Systems, Milwaukee, WI) PET scanner with an average in-planecross-plane spatial resolution of FWHM = 6 mm. The animalswere positioned with both kidneys included in the field of view ofthe PET scanner. A transmission scan with a 10-mCi 68Ge pinsource was obtained first and was used subsequently for attenuation correction of the PET scans. In each animal, two experimentswere performed, with an interval of 3 hr between the two tracerinjections. At baseline, the dogs received 17 ±4 mCi of ‘‘C-L159,884 injected intravenously as a slow (15-sec) bolus with aspecific activity of 1391 ±563 mCi/@mol. Thirty minutes afterconclusion of PET imaging, MK-996 (1 mg/kg) was injectedintravenously slowly (over a 5-mm interval). Thirty minutespostadministration of the MK-996 blocking dose, a second tracerdose (13 ±7 mCi; specific activity = 1344 ±588 mCi/p.mol) wasadministered, and PET imaging was started again.
Dynamic PET studies were acquired with the following imagesequence: four images of 15-sec duration, three images of I-mmduration, three images of 2-mm duration, three images of 5-mmduration, three images of 10-mm duration and three images of20-mm duration, with a total imaging time of 115 mm. The PETimages were reconstructed by filtered backprojection of the sinograms using a ramp filter only. For display purposes (Fig. 1), theimages were convolved with a 3 X 3 pixel smoothing kernel.
After attenuation correction and decay correction, the PETimages were transferred via ethernet to a personal computersupplied with an Intel Pentium Pro 200-MHz (Intel Corp., SantaClara, CA) processor. Using the Johns Hopkins University program “Imager,―regions of interest were defined over the cortex ofboth kidneys (Fig. lC). An average of the left and right renalcortical activities was used for data analysis. Time-activity curves,expressed in nanocunes per milliliters per millicuries of theinjected dose, were further processed using Microsoft Excel!Windows 95 (Microsoft Corp., Redmond, WA) and Matlab/Windows 95 (The Math Works Inc., Natick, MA).
Arterial Input FunctionTotal plasma radioactivity was measured in blood samples
collected from a femoral artery as quickly as possible during thefirst 2 mm (every 3—10 sec) and at increasing time intervalsthereafter. The plasma activity was corrected for physical decayand expressed as nanocuries per cubic centimeter per millicurie ofthe injected dose. At distinct time points (5, 15, 30 and 60 mmpostinjection), an additional 2 ml of arterial blood were collectedfor determination of metabolites. After centrifugation, 1 ml ofplasma was separated and placed in a test tube. One milliliter of 5%perchloric acid in the high-performance liquid chromatography
1210 THEJOURNALOFNUCLEARMEDICINE•Vol.39•No.7 •July1998
(HPLC) mobile phase was added to precipitate plasma proteins,mixed thoroughly and centrifuged for 10 mm at 2000 rpm. Onemilliliter of supernatant was taken and injected onto HPLC with aWaters pump (Waters Associates, Milford, MA), an AlltechEconosil 18 column (Alltech Associates, Deerfield, IL) and aradioactivity detector connected to an online computer for dataacquisition and processing. The HPLC mobile phase consisted of20% acetonitrile, 40% methanol and 40% H2O with 0.1% trifluoroacetic acid. The retention time of the metabolites was 2 to 3mm, and the retention time of ‘‘C-L-l59,884was 5—6mm.
Data ProcessingBecause radioligand metabolites were measured only at limited
time points, additional time points were calculated by monoexponential interpolation/extrapolation to obtain the sampling rateneeded for curve processing.
To assess the effect of the AT, receptor antagonist MK-996 ontotal and metabolite-corrected plasma radioactivity, these timeactivity curves were displayed in both a linear and a semiloganthmic fashion and were compared by numerical integration:
t,=T ±[C@m + C@(Hl)][ti __1C@(t)dt= 2t0=0
where C@(t) is the continuous representation, and C@(i) is thediscrete representation of plasma radioactivity.
From the tissue activity curve region, plasma activity curve andthe plasma activity time-integral a Gjedde—Patlakplot was created(13—15):
JCp(t)dtROI(T) =C@(T) = V0 + K,@ @@(T)
Parameter V0 is the initial volume of distribution and theexpression within the bracket of Equation 2 is called stretched timeor normalized time (16). The normalized time is represented on thex-axis while the normalized tissue activity (the left side of Eq. 2)is represented on the y-axis. In the case of a radioligand with anirreversible kinetic component, the slope of this plot is equivalentto the influx rate constant K1(16).
RESULTSThere was preferential accumulation of ‘1C-L-159,884 in the
renal cortex (Fig. IA). The radioligand amount in the kidneyswas significantly reduced by pretreatment with the AT, receptor antagonist MK-996 (Fig. 1B). A minimal amount of activitycould also be observed in the collecting system, indicatingminimal radioligand excretion (Fig. lB).
As time elapsed after tracer administration, increasing radioactivity was observed in the liver, followed by accumulation inthe gallbladder (image not shown) and, finally, in the loops ofsmall bowel (Fig. lA and B). Activity in the gastrointestinalsystem was separable from that in the kidneys, and placement ofa region of interest delineating the renal cortex was unaffected(Fig. 1C).
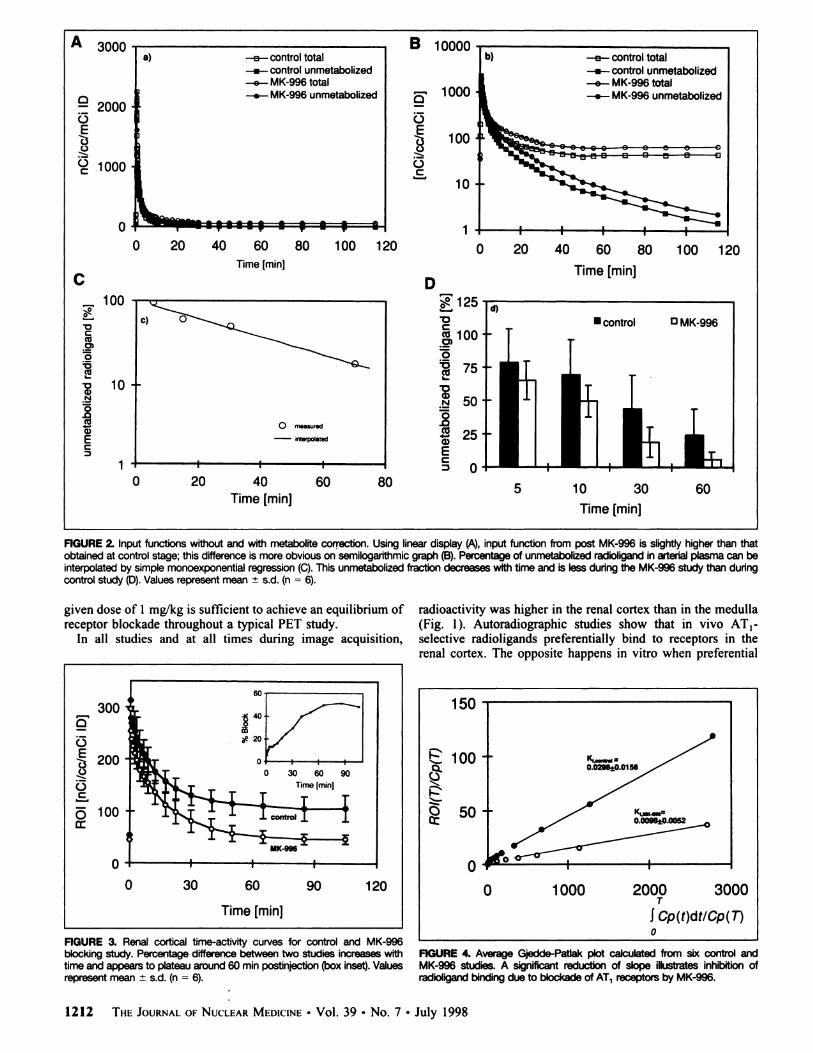
The arterial input function increased to a peak value of over2000 nCi/ml/mCi of the injected dose during the first 30 sec.This sharp increase was followed by a fast decline to < 10% ofthe peak activity within 5 mm. After a slower descent over aperiod of 5—40mm, total arterial radioactivity reached a constantvalue. Unmetabolized radioactivity decreased to a value of
—0.1% of the peak at 115 mm postinjection (Fig.2A and B).Both total arterial and metabolite-corrected arterial activitywere slightly higher after pretreatment with MK-996.
The time integral of total arterial activity was 8564 ±1521(range 6889—10,653) for the control studies and 11,287 ±1615(range 9953—13,83 1) after MK-996 treatment. The time integralof unmetabolized arterial activity was 3969 ±2401 (range,1638—7324) for the control studies and 5292 ±2636 (range,2557—8445)after MK-996 treatment.
The fraction of unmetabolized radioligand in arterial plasmawas determined at four time points. Using these four datapoints, additional data points were reconstructed by monoexponential fitting (Fig. 2C). Unmetabolized radioligand decreased from 75% at 5 mm to 25% at 60 mm postinjection andwas slightly less for the MK-996 group than for the controlstudy (Fig. 2D), probably due to a higher amount of unboundcirculating ligand available for metabolism.
Radioactivity in the cortices of the kidneys was highestduring the first 30 sec and reached a value of 300 nCi/ml/mCi.After a faster decline with a half-life of -‘@15 mm, radioactivityin the kidneys reached a constant value at around 60 mm andremained almost constant until the end ofthe study (Fig. 3). Thepercentage difference between the control and MK-996 studies
Eq. 1 increased to —50%at 60 mm and remained stable until the endof the study (Fig. 3, inset).
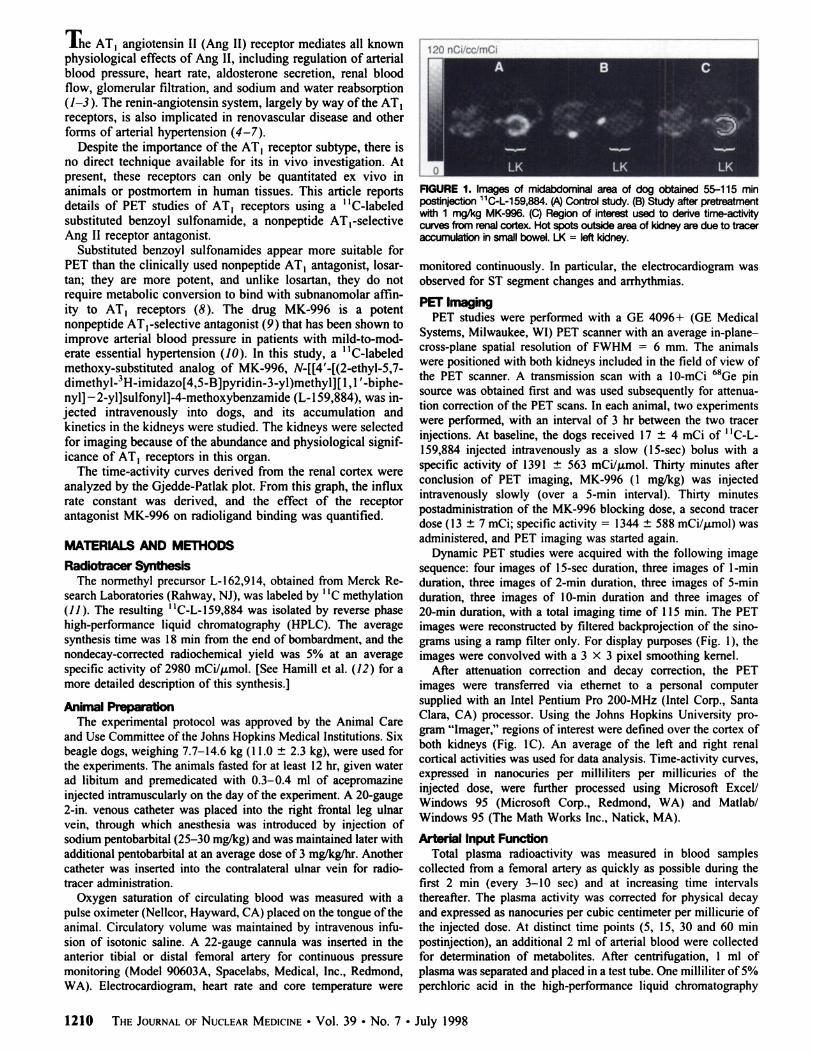
The Gjedde-Patlak plot was linear for the last four points(Fig. 4), and using these four points, the slope was calculated toexpress the influx rate constant ofthe radioligand K1. ParameterK1 decreased from a baseline of 0.0298 ± 0.0156 to apost-MK-996 value of0.0098 ±0.0052, indicating that specificbinding of the radioligand comprised two-thirds of the totalbinding.
DISCUSSIONEq. 2 The presented PET images, time-activity curves and influx
rate constants demonstrate binding of ‘‘C-L-l59,884 at the siteof the Ang Il/AT, receptors in the renal cortex and encouragethe application ofthis new radioligand for PET imaging studies.
Dogs were chosen for these preclinical studies because theseanimals represent a well-established model for investigations ofthe renin-angiotensin system, particularly the AT, receptors. Incontrast to rats and mice, in which two subtypes, AT1a andAT,,,, have been discovered, dogs, like humans, possess onlyone subtype of these receptors, e.g., AT, (1 7). An additionaladvantage of the dog model is that there is high degree ofhomology of the amino acid sequences between the dog andhuman AT, receptor proteins (18).
The drug MK-996 was chosen to assess nonspecific bindingbecause it is a very potent antagonist of the AT1 receptor.According to Kivlighn et al. (19), 0. 1 mg/kg MK-996 producespeak inhibition of pressor responses to exogenous Ang II asearly as 5 mm after intravenous injection in conscious normotensive dogs. Peak inhibition plateaus and is maintained for 90mm, followed by a steady decrease with a 50% effect remaining4 hr postinjection. An intravenous dose of 1 mg/kg given toanesthetized chimpanzees results in complete inhibition of thepressure response to exogenous Ang II, with a plateau effect for200 mm followed by a steady decrease with a residual inhibitory effect of 50% as late as 24 hr (19). For confirmation ofthese published potencies, measurements were performed inthree dogs. The pressure effects of multiple administrations ofexogenous Ang II (0. 1 mg/g intravenously) were completelyabolished between 20 mm and 2 hr after intravenous injectionof 1 mg/kg MK-996. These measurements indicated that the
ANGIOTENSIN Il/AT, RECEPTORS •Szabo et al. 1211
a) —a.—control total-_.-— control unmetabolized
—0-- MK-996 total
—..— MK-996 unmetabolized
@L@@111111,1@@ •
A 3000 B ioooo
6' 1000@2000
o 0@3 .@ 100E
.@
@1000 oC
10
0 1
0 20 40 60 80 100 120 0 20 40 60 80 100 120
Time[mm] Time [mm]C D
100 .. @‘125@: @0@0 @100C
c@ 0),@) =0.5.@ @75
i@10@. i@50:@ :@E : 25C E
@ C1• I@ I I@ 0
0 20 40 60 80Time [mm]
—0--' control total
—.-- control unmetabolized
—9-- MK-996 total
—.-- MK-996 unmetabolized
0 measured— interpolated
5 10 30 60
FIGURE2. Inputfunctionswithoutand with metabolitecorrection.Using lineardisplay (A),input functionfrom post MK-996is slightlyhigherthan thatobtained at controlstage; this differenceis more obviouson semilogarithmicgraph (B).Percentage of unmetabolizedradlOllgandinaterial plasma can beinterpolatedby simplemonoexponentialregression(C).Thisunmetabolizedfractiondecreases withtime and vsless dunng the MK-996study than dunngcontrolstudy (D).Valuesrepresent mean ±s.d. (n = 6).
given dose of 1 mg/kg is sufficient to achieve an equilibrium ofreceptor blockade throughout a typical PET study.
In all studies and at all times during image acquisition,
FIGURE3. Renal cortical time-activitycurves for control and MK-996biockingstudy. Percentage differencebetween two StUd@Sincreases withtimeand appears to i@ateauaround 60 mmpostinjection(boxinset).Valuesrepresent mean ±s.d. (n = 6).
radioactivity was higher in the renal cortex than in the medulla(Fig. 1). Autoradiographic studies show that in vivo AT,-selective radioligands preferentially bind to receptors in therenal cortex. The opposite happens in vitro when preferential
FIGURE 4. Average Gjedde-Patlak plot Calculated from six control andMK-996studies. A significantreduction of slope ilkistrates inhibitionofrad@and bindingdue to biockade of AT1receptors by MK-996.
150
R@ ioo
@50
0
300
0.g200,@0C
o 100
0
0 30 60 90 120 0 1000 2000 3000T
SCp(t)dt/Cp(T)Time [mm]0
1212 THEJOURNALOFNUCLEARMEDICINEâ€Vol.39•No.7 •July1998
Time [mm]
binding of these ligands to the renal medulla is observed (20).Possible explanations for this difference in binding are:
1. Lower blood flow to the medulla than to the cortex;2. Occupancy of the medullary receptors in vivo by endog
enous Ang II; or3. Higher Ang Il-mediated receptor internalization in the
medulla.
Possible limitations of the radioligand include excretionthrough the kidneys and liver. Excretion through the kidneyswas minimal during the experiments (Fig. 1); however, furtherinvestigation of pharmacologically active or inactive@ ‘C-labeled metabolites in the kidneys is warranted. Although theradioligand enters the bowel lumen by way of hepatobiliaryexcretion, an appropriate separation of these structures and therenal cortical regions of interest (under exclusion of gastrointestinal activity) is possible (Fig. 1C).
Consistent with the differences in the arterial time-activitycurves, both total and unmetabolized radioactivity time integrals were lower for the control studies than for the blockingstudies with MK-996. The time integral represents the availability of the radioligand throughout the entire course of thestudy. The differences between the arterial input functionsclearly indicate that reduced binding of the radioligand afterMK-996 was attributable not to reduced radioligand deliverybut to reduced accumulation at specific binding sites.
Time-activity curves in the cortices of the kidneys demonstrated a prominent peak followed by fast and then slowwashout. The early peak corresponds to first-pass distribution ofthe radioligand within the vasculature of the kidney. Thefollowing washout component is probably related to the distribution of the radioligand within a virtual compartment thatcorresponds to nonspecific binding sites, whereas the slowestcomponent with an almost steady level of radioactivity andbinding inhibition after 60 mm is related to specific binding.Therefore, the images obtained at 60 mm and later can be usedfor receptor imaging. Blocking effects of the AT, antagonistMK-996 were strongest during this later period. The relativelylow binding inhibition of 50% seen in the time-activity curvesis the result of a larger amount of radioligand available due toblockade of the receptors in the entire body. Inhibition is higherwhen parameter K is used for quantification, e.g., 66%. TheGjedde-Patlak plot is a simplified way of quantifying radioligand uptake and binding. This technique is applied for kineticanalysis of radioligands with a component of irreversiblebinding and largely eliminates the effect of the input function.Thus, if one excludes the effect of higher ligand availabilityafter receptor blockade, at least two-thirds of renal corticalradioactivity is due to specific binding to the AT, receptors.
CONCLUSIONThe presented data demonstrate that PET imaging ofthe renal
cortical AT, receptors is feasible with ‘‘C-L-159,884. The
quality of the images is good, and the time-activity curvesillustrate the blocking effect of the AT, receptor antagonistMK-996 on radioligand binding. Based on the influx rateconstant K, at least two-thirds of the radioactivity correspondsto specific binding, which makes this radioligand suitable forquantitative studies of the AT, receptors.
ACKNOWLEDGMENTSWe appreciate Robert Smoot, CNMT, for his assistance with the
radiochemical synthesis and David Clough, CNMT, for organization and performance of the PET studies. We thank Paige Finleyfor her excellent help in the dog studies. This work was in partsupported by NIH Grant No. DK5O183.
REFERENCESI . Bernstein KE, Alexander RW. Counterpoint: molecular analysis of the angiotensin II
receptor. Endocr Rev 1992;l3:381—386.2. Griendling KK, Murphy TJ, Alexander RW. Molecular biology of the renin
angiotensin system. Circulation I993;87: I816—1828.3. Gibson RE, Thorpe HH, Cartwright ME, et al. Angiotensin II receptor subtypes in
renal cortex ofrats and rhesus monkeys. Am J Phvsiol 199l:261:F512—F518.4. Wood AJJ. Angiotensin receptors and their antagonists. NEnglJMed 1996:334:1649—
1654.5. Ferrario CM. The renin-angiotensin system: importance in physiology and pathology.
J Cardiovasc Pharmacol I990;15(suppl 3):51—S5.6. Caulfield M, Lavender P. Farrall M, et al. Linkage of the angiotensinogen gene to
essential hypertension. N EngI J Med 1994:330:1629—1633.7. Admiraal PJ, Danser AH, Jong MS. Pieterman H. Derkx FH, Schalekamp MA.
Regional angiotensin II production in essential hypertension and renal artery stenosis.Hypertension 1993;2 I:I73—184.
8. Chang RSL, Bendesky Ri, Chen TS, et al. In vitro pharmacology of MK-996, a new
potent and selective angiotensin II (AT1) receptor antagonist. Drug Dev Res I994:32:161—171.
9. Chakravaiiy PK, Naylor EM, Chen A, et al. A highly potent. orally active imidazo[4,5-b]pyridine biphenyl acylsulfonamide (MK-996;L-159,282): a new All-selectiveangiotensin II receptor antagonist. J Med Chem 1994:37:4068—4072.
10. Lappe JT, Toh J, Soffer BA, Goldberg Al, Sweet CS. Efficacy and tolerability ofmultiple doses of MK-996, an angiotensin II (All) receptor antagonist. compared toenalapril and to placebo in mild to moderate hypertensive patients [Abstracti. Am JJ-i.vpertens 1995;8:l8OA.
1 1. Dannals RF, Ravert HI, Frost JJ, Wilson AA, Bums HD, Wagner HN Jr. Radiosyn
thesis of an opiate receptor binding radiotracer: [‘‘C]carfentanil. list J Appl Radiat Isotl985;36:303—306.
12. Hamill TG, Burns HD, Dannals RF, et al. Development of [â€CIL-l59,884: a
radiolabeled, nonpeptide angiotensin II antagonist that is useful for angiotensin II, AT,receptor imaging. Appl Radiat Isot 1996:47:211—218.
13. Gjedde A. Calculation of glucose phosphorylation from brain uptake of glucoseanalogs in vivo: a re-examination. Brain Res l982;4:237—274.
14. Patlak CS, Blasberg RG, Fenstermacher JD. Graphical evaluation of blood-to-braintransfer constants from multiple-time uptake data. J Cereb Blood Flow Metab1983;3: 1—7.
I5. Patlak Cs, Blasberg RG. Graphical evaluation of blood-to-brain transfer constantsfrom multiple-time uptake data. Generalizations. J Cereb Blood Flow Metab 1985:5:584—590.
16. Carson RE. Mathematical modeling and compartmental analysis. In: Harbert JC.Eckelman WC, Neumann RD. eds. Nuclear medicine diagnosis and therapy. NewYork:Thieme;1996:167—193.
17. Kim SE, Scheffel U, Szabo Z, et al. In vivo labeling ofangiotensin II receptors witha carbon-I 1 labeled selective nonpeptide antagonist. J NucI Med 1996:37:307—311.
18. Burns L, Clark KL, Bradley J, Robertson Mi, Clark AJL. Molecular cloning of thecanine angiotensin II receptor—anAT,-like receptor with reduced affinity for DuP753.FEBS Lettl994;343:I46—150.
19. Kivlighn SD, Zingaro GJ, Gabel RA. et al. In vivo pharmacology of a novel AT,selective angiotensin II receptor antagonist, MK-996. An, J l-lvpertens 1995;8:58—66.
20. Zhuo J, Alcom D, McCausland J, Casley D, Mendelsohn FAO. In vivo occupancy ofangiotensin II subtype 1 receptors in rat renal medullary interstitial cells. Hypertension1994:23:838-843.
ANGIOTENSIN LI/AT, RECEPTORS †Szabo Ct al. 1213


![O'7lU'li':l'nnOil tJ.oW7jil h'::t (I?'li'!l::t)i1'P1VilmlVi … ספח...O'7lU'li':l'nnOil tJ.oW7jil h'::t (I?'li'!l::t)i1'P1VilmlVi 'J'OlUiilemil 11446-08-]4 Y''''il:l inlt!r'~"'e](https://img.pdfslide.net/doc/110x75/5fc35c72e2426d53480792e8/o7lulilnnoil-tjow7jil-ht-ililti1p1vilmlvi-o7lulilnnoil.jpg)


![1'U ':i1 OU n - RIDwater.rid.go.th/hydhome/ma/60/6378.pdf · ~ 1'U ':i1 OU n 1 ':i .. rlJJ10V1~~1~~JD~\Jtl.tl .~ __ ~l]JJYl~J~ ~:y\)_~-~~kk~_ ;; ... ... ~. ~~ft. o~l~b~~~~Q __ ___](https://img.pdfslide.net/doc/110x75/5acc0b367f8b9a63398c6da2/1u-i1-ou-n-1u-i1-ou-n-1-i-rljj10v11jdjtltl-ljjylj.jpg)


![(l~lt1lJl~~l'I!'] ':I ':I - ayud.co.th · mmrWl'l.n~~i1'lfl1':ifll n'j::l1'!-l'\'I'nUi'lltl L](https://img.pdfslide.net/doc/110x75/5d67562888c99389108bbf6c/llt1ljlli-i-i-ayudcoth-mmrwllni1lfl1ifll-njl1-linuilltl.jpg)