Embed Size (px)
Citation preview
Loughborough UniversityInstitutional Repository
Investigations of the role ofcolloids in radionuclide
migration
This item was submitted to Loughborough University's Institutional Repositoryby the/an author.
Additional Information:
• A Doctoral Thesis. Submitted in partial fulfilment of the requirementsfor the award of Doctor of Philosophy of Loughborough University.
Metadata Record: https://dspace.lboro.ac.uk/2134/9134
Publisher: c© Silvia Anton Gascon
Please cite the published version.

This item was submitted to Loughborough’s Institutional Repository (https://dspace.lboro.ac.uk/) by the author and is made available under the
following Creative Commons Licence conditions.
For the full text of this licence, please go to: http://creativecommons.org/licenses/by-nc-nd/2.5/
Thesis
Investigations Of The Role Of Colloids In
Radionuclide Migration
By Silvia Antón Gascón
SUBMITTED IN PARTIAL FULFILMENT OF THE
REQUIREMENTS FOR THE
AWARD OF
DOCTOR OF PHILOSOPHY
Loughborough University
September 2011
Research Supervisor Professor Peter Warwick
Abstract Page 2 of 214
ABSTRACT
Intermediate and low level radioactive waste is planned to be disposed of in deep
underground repositories where the waste packages will be surrounded by layers of
engineered and geological barriers. In the event of leakage and mobilisation of
radionuclides from the canisters, radionuclides may be transported by groundwaters
into the Geosphere, where radionuclide mobility may be retarded by sorption to the
geological host rock. However, colloidal particles, which provide large surface area
per mass, may potentially enhance the transport of radionuclides.
The mobility of radionuclides through the Geosphere depends greatly on the sorption
and desorption of radionuclides with the host rock. However, the presence of
colloidal particles may influence the transport of radionuclides. Given a stable and
mobile colloidal suspension which sorbs radionuclides onto its surface in a reversible
manner, the radionuclide may be transported along with the colloidal suspension.
The work presented in this thesis aims to contribute to understanding the role of
inorganic colloids in contaminant transport through the Geosphere.
Colloids are small and metastable particles which can be transported long distances
with groundwater. This mobility is determined mainly by the stability of colloids, as
unstable colloids tend to coagulate, thus reducing significantly colloidal transport.
Stable colloids present in groundwater may sorb radionuclides onto them. Given an
irreversible interaction, where a strong sorption is followed by a weak or no
desorption, radionuclides may be transported until the colloids flocculate, becoming
immobilised. On the contrary, a reversible interaction, where a weak sorption is
followed by desorption, may lead to a scenario where the radionuclide is
immobilised by sorption to the host rock.
Given the importance of the reversibility of the sorption of radionuclides to inorganic
colloids on the fate of contaminant transport through the Geosphere, the interactions
of three metals (Cs+, Ni2+ and Eu3+) with boehmite and montmorillonite colloids has
been investigated by means of sorption and desorption batch experiments.
Abstract Page 3 of 214
Data on the sorption of metals onto colloids (and solid surfaces) is generally
expressed in terms of distribution ratio, Rd. The results showed that the Rd, and
hence, the sorption, generally increased with the ionic charge of the metal. The Rd
value, however, depends on the specific experimental conditions of the experiment,
making comparison with existing literature difficult. Moreover, in the case of
sorption onto colloidal particles, the distribution ratio also depends strongly on the
size distribution of the colloids, as the surface provided by colloids for sorption may
vary with the size of the colloids.
The number of investigations carried out in the literature on contaminant sorption
onto solid surfaces is much greater than those carried out on colloidal surfaces. As a
result, the data available on distribution ratios for metal sorption onto solid surfaces
is greater than that available onto colloidal surfaces. Assuming that the main
difference between a solid surface and a colloidal surface is the difference in surface
area, one could assume that the distribution ratios of a metal on a colloid and a solid
are related by the specific surface area. An attempt was made to test a mathematical
model whereby the Rd values were related by the ionic charge of the metal and the
specific surface areas of boehmite colloidal and solid particles. Other surface
properties, like proton exchange capacity, were tested for the same model.
Desorption experiments help understand the extent of the reversibility of the
sorption. The sorption of metals onto both boehmite and montmorillonite was found
to be reversible, except in the case of Eu3+ sorption onto montmorillonite, which
desorbed from the colloids in an amount less than a 5% of that which would be
expected for a reversible system.
Organic colloids, such as humic acids, are present in natural groundwaters. Although
their structure is not yet clear, the large number of functional groups make humic
acids organic complexing ligands which may influence the interaction of metals with
inorganic colloids or surfaces, and may, therefore, influence the mobility of
radionuclides through the Geosphere. In this work, the influence of humic acid on the
sorption of Cs+, Ni2+ and Eu3+ on boehmite colloids was studied, observing a
decrease in the sorption of metals onto the colloids. The interaction of humic acids
Abstract Page 4 of 214
with boehmite colloids was also assessed, as the net negative charge of humic acids
tended to neutralise the net positive charge of boehmite colloids and thus led to the
flocculation of the colloids.
Ternary systems, constituted by metals, solid surfaces and humic acids has been
generally modelled with the linear additive model. Its applicability on colloids has
not been tested as much as on solid surfaces, but generally, a slight modification has
been needed for success. In this work, the linear additive model was tested on the
experimental results.
The transport of radionuclides associated to inorganic colloids has been assessed by
means of column experiments. A radiometric technique consisting of radiolabelling
inorganic silica colloids with 152Eu spike was used to detect and quantify the
migration of silica colloids through a sand column. Furthermore, the same method
was used to investigate the migration of 137Cs associated to silica colloids through a
sand column. The mobility of the radionuclide through the sand column was found to
be enhanced by the silica colloids.
Overall, the investigations carried out in this thesis demonstrate that inorganic
colloids may influence the mobility of radionuclides in the Geosphere by enhancing
their transport and should thus be considered in the performance assessments of deep
underground repositories.
Acknowledgements Page 5 of 214
Acknowledgements
Fistly, I would like to acknowledge my supervisor, Prof. Peter Warwick for giving
me the chance to initiate my career into research. I would like to thank him for all his
support, encouragement, guidance and all his efforts to make this PhD possible.
I would like to thank Feralco Ltd. (UK) and Nabaltech (Germany) for kindly
providing the boehmite used in this work. I would like to thank Dr. Sneh Jain for
taking the time and dedication to carry out the SEM and SSA measurements at BGS.
During my three years, the help of Mrs. Linda Sands, both professionally and
personally, has been extraodinary, thank you for your words of wisdom and comfort,
and for all your encouragement and support. All my collegues in the lab have made
my time so enjoyable, thank you to Anumaija for her friendship, to Ricky for putting
up with our “friday afternoon” music, to Larry, Adam and Ebong for making me
laugh so many times, to Amy, Kirsty and Katie for all our moments in (and outside)
the lab, and also thank you to Sneh for our long conversations in the “micro-lab” and
to Mónica for all your efforts and time on my project. Thanks to Sneh for being my
post-doc; your experience has been very helpful in the past two years.
Thank you to my dear “spanish crew”, Jesús, Arancha, Adela and Noelia, for making
my arrival in Loughborough so easy. You made my week-ends and lunches some of
the best moments, and thank you for your friendship, which will last for very long.
To my french housemates, Eric and Julien, thanks for welcoming into Loughborough
and for your friendship, thanks for being my mates and for being so involved in my
personal adventure in this town.
About a year after I started this PhD, new friends appeared, Anumaija, who arrived
from Finland by train, Jasón, who flew from Barcelona and perhaps had too many
cheeseburgers in his first week of PhD, and Hayley, who was my housemate for over
a year and with whom I hosted very good parties.

Acknowledgements Page 6 of 214
In the completion of this thesis, I would like to thank the help Mónica and Sneh for
proof-reading, and to Sneh for the SEM and SSA measurements. A special mention
to my uncle, Vicente. Thank you for all your interest shown during the years of
experimental work. But most importantly, your support, interest, excitement and joy
have been my main encouragement and reference to keep going. Your trust and
confidence on this project and on me helped me believe in it.
I would like to thank my mother, Pilar, for all her support during the whole time I
was in Loughborough. Thank you for listening to me in the rough times, thank you
for sharing with me the good moments, thank you because your love and your
confidence helped me hang on. Thank you for being strong for me when I was
lacking strength.
To Iván, my love, thank you for being next to me all the way, thank you for not
letting the distance be an inconvenience, thank you for spending your free time with
me and for sharing part of my time in Loughborough. Thank you for your support
and for believing in me, I know it has been hard some times, thank you for being
there all along.
I would like to thank my collegues, Elena, Mar and Rosa for their friendship, as well
as for the interest shown in the progress of this thesis.
Finally, I would like to dedicate this thesis to those in my family who unfortunately
are no longer here to see it accomplished.
Table of Contents Page 7 of 214
Table of Contents
ABSTRACT................................................................................................................. 2
Acknowledgements...................................................................................................... 5
Table of Contents......................................................................................................... 7
Table of Figures ......................................................................................................... 11
List of tables............................................................................................................... 16
List of abbreviations .................................................................................................. 19
ORGANISATION OF THIS REPORT..................................................................... 20
Chapter 1. INTRODUCTION.................................................................................... 21
1.1. Basics of colloid chemistry................................................................................. 21
1.1.1. Definition and stability of colloids .............................................................. 21
1.1.2. Types of Colloids......................................................................................... 22
1.1.2.1. Biocolloids ............................................................................................ 23
1.1.2.2. Organic substances ............................................................................... 23
1.2. Migration of colloids .......................................................................................... 25
1.2.1. Release of colloids ....................................................................................... 25
1.2.2. Transport of colloids.................................................................................... 26
1.2.3. Retention of colloids.................................................................................... 26
1.3. Colloid-facilitated transport of contaminants ..................................................... 27
1.4. Modelling............................................................................................................ 29
1.4.1. Modelling solute transport ........................................................................... 29
1.4.2. Inclusion of colloids in modelling solute transport ..................................... 30
1.4.3. Modelling contaminant sorption to colloids ................................................ 31
Chapter 2. COLLOID BINARY SYSTEMS............................................................. 32
2.1. Introduction......................................................................................................... 32
2.2. Experimental....................................................................................................... 33
2.2.1. Method development ................................................................................... 34
2.2.1.1. Materials used ....................................................................................... 34
2.2.1.1.1. Boehmite........................................................................................ 34
2.2.1.1.2. Montmorillonite ............................................................................. 35
2.2.1.1.3. Metal solutions............................................................................... 36
2.2.1.2. Preparation for measurements .............................................................. 37
Table of Contents Page 8 of 214
2.2.1.3. Speciation.............................................................................................. 38
2.2.1.4. Data processing..................................................................................... 38
2.2.1.4.1. Distribution ratio............................................................................ 39
2.2.1.4.2. Freundlich isotherm ....................................................................... 40
2.2.1.4.3. Langmuir isotherm......................................................................... 40
2.2.1.4.4. D-R isotherm.................................................................................. 41
2.2.1.4.5. Statistics ......................................................................................... 41
2.2.2. Generation and stability of colloids ............................................................. 42
2.2.2.1. Boehmite............................................................................................... 42
2.2.2.2. Montmorillonite.................................................................................... 43
2.2.3. Sorption and desorption experiments .......................................................... 43
2.2.3.1. Sorption experiments ............................................................................ 43
2.2.3.2. Desorption experiments ........................................................................ 45
2.2.4. Surface area measurements.......................................................................... 45
2.2.4.1. Specific surface area ............................................................................. 45
2.2.4.2. Exchange capacity measurements ........................................................ 47
2.2.4.2.1. Proton exchange capacity .............................................................. 47
2.2.4.2.2. Cation exchange capacity .............................................................. 48
2.2.4.2.3. SEM and XRD powder diffraction ................................................ 49
2.3. Results................................................................................................................. 49
2.3.1. Characterisation and stability of colloids.....................................................50
2.3.1.1. Boehmite............................................................................................... 50
2.3.1.2. Montmorillonite.................................................................................... 54
2.3.2. Sorption and desorption experiments .......................................................... 58
2.3.2.1. Sorption experiments ............................................................................ 58
2.3.2.1.1. Speciation....................................................................................... 58
2.3.2.1.2. Control experiments....................................................................... 61
2.3.2.1.3. Sorption of metals onto boehmite colloids .................................... 62
2.3.2.1.4. Sorption on solid boehmite ............................................................ 72
2.3.2.1.5. Sorption onto montmorillonite colloids......................................... 76
2.3.2.1.6. Sorption on solid montmorillonite................................................. 80
2.3.2.2. Desorption experiments ........................................................................ 86
2.3.2.2.1. Desorption from boehmite colloids ............................................... 87
2.3.2.2.2. Desorption from solid boehmite .................................................... 91
Table of Contents Page 9 of 214
2.3.2.2.3. Desorption from montmorillonite colloids.................................... 94
2.3.2.2.4. Desorption from solid montmorillonite ......................................... 96
2.3.3. Surface area of boehmite ............................................................................. 99
2.3.3.1. Surface imaging .................................................................................. 102
2.4. Discussions ....................................................................................................... 110
2.4.1. Metals and Boehmite ................................................................................. 110
2.4.2. Metals and Montmorillonite ...................................................................... 112
2.4.3. Solid to liquid ratio .................................................................................... 115
2.4.4. Sorption onto solid vs colloid .................................................................... 116
2.5. Conclusions....................................................................................................... 118
Chapter 3. COLLOID HUMATE TERNARY SYSTEMS ..................................... 121
3.1. Introduction....................................................................................................... 121
3.1.1. Linear additive model ................................................................................ 122
3.2. Experimental..................................................................................................... 124
3.2.1. Preparation of reagents .............................................................................. 124
3.2.2. Preparation for measurement ..................................................................... 125
3.2.3. Stability of HA........................................................................................... 126
3.2.4. Stability of colloids in the presence of HA................................................ 126
3.2.5. Sorption of HA to boehmite....................................................................... 127
3.2.6. Sorption of metals to boehmite in the presence of HA.............................. 127
3.3. Results and discussions..................................................................................... 129
3.3.1. Calibration curve of HA ............................................................................ 129
3.3.2. Stability of HA........................................................................................... 130
3.3.3. Stability of humate-boehmite suspensions ................................................ 132
3.3.4. Sorption of HA to boehmite....................................................................... 136
3.3.5. Sorption of metals onto boehmite in the presence of HA.......................... 138
3.3.5.1. Sorption of Cs ..................................................................................... 138
3.3.5.2. Sorption of Ni ..................................................................................... 139
3.3.5.3. Sorption of Eu..................................................................................... 141
3.3.5.4. Discussions ......................................................................................... 141
3.3.6. Surface imaging of boehmite colloids ....................................................... 143
3.3.7. Modelling................................................................................................... 145
3.3.7.1. Linear Additive Model........................................................................145
3.3.7.2. Langmuir, Freundlich and D-R modelling ......................................... 153
Table of Contents Page 10 of 214
3.4. Conclusions....................................................................................................... 159
Chapter 4. MOBILITY OF COLLOIDS AND COLLOID-FACILITATED
TRANSPORT .......................................................................................................... 161
4.1. Introduction....................................................................................................... 161
4.2. Experimental..................................................................................................... 162
4.2.1. Method development ................................................................................. 162
2.1.1. Materials used ........................................................................................ 162
4.2.1.2. Preparation for measurements ............................................................ 162
4.2.2. Synthesis and stability of radiolabelled silica colloids .............................. 163
4.2.2.1. Synthesis of silica colloids.................................................................. 163
4.2.2.2. Synthesis of Eu-doped silica colloids ................................................. 163
4.2.2.3. Characterisation and stability of Eu-doped silica colloids.................. 164
4.2.3. Migration experiments............................................................................... 164
4.2.3.1. Migration of Eu-doped silica colloids through sand column.............. 164
4.2.3.2. Migration of Cs associated to Eu-doped silica colloids through sand
column ............................................................................................................. 166
4.2.3.2.1. Sorption and desorption of Cs on silica colloids ......................... 167
4.2.3.2.2. Column experiments .................................................................... 167
4.3. Results............................................................................................................... 170
4.3.1. Characterisation and stability of colloids................................................... 170
4.3.1.1. Silica colloids...................................................................................... 170
4.3.1.2. Eu-doped silica colloids...................................................................... 172
4.3.2. Migration experiments............................................................................... 176
4.3.2.1. Migration of Eu-doped silica colloids through sand column.............. 176
4.3.2.2. Migration of Cs associated to Eu-doped silica colloids...................... 179
4.3.2.2.1. Sorption of Cs to silica colloids................................................... 179
4.3.2.2.2. Migration of 137Cs associated to Eu-doped silica colloids........... 182
4.4. Conclusions....................................................................................................... 190
Chapter 5. CONCLUSIONS AND FURTHER WORK.......................................... 191
PERSONAL DEVELOPMENT TRAINING.......................................................... 195
REFERENCES ........................................................................................................ 198
Table of figures Page 11 of 214
Table of Figures
Figure 1. Possible interaction between colloids and radionuclide particles in the
subsurface. ................................................................................................................. 27
Figure 2. Structure of boehmite 47. ............................................................................ 34
Figure 3. Structure of montmorillonite 62. ................................................................. 35
Figure 4. Organic dyes used in the surface area measurement of boehmite colloids.47
Figure 5. Average size and kcounts per second of boehmite colloids after different
centrifugation periods. ............................................................................................... 51
Figure 6. Average size of boehmite colloids as a function of pH and time............... 52
Figure 7. Zeta potential of boehmite colloids as a function of pH, for two samples of
boehmite colloids....................................................................................................... 53
Figure 8. Zeta potential of boehmite colloids as a function of metal concentration
(Cs, Ni and Eu) at pH 7.............................................................................................. 54
Figure 9. Average size (a) and zeta potential (b) of montmorillonite colloids as a
function of pH............................................................................................................ 55
Figure 10. (a) Average size and (b) zeta potential of montmorillonite colloids as a
function of ionic strength........................................................................................... 57
Figure 11. Ni sorption onto solid montmorillonite at pH 7 and ionic strength 0.05
mol dm-3. Filtration through 0.45 and 0.22 µm filters. .............................................. 62
Figure 12. Sorption isotherm for the sorption of Cs, Ni and Eu onto boehmite
colloids (30 mg) at pH 7 and ionic strength 0.05 mol dm-3. ...................................... 63
Figure 13. Distribution ratios and percentages of sorbed Eu on colloidal boehmite at
pH 7 and ionic strength 0.05 mol dm-3. ..................................................................... 64
Figure 14. Langmuir fits for (a) Cs, (b) Ni and (c) Eu sorption on boehmite colloids
(approximately 30 mg) at pH 7 and ionic strength 0.05 mol dm-3............................. 66
Figure 15. Freundlich fit for metal sorption on boehmite colloids (approximately 30
mg) at pH 7 and ionic strength 0.05 mol dm-3. .......................................................... 66
Figure 16. D-R fit for metal sorption on boehmite colloids (approximately 30 mg) at
pH 7 and ionic strength 0.05 mol dm-3. ..................................................................... 67
Figure 17. Effect of the solid to liquid ratio on the sorption of (a) Cs, (b) Ni and (c)
Eu onto boehmite colloids at pH 7 and ionic strength 0.05 mol dm-3. ...................... 69
Figure 18. Effect of the background electrolyte on the (a) sorption and (b) desorption
of Cs onto boehmite colloids at pH 7 and ionic strength 0.05 mol dm-3. .................. 71
Table of figures Page 12 of 214
Figure 19. Sorption isotherm for Cs, Ni and Eu onto solid boehmite at pH 7 and ionic
strength 0.05 mol dm-3. .............................................................................................. 73
Figure 20. Modelling of metal sorption onto solid boehmite at pH 7 and ionic
strength 0.05 mol dm-3. .............................................................................................. 75
Figure 21. Sorption isotherms for (a) Cs, (b) Ni and (c) Eu sorption onto
montmorillonite colloids at pH 7 and ionic strength 0.05 mol dm-3.......................... 77
Figure 22. Modelling metal sorption on montmorillonite colloids at pH 7 and ionic
strength 0.05 mol dm-3. .............................................................................................. 79
Figure 23. Sorption isotherms for (a) Cs, (b) Ni and (c) Eu sorption onto solid
montmorillonite (black squares) and onto colloid (white triangles).......................... 81
Figure 24. Modelling metal sorption on solid montmorillonite at pH 7 and ionic
strength 0.05 mol dm-3. .............................................................................................. 83
Figure 25. Sorption isotherm for Ni sorption on solid montmorillonite at different
solid to liquid ratio, pH 7 and ionic strength 0.05 mol dm-3...................................... 84
Figure 26. Desorption percentages for three consecutive desorptions of metals from
boehmite colloids (30 mg) at pH 7 and ionic strength 0.05 mol dm-3. ...................... 87
Figure 27. (a) First and (b) second and third desorptions of Cs from boehmite
colloids at pH 7 and ionic strength 0.05 mol dm-3..................................................... 88
Figure 28. First, second and third desorption of Ni from boehmite colloids............. 89
Figure 29. First, second and third desorption of Eu from boehmite colloids. ........... 89
Figure 30. Influence of solid to liquid ratio on the desorption of (a) Cs, (b) Ni and (c)
Eu from boehmite colloids......................................................................................... 91
Figure 31. Desorption percentages for three consecutive desorptions of metals from
solid boehmite at pH 7 and ionic strength 0.05 mol dm-3......................................... 92
Figure 32. Metal desorption from solid boehmite at pH 7 and ionic strength 0.05 mol
dm-3. ........................................................................................................................... 94
Figure 33. Desorption percentages for three consecutive desorption steps of metals
from montmorillonite colloids at pH 7 and ionic strength 0.05 mol dm-3. ................ 95
Figure 34. Metal desorption from montmorillonite colloids at pH 7 and ionic strength
0.05 mol dm-3............................................................................................................. 96
Figure 35. Desorption percentages for three consecutive desorption steps of metals
from solid montmorillonite at pH 7 and ionic strength 0.05 mol dm-3. ..................... 97
Figure 36. First, second and third desorption for (a) Cs, (b) Ni and (c) Eu from solid
montmorillonite at pH 7 and ionic strength 0.05 mol dm-3. ...................................... 99
Table of figures Page 13 of 214
Figure 37. XRD diffractograms of solid and colloidal boehmite. ........................... 103
Figure 38. XRD Powder diffraction for boehmite (colloidal and solid samples)
compared to reference boehmite.............................................................................. 105
Figure 39. Effect of metal binding on boehmite colloids. ....................................... 106
Figure 40. SEM images for boehmite (a) colloids and (b) solid.............................. 107
Figure 41. SEM images for Cs-bound boehmite colloids........................................ 108
Figure 42. SEM images for Ni-bound boehmite colloids........................................ 109
Figure 43. SEM images for Eu-bound boehmite colloids. ...................................... 109
Figure 44. Interactions between metal cations (M), HA molecules and the surface of
the solid.................................................................................................................... 122
Figure 45. HA UV calibration curves...................................................................... 129
Figure 46. Effect of treatments on the absorbances of HA at 254 nm..................... 130
Figure 47. Effect of centrifugation and filtration on the ratios of UV-Vis absorbances
for HA solutions at concentrations 10 to 450 mg kg-1. (a) Ratio A300/A254, (b) Ratio
A350/A254 and (c) A400/A254. ..................................................................................... 131
Figure 48. Stability of Boehmite (67 mg) HA suspensions followed by DLS
measurements of average size.................................................................................. 132
Figure 49. Kinetic stability of boehmite colloids (11 mg) in the presence of varying
concentrations of HA at pH 7 and I 0.05 mol dm-3.................................................. 134
Figure 50. Kinetic stability of boehmite suspension in the presence of 500 mg kg-1
HA............................................................................................................................ 135
Figure 51. Sorption isotherm of HA to colloidal (30 mg) and solid (100 mg)
boehmite measured by UV-Vis spectroscopy at 254 nm......................................... 137
Figure 52. Sorption of Cs to boehmite colloids at pH 7 and ionic strength 0.05 mol
dm-3 in the presence of 0, 1 and 2 mg kg-1 HA. ....................................................... 139
Figure 53. Sorption of Ni to boehmite colloids at pH 7 and ionic strength 0.05 mol
dm-3 in the presence of 0, 1 and 2 mg kg-1 HA. ....................................................... 140
Figure 54. Sorption isotherm for Eu sorption on boehmite colloids in the presence of
HA (0, 1 and 2 mg kg-1) at pH 7 and ionic strength 0.05 mol dm-3......................... 141
Figure 55. XRD pattern of colloidal boehmite and HA-bound boehmite. .............. 144
Figure 56. SEM images for (a) and (b) humate-boehmite and (c) boehmite colloids.
................................................................................................................................. 145
Figure 57. UV scatter of dissolved HA after equilibration with boehmite colloids at
pH 7 and ionic strength 0.05 mol dm-3. ................................................................... 149
Table of figures Page 14 of 214
Figure 58. Modelling Cs sorption onto boehmite colloids in the presence of HA at pH
7 and ionic strength 0.05 mol dm-3. ......................................................................... 156
Figure 59. Modelling Ni sorption onto boehmite colloids in the presence of HA at pH
7 and ionic strength 0.05 mol dm-3. ......................................................................... 157
Figure 60. Modelling Eu sorption onto boehmite colloids in the presence of HA at
pH 7 and ionic strength 0.05 mol dm-3. ................................................................... 159
Figure 61. Experimental set up for the migration of radiolabelled silica colloids
through a sand column............................................................................................. 165
Figure 62. Experimental set up for the measurement of remaining gamma activity
with NaI detector. .................................................................................................... 165
Figure 63. Diagram of the control experiment carried out for the detection of γ-
activity through lead bricks with Na-I detector. ......................................................166
Figure 64. Gamma-counter scans for (a) Cs associated to Eu-doped silica colloids,
(b) Eu-doped silica colloids and (c) Cs spike. ......................................................... 169
Figure 65. Spectra from NaI detector for Cs associated to Eu-doped silica colloids.
................................................................................................................................. 170
Figure 66. UV Scatter of silica colloids as a function of time and ionic strength (IS).
................................................................................................................................. 172
Figure 67. UV Scatter and specific activity of silica colloids in DI water. ............. 174
Figure 68. Specific activity of the supernatant of suspensions of silica colloids before
and after centrifugation, and after redispersion in various concentrations of NaCl. 175
Figure 69. Recovery of Eu doped silica colloids and conservative tracer through sand
column (pore volume = 60.75 cm3). (a) Whole experiment and (b) Beginning of the
breakthrough. ........................................................................................................... 177
Figure 70. Sorption isotherm of Cs sorption onto silica colloids at pH 7................ 179
Figure 71. Sorption percentages for Cs sorption onto silica colloids at pH 7 and ionic
strength 0.05 mol dm-3. ............................................................................................ 180
Figure 72. Desorption of Cs from silica colloids at pH 7 and ionic strength 0.05 mol
dm-3. ......................................................................................................................... 182
Figure 73. Cumulative recovery of Cs and Eu doped silica colloids through a sand
column (Pore volume = 71.3 cm3). .......................................................................... 183
Figure 74. Measurement of 137Cs activity (4.4 kBq) with NaI detector (ROI = 282 –
354) along column length after flooding of column with Cs associated to Eu doped
silica colloids and DI water. Segments measured for 40 minutes. .......................... 185

Table of figures Page 15 of 214
Figure 75. Corrected net counts for Cs retention along the column. ....................... 187
Figure 76. Breakthrough curve for second flush with DI water through Cs associated
Eu-doped silica colloids - sand column ................................................................... 188
Figure 77. Na-I detector pattern for second flush of DI water through Cs associated
Eu-doped silica colloids - sand column ................................................................... 188
Figure 78. Modelling approach for Cs migration through sand column in the presence
of silica colloids. ...................................................................................................... 189
Figure 79. Modelling of Cs through sand column when associated with silica
colloids..................................................................................................................... 189
List of tables Page 16 of 214
List of tables
Table 1. Isotopes and radioactive parameters. ........................................................... 36
Table 2. Metal concentration in active metal stock solution. .................................... 37
Table 3. Average size of boehmite colloids as determined using a Zeta Master S. 1
cm3 boehmite colloids diluted into x cm3 deionised water. ....................................... 50
Table 4. Characterisation of montmorillonite colloids. ............................................. 55
Table 5. Metal speciation for system constituted by 10-3 mol dm-3 MClx and 30 mg
boehmite colloids at pH 7 and ionic strength 0.05 mol dm-3..................................... 60
Table 6. Speciation for montmorillonite in the presence of 10-3 MClx, 0.05 mol dm-3
NaCl and pH 7. Concentrations in mol dm-3. ............................................................ 60
Table 7. Metal speciation for system constituted by 10-3 mol dm-3 MClx and 30 mg
montmorillonite colloids at pH 7 and ionic strength 0.05 mol dm-3.......................... 61
Table 8. Mass of boehmite colloids in 10 cm3 measured gravimetrically. ................ 62
Table 9. Modelling parameters for metal sorption onto boehmite colloids............... 67
Table 10. Mass of boehmite colloids in 10 cm3 of suspension measured
gravimetrically. .......................................................................................................... 68
Table 11. Rd values for metal sorption onto varying amounts of boehmite colloids. 70
Table 12. Distributio ratios for metal sorption on boehmite (colloidal and solid
phase). ........................................................................................................................ 73
Table 13. Modelling parameters for metal sorption onto solid and colloidal boehmite.
................................................................................................................................... 75
Table 14. Characteristic parameters of montmorillonite colloids used in sorption
batch experiments. ..................................................................................................... 76
Table 15. Modelling parameters for metal sorption on montmorillonite colloids..... 79
Table 16. Modelling parameters for metal sorption on solid montmorillonite.......... 83
Table 17. Sorption parameters for metal sorption on montmorillonite (colloidal and
solid phase). ............................................................................................................... 85
Table 18. Modelling parameters for metal sorption onto colloidal and solid
montmorillonite. ........................................................................................................ 86
Table 19. Desorption percentages for metal desorption from boehmite (colloidal and
solid phase). ............................................................................................................... 93
Table 20. Surface parameters of colloidal and solid boehmite................................ 100
List of tables Page 17 of 214
Table 21. Attempt to measure surface area of boehmite by adsorption of organic
dyes. ......................................................................................................................... 101
Table 22. Size of colloidal and solid boehmite calculated by the Scherrer equation.
................................................................................................................................. 103
Table 23. Ionic sizes and electronegativities of metals studied............................... 112
Table 24. Rd values for metal sorption on solid montmorillonite at pH 7............... 115
Table 25. References on Freundlich fit of Cs sorption to solid montmorillonite. ... 116
Table 26. Sorption of metals on boehmite and montmorillonite, solid and colloidal
phase. ....................................................................................................................... 117
Table 27. Estimated values of Rd values for metal sorption on boehmite. .............. 118
Table 28. Time of flocculation for boehmite colloids (67 mg) in the presence of
increasing concentrations of HA measured by UV-Vis spectroscopy..................... 133
Table 29. Zeta potential of boehmite colloids, HA and binary humate-boehmite
suspension................................................................................................................ 136
Table 30. Rd values for Cs, Ni and Eu sorption in the presence of 0, 1 and 2 mg kg-1
of HA. ...................................................................................................................... 142
Table 31. Intensity ratios for XRD peaks on boehmite and humate-boehmite colloids.
................................................................................................................................. 144
Table 32. Parameters for the application of the LAM for sorption of Cs, Ni and Eu
onto boehmite colloids in the presence of 1 mg kg-1 HA. fHA = 0.23. ..................... 146
Table 33. Parameters for the application of the LAM for sorption of Cs, Ni and Eu
onto boehmite colloids in the presence of 2 mg kg-1 HA. fHA = 0.60. ..................... 147
Table 34. Parameters observed from the application of the LAM 154 to the sorption of
metals onto boehmite colloids in the presence of 1 and 2 mg kg-1 HA. .................. 147
Table 35. Sensitivity analysis for Cs sorption onto boehmite colloids in the presence
of (a) 1 and (b) 2 mg kg-1 HA. ................................................................................. 150
Table 36. Sensitivity analysis for Ni sorption onto boehmite colloids in the presence
of (a) 1 and (b) 2 mg kg-1 HA. ................................................................................. 151
Table 37. Sensitivity analysis for Eu sorption onto boehmite colloids in the presence
of (a) 1 and (b) 2 mg kg-1 HA. ................................................................................. 151
Table 38. Values of fHA for similar values between Rd,t predicted and experimental.
................................................................................................................................. 152
Table 39. Parameters of the modelling of the sorption of Cs, Ni and Eu onto
boehmite in the presence of HA (0, 1 and 2 mg kg-1).............................................. 153

List of tables Page 18 of 214
Table 40. Control experiment proving the effectiveness of the lead bricks. ........... 166
Table 41. Selection of regions in gamma counter for 152Eu and 137Cs. ................... 168
Table 42. Characterisation of Eu doped silica colloids. .......................................... 173
Table 43. Experimental parameters of column experiment carried out for the
assessment of the migration of Eu doped silica colloids through sand column. ..... 176
Table 44. Modelling parameters for Cs sorption onto silica colloids...................... 181
Table 45. Comparison of modelling parameters for Cs sorption onto silica colloids.
................................................................................................................................. 182
Table of Abbreviations Page 19 of 214
List of abbreviations
HA Humic acid
MES Buffering agent, 2-(N-morpholino)ethanesulfonic acid
TEOS Tetraethyl orthosilicate
DI water Deionised water
DPSO Diphenyl sulfoxide
4-NBA 4-nitrobenzylalcohol
3-NP 3-nitrophenol
IS Ionic strength
DLVO theory Deryajin-Landau-Verwey-Overbeek
DLS Dynamic light scattering
XRD X-ray diffraction analysis
UV-Vis Ultraviolet Visible spectroscopy
a.u. Arbitrary units
CE Cation exchange
PE Proton exchange
JChess Chemical speciation modelling program
LAM Linear additive model
Organisation of this report Page 20 of 214
ORGANISATION OF THIS REPORT This report is divided into chapters concerning the influence of colloids on the
sorption and transport of radionuclides through the Geosphere.
Chapter 1 introduces the need to consider colloids when considering risk assessment.
A short introduction to colloids and their stability is followed by a description of the
inclusion of colloids in radionuclide transport. Examples given demonstrate the need
to fully understand the interactions of colloids and radionuclides.
Chapter 2 describes the binary interaction between metals and colloidal mineral
phases. By modelling the sorption isotherms, distribution ratios are collected.
Desorption experiments provide quantitative measurements of the reversible
behaviour of the metals under examination. Futhermore, a modelling approach was
used in an attempt to predict the distribution ratios of metals on the colloidal phase
by extrapolating from those distribution ratios found on the solid phase.
Ternary systems including humic acids were investigated in Chapter 3, where the
influence of humic acids on the sorption of the binary metal colloid system was
measured. The linear additive model was applied to the experimental results.
The mobility of colloids through a column was investigated in Chapter 4, as well as
the effect of colloids in the migration of radionuclides through the column. The
colloids were radiolabelled with 152Eu from early stages of the synthesis process,
allowing the colloids to be detected radiometrically along the column.
Chapter 5 concludes with a summary of the most relevant findings of the thesis.
Introduction Page 21 of 214
Chapter 1. INTRODUCTION
Long term disposal of low level and intermediate level radioactive waste includes
interim storage and then disposal in deep underground repositories. Due to the long
half-life of the radioactive waste, the underground facilities should be designed to
ensure isolation of the waste packages even after hundreds of thousands of years.
However, because of the long time scales involved, radionuclides may eventually be
released to the Geosphere by mobilisation and transport in groundwater 1.
Performance assessment of potential nuclear waste repositories requires a thorough
understanding of physico-chemical and engineering aspects of the waste packaging,
the geological disposal facility as well as the geological environment surrounding the
facility. To prevent radionuclides from being released into the environment, both
engineered and geological barriers are considered. The former is constituted by
backfill or buffer material which can act as a retardant for radionuclides. The latter
consists of the host rock geology, which provides a long groundwater travel time for
dispersion and retention of radionuclides by sorption to the surrounding solid matrix 2.
Retention or retardation may occur mainly by sorption onto the surface of the host
rock. Nonetheless, the presence of mobile, sorbent particles may reduce the
effectiveness of retardation of radionuclides 2. These small particles released from
the host rock may have the same sorptive capacity as the host, but may provide a
large surface which contaminants may sorb to. The mobility of these colloidal
particles may lead to an enhancement of the transport of the contaminants.
1.1. Basics of colloid chemistry
1.1.1. Definition and stability of colloids
Colloids are particles which size range 1 to 1000 nm, being generally smaller than
the pores in permeable and fractured media. These particles, are sufficiently stable to
form another phase to the aqueous phase and sufficiently “small” to undergo
Introduction Page 22 of 214
Brownian motion 3. Colloids possess a large surface area to volume ratio 4 and can
thus act as a sorbent of contaminants.
The stability of a colloidal system depends on the net energy balance of two forces:
the Van der Waals attractive forces, and the repulsive, electrostatic forces which
prevent the particles from colliding 4. The DLVO (Deryajin-Landau-Verwey-
Overbeek) theory is a quantitative model for predicting the stability of colloidal
systems based on the summatory of both attractive and repulsive forces and the
distance between the particles 4. When particles undergoing Brownian motion collide
with sufficient energy to overcome the long range repulsive forces, then the attractive
forces will lead to a minimum in the potential and thus aggregation may occur 5. A
secondary minimum in the energy potential, which leads to a reversible flocculation
of the particles, may be found in colloidal systems. Hence, stability of a colloidal
system is attained by generating enough repulsion between colloidal particles to
prevent the particles from flocculating.
The background electrolyte in solution plays a key role on the stability of the
colloidal system. An increase of the concentration of the electrolyte leads to a
descrease in the repulsion forces due to screening of the double layer interaction.
Consequently, the colloidal particles coagulate 5. Other parameters which influence
the stability of colloids are hydration forces 6, which involve the organisation of
water molecules around the surface by polarisation induced by the dipole moments
of the ion pairs 5, or sterical stability, which may be attained by coating the particles
with an absorbed polymeric layer on the surface of the colloid 7.
Stability of colloidal suspensions is often studied by measurements of zeta potential 8,9, where the general trend observed is an increase of the stability with the net
surface charge 10.
1.1.2. Types of Colloids
Groundwater colloids may be inorganic particles, organic molecules, or
microorganisms 11,12,13. Colloids can be formed by weathering of rocks, plants and
soils, as well as by dissolution of minerals, leading to the formation of secondary
Introduction Page 23 of 214
minerals 14. Actinide oxides and hydroxides present in the near field of a repository
may undergo hydrolysis and polymerisation processes leading to the formation of
actinide colloids 10.
1.1.2.1. Biocolloids
Biocolloids are those microorganisms, such as bacteria or viruses, which are
colloidal in size and naturally exist in the subsurface. Bacteria generally possess net
negative charge in natural environments 11, although the cell surface and other
properties depend on environmental conditions 13. Microbes may alter, by enhancing
the kinetics, processes in groundwater chemistry which would be slow otherwise 2.
Recent investigations have reported adsorption of metals, such as Ni(II), Cu(II),
Zn(II) or Cr(VI) on fungus under different pH and temperature conditions 15. The
sorption of Co(II) and Sr(II) onto moss was maximum at pH 5 – 6. The sorption
isotherms were modelled satisfactorily by the Langmuir model and spectroscopic
techniques revealed ion exchange was the main mechanism for the sorption of metals 16. The transport of Cd(II) through gravel aquifer media by bacteria spores 17 was
assessed, leading to the development of a computer code to model the transport of
Cd(II). Bioremediation by the chitosan biopolymer has been widely studied;
Muzzarelli 18 and Wan Nhag et al. 19 reviewed the findings of the investigations.
1.1.2.2. Organic substances
Humic acids (HA) are the fraction of organic substances which are soluble in
solution at pH above 2 20. HA are ubiquitous in groundwater systems 2, as they
originate from decomposition of plants and animal matter 20. A large number of
functional groups are found in HA molecules, including carboxylic groups and
phenolic groups. Due to the complexity of HA, a structure has not yet been found,
although many have been proposed. From the different spectroscopic studies,
properties like flexibility have been attributed to HA 21. This property allows the
structure to contract or expand depending on the pH and ionic strength conditions. In
this manner, an increase on the ionic strength will cause the molecules to shrink due
to screening of the charges. On the contrary, an increase in the pH leads to the
Introduction Page 24 of 214
formation of negative charges that will cause repulsive interactions, thus leading to
expansion.
HA present in groundwater systems can act as a sorbent for contaminants 21, thereby
potentially enhancing the transport of these contaminants, and can also promote
colloidal transport by preventing their coagulation and consequent deposition on the
solid matrix 20.
The effect of HA on minerals and contaminants has been addressed from different
approaches:
• Coating of minerals by HA. These investigations generally study the sorption
of HA on minerals and clays under a variety of chemical conditions. For
example, Liu et al. 22 found that the sorption of HA on montmorillonite
decreased with an increase of pH. Yoshida et al. 23 reported an increase in the
migration of alumina through a sand column when coated by HA.
• Influence of HA on the sorption of metals onto minerals and clays.
Investigations of the sorption of metals in the ternary system include the
sorption of U(IV) onto kaolin in the presence of HA 24. The effect that HA
has in a ternary system has been the object of study to understand the
mechanisms of sorption and modelling attempts have been made. Examples
include the quantification of the blocking effect of HA on the sorption sites of
latex colloids, studied by Yang et al. 20
• Sorption of metals onto HA. For example, the enhancement in the transport
of Eu(III) by HA through a sand column was reported by Warwick et al. 25.
More examples can be found in Chapter 3.
A number of investigations have been carried out to understand the mechanisms of
sorption in ternary systems. Anirudhan et al. 26 reported that the sorption of Cu(II),
Zn(II) and Co(II) onto bentonite occurred through ion exchange and complexation
mechanisms. Bivalent metal sorption onto montmorillonite was reported to take
place by bridging of the metals. A bridged corundum-HA-Pb(II) complex was
reported by Boily and Fein 27 at low to neutral pH. An increase in the pH was found
to introduce competition for the metal by the surface sites (adsorbed metal) and by
Introduction Page 25 of 214
the HA (formation of aqueous Pb-humate complexes), leading to the decrease of Pb
sorption on the corundum surface.
1.2. Migration of colloids
The presence of colloids in the subsurface is ubiquitous and has been recorded by
several investigators 13. Tipping et al. 3 reported data on colloidal speciation in
several field sampling points. Special attention has been paid to the presence of
colloids at the Grimsel test site in Switzerland, where several groups have
investigated not only the release of colloids and their transport but also their role in
facilitating the transport of radionuclides 35, 36, 37.
A clear understanding of the mobility of colloids is essential in order to assess the
influence of colloids on contaminant migration through the subsurface. The mobility
of colloidal particles includes transport, release from and retention on the solid
geological material.
1.2.1. Release of colloids
This process depends on particle-surface interactions and is governed by the
hydrodynamics of the flow field 28. In this context, colloidal particles may be
released by sliding or rolling of particles due to the flow forces. Dettachment of
colloidal particles occur mainly due to changes in solution chemistry, like ionic
strength or pH 29, 30. Sen et al. 29 suggested that a favourable chemical environment
for the release of colloidal particles is that saturated in Na+ ions, with high pH and
low ionic strength. Under these conditions, an expansion of the electric double layer
would lead to mobilisation of the particle due to repulsion of like-charged particle
and matrix.
The release of colloids has been investigated at laboratory scale by means of column
experiments with subsurface materials 28. Grolimund and Bokovec 28 reported an
increase in particle release with decreasing ionic strength and presence of
monovalent counterions. Another factor which influenced the release of colloidal
particles was aging the subsurface materials. This caused the release of colloidal
particles to decrease as the time of aging increased.
Introduction Page 26 of 214
Reviews on the release of colloids can be found in Ryan et al. 30 and more recently in
Sen et al. 29.
1.2.2. Transport of colloids
Colloid transport has been experimentally observed through fractured materials, like
carbonate rocks or glacial tills 13.
Transport of colloids can be described by two phenomena: size exclusion mechanism
and hydrodynamic chromatography. The former is based on the fact that colloids are
excluded from fine pores. The latter is based on the chromatographic effect that the
velocity profile through a cylinder is parabolic, being maximum at the center and
decreasing towards the walls. Due to the size, particles will be excluded from the
slowest regions and thus migrate at higher velocity than the average water 31.
1.2.3. Retention of colloids
Transport of colloids may be reduced by immobilising the colloids on the solid
surface. Colloid stability can be achieved by maintaining the repulsive forces
between colloids and solid surface 13. Thus, colloid retention can be achieved by
minimising those repulsive forces, leading to the coagulation of colloids, and hence
the deposition of colloids on the surface. Retention of colloids may be enhanced by
increasing the ionic strength of the solute suspension 32. Multivalent cations in the
solute may also contribute to a higher retention of colloids 13.
For example, the retention of alumina colloids on mica was studied by Spalla et al. 33
who reported no desorption of colloids when the sample was aged in salt (NaNO3)
water, but observed desorption of the colloids when aging the sample with citrate (>
5 mmol dm-3), due to the change in the charge in the alumina surface introduced by
the citrate.
Introduction Page 27 of 214
1.3. Colloid-facilitated transport of contaminants
Transport of contaminants due to association with colloids was suggested in the early
1980s 13. It is widely accepted that colloidal particles may play a key role in
determining the fate of contaminants in the subsurface. For colloids to have a
fundamental influence on the transport of contaminants, three criteria must be met 30,2: First, colloids need to be present in a significant amount to have a significant
probability of interaction between contaminants and colloids. In this case, release of
colloidal particles from the solid matrix must occur. Secondly, colloids must adsorb
contaminants on their surface; interactions between the surface of the colloids and
the radionuclides must take place so that the radionuclide attaches to the colloidal
particle. Finally, colloids have to migrate through the groundwater in order to co-
transport contaminants along with them. The interactions between contaminants and
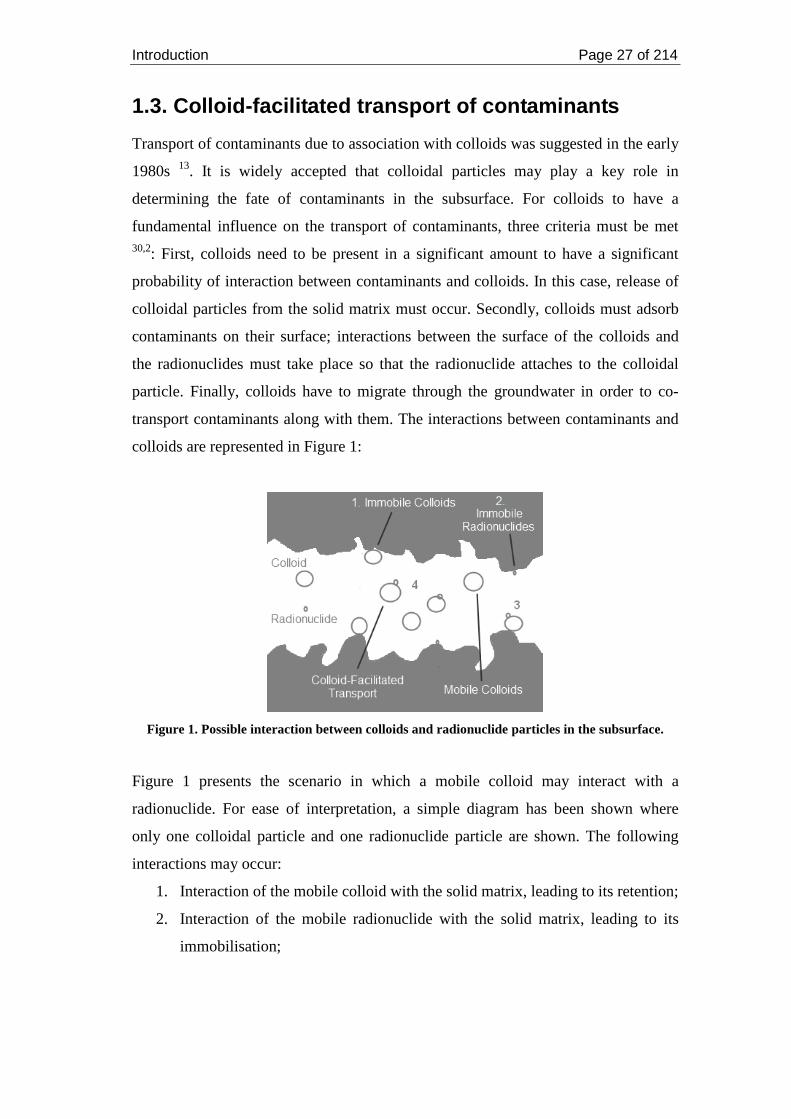
colloids are represented in Figure 1:
Figure 1. Possible interaction between colloids and radionuclide particles in the subsurface.
Figure 1 presents the scenario in which a mobile colloid may interact with a
radionuclide. For ease of interpretation, a simple diagram has been shown where
only one colloidal particle and one radionuclide particle are shown. The following
interactions may occur:
1. Interaction of the mobile colloid with the solid matrix, leading to its retention;
2. Interaction of the mobile radionuclide with the solid matrix, leading to its
immobilisation;
Introduction Page 28 of 214
3. Irreversible interaction of the mobile radionuclide with an immobile colloid.
In this case, the transport of the radionuclide will depend on the rate of
release of the colloid.
4. Interaction of the mobile colloid with the mobile radionuclide, leading to an
enhancement of the transport of the radionuclide. However, depending on the
reversibility of the interaction, the radionuclide can be transported long
distances, until deposition of the colloid (irreversible sorption) or can be
transported until the radionuclide desorbs from the colloidal particle
(reversible sorption).
The transport of contaminants and colloidal particles through the subsurface can be
generally described by four terms: diffusion, dispersion, advection and a chemical
term which takes into account deposition and release of the transported particle 12.
Migration of radionuclides is generally diminished by sorption onto the solid matrix.
However, the presence of colloids can significantly enhance the migration of
contaminants, as seen by the scheme in Figure 1. Hence, an understanding of the
sorption of contaminants onto colloidal particles is fundamental 34.
Examples of experimental observations of enhanced mobility of contaminants due to
co-transportation with colloidal particles are given below.
The breakthrough of 241Am and 244Pu 35 and 131I, 85Sr, 137Cs, 99Tc, 232Th, 233U, 237Np, 238,244Pu, and 241Am 36 associated with Febex bentonite colloids through Grimsel
groundwater was studied by means of column experiments. The radionuclides were
found to be co-transported with the bentonite colloids. Furthermore, the sorption of
Am on bentonite colloids was reversible, but slow. Sr transport through a crystalline
structure was slightly enhanced by the presence of bentonite colloids 37. However,
the transport was less than expected due to partly the retention of the colloids in the
structure and partly due to, perhaps, desorption of Sr from the colloids. Grolimund et
al. 38 reported the outbreak of Pb through a non-calcareous soil; Nagasaki et al. 39
observed enhanced transport of Am and Np by montmorillonite colloids; Cs
migration through a granite fracture was enhanced by clay colloids 40 and by silica
colloids when passed through glass bead columns 41. Natural organic colloids
Introduction Page 29 of 214
enhanced slightly the transport of 241Am through a fracture in granite, but did not
influence greatly the transport of 85Sr, as reported by Vilks et al. 42.
1.4. Modelling
The classic approach describes transport of contaminants as a function of diffusion,
advection and deposition/release on the porous matrix. Inclusion of colloids in the
transport equation has been approached by adding sorptive terms in the original
transport equation (see section 1.4.3). Modelling the effects of bacteria on
contaminant transport has also been addressed, simply by adding sorption and
desorption interactions to the classic approach 11.
The inclusion of colloids in the solute transport equation needs the complete
knowledge and understanding of the interaction between radionuclides and colloids.
The study of both the sorption and migration of colloidal particles and contaminants
have led to the development of computer codes.
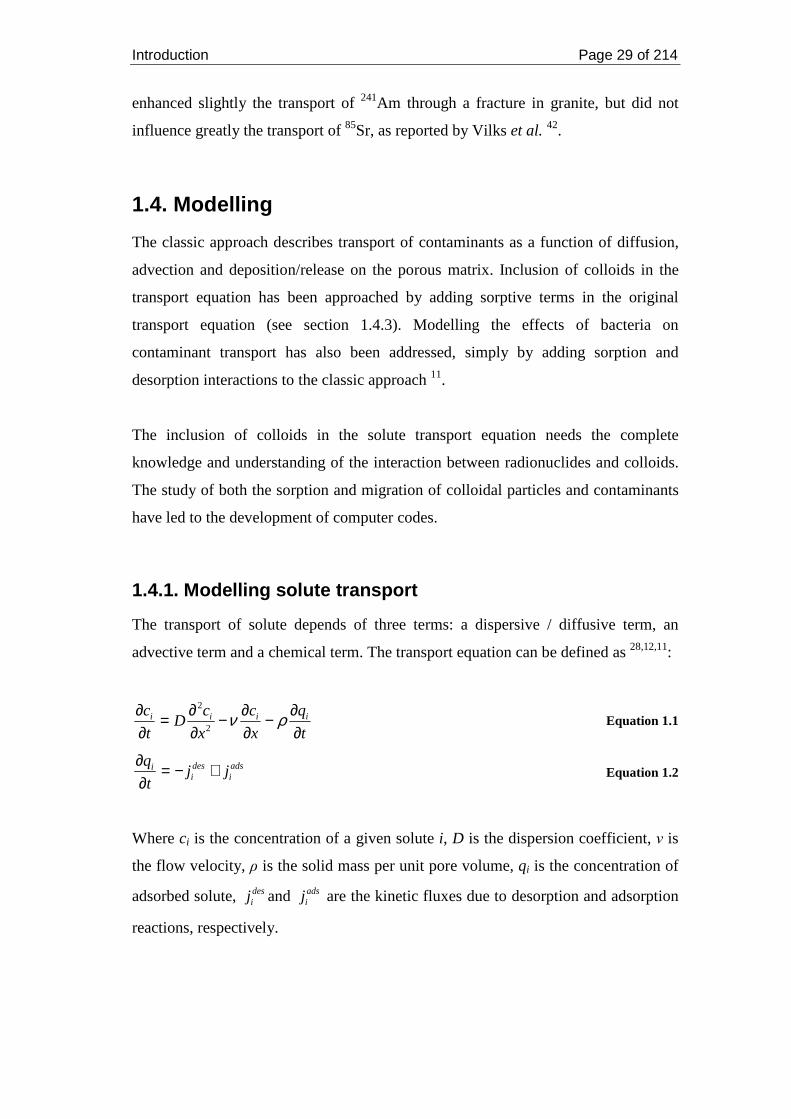
1.4.1. Modelling solute transport
The transport of solute depends of three terms: a dispersive / diffusive term, an
advective term and a chemical term. The transport equation can be defined as 28,12,11:
t
q
x
c
x
cD
t
c iiii
∂∂−
∂∂−
∂∂=
∂∂ ρν
2
2
Equation 1.1
adsi
desi
i jjt
q +−=∂∂
Equation 1.2
Where ci is the concentration of a given solute i, D is the dispersion coefficient, ν is
the flow velocity, ρ is the solid mass per unit pore volume, qi is the concentration of
adsorbed solute, desij and ads
ij are the kinetic fluxes due to desorption and adsorption
reactions, respectively.
Introduction Page 30 of 214
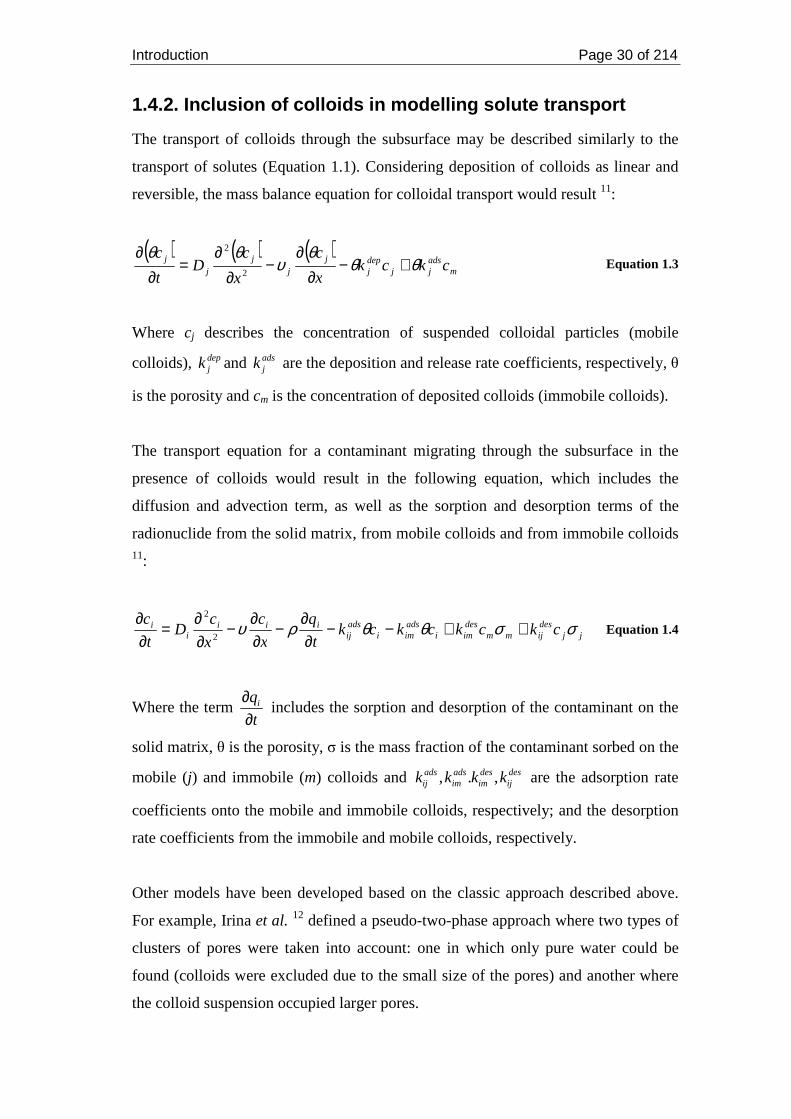
1.4.2. Inclusion of colloids in modelling solute transport
The transport of colloids through the subsurface may be described similarly to the
transport of solutes (Equation 1.1). Considering deposition of colloids as linear and
reversible, the mass balance equation for colloidal transport would result 11:
( ) ( ) ( )m
adsjj
depj
jj
jj
j ckckx
c
x
cD
t
cθθ
θυ
θθ+−
∂∂
−∂
∂=
∂∂
2
2
Equation 1.3
Where cj describes the concentration of suspended colloidal particles (mobile
colloids), depjk and ads
jk are the deposition and release rate coefficients, respectively, θ
is the porosity and cm is the concentration of deposited colloids (immobile colloids).
The transport equation for a contaminant migrating through the subsurface in the
presence of colloids would result in the following equation, which includes the
diffusion and advection term, as well as the sorption and desorption terms of the
radionuclide from the solid matrix, from mobile colloids and from immobile colloids 11:
jjdesijmm
desimi
adsimi
adsij
iiii
i ckckckckt
q
x
c
x
cD
t
c σσθθρυ ++−−∂
∂−
∂∂
−∂∂
=∂∂
2
2
Equation 1.4
Where the term t
qi
∂∂
includes the sorption and desorption of the contaminant on the
solid matrix, θ is the porosity, σ is the mass fraction of the contaminant sorbed on the
mobile (j) and immobile (m) colloids and desij
desim
adsim
adsij kkkk ,., are the adsorption rate
coefficients onto the mobile and immobile colloids, respectively; and the desorption
rate coefficients from the immobile and mobile colloids, respectively.
Other models have been developed based on the classic approach described above.
For example, Irina et al. 12 defined a pseudo-two-phase approach where two types of
clusters of pores were taken into account: one in which only pure water could be
found (colloids were excluded due to the small size of the pores) and another where
the colloid suspension occupied larger pores.
Introduction Page 31 of 214
1.4.3. Modelling contaminant sorption to colloids
Successful modelling of the transport of radionuclides through the subsurface in the
presence of colloids needs a full understanding of the processes which govern the
sorption of radionuclides onto the colloids. Sorption of contaminants on colloids has
been widely studied and different models have been used to model such sorption.
Some of the simpler models are based on empirical equations, like the Langmuir or
the Freundlich isotherms.
Thermodynamic interpretations are based on the assumption that equilibrium is
reached when measurements are taken to enable the construction of sorption
isotherms. This however, may not be true as kinetics of the sorption may be slow and
equilibrium may not be attained on the period of time of the experiment 43.
From the study of the sorption and desorption of contaminants from colloids, or, in
general, from solid surfaces, a mechanistic interpretation can be derived. Once the
contaminant has sorbed onto the surface, given the necessary time to reach a new
equilibrium, the adsorbate can (a) diffuse slowly into the matrix, (b) form inner-
sphere surface complexation, or (c) crystallise in the form of a new solid phase 43.
The mechanisms of sorption are modelled using surface complexation models (refer
to Goldberg et al. 44 for more details) by testing the ability of the models to
reproduce the data satisfactorily 45.
Many models have been used to describe the mechanisms of sorption of metals onto
colloids. Based on surface complexation and cation exchange, models and computer
codes have been developed. For example, Missana et al. 45 interpreted the sorption of
U(VI) onto goethite colloids using the double difuse layer model, Kraepiel et al. 46
used potentiometric data and combined it with surface complexation and cation
exchange models to develop a computer code for the modelling of sorption of metals
onto Na-montmorillonite.
Although mechanistic interpretations of metal-colloid interactions were not an aim in
this thesis, interpretations found in the literature are used to interpret some of the
experimental results.
Colloid Binary Systems Page 32 of 214
Chapter 2. COLLOID BINARY SYSTEMS
2.1. Introduction
Understanding the migration of metals through the Geosphere may start by
evaluating the interactions of contaminants with the host rock. Due to various
factors, such as friction, the host rock might release smaller, metastable particles
called colloids. Because of their small size, colloids may be excluded from pores
while migrating along the Geosphere following the flows of groundwater.
Having the same properties as the host rock, colloids might interact with
contaminants in the same way as the original minerals, with the addition that they
may be transported along with the colloids. Therefore, colloids can be considered
potential transporters of contaminants, i.e. radionuclides, through the Geosphere.
The knowledge of the extent of sorption of metals onto colloids present in the
environment is therefore important in evaluating the possible migration of
radionuclides through the Geosphere. In this matter, not only sorption, but also
desorption of the metals from the colloids is of great relevance 36,45, as an irreversible
sorption would lead to transport of the contaminant; whereas a reversible sorption
could limit the enhancement of the transport of the contaminant. In any case, the
assessment of the interactions of radionuclides with colloids is fundamental in
understanding the fate of radionuclides in the Geosphere.
This chapter aims to extend the knowledge of the interactions between three metals:
caesium (Cs), nickel (Ni) and europium (Eu), chosen because they are mono, di and
trivalent; with two different colloids that are abundant in the environment: boehmite
and montmorillonite. Sorption of the metals onto the colloids was studied under fixed
conditions of pH and ionic strength, followed by an investigation of the desorption of
the metals, carried out in three consecutive steps, in order to gain a better
understanding of the reversibility of the sorptive process.
Colloid Binary Systems Page 33 of 214
Colloids can be considered to have the same sorptive properties as the minerals they
originated from, but their smaller dimensions provide colloids with a larger surface
area per mass which metals might sorb to, thereby enhancing the sorptive properties.
In this investigation, special attention is paid to the sorption of metals onto colloids
and the solid phase of the corresponding mineral in order to compare the extent of
sorption onto colloids and to bulk surfaces of the same material. To facilitate
comparisons, the surface areas of both colloid and solid phase were measured, along
with other surface properties like proton or cation exchange capacities.
The sorption of a metal onto a solid is generally expressed by a distribution ratio,
which is the ratio of surface-bound metal to dissolved metal in solution. Databases of
these distribution ratios exist 44 and a large number of sorption studies are found in
the literature. However, the distribution ratio is a parameter specific to the conditions
in which the sorption was carried out. Furthermore, most of the distribution ratios
determined are so for the systems consisting of metals and solid phases. The number
of investigations where sorption of metals is carried out on colloids is more limited.
Considering the only differences between colloidal and solid phases might be related
to the surface area, this investigation suggests that the distribution ratio for the
sorption of a metal onto a colloid might be proportional to the distribution ratio of the
metal and the ratios of surface areas. This idea was introduced by Wieland et al. 14,
who suggested that a “scaling factor” between the distribution ratios could be the
ratios between surfaces areas. This idea has been extended, although, due to the
limited knowledge in modelling, only a robust approach is presented herein, needing
further insight to produce a mathematical expression that could relate both
distribution ratios.
2.2. Experimental
The experimental procedure was based mainly on batch experiments measuring the
sorption and desorption of metals onto colloidal and solid phases using two different
minerals. In addition to batch experiments, other measurements were needed in order
to characterise the colloids, i.e. measurement of average size, zeta potential and
surface area.
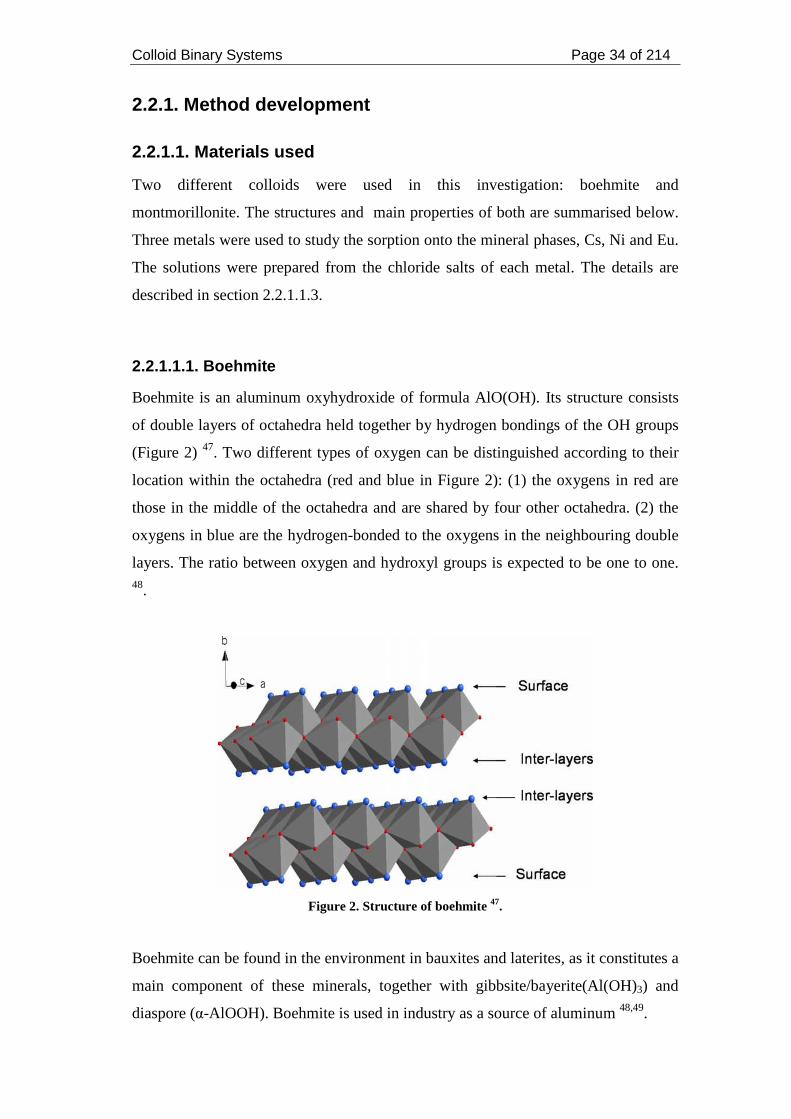
Colloid Binary Systems Page 34 of 214
2.2.1. Method development
2.2.1.1. Materials used
Two different colloids were used in this investigation: boehmite and
montmorillonite. The structures and main properties of both are summarised below.
Three metals were used to study the sorption onto the mineral phases, Cs, Ni and Eu.
The solutions were prepared from the chloride salts of each metal. The details are
described in section 2.2.1.1.3.
2.2.1.1.1. Boehmite
Boehmite is an aluminum oxyhydroxide of formula AlO(OH). Its structure consists
of double layers of octahedra held together by hydrogen bondings of the OH groups
(Figure 2) 47. Two different types of oxygen can be distinguished according to their
location within the octahedra (red and blue in Figure 2): (1) the oxygens in red are
those in the middle of the octahedra and are shared by four other octahedra. (2) the
oxygens in blue are the hydrogen-bonded to the oxygens in the neighbouring double
layers. The ratio between oxygen and hydroxyl groups is expected to be one to one. 48.
Figure 2. Structure of boehmite 47.
Boehmite can be found in the environment in bauxites and laterites, as it constitutes a
main component of these minerals, together with gibbsite/bayerite(Al(OH)3) and
diaspore (α-AlOOH). Boehmite is used in industry as a source of aluminum 48,49.
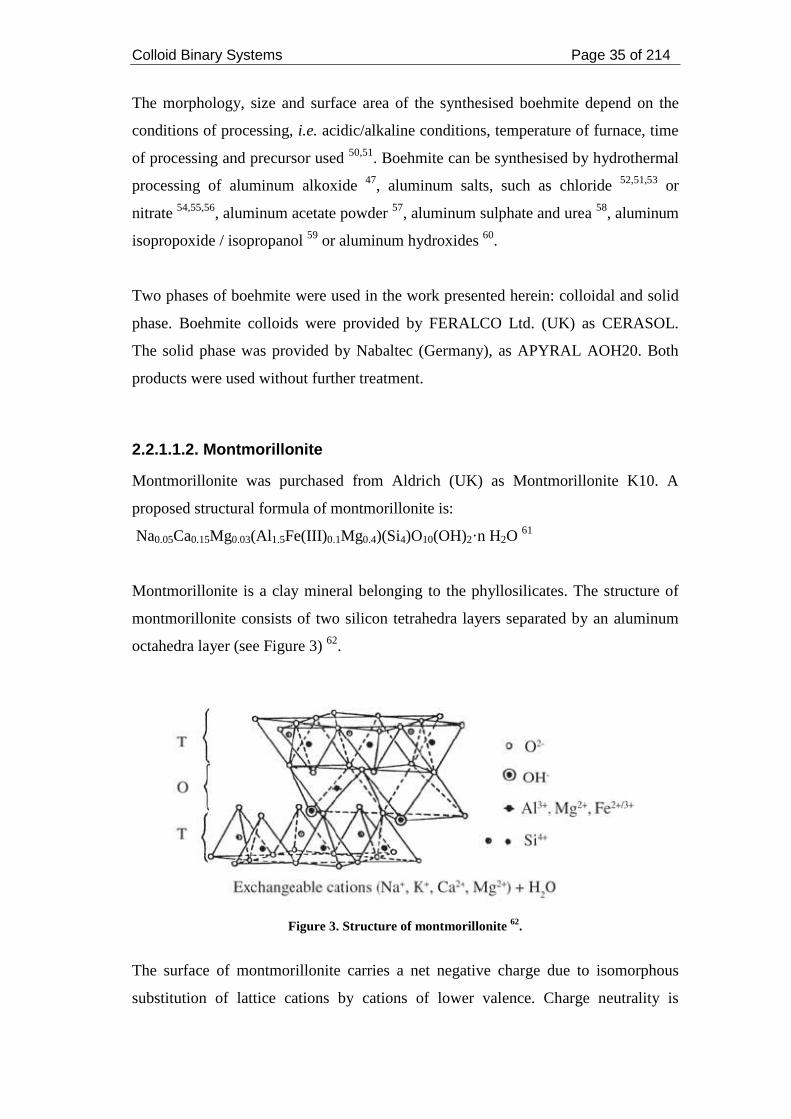
Colloid Binary Systems Page 35 of 214
The morphology, size and surface area of the synthesised boehmite depend on the
conditions of processing, i.e. acidic/alkaline conditions, temperature of furnace, time
of processing and precursor used 50,51. Boehmite can be synthesised by hydrothermal
processing of aluminum alkoxide 47, aluminum salts, such as chloride 52,51,53 or
nitrate 54,55,56, aluminum acetate powder 57, aluminum sulphate and urea 58, aluminum
isopropoxide / isopropanol 59 or aluminum hydroxides 60.
Two phases of boehmite were used in the work presented herein: colloidal and solid
phase. Boehmite colloids were provided by FERALCO Ltd. (UK) as CERASOL.
The solid phase was provided by Nabaltec (Germany), as APYRAL AOH20. Both
products were used without further treatment.
2.2.1.1.2. Montmorillonite
Montmorillonite was purchased from Aldrich (UK) as Montmorillonite K10. A
proposed structural formula of montmorillonite is:
Na0.05Ca0.15Mg0.03(Al1.5Fe(III)0.1Mg0.4)(Si4)O10(OH)2·n H2O 61
Montmorillonite is a clay mineral belonging to the phyllosilicates. The structure of
montmorillonite consists of two silicon tetrahedra layers separated by an aluminum
octahedra layer (see Figure 3) 62.
Figure 3. Structure of montmorillonite 62.
The surface of montmorillonite carries a net negative charge due to isomorphous
substitution of lattice cations by cations of lower valence. Charge neutrality is
Colloid Binary Systems Page 36 of 214
achieved by the formation of electrostatic interactions with nearby cations in
solution, which can undergo ion exchange processes with other cations in solution 63.
Together with kaolinite, illite or chlorite, montmorillonite is a major component of
bentonite, used as backfill material for radioactive waste repositories 63. Upon a
release of radionuclides, the first barrier encountered would be the backfill material.
Hence, understanding the interactions of radionuclides with montmorillonite is
essential towards assessing the mobility and fate of radionuclides in the Geosphere.
2.2.1.1.3. Metal solutions
Metal solutions were prepared by diluting a known amount of solid with deionised
(DI) water to the desired volume. The solids used for each metal were: CsCl (BDH
Laboratories AnalaR®), NiCl2 (Fisher Scientific) and EuCl3 (Sigma-Aldrich). NaCl
and KCl, from Sigma-Aldrich chemicals, were used to adjust the ionic strength. In
some cases 2-(N-morpholino)ethanesulfonic acid (MES) (Sigma-Aldrich) was used
as a buffering agent and was chosen for its non-complexing properties.
Radioactive stock solutions, obtained from Amersham International Plc., were
prepared by diluting a known volume of radioactive stock into the desired volume of
DI water. Generally, 10 – 20 x 10-3 cm3 would be taken from the stock solution
provided from the manufacturers and diluted into 10 – 20 cm3 DI water. The isotopes
used are shown below.
Table 1. Isotopes and radioactive parameters.
Isotope Inorganic Salt Radiation
measured
Half life (years)
137Cs CsCl Gamma 30.2 63Ni NiCl2 Beta 100
152Eu EuCl3 Gamma 13.5
The metal concentration of the active metal stock solution can be calculated from the
exponential decay law:
Colloid Binary Systems Page 37 of 214
Ndt
dN λ=− Equation 2.1
λ2ln
21 =t Equation 2.2
Where λ is the decay constant, related to the half-time of the isotope by Equation 2.2,
and N is the number of atoms involved. The metal concentration may be calculated
dividing N by the avogadro number (NA = 6.022 x 10²³). Table 2 shows the metal
concentration of the active metal stock solution, given that the specific activity was
approximately 8.33 x 10⁶ Bq dm-3.
Table 2. Metal concentration in active metal stock solution.
Metal 2
1t (seconds) [M] (mol dm-3)
137Cs 952387200 1.89 x 10⁻⁸ 63Ni 3153600000 6.29 x 10⁻⁸
152Eu 425736000 8.49 x 10⁻⁹
The study of these three metals was carried out due to the following importance of
the metals:
• 137Cs is present in the environment due to nuclear activities and accidents 64.
• Ni is a toxic heavy metal 65, which can be found in wastewater due to its use
in industry 66. Ni is an analogue for other heavy metal and radionuclide
contaminants, i.e. Pb (II) 65.
• 152Eu is a well-known analogue for transuranic metals and other lanthanides 67.
2.2.1.2. Preparation for measurements
Average sizes and zeta potentials of colloids were measured using a Zeta Master S
(Malvern Instruments). Ten recordings were measured and the average and standard
deviations are reported.
pH measurements were carried out using a Jenway 350 pH meter. The instrument
was calibrated prior to its use with three standard solutions (pHs 4, 7 and 10).
Colloid Binary Systems Page 38 of 214
Samples were centrifuged in a Hermle Z206A centrifuge at 6000 rpm for 30 minutes.
When necessary, samples were mixed using a Labnet VX100 Vortex mixer. The
filters used in all sorption and desorption experiments were supplied by Elkay (0.45
and 0.22 µm in pore size) or Anachem (PES Syr-filter 0.2 µm filters) and the plastic
syringes used (5 cm3) were provided by BD Plastipak. When used, the plastic
syringes were filled with sample, the filter fitted to the end and the first 5 cm3 of the
filtered sample were discarded, collecting the following 2 cm3 for radiometric
measurement. Control experiments showed that no sorption of activity to the syringe
filters or to the centrifuge tubes took place.
Radionuclide assays (to an error of two sigma or better) were performed using either
a Tricarb 1900TR Liquid Scintillation Analyzer (Packard Ltd) or a Cobra II Auto-
Gamma Counter (Packard). The activities measured were converted by calculation
into concentrations.
Powder X-ray measurements were performed using Cu-Kα radiation (λ = 1.5418 Å)
on a Bruker D8 diffractometer in reflection geometry and a Braun position sensitive
detector. The sample was loaded onto a silicon zero background substrate and data
were collected in the range 5 < 2θ < 90° with a step time of 1 second and step width
of 0.014°.
2.2.1.3. Speciation
The JChess speciation programme was used to predict the metal species for each of
the systems studied in batch sorption experiments. These were constituted by the
MClx (M = Cs, Ni, Eu), the colloid (boehmite or Na-montmorillonite), 0.05 mol dm-3
NaCl as background electrolyte and pH 7.
2.2.1.4. Data processing
Sorption isotherms were constructed from data obtained from the batch experiments.
The results were fitted to three different models: the Langmuir, the Freundlich and
the Dubinin-Radushkevich equations. The three models are briefly described in this
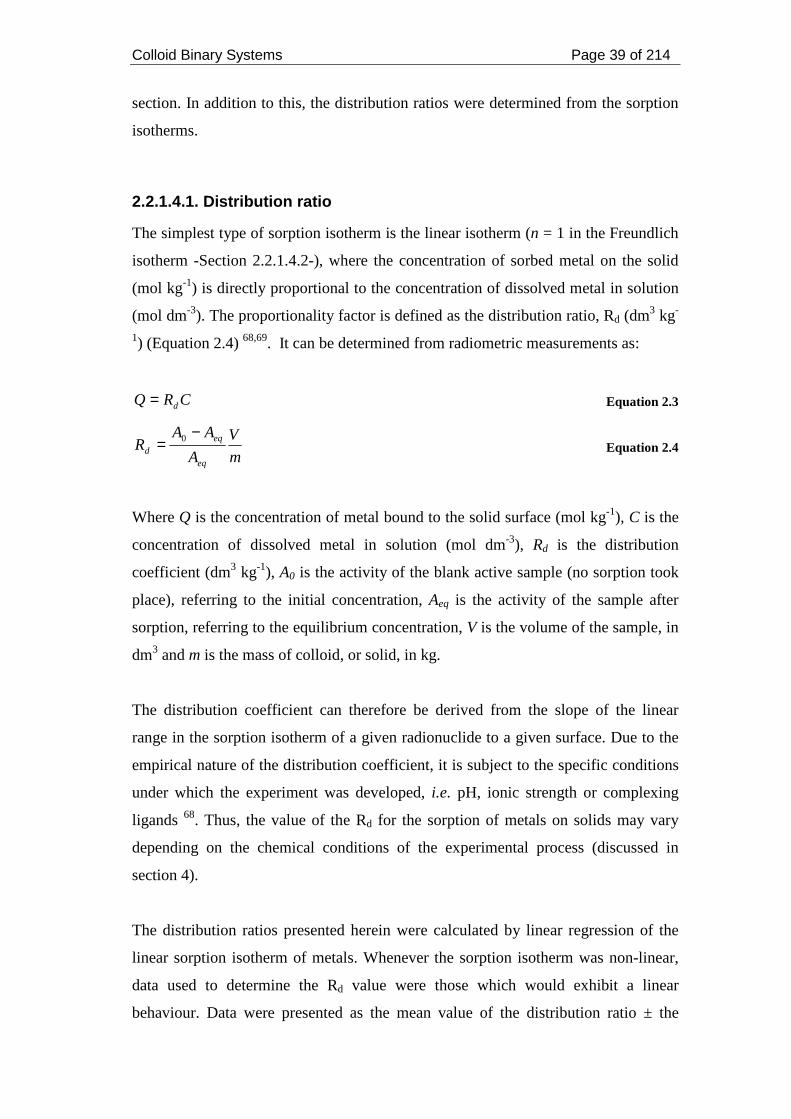
Colloid Binary Systems Page 39 of 214
section. In addition to this, the distribution ratios were determined from the sorption
isotherms.
2.2.1.4.1. Distribution ratio
The simplest type of sorption isotherm is the linear isotherm (n = 1 in the Freundlich
isotherm -Section 2.2.1.4.2-), where the concentration of sorbed metal on the solid
(mol kg-1) is directly proportional to the concentration of dissolved metal in solution
(mol dm-3). The proportionality factor is defined as the distribution ratio, Rd (dm3 kg-
1) (Equation 2.4) 68,69. It can be determined from radiometric measurements as:
CRQ d= Equation 2.3
m
V
A
AAR
eq
eqd
−= 0 Equation 2.4
Where Q is the concentration of metal bound to the solid surface (mol kg-1), C is the
concentration of dissolved metal in solution (mol dm-3), Rd is the distribution
coefficient (dm3 kg-1), A0 is the activity of the blank active sample (no sorption took
place), referring to the initial concentration, Aeq is the activity of the sample after
sorption, referring to the equilibrium concentration, V is the volume of the sample, in
dm3 and m is the mass of colloid, or solid, in kg.
The distribution coefficient can therefore be derived from the slope of the linear
range in the sorption isotherm of a given radionuclide to a given surface. Due to the
empirical nature of the distribution coefficient, it is subject to the specific conditions
under which the experiment was developed, i.e. pH, ionic strength or complexing
ligands 68. Thus, the value of the Rd for the sorption of metals on solids may vary
depending on the chemical conditions of the experimental process (discussed in
section 4).
The distribution ratios presented herein were calculated by linear regression of the
linear sorption isotherm of metals. Whenever the sorption isotherm was non-linear,
data used to determine the Rd value were those which would exhibit a linear
behaviour. Data were presented as the mean value of the distribution ratio ± the
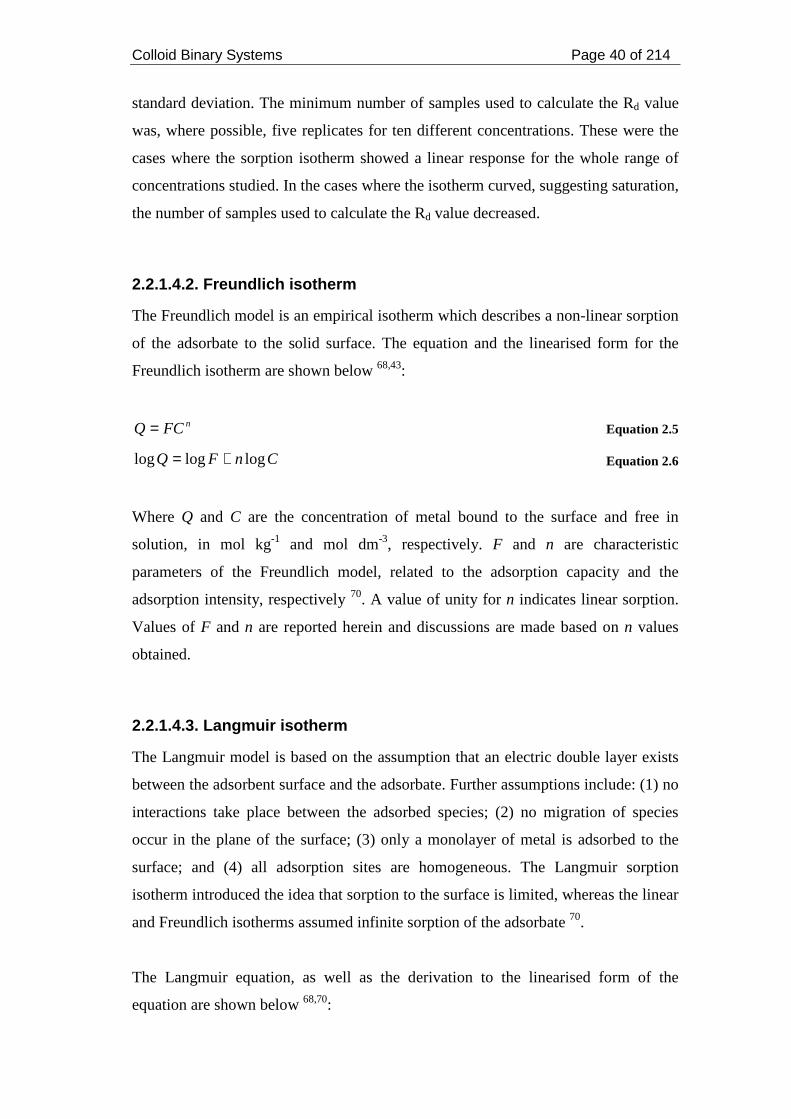
Colloid Binary Systems Page 40 of 214
standard deviation. The minimum number of samples used to calculate the Rd value
was, where possible, five replicates for ten different concentrations. These were the
cases where the sorption isotherm showed a linear response for the whole range of
concentrations studied. In the cases where the isotherm curved, suggesting saturation,
the number of samples used to calculate the Rd value decreased.
2.2.1.4.2. Freundlich isotherm
The Freundlich model is an empirical isotherm which describes a non-linear sorption
of the adsorbate to the solid surface. The equation and the linearised form for the
Freundlich isotherm are shown below 68,43:
nFCQ = Equation 2.5
CnFQ logloglog += Equation 2.6
Where Q and C are the concentration of metal bound to the surface and free in
solution, in mol kg-1 and mol dm-3, respectively. F and n are characteristic
parameters of the Freundlich model, related to the adsorption capacity and the
adsorption intensity, respectively 70. A value of unity for n indicates linear sorption.
Values of F and n are reported herein and discussions are made based on n values
obtained.
2.2.1.4.3. Langmuir isotherm
The Langmuir model is based on the assumption that an electric double layer exists
between the adsorbent surface and the adsorbate. Further assumptions include: (1) no
interactions take place between the adsorbed species; (2) no migration of species
occur in the plane of the surface; (3) only a monolayer of metal is adsorbed to the
surface; and (4) all adsorption sites are homogeneous. The Langmuir sorption
isotherm introduced the idea that sorption to the surface is limited, whereas the linear
and Freundlich isotherms assumed infinite sorption of the adsorbate 70.
The Langmuir equation, as well as the derivation to the linearised form of the
equation are shown below 68,70:
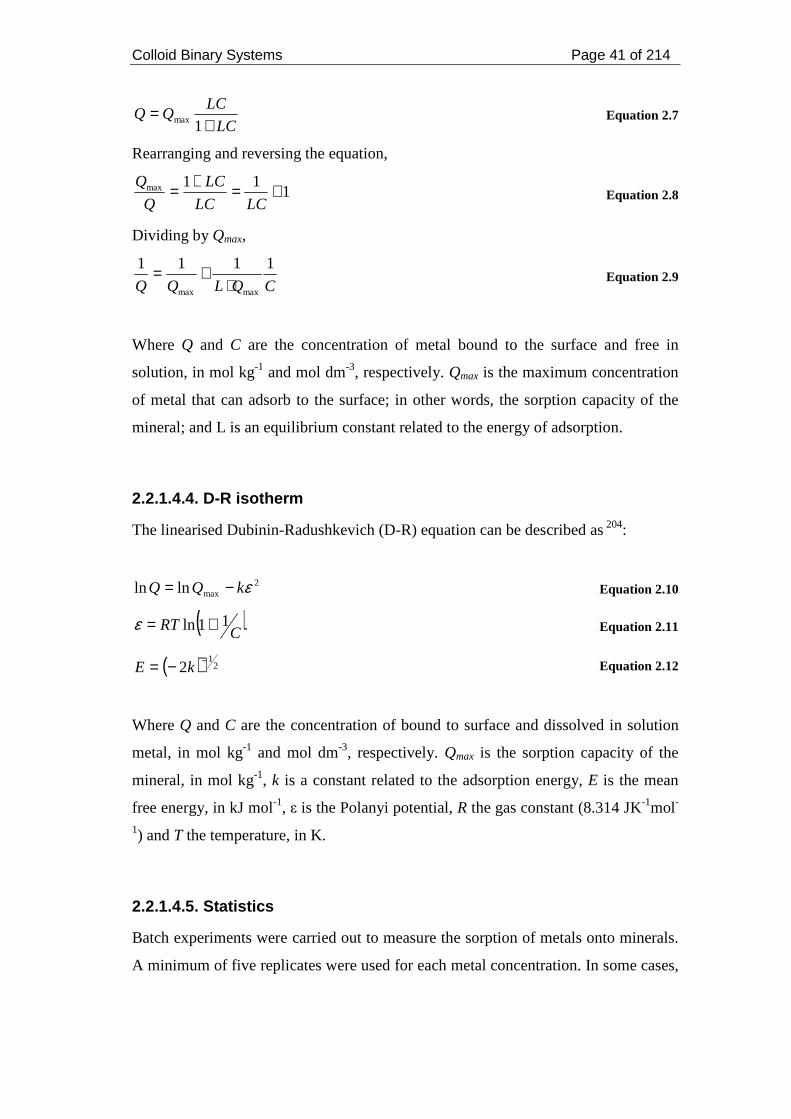
Colloid Binary Systems Page 41 of 214
LC
LCQQ
+=
1max Equation 2.7
Rearranging and reversing the equation,
111max +=+=
LCLC
LC
Q
Q Equation 2.8
Dividing by Qmax,
CQLQQ
1111
maxmax ⋅+= Equation 2.9
Where Q and C are the concentration of metal bound to the surface and free in
solution, in mol kg-1 and mol dm-3, respectively. Qmax is the maximum concentration
of metal that can adsorb to the surface; in other words, the sorption capacity of the
mineral; and L is an equilibrium constant related to the energy of adsorption.
2.2.1.4.4. D-R isotherm
The linearised Dubinin-Radushkevich (D-R) equation can be described as 204:
2maxlnln εkQQ −= Equation 2.10
( )CRT 11ln +=ε Equation 2.11
( ) 21
2 −−= kE Equation 2.12
Where Q and C are the concentration of bound to surface and dissolved in solution
metal, in mol kg-1 and mol dm-3, respectively. Qmax is the sorption capacity of the
mineral, in mol kg-1, k is a constant related to the adsorption energy, E is the mean
free energy, in kJ mol-1, ε is the Polanyi potential, R the gas constant (8.314 JK-1mol-
1) and T the temperature, in K.
2.2.1.4.5. Statistics
Batch experiments were carried out to measure the sorption of metals onto minerals.
A minimum of five replicates were used for each metal concentration. In some cases,
Colloid Binary Systems Page 42 of 214
up to eight replicates were used. The radioactivity of the samples was measured to a
2σ error.
The concentrations of dissolved metal in solution and surface-bound metal were
determined mathematically from the measured activity values. The mean and
standard deviation of these concentrations were determined from the number of
replicates used in the batch experiment.
The Rd values presented are shown as SDRd ± where dR is the mean value obtained
for the distribution ratio and SD is the standard deviation. Both values were
determined by applying the linear regression method. The same method was applied
to determine the standard deviation of characteristic parameters of the Freundlich,
Langmuir and D-R isotherms.
2.2.2. Generation and stability of colloids
2.2.2.1. Boehmite
Boehmite colloids were used as provided with no treatment prior to their use, except
dilution. Initial measurements of average size and particle counts per second were
carried out to find the concentration of boehmite colloids to be used in sorption
experiments.
Characterisation and stability of boehmite colloids was carried out by measuring the
average size, particle counts and zeta potential. This last parameter was measured as
a function of pH in a wide range of pHs and ionic strengths.
Separation of colloids from solution was achieved by centrifugation of samples at
6000 rpm. An experiment was carried out whereby samples of boehmite colloids
were centrifuged for different times, ranging from 0 to 50 minutes and recording the
average size after the test.
Colloid Binary Systems Page 43 of 214
2.2.2.2. Montmorillonite
Montmorillonite colloids were extracted by repeatedly washing Montmorillonite K-
10 (Aldrich) with 25 cm3 aliquots of 0.05 mol dm-3 NaCl, combined with filtration
and centrifugation. The filtrate was measured with dynamic light scattering (DLS)
for average size and particle counts.
Montmorillonite colloids were characterised by DLS and zeta potential. The stability
of the obtained colloids was measured as a function of pH and ionic strength.
2.2.3. Sorption and desorption experiments
The study of the interactions between metals and minerals was performed by
investigating the sorption and later desorption of metals from colloidal and solid
surfaces by using batch experiments. The experimental procedure and the results are
shown first for the colloidal phase of each mineral and then for the solid phase. The
desorption experiments are then detailed.
2.2.3.1. Sorption experiments
The sorption of metals onto colloids was studied using three different metals, Cs, Ni
and Eu, which are mono-, di- and trivalent, respectively; and two different colloids,
boehmite and montmorillonite.
The experimental procedure for sorption onto colloids and solids was slightly
different.
Sorption onto colloids
10 cm3 of colloid suspension were pipetted into 15 cm3 polypropylene centrifuge
tubes, along with 1 cm3 of metal solution, buffer and background electrolyte. The pH
was adjusted to 7 by adding small volumes of NaOH or HCl. The suspensions were
then spiked with 100 µL of a radioactive tracer (approximately 0.83 KBq) and left to
equilibrate for 24 hours. After the equilibrating period, the samples were centrifuged
in a Hermle Z206A for 30 minutes at 6000 rpm. Control experiments showed that
this time was sufficient for the colloids to be separated from the bulk. To further
ensure this separation, prior to the radiometric measurement of the solution, the
Colloid Binary Systems Page 44 of 214
samples were filtered using 0.45 µm Elkay filters. The 24 hour contact time was
chosen following previous experiments carried out at Loughborough University 71.
Sorption onto solids
The procedure was the same as that used for colloids except that the solid was
weighed into the centrifuge tubes. To keep the solid to liquid ratio similar to the
adsorption carried out on colloids, aproximately 30 mg of solid were weighed into
the vessels. In several sets, the influence of the amount of solid on the sorption of
metals was tested.
Experimental conditions
pH and ionic strength were kept constant in all batch experiments. However, the
influence of other parameters was assessed:
• The influence of the solid to liquid ratio was studied by changing the colloid
concentration in suspension: it varied from 15 to 54 mg of colloid present in
the 10 cm3, in different batch experiments to study the influence of the
colloidal concentration. This concentration was measured gravimetrically.
The colloid concentration will be clearly stated in the results for ease of
interpretation.
• The influence of background electrolyte on the sorption of Cs and Ni onto
boehmite colloids was studied by batch experiments, using the same
procedure as the one described previously.
Control experiments
The pH of the samples was adjusted to 7.0 ± 0.1 prior to leaving the samples to
equilibrate, followed by monitoring of the pH after the equilibration period. As an
example, the sorption of Ni onto solid montmorillonite was tested in the presence
and in the absence of MES, noting the evolution of the pH.
On conclusion of the equilibration period, separation of the colloidal phase from the
solution took place by centrifugation and later filtration. The filters were tested for
radioactivity retention. Furthermore, filters of 0.45 and 0.22 µm pores were used. A
separate test was carried out to study any differences on the sorption.
Colloid Binary Systems Page 45 of 214
2.2.3.2. Desorption experiments
Reversibility of the sorption of metals onto colloids and solids was studied by
performing three consecutive desorptions after the sorption experiments. The
procedure was carried out equally on the experiments for colloidal and solid surfaces.
At the end of the sorption experiments, an aliquot of background electrolyte
containing buffer solution was added to the centrifuge tubes in order to restore the
initial solid to liquid ratio. The colloids were resuspended by briefly sonicating and
then left to equilibrate for 24 hours. After the equilibration period, the samples were
subjected to the separation process as explained in the adsorption section. The
desorption experiments were carried out carefully to reproduce the same conditions
as the sorption experiments, to minimise the effect of experimental differences
between sorption and desorption.
2.2.4. Surface area measurements
An extensive study of the surface of boehmite, both colloids and solid, was carried
out by measuring the surface area, proton and cation exchange capacities.
Spectroscopic techniques were used on both phases of boehmite, aiming to see
differences on the surface of the colloid and the solid. With this purpose, both SEM
and X-ray Powder Diffraction (XRD) techniques were used on both phases of the
mineral.
2.2.4.1. Specific surface area
The specific surface area (SSA) can be defined as the ratio of the surface area of a
solid surface and its mass; the former accounts for all sites accesible for cations in
the inner surfaces 72. The units of the SSA are m2 g-1.
The most common method used to measure the SSA of solids is the BET method 73,
which consists of the measurement of the amount of adsorbed nitrogen gas required
to cover the solid surface with a complete monolayer. The surface area is determined
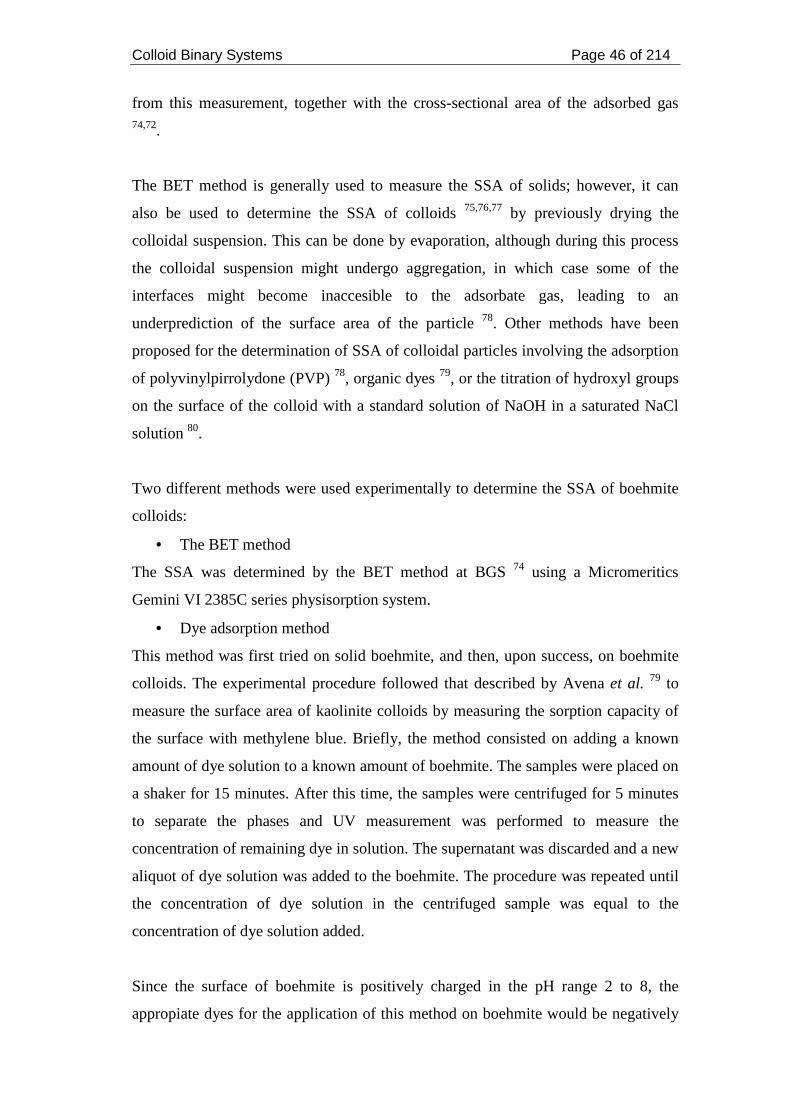
Colloid Binary Systems Page 46 of 214
from this measurement, together with the cross-sectional area of the adsorbed gas 74,72.
The BET method is generally used to measure the SSA of solids; however, it can
also be used to determine the SSA of colloids 75,76,77 by previously drying the
colloidal suspension. This can be done by evaporation, although during this process
the colloidal suspension might undergo aggregation, in which case some of the
interfaces might become inaccesible to the adsorbate gas, leading to an
underprediction of the surface area of the particle 78. Other methods have been
proposed for the determination of SSA of colloidal particles involving the adsorption
of polyvinylpirrolydone (PVP) 78, organic dyes 79, or the titration of hydroxyl groups
on the surface of the colloid with a standard solution of NaOH in a saturated NaCl
solution 80.
Two different methods were used experimentally to determine the SSA of boehmite
colloids:
• The BET method
The SSA was determined by the BET method at BGS 74 using a Micromeritics
Gemini VI 2385C series physisorption system.
• Dye adsorption method
This method was first tried on solid boehmite, and then, upon success, on boehmite
colloids. The experimental procedure followed that described by Avena et al. 79 to
measure the surface area of kaolinite colloids by measuring the sorption capacity of
the surface with methylene blue. Briefly, the method consisted on adding a known
amount of dye solution to a known amount of boehmite. The samples were placed on
a shaker for 15 minutes. After this time, the samples were centrifuged for 5 minutes
to separate the phases and UV measurement was performed to measure the
concentration of remaining dye in solution. The supernatant was discarded and a new
aliquot of dye solution was added to the boehmite. The procedure was repeated until
the concentration of dye solution in the centrifuged sample was equal to the
concentration of dye solution added.
Since the surface of boehmite is positively charged in the pH range 2 to 8, the
appropiate dyes for the application of this method on boehmite would be negatively
Colloid Binary Systems Page 47 of 214
charged. The following dyes were tried: diphenylsulfoxide (DPSO), 4-
nitrobenzylalcohol (4NBA), 3-nitrophenol (3NP) and ponceau S (structures shown in
Figure 4).
Diphenylsulfoxide
(DPSO)
4-nitrobenzylalcohol (4NBA)
3-nitrophenol
(3NP)
Ponceau S
Figure 4. Organic dyes used in the surface area measurement of boehmite colloids.
2.2.4.2. Exchange capacity measurements
Other parameters indicative of the surface area of the colloids are the proton and
cation exchange capacities, PEC and CEC, respectively. Both properties were
measured for boehmite using the methods described in detail below.
2.2.4.2.1. Proton exchange capacity
The PEC method used in this investigation was modified from that described by He
et al. 81 in order to prevent the colloids from flocculating. The method developed
consisted of the titration of boehmite in 0.05 mol dm-3 NaCl. The pH of the
suspension was taken to 3 with 0.01 mol dm-3 HCl and then titrated to pH 8 with 0.01
mol dm-3 NaOH. The pH was not increased above pH 8 so as to avoid flocculation of
boehmite colloids. Once the suspension was at pH 8, it was back-titrated to pH 3.5
Colloid Binary Systems Page 48 of 214
with 0.01 mol dm-3 HCl. The system tended to buffer at pH 3.5. The moles used to
titrate (nOH) and backtitrate (nH) could be calculated from the volume used. The PEC
was calculated as 81:
boehmiteg
sitesmolHPEC
+
= Equation 2.13
HOH nnsitesmolH −=+ Equation 2.14
In the case of the solid, 1.5 g were used in the experiment. In the case of the colloids,
the gravimetric analysis of the sample showed that 0.496 g were titrated.
2.2.4.2.2. Cation exchange capacity
The CEC is defined as the capacity of a mineral, clay or soil to sorb cations which
can later be exchanged by other cations in solution 82. Many methods have been
proposed for the measurement of this fundamental property of clays 83,84. The
cobaltihexamine chloride method was chosen to measure the CEC of the minerals
used herein.
The method is based on spectrometrically measuring the concentration of
Co(NH3)63+ before and after it was contacted with the mineral. UV absorbance was
measured at 472 nm. In detail, 40 cm3 of 0.0167 mol dm-3 Co(NH3)6Cl3 were added
to 2 g of mineral. The resulting suspension was shaken for one hour, after which
centrifugation at 6000 rpm took place for 10 minutes. An aliquot of the supernatant
was filtered through 0.22 µm filters and the absorbance measured. The CEC was
calculated as 85:
100500
0 ×××
−=
m
V
A
AACEC i Equation 2.15
Where A0 is the absorbance of the Co(NH3)6Cl3 sample, Ai is the absorbance of the
sample after shaking for one hour, V is the volume of sample, in cm3, and m is the
mass of boehmite, in g. The CEC was calculated in units of meq g-1.
Colloid Binary Systems Page 49 of 214
2.2.4.2.3. SEM and XRD powder diffraction
Part of this investigation included assessing the differences in surfaces between the
colloidal and the solid phase of boehmite. For this purpose, SEM images were taken
aiming to observe physical differences in the surface of the colloidal and solid phases
of boehmite.
XRD diffraction patterns were taken after the sorption processes of either metals or
HA had taken place, aiming to find alterations in the surface of boehmite due to the
sorption of metals or HA.
Sorption of metals on boehmite colloids was studied by radiometric batch
experiments. However, a batch of sorption experiments was carried out radiotracer-
free to measure any changes in the surface due to the presence of metals. These
changes were assessed by measuring XRD diffraction patterns and SEM images.
SEM measurements were carried out at BGS (Keyworth, UK) using a LEO (Zeiss)
435VP Variable Pressure Digital Scanning Electron Microscope (SEM). Powder
diffraction measurements were taken using Cu-Kα radiation (λ = 1.5418 Å) on a
Bruker D8 diffractometer in reflection geometry and a Braun position sensitive
detector. The sample was loaded onto a silicon zero background substrate and data
were collected in the range 5 < 2θ < 90° with a step time of 1 second and step width
of 0.014°.
2.3. Results
This section presents the results of the experiments detailed in section 2.2. The
characterisation of colloids, along with the analysis of the stability are presented. An
understanding of the conditions in which colloids were stable was fundamental for
the batch sorption and desorption study. Those sorption experiments were performed
always at the same pH and ionic strength. However, other factors influencing the
sorption of metals on colloids were investigated, e.g. the solid to liquid ratio or the
background electrolyte.
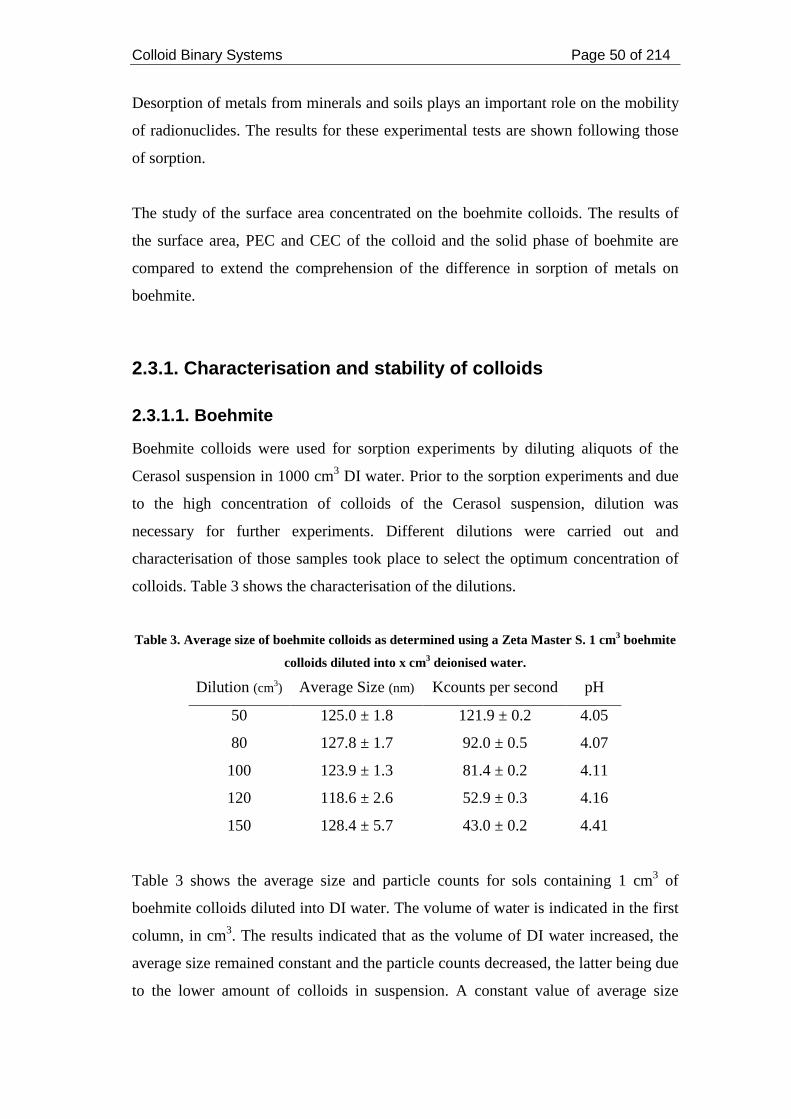
Colloid Binary Systems Page 50 of 214
Desorption of metals from minerals and soils plays an important role on the mobility
of radionuclides. The results for these experimental tests are shown following those
of sorption.
The study of the surface area concentrated on the boehmite colloids. The results of
the surface area, PEC and CEC of the colloid and the solid phase of boehmite are
compared to extend the comprehension of the difference in sorption of metals on
boehmite.
2.3.1. Characterisation and stability of colloids
2.3.1.1. Boehmite
Boehmite colloids were used for sorption experiments by diluting aliquots of the
Cerasol suspension in 1000 cm3 DI water. Prior to the sorption experiments and due
to the high concentration of colloids of the Cerasol suspension, dilution was
necessary for further experiments. Different dilutions were carried out and
characterisation of those samples took place to select the optimum concentration of
colloids. Table 3 shows the characterisation of the dilutions.
Table 3. Average size of boehmite colloids as determined using a Zeta Master S. 1 cm3 boehmite
colloids diluted into x cm3 deionised water.
Dilution (cm3) Average Size (nm) Kcounts per second pH
50 125.0 ± 1.8 121.9 ± 0.2 4.05
80 127.8 ± 1.7 92.0 ± 0.5 4.07
100 123.9 ± 1.3 81.4 ± 0.2 4.11
120 118.6 ± 2.6 52.9 ± 0.3 4.16
150 128.4 ± 5.7 43.0 ± 0.2 4.41
Table 3 shows the average size and particle counts for sols containing 1 cm3 of
boehmite colloids diluted into DI water. The volume of water is indicated in the first
column, in cm3. The results indicated that as the volume of DI water increased, the
average size remained constant and the particle counts decreased, the latter being due
to the lower amount of colloids in suspension. A constant value of average size
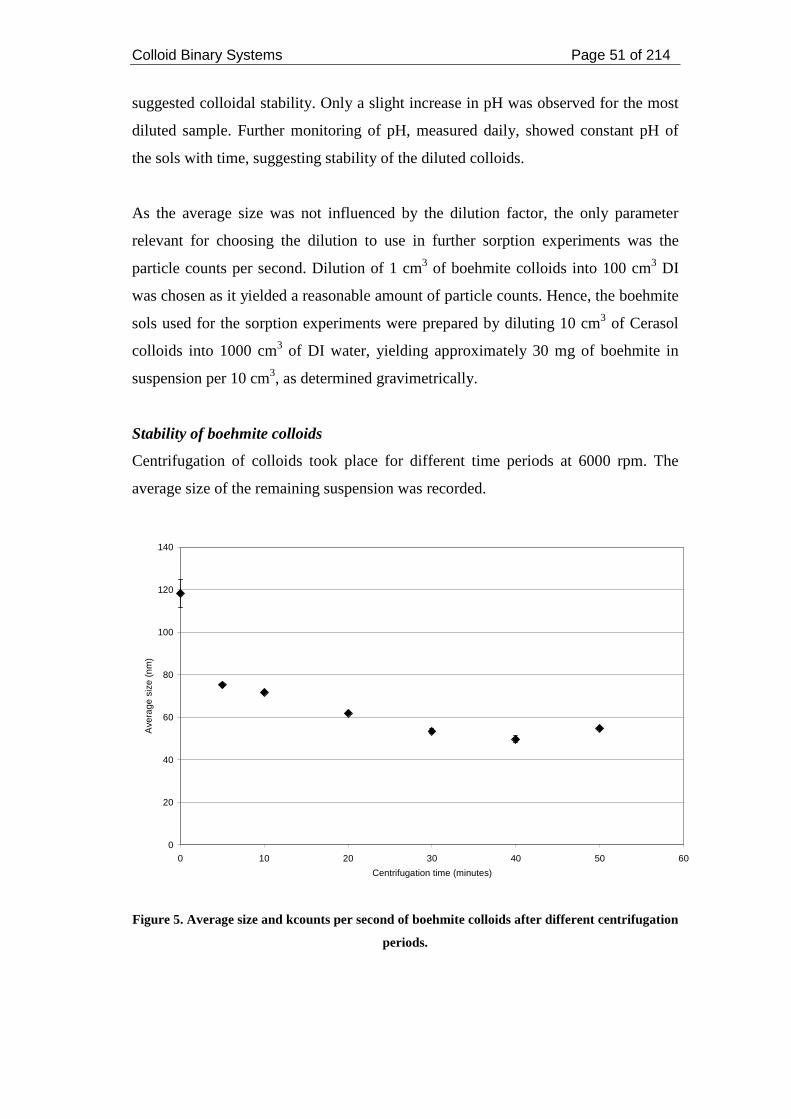
Colloid Binary Systems Page 51 of 214
suggested colloidal stability. Only a slight increase in pH was observed for the most
diluted sample. Further monitoring of pH, measured daily, showed constant pH of
the sols with time, suggesting stability of the diluted colloids.
As the average size was not influenced by the dilution factor, the only parameter
relevant for choosing the dilution to use in further sorption experiments was the
particle counts per second. Dilution of 1 cm3 of boehmite colloids into 100 cm3 DI
was chosen as it yielded a reasonable amount of particle counts. Hence, the boehmite
sols used for the sorption experiments were prepared by diluting 10 cm3 of Cerasol
colloids into 1000 cm3 of DI water, yielding approximately 30 mg of boehmite in
suspension per 10 cm3, as determined gravimetrically.
Stability of boehmite colloids
Centrifugation of colloids took place for different time periods at 6000 rpm. The
average size of the remaining suspension was recorded.
0
20
40
60
80
100
120
140
0 10 20 30 40 50 60
Centrifugation time (minutes)
Ave
rage
siz
e (n
m)
Figure 5. Average size and kcounts per second of boehmite colloids after different centrifugation
periods.
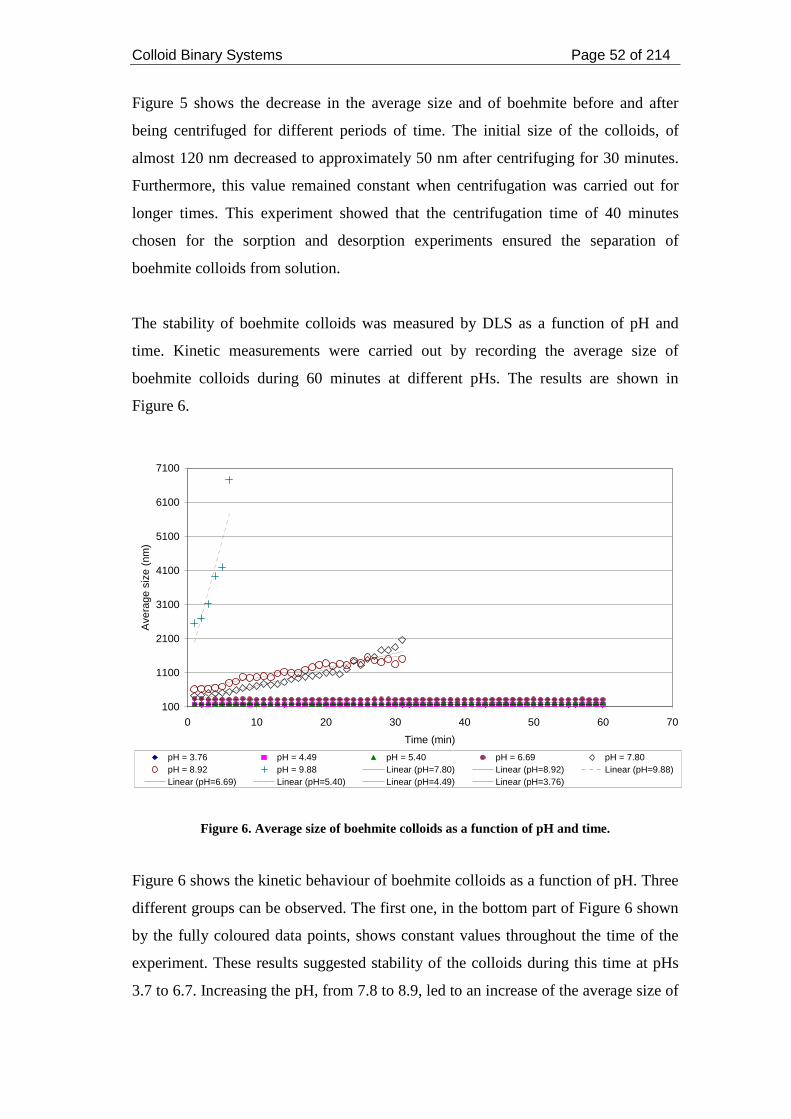
Colloid Binary Systems Page 52 of 214
Figure 5 shows the decrease in the average size and of boehmite before and after
being centrifuged for different periods of time. The initial size of the colloids, of
almost 120 nm decreased to approximately 50 nm after centrifuging for 30 minutes.
Furthermore, this value remained constant when centrifugation was carried out for
longer times. This experiment showed that the centrifugation time of 40 minutes
chosen for the sorption and desorption experiments ensured the separation of
boehmite colloids from solution.
The stability of boehmite colloids was measured by DLS as a function of pH and
time. Kinetic measurements were carried out by recording the average size of
boehmite colloids during 60 minutes at different pHs. The results are shown in
Figure 6.
100
1100
2100
3100
4100
5100
6100
7100
0 10 20 30 40 50 60 70
Time (min)
Ave
rage
siz
e (n
m)
pH = 3.76 pH = 4.49 pH = 5.40 pH = 6.69 pH = 7.80pH = 8.92 pH = 9.88 Linear (pH=7.80) Linear (pH=8.92) Linear (pH=9.88)Linear (pH=6.69) Linear (pH=5.40) Linear (pH=4.49) Linear (pH=3.76)
Figure 6. Average size of boehmite colloids as a function of pH and time.
Figure 6 shows the kinetic behaviour of boehmite colloids as a function of pH. Three
different groups can be observed. The first one, in the bottom part of Figure 6 shown
by the fully coloured data points, shows constant values throughout the time of the
experiment. These results suggested stability of the colloids during this time at pHs
3.7 to 6.7. Increasing the pH, from 7.8 to 8.9, led to an increase of the average size of
Colloid Binary Systems Page 53 of 214
the colloids with time, suggesting that boehmite colloids were no longer stable, but
particles were slowly flocculating. A further increase of the pH, to pH 10, showed a
rapid increase of average size with time, indicating almost immediate flocculation of
the colloids.
Summarising, Figure 6 indicated that stability of the colloids was ensured at acidic to
neutral pHs, but colloids were no longer stable at alkaline pHs. This pattern was also
shown by the zeta potential, shown in Figure 7.
-30
-20
-10
0
10
20
30
40
50
0 2 4 6 8 10 12 14
pH
Zet
a po
tent
ial (
mV
)
Zeta potential 1 Zeta potential 2
Figure 7. Zeta potential of boehmite colloids as a function of pH, for two samples of boehmite
colloids.
Figure 7 shows the zeta potential of two samples of boehmite colloids across a wide
range of pHs. The zeta potential was positive in the acidic and neutral range,
becoming negative at pHs above approximately 8.5 (isoelectric point), in agreement
with previous literature 86,87,88.
As the sorption experiments investigated were those where Cs, Ni and Eu were
added to boehmite colloids at different concentrations, the measurement of the zeta
potential of boehmite colloids in the presence of metals was carried out at pH 7
(Figure 8).
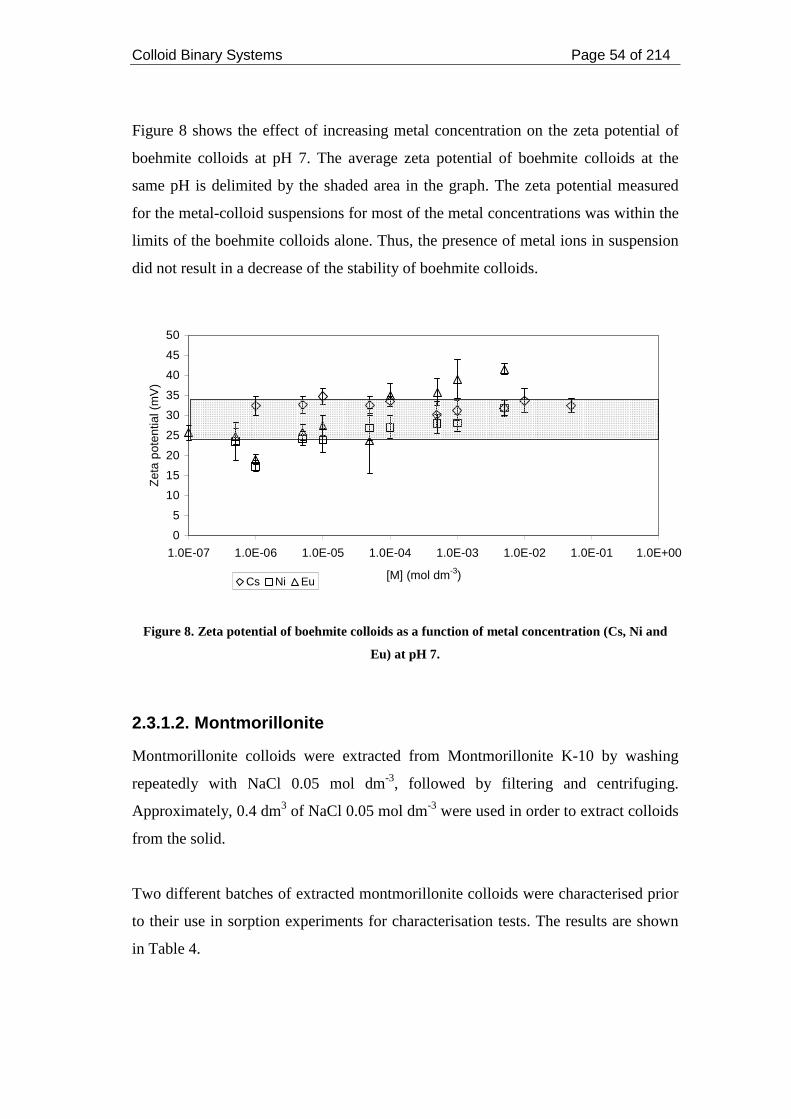
Colloid Binary Systems Page 54 of 214
Figure 8 shows the effect of increasing metal concentration on the zeta potential of
boehmite colloids at pH 7. The average zeta potential of boehmite colloids at the
same pH is delimited by the shaded area in the graph. The zeta potential measured
for the metal-colloid suspensions for most of the metal concentrations was within the
limits of the boehmite colloids alone. Thus, the presence of metal ions in suspension
did not result in a decrease of the stability of boehmite colloids.
0
5
10
15
20
25
30
35
40
45
50
1.0E-07 1.0E-06 1.0E-05 1.0E-04 1.0E-03 1.0E-02 1.0E-01 1.0E+00
[M] (mol dm-3)
Zet
a po
tent
ial (
mV
)
Cs Ni Eu
Figure 8. Zeta potential of boehmite colloids as a function of metal concentration (Cs, Ni and
Eu) at pH 7.
2.3.1.2. Montmorillonite
Montmorillonite colloids were extracted from Montmorillonite K-10 by washing
repeatedly with NaCl 0.05 mol dm-3, followed by filtering and centrifuging.
Approximately, 0.4 dm3 of NaCl 0.05 mol dm-3 were used in order to extract colloids
from the solid.
Two different batches of extracted montmorillonite colloids were characterised prior
to their use in sorption experiments for characterisation tests. The results are shown
in Table 4.
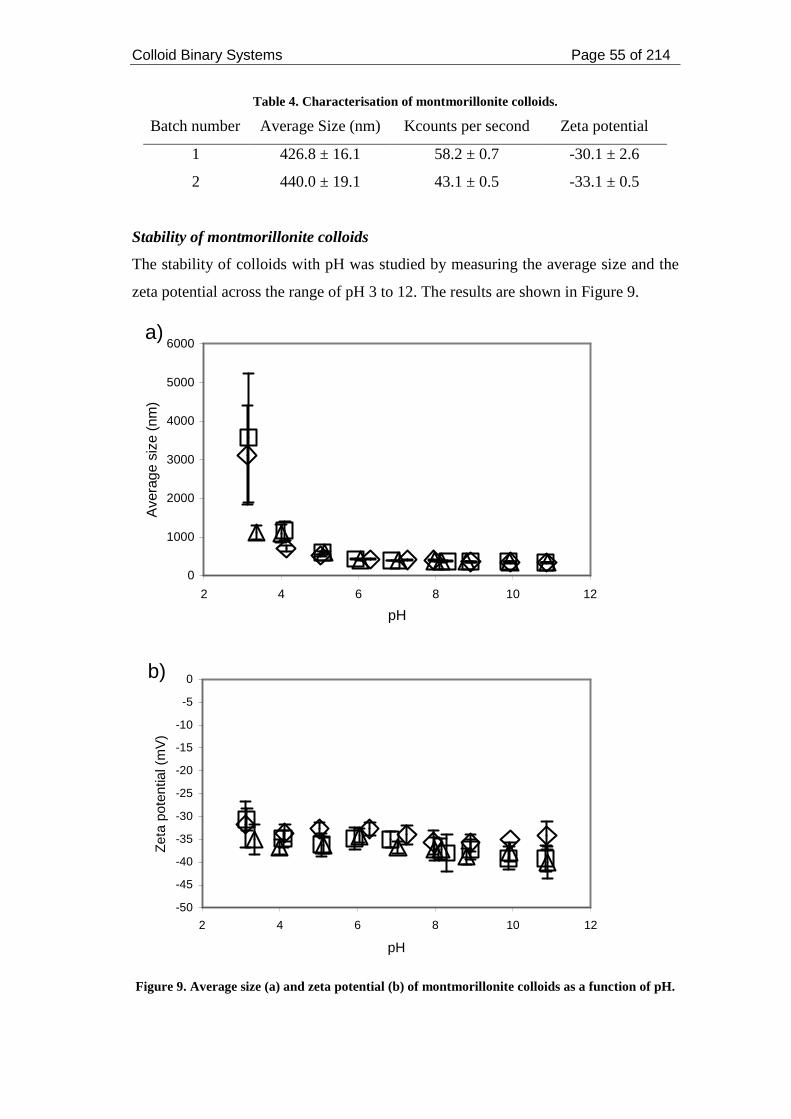
Colloid Binary Systems Page 55 of 214
Table 4. Characterisation of montmorillonite colloids.
Batch number Average Size (nm) Kcounts per second Zeta potential
1 426.8 ± 16.1 58.2 ± 0.7 -30.1 ± 2.6
2 440.0 ± 19.1 43.1 ± 0.5 -33.1 ± 0.5
Stability of montmorillonite colloids
The stability of colloids with pH was studied by measuring the average size and the
zeta potential across the range of pH 3 to 12. The results are shown in Figure 9.
0
1000
2000
3000
4000
5000
6000
2 4 6 8 10 12
pH
Ave
rage
siz
e (n
m)
a)
-50
-45
-40
-35
-30
-25
-20
-15
-10
-5
0
2 4 6 8 10 12
pH
Zet
a po
tent
ial (
mV
)
b)
Figure 9. Average size (a) and zeta potential (b) of montmorillonite colloids as a function of pH.
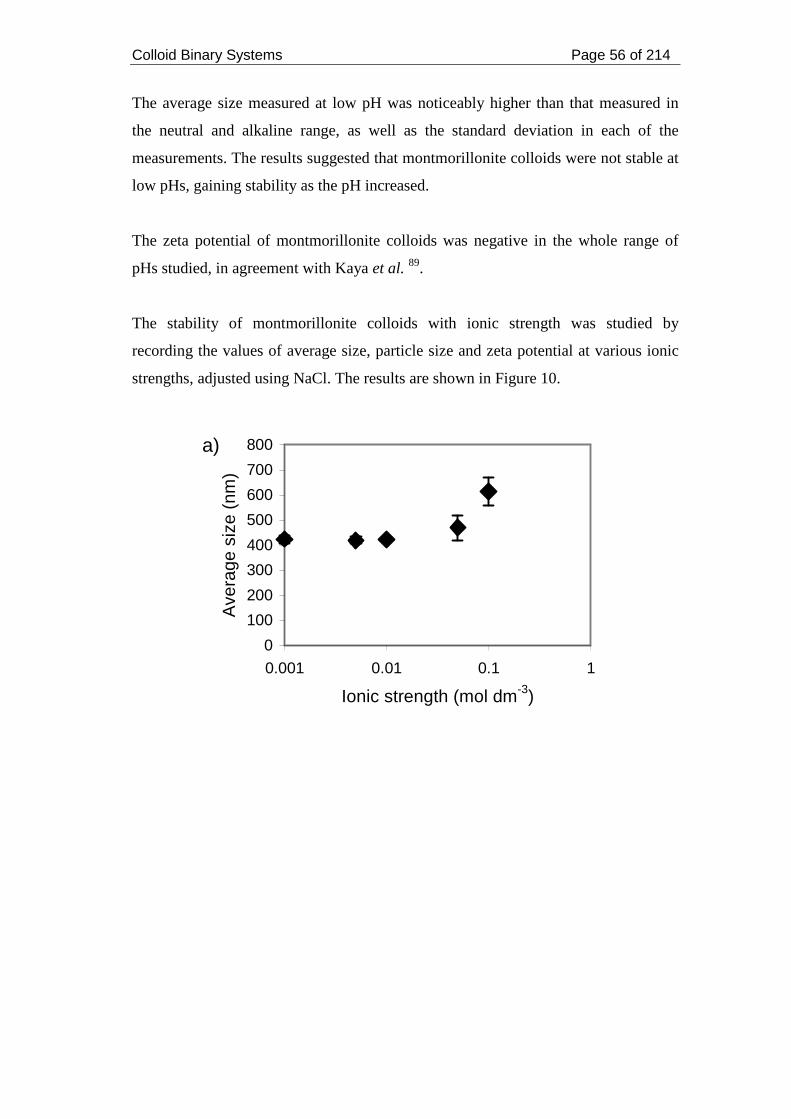
Colloid Binary Systems Page 56 of 214
The average size measured at low pH was noticeably higher than that measured in
the neutral and alkaline range, as well as the standard deviation in each of the
measurements. The results suggested that montmorillonite colloids were not stable at
low pHs, gaining stability as the pH increased.
The zeta potential of montmorillonite colloids was negative in the whole range of
pHs studied, in agreement with Kaya et al. 89.
The stability of montmorillonite colloids with ionic strength was studied by
recording the values of average size, particle size and zeta potential at various ionic
strengths, adjusted using NaCl. The results are shown in Figure 10.
0
100
200
300
400
500
600
700
800
0.001 0.01 0.1 1
Ionic strength (mol dm-3)
Ave
rage
siz
e (n
m)
a)
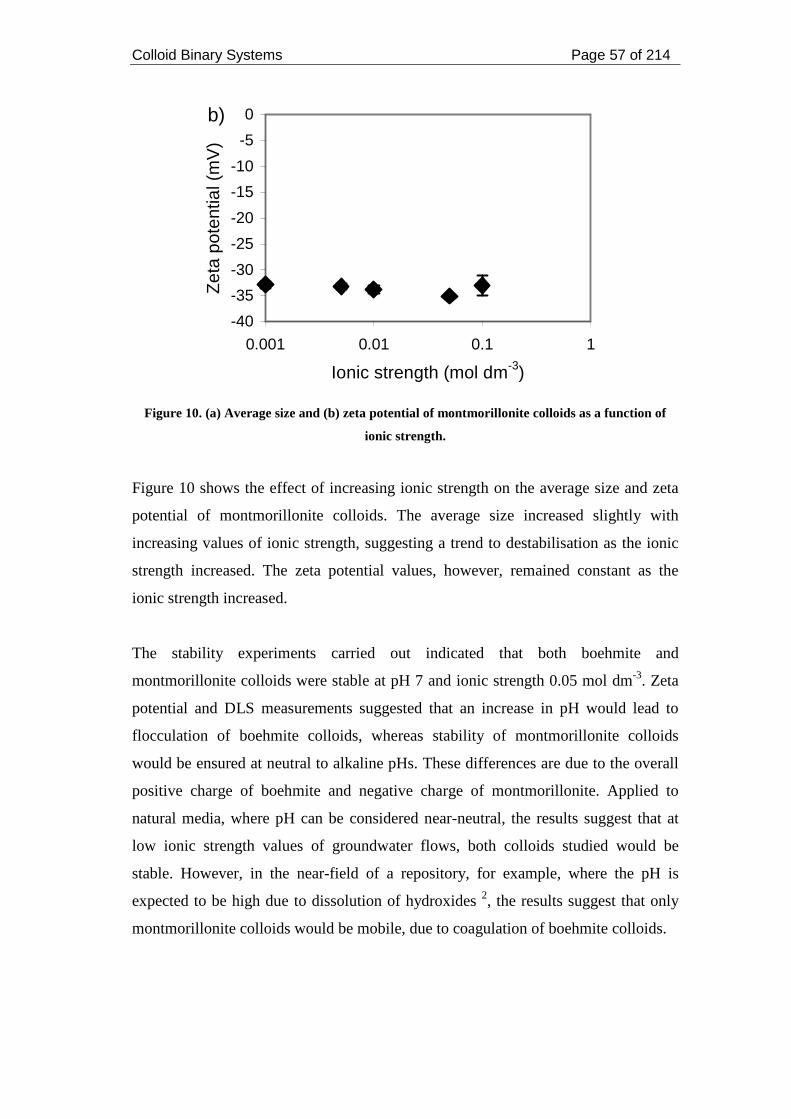
Colloid Binary Systems Page 57 of 214
-40
-35
-30
-25
-20
-15
-10
-5
0
0.001 0.01 0.1 1
Ionic strength (mol dm-3)
Zet
a po
tent
ial (
mV
)
b)
Figure 10. (a) Average size and (b) zeta potential of montmorillonite colloids as a function of
ionic strength.
Figure 10 shows the effect of increasing ionic strength on the average size and zeta
potential of montmorillonite colloids. The average size increased slightly with
increasing values of ionic strength, suggesting a trend to destabilisation as the ionic
strength increased. The zeta potential values, however, remained constant as the
ionic strength increased.
The stability experiments carried out indicated that both boehmite and
montmorillonite colloids were stable at pH 7 and ionic strength 0.05 mol dm-3. Zeta
potential and DLS measurements suggested that an increase in pH would lead to
flocculation of boehmite colloids, whereas stability of montmorillonite colloids
would be ensured at neutral to alkaline pHs. These differences are due to the overall
positive charge of boehmite and negative charge of montmorillonite. Applied to
natural media, where pH can be considered near-neutral, the results suggest that at
low ionic strength values of groundwater flows, both colloids studied would be
stable. However, in the near-field of a repository, for example, where the pH is
expected to be high due to dissolution of hydroxides 2, the results suggest that only
montmorillonite colloids would be mobile, due to coagulation of boehmite colloids.
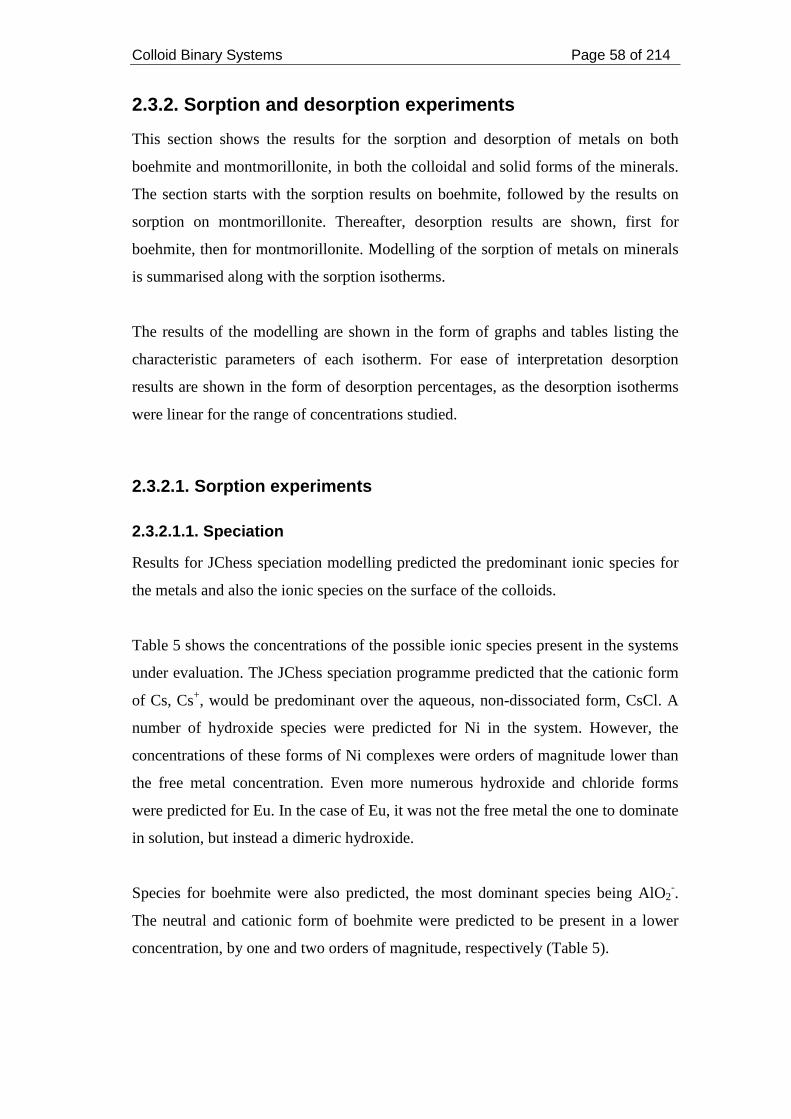
Colloid Binary Systems Page 58 of 214
2.3.2. Sorption and desorption experiments
This section shows the results for the sorption and desorption of metals on both
boehmite and montmorillonite, in both the colloidal and solid forms of the minerals.
The section starts with the sorption results on boehmite, followed by the results on
sorption on montmorillonite. Thereafter, desorption results are shown, first for
boehmite, then for montmorillonite. Modelling of the sorption of metals on minerals
is summarised along with the sorption isotherms.
The results of the modelling are shown in the form of graphs and tables listing the
characteristic parameters of each isotherm. For ease of interpretation desorption
results are shown in the form of desorption percentages, as the desorption isotherms
were linear for the range of concentrations studied.
2.3.2.1. Sorption experiments
2.3.2.1.1. Speciation
Results for JChess speciation modelling predicted the predominant ionic species for
the metals and also the ionic species on the surface of the colloids.
Table 5 shows the concentrations of the possible ionic species present in the systems
under evaluation. The JChess speciation programme predicted that the cationic form
of Cs, Cs+, would be predominant over the aqueous, non-dissociated form, CsCl. A
number of hydroxide species were predicted for Ni in the system. However, the
concentrations of these forms of Ni complexes were orders of magnitude lower than
the free metal concentration. Even more numerous hydroxide and chloride forms
were predicted for Eu. In the case of Eu, it was not the free metal the one to dominate
in solution, but instead a dimeric hydroxide.
Species for boehmite were also predicted, the most dominant species being AlO2-.
The neutral and cationic form of boehmite were predicted to be present in a lower
concentration, by one and two orders of magnitude, respectively (Table 5).
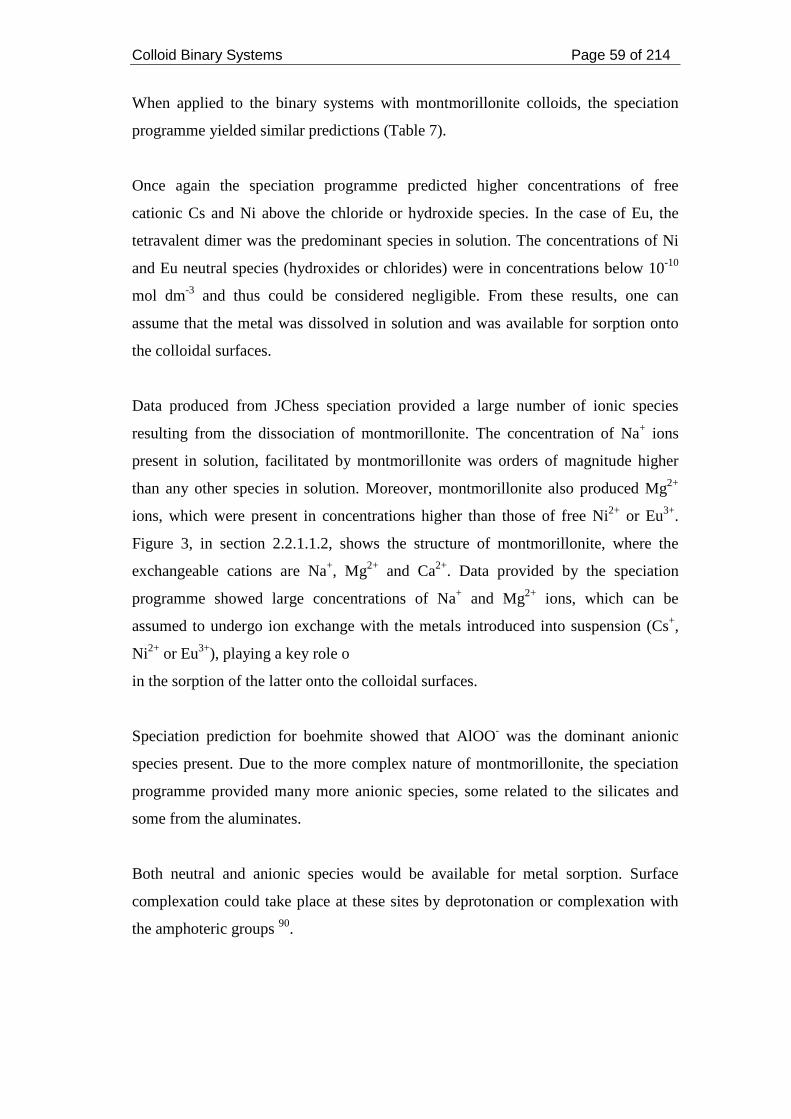
Colloid Binary Systems Page 59 of 214
When applied to the binary systems with montmorillonite colloids, the speciation
programme yielded similar predictions (Table 7).
Once again the speciation programme predicted higher concentrations of free
cationic Cs and Ni above the chloride or hydroxide species. In the case of Eu, the
tetravalent dimer was the predominant species in solution. The concentrations of Ni
and Eu neutral species (hydroxides or chlorides) were in concentrations below 10-10
mol dm-3 and thus could be considered negligible. From these results, one can
assume that the metal was dissolved in solution and was available for sorption onto
the colloidal surfaces.
Data produced from JChess speciation provided a large number of ionic species
resulting from the dissociation of montmorillonite. The concentration of Na+ ions
present in solution, facilitated by montmorillonite was orders of magnitude higher
than any other species in solution. Moreover, montmorillonite also produced Mg2+
ions, which were present in concentrations higher than those of free Ni2+ or Eu3+.
Figure 3, in section 2.2.1.1.2, shows the structure of montmorillonite, where the
exchangeable cations are Na+, Mg2+ and Ca2+. Data provided by the speciation
programme showed large concentrations of Na+ and Mg2+ ions, which can be
assumed to undergo ion exchange with the metals introduced into suspension (Cs+,
Ni2+ or Eu3+), playing a key role o
in the sorption of the latter onto the colloidal surfaces.
Speciation prediction for boehmite showed that AlOO- was the dominant anionic
species present. Due to the more complex nature of montmorillonite, the speciation
programme provided many more anionic species, some related to the silicates and
some from the aluminates.
Both neutral and anionic species would be available for metal sorption. Surface
complexation could take place at these sites by deprotonation or complexation with
the amphoteric groups 90.
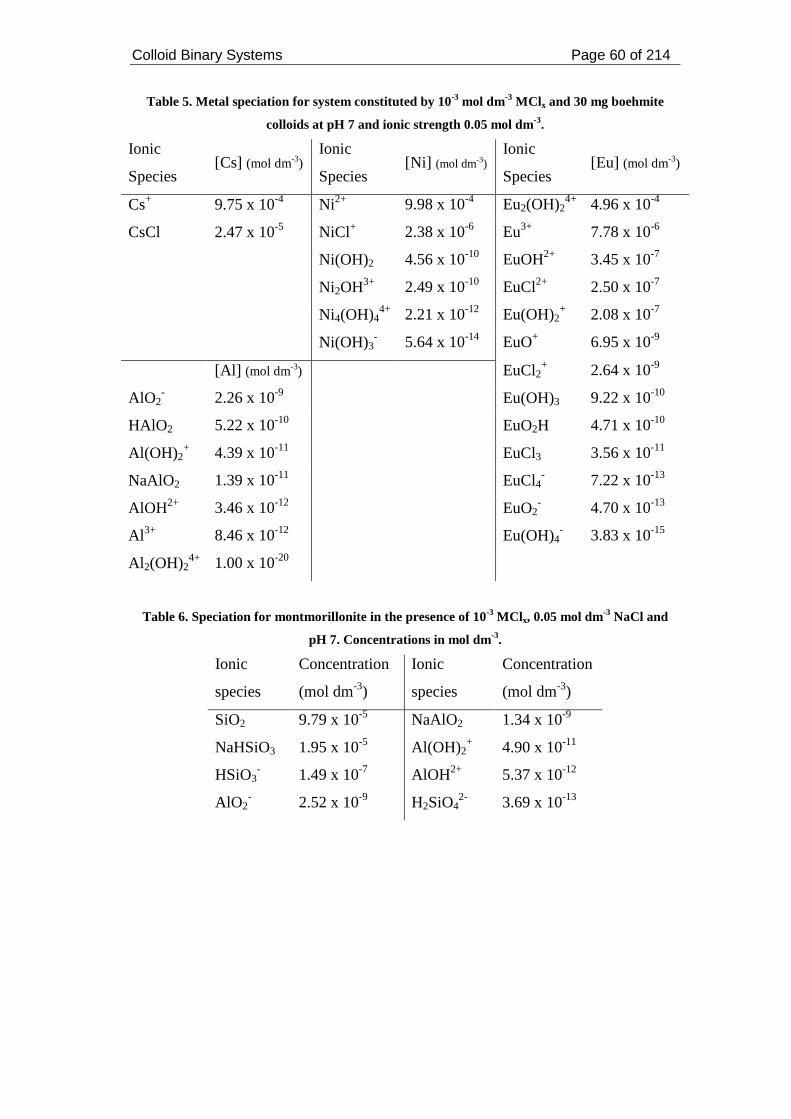
Colloid Binary Systems Page 60 of 214
Table 5. Metal speciation for system constituted by 10-3 mol dm-3 MCl x and 30 mg boehmite
colloids at pH 7 and ionic strength 0.05 mol dm-3.
Ionic
Species [Cs] (mol dm-3)
Ionic
Species [Ni] (mol dm-3)
Ionic
Species [Eu] (mol dm-3)
Cs+ 9.75 x 10⁻⁴ Ni2+ 9.98 x 10⁻⁴ Eu2(OH)24+ 4.96 x 10⁻⁴
CsCl 2.47 x 10⁻⁵ NiCl+ 2.38 x 10⁻⁶ Eu3+ 7.78 x 10⁻⁶
Ni(OH)2 4.56 x 10⁻¹⁰ EuOH2+ 3.45 x 10⁻⁷
Ni2OH3+ 2.49 x 10⁻¹⁰ EuCl2+ 2.50 x 10⁻⁷ Ni4(OH)4
4+ 2.21 x 10⁻¹² Eu(OH)2+ 2.08 x 10⁻⁷
Ni(OH)3- 5.64 x 10⁻¹⁴ EuO+ 6.95 x 10⁻⁹
[Al] (mol dm-3) EuCl2+ 2.64 x 10⁻⁹
AlO2- 2.26 x 10⁻⁹ Eu(OH)3 9.22 x 10⁻¹⁰
HAlO2 5.22 x 10⁻¹⁰ EuO2H 4.71 x 10⁻¹⁰
Al(OH)2+ 4.39 x 10⁻¹¹ EuCl3 3.56 x 10⁻¹¹
NaAlO2 1.39 x 10⁻¹¹ EuCl4- 7.22 x 10⁻¹³
AlOH2+ 3.46 x 10⁻¹² EuO2- 4.70 x 10⁻¹³
Al 3+ 8.46 x 10⁻¹² Eu(OH)4- 3.83 x 10⁻¹⁵
Al 2(OH)24+ 1.00 x 10⁻²⁰
Table 6. Speciation for montmorillonite in the presence of 10-3 MCl x, 0.05 mol dm-3 NaCl and
pH 7. Concentrations in mol dm-3.
Ionic
species
Concentration
(mol dm-3)
Ionic
species
Concentration
(mol dm-3)
SiO2 9.79 x 10⁻⁵ NaAlO2 1.34 x 10⁻⁹
NaHSiO3 1.95 x 10⁻⁵ Al(OH)2+ 4.90 x 10⁻¹¹
HSiO3- 1.49 x 10⁻⁷ AlOH2+ 5.37 x 10⁻¹²
AlO2- 2.52 x 10⁻⁹ H2SiO4
2- 3.69 x 10⁻¹³
Colloid Binary Systems Page 61 of 214
Table 7. Metal speciation for system constituted by 10-3 mol dm-3 MCl x and 30 mg
montmorillonite colloids at pH 7 and ionic strength 0.05 mol dm-3.
Ionic
Species [Cs] (mol dm-3)
Ionic
Species [Ni] (mol dm-3)
Ionic
Species [Eu] (mol dm-3)
Cs+ 9.87 x 10⁻⁴ Ni2+ 4.98 x 10⁻⁵ Eu2(OH)24+ 2.17 x 10⁻⁴
CsCl 1.35 x 10⁻⁵ NiCl+ 5.18 x 10⁻⁸ Eu3+ 5.70 x 10⁻⁶
Ni(OH)2 1.48 x 10⁻¹¹ EuOH2+ 1.51 x 10⁻⁷
Ni2OH3+ 6.88 x 10⁻¹³ Eu(OH)2+ 6.65 x 10⁻⁸
Ni(OH)3- 2.04 x 10⁻¹⁵ EuCl2+ 6.58 x 10⁻⁸
Ni4(OH)44+ 1.37 x 10⁻¹⁷ EuO+ 2.22 x 10⁻⁹
EuCl2+ 3.09 x 10⁻¹⁰
Eu(OH)3 2.65 x 10⁻¹⁰
EuO2H 1.35 x 10⁻¹¹ EuCl3 2.27 x 10⁻¹²
EuO2- 1.50 x 10⁻¹³
EuCl4- 3.08 x 10⁻¹⁴
Eu(OH)4- 1.22 x 10⁻¹⁵
2.3.2.1.2. Control experiments
Two control experiments constituted the study of the sorption of Ni onto solid
montmorillonite when the pH was buffered and when it was allowed to drift, and
when the supernatant resulting from separating the colloidal phase from solution
after the sorption process was filtered through 0.45 or 0.22 µm pore filters.
By measuring the pH of the samples after the equilibration period, a drift in the pH
towards lower pHs was observed. For example, the pH of the samples for the
sorption of Cs onto boehmite colloids drifted from 6.96 ± 0.14 to 5.48 ± 0.02. In
another batch of Cs sorption onto solid montmorillonite, the pH drifted from 6.93 ±
0.08 to 3.81 ± 0.05. The pH drift was also observed for Ni sorption onto solid
montmorillonite, where a decrease in 1.30 ± 0.47 units could be observed. From
these results, the pH of the samples used to investigate the sorption of metals onto
boehmite and montmorillonite was buffered using MES.
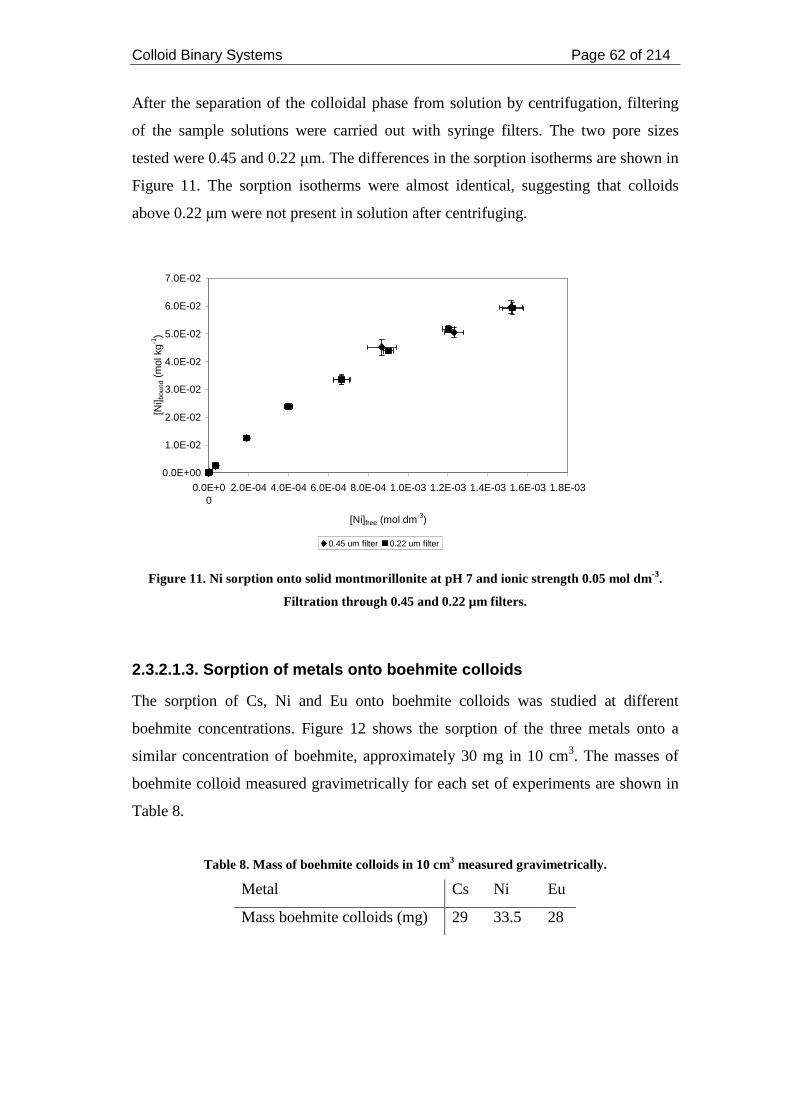
Colloid Binary Systems Page 62 of 214
After the separation of the colloidal phase from solution by centrifugation, filtering
of the sample solutions were carried out with syringe filters. The two pore sizes
tested were 0.45 and 0.22 µm. The differences in the sorption isotherms are shown in
Figure 11. The sorption isotherms were almost identical, suggesting that colloids
above 0.22 µm were not present in solution after centrifuging.
0.0E+00
1.0E-02
2.0E-02
3.0E-02
4.0E-02
5.0E-02
6.0E-02
7.0E-02
0.0E+00
2.0E-04 4.0E-04 6.0E-04 8.0E-04 1.0E-03 1.2E-03 1.4E-03 1.6E-03 1.8E-03
[Ni]free (mol dm-3)
[Ni] b
ound
(m
ol k
g-1)
0.45 um filter 0.22 um filter
Figure 11. Ni sorption onto solid montmorillonite at pH 7 and ionic strength 0.05 mol dm-3.
Filtration through 0.45 and 0.22 µm filters.
2.3.2.1.3. Sorption of metals onto boehmite colloids
The sorption of Cs, Ni and Eu onto boehmite colloids was studied at different
boehmite concentrations. Figure 12 shows the sorption of the three metals onto a
similar concentration of boehmite, approximately 30 mg in 10 cm3. The masses of
boehmite colloid measured gravimetrically for each set of experiments are shown in
Table 8.
Table 8. Mass of boehmite colloids in 10 cm3 measured gravimetrically.
Metal Cs Ni Eu
Mass boehmite colloids (mg) 29 33.5 28
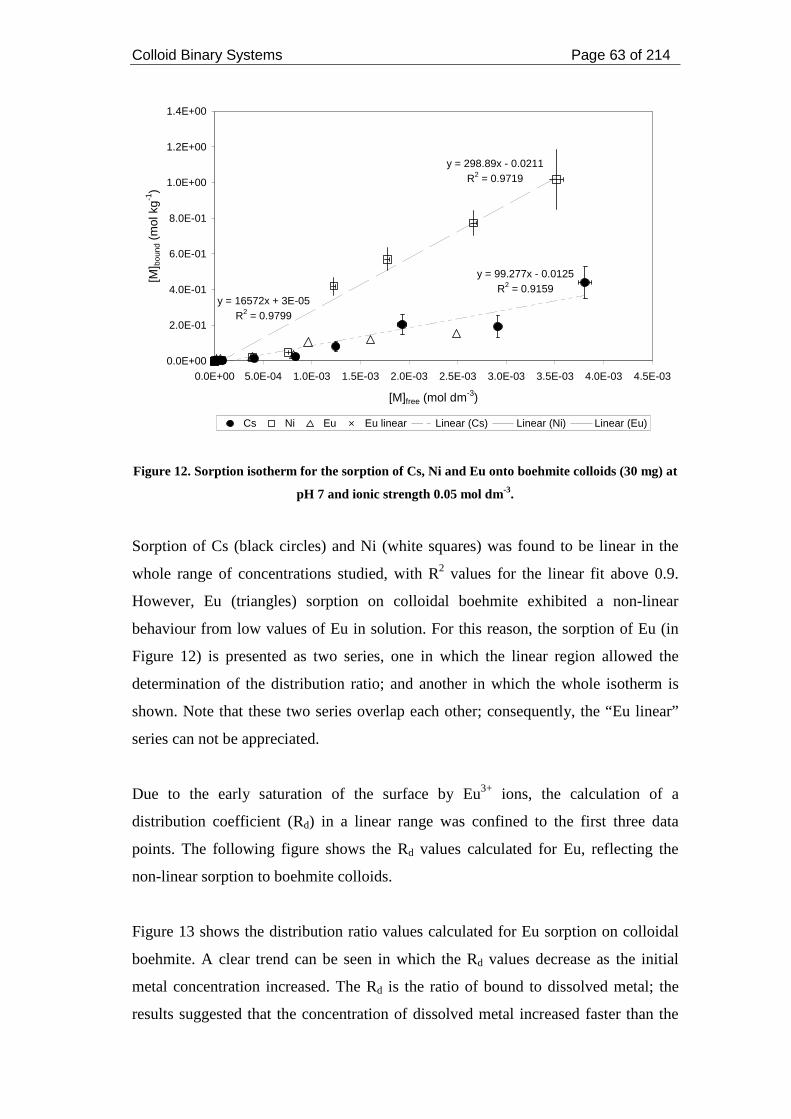
Colloid Binary Systems Page 63 of 214
y = 99.277x - 0.0125R2 = 0.9159
y = 298.89x - 0.0211R2 = 0.9719
y = 16572x + 3E-05R2 = 0.9799
0.0E+00
2.0E-01
4.0E-01
6.0E-01
8.0E-01
1.0E+00
1.2E+00
1.4E+00
0.0E+00 5.0E-04 1.0E-03 1.5E-03 2.0E-03 2.5E-03 3.0E-03 3.5E-03 4.0E-03 4.5E-03
[M]free (mol dm-3)
[M] b
ound
(m
ol k
g-1)
Cs Ni Eu Eu linear Linear (Cs) Linear (Ni) Linear (Eu)
Figure 12. Sorption isotherm for the sorption of Cs, Ni and Eu onto boehmite colloids (30 mg) at
pH 7 and ionic strength 0.05 mol dm-3.
Sorption of Cs (black circles) and Ni (white squares) was found to be linear in the
whole range of concentrations studied, with R2 values for the linear fit above 0.9.
However, Eu (triangles) sorption on colloidal boehmite exhibited a non-linear
behaviour from low values of Eu in solution. For this reason, the sorption of Eu (in
Figure 12) is presented as two series, one in which the linear region allowed the
determination of the distribution ratio; and another in which the whole isotherm is
shown. Note that these two series overlap each other; consequently, the “Eu linear”
series can not be appreciated.
Due to the early saturation of the surface by Eu3+ ions, the calculation of a
distribution coefficient (Rd) in a linear range was confined to the first three data
points. The following figure shows the Rd values calculated for Eu, reflecting the
non-linear sorption to boehmite colloids.
Figure 13 shows the distribution ratio values calculated for Eu sorption on colloidal
boehmite. A clear trend can be seen in which the Rd values decrease as the initial
metal concentration increased. The Rd is the ratio of bound to dissolved metal; the
results suggested that the concentration of dissolved metal increased faster than the
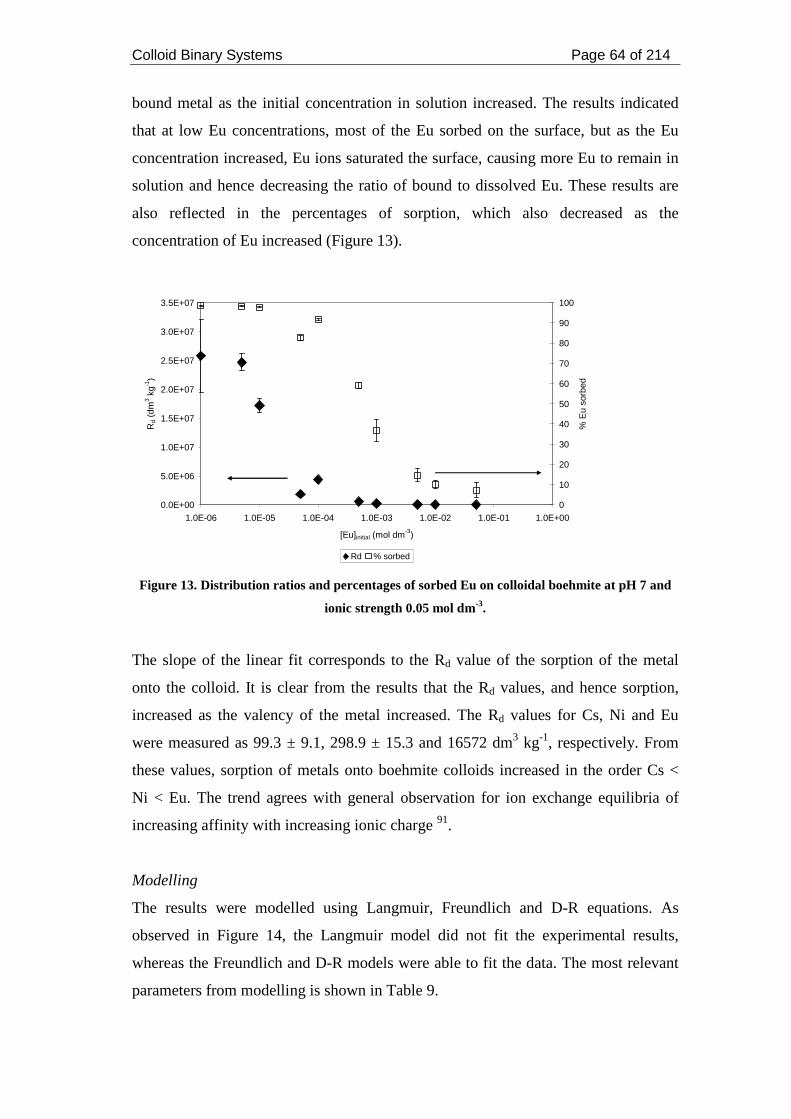
Colloid Binary Systems Page 64 of 214
bound metal as the initial concentration in solution increased. The results indicated
that at low Eu concentrations, most of the Eu sorbed on the surface, but as the Eu
concentration increased, Eu ions saturated the surface, causing more Eu to remain in
solution and hence decreasing the ratio of bound to dissolved Eu. These results are
also reflected in the percentages of sorption, which also decreased as the
concentration of Eu increased (Figure 13).
0.0E+00
5.0E+06
1.0E+07
1.5E+07
2.0E+07
2.5E+07
3.0E+07
3.5E+07
1.0E-06 1.0E-05 1.0E-04 1.0E-03 1.0E-02 1.0E-01 1.0E+00
[Eu]initial (mol dm-3)
Rd
(dm
3 kg-1
)
0
10
20
30
40
50
60
70
80
90
100
% E
u so
rbed
Rd % sorbed Figure 13. Distribution ratios and percentages of sorbed Eu on colloidal boehmite at pH 7 and
ionic strength 0.05 mol dm-3.
The slope of the linear fit corresponds to the Rd value of the sorption of the metal
onto the colloid. It is clear from the results that the Rd values, and hence sorption,
increased as the valency of the metal increased. The Rd values for Cs, Ni and Eu
were measured as 99.3 ± 9.1, 298.9 ± 15.3 and 16572 dm3 kg-1, respectively. From
these values, sorption of metals onto boehmite colloids increased in the order Cs <
Ni < Eu. The trend agrees with general observation for ion exchange equilibria of
increasing affinity with increasing ionic charge 91.
Modelling
The results were modelled using Langmuir, Freundlich and D-R equations. As
observed in Figure 14, the Langmuir model did not fit the experimental results,
whereas the Freundlich and D-R models were able to fit the data. The most relevant
parameters from modelling is shown in Table 9.
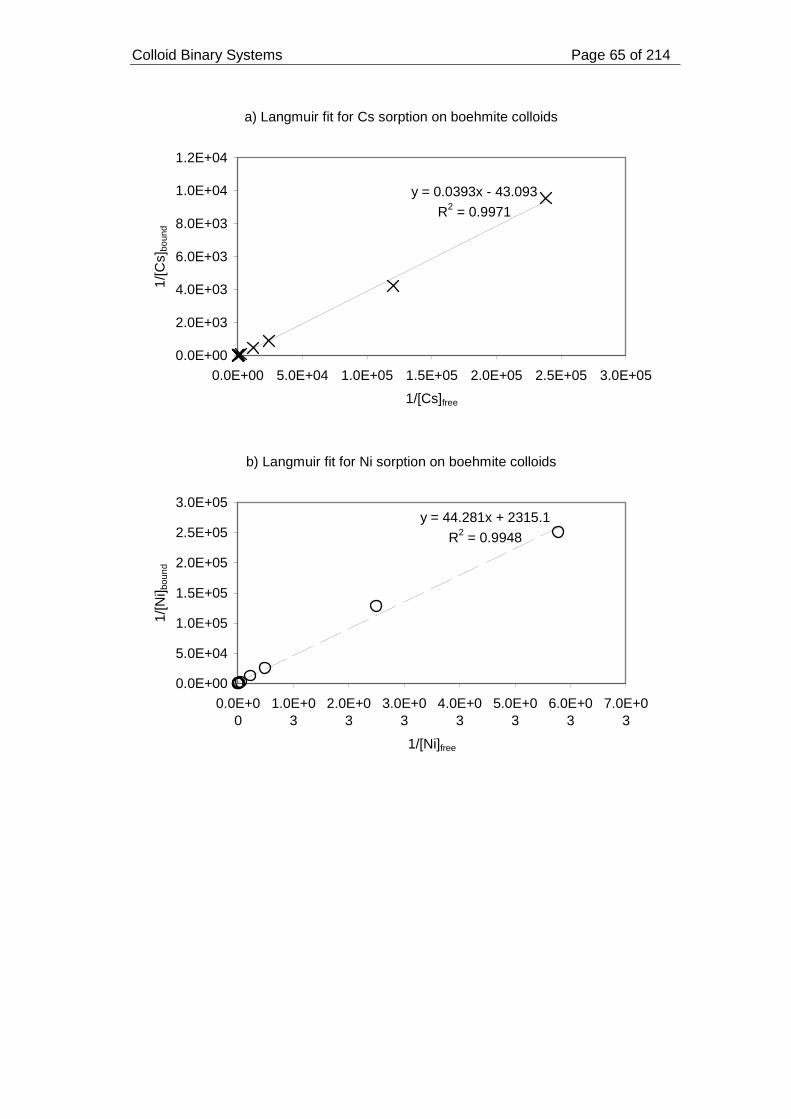
Colloid Binary Systems Page 65 of 214
a) Langmuir fit for Cs sorption on boehmite colloids
y = 0.0393x - 43.093
R2 = 0.9971
0.0E+00
2.0E+03
4.0E+03
6.0E+03
8.0E+03
1.0E+04
1.2E+04
0.0E+00 5.0E+04 1.0E+05 1.5E+05 2.0E+05 2.5E+05 3.0E+05
1/[Cs]free
1/[C
s]bo
und
b) Langmuir fit for Ni sorption on boehmite colloids
y = 44.281x + 2315.1
R2 = 0.9948
0.0E+00
5.0E+04
1.0E+05
1.5E+05
2.0E+05
2.5E+05
3.0E+05
0.0E+00
1.0E+03
2.0E+03
3.0E+03
4.0E+03
5.0E+03
6.0E+03
7.0E+03
1/[Ni]free
1/[N
i] bou
nd
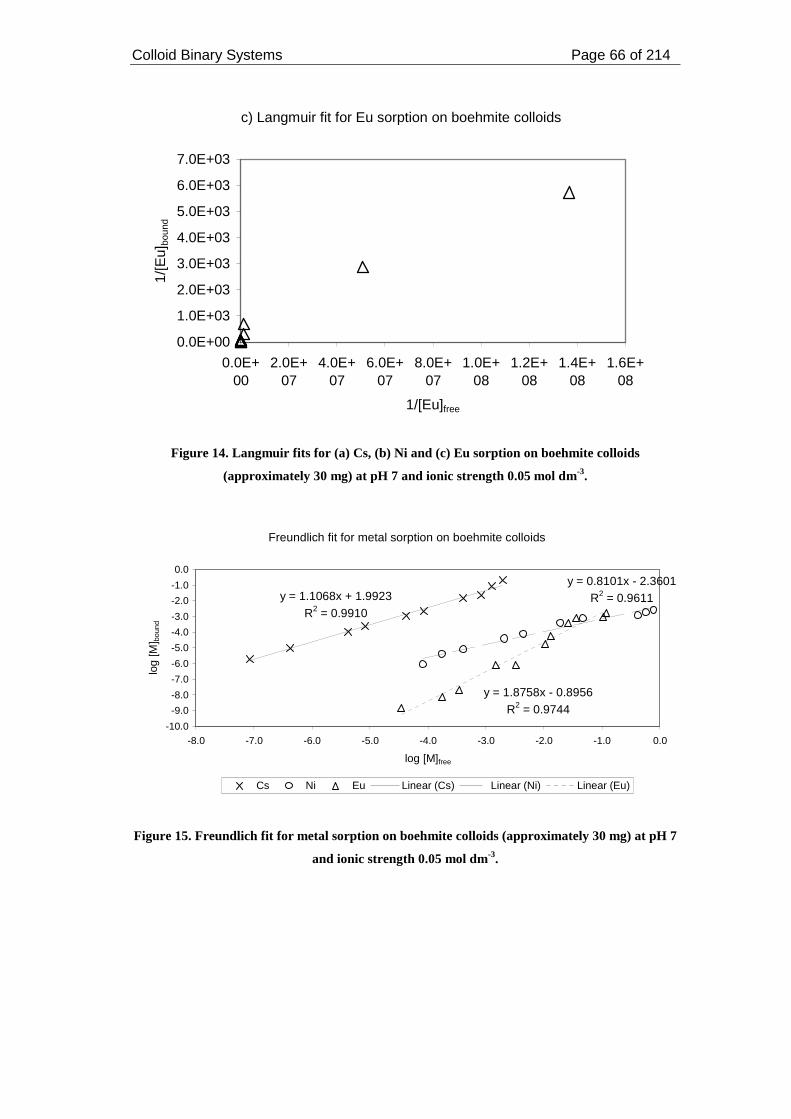
Colloid Binary Systems Page 66 of 214
c) Langmuir fit for Eu sorption on boehmite colloids
0.0E+00
1.0E+03
2.0E+03
3.0E+03
4.0E+03
5.0E+03
6.0E+03
7.0E+03
0.0E+00
2.0E+07
4.0E+07
6.0E+07
8.0E+07
1.0E+08
1.2E+08
1.4E+08
1.6E+08
1/[Eu]free
1/[E
u]bo
und
Figure 14. Langmuir fits for (a) Cs, (b) Ni and (c) Eu sorption on boehmite colloids
(approximately 30 mg) at pH 7 and ionic strength 0.05 mol dm-3.
Freundlich fit for metal sorption on boehmite colloids
y = 1.1068x + 1.9923R2 = 0.9910
y = 0.8101x - 2.3601R2 = 0.9611
y = 1.8758x - 0.8956R2 = 0.9744
-10.0
-9.0
-8.0
-7.0
-6.0
-5.0
-4.0
-3.0
-2.0
-1.0
0.0
-8.0 -7.0 -6.0 -5.0 -4.0 -3.0 -2.0 -1.0 0.0
log [M]free
log
[M] b
ound
Cs Ni Eu Linear (Cs) Linear (Ni) Linear (Eu)
Figure 15. Freundlich fit for metal sorption on boehmite colloids (approximately 30 mg) at pH 7
and ionic strength 0.05 mol dm-3.
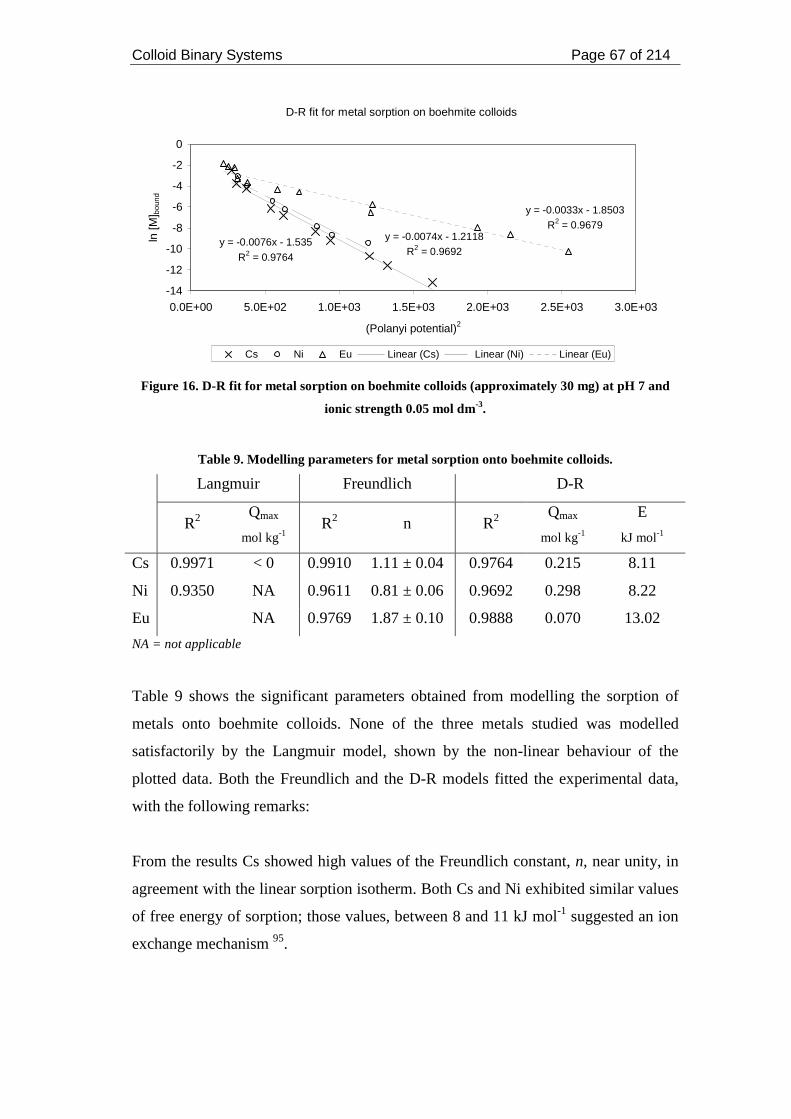
Colloid Binary Systems Page 67 of 214
D-R fit for metal sorption on boehmite colloids
y = -0.0076x - 1.535
R2 = 0.9764
y = -0.0074x - 1.2118R2 = 0.9692
y = -0.0033x - 1.8503R2 = 0.9679
-14
-12
-10
-8
-6
-4
-2
0
0.0E+00 5.0E+02 1.0E+03 1.5E+03 2.0E+03 2.5E+03 3.0E+03
(Polanyi potential)2
ln [M
] bou
nd
Cs Ni Eu Linear (Cs) Linear (Ni) Linear (Eu)
Figure 16. D-R fit for metal sorption on boehmite colloids (approximately 30 mg) at pH 7 and
ionic strength 0.05 mol dm-3.
Table 9. Modelling parameters for metal sorption onto boehmite colloids.
Langmuir Freundlich D-R
R2
Qmax
mol kg-1 R2 n R2
Qmax
mol kg-1
E
kJ mol-1
Cs 0.9971 < 0 0.9910 1.11 ± 0.04 0.9764 0.215 8.11
Ni 0.9350 NA 0.9611 0.81 ± 0.06 0.9692 0.298 8.22
Eu NA 0.9769 1.87 ± 0.10 0.9888 0.070 13.02
NA = not applicable
Table 9 shows the significant parameters obtained from modelling the sorption of
metals onto boehmite colloids. None of the three metals studied was modelled
satisfactorily by the Langmuir model, shown by the non-linear behaviour of the
plotted data. Both the Freundlich and the D-R models fitted the experimental data,
with the following remarks:
From the results Cs showed high values of the Freundlich constant, n, near unity, in
agreement with the linear sorption isotherm. Both Cs and Ni exhibited similar values
of free energy of sorption; those values, between 8 and 11 kJ mol-1 suggested an ion
exchange mechanism 95.
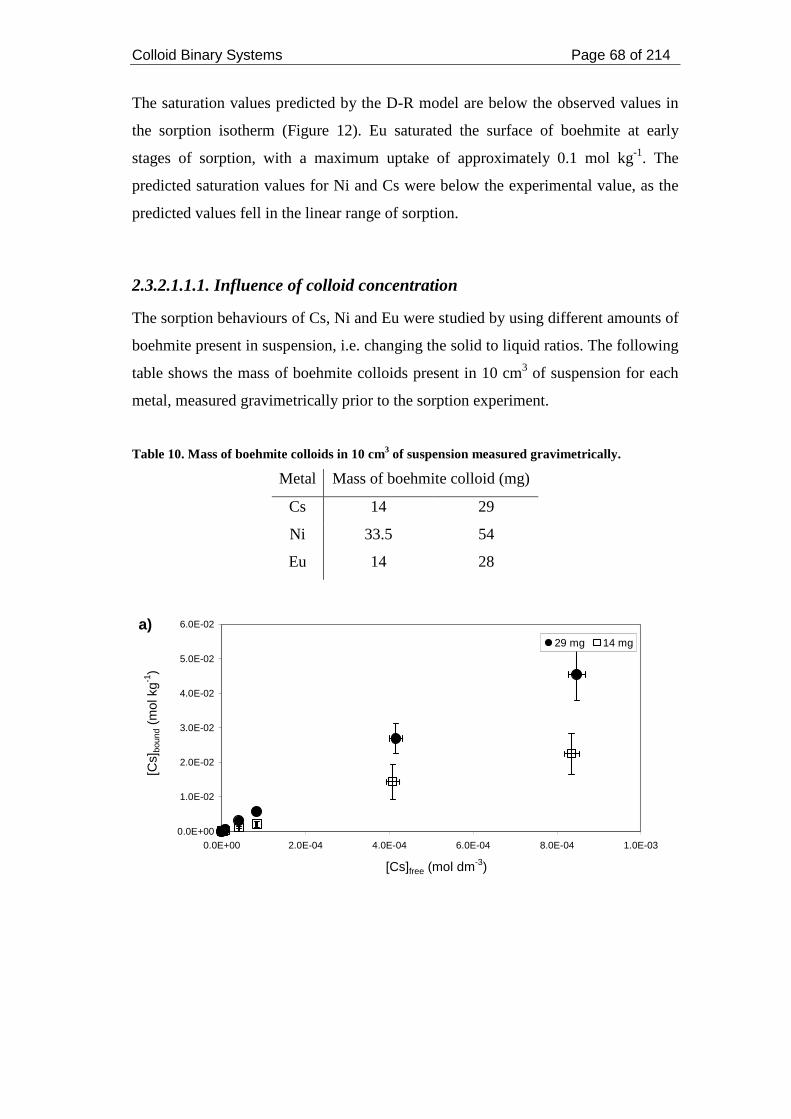
Colloid Binary Systems Page 68 of 214
The saturation values predicted by the D-R model are below the observed values in
the sorption isotherm (Figure 12). Eu saturated the surface of boehmite at early
stages of sorption, with a maximum uptake of approximately 0.1 mol kg-1. The
predicted saturation values for Ni and Cs were below the experimental value, as the
predicted values fell in the linear range of sorption.
2.3.2.1.1.1. Influence of colloid concentration
The sorption behaviours of Cs, Ni and Eu were studied by using different amounts of
boehmite present in suspension, i.e. changing the solid to liquid ratios. The following
table shows the mass of boehmite colloids present in 10 cm3 of suspension for each
metal, measured gravimetrically prior to the sorption experiment.
Table 10. Mass of boehmite colloids in 10 cm3 of suspension measured gravimetrically.
Metal Mass of boehmite colloid (mg)
Cs 14 29
Ni 33.5 54
Eu 14 28
a)
0.0E+00
1.0E-02
2.0E-02
3.0E-02
4.0E-02
5.0E-02
6.0E-02
0.0E+00 2.0E-04 4.0E-04 6.0E-04 8.0E-04 1.0E-03
[Cs]free (mol dm-3)
[Cs]
boun
d (m
ol k
g-1)
29 mg 14 mg
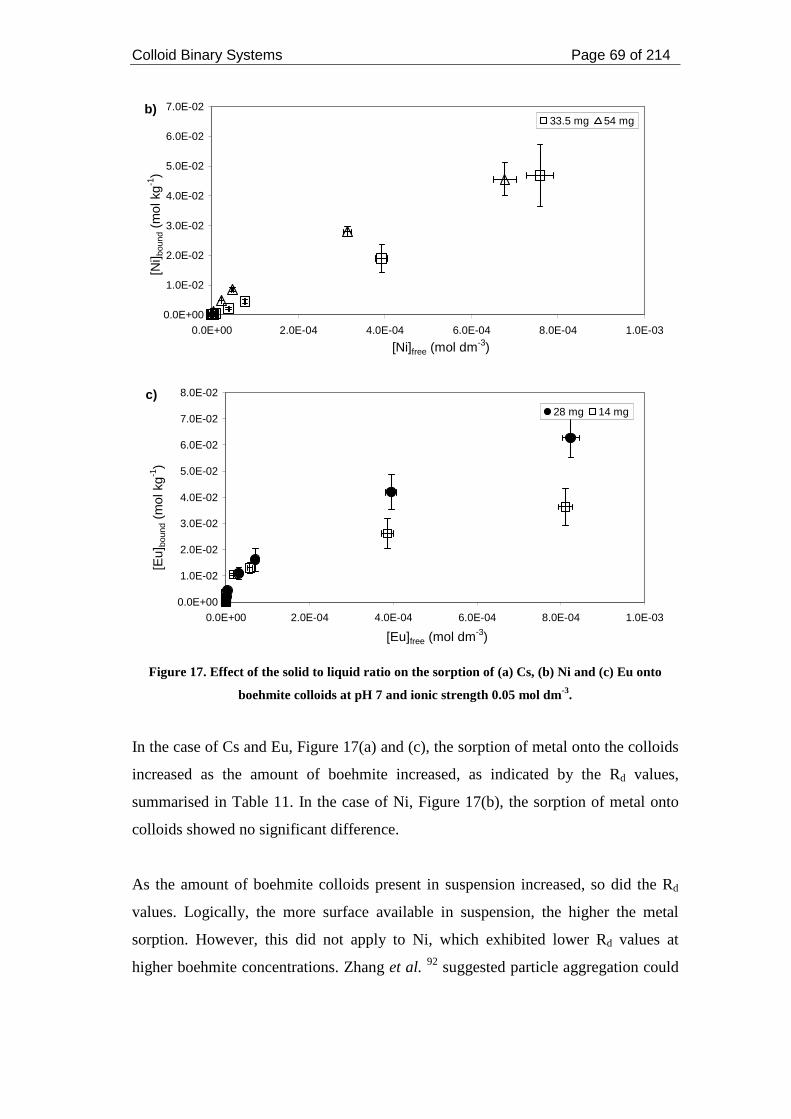
Colloid Binary Systems Page 69 of 214
b)
0.0E+00
1.0E-02
2.0E-02
3.0E-02
4.0E-02
5.0E-02
6.0E-02
7.0E-02
0.0E+00 2.0E-04 4.0E-04 6.0E-04 8.0E-04 1.0E-03
[Ni]free (mol dm-3)
[Ni] b
ound
(m
ol k
g-1)
33.5 mg 54 mg
c)
0.0E+00
1.0E-02
2.0E-02
3.0E-02
4.0E-02
5.0E-02
6.0E-02
7.0E-02
8.0E-02
0.0E+00 2.0E-04 4.0E-04 6.0E-04 8.0E-04 1.0E-03
[Eu]free (mol dm-3)
[Eu]
boun
d (m
ol k
g-1)
28 mg 14 mg
Figure 17. Effect of the solid to liquid ratio on the sorption of (a) Cs, (b) Ni and (c) Eu onto
boehmite colloids at pH 7 and ionic strength 0.05 mol dm-3.
In the case of Cs and Eu, Figure 17(a) and (c), the sorption of metal onto the colloids
increased as the amount of boehmite increased, as indicated by the Rd values,
summarised in Table 11. In the case of Ni, Figure 17(b), the sorption of metal onto
colloids showed no significant difference.
As the amount of boehmite colloids present in suspension increased, so did the Rd
values. Logically, the more surface available in suspension, the higher the metal
sorption. However, this did not apply to Ni, which exhibited lower Rd values at
higher boehmite concentrations. Zhang et al. 92 suggested particle aggregation could
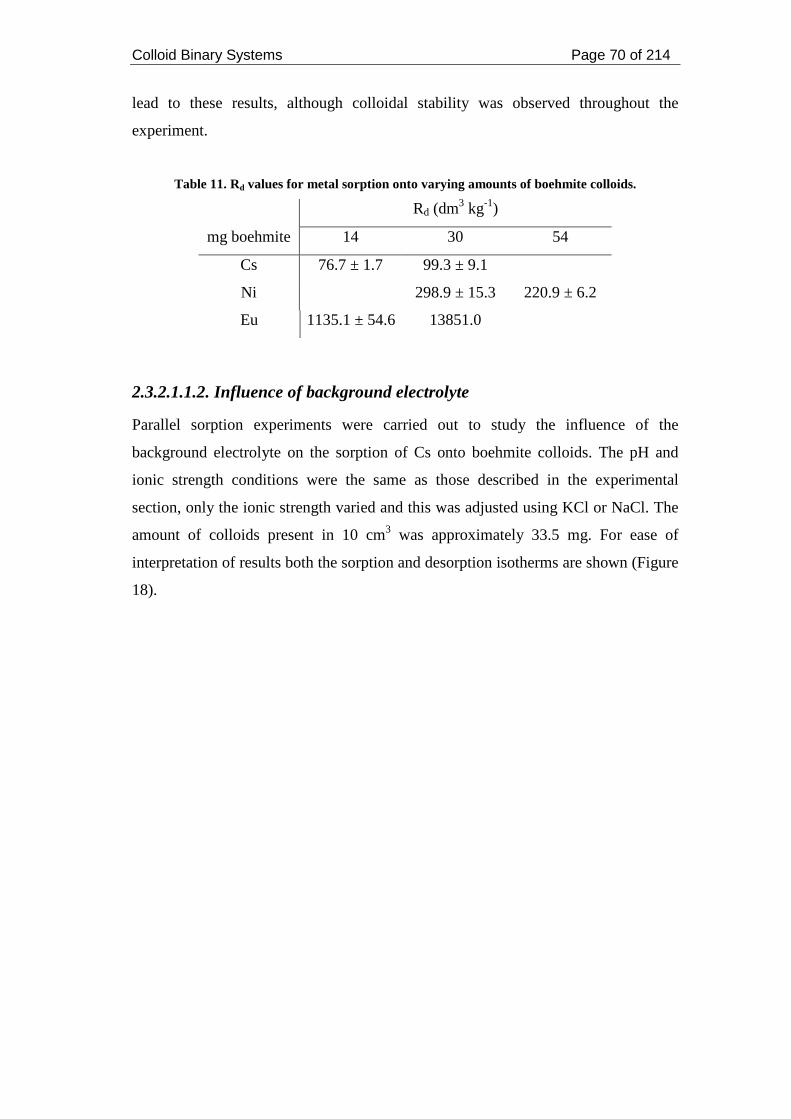
Colloid Binary Systems Page 70 of 214
lead to these results, although colloidal stability was observed throughout the
experiment.
Table 11. Rd values for metal sorption onto varying amounts of boehmite colloids.
Rd (dm3 kg-1)
mg boehmite 14 30 54
Cs 76.7 ± 1.7 99.3 ± 9.1
Ni 298.9 ± 15.3 220.9 ± 6.2
Eu 1135.1 ± 54.6 13851.0
2.3.2.1.1.2. Influence of background electrolyte
Parallel sorption experiments were carried out to study the influence of the
background electrolyte on the sorption of Cs onto boehmite colloids. The pH and
ionic strength conditions were the same as those described in the experimental
section, only the ionic strength varied and this was adjusted using KCl or NaCl. The
amount of colloids present in 10 cm3 was approximately 33.5 mg. For ease of
interpretation of results both the sorption and desorption isotherms are shown (Figure
18).
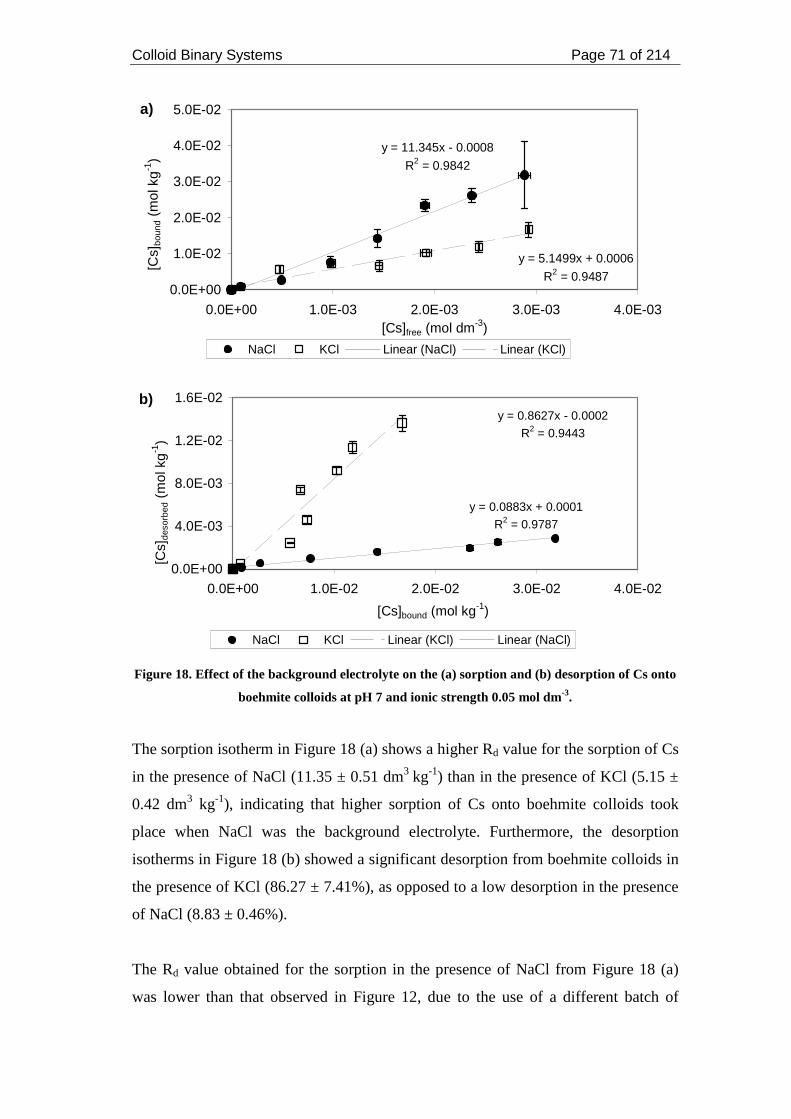
Colloid Binary Systems Page 71 of 214
y = 11.345x - 0.0008
R2 = 0.9842
y = 5.1499x + 0.0006
R2 = 0.94870.0E+00
1.0E-02
2.0E-02
3.0E-02
4.0E-02
5.0E-02
0.0E+00 1.0E-03 2.0E-03 3.0E-03 4.0E-03[Cs]free (mol dm-3)
[Cs]
boun
d (m
ol k
g-1)
NaCl KCl Linear (NaCl) Linear (KCl)
a)
b)y = 0.8627x - 0.0002
R2 = 0.9443
y = 0.0883x + 0.0001
R2 = 0.9787
0.0E+00
4.0E-03
8.0E-03
1.2E-02
1.6E-02
0.0E+00 1.0E-02 2.0E-02 3.0E-02 4.0E-02
[Cs]bound (mol kg-1)
[Cs]
deso
rbed
(m
ol k
g-1)
NaCl KCl Linear (KCl) Linear (NaCl)
Figure 18. Effect of the background electrolyte on the (a) sorption and (b) desorption of Cs onto
boehmite colloids at pH 7 and ionic strength 0.05 mol dm-3.
The sorption isotherm in Figure 18 (a) shows a higher Rd value for the sorption of Cs
in the presence of NaCl (11.35 ± 0.51 dm3 kg-1) than in the presence of KCl (5.15 ±
0.42 dm3 kg-1), indicating that higher sorption of Cs onto boehmite colloids took
place when NaCl was the background electrolyte. Furthermore, the desorption
isotherms in Figure 18 (b) showed a significant desorption from boehmite colloids in
the presence of KCl (86.27 ± 7.41%), as opposed to a low desorption in the presence
of NaCl (8.83 ± 0.46%).
The Rd value obtained for the sorption in the presence of NaCl from Figure 18 (a)
was lower than that observed in Figure 12, due to the use of a different batch of
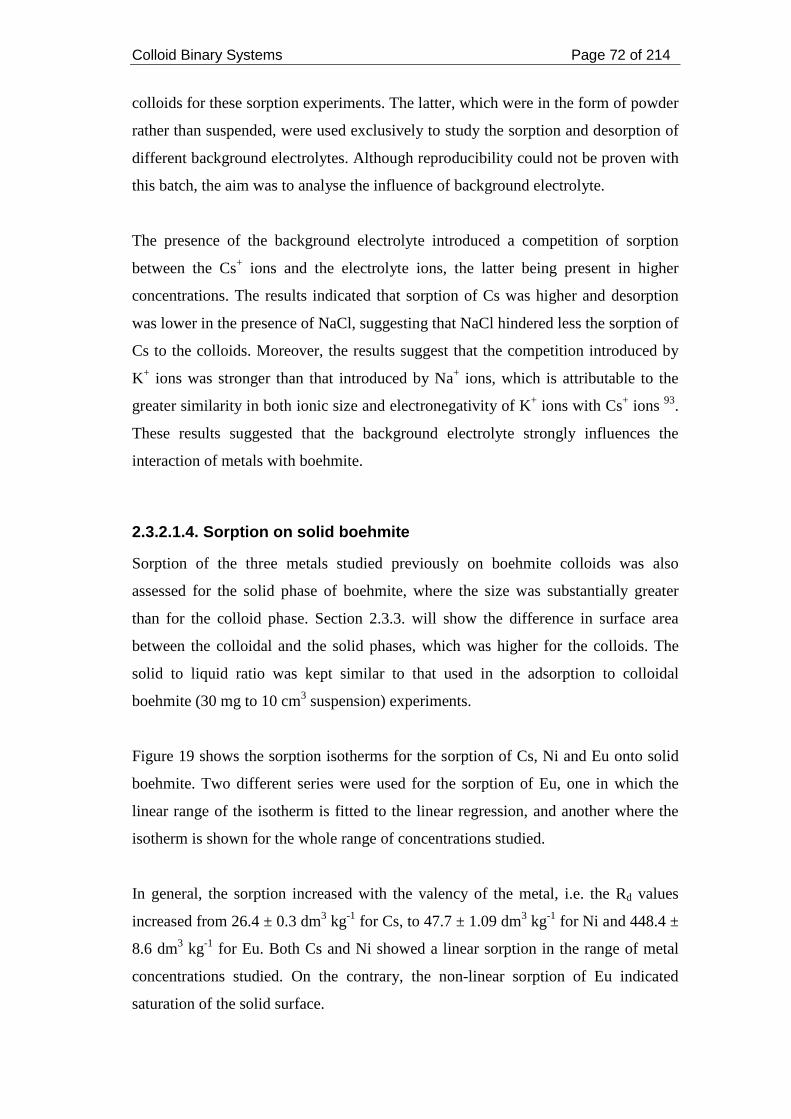
Colloid Binary Systems Page 72 of 214
colloids for these sorption experiments. The latter, which were in the form of powder
rather than suspended, were used exclusively to study the sorption and desorption of
different background electrolytes. Although reproducibility could not be proven with
this batch, the aim was to analyse the influence of background electrolyte.
The presence of the background electrolyte introduced a competition of sorption
between the Cs+ ions and the electrolyte ions, the latter being present in higher
concentrations. The results indicated that sorption of Cs was higher and desorption
was lower in the presence of NaCl, suggesting that NaCl hindered less the sorption of
Cs to the colloids. Moreover, the results suggest that the competition introduced by
K+ ions was stronger than that introduced by Na+ ions, which is attributable to the
greater similarity in both ionic size and electronegativity of K+ ions with Cs+ ions 93.
These results suggested that the background electrolyte strongly influences the
interaction of metals with boehmite.
2.3.2.1.4. Sorption on solid boehmite
Sorption of the three metals studied previously on boehmite colloids was also
assessed for the solid phase of boehmite, where the size was substantially greater
than for the colloid phase. Section 2.3.3. will show the difference in surface area
between the colloidal and the solid phases, which was higher for the colloids. The
solid to liquid ratio was kept similar to that used in the adsorption to colloidal
boehmite (30 mg to 10 cm3 suspension) experiments.
Figure 19 shows the sorption isotherms for the sorption of Cs, Ni and Eu onto solid
boehmite. Two different series were used for the sorption of Eu, one in which the
linear range of the isotherm is fitted to the linear regression, and another where the
isotherm is shown for the whole range of concentrations studied.
In general, the sorption increased with the valency of the metal, i.e. the Rd values
increased from 26.4 ± 0.3 dm3 kg-1 for Cs, to 47.7 ± 1.09 dm3 kg-1 for Ni and 448.4 ±
8.6 dm3 kg-1 for Eu. Both Cs and Ni showed a linear sorption in the range of metal
concentrations studied. On the contrary, the non-linear sorption of Eu indicated
saturation of the solid surface.
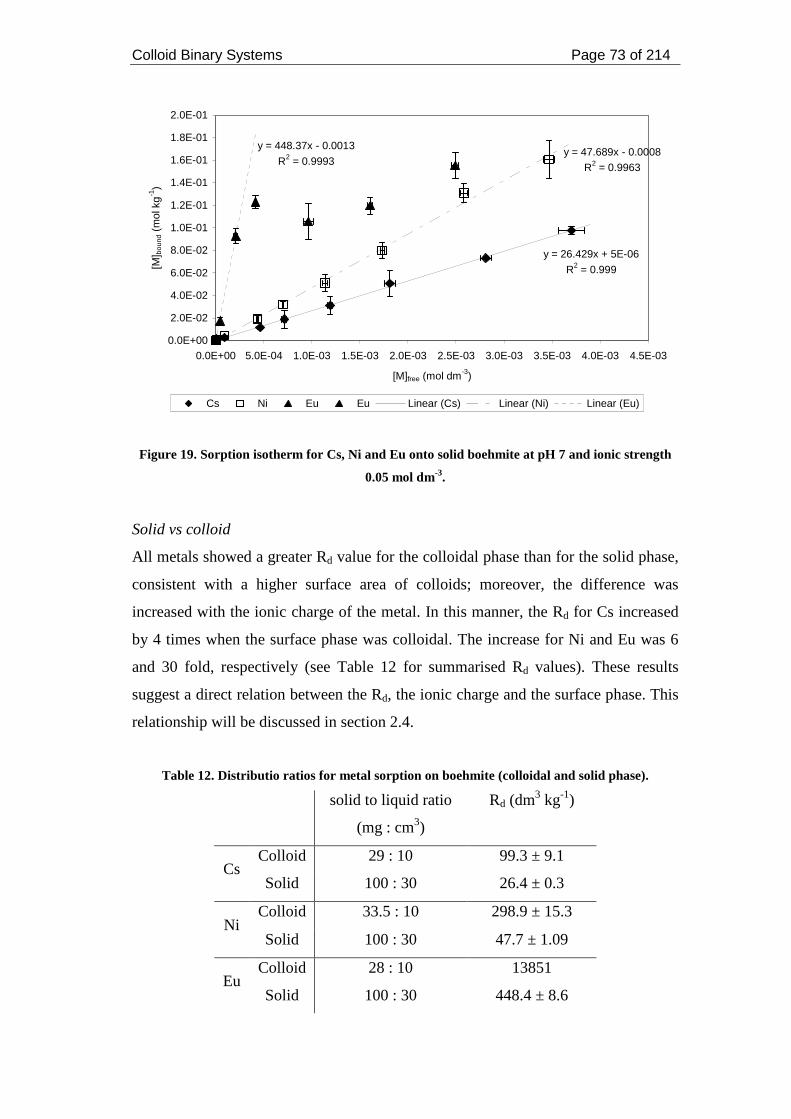
Colloid Binary Systems Page 73 of 214
y = 26.429x + 5E-06
R2 = 0.999
y = 47.689x - 0.0008
R2 = 0.9963
y = 448.37x - 0.0013
R2 = 0.9993
0.0E+00
2.0E-02
4.0E-02
6.0E-02
8.0E-02
1.0E-01
1.2E-01
1.4E-01
1.6E-01
1.8E-01
2.0E-01
0.0E+00 5.0E-04 1.0E-03 1.5E-03 2.0E-03 2.5E-03 3.0E-03 3.5E-03 4.0E-03 4.5E-03
[M]free (mol dm-3)
[M] b
ound
(m
ol k
g-1
)
Cs Ni Eu Eu Linear (Cs) Linear (Ni) Linear (Eu)
Figure 19. Sorption isotherm for Cs, Ni and Eu onto solid boehmite at pH 7 and ionic strength
0.05 mol dm-3.
Solid vs colloid
All metals showed a greater Rd value for the colloidal phase than for the solid phase,
consistent with a higher surface area of colloids; moreover, the difference was
increased with the ionic charge of the metal. In this manner, the Rd for Cs increased
by 4 times when the surface phase was colloidal. The increase for Ni and Eu was 6
and 30 fold, respectively (see Table 12 for summarised Rd values). These results
suggest a direct relation between the Rd, the ionic charge and the surface phase. This
relationship will be discussed in section 2.4.
Table 12. Distributio ratios for metal sorption on boehmite (colloidal and solid phase).
solid to liquid ratio
(mg : cm3)
Rd (dm3 kg-1)
Colloid 29 : 10 99.3 ± 9.1 Cs
Solid 100 : 30 26.4 ± 0.3
Colloid 33.5 : 10 298.9 ± 15.3 Ni
Solid 100 : 30 47.7 ± 1.09
Colloid 28 : 10 13851 Eu
Solid 100 : 30 448.4 ± 8.6
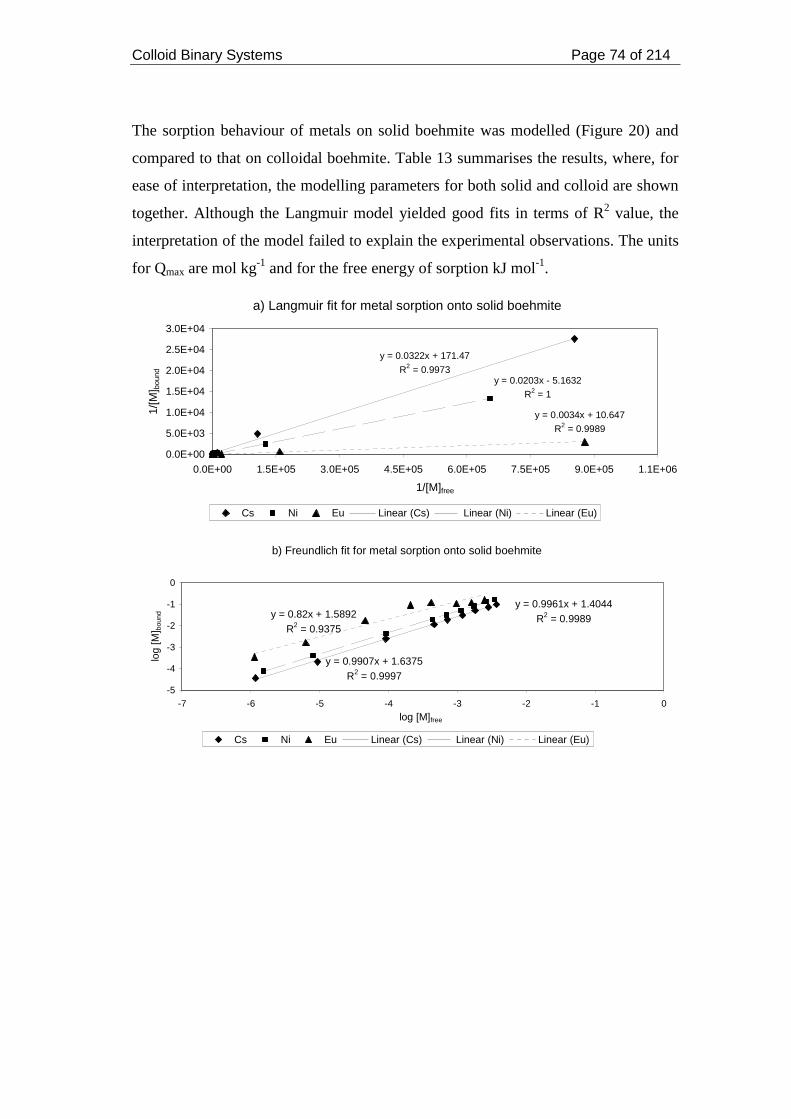
Colloid Binary Systems Page 74 of 214
The sorption behaviour of metals on solid boehmite was modelled (Figure 20) and
compared to that on colloidal boehmite. Table 13 summarises the results, where, for
ease of interpretation, the modelling parameters for both solid and colloid are shown
together. Although the Langmuir model yielded good fits in terms of R2 value, the
interpretation of the model failed to explain the experimental observations. The units
for Qmax are mol kg-1 and for the free energy of sorption kJ mol-1.
a) Langmuir fit for metal sorption onto solid boehmite
y = 0.0322x + 171.47
R2 = 0.9973y = 0.0203x - 5.1632
R2 = 1
y = 0.0034x + 10.647
R2 = 0.9989
0.0E+00
5.0E+03
1.0E+04
1.5E+04
2.0E+04
2.5E+04
3.0E+04
0.0E+00 1.5E+05 3.0E+05 4.5E+05 6.0E+05 7.5E+05 9.0E+05 1.1E+06
1/[M]free
1/[M
] bou
nd
Cs Ni Eu Linear (Cs) Linear (Ni) Linear (Eu)
b) Freundlich fit for metal sorption onto solid boehmite
y = 0.9961x + 1.4044R2 = 0.9989
y = 0.9907x + 1.6375R2 = 0.9997
y = 0.82x + 1.5892R2 = 0.9375
-5
-4
-3
-2
-1
0
-7 -6 -5 -4 -3 -2 -1 0
log [M]free
log
[M] b
ound
Cs Ni Eu Linear (Cs) Linear (Ni) Linear (Eu)
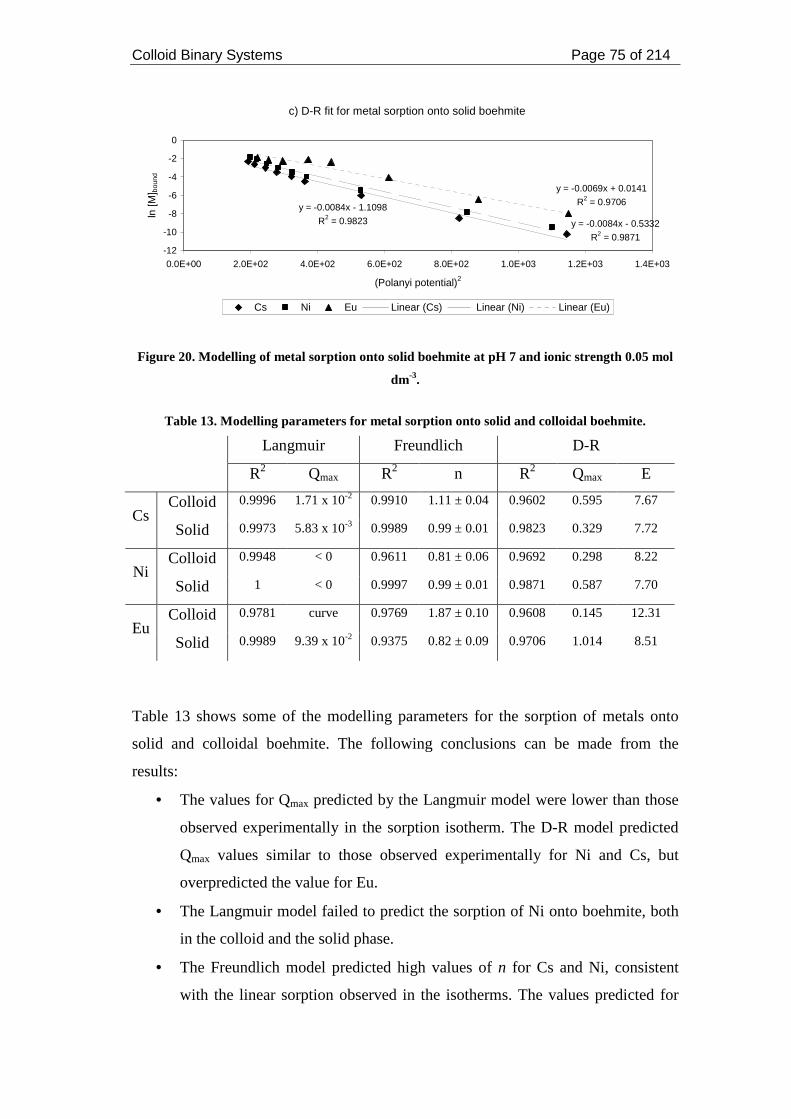
Colloid Binary Systems Page 75 of 214
c) D-R fit for metal sorption onto solid boehmite
y = -0.0084x - 1.1098
R2 = 0.9823 y = -0.0084x - 0.5332
R2 = 0.9871
y = -0.0069x + 0.0141
R2 = 0.9706
-12
-10
-8
-6
-4
-2
0
0.0E+00 2.0E+02 4.0E+02 6.0E+02 8.0E+02 1.0E+03 1.2E+03 1.4E+03
(Polanyi potential)2
ln [M
] bou
nd
Cs Ni Eu Linear (Cs) Linear (Ni) Linear (Eu)
Figure 20. Modelling of metal sorption onto solid boehmite at pH 7 and ionic strength 0.05 mol
dm-3.
Table 13. Modelling parameters for metal sorption onto solid and colloidal boehmite.
Langmuir Freundlich D-R
R2 Qmax R2 n R2 Qmax E
Colloid 0.9996 1.71 x 10⁻² 0.9910 1.11 ± 0.04 0.9602 0.595 7.67 Cs
Solid 0.9973 5.83 x 10⁻³ 0.9989 0.99 ± 0.01 0.9823 0.329 7.72
Colloid 0.9948 < 0 0.9611 0.81 ± 0.06 0.9692 0.298 8.22 Ni
Solid 1 < 0 0.9997 0.99 ± 0.01 0.9871 0.587 7.70
Colloid 0.9781 curve 0.9769 1.87 ± 0.10 0.9608 0.145 12.31 Eu
Solid 0.9989 9.39 x 10⁻² 0.9375 0.82 ± 0.09 0.9706 1.014 8.51
Table 13 shows some of the modelling parameters for the sorption of metals onto
solid and colloidal boehmite. The following conclusions can be made from the
results:
• The values for Qmax predicted by the Langmuir model were lower than those
observed experimentally in the sorption isotherm. The D-R model predicted
Qmax values similar to those observed experimentally for Ni and Cs, but
overpredicted the value for Eu.
• The Langmuir model failed to predict the sorption of Ni onto boehmite, both
in the colloid and the solid phase.
• The Freundlich model predicted high values of n for Cs and Ni, consistent
with the linear sorption observed in the isotherms. The values predicted for
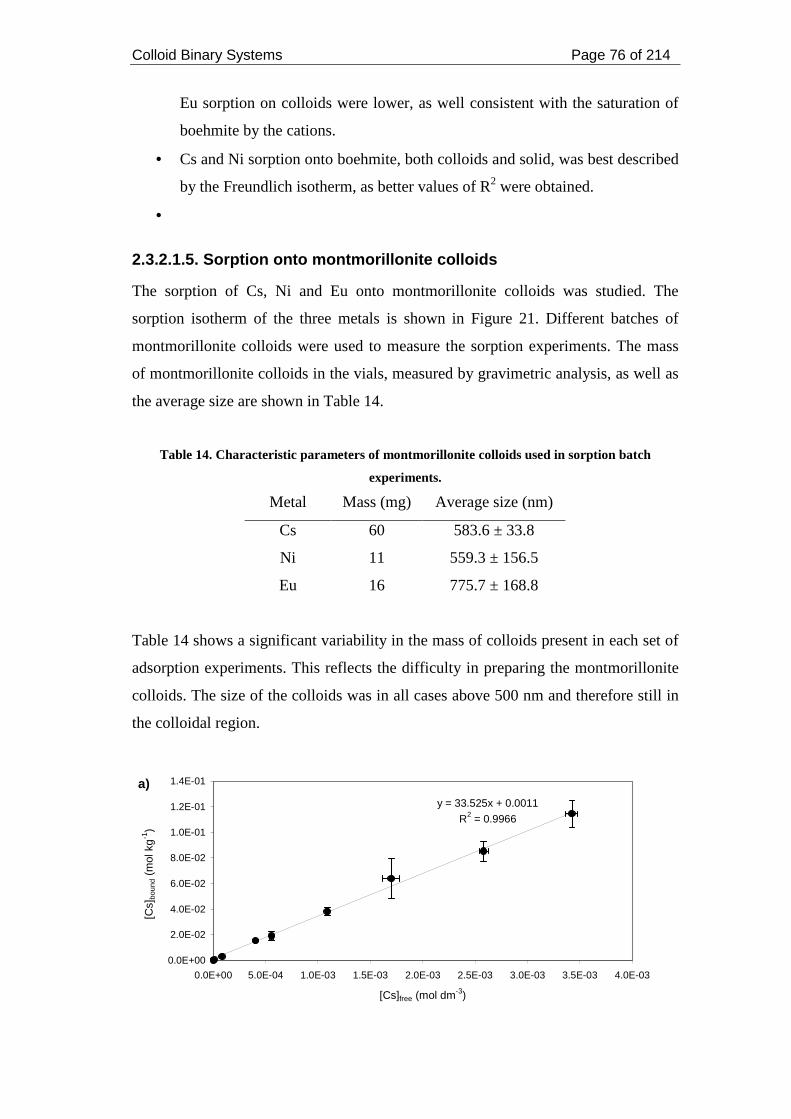
Colloid Binary Systems Page 76 of 214
Eu sorption on colloids were lower, as well consistent with the saturation of
boehmite by the cations.
• Cs and Ni sorption onto boehmite, both colloids and solid, was best described
by the Freundlich isotherm, as better values of R2 were obtained.
•
2.3.2.1.5. Sorption onto montmorillonite colloids
The sorption of Cs, Ni and Eu onto montmorillonite colloids was studied. The
sorption isotherm of the three metals is shown in Figure 21. Different batches of
montmorillonite colloids were used to measure the sorption experiments. The mass
of montmorillonite colloids in the vials, measured by gravimetric analysis, as well as
the average size are shown in Table 14.
Table 14. Characteristic parameters of montmorillonite colloids used in sorption batch
experiments.
Metal Mass (mg) Average size (nm)
Cs 60 583.6 ± 33.8
Ni 11 559.3 ± 156.5
Eu 16 775.7 ± 168.8
Table 14 shows a significant variability in the mass of colloids present in each set of
adsorption experiments. This reflects the difficulty in preparing the montmorillonite
colloids. The size of the colloids was in all cases above 500 nm and therefore still in
the colloidal region.
a)y = 33.525x + 0.0011
R2 = 0.9966
0.0E+00
2.0E-02
4.0E-02
6.0E-02
8.0E-02
1.0E-01
1.2E-01
1.4E-01
0.0E+00 5.0E-04 1.0E-03 1.5E-03 2.0E-03 2.5E-03 3.0E-03 3.5E-03 4.0E-03
[Cs]free (mol dm-3)
[Cs]
boun
d (m
ol k
g-1)
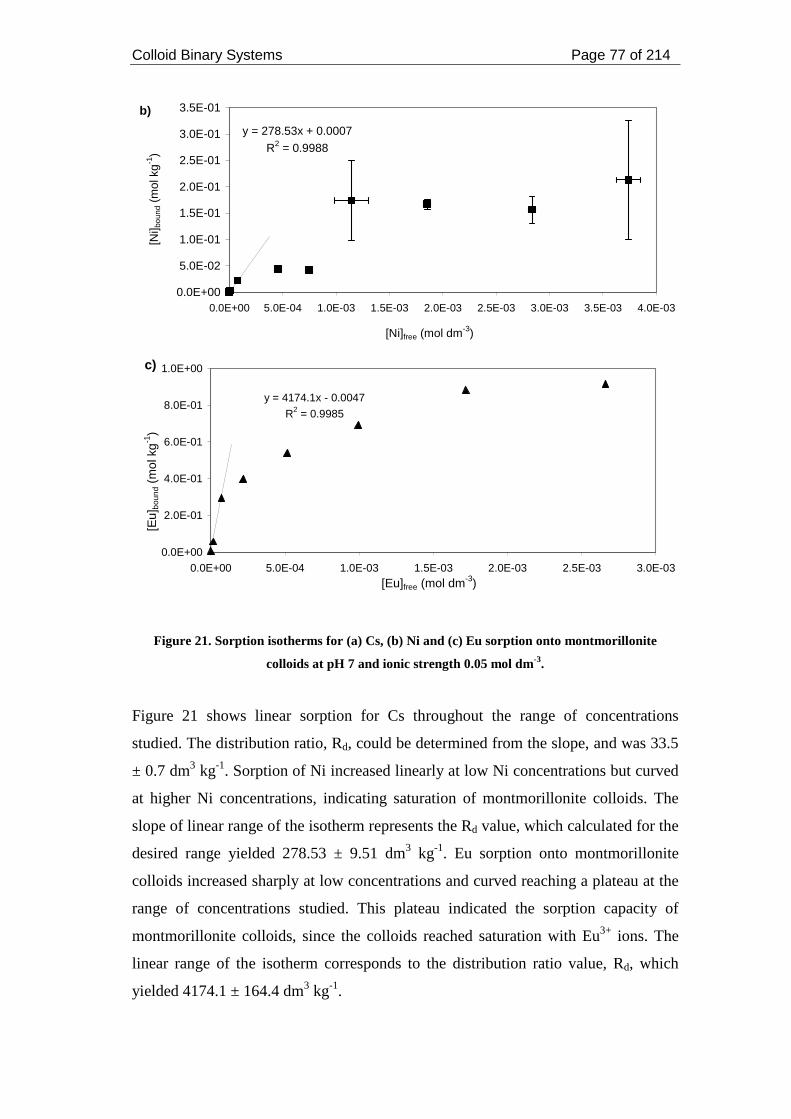
Colloid Binary Systems Page 77 of 214
b)
y = 278.53x + 0.0007
R2 = 0.9988
0.0E+00
5.0E-02
1.0E-01
1.5E-01
2.0E-01
2.5E-01
3.0E-01
3.5E-01
0.0E+00 5.0E-04 1.0E-03 1.5E-03 2.0E-03 2.5E-03 3.0E-03 3.5E-03 4.0E-03
[Ni]free (mol dm-3)
[Ni] b
ound
(m
ol k
g-1)
c)
y = 4174.1x - 0.0047
R2 = 0.9985
0.0E+00
2.0E-01
4.0E-01
6.0E-01
8.0E-01
1.0E+00
0.0E+00 5.0E-04 1.0E-03 1.5E-03 2.0E-03 2.5E-03 3.0E-03[Eu]free (mol dm-3)
[Eu]
boun
d (m
ol k
g-1)
Figure 21. Sorption isotherms for (a) Cs, (b) Ni and (c) Eu sorption onto montmorillonite
colloids at pH 7 and ionic strength 0.05 mol dm-3.
Figure 21 shows linear sorption for Cs throughout the range of concentrations
studied. The distribution ratio, Rd, could be determined from the slope, and was 33.5
± 0.7 dm3 kg-1. Sorption of Ni increased linearly at low Ni concentrations but curved
at higher Ni concentrations, indicating saturation of montmorillonite colloids. The
slope of linear range of the isotherm represents the Rd value, which calculated for the
desired range yielded 278.53 ± 9.51 dm3 kg-1. Eu sorption onto montmorillonite
colloids increased sharply at low concentrations and curved reaching a plateau at the
range of concentrations studied. This plateau indicated the sorption capacity of
montmorillonite colloids, since the colloids reached saturation with Eu3+ ions. The
linear range of the isotherm corresponds to the distribution ratio value, Rd, which
yielded 4174.1 ± 164.4 dm3 kg-1.
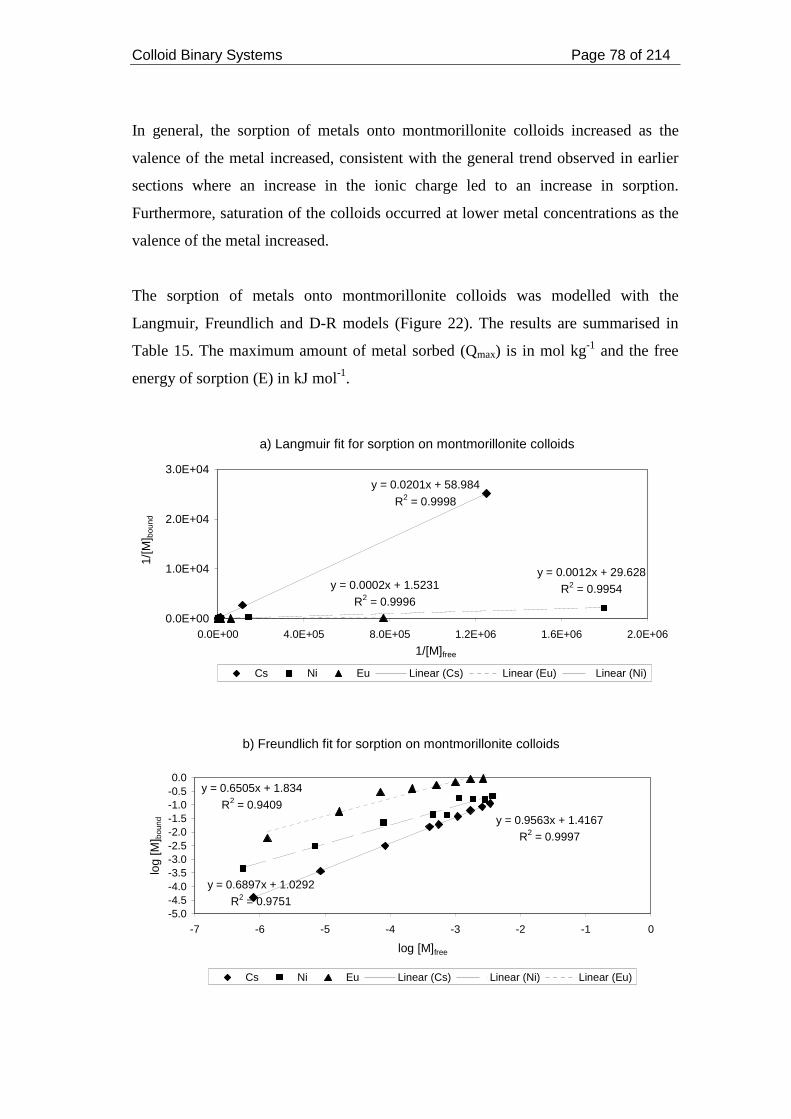
Colloid Binary Systems Page 78 of 214
In general, the sorption of metals onto montmorillonite colloids increased as the
valence of the metal increased, consistent with the general trend observed in earlier
sections where an increase in the ionic charge led to an increase in sorption.
Furthermore, saturation of the colloids occurred at lower metal concentrations as the
valence of the metal increased.
The sorption of metals onto montmorillonite colloids was modelled with the
Langmuir, Freundlich and D-R models (Figure 22). The results are summarised in
Table 15. The maximum amount of metal sorbed (Qmax) is in mol kg-1 and the free
energy of sorption (E) in kJ mol-1.
a) Langmuir fit for sorption on montmorillonite colloids
y = 0.0201x + 58.984
R2 = 0.9998
y = 0.0002x + 1.5231
R2 = 0.9996
y = 0.0012x + 29.628
R2 = 0.9954
0.0E+00
1.0E+04
2.0E+04
3.0E+04
0.0E+00 4.0E+05 8.0E+05 1.2E+06 1.6E+06 2.0E+06
1/[M]free
1/[M
] bou
nd
Cs Ni Eu Linear (Cs) Linear (Eu) Linear (Ni)
b) Freundlich fit for sorption on montmorillonite colloids
y = 0.9563x + 1.4167
R2 = 0.9997
y = 0.6897x + 1.0292
R2 = 0.9751
y = 0.6505x + 1.834
R2 = 0.9409
-5.0-4.5-4.0-3.5-3.0-2.5-2.0-1.5-1.0-0.50.0
-7 -6 -5 -4 -3 -2 -1 0
log [M]free
log
[M] b
ound
Cs Ni Eu Linear (Cs) Linear (Ni) Linear (Eu)
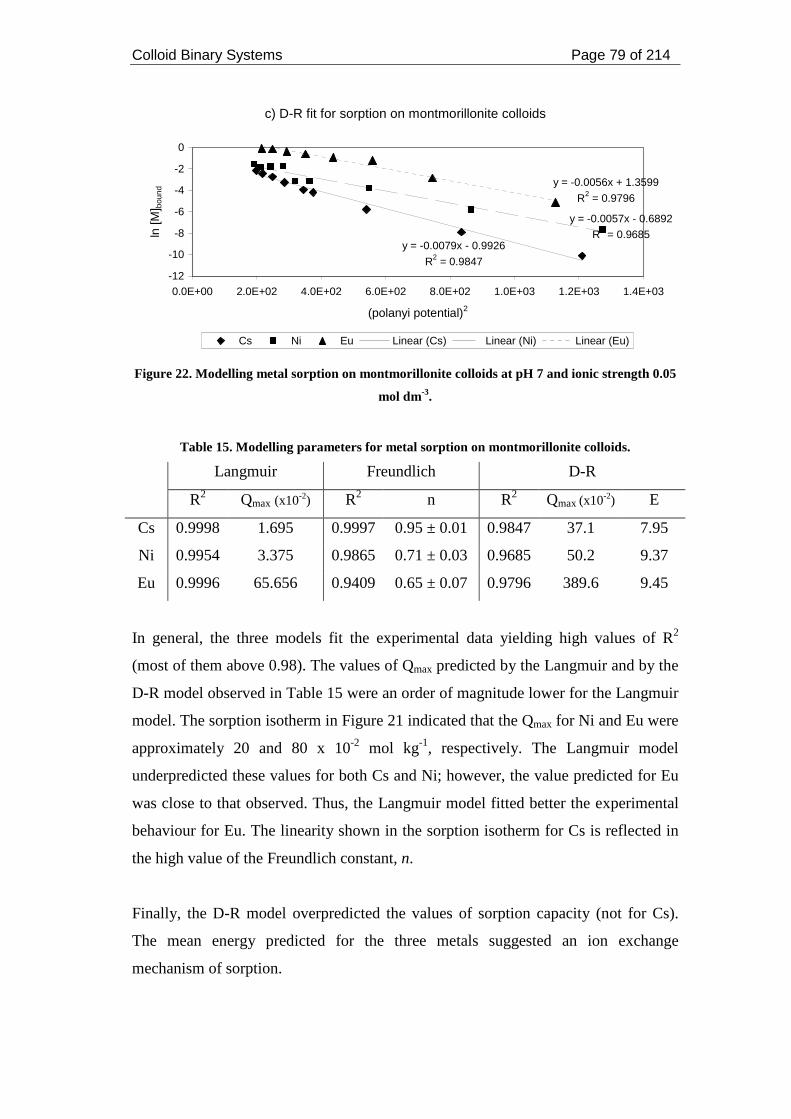
Colloid Binary Systems Page 79 of 214
c) D-R fit for sorption on montmorillonite colloids
y = -0.0079x - 0.9926
R2 = 0.9847
y = -0.0057x - 0.6892
R2 = 0.9685
y = -0.0056x + 1.3599
R2 = 0.9796
-12
-10
-8
-6
-4
-2
0
0.0E+00 2.0E+02 4.0E+02 6.0E+02 8.0E+02 1.0E+03 1.2E+03 1.4E+03
(polanyi potential)2
ln [M
] bou
nd
Cs Ni Eu Linear (Cs) Linear (Ni) Linear (Eu)
Figure 22. Modelling metal sorption on montmorillonite colloids at pH 7 and ionic strength 0.05
mol dm-3.
Table 15. Modelling parameters for metal sorption on montmorillonite colloids.
Langmuir Freundlich D-R
R2 Qmax (x10-2) R2 n R2 Qmax (x10-2) E
Cs 0.9998 1.695 0.9997 0.95 ± 0.01 0.9847 37.1 7.95
Ni 0.9954 3.375 0.9865 0.71 ± 0.03 0.9685 50.2 9.37
Eu 0.9996 65.656 0.9409 0.65 ± 0.07 0.9796 389.6 9.45
In general, the three models fit the experimental data yielding high values of R2
(most of them above 0.98). The values of Qmax predicted by the Langmuir and by the
D-R model observed in Table 15 were an order of magnitude lower for the Langmuir
model. The sorption isotherm in Figure 21 indicated that the Qmax for Ni and Eu were
approximately 20 and 80 x 10-2 mol kg-1, respectively. The Langmuir model
underpredicted these values for both Cs and Ni; however, the value predicted for Eu
was close to that observed. Thus, the Langmuir model fitted better the experimental
behaviour for Eu. The linearity shown in the sorption isotherm for Cs is reflected in
the high value of the Freundlich constant, n.
Finally, the D-R model overpredicted the values of sorption capacity (not for Cs).
The mean energy predicted for the three metals suggested an ion exchange
mechanism of sorption.
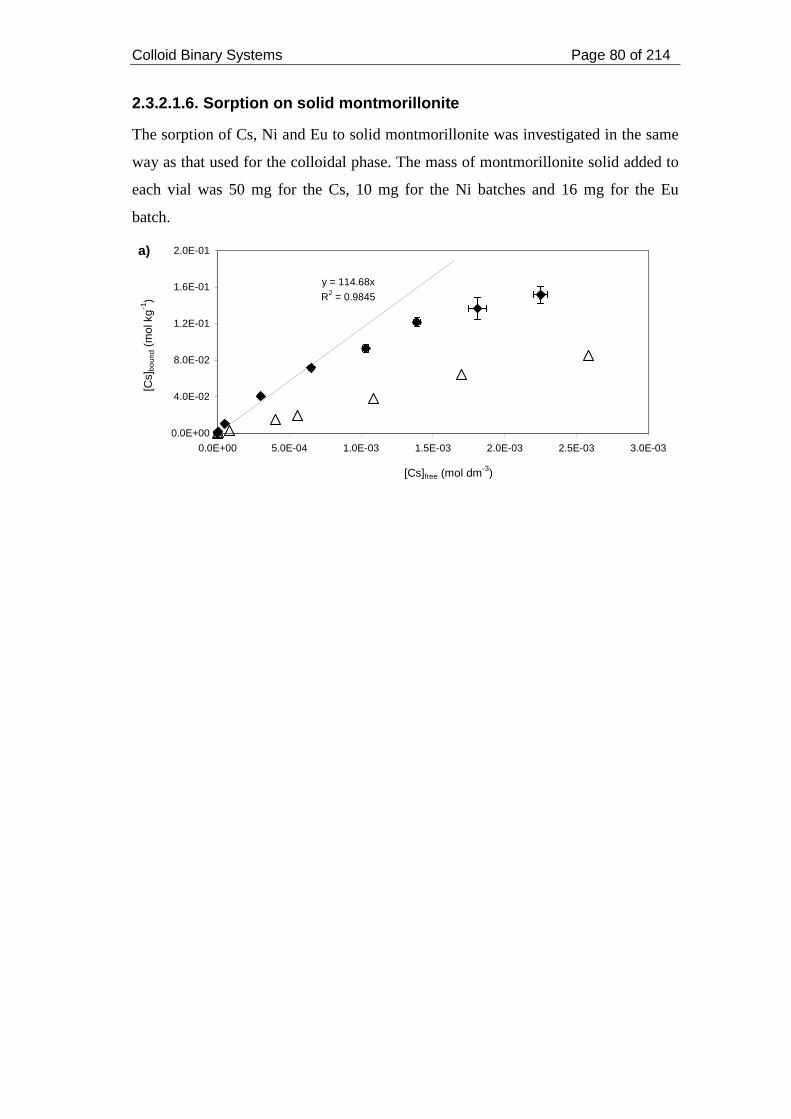
Colloid Binary Systems Page 80 of 214
2.3.2.1.6. Sorption on solid montmorillonite
The sorption of Cs, Ni and Eu to solid montmorillonite was investigated in the same
way as that used for the colloidal phase. The mass of montmorillonite solid added to
each vial was 50 mg for the Cs, 10 mg for the Ni batches and 16 mg for the Eu
batch.
a)
y = 114.68x
R2 = 0.9845
0.0E+00
4.0E-02
8.0E-02
1.2E-01
1.6E-01
2.0E-01
0.0E+00 5.0E-04 1.0E-03 1.5E-03 2.0E-03 2.5E-03 3.0E-03
[Cs]free (mol dm-3)
[Cs]
boun
d (m
ol k
g-1
)
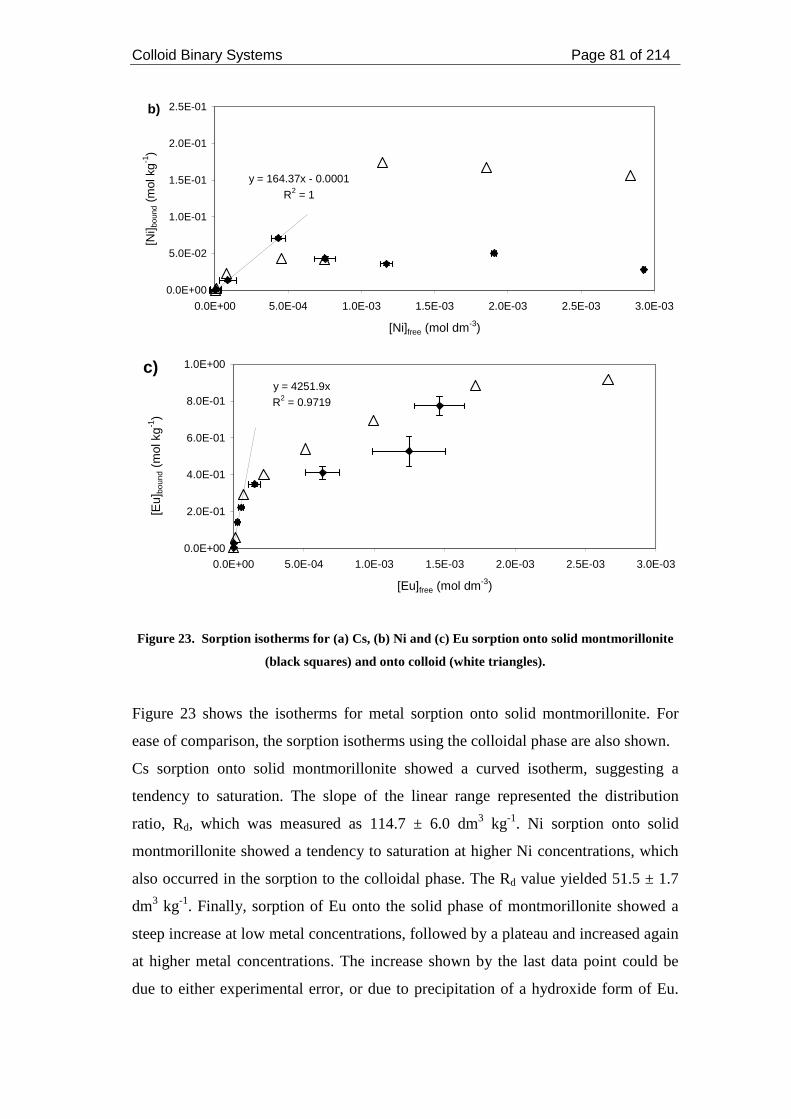
Colloid Binary Systems Page 81 of 214
b)
y = 164.37x - 0.0001
R2 = 1
0.0E+00
5.0E-02
1.0E-01
1.5E-01
2.0E-01
2.5E-01
0.0E+00 5.0E-04 1.0E-03 1.5E-03 2.0E-03 2.5E-03 3.0E-03
[Ni]free (mol dm-3)
[Ni] b
ound
(m
ol k
g-1)
c)y = 4251.9x
R2 = 0.9719
0.0E+00
2.0E-01
4.0E-01
6.0E-01
8.0E-01
1.0E+00
0.0E+00 5.0E-04 1.0E-03 1.5E-03 2.0E-03 2.5E-03 3.0E-03
[Eu]free (mol dm-3)
[Eu]
boun
d (m
ol k
g-1)
Figure 23. Sorption isotherms for (a) Cs, (b) Ni and (c) Eu sorption onto solid montmorillonite
(black squares) and onto colloid (white triangles).
Figure 23 shows the isotherms for metal sorption onto solid montmorillonite. For
ease of comparison, the sorption isotherms using the colloidal phase are also shown.
Cs sorption onto solid montmorillonite showed a curved isotherm, suggesting a
tendency to saturation. The slope of the linear range represented the distribution
ratio, Rd, which was measured as 114.7 ± 6.0 dm3 kg-1. Ni sorption onto solid
montmorillonite showed a tendency to saturation at higher Ni concentrations, which
also occurred in the sorption to the colloidal phase. The Rd value yielded 51.5 ± 1.7
dm3 kg-1. Finally, sorption of Eu onto the solid phase of montmorillonite showed a
steep increase at low metal concentrations, followed by a plateau and increased again
at higher metal concentrations. The increase shown by the last data point could be
due to either experimental error, or due to precipitation of a hydroxide form of Eu.
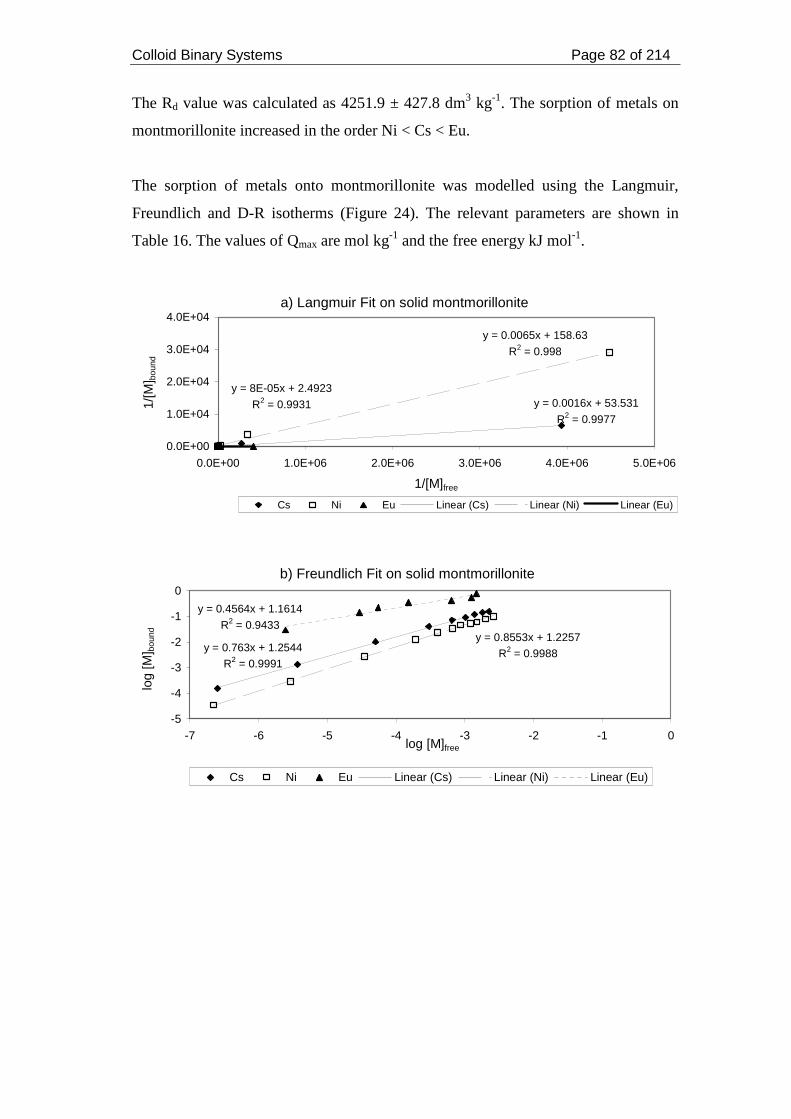
Colloid Binary Systems Page 82 of 214
The Rd value was calculated as 4251.9 ± 427.8 dm3 kg-1. The sorption of metals on
montmorillonite increased in the order Ni < Cs < Eu.
The sorption of metals onto montmorillonite was modelled using the Langmuir,
Freundlich and D-R isotherms (Figure 24). The relevant parameters are shown in
Table 16. The values of Qmax are mol kg-1 and the free energy kJ mol-1.
a) Langmuir Fit on solid montmorillonite
y = 0.0016x + 53.531
R2 = 0.9977
y = 0.0065x + 158.63
R2 = 0.998
y = 8E-05x + 2.4923
R2 = 0.9931
0.0E+00
1.0E+04
2.0E+04
3.0E+04
4.0E+04
0.0E+00 1.0E+06 2.0E+06 3.0E+06 4.0E+06 5.0E+06
1/[M]free
1/[M
] bou
nd
Cs Ni Eu Linear (Cs) Linear (Ni) Linear (Eu)
b) Freundlich Fit on solid montmorillonite
y = 0.763x + 1.2544
R2 = 0.9991
y = 0.8553x + 1.2257
R2 = 0.9988
y = 0.4564x + 1.1614
R2 = 0.9433
-5
-4
-3
-2
-1
0
-7 -6 -5 -4 -3 -2 -1 0log [M]free
log
[M] b
ound
Cs Ni Eu Linear (Cs) Linear (Ni) Linear (Eu)
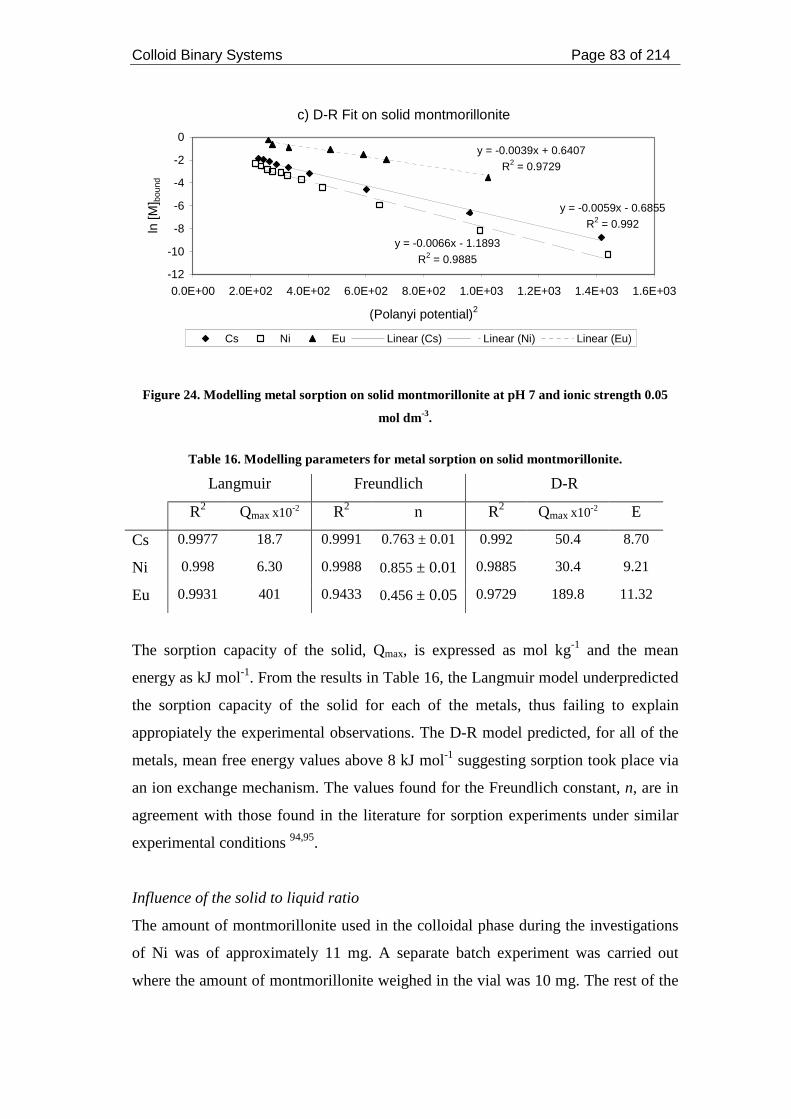
Colloid Binary Systems Page 83 of 214
c) D-R Fit on solid montmorillonite
y = -0.0059x - 0.6855
R2 = 0.992
y = -0.0066x - 1.1893
R2 = 0.9885
y = -0.0039x + 0.6407
R2 = 0.9729
-12
-10
-8
-6
-4
-2
0
0.0E+00 2.0E+02 4.0E+02 6.0E+02 8.0E+02 1.0E+03 1.2E+03 1.4E+03 1.6E+03
(Polanyi potential)2
ln [M
] bou
nd
Cs Ni Eu Linear (Cs) Linear (Ni) Linear (Eu)
Figure 24. Modelling metal sorption on solid montmorillonite at pH 7 and ionic strength 0.05
mol dm-3.
Table 16. Modelling parameters for metal sorption on solid montmorillonite.
Langmuir Freundlich D-R
R2 Qmax x10-2 R2 n R2 Qmax x10-2 E
Cs 0.9977 18.7 0.9991 0.763 ± 0.01 0.992 50.4 8.70
Ni 0.998 6.30 0.9988 0.855 ± 0.01 0.9885 30.4 9.21
Eu 0.9931 401 0.9433 0.456 ± 0.05 0.9729 189.8 11.32
The sorption capacity of the solid, Qmax, is expressed as mol kg-1 and the mean
energy as kJ mol-1. From the results in Table 16, the Langmuir model underpredicted
the sorption capacity of the solid for each of the metals, thus failing to explain
appropiately the experimental observations. The D-R model predicted, for all of the
metals, mean free energy values above 8 kJ mol-1 suggesting sorption took place via
an ion exchange mechanism. The values found for the Freundlich constant, n, are in
agreement with those found in the literature for sorption experiments under similar
experimental conditions 94,95.
Influence of the solid to liquid ratio
The amount of montmorillonite used in the colloidal phase during the investigations
of Ni was of approximately 11 mg. A separate batch experiment was carried out
where the amount of montmorillonite weighed in the vial was 10 mg. The rest of the
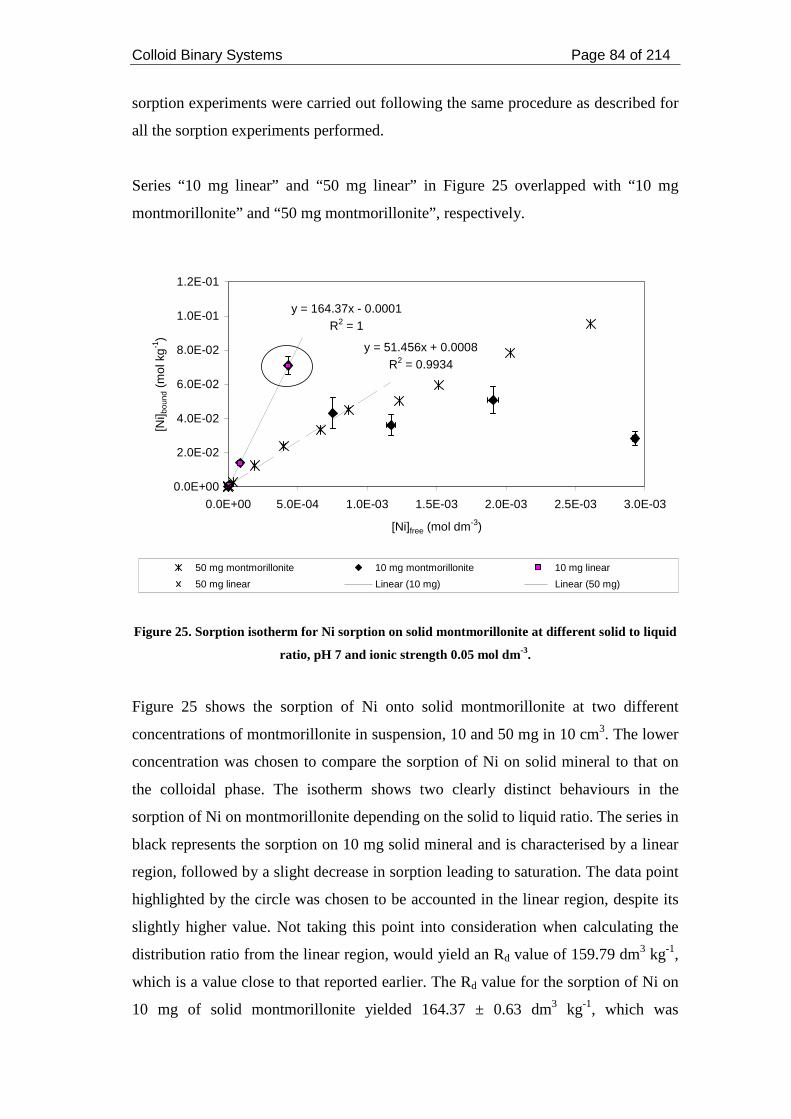
Colloid Binary Systems Page 84 of 214
sorption experiments were carried out following the same procedure as described for
all the sorption experiments performed.
Series “10 mg linear” and “50 mg linear” in Figure 25 overlapped with “10 mg
montmorillonite” and “50 mg montmorillonite”, respectively.
y = 164.37x - 0.0001R2 = 1
y = 51.456x + 0.0008R2 = 0.9934
0.0E+00
2.0E-02
4.0E-02
6.0E-02
8.0E-02
1.0E-01
1.2E-01
0.0E+00 5.0E-04 1.0E-03 1.5E-03 2.0E-03 2.5E-03 3.0E-03
[Ni]free (mol dm-3)
[Ni] b
ound
(m
ol k
g-1)
50 mg montmorillonite 10 mg montmorillonite 10 mg linear
50 mg linear Linear (10 mg) Linear (50 mg)
Figure 25. Sorption isotherm for Ni sorption on solid montmorillonite at different solid to liquid
ratio, pH 7 and ionic strength 0.05 mol dm-3.
Figure 25 shows the sorption of Ni onto solid montmorillonite at two different
concentrations of montmorillonite in suspension, 10 and 50 mg in 10 cm3. The lower
concentration was chosen to compare the sorption of Ni on solid mineral to that on
the colloidal phase. The isotherm shows two clearly distinct behaviours in the
sorption of Ni on montmorillonite depending on the solid to liquid ratio. The series in
black represents the sorption on 10 mg solid mineral and is characterised by a linear
region, followed by a slight decrease in sorption leading to saturation. The data point
highlighted by the circle was chosen to be accounted in the linear region, despite its
slightly higher value. Not taking this point into consideration when calculating the
distribution ratio from the linear region, would yield an Rd value of 159.79 dm3 kg-1,
which is a value close to that reported earlier. The Rd value for the sorption of Ni on
10 mg of solid montmorillonite yielded 164.37 ± 0.63 dm3 kg-1, which was
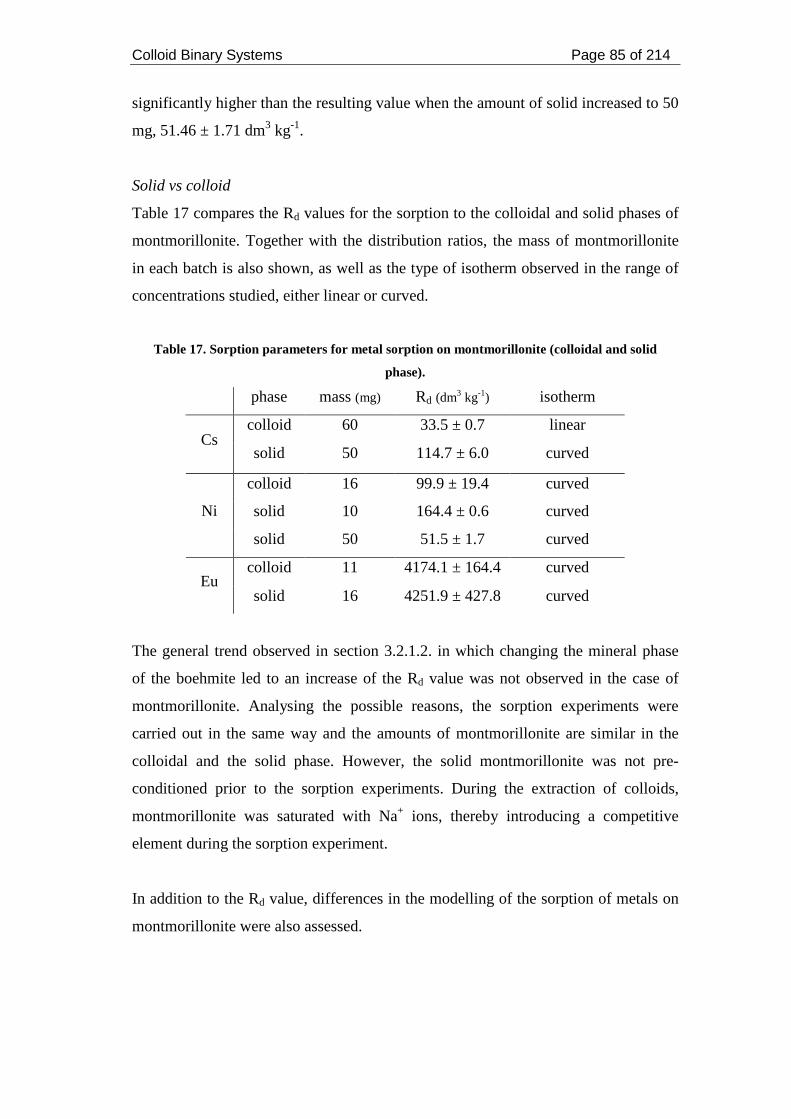
Colloid Binary Systems Page 85 of 214
significantly higher than the resulting value when the amount of solid increased to 50
mg, 51.46 ± 1.71 dm3 kg-1.
Solid vs colloid
Table 17 compares the Rd values for the sorption to the colloidal and solid phases of
montmorillonite. Together with the distribution ratios, the mass of montmorillonite
in each batch is also shown, as well as the type of isotherm observed in the range of
concentrations studied, either linear or curved.
Table 17. Sorption parameters for metal sorption on montmorillonite (colloidal and solid
phase).
phase mass (mg) Rd (dm3 kg-1) isotherm
colloid 60 33.5 ± 0.7 linear Cs
solid 50 114.7 ± 6.0 curved
colloid 16 99.9 ± 19.4 curved
solid 10 164.4 ± 0.6 curved Ni
solid 50 51.5 ± 1.7 curved
colloid 11 4174.1 ± 164.4 curved Eu
solid 16 4251.9 ± 427.8 curved
The general trend observed in section 3.2.1.2. in which changing the mineral phase
of the boehmite led to an increase of the Rd value was not observed in the case of
montmorillonite. Analysing the possible reasons, the sorption experiments were
carried out in the same way and the amounts of montmorillonite are similar in the
colloidal and the solid phase. However, the solid montmorillonite was not pre-
conditioned prior to the sorption experiments. During the extraction of colloids,
montmorillonite was saturated with Na+ ions, thereby introducing a competitive
element during the sorption experiment.
In addition to the Rd value, differences in the modelling of the sorption of metals on
montmorillonite were also assessed.
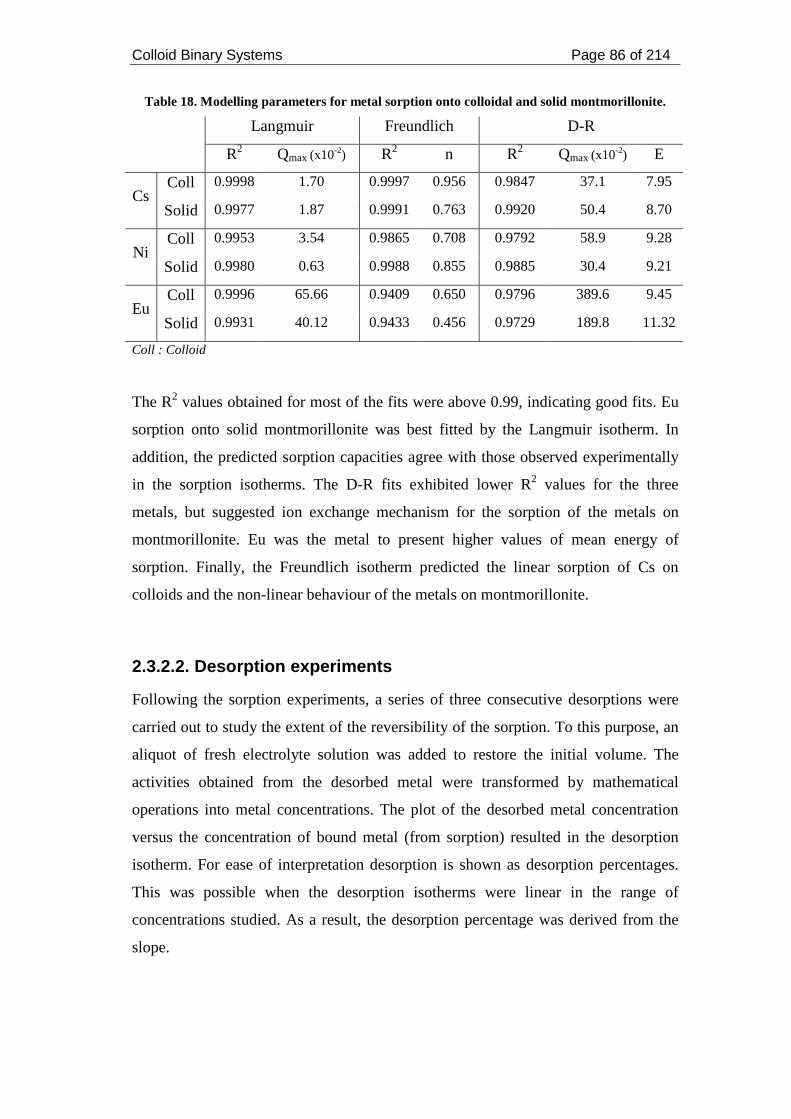
Colloid Binary Systems Page 86 of 214
Table 18. Modelling parameters for metal sorption onto colloidal and solid montmorillonite.
Langmuir Freundlich D-R
R2 Qmax (x10-2) R2 n R2 Qmax (x10-2) E
Coll 0.9998 1.70 0.9997 0.956 0.9847 37.1 7.95 Cs
Solid 0.9977 1.87 0.9991 0.763 0.9920 50.4 8.70
Coll 0.9953 3.54 0.9865 0.708 0.9792 58.9 9.28 Ni
Solid 0.9980 0.63 0.9988 0.855 0.9885 30.4 9.21
Coll 0.9996 65.66 0.9409 0.650 0.9796 389.6 9.45 Eu
Solid 0.9931 40.12 0.9433 0.456 0.9729 189.8 11.32
Coll : Colloid
The R2 values obtained for most of the fits were above 0.99, indicating good fits. Eu
sorption onto solid montmorillonite was best fitted by the Langmuir isotherm. In
addition, the predicted sorption capacities agree with those observed experimentally
in the sorption isotherms. The D-R fits exhibited lower R2 values for the three
metals, but suggested ion exchange mechanism for the sorption of the metals on
montmorillonite. Eu was the metal to present higher values of mean energy of
sorption. Finally, the Freundlich isotherm predicted the linear sorption of Cs on
colloids and the non-linear behaviour of the metals on montmorillonite.
2.3.2.2. Desorption experiments
Following the sorption experiments, a series of three consecutive desorptions were
carried out to study the extent of the reversibility of the sorption. To this purpose, an
aliquot of fresh electrolyte solution was added to restore the initial volume. The
activities obtained from the desorbed metal were transformed by mathematical
operations into metal concentrations. The plot of the desorbed metal concentration
versus the concentration of bound metal (from sorption) resulted in the desorption
isotherm. For ease of interpretation desorption is shown as desorption percentages.
This was possible when the desorption isotherms were linear in the range of
concentrations studied. As a result, the desorption percentage was derived from the
slope.
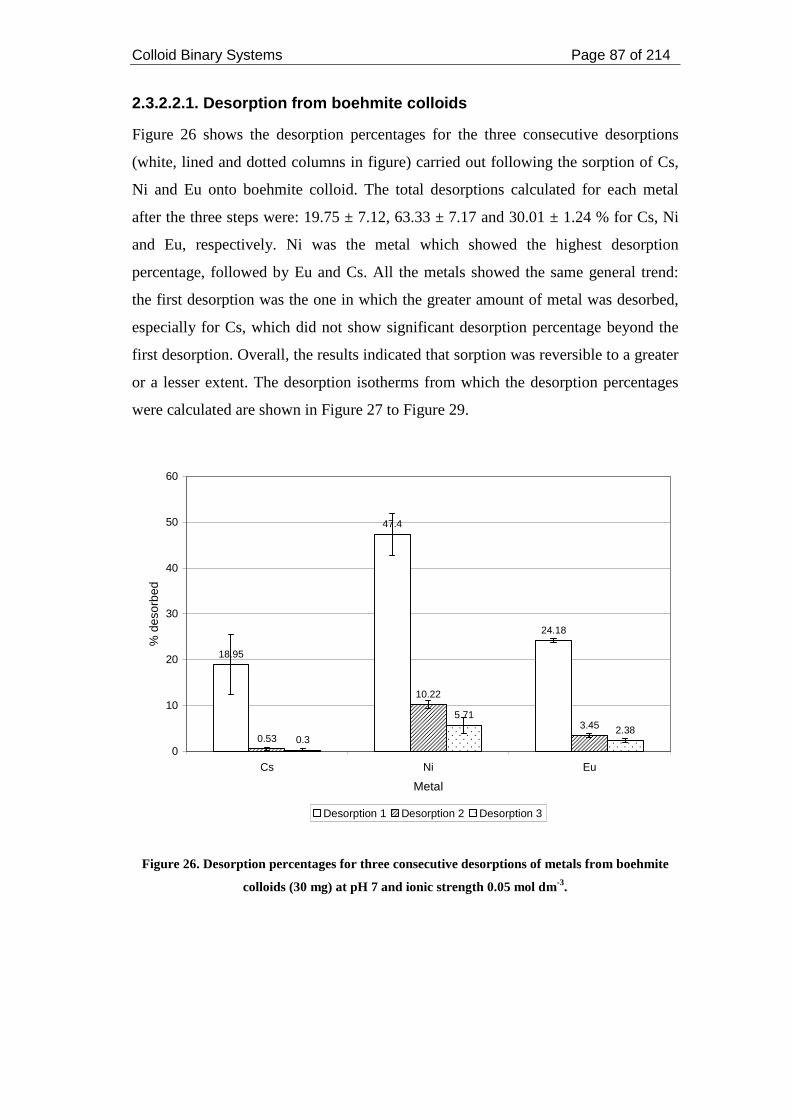
Colloid Binary Systems Page 87 of 214
2.3.2.2.1. Desorption from boehmite colloids
Figure 26 shows the desorption percentages for the three consecutive desorptions
(white, lined and dotted columns in figure) carried out following the sorption of Cs,
Ni and Eu onto boehmite colloid. The total desorptions calculated for each metal
after the three steps were: 19.75 ± 7.12, 63.33 ± 7.17 and 30.01 ± 1.24 % for Cs, Ni
and Eu, respectively. Ni was the metal which showed the highest desorption
percentage, followed by Eu and Cs. All the metals showed the same general trend:
the first desorption was the one in which the greater amount of metal was desorbed,
especially for Cs, which did not show significant desorption percentage beyond the
first desorption. Overall, the results indicated that sorption was reversible to a greater
or a lesser extent. The desorption isotherms from which the desorption percentages
were calculated are shown in Figure 27 to Figure 29.
18.95
47.4
24.18
0.53
10.22
3.45
0.3
5.71
2.38
0
10
20
30
40
50
60
Cs Ni Eu
Metal
% d
esor
bed
Desorption 1 Desorption 2 Desorption 3
Figure 26. Desorption percentages for three consecutive desorptions of metals from boehmite
colloids (30 mg) at pH 7 and ionic strength 0.05 mol dm-3.
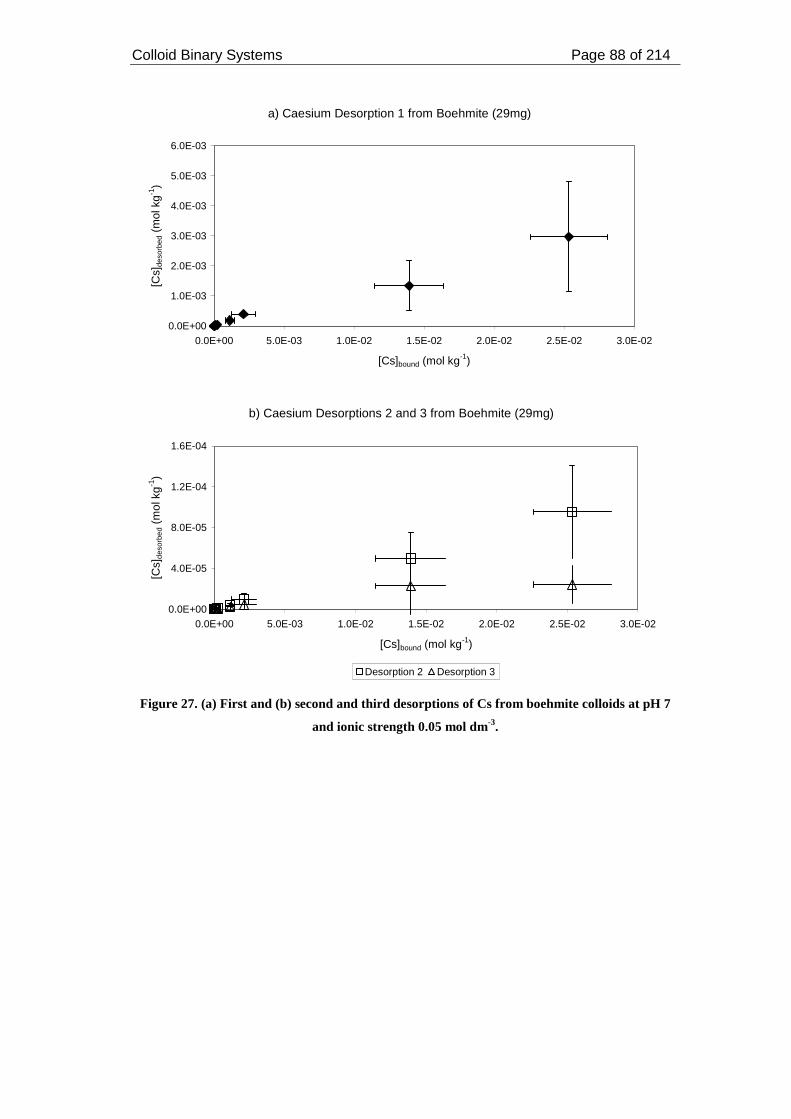
Colloid Binary Systems Page 88 of 214
a) Caesium Desorption 1 from Boehmite (29mg)
0.0E+00
1.0E-03
2.0E-03
3.0E-03
4.0E-03
5.0E-03
6.0E-03
0.0E+00 5.0E-03 1.0E-02 1.5E-02 2.0E-02 2.5E-02 3.0E-02
[Cs]bound (mol kg-1)
[Cs]
deso
rbed
(m
ol k
g-1
)
b) Caesium Desorptions 2 and 3 from Boehmite (29mg)
0.0E+00
4.0E-05
8.0E-05
1.2E-04
1.6E-04
0.0E+00 5.0E-03 1.0E-02 1.5E-02 2.0E-02 2.5E-02 3.0E-02
[Cs]bound (mol kg-1)
[Cs]
deso
rbed
(m
ol k
g-1)
Desorption 2 Desorption 3
Figure 27. (a) First and (b) second and third desorptions of Cs from boehmite colloids at pH 7
and ionic strength 0.05 mol dm-3.
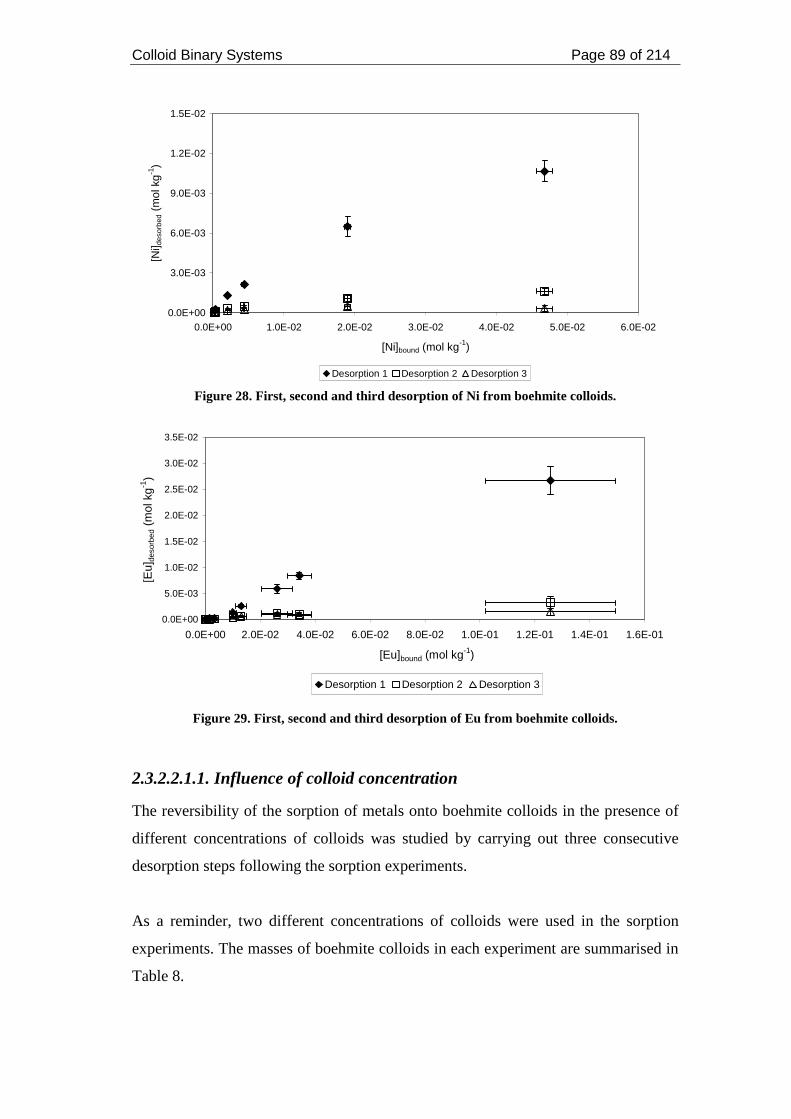
Colloid Binary Systems Page 89 of 214
0.0E+00
3.0E-03
6.0E-03
9.0E-03
1.2E-02
1.5E-02
0.0E+00 1.0E-02 2.0E-02 3.0E-02 4.0E-02 5.0E-02 6.0E-02
[Ni]bound (mol kg-1)
[Ni] d
esor
bed
(mol
kg
-1)
Desorption 1 Desorption 2 Desorption 3
Figure 28. First, second and third desorption of Ni from boehmite colloids.
0.0E+00
5.0E-03
1.0E-02
1.5E-02
2.0E-02
2.5E-02
3.0E-02
3.5E-02
0.0E+00 2.0E-02 4.0E-02 6.0E-02 8.0E-02 1.0E-01 1.2E-01 1.4E-01 1.6E-01
[Eu]bound (mol kg-1)
[Eu]
deso
rbed
(m
ol k
g-1)
Desorption 1 Desorption 2 Desorption 3
Figure 29. First, second and third desorption of Eu from boehmite colloids.
2.3.2.2.1.1. Influence of colloid concentration
The reversibility of the sorption of metals onto boehmite colloids in the presence of
different concentrations of colloids was studied by carrying out three consecutive
desorption steps following the sorption experiments.
As a reminder, two different concentrations of colloids were used in the sorption
experiments. The masses of boehmite colloids in each experiment are summarised in
Table 8.
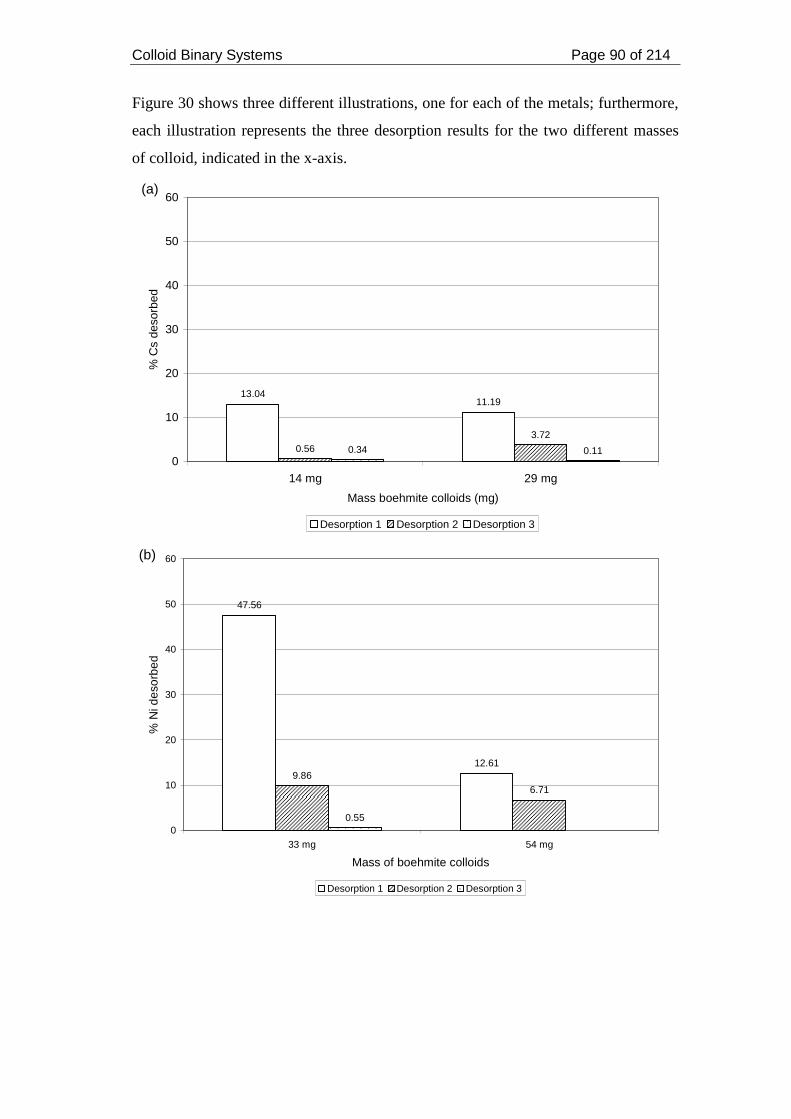
Colloid Binary Systems Page 90 of 214
Figure 30 shows three different illustrations, one for each of the metals; furthermore,
each illustration represents the three desorption results for the two different masses
of colloid, indicated in the x-axis.
13.0411.19
0.563.72
0.34 0.110
10
20
30
40
50
60
14 mg 29 mg
Mass boehmite colloids (mg)
% C
s de
sorb
ed
Desorption 1 Desorption 2 Desorption 3
(a)
47.56
12.619.86
6.71
0.550
10
20
30
40
50
60
33 mg 54 mg
Mass of boehmite colloids
% N
i des
orbe
d
Desorption 1 Desorption 2 Desorption 3
(b)
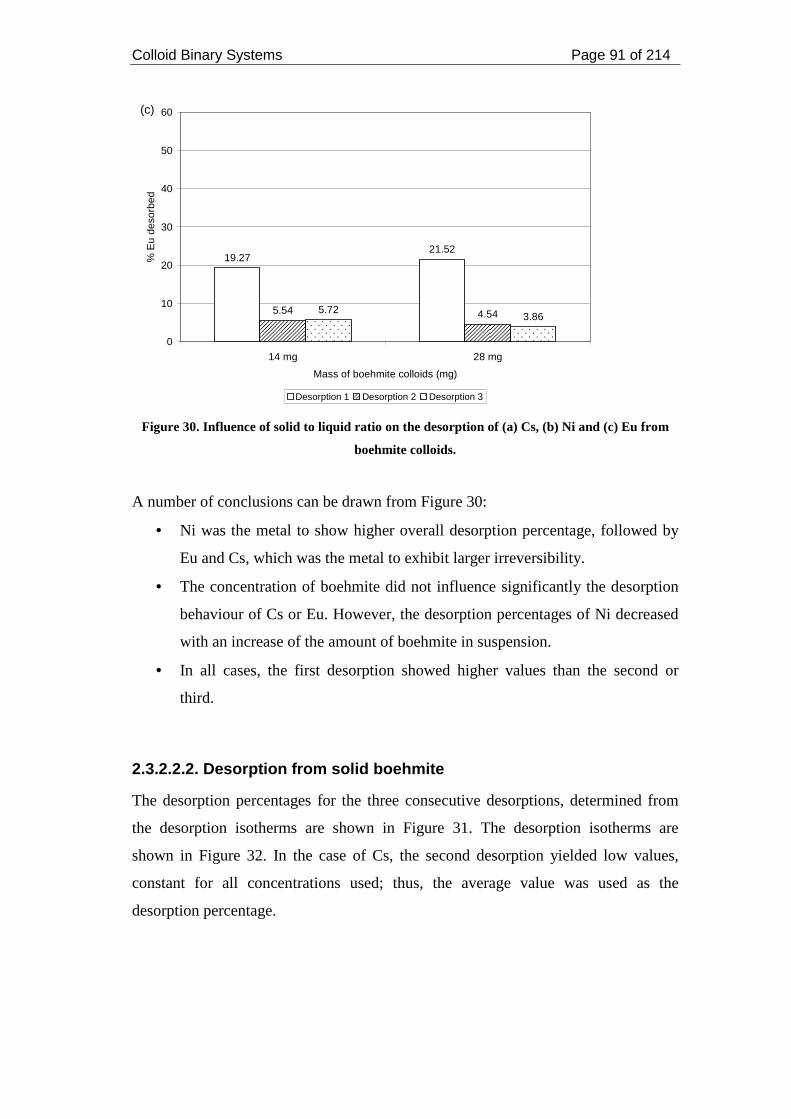
Colloid Binary Systems Page 91 of 214
19.2721.52
5.54 4.545.723.86
0
10
20
30
40
50
60
14 mg 28 mg
Mass of boehmite colloids (mg)
% E
u de
sorb
ed
Desorption 1 Desorption 2 Desorption 3
(c)
Figure 30. Influence of solid to liquid ratio on the desorption of (a) Cs, (b) Ni and (c) Eu from
boehmite colloids.
A number of conclusions can be drawn from Figure 30:
• Ni was the metal to show higher overall desorption percentage, followed by
Eu and Cs, which was the metal to exhibit larger irreversibility.
• The concentration of boehmite did not influence significantly the desorption
behaviour of Cs or Eu. However, the desorption percentages of Ni decreased
with an increase of the amount of boehmite in suspension.
• In all cases, the first desorption showed higher values than the second or
third.
2.3.2.2.2. Desorption from solid boehmite
The desorption percentages for the three consecutive desorptions, determined from
the desorption isotherms are shown in Figure 31. The desorption isotherms are
shown in Figure 32. In the case of Cs, the second desorption yielded low values,
constant for all concentrations used; thus, the average value was used as the
desorption percentage.
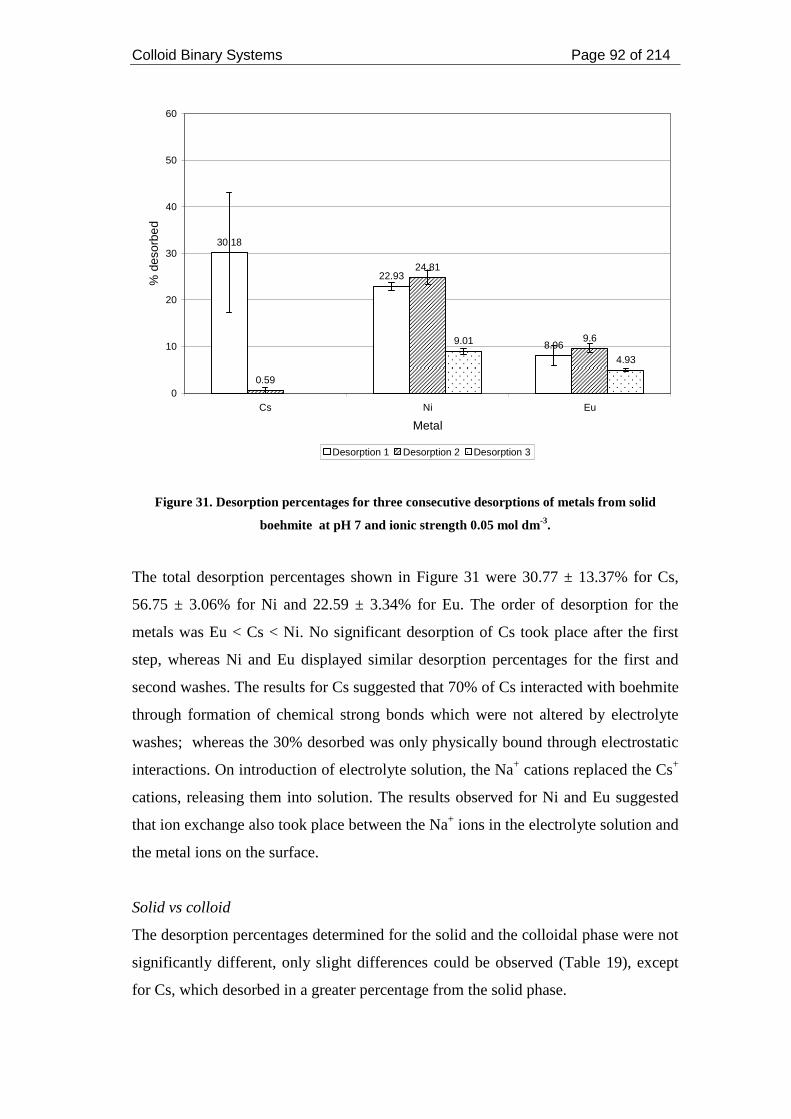
Colloid Binary Systems Page 92 of 214
30.18
22.93
8.06
0.59
24.81
9.69.01
4.93
0
10
20
30
40
50
60
Cs Ni Eu
Metal
% d
esor
bed
Desorption 1 Desorption 2 Desorption 3
Figure 31. Desorption percentages for three consecutive desorptions of metals from solid
boehmite at pH 7 and ionic strength 0.05 mol dm-3.
The total desorption percentages shown in Figure 31 were 30.77 ± 13.37% for Cs,
56.75 ± 3.06% for Ni and 22.59 ± 3.34% for Eu. The order of desorption for the
metals was Eu < Cs < Ni. No significant desorption of Cs took place after the first
step, whereas Ni and Eu displayed similar desorption percentages for the first and
second washes. The results for Cs suggested that 70% of Cs interacted with boehmite
through formation of chemical strong bonds which were not altered by electrolyte
washes; whereas the 30% desorbed was only physically bound through electrostatic
interactions. On introduction of electrolyte solution, the Na+ cations replaced the Cs+
cations, releasing them into solution. The results observed for Ni and Eu suggested
that ion exchange also took place between the Na+ ions in the electrolyte solution and
the metal ions on the surface.
Solid vs colloid
The desorption percentages determined for the solid and the colloidal phase were not
significantly different, only slight differences could be observed (Table 19), except
for Cs, which desorbed in a greater percentage from the solid phase.
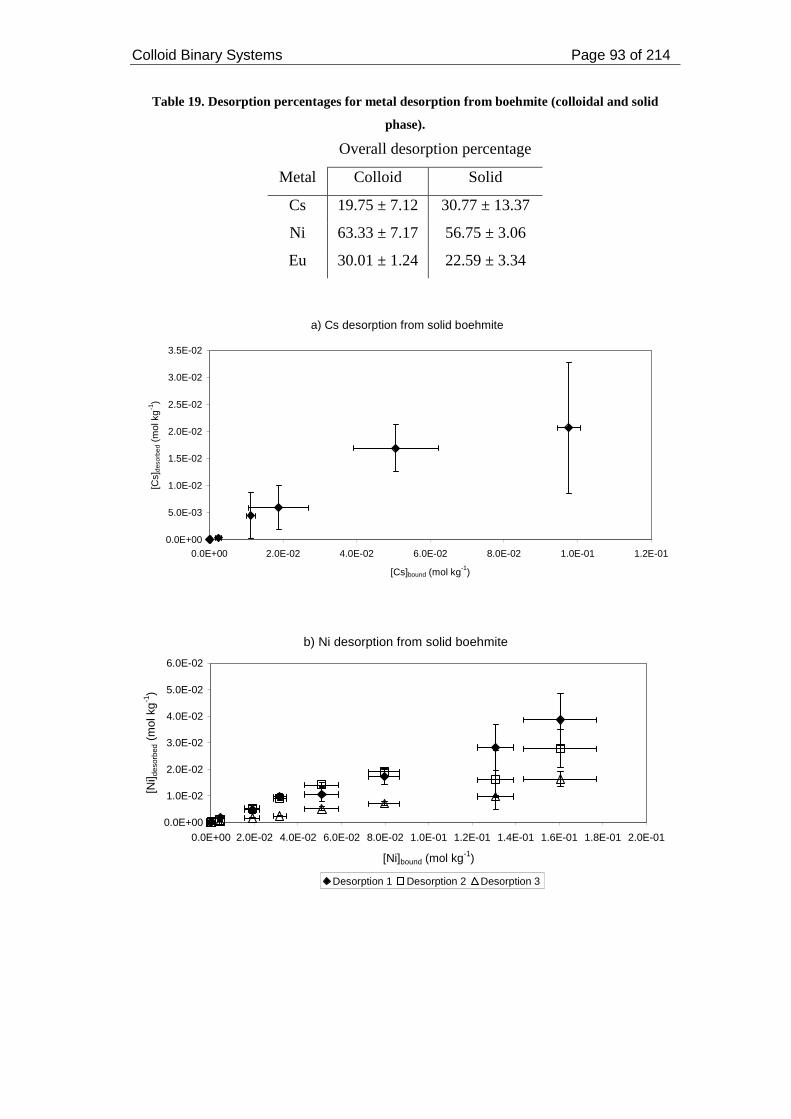
Colloid Binary Systems Page 93 of 214
Table 19. Desorption percentages for metal desorption from boehmite (colloidal and solid
phase).
Overall desorption percentage
Metal Colloid Solid
Cs 19.75 ± 7.12 30.77 ± 13.37
Ni 63.33 ± 7.17 56.75 ± 3.06
Eu 30.01 ± 1.24 22.59 ± 3.34
a) Cs desorption from solid boehmite
0.0E+00
5.0E-03
1.0E-02
1.5E-02
2.0E-02
2.5E-02
3.0E-02
3.5E-02
0.0E+00 2.0E-02 4.0E-02 6.0E-02 8.0E-02 1.0E-01 1.2E-01
[Cs]bound (mol kg-1)
[Cs]
deso
rbed
(m
ol k
g-1
)
b) Ni desorption from solid boehmite
0.0E+00
1.0E-02
2.0E-02
3.0E-02
4.0E-02
5.0E-02
6.0E-02
0.0E+00 2.0E-02 4.0E-02 6.0E-02 8.0E-02 1.0E-01 1.2E-01 1.4E-01 1.6E-01 1.8E-01 2.0E-01
[Ni]bound (mol kg-1)
[Ni] d
esor
bed
(mol
kg
-1)
Desorption 1 Desorption 2 Desorption 3
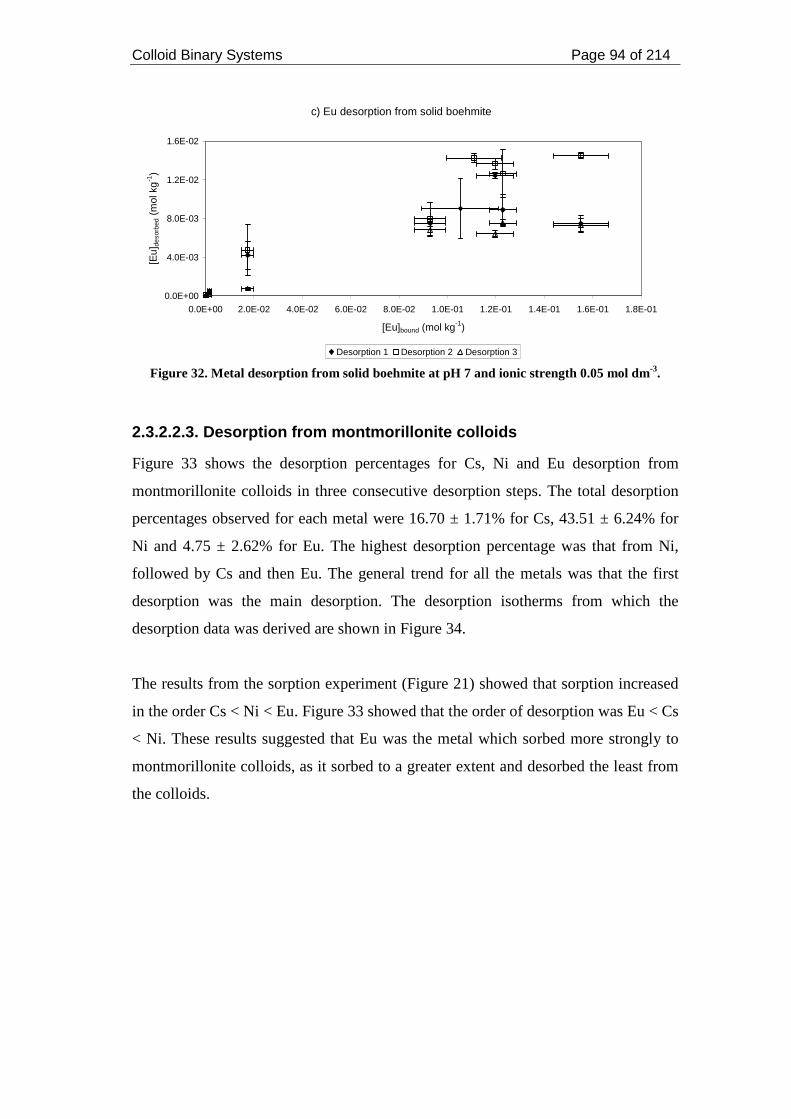
Colloid Binary Systems Page 94 of 214
c) Eu desorption from solid boehmite
0.0E+00
4.0E-03
8.0E-03
1.2E-02
1.6E-02
0.0E+00 2.0E-02 4.0E-02 6.0E-02 8.0E-02 1.0E-01 1.2E-01 1.4E-01 1.6E-01 1.8E-01
[Eu]bound (mol kg-1)
[Eu]
deso
rbed
(m
ol k
g-1
)
Desorption 1 Desorption 2 Desorption 3
Figure 32. Metal desorption from solid boehmite at pH 7 and ionic strength 0.05 mol dm-3.
2.3.2.2.3. Desorption from montmorillonite colloids
Figure 33 shows the desorption percentages for Cs, Ni and Eu desorption from
montmorillonite colloids in three consecutive desorption steps. The total desorption
percentages observed for each metal were 16.70 ± 1.71% for Cs, 43.51 ± 6.24% for
Ni and 4.75 ± 2.62% for Eu. The highest desorption percentage was that from Ni,
followed by Cs and then Eu. The general trend for all the metals was that the first
desorption was the main desorption. The desorption isotherms from which the
desorption data was derived are shown in Figure 34.
The results from the sorption experiment (Figure 21) showed that sorption increased
in the order Cs < Ni < Eu. Figure 33 showed that the order of desorption was Eu < Cs
< Ni. These results suggested that Eu was the metal which sorbed more strongly to
montmorillonite colloids, as it sorbed to a greater extent and desorbed the least from
the colloids.
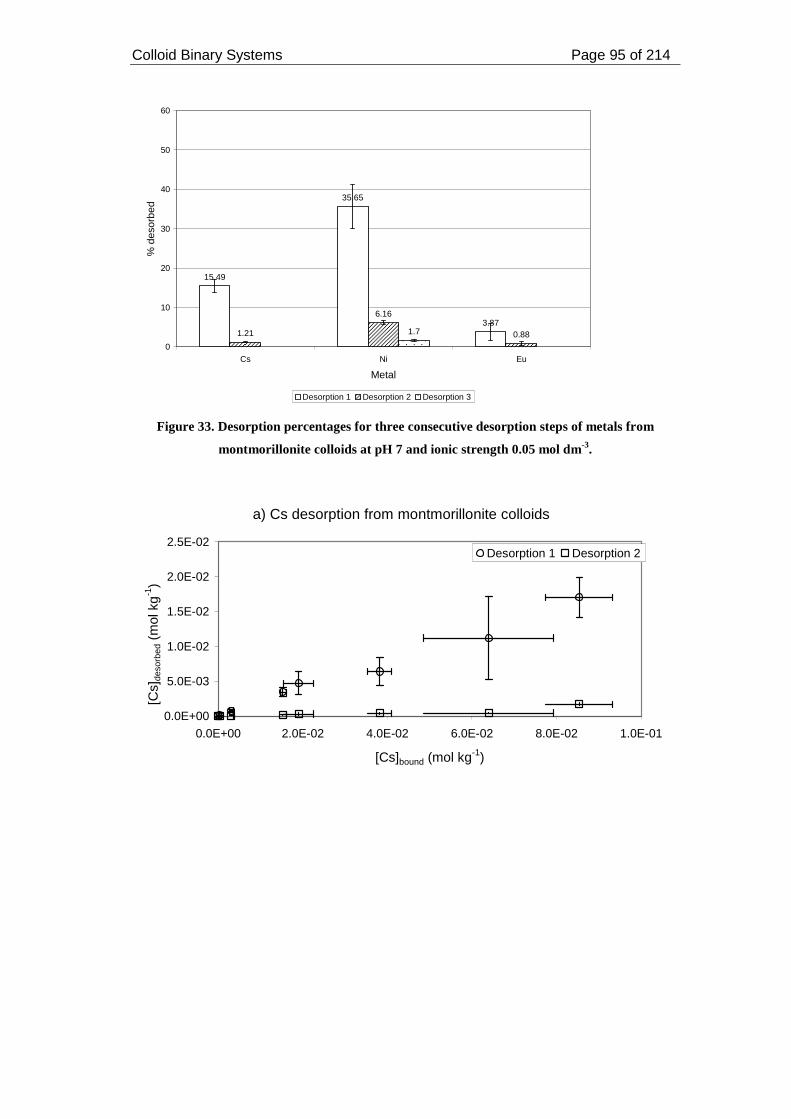
Colloid Binary Systems Page 95 of 214
15.49
35.65
3.871.21
6.16
0.881.7
0
10
20
30
40
50
60
Cs Ni Eu
Metal
% d
esor
bed
Desorption 1 Desorption 2 Desorption 3
Figure 33. Desorption percentages for three consecutive desorption steps of metals from
montmorillonite colloids at pH 7 and ionic strength 0.05 mol dm-3.
a) Cs desorption from montmorillonite colloids
0.0E+00
5.0E-03
1.0E-02
1.5E-02
2.0E-02
2.5E-02
0.0E+00 2.0E-02 4.0E-02 6.0E-02 8.0E-02 1.0E-01
[Cs]bound (mol kg-1)
[Cs]
deso
rbed
(m
ol k
g-1
)
Desorption 1 Desorption 2
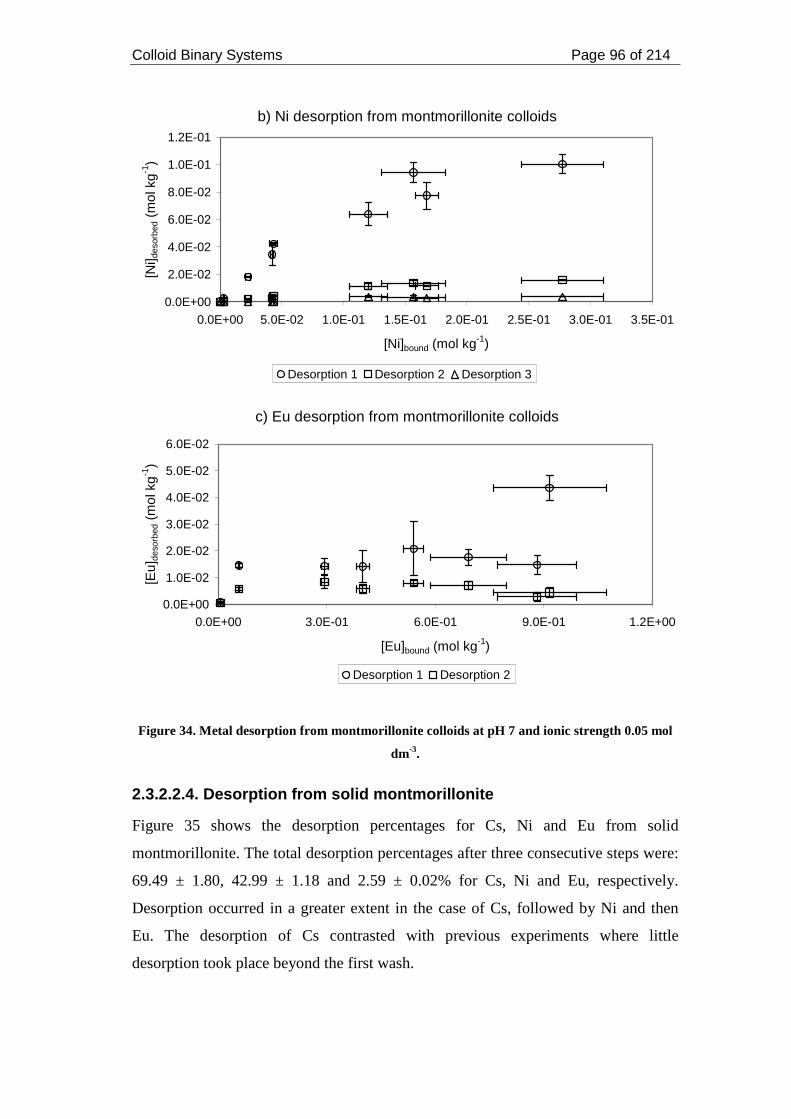
Colloid Binary Systems Page 96 of 214
b) Ni desorption from montmorillonite colloids
0.0E+00
2.0E-02
4.0E-02
6.0E-02
8.0E-02
1.0E-01
1.2E-01
0.0E+00 5.0E-02 1.0E-01 1.5E-01 2.0E-01 2.5E-01 3.0E-01 3.5E-01
[Ni]bound (mol kg-1)
[Ni] d
esor
bed
(mol
kg-1
)
Desorption 1 Desorption 2 Desorption 3
c) Eu desorption from montmorillonite colloids
0.0E+00
1.0E-02
2.0E-02
3.0E-02
4.0E-02
5.0E-02
6.0E-02
0.0E+00 3.0E-01 6.0E-01 9.0E-01 1.2E+00
[Eu]bound (mol kg-1)
[Eu]
deso
rbed
(m
ol k
g-1)
Desorption 1 Desorption 2
Figure 34. Metal desorption from montmorillonite colloids at pH 7 and ionic strength 0.05 mol
dm-3.
2.3.2.2.4. Desorption from solid montmorillonite
Figure 35 shows the desorption percentages for Cs, Ni and Eu from solid
montmorillonite. The total desorption percentages after three consecutive steps were:
69.49 ± 1.80, 42.99 ± 1.18 and 2.59 ± 0.02% for Cs, Ni and Eu, respectively.
Desorption occurred in a greater extent in the case of Cs, followed by Ni and then
Eu. The desorption of Cs contrasted with previous experiments where little
desorption took place beyond the first wash.
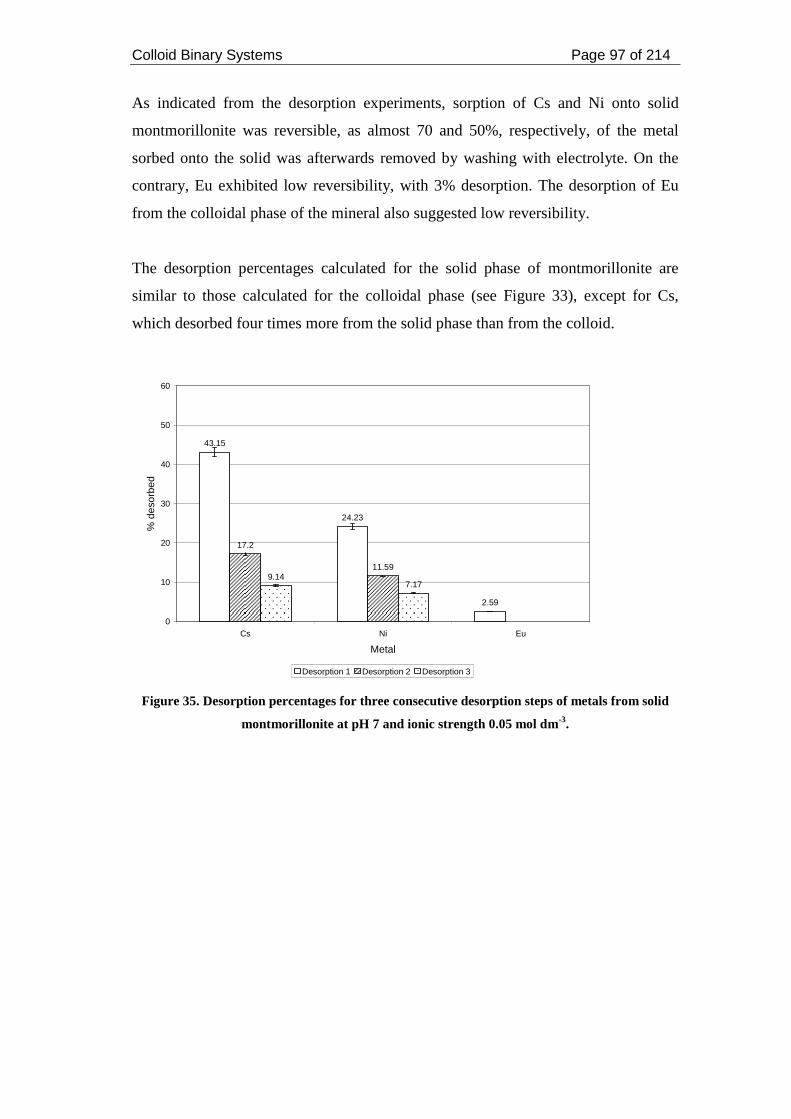
Colloid Binary Systems Page 97 of 214
As indicated from the desorption experiments, sorption of Cs and Ni onto solid
montmorillonite was reversible, as almost 70 and 50%, respectively, of the metal
sorbed onto the solid was afterwards removed by washing with electrolyte. On the
contrary, Eu exhibited low reversibility, with 3% desorption. The desorption of Eu
from the colloidal phase of the mineral also suggested low reversibility.
The desorption percentages calculated for the solid phase of montmorillonite are
similar to those calculated for the colloidal phase (see Figure 33), except for Cs,
which desorbed four times more from the solid phase than from the colloid.
43.15
24.23
2.59
17.2
11.599.14
7.17
0
10
20
30
40
50
60
Cs Ni Eu
Metal
% d
esor
bed
Desorption 1 Desorption 2 Desorption 3
Figure 35. Desorption percentages for three consecutive desorption steps of metals from solid
montmorillonite at pH 7 and ionic strength 0.05 mol dm-3.
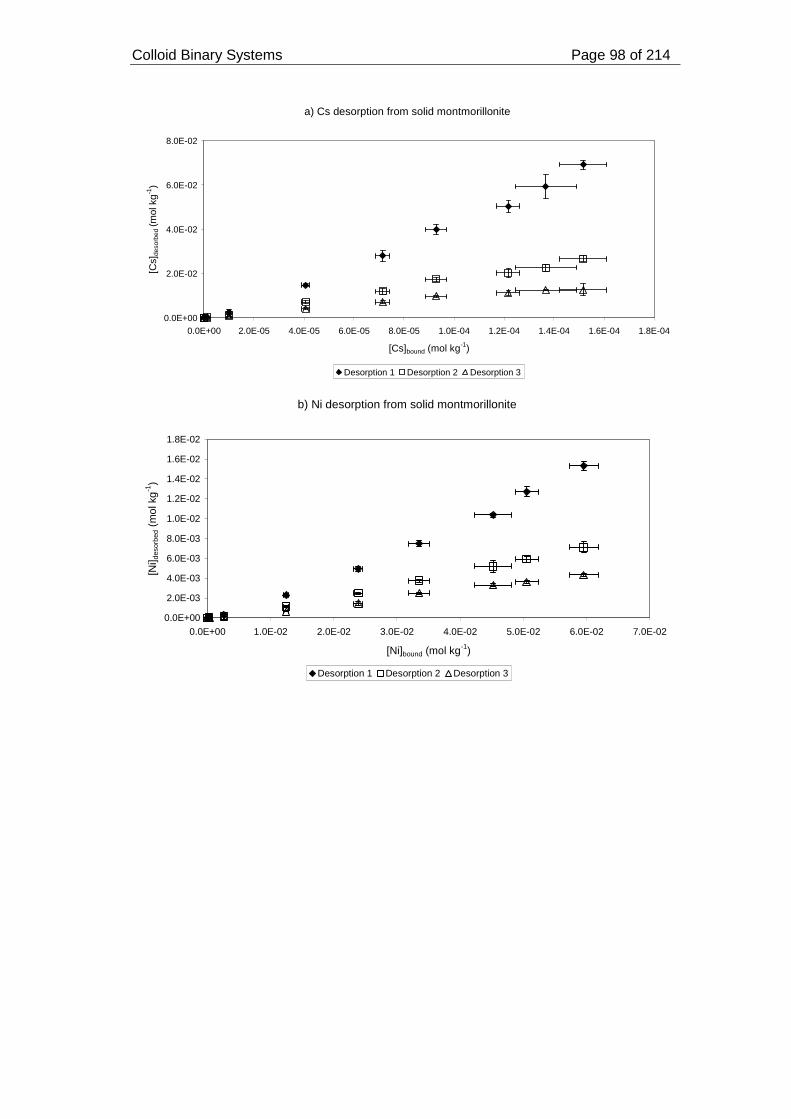
Colloid Binary Systems Page 98 of 214
a) Cs desorption from solid montmorillonite
0.0E+00
2.0E-02
4.0E-02
6.0E-02
8.0E-02
0.0E+00 2.0E-05 4.0E-05 6.0E-05 8.0E-05 1.0E-04 1.2E-04 1.4E-04 1.6E-04 1.8E-04
[Cs]bound (mol kg-1)
[Cs]
deso
rbed
(mol
kg
-1)
Desorption 1 Desorption 2 Desorption 3
b) Ni desorption from solid montmorillonite
0.0E+00
2.0E-03
4.0E-03
6.0E-03
8.0E-03
1.0E-02
1.2E-02
1.4E-02
1.6E-02
1.8E-02
0.0E+00 1.0E-02 2.0E-02 3.0E-02 4.0E-02 5.0E-02 6.0E-02 7.0E-02
[Ni]bound (mol kg-1)
[Ni] d
esor
bed
(mol
kg
-1)
Desorption 1 Desorption 2 Desorption 3
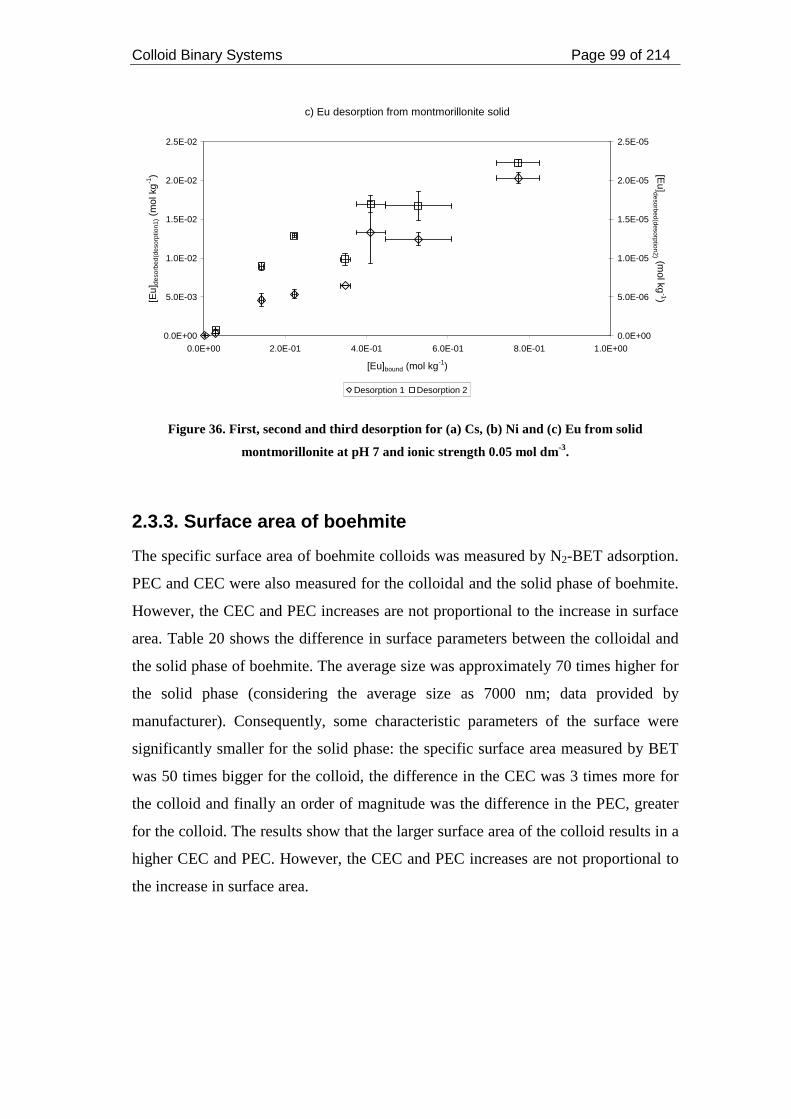
Colloid Binary Systems Page 99 of 214
c) Eu desorption from montmorillonite solid
0.0E+00
5.0E-03
1.0E-02
1.5E-02
2.0E-02
2.5E-02
0.0E+00 2.0E-01 4.0E-01 6.0E-01 8.0E-01 1.0E+00
[Eu]bound (mol kg-1)
[Eu]
deso
rbed
(des
orpt
ion1
) (m
ol k
g-1
)
0.0E+00
5.0E-06
1.0E-05
1.5E-05
2.0E-05
2.5E-05[E
u]desorbed(desorption2) (mol kg
-1)
Desorption 1 Desorption 2
Figure 36. First, second and third desorption for (a) Cs, (b) Ni and (c) Eu from solid
montmorillonite at pH 7 and ionic strength 0.05 mol dm-3.
2.3.3. Surface area of boehmite
The specific surface area of boehmite colloids was measured by N2-BET adsorption.
PEC and CEC were also measured for the colloidal and the solid phase of boehmite.
However, the CEC and PEC increases are not proportional to the increase in surface
area. Table 20 shows the difference in surface parameters between the colloidal and
the solid phase of boehmite. The average size was approximately 70 times higher for
the solid phase (considering the average size as 7000 nm; data provided by
manufacturer). Consequently, some characteristic parameters of the surface were
significantly smaller for the solid phase: the specific surface area measured by BET
was 50 times bigger for the colloid, the difference in the CEC was 3 times more for
the colloid and finally an order of magnitude was the difference in the PEC, greater
for the colloid. The results show that the larger surface area of the colloid results in a
higher CEC and PEC. However, the CEC and PEC increases are not proportional to
the increase in surface area.
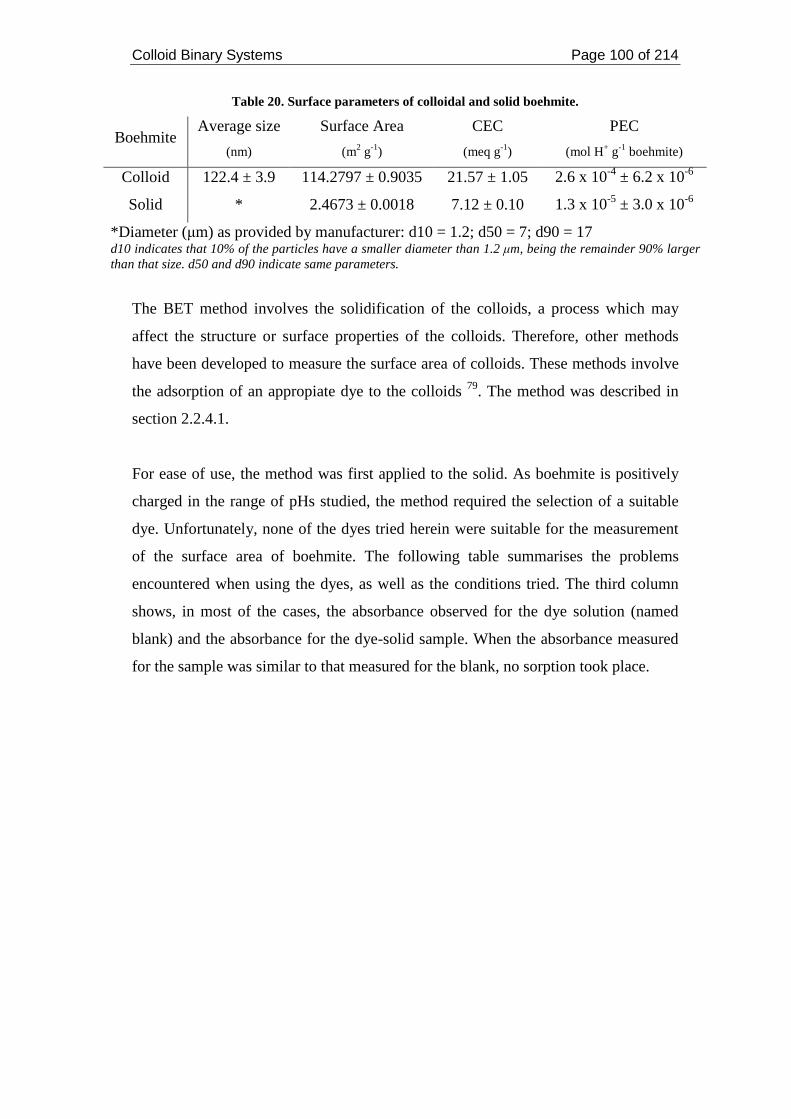
Colloid Binary Systems Page 100 of 214
Table 20. Surface parameters of colloidal and solid boehmite.
Boehmite Average size
(nm)
Surface Area
(m2 g-1)
CEC
(meq g-1)
PEC
(mol H+ g-1 boehmite)
Colloid 122.4 ± 3.9 114.2797 ± 0.9035 21.57 ± 1.05 2.6 x 10⁻⁴ ± 6.2 x 10⁻⁶
Solid * 2.4673 ± 0.0018 7.12 ± 0.10 1.3 x 10⁻⁵ ± 3.0 x 10⁻⁶
*Diameter (µm) as provided by manufacturer: d10 = 1.2; d50 = 7; d90 = 17 d10 indicates that 10% of the particles have a smaller diameter than 1.2 µm, being the remainder 90% larger than that size. d50 and d90 indicate same parameters.
The BET method involves the solidification of the colloids, a process which may
affect the structure or surface properties of the colloids. Therefore, other methods
have been developed to measure the surface area of colloids. These methods involve
the adsorption of an appropiate dye to the colloids 79. The method was described in
section 2.2.4.1.
For ease of use, the method was first applied to the solid. As boehmite is positively
charged in the range of pHs studied, the method required the selection of a suitable
dye. Unfortunately, none of the dyes tried herein were suitable for the measurement
of the surface area of boehmite. The following table summarises the problems
encountered when using the dyes, as well as the conditions tried. The third column
shows, in most of the cases, the absorbance observed for the dye solution (named
blank) and the absorbance for the dye-solid sample. When the absorbance measured
for the sample was similar to that measured for the blank, no sorption took place.
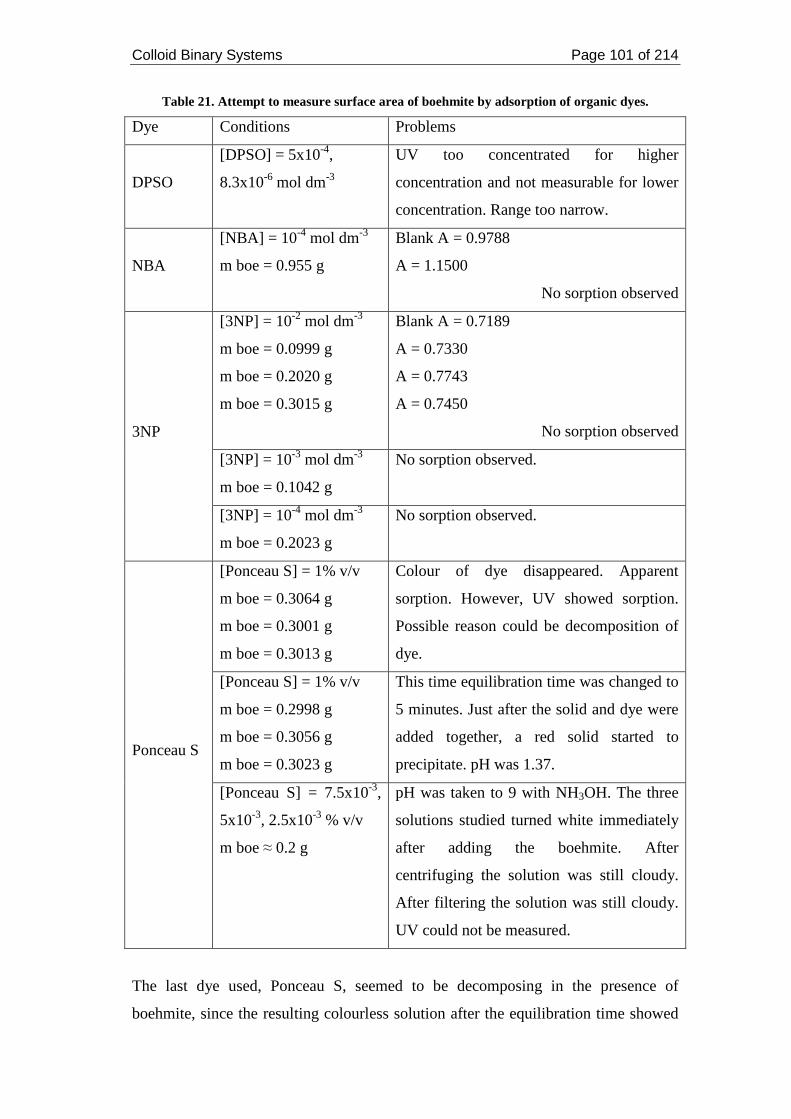
Colloid Binary Systems Page 101 of 214
Table 21. Attempt to measure surface area of boehmite by adsorption of organic dyes.
Dye Conditions Problems
DPSO
[DPSO] = 5x10⁻⁴,
8.3x10⁻⁶ mol dm-3
UV too concentrated for higher
concentration and not measurable for lower
concentration. Range too narrow.
NBA
[NBA] = 10-4 mol dm-3
m boe = 0.955 g
Blank A = 0.9788
A = 1.1500
No sorption observed
[3NP] = 10-2 mol dm-3
m boe = 0.0999 g
m boe = 0.2020 g
m boe = 0.3015 g
Blank A = 0.7189
A = 0.7330
A = 0.7743
A = 0.7450
No sorption observed
[3NP] = 10-3 mol dm-3
m boe = 0.1042 g
No sorption observed.
3NP
[3NP] = 10-4 mol dm-3
m boe = 0.2023 g
No sorption observed.
[Ponceau S] = 1% v/v
m boe = 0.3064 g
m boe = 0.3001 g
m boe = 0.3013 g
Colour of dye disappeared. Apparent
sorption. However, UV showed sorption.
Possible reason could be decomposition of
dye.
[Ponceau S] = 1% v/v
m boe = 0.2998 g
m boe = 0.3056 g
m boe = 0.3023 g
This time equilibration time was changed to
5 minutes. Just after the solid and dye were
added together, a red solid started to
precipitate. pH was 1.37. Ponceau S
[Ponceau S] = 7.5x10⁻³,
5x10⁻³, 2.5x10⁻³ % v/v
m boe ≈ 0.2 g
pH was taken to 9 with NH3OH. The three
solutions studied turned white immediately
after adding the boehmite. After
centrifuging the solution was still cloudy.
After filtering the solution was still cloudy.
UV could not be measured.
The last dye used, Ponceau S, seemed to be decomposing in the presence of
boehmite, since the resulting colourless solution after the equilibration time showed
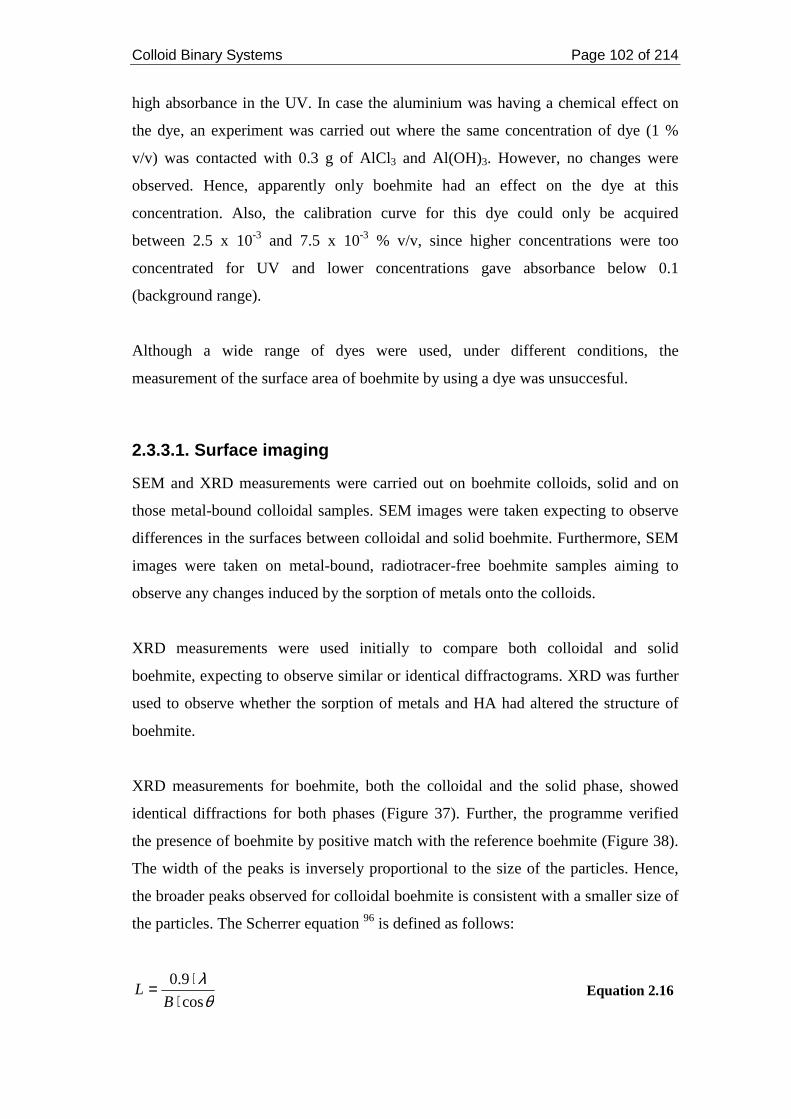
Colloid Binary Systems Page 102 of 214
high absorbance in the UV. In case the aluminium was having a chemical effect on
the dye, an experiment was carried out where the same concentration of dye (1 %
v/v) was contacted with 0.3 g of AlCl3 and Al(OH)3. However, no changes were
observed. Hence, apparently only boehmite had an effect on the dye at this
concentration. Also, the calibration curve for this dye could only be acquired
between 2.5 x 10⁻³ and 7.5 x 10⁻³ % v/v, since higher concentrations were too
concentrated for UV and lower concentrations gave absorbance below 0.1
(background range).
Although a wide range of dyes were used, under different conditions, the
measurement of the surface area of boehmite by using a dye was unsuccesful.
2.3.3.1. Surface imaging
SEM and XRD measurements were carried out on boehmite colloids, solid and on
those metal-bound colloidal samples. SEM images were taken expecting to observe
differences in the surfaces between colloidal and solid boehmite. Furthermore, SEM
images were taken on metal-bound, radiotracer-free boehmite samples aiming to
observe any changes induced by the sorption of metals onto the colloids.
XRD measurements were used initially to compare both colloidal and solid
boehmite, expecting to observe similar or identical diffractograms. XRD was further
used to observe whether the sorption of metals and HA had altered the structure of
boehmite.
XRD measurements for boehmite, both the colloidal and the solid phase, showed
identical diffractions for both phases (Figure 37). Further, the programme verified
the presence of boehmite by positive match with the reference boehmite (Figure 38).
The width of the peaks is inversely proportional to the size of the particles. Hence,
the broader peaks observed for colloidal boehmite is consistent with a smaller size of
the particles. The Scherrer equation 96 is defined as follows:
θλ
cos
9.0
⋅⋅=
BL Equation 2.16
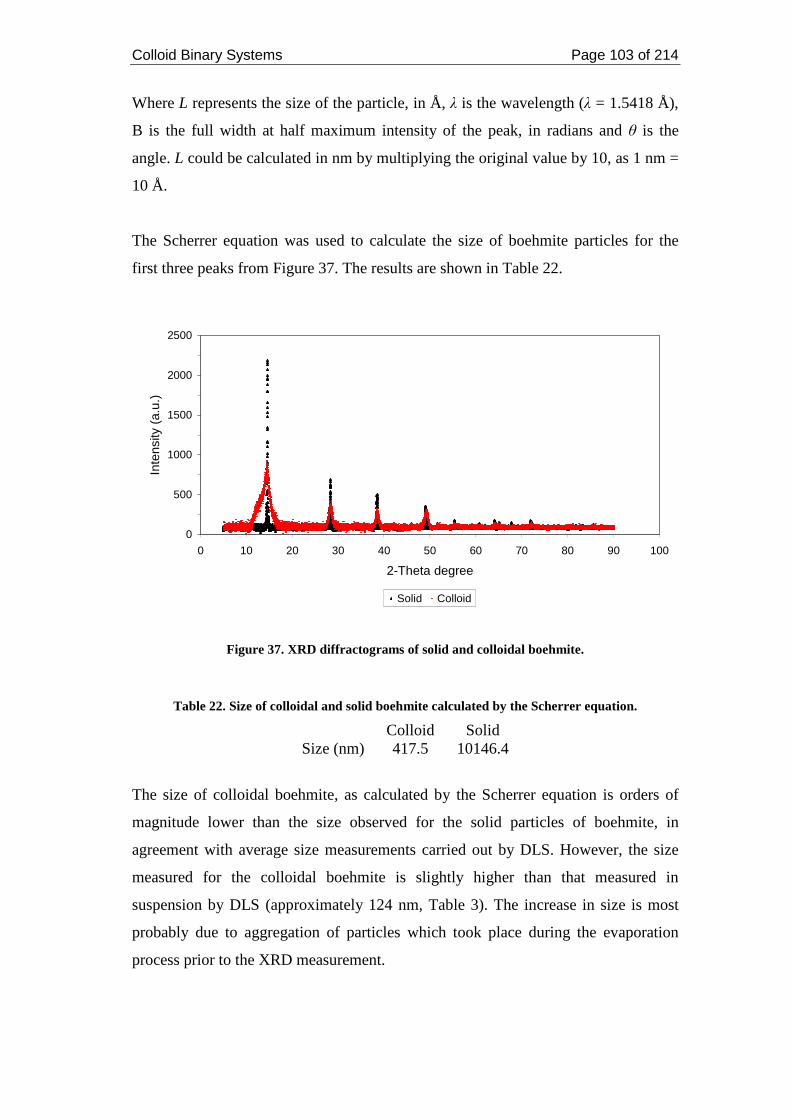
Colloid Binary Systems Page 103 of 214
Where L represents the size of the particle, in Å, λ is the wavelength (λ = 1.5418 Å),
B is the full width at half maximum intensity of the peak, in radians and θ is the
angle. L could be calculated in nm by multiplying the original value by 10, as 1 nm =
10 Å.
The Scherrer equation was used to calculate the size of boehmite particles for the
first three peaks from Figure 37. The results are shown in Table 22.
0
500
1000
1500
2000
2500
0 10 20 30 40 50 60 70 80 90 100
2-Theta degree
Inte
nsity
(a.
u.)
Solid Colloid
Figure 37. XRD diffractograms of solid and colloidal boehmite.
Table 22. Size of colloidal and solid boehmite calculated by the Scherrer equation.
Colloid Solid Size (nm) 417.5 10146.4
The size of colloidal boehmite, as calculated by the Scherrer equation is orders of
magnitude lower than the size observed for the solid particles of boehmite, in
agreement with average size measurements carried out by DLS. However, the size
measured for the colloidal boehmite is slightly higher than that measured in
suspension by DLS (approximately 124 nm, Table 3). The increase in size is most
probably due to aggregation of particles which took place during the evaporation
process prior to the XRD measurement.

Colloid Binary Systems Page 104 of 214
Two important conclusions could be drawn from the XRD measurements: (a) the
size of colloidal particles was indeed significantly lower than the size of solid
particles and that the solidification process affected the colloidal suspension by
forming aggregates which altered the surface characteristics of the colloids, i.e. their
size.
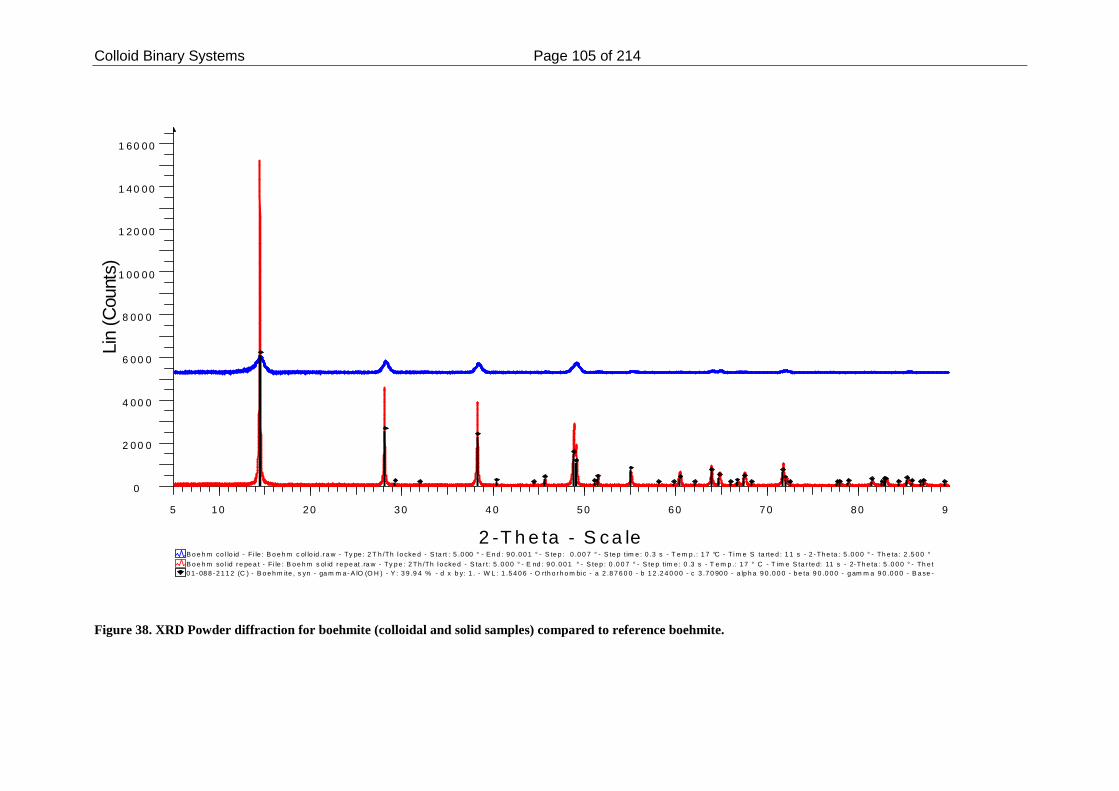
Colloid Binary Systems Page 105 of 214
0 1 - 08 8 - 2 1 1 2 (C ) - B o e h m ite , s yn - ga m m a - A lO (O H ) - Y : 3 9 .9 4 % - d x b y: 1 . - W L : 1 .5 4 0 6 - O rth o r h o m bic - a 2 .8 7 6 0 0 - b 1 2 .2 4 0 0 0 - c 3 .7 0 90 0 - a lp h a 9 0 .0 0 0 - b e ta 9 0 .0 0 0 - g am m a 9 0 .0 0 0 - B a se -B o e h m so l id r e pe a t - F i le : B o e h m s ol id r e p e at .ra w - Ty p e : 2 Th /Th l o cke d - S ta r t: 5 .0 0 0 ° - E nd : 9 0 .0 0 1 ° - S te p : 0 .0 0 7 ° - S te p tim e : 0 .3 s - T e m p .: 1 7 ° C - T im e S ta r te d: 11 s - 2- Th e ta : 5 .0 0 0 ° - Th e t
B o e h m co l lo id - F i le : B o e h m c ol lo id .r a w - Ty pe : 2 T h /Th l o cke d - S ta rt : 5 .0 00 ° - E n d : 9 0 .0 0 1 ° - S te p : 0 .0 0 7 ° - S te p tim e : 0 .3 s - T e m p .: 1 7 °C - T im e S ta rte d : 1 1 s - 2 - Th e ta : 5 .0 0 0 ° - Th e ta : 2 .5 0 0 °
Lin
(Cou
nts)
0
2 0 0 0
4 0 0 0
6 0 0 0
8 0 0 0
1 0 0 0 0
1 2 0 0 0
1 4 0 0 0
1 6 0 0 0
2 -T h e ta - S c a le
5 1 0 2 0 3 0 4 0 5 0 6 0 7 0 8 0 9 0
Figure 38. XRD Powder diffraction for boehmite (colloidal and solid samples) compared to reference boehmite.
Colloid Binary Systems Page 106 of 214
The powder diffractions observed in Figure 37 show the presence of peaks at the
same 2-theta degree, indicating that the same mineral was being analysed. The
broader peak for the colloidal boehmite sample, together with the smaller (lower
intensity) peaks, are probably due to the smaller amount of sample introduced in the
instrument.
XRD measurements for boehmite colloids and metal-bound-boehmite colloids
showed no significant differences, suggesting that the metals did not cause any
alteration in the structure of boehmite (Figure 39).
0
200
400
600
800
1000
0 10 20 30 40 50 60 70 80 90 100
2-Theta-Scale
Inte
nsi
ty (
a.u
.)
Boehmite Colloids Boehmite + Cs Boehmite + Ni Boehmite + Eu
Figure 39. Effect of metal binding on boehmite colloids.
The SEM images were combined with EDAX mapping. The latter confirmed Al and
O were dominant in boehmite. The images for boehmite colloids and solid are shown
in Figure 40.
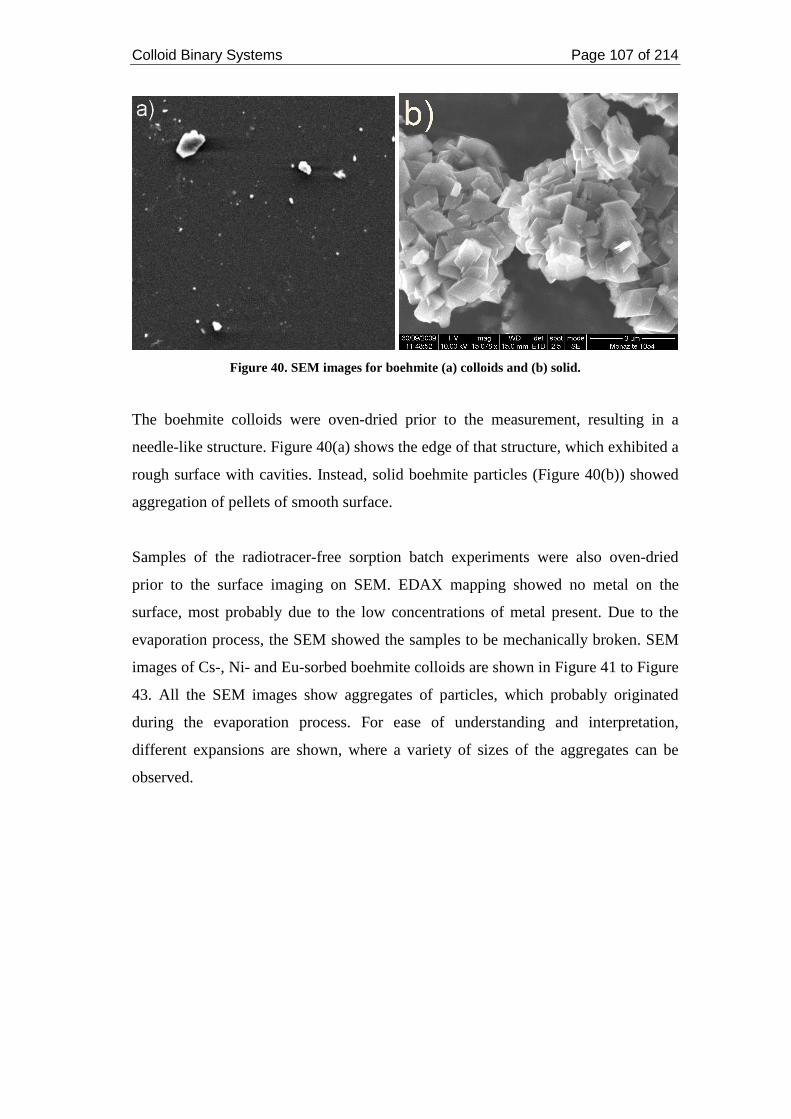
Colloid Binary Systems Page 107 of 214
Figure 40. SEM images for boehmite (a) colloids and (b) solid.
The boehmite colloids were oven-dried prior to the measurement, resulting in a
needle-like structure. Figure 40(a) shows the edge of that structure, which exhibited a
rough surface with cavities. Instead, solid boehmite particles (Figure 40(b)) showed
aggregation of pellets of smooth surface.
Samples of the radiotracer-free sorption batch experiments were also oven-dried
prior to the surface imaging on SEM. EDAX mapping showed no metal on the
surface, most probably due to the low concentrations of metal present. Due to the
evaporation process, the SEM showed the samples to be mechanically broken. SEM
images of Cs-, Ni- and Eu-sorbed boehmite colloids are shown in Figure 41 to Figure
43. All the SEM images show aggregates of particles, which probably originated
during the evaporation process. For ease of understanding and interpretation,
different expansions are shown, where a variety of sizes of the aggregates can be
observed.
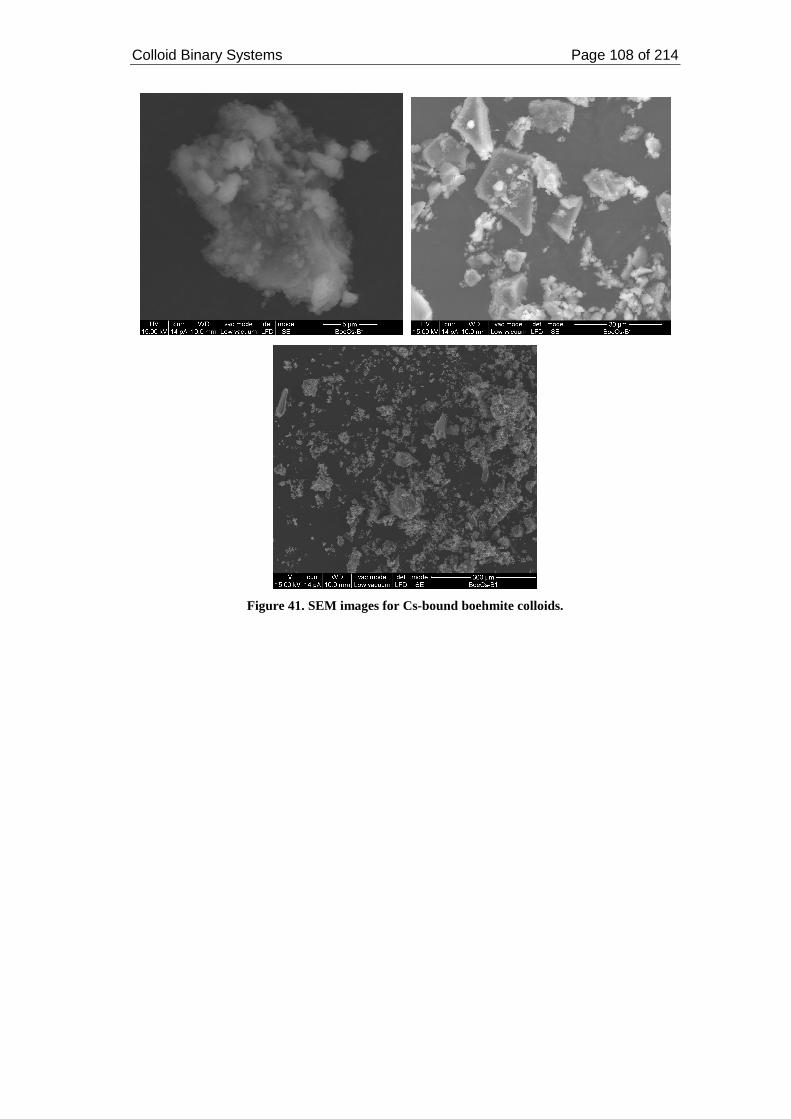
Colloid Binary Systems Page 108 of 214
Figure 41. SEM images for Cs-bound boehmite colloids.
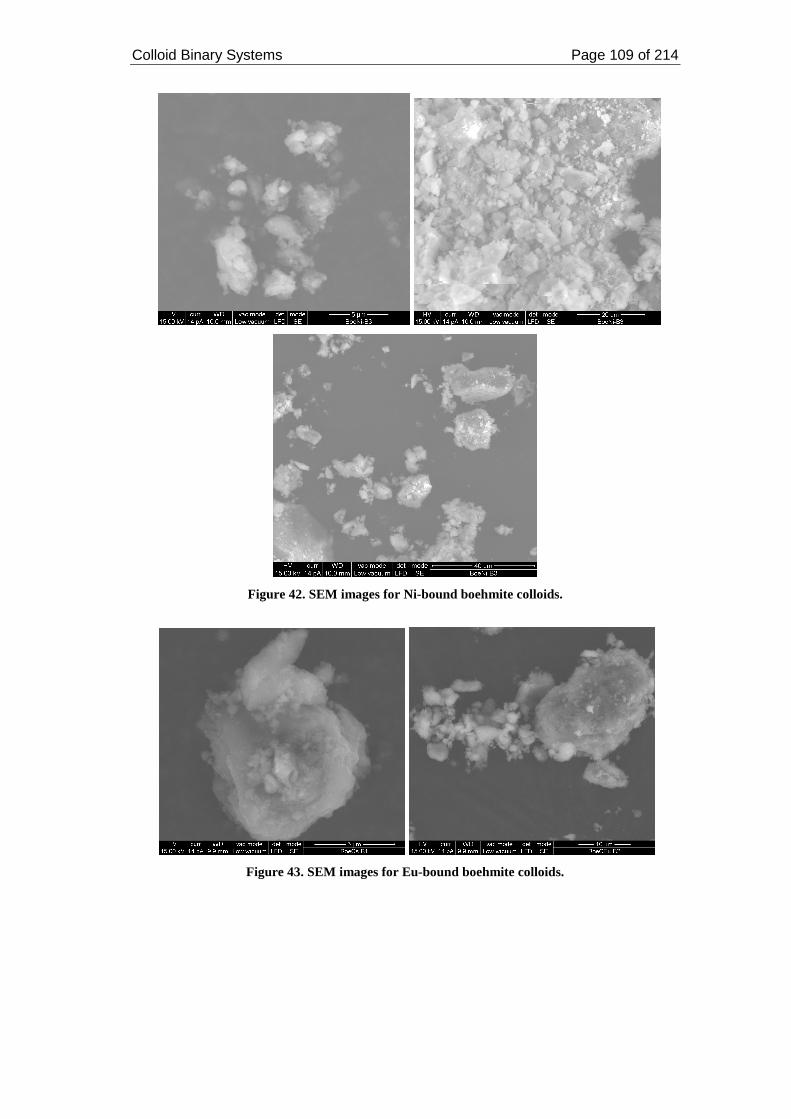
Colloid Binary Systems Page 109 of 214
Figure 42. SEM images for Ni-bound boehmite colloids.
Figure 43. SEM images for Eu-bound boehmite colloids.

Colloid Binary Systems Page 110 of 214
2.4. Discussions
Other studies reported in the literature have shown that metal sorption has generally
been studied on solid surfaces rather than colloidal surfaces. The investigations
herein have shown sorption isotherms and interpretations on both phases of minerals.
2.4.1. Metals and Boehmite
Sorption of Cs, Ni and Eu studied in this work, together with other investigations
have shown that boehmite, despite being positively charged, can act as an adsorbent
of cations through the OH- groups. Spectroscopic studies have shown the
mechanisms of interaction of multivalent metals with boehmite colloids. In this
manner, Cu(II) was found to coordinate to the oxygens in the AlOOH 97, thereby
forming inner-sphere complexes. As(V) associated to boehmite by forming bidentate
binuclear structures, where As coordinated to two oxygens in a tetrahedral
coordination 98. Hiemstra et al. 99 concluded that the sorption of Fe(II) to boehmite
could be explained in the same manner. Meng et al. 100 studied the sorption of Eu
onto pseudo-boehmite and found that the chemical adsorption was due to
electrostatic attraction. Phosphorous covered 20% of the boehmite surface at pH 4 101. Liu et al. 102 observed the reversibility of the sorption of Cd(II) to boehmite by
means of column experiments. Finally, the reversibility of the sorption of metals onto
boehmite colloids has also been observed in the case of Cr(VI) 59 and Rh(VII) 53.
To summarise the experimental observations, the sorption of metals onto boehmite
(colloids and solid) increased with the ionic charge of the metal, and the Rd values
were higher for the sorption onto the colloidal phase compared to those on the solid
phase, due to the higher surface area of the colloid. Desorption experiments showed
that Ni was the metal to desorb the most after three consecutive washes and that Cs
desorption took place mainly after the first desorption. In the case of this metal,
further washes did not exctract more metal from the surface of either colloidal or
solid boehmite.
Na+ ions, present in solution, compete succesfully with Cs+ ions for outer-sphere
sites 103, leading to a reversible sorption of Cs on boehmite, as observed
Colloid Binary Systems Page 111 of 214
experimentally. However, this reversibility was only partial, as a significant amount
of Cs remained sorbed after the first desorption. Hence, not only ion exchange
mechanism, but also inner-sphere complexation can be assumed from the irreversible
sorption observed. Although ion exchange is the main mechanism for Cs uptake on
minerals 104, Kim et al. 103 proposed as well stronger bonds via inner-sphere
complexation , which takes place by the proximity of Cs to the Stern layer.
Ni sorption on boehmite was linear and showed the highest reversibility on boehmite.
The D-R model predicted ion exchange as the main mechanism for the sorption of Ni
on boehmite, which would explain the high desorption observed. The presence of
weak and strong binding surface sites were assumed by Villaseñor Nano 105 when
investigating the sorption of Fe(II) onto oxides, and may also apply to the sorption of
Ni onto boehmite colloids.
Batch sorption experiments indicated that Eu sorbed almost completely to boehmite
at low concentrations, but soon saturated the surface of boehmite. Kraemer et al. 67
reported sorption percentages above 98% at metal concentrations 3 µmol dm-3 at pH
6.3, in agreement with the experimental observations. The high sorption of the metal
to the boehmite surface might be due to the bonding of hydrated Eu to the aluminol
groups 47,106. Naveau et al. 107 modelled succesfully the sorption of Eu on goethite by
introducing into the surface complexation model the ternary complexes
≡XOHEuCl2+ and ≡XOHEu(OH)2. These weak and electrostatic bonding lead to
dettachment of the metal and thus reversible sorption may be expected.
Sorption of metals on boehmite, both solid and colloids, increased in the order:
Cs < Ni < Eu
Which agrees with the general trend that an increase in ionic charge leads to an
increase in sorption 91. Desorption increased in the order:
Cs ≤ Eu < Ni
The desorption percentages observed for Cs from boehmite colloids were lower than
those for Eu in the colloidal phase, but was in the same order (considering error) in
the solid phase. The divalent metal was the one to desorb to a greater extent from
boehmite in both phases, therefore, ionic charge is not the dominant factor to
determine the extent of desorption. From the three metals studied, Ni is the metal to
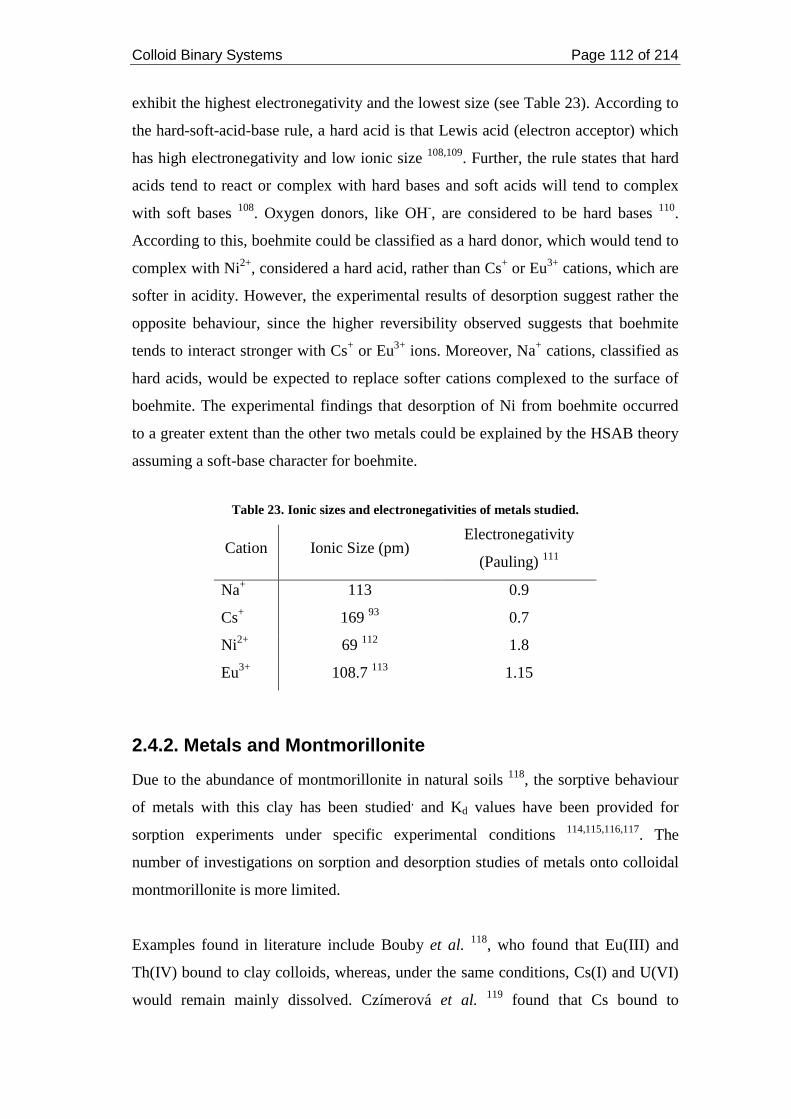
Colloid Binary Systems Page 112 of 214
exhibit the highest electronegativity and the lowest size (see Table 23). According to
the hard-soft-acid-base rule, a hard acid is that Lewis acid (electron acceptor) which
has high electronegativity and low ionic size 108,109. Further, the rule states that hard
acids tend to react or complex with hard bases and soft acids will tend to complex
with soft bases 108. Oxygen donors, like OH-, are considered to be hard bases 110.
According to this, boehmite could be classified as a hard donor, which would tend to
complex with Ni2+, considered a hard acid, rather than Cs+ or Eu3+ cations, which are
softer in acidity. However, the experimental results of desorption suggest rather the
opposite behaviour, since the higher reversibility observed suggests that boehmite
tends to interact stronger with Cs+ or Eu3+ ions. Moreover, Na+ cations, classified as
hard acids, would be expected to replace softer cations complexed to the surface of
boehmite. The experimental findings that desorption of Ni from boehmite occurred
to a greater extent than the other two metals could be explained by the HSAB theory
assuming a soft-base character for boehmite.
Table 23. Ionic sizes and electronegativities of metals studied.
Cation Ionic Size (pm) Electronegativity
(Pauling) 111
Na+ 113 0.9
Cs+ 169 93 0.7
Ni2+ 69 112 1.8
Eu3+ 108.7 113 1.15
2.4.2. Metals and Montmorillonite
Due to the abundance of montmorillonite in natural soils 118, the sorptive behaviour
of metals with this clay has been studied, and Kd values have been provided for
sorption experiments under specific experimental conditions 114,115,116,117. The
number of investigations on sorption and desorption studies of metals onto colloidal
montmorillonite is more limited.
Examples found in literature include Bouby et al. 118, who found that Eu(III) and
Th(IV) bound to clay colloids, whereas, under the same conditions, Cs(I) and U(VI)
would remain mainly dissolved. Czímerová et al. 119 found that Cs bound to
Colloid Binary Systems Page 113 of 214
montmorillonite colloids directly to the oxygens in the siloxane groups. 85Sr was
found to adsorb quickly onto montmorillonite colloids present in natural
groundwaters 120. Baik and Cho 121 studied the sorption of U(VI) onto natural soil,
constituted mainly by montmorillonite colloids, under different experimental
conditions. Sorption was found to be greatest at pH 6.5.
As a summary of the results found for metal sorption and desorption onto
montmorillonite colloids and solid phase, the sorption of metals onto
montmorillonite colloids increased in the order Cs < Ni < Eu. The sorption of Eu
showed a low reversibility, as only a 5% of the Eu sorbed was desorbed after three
washes. Desorption increased in the case of Cs and was highest for Ni, but in all
cases was below 50%. The sorption behaviour was different in the solid phase, as the
order of sorption increased Ni < Cs < Eu. The reversibility was also low in the case
of Eu, as less than 3% of the sorbed Eu was desorbed after three washes. Ni
exhibited similar desorption percentages in the solid phase, as it did on the colloidal
phase. Finally, Cs showed the largest reversibility, as 69% of the sorbed Cs was
desorbed after three washes.
Ion exchange was the main sorption mechanism to explain the adsorption of Cs on
solid montmorillonite, based on the mean free energy predicted by the D-R model, in
agreement with previous reports found in the literature 94,122,95,104. The model fitted
succesfully the experimental observations in the work presented herein, predicting
similar values of mean free energy to those found in literature.
Partial reversibility of Cs sorption on montmorillonite has been reported in literature.
In this manner, Bellenger et al. 123 and Dyer et al. 124 reported preferential retention
of Cs ions by solid montmorillonite; Bostick et al. 125 reported 31% desorption of Cs
from solid montmorillonite after two washes with electrolyte. The author suggested
two types of sorption mechanisms, inner sphere complexes, in which Cs would be
more immobilised, and outer sphere complexes, where Cs would be easily exchanged
by other cations present in solution. Significant desorption of Cs from clays
containing montmorillonite was observed as well by Lujaniené et al. 126 and
Krumhansl et al. 64.

Colloid Binary Systems Page 114 of 214
A desorption percentage of approximately 43% in both the colloidal and the solid
phase was determined for Ni. These results are in agreement with other authors who
reported remobilisation of Ni on addition of other cations in solution 127. Two
different sorption sites have been described to account for the partial reversibility
observed for sorption of Ni on montmorillonite: weak sites, and strong sites which
would lead to retention of the metal on the surface 63,104.
Eu sorption to montmorillonite and similar clays is generally described by surface
complexation 104. This mechanistic explanation supports the findings herein in which
low reversibility was found for Eu, suggesting strong bonding took place at the
interface of montmorillonite.
The sorption of the metals increased as the ionic charge of the metals increased, in
agreement with Adeleye et al. 91. Both Cs and Ni were found to exhibit reversibility
of the sorption, however, Eu desorption was low. The order of desorption increased
in the order Eu < Ni < Cs.
Some Rd values reported in literature for sorption of metals on montmorillonite are
shown in Table 24. All the values listed in the table correspond to batch experiments
carried out at pH 7. The ionic strengths and solid to liquid ratios, however, varied
from one reference to another, hence the differences in distribution ratio values.
Although few Rd values are referenced in Table 24 compared to the many more
available in literature, the aim was to show the large range of values depending on
the conditions of the batch experiments. A database was provided by Wold 128, where
a large number of Rd values can be found for the sorption of different metals onto
Ca2+ and Na+ montmorillonite, under different experimental conditions. In the same
report, Wold highlighted the concerns in comparing the sorption of metals onto
colloids when the experiments were carried out under different experimental
conditions, mainly due to the influence of size distribution. Because the Rd value is
normalised to the mass of colloid and not to the surface area, the smaller the colloids,
the larger the surface sites available for sorption, and thus, the larger the Rd value.
Hence, studying the sorption of metals onto colloids is not just influenced by the
solid to liquid ratio, but also by the size distribution of the colloids.
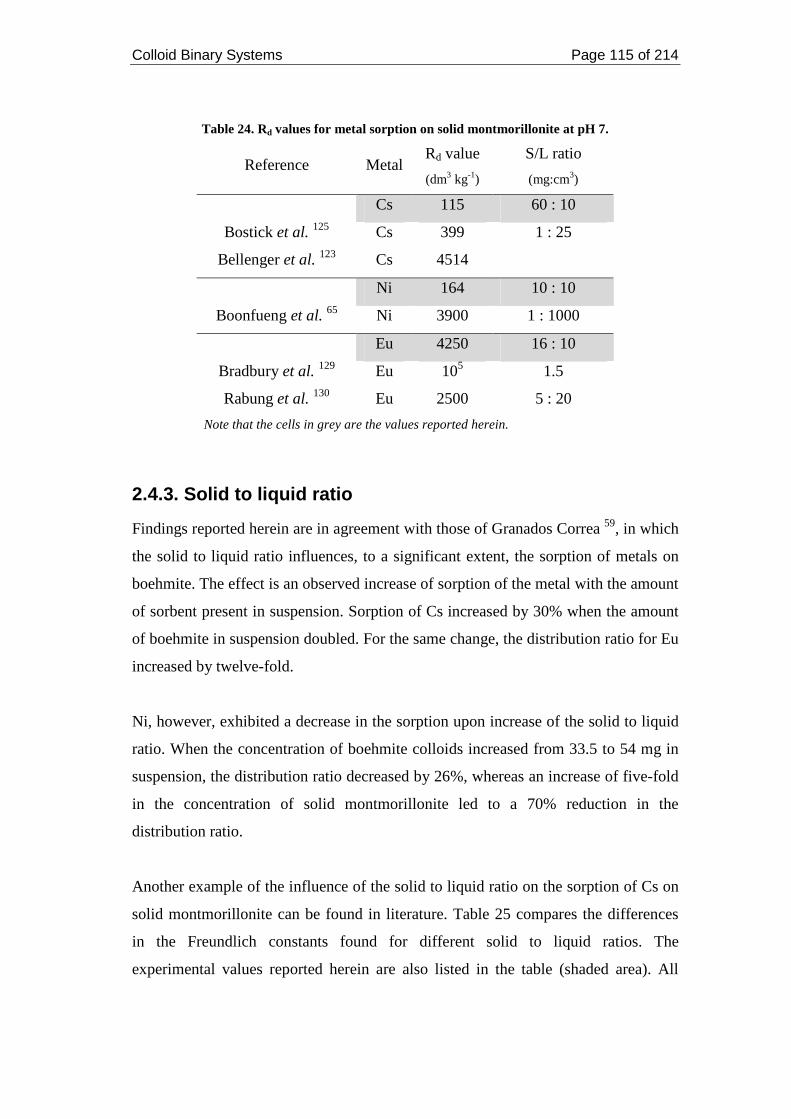
Colloid Binary Systems Page 115 of 214
Table 24. Rd values for metal sorption on solid montmorillonite at pH 7.
Reference Metal Rd value
(dm3 kg-1)
S/L ratio
(mg:cm3)
Cs 115 60 : 10
Bostick et al. 125 Cs 399 1 : 25
Bellenger et al. 123 Cs 4514
Ni 164 10 : 10
Boonfueng et al. 65 Ni 3900 1 : 1000
Eu 4250 16 : 10
Bradbury et al. 129 Eu 105 1.5
Rabung et al. 130 Eu 2500 5 : 20
Note that the cells in grey are the values reported herein.
2.4.3. Solid to liquid ratio
Findings reported herein are in agreement with those of Granados Correa 59, in which
the solid to liquid ratio influences, to a significant extent, the sorption of metals on
boehmite. The effect is an observed increase of sorption of the metal with the amount
of sorbent present in suspension. Sorption of Cs increased by 30% when the amount
of boehmite in suspension doubled. For the same change, the distribution ratio for Eu
increased by twelve-fold.
Ni, however, exhibited a decrease in the sorption upon increase of the solid to liquid
ratio. When the concentration of boehmite colloids increased from 33.5 to 54 mg in
suspension, the distribution ratio decreased by 26%, whereas an increase of five-fold
in the concentration of solid montmorillonite led to a 70% reduction in the
distribution ratio.
Another example of the influence of the solid to liquid ratio on the sorption of Cs on
solid montmorillonite can be found in literature. Table 25 compares the differences
in the Freundlich constants found for different solid to liquid ratios. The
experimental values reported herein are also listed in the table (shaded area). All
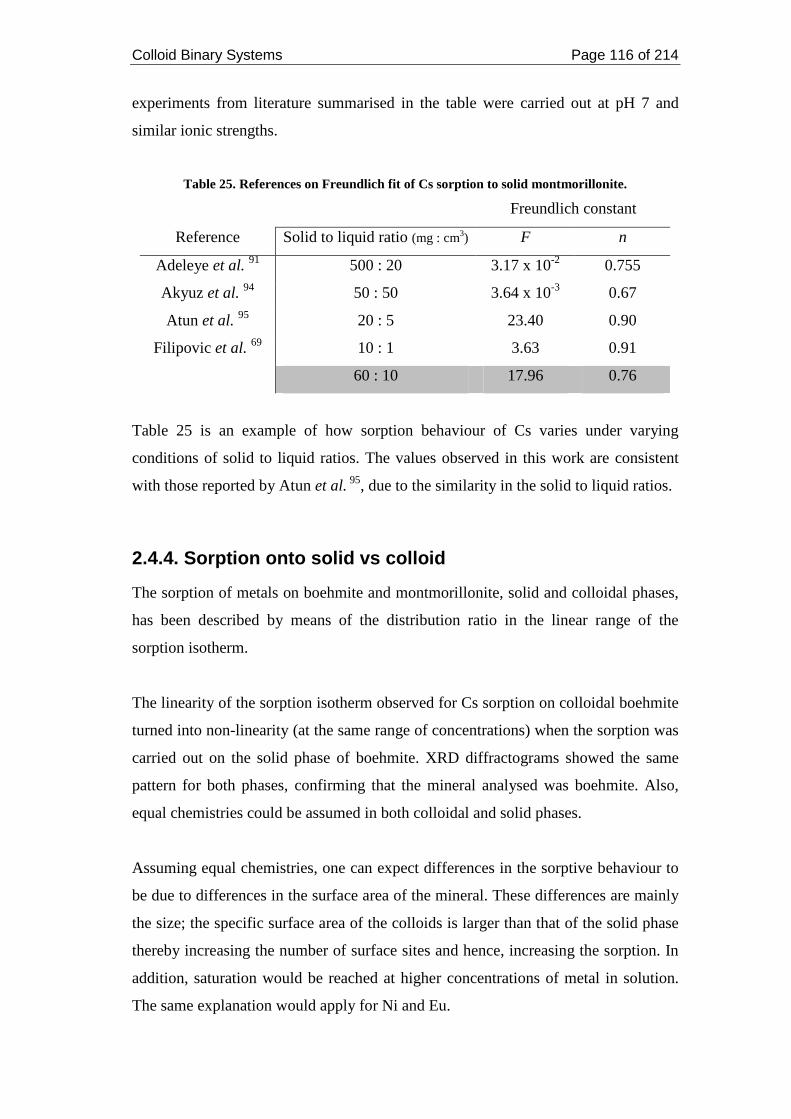
Colloid Binary Systems Page 116 of 214
experiments from literature summarised in the table were carried out at pH 7 and
similar ionic strengths.
Table 25. References on Freundlich fit of Cs sorption to solid montmorillonite.
Freundlich constant
Reference Solid to liquid ratio (mg : cm3) F n
Adeleye et al. 91 500 : 20 3.17 x 10⁻² 0.755
Akyuz et al. 94 50 : 50 3.64 x 10⁻³ 0.67
Atun et al. 95 20 : 5 23.40 0.90
Filipovic et al. 69 10 : 1 3.63 0.91
60 : 10 17.96 0.76
Table 25 is an example of how sorption behaviour of Cs varies under varying
conditions of solid to liquid ratios. The values observed in this work are consistent
with those reported by Atun et al. 95, due to the similarity in the solid to liquid ratios.
2.4.4. Sorption onto solid vs colloid
The sorption of metals on boehmite and montmorillonite, solid and colloidal phases,
has been described by means of the distribution ratio in the linear range of the
sorption isotherm.
The linearity of the sorption isotherm observed for Cs sorption on colloidal boehmite
turned into non-linearity (at the same range of concentrations) when the sorption was
carried out on the solid phase of boehmite. XRD diffractograms showed the same
pattern for both phases, confirming that the mineral analysed was boehmite. Also,
equal chemistries could be assumed in both colloidal and solid phases.
Assuming equal chemistries, one can expect differences in the sorptive behaviour to
be due to differences in the surface area of the mineral. These differences are mainly
the size; the specific surface area of the colloids is larger than that of the solid phase
thereby increasing the number of surface sites and hence, increasing the sorption. In
addition, saturation would be reached at higher concentrations of metal in solution.
The same explanation would apply for Ni and Eu.
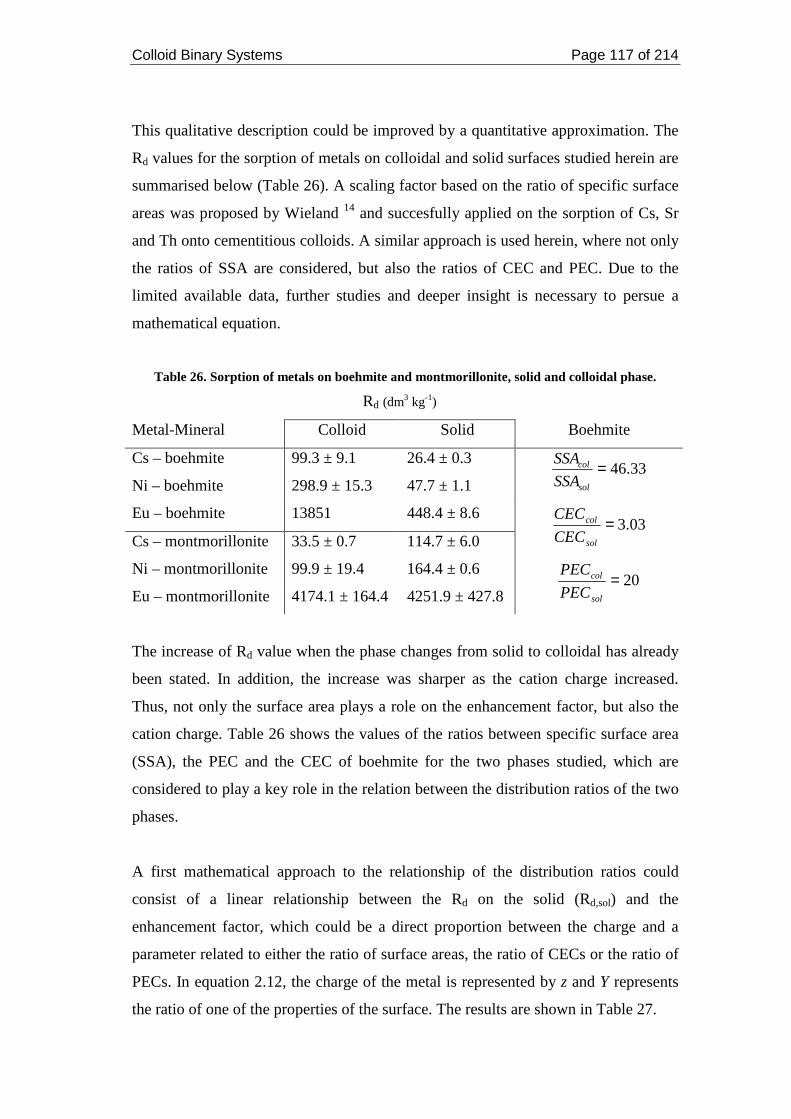
Colloid Binary Systems Page 117 of 214
This qualitative description could be improved by a quantitative approximation. The
Rd values for the sorption of metals on colloidal and solid surfaces studied herein are
summarised below (Table 26). A scaling factor based on the ratio of specific surface
areas was proposed by Wieland 14 and succesfully applied on the sorption of Cs, Sr
and Th onto cementitious colloids. A similar approach is used herein, where not only
the ratios of SSA are considered, but also the ratios of CEC and PEC. Due to the
limited available data, further studies and deeper insight is necessary to persue a
mathematical equation.
Table 26. Sorption of metals on boehmite and montmorillonite, solid and colloidal phase.
Rd (dm3 kg-1)
Metal-Mineral Colloid Solid Boehmite
Cs – boehmite 99.3 ± 9.1 26.4 ± 0.3
Ni – boehmite 298.9 ± 15.3 47.7 ± 1.1
Eu – boehmite 13851 448.4 ± 8.6
Cs – montmorillonite 33.5 ± 0.7 114.7 ± 6.0
Ni – montmorillonite 99.9 ± 19.4 164.4 ± 0.6
Eu – montmorillonite 4174.1 ± 164.4 4251.9 ± 427.8
33.46=sol
col
SSA
SSA
03.3=sol
col
CEC
CEC
20=sol
col
PEC
PEC
The increase of Rd value when the phase changes from solid to colloidal has already
been stated. In addition, the increase was sharper as the cation charge increased.
Thus, not only the surface area plays a role on the enhancement factor, but also the
cation charge. Table 26 shows the values of the ratios between specific surface area
(SSA), the PEC and the CEC of boehmite for the two phases studied, which are
considered to play a key role in the relation between the distribution ratios of the two
phases.
A first mathematical approach to the relationship of the distribution ratios could
consist of a linear relationship between the Rd on the solid (Rd,sol) and the
enhancement factor, which could be a direct proportion between the charge and a
parameter related to either the ratio of surface areas, the ratio of CECs or the ratio of
PECs. In equation 2.12, the charge of the metal is represented by z and Y represents
the ratio of one of the properties of the surface. The results are shown in Table 27.
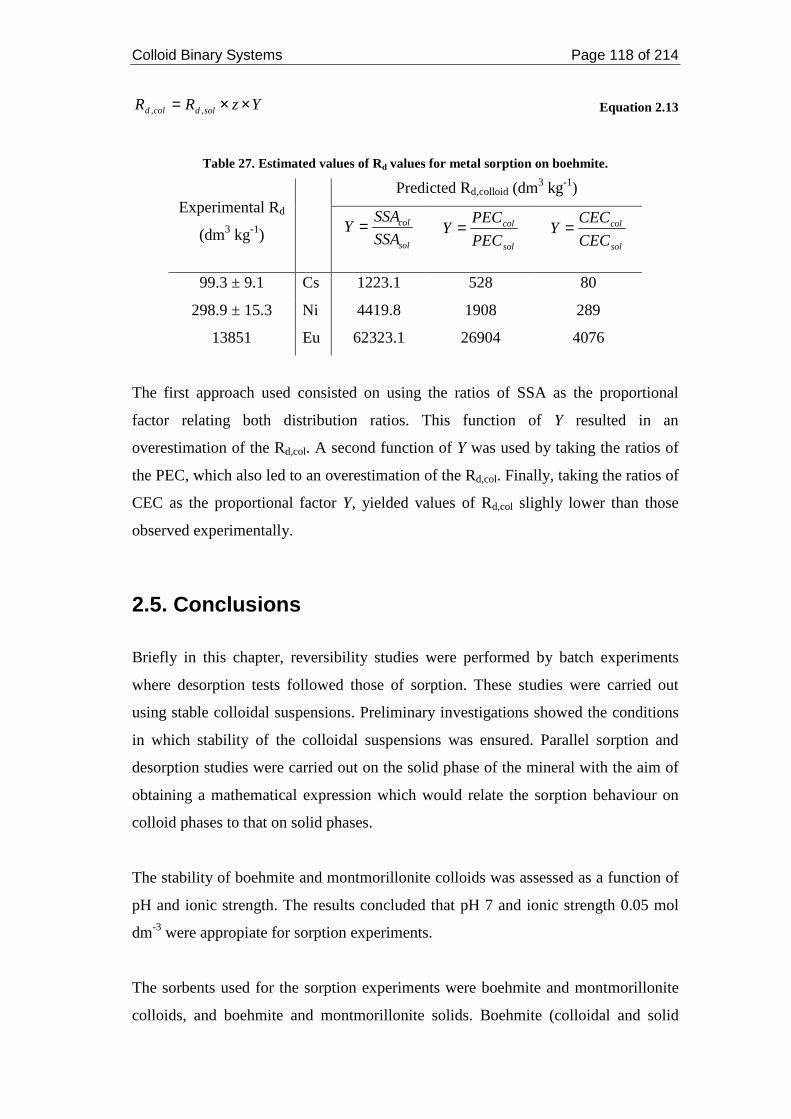
Colloid Binary Systems Page 118 of 214
YzRR soldcold ××= ,, Equation 2.13
Table 27. Estimated values of Rd values for metal sorption on boehmite.
Predicted Rd,colloid (dm3 kg-1) Experimental Rd
(dm3 kg-1)
sol
col
SSA
SSAY =
sol
col
PEC
PECY =
sol
col
CEC
CECY =
99.3 ± 9.1 Cs 1223.1 528 80
298.9 ± 15.3 Ni 4419.8 1908 289
13851 Eu 62323.1 26904 4076
The first approach used consisted on using the ratios of SSA as the proportional
factor relating both distribution ratios. This function of Y resulted in an
overestimation of the Rd,col. A second function of Y was used by taking the ratios of
the PEC, which also led to an overestimation of the Rd,col. Finally, taking the ratios of
CEC as the proportional factor Y, yielded values of Rd,col slighly lower than those
observed experimentally.
2.5. Conclusions
Briefly in this chapter, reversibility studies were performed by batch experiments
where desorption tests followed those of sorption. These studies were carried out
using stable colloidal suspensions. Preliminary investigations showed the conditions
in which stability of the colloidal suspensions was ensured. Parallel sorption and
desorption studies were carried out on the solid phase of the mineral with the aim of
obtaining a mathematical expression which would relate the sorption behaviour on
colloid phases to that on solid phases.
The stability of boehmite and montmorillonite colloids was assessed as a function of
pH and ionic strength. The results concluded that pH 7 and ionic strength 0.05 mol
dm-3 were appropiate for sorption experiments.
The sorbents used for the sorption experiments were boehmite and montmorillonite
colloids, and boehmite and montmorillonite solids. Boehmite (colloidal and solid
Colloid Binary Systems Page 119 of 214
form) and solid montmorillonite were used as provided by the manufacturer, whereas
montmorillonite colloids were extracted by repeated washes with electrolyte from the
solid form. The sorption of Cs (mono-), Ni (di-) and Eu (tri-valent) on these minerals
was investigated. Generally, the findings agreed with an increase of sorption with
ionic charge. Sorption isotherms and later modelling showed a general linear
behaviour of Cs, general non-linear behaviour of Eu and a linear sorption of Ni on
boehmite (both phases), followed by a non-linear sorption on montmorillonite (both
phases).
The three sorption isotherms used in modelling were the empirical models Langmuir,
Freundlich and D-R models, which provided estimates of sorption capacity of the
minerals and energy of sorption. In general, the results proved unsuccesful for the
Langmuir model, due to an underprediction of the sorption capacities, but good fits
for the Freundlich isotherm. The D-R isotherm predicted ion exchange as the
sorption mechanism in general.
Desorption experiments showed that the sorption of metals on boehmite was partially
reversible. The sorption of metals on montmorillonite was also partially reversible,
although Eu exhibited low desorption values in both phases of montmorillonite. The
reversibility did not depend on the ionic charge, as Ni showed the highest
reversibility in most of the cases. The results from the desorption experiments carried
out have been interpreted from a thermodynamic approach and these have shown the
order of desorption of metals from colloids. However, the kinetics of desorption
would be necessary for a thorough and complete knowledge of the desorption rates.
The partial reversibility may be explained by different sorption mechanisms,
supported by many authors in literature; sorption by inner-sphere complexation,
which leads to the formation of strong, chemical bonds; and sorption by outer-sphere
complexation, which is described by weak, physical and electrostatic interactions
between the metal and the mineral surface. On addition of the electrolyte, the metal
ions bound via outer-sphere complexation were exchanged by the cations from the
electrolyte, whereas the complexed metal ions remained bound to the mineral
surface.
Colloid Binary Systems Page 120 of 214
The Rd values were found to be dependent upon the solid to liquid ratio, increasing
as this parameter increased, in agreement with other studies found in literature.
Another influencing parameter was the background electrolyte. Changing the
electrolyte from Na+ to K+ led to a decrease in sorption and an increase in desorption
of Cs to boehmite colloids, thus concluding that the similarity in ionic size resulted in
a greater competition for the sorption sites.
Measurements of the specific surface area, proton and cation exchange capacities
indicated that the lower particle size of the colloids provided a higher specific surface
area for colloids, explaining the higher sorption observed on colloidal particles.
An attempt to quantify the distribution ratio of the sorption of metals on colloids as a
function of the Rd value on solids, charge and surface, was made. A simplistic, linear
equation was proposed where the Rd value for the sorption of metals on colloids
could be determined from the Rd value for the sorption of metals on solids, the ionic
charge of the metal and the ratio of CEC between the colloidal and the solid particles
of the mineral. However, this simplistic model could only be applied on the results
obtained herein for boehmite. Thus, a single system is insufficient for testing a model
and more measurements and mathematical processing is needed to continue this line
of enquiry.
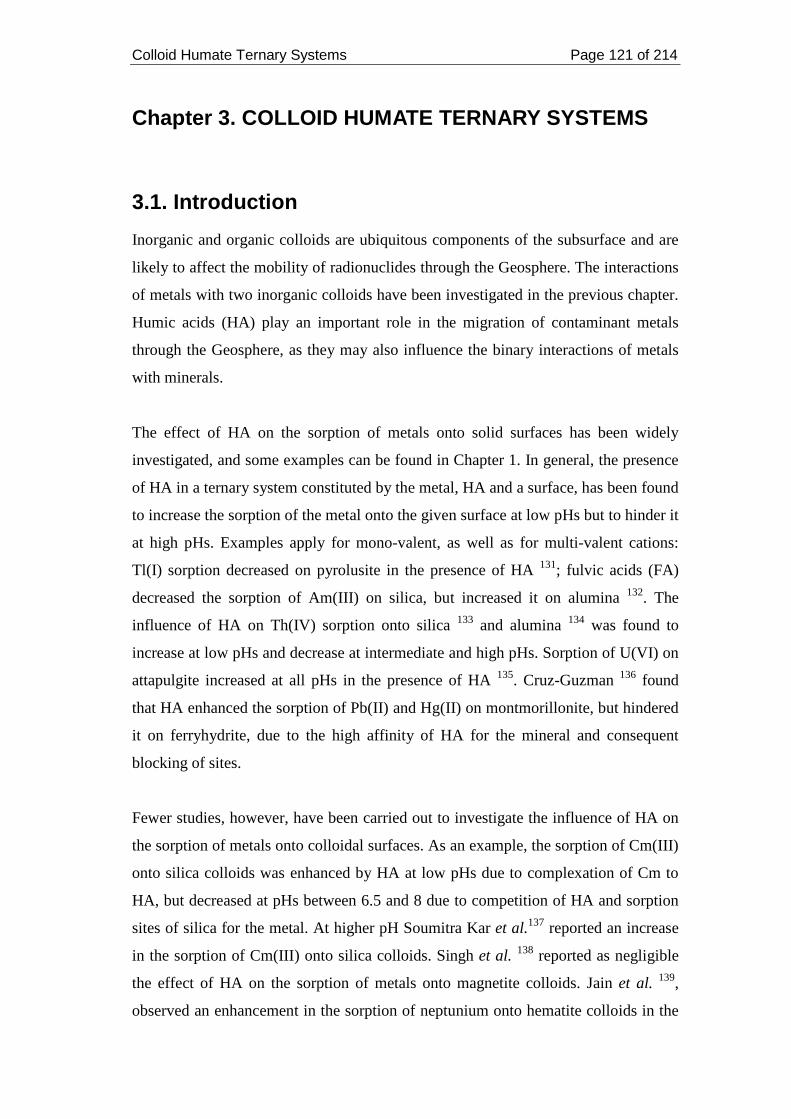
Colloid Humate Ternary Systems Page 121 of 214
Chapter 3. COLLOID HUMATE TERNARY SYSTEMS
3.1. Introduction
Inorganic and organic colloids are ubiquitous components of the subsurface and are
likely to affect the mobility of radionuclides through the Geosphere. The interactions
of metals with two inorganic colloids have been investigated in the previous chapter.
Humic acids (HA) play an important role in the migration of contaminant metals
through the Geosphere, as they may also influence the binary interactions of metals
with minerals.
The effect of HA on the sorption of metals onto solid surfaces has been widely
investigated, and some examples can be found in Chapter 1. In general, the presence
of HA in a ternary system constituted by the metal, HA and a surface, has been found
to increase the sorption of the metal onto the given surface at low pHs but to hinder it
at high pHs. Examples apply for mono-valent, as well as for multi-valent cations:
Tl(I) sorption decreased on pyrolusite in the presence of HA 131; fulvic acids (FA)
decreased the sorption of Am(III) on silica, but increased it on alumina 132. The
influence of HA on Th(IV) sorption onto silica 133 and alumina 134 was found to
increase at low pHs and decrease at intermediate and high pHs. Sorption of U(VI) on
attapulgite increased at all pHs in the presence of HA 135. Cruz-Guzman 136 found
that HA enhanced the sorption of Pb(II) and Hg(II) on montmorillonite, but hindered
it on ferryhydrite, due to the high affinity of HA for the mineral and consequent
blocking of sites.
Fewer studies, however, have been carried out to investigate the influence of HA on
the sorption of metals onto colloidal surfaces. As an example, the sorption of Cm(III)
onto silica colloids was enhanced by HA at low pHs due to complexation of Cm to
HA, but decreased at pHs between 6.5 and 8 due to competition of HA and sorption
sites of silica for the metal. At higher pH Soumitra Kar et al.137 reported an increase
in the sorption of Cm(III) onto silica colloids. Singh et al. 138 reported as negligible
the effect of HA on the sorption of metals onto magnetite colloids. Jain et al. 139,
observed an enhancement in the sorption of neptunium onto hematite colloids in the
Colloid Humate Ternary Systems Page 122 of 214
presence of HA at acidic pHs. These studies provide evidence that the effect of HA
on metal sorption to colloids does not always follow the general trend observed for
most of the solids.
Following the investigation of the interaction of colloids with contaminant metals,
this chapter studies the influence of HA on the sorption of metals (Cs, Ni and Eu)
onto boehmite colloids and focuses further on the applicability of the linear additive
model (LAM) to the experimental results.
3.1.1. Linear additive model
The LAM is a mathematical model used to predict the sorption of metals onto
surfaces in the presence of HA. The ternary system is the system in which metal
cations, HA and the solid or colloid surface coexist. The different interactions are
shown in Figure 44, where, for simplicity, HA molecules have been given a spherical
shape. This example uses a solid surface.
Figure 44. Interactions between metal cations (M), HA molecules and the surface of the solid.
The LAM assumes that the distribution coefficient for the ternary system (Rd,t)
results as a combination of the distribution coefficients of the separate binary
systems (β, fHA and Rd). Several expressions have been proposed to determine Rd,t
values in ternary systems. For instance, Samadfam et al. 140 proposed the following
expression for the LAM (as applied for solids):
Colloid Humate Ternary Systems Page 123 of 214
( )][)1(1
][, HAf
HAfWVR
RHA
HAd
td ββ
−+
+= Equation 3.1
Where Rd,t and Rd, in dm3 kg-1, are the distribution coefficients for the ternary and
binary metal-solid system, respectively, fHA is the fractional sorption of HA onto the
surface, β is the metal-humate stability constant, in mol dm-3, V, in dm3, and W, in
kg, are the volume of sample and weight of solid, respectively, and [HA] is the
concentration of HA, in mol dm-3.
A slightly simpler model was proposed by Lippold et al. 141:
][1
][, HA
HAfRR HAd
td ββ
++= Equation 3.2
A series of assumptions are considered in both mathematical formulations of the
LAM: 142,143,140,144
• The individual sorption coefficients are independent of the metal
concentration;
• The sorption properties or characteristics of the mineral are not affected by
the presence of HA;
• Different molecular weight fractions of HA are neglected and sorption of HA
is considered as a whole;
• Affinity of metals for mineral-bound HA and for dissolved HA are
considered identical;
• The mass of mineral is much higher than the mass of mineral-bound HA;
• Electrostatic interactions at the mineral-water interface are neglected.
Although the LAM has been generally applied to model the influence of HA on the
sorption of metals onto solids, in principle, its application could be extended to
colloidal systems. However, the examples found to date in the literature report, in
general, the failure of the model when applied to colloidal systems: Kumar et al.145
observed an increase of Cs sorption on silica colloids at acidic pHs in the presence of
HA. Although at first the LAM could not describe succesfully the effect of HA, the

Colloid Humate Ternary Systems Page 124 of 214
use of two different stability constants for metal-humate complexation led to the
success of the model. The two stability constants corresponded to the complexation
of metal with dissolved HA in suspension and that of metal with surface-bound HA.
Like this, the sorption of Cs onto silica colloids 145 and that of Tc (VII) onto alumina 146 were modelled by the LAM. However, this modification of the LAM did not
satisfy the modelling of Cm(III) sorption onto silica colloids in the presence of HA 147. Christl et al. 142 found that the additivity assumption underestimated the sorption
of copper onto hematite colloids in the presence of HA.
This chapter aimed to study the influence of HA on metal sorption onto boehmite
colloids. Further, an attempt to model the sorption with the LAM was made. With the
objective of comparing the behaviour of metals on the colloids in the presence and
absence of HA, the experimental conditions were the same as those used for the
batch sorption experiments in the previous chapter.
3.2. Experimental
Before the investigation of the influence of HA on the sorption of metals onto
boehmite colloids was started, the sorption of HA onto boehmite colloids was studied
(see section 3.2.4). Special attention was given to the stability of boehmite colloids in
the presence of HA, since initial tests provided experimental evidence of flocculation
of the colloids taking place on addition of HA at a wide range of concentrations.
Therefore, a study was carried out in which the stability of the colloids was followed
by DLS or UV-Vis spectroscopy. Once the stability conditions were established,
sorption experiments were carried out.
3.2.1. Preparation of reagents
Purified humic acid (Aldrich) 148 was used to prepare solutions of concentrations
ranging 1 to 500 mg kg-1. All the samples used were adjusted to pH 7 and ionic
strength 0.05 mol dm-3 with NaCl.
Boehmite colloids were provided by Feralco Ltd. as a concentrated suspension.
Aliquots were taken from there to prepare the suspensions for experimental study.
Colloid Humate Ternary Systems Page 125 of 214
Gravimetric and spectrophotometric measurements were carried out to characterise
the colloids. pH was fixed to 7 prior to any experimental measurement.
Metal solutions were prepared by dissolving the corresponding chloride salts in DI
water. The solids used for each metal were: CsCl (BDH Laboratories AnalaR®),
NiCl2 (Fisher Scientific) and EuCl3 (Sigma-Aldrich).
The pH and ionic strength were fixed to 7 and 0.05 mol dm-3 with NaCl (Sigma-
Aldrich chemicals), respectively.
3.2.2. Preparation for measurement
UV measurements were taken using a UV Type Varian Cary Series 50 Bio
Spectrophotometer. A quartz cuvette was filled with approximately 1 cm3 HA
sample and the absorbance spectrum was recorded at several wavelengths (254, 300,
350 and 400 nm).
Average size of the colloids was measured by dynamic light scattering (DLS) and
was carried out in a Zeta Master S. An average of ten measurements were taken for
each sample, except in the kinetic studies, where each recording corresponded to one
measurement. A plastic cuvette was filled with approximately 3 cm3 of sample.
Powder X-ray measurements were performed using Cu-Kα radiation (λ = 1.5418 Å)
on a Bruker D8 diffractometer in reflection geometry and a Braun position sensitive
detector. The sample was loaded onto a silicon zero background substrate and the
data were collected in the range 5 < 2θ < 90° with a step time of 1 second and step
width of 0.014°. SEM pictures were taken in a LEO (Zeiss) 435VP Variable Pressure
Digital Scanning Electron Microscope (SEM) at BGS.
pH measurements were carried out in a Jenway 350 pH meter. The instruments were
calibrated prior to their use with three standard solutions (pHs 4, 7 and 10).
Samples were centrifuged in a Hermle Z206A centrifuge at 6000 rpm for 30 minutes.
When necessary, samples were mixed using a Labnet VX100 Vortex mixer. The
Colloid Humate Ternary Systems Page 126 of 214
filters used in all sorption and desorption experiments were supplied by Elkay (0.45
µm in pore size) and the plastic syringes used (5 cm3) were provided by BD
Plastipak. When used, the plastic syringes were filled with sample, the filter fitted to
the end and the first 5 cm3 of the filtered sample were discarded, collecting the
following 2 cm3 for radiometric measurement. Control experiments showed that
sorption of activity to the syringe filters or to the centrifuge tubes did not take place.
Radionuclide assays (to an error of two sigma or better) were performed using either
a Tricarb 1900TR Liquid Scintillation Analyzer (Packard Ltd) or a Cobra II Auto-
Gamma Counter (Packard). The activities measured were transformed by
mathematical operations into concentrations.
3.2.3. Stability of HA
Control experiments were carried out to measure the effect of centrifugation and
filtration on HA solutions of different concentrations, ranging from 10 to 450 mg
kg-1. The UV-Vis absorbance of the solutions was measured at several wavelengths
(254, 300, 350 and 400 nm). As humic acids have a range of molecular masses, the
absorbance at one unique wavelength would not provide information about whether
an important fraction of humic acids were being sedimented by centrifugation.
Hence, the ratios between wavelengths were calculated and differences observed
between these ratios would indicate any changes 149.
3.2.4. Stability of colloids in the presence of HA
To study the influence of HA on the sorption of metals onto colloidal boehmite, a
stable suspension of humate-colloid was needed. The influence of HA on the stability
of boehmite colloids (approximately 67 mg in 30 cm3) was studied by measuring
kinetically the average size of the colloids at pH 7 in the presence of varying
concentrations of HA, ranging from 0 to 5, and 200 to 450 mg kg-1. At higher
concentrations of HA, UV-Vis spectroscopy was needed to monitor the stability of
the sols, whereas at lower HA concentrations the stability was measured by DLS
with the Zeta Master. For intermediate HA concentrations no spectroscopic
measurements were carried out.
Colloid Humate Ternary Systems Page 127 of 214
The same kinetic measurements were performed in sols containing approximately
11.4 mg of boehmite colloids and varying concentrations of HA (1 to 40 mg kg-1). In
this case, DLS was the only technique used to monitor the stability. The average size
was measured every 50 seconds for 50 minutes.
3.2.5. Sorption of HA to boehmite
The extent of the sorption of HA onto boehmite was studied by means of batch
experiments. The sorption of HA to both the colloidal and solid phases of boehmite
was measured. The concentration of HA was measured using UV-Visible
spectrometry at 254 nm. For this purpose, in triplicate, 20 cm3 of HA were added to
10 cm3 of boehmite colloids (total mass of colloids 33.5 mg). In the case of the
sorption onto the solid phase of boehmite, 30 cm3 of HA were added to 0.1 g of
boehmite. The concentrations of HA were prepared to give a final concentration of 2
to 80 mg kg-1. The samples were pH adjusted to 7.0 ± 0.4 by adding small amounts
of HCl or NaOH 0.1 mol dm-3 and ionic strength 0.05 mol dm-3 with NaCl, and left
to equilibrate for 24 hours, after which time the samples were centrifuged for 30
minutes at 6000 rpm. 5 cm3 of supernatant were collected with a syringe, to be
filtered with a 0.45 µm syringe filter. The first 2 cm3 were discarded and the
following 3 cm3 of filtered suspension were collected in a quartz cuvette for UV
measurement.
The absorbance of HA is related to the concentration through the calibration curve
(see section 3.3.1.). Hence, the concentration of HA adsorbed to boehmite could be
calculated as the difference between the initial HA added and the HA measured in
solution after the equilibration time.
3.2.6. Sorption of metals to boehmite in the presence of HA
The effect of HA on the sorption of different metals (i.e. Cs, Ni and Eu) onto
colloidal boehmite was studied by performing batch experiments where 1 cm3 of
metal solution and 1 cm3 of HA were added to 10 cm3 of colloidal boehmite (33.5
mg). 0.1 cm3 radioactive spike were added (0.83 kBq cm-3) (see Table 1 in Chapter 2
Colloid Humate Ternary Systems Page 128 of 214
for isotopes used). The metal solutions were prepared so that the final concentration
of metal ranged from 10-6 to 4x10⁻³ mol dm-3. In a similar manner, HA solutions
were prepared so that the final concentrations in suspension would be 0, 1 and 2 mg
kg-1. The corresponding volumes of metal and HA solutions were added within one
minute to the boehmite suspension, minimising the effect produced by the order of
addition. Pre-equilibration of the colloids with HA has been shown to influence the
sorption of metal onto colloids 150; however, for a better comparison of the results
with those found in Chapter 2, this factor was not assessed.
The pH was adjusted to 6.8 ± 0.1 and the ionic strength was adjusted with NaCl to
0.05 mol dm-3. The samples were left to equilibrate for 24 hours, after which, the
samples were centrifuged for 30 minutes at 6000 rpm. An aliquot from the
supernatant was filtered through a 0.45 µm filter and 2 cm3 were measured for
activity. The collected data were related to the concentration of metal left in solution
by the following equation:
ispike
samplesoltn M
A
AM ][][ = Equation 3.3
Where [M] soltn is the concentration of metal left in solution after the sorption
experiment, Asample is the activity of the sample, Aspike is the activity of a reference
sample where no sorption process took place; and [M] i is the initial concentration of
metal introduced in the ternary system. The concentration of metal bound was
calculated as the difference between the initial concentration of metal and the
concentration left in solution after the sorption experiment,
[ ] [ ] [ ]soltnibound MMM −= Equation 3.4
Note that the [M] bound considers not only the metal bound to the colloid but also the
metal-humate complexes bound to the colloid. In a similar manner, the [M] soltn
includes both the concentration of free metal cations in solution and metal-humate
complexes, also in solution.
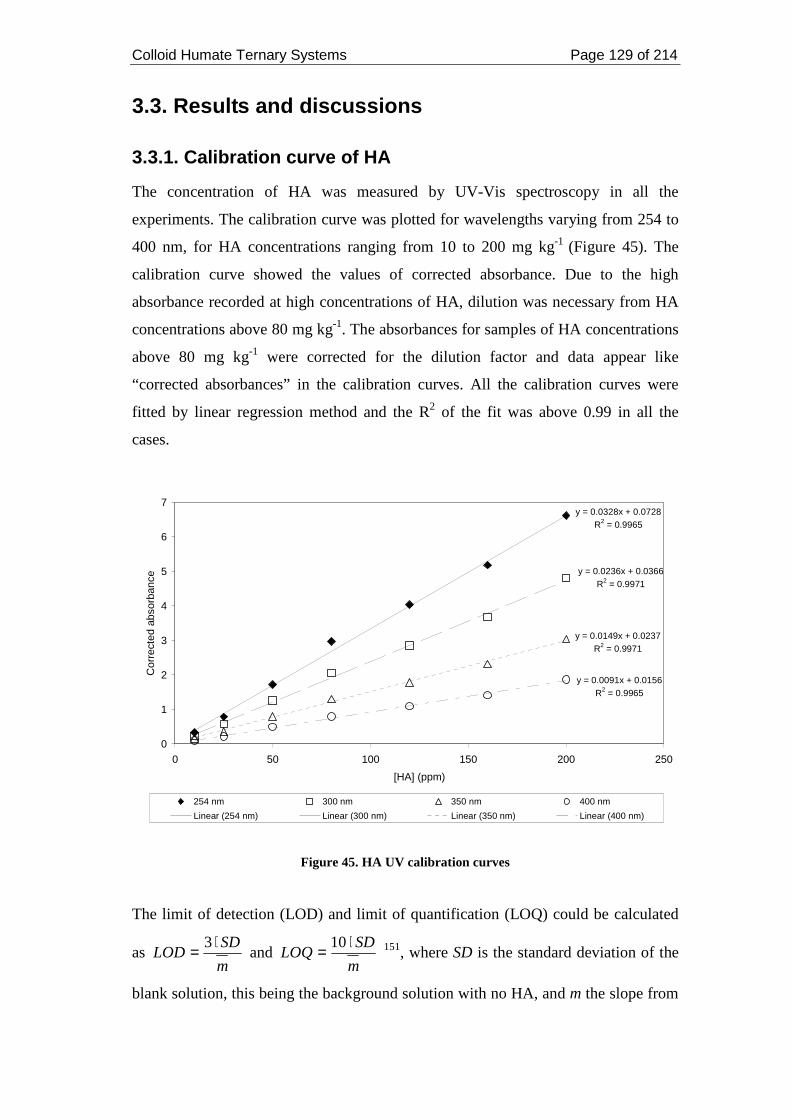
Colloid Humate Ternary Systems Page 129 of 214
3.3. Results and discussions
3.3.1. Calibration curve of HA
The concentration of HA was measured by UV-Vis spectroscopy in all the
experiments. The calibration curve was plotted for wavelengths varying from 254 to
400 nm, for HA concentrations ranging from 10 to 200 mg kg-1 (Figure 45). The
calibration curve showed the values of corrected absorbance. Due to the high
absorbance recorded at high concentrations of HA, dilution was necessary from HA
concentrations above 80 mg kg-1. The absorbances for samples of HA concentrations
above 80 mg kg-1 were corrected for the dilution factor and data appear like
“corrected absorbances” in the calibration curves. All the calibration curves were
fitted by linear regression method and the R2 of the fit was above 0.99 in all the
cases.
y = 0.0328x + 0.0728R2 = 0.9965
y = 0.0236x + 0.0366R2 = 0.9971
y = 0.0149x + 0.0237R2 = 0.9971
y = 0.0091x + 0.0156R2 = 0.9965
0
1
2
3
4
5
6
7
0 50 100 150 200 250
[HA] (ppm)
Cor
rect
ed a
bsor
banc
e
254 nm 300 nm 350 nm 400 nm
Linear (254 nm) Linear (300 nm) Linear (350 nm) Linear (400 nm)
Figure 45. HA UV calibration curves
The limit of detection (LOD) and limit of quantification (LOQ) could be calculated
as m
SDLOD
⋅= 3 and
m
SDLOQ
⋅= 10 151, where SD is the standard deviation of the
blank solution, this being the background solution with no HA, and m the slope from
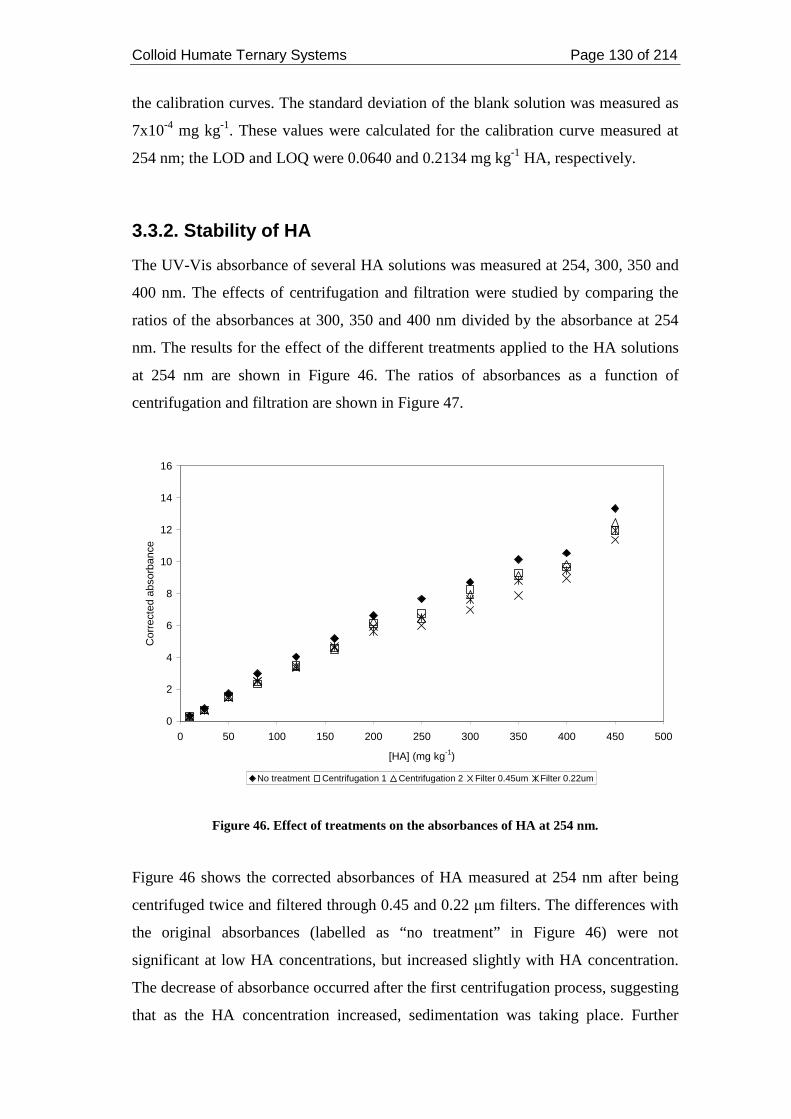
Colloid Humate Ternary Systems Page 130 of 214
the calibration curves. The standard deviation of the blank solution was measured as
7x10⁻⁴ mg kg-1. These values were calculated for the calibration curve measured at
254 nm; the LOD and LOQ were 0.0640 and 0.2134 mg kg-1 HA, respectively.
3.3.2. Stability of HA
The UV-Vis absorbance of several HA solutions was measured at 254, 300, 350 and
400 nm. The effects of centrifugation and filtration were studied by comparing the
ratios of the absorbances at 300, 350 and 400 nm divided by the absorbance at 254
nm. The results for the effect of the different treatments applied to the HA solutions
at 254 nm are shown in Figure 46. The ratios of absorbances as a function of
centrifugation and filtration are shown in Figure 47.
0
2
4
6
8
10
12
14
16
0 50 100 150 200 250 300 350 400 450 500
[HA] (mg kg-1)
Cor
rect
ed a
bsor
banc
e
No treatment Centrifugation 1 Centrifugation 2 Filter 0.45um Filter 0.22um
Figure 46. Effect of treatments on the absorbances of HA at 254 nm.
Figure 46 shows the corrected absorbances of HA measured at 254 nm after being
centrifuged twice and filtered through 0.45 and 0.22 µm filters. The differences with
the original absorbances (labelled as “no treatment” in Figure 46) were not
significant at low HA concentrations, but increased slightly with HA concentration.
The decrease of absorbance occurred after the first centrifugation process, suggesting
that as the HA concentration increased, sedimentation was taking place. Further
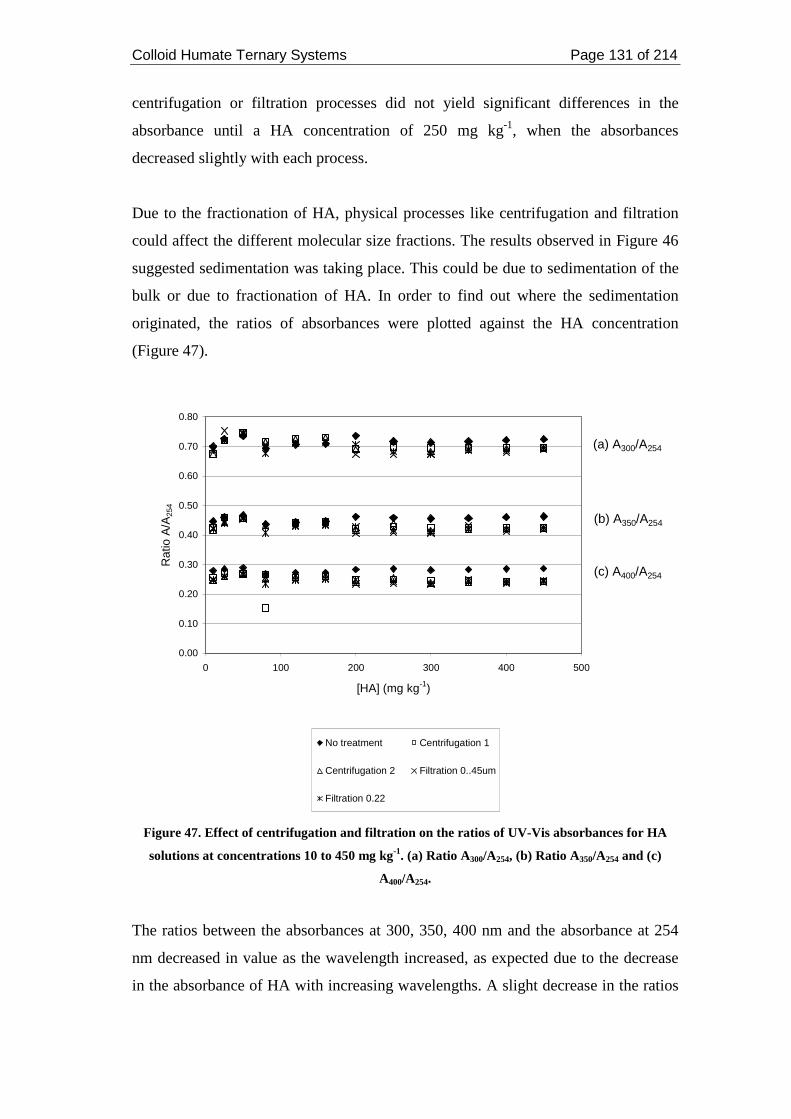
Colloid Humate Ternary Systems Page 131 of 214
centrifugation or filtration processes did not yield significant differences in the
absorbance until a HA concentration of 250 mg kg-1, when the absorbances
decreased slightly with each process.
Due to the fractionation of HA, physical processes like centrifugation and filtration
could affect the different molecular size fractions. The results observed in Figure 46
suggested sedimentation was taking place. This could be due to sedimentation of the
bulk or due to fractionation of HA. In order to find out where the sedimentation
originated, the ratios of absorbances were plotted against the HA concentration
(Figure 47).
0.00
0.10
0.20
0.30
0.40
0.50
0.60
0.70
0.80
0 100 200 300 400 500
[HA] (mg kg-1)
Rat
io A
/A25
4
(a) A300/A254
(b) A350/A254
(c) A400/A254
No treatment Centrifugation 1
Centrifugation 2 Filtration 0..45um
Filtration 0.22
Figure 47. Effect of centrifugation and filtration on the ratios of UV-Vis absorbances for HA
solutions at concentrations 10 to 450 mg kg-1. (a) Ratio A300/A254, (b) Ratio A350/A254 and (c)
A400/A254.
The ratios between the absorbances at 300, 350, 400 nm and the absorbance at 254
nm decreased in value as the wavelength increased, as expected due to the decrease
in the absorbance of HA with increasing wavelengths. A slight decrease in the ratios
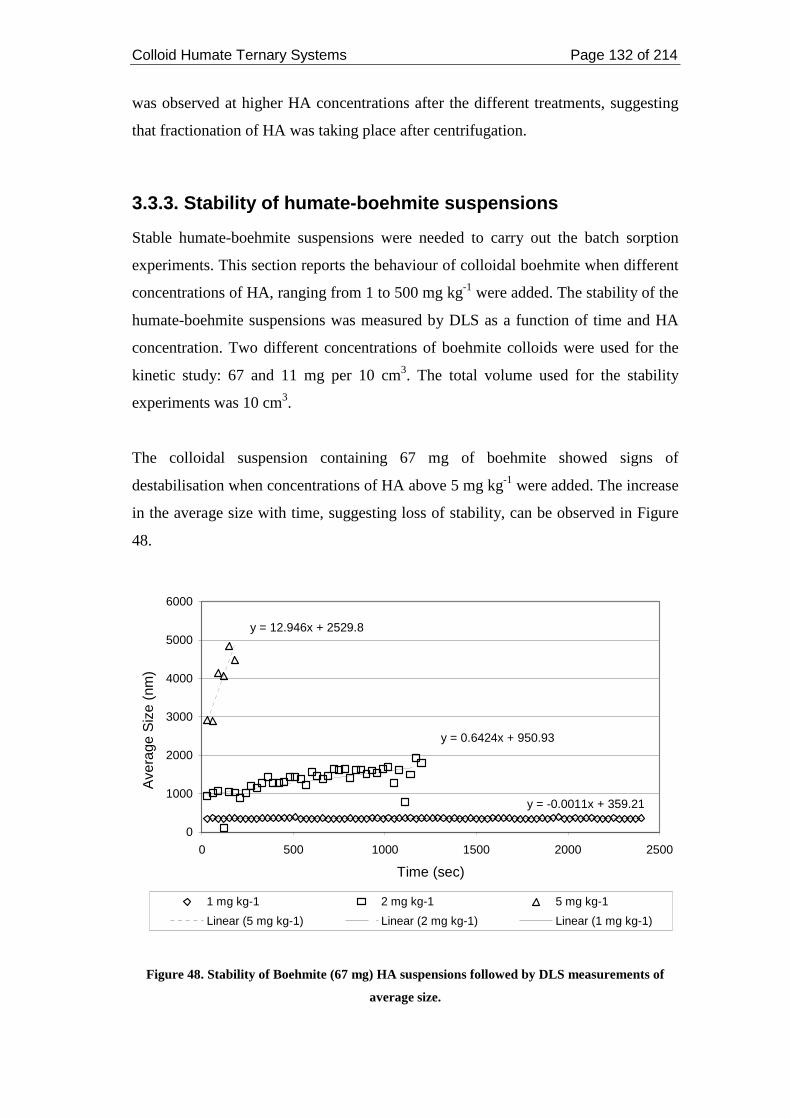
Colloid Humate Ternary Systems Page 132 of 214
was observed at higher HA concentrations after the different treatments, suggesting
that fractionation of HA was taking place after centrifugation.
3.3.3. Stability of humate-boehmite suspensions
Stable humate-boehmite suspensions were needed to carry out the batch sorption
experiments. This section reports the behaviour of colloidal boehmite when different
concentrations of HA, ranging from 1 to 500 mg kg-1 were added. The stability of the
humate-boehmite suspensions was measured by DLS as a function of time and HA
concentration. Two different concentrations of boehmite colloids were used for the
kinetic study: 67 and 11 mg per 10 cm3. The total volume used for the stability
experiments was 10 cm3.
The colloidal suspension containing 67 mg of boehmite showed signs of
destabilisation when concentrations of HA above 5 mg kg-1 were added. The increase
in the average size with time, suggesting loss of stability, can be observed in Figure
48.
y = 12.946x + 2529.8
y = 0.6424x + 950.93
y = -0.0011x + 359.21
0
1000
2000
3000
4000
5000
6000
0 500 1000 1500 2000 2500
Time (sec)
Ave
rage
Siz
e (n
m)
1 mg kg-1 2 mg kg-1 5 mg kg-1
Linear (5 mg kg-1) Linear (2 mg kg-1) Linear (1 mg kg-1)
Figure 48. Stability of Boehmite (67 mg) HA suspensions followed by DLS measurements of
average size.
Colloid Humate Ternary Systems Page 133 of 214
Figure 48 shows the kinetic evolution of the average size with increasing
concentrations of HA. The three different HA concentrations caused different
responses on the colloidal suspension. In the presence of 1 mg kg-1 HA, the average
size of boehmite was constant with time, suggesting stability of the suspension. In
the presence of 2 mg kg-1 HA, the average size increased with time, suggesting
flocculation was slowly taking place. When the HA concentration increased to 5 mg
kg-1, the average size quickly increased with time, indicating almost immediate
flocculation of the colloids. Further addition of HA to boehmite colloids resulted in
flocculation within five minutes. The average size could not be measured due to the
high polydispersity. When HA was added in concentrations above 5 mg kg-1, the
scattering of the colloidal suspension was measured kinetically by UV spectroscopy.
This technique recorded a constant high absorbance, which corresponded to
scattering of the light rather than absorbance, until the particles flocculated, at which
time no more scattering was detected. From the UV measurements, the time taken for
the absorbance to fall to zero was used as an indication of stability.
As the added HA concentration increased, the time needed for flocculation to be
detected also increased, as shown in Table 28. This suggested that the time for the
binary humate-boehmite suspension to lose stability increased as the HA
concentration increased, suggesting that at larger HA concentrations, the binary sol
would remain stable. However, the HA concentration necessary for the system to be
stable during 24 hours was not reached in these experiments.
Table 28. Time of flocculation for boehmite colloids (67 mg) in the presence of increasing
concentrations of HA measured by UV-Vis spectroscopy.
[HA] mg kg-1 Time of flocculation (min)
200 59.58
250 66.00
300 104.66
400 259.06
The kinetic stability of a humate-boehmite suspension containing 11 mg boehmite in
10 cm3 was followed by DLS. Increasing concentrations of HA were added. The
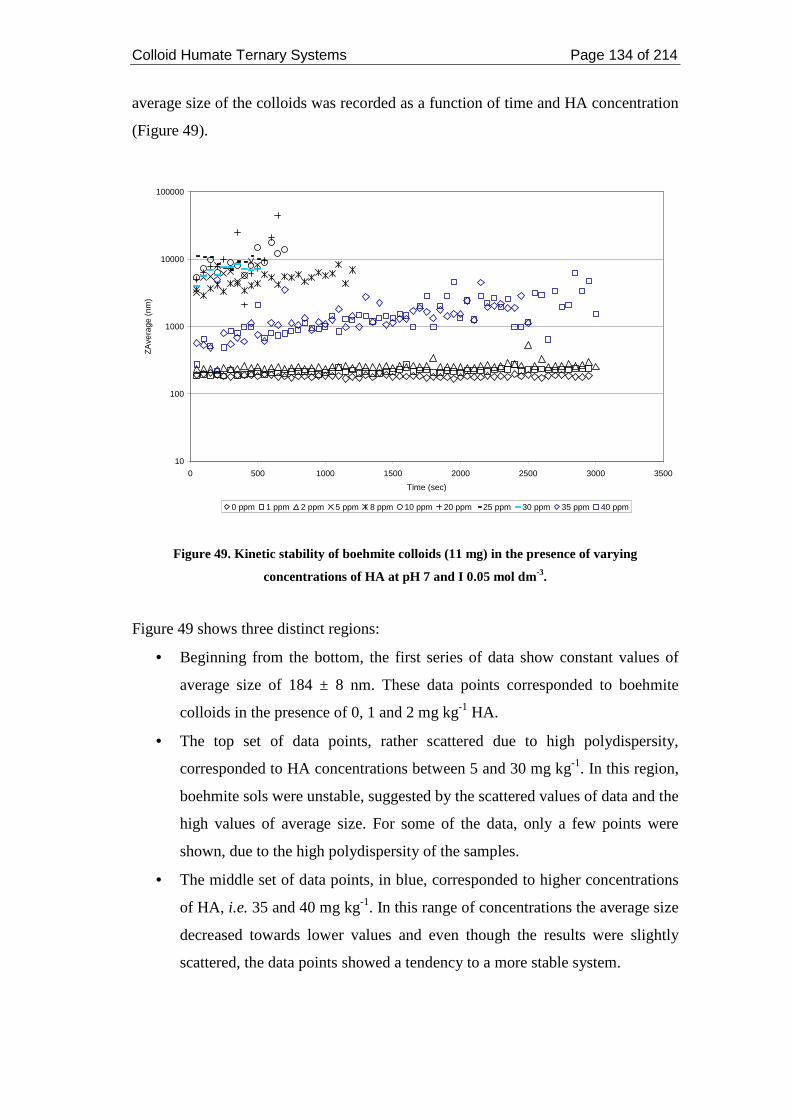
Colloid Humate Ternary Systems Page 134 of 214
average size of the colloids was recorded as a function of time and HA concentration
(Figure 49).
10
100
1000
10000
100000
0 500 1000 1500 2000 2500 3000 3500
Time (sec)
ZA
vera
ge (
nm)
0 ppm 1 ppm 2 ppm 5 ppm 8 ppm 10 ppm 20 ppm 25 ppm 30 ppm 35 ppm 40 ppm
Figure 49. Kinetic stability of boehmite colloids (11 mg) in the presence of varying
concentrations of HA at pH 7 and I 0.05 mol dm-3.
Figure 49 shows three distinct regions:
• Beginning from the bottom, the first series of data show constant values of
average size of 184 ± 8 nm. These data points corresponded to boehmite
colloids in the presence of 0, 1 and 2 mg kg-1 HA.
• The top set of data points, rather scattered due to high polydispersity,
corresponded to HA concentrations between 5 and 30 mg kg-1. In this region,
boehmite sols were unstable, suggested by the scattered values of data and the
high values of average size. For some of the data, only a few points were
shown, due to the high polydispersity of the samples.
• The middle set of data points, in blue, corresponded to higher concentrations
of HA, i.e. 35 and 40 mg kg-1. In this range of concentrations the average size
decreased towards lower values and even though the results were slightly
scattered, the data points showed a tendency to a more stable system.
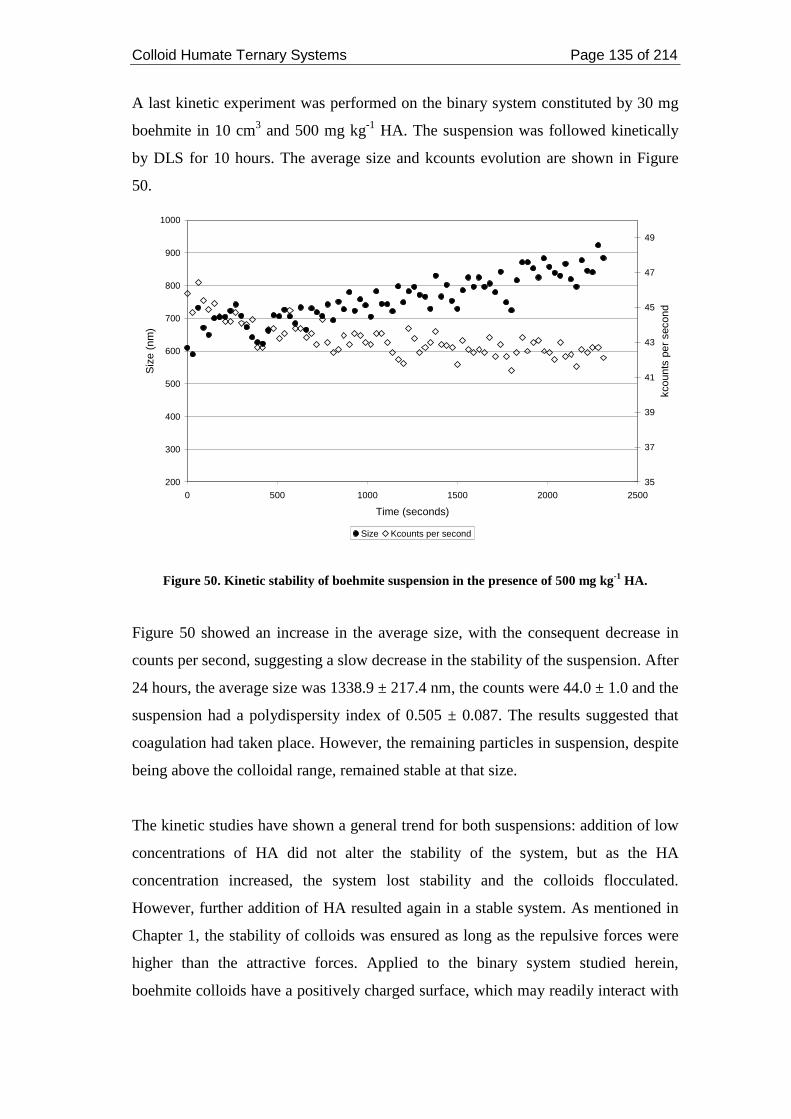
Colloid Humate Ternary Systems Page 135 of 214
A last kinetic experiment was performed on the binary system constituted by 30 mg
boehmite in 10 cm3 and 500 mg kg-1 HA. The suspension was followed kinetically
by DLS for 10 hours. The average size and kcounts evolution are shown in Figure
50.
200
300
400
500
600
700
800
900
1000
0 500 1000 1500 2000 2500
Time (seconds)
Siz
e (n
m)
35
37
39
41
43
45
47
49
kcou
nts
per
seco
nd
Size Kcounts per second
Figure 50. Kinetic stability of boehmite suspension in the presence of 500 mg kg-1 HA.
Figure 50 showed an increase in the average size, with the consequent decrease in
counts per second, suggesting a slow decrease in the stability of the suspension. After
24 hours, the average size was 1338.9 ± 217.4 nm, the counts were 44.0 ± 1.0 and the
suspension had a polydispersity index of 0.505 ± 0.087. The results suggested that
coagulation had taken place. However, the remaining particles in suspension, despite
being above the colloidal range, remained stable at that size.
The kinetic studies have shown a general trend for both suspensions: addition of low
concentrations of HA did not alter the stability of the system, but as the HA
concentration increased, the system lost stability and the colloids flocculated.
However, further addition of HA resulted again in a stable system. As mentioned in
Chapter 1, the stability of colloids was ensured as long as the repulsive forces were
higher than the attractive forces. Applied to the binary system studied herein,
boehmite colloids have a positively charged surface, which may readily interact with
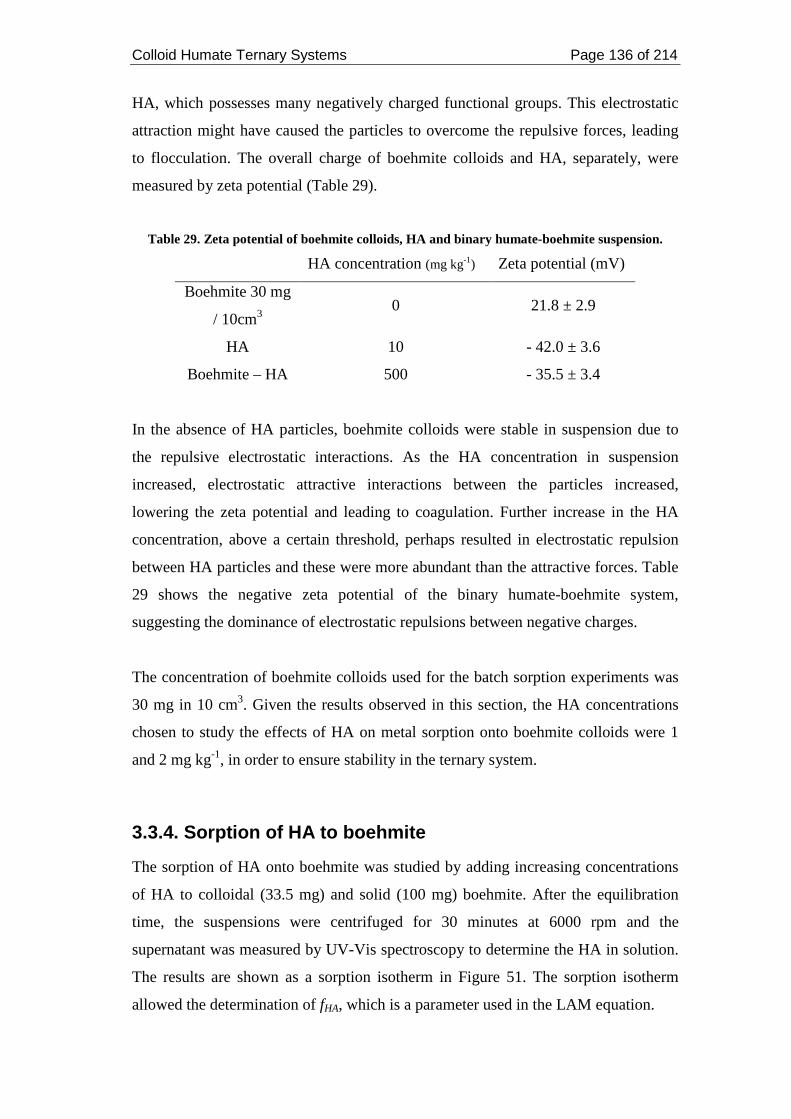
Colloid Humate Ternary Systems Page 136 of 214
HA, which possesses many negatively charged functional groups. This electrostatic
attraction might have caused the particles to overcome the repulsive forces, leading
to flocculation. The overall charge of boehmite colloids and HA, separately, were
measured by zeta potential (Table 29).
Table 29. Zeta potential of boehmite colloids, HA and binary humate-boehmite suspension.
HA concentration (mg kg-1) Zeta potential (mV)
Boehmite 30 mg
/ 10cm3 0 21.8 ± 2.9
HA 10 - 42.0 ± 3.6
Boehmite – HA 500 - 35.5 ± 3.4
In the absence of HA particles, boehmite colloids were stable in suspension due to
the repulsive electrostatic interactions. As the HA concentration in suspension
increased, electrostatic attractive interactions between the particles increased,
lowering the zeta potential and leading to coagulation. Further increase in the HA
concentration, above a certain threshold, perhaps resulted in electrostatic repulsion
between HA particles and these were more abundant than the attractive forces. Table
29 shows the negative zeta potential of the binary humate-boehmite system,
suggesting the dominance of electrostatic repulsions between negative charges.
The concentration of boehmite colloids used for the batch sorption experiments was
30 mg in 10 cm3. Given the results observed in this section, the HA concentrations
chosen to study the effects of HA on metal sorption onto boehmite colloids were 1
and 2 mg kg-1, in order to ensure stability in the ternary system.
3.3.4. Sorption of HA to boehmite
The sorption of HA onto boehmite was studied by adding increasing concentrations
of HA to colloidal (33.5 mg) and solid (100 mg) boehmite. After the equilibration
time, the suspensions were centrifuged for 30 minutes at 6000 rpm and the
supernatant was measured by UV-Vis spectroscopy to determine the HA in solution.
The results are shown as a sorption isotherm in Figure 51. The sorption isotherm
allowed the determination of fHA, which is a parameter used in the LAM equation.
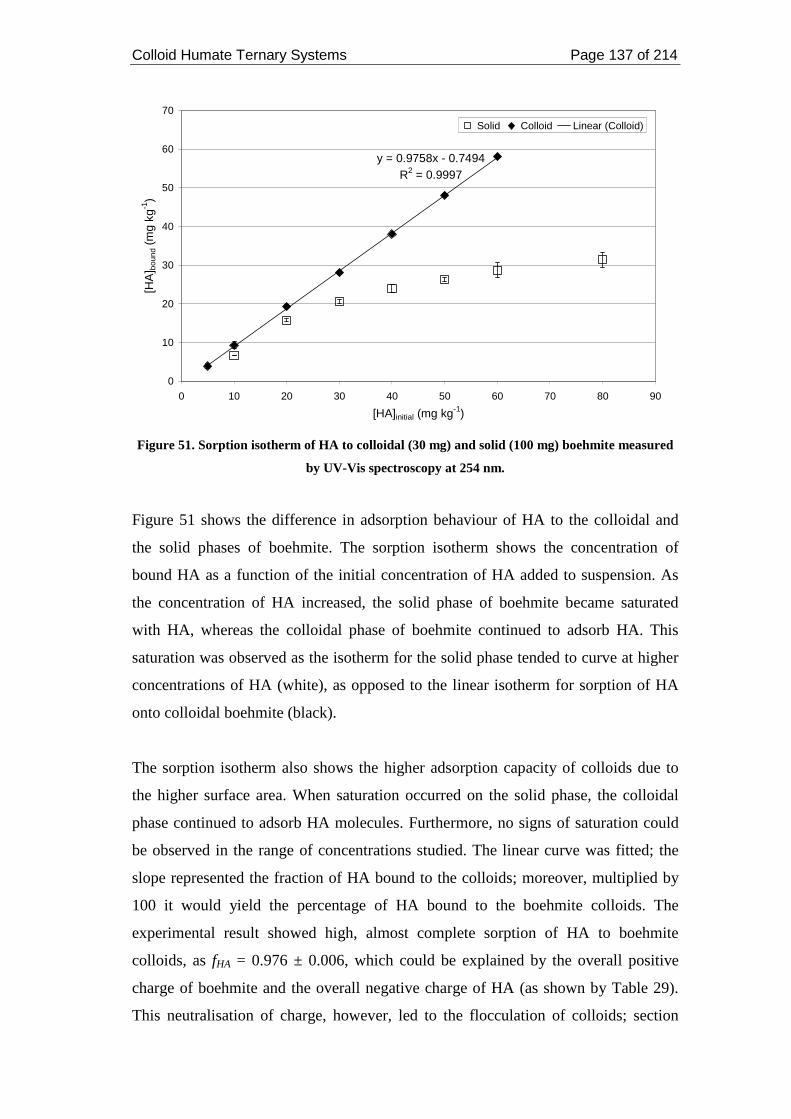
Colloid Humate Ternary Systems Page 137 of 214
y = 0.9758x - 0.7494R2 = 0.9997
0
10
20
30
40
50
60
70
0 10 20 30 40 50 60 70 80 90
[HA]initial (mg kg-1)
[HA
] bou
nd (
mg
kg-1
)
Solid Colloid Linear (Colloid)
Figure 51. Sorption isotherm of HA to colloidal (30 mg) and solid (100 mg) boehmite measured
by UV-Vis spectroscopy at 254 nm.
Figure 51 shows the difference in adsorption behaviour of HA to the colloidal and
the solid phases of boehmite. The sorption isotherm shows the concentration of
bound HA as a function of the initial concentration of HA added to suspension. As
the concentration of HA increased, the solid phase of boehmite became saturated
with HA, whereas the colloidal phase of boehmite continued to adsorb HA. This
saturation was observed as the isotherm for the solid phase tended to curve at higher
concentrations of HA (white), as opposed to the linear isotherm for sorption of HA
onto colloidal boehmite (black).
The sorption isotherm also shows the higher adsorption capacity of colloids due to
the higher surface area. When saturation occurred on the solid phase, the colloidal
phase continued to adsorb HA molecules. Furthermore, no signs of saturation could
be observed in the range of concentrations studied. The linear curve was fitted; the
slope represented the fraction of HA bound to the colloids; moreover, multiplied by
100 it would yield the percentage of HA bound to the boehmite colloids. The
experimental result showed high, almost complete sorption of HA to boehmite
colloids, as fHA = 0.976 ± 0.006, which could be explained by the overall positive
charge of boehmite and the overall negative charge of HA (as shown by Table 29).
This neutralisation of charge, however, led to the flocculation of colloids; section
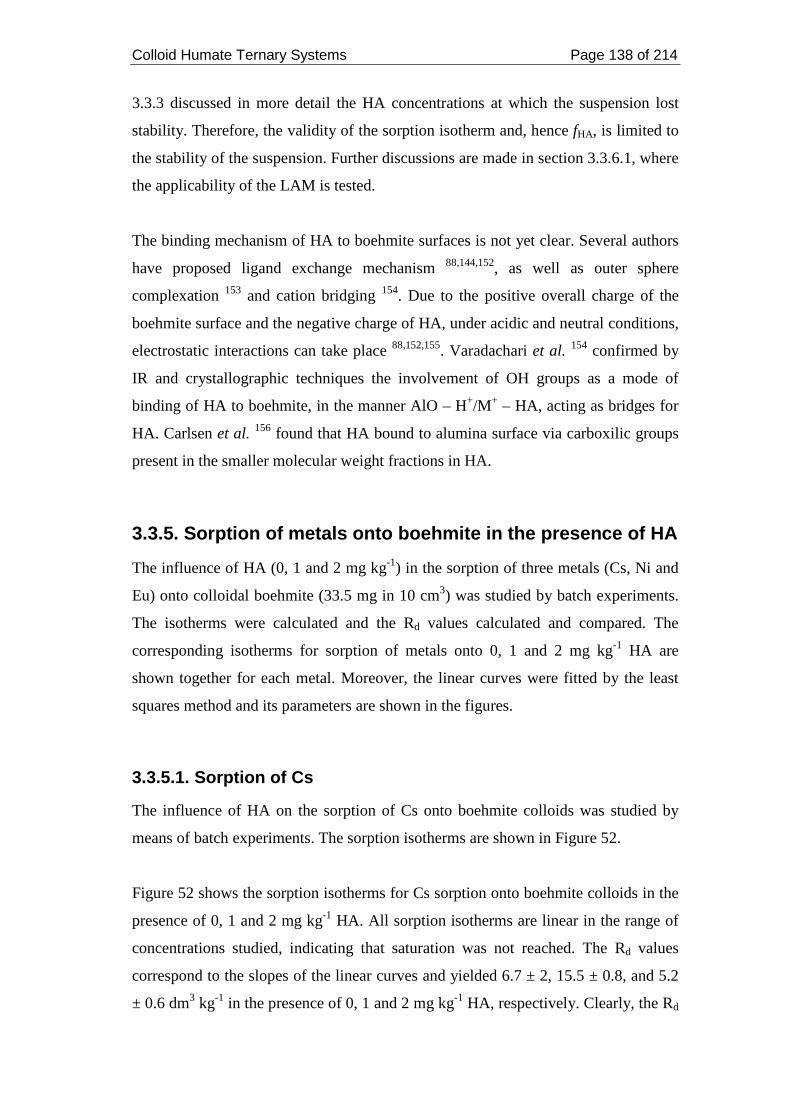
Colloid Humate Ternary Systems Page 138 of 214
3.3.3 discussed in more detail the HA concentrations at which the suspension lost
stability. Therefore, the validity of the sorption isotherm and, hence fHA, is limited to
the stability of the suspension. Further discussions are made in section 3.3.6.1, where
the applicability of the LAM is tested.
The binding mechanism of HA to boehmite surfaces is not yet clear. Several authors
have proposed ligand exchange mechanism 88,144,152, as well as outer sphere
complexation 153 and cation bridging 154. Due to the positive overall charge of the
boehmite surface and the negative charge of HA, under acidic and neutral conditions,
electrostatic interactions can take place 88,152,155. Varadachari et al. 154 confirmed by
IR and crystallographic techniques the involvement of OH groups as a mode of
binding of HA to boehmite, in the manner AlO – H+/M+ – HA, acting as bridges for
HA. Carlsen et al. 156 found that HA bound to alumina surface via carboxilic groups
present in the smaller molecular weight fractions in HA.
3.3.5. Sorption of metals onto boehmite in the presence of HA
The influence of HA (0, 1 and 2 mg kg-1) in the sorption of three metals (Cs, Ni and
Eu) onto colloidal boehmite (33.5 mg in 10 cm3) was studied by batch experiments.
The isotherms were calculated and the Rd values calculated and compared. The
corresponding isotherms for sorption of metals onto 0, 1 and 2 mg kg-1 HA are
shown together for each metal. Moreover, the linear curves were fitted by the least
squares method and its parameters are shown in the figures.
3.3.5.1. Sorption of Cs
The influence of HA on the sorption of Cs onto boehmite colloids was studied by
means of batch experiments. The sorption isotherms are shown in Figure 52.
Figure 52 shows the sorption isotherms for Cs sorption onto boehmite colloids in the
presence of 0, 1 and 2 mg kg-1 HA. All sorption isotherms are linear in the range of
concentrations studied, indicating that saturation was not reached. The Rd values
correspond to the slopes of the linear curves and yielded 6.7 ± 2, 15.5 ± 0.8, and 5.2
± 0.6 dm3 kg-1 in the presence of 0, 1 and 2 mg kg-1 HA, respectively. Clearly, the Rd
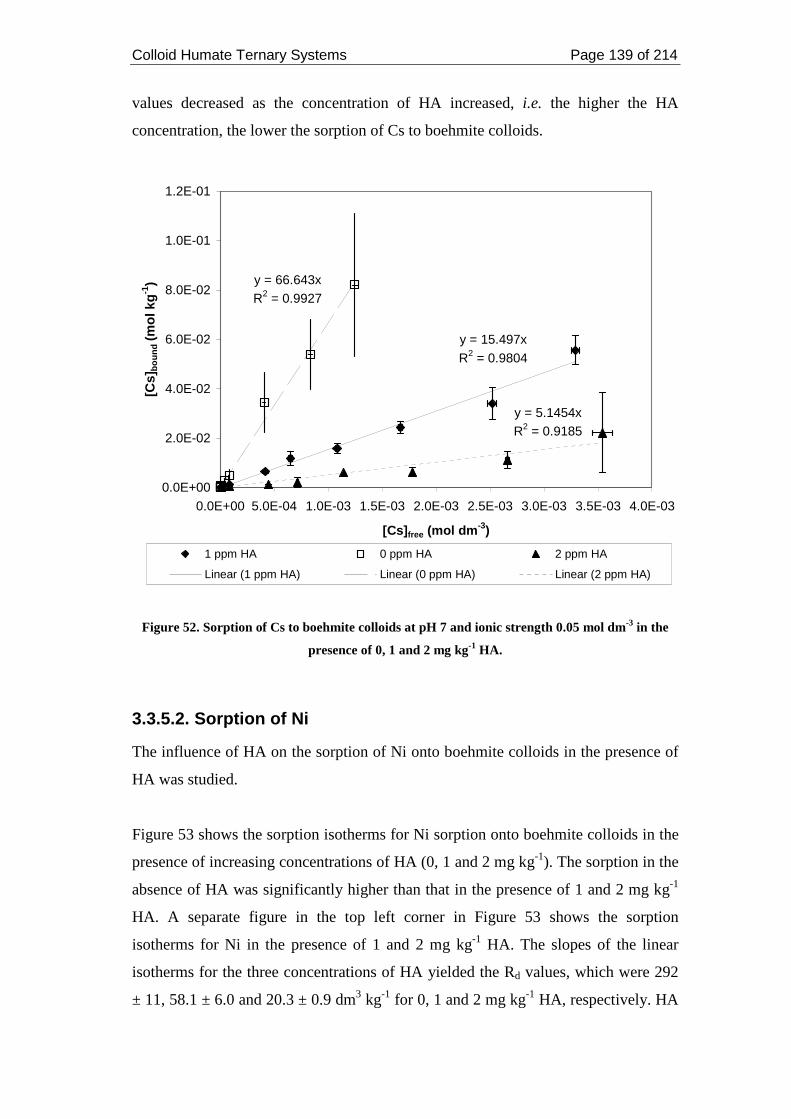
Colloid Humate Ternary Systems Page 139 of 214
values decreased as the concentration of HA increased, i.e. the higher the HA
concentration, the lower the sorption of Cs to boehmite colloids.
y = 15.497xR2 = 0.9804
y = 66.643xR2 = 0.9927
y = 5.1454xR2 = 0.9185
0.0E+00
2.0E-02
4.0E-02
6.0E-02
8.0E-02
1.0E-01
1.2E-01
0.0E+00 5.0E-04 1.0E-03 1.5E-03 2.0E-03 2.5E-03 3.0E-03 3.5E-03 4.0E-03
[Cs]free (mol dm-3)
[Cs]
bo
un
d (m
ol k
g-1
)
1 ppm HA 0 ppm HA 2 ppm HA
Linear (1 ppm HA) Linear (0 ppm HA) Linear (2 ppm HA)
Figure 52. Sorption of Cs to boehmite colloids at pH 7 and ionic strength 0.05 mol dm-3 in the
presence of 0, 1 and 2 mg kg-1 HA.
3.3.5.2. Sorption of Ni
The influence of HA on the sorption of Ni onto boehmite colloids in the presence of
HA was studied.
Figure 53 shows the sorption isotherms for Ni sorption onto boehmite colloids in the
presence of increasing concentrations of HA (0, 1 and 2 mg kg-1). The sorption in the
absence of HA was significantly higher than that in the presence of 1 and 2 mg kg-1
HA. A separate figure in the top left corner in Figure 53 shows the sorption
isotherms for Ni in the presence of 1 and 2 mg kg-1 HA. The slopes of the linear
isotherms for the three concentrations of HA yielded the Rd values, which were 292
± 11, 58.1 ± 6.0 and 20.3 ± 0.9 dm3 kg-1 for 0, 1 and 2 mg kg-1 HA, respectively. HA
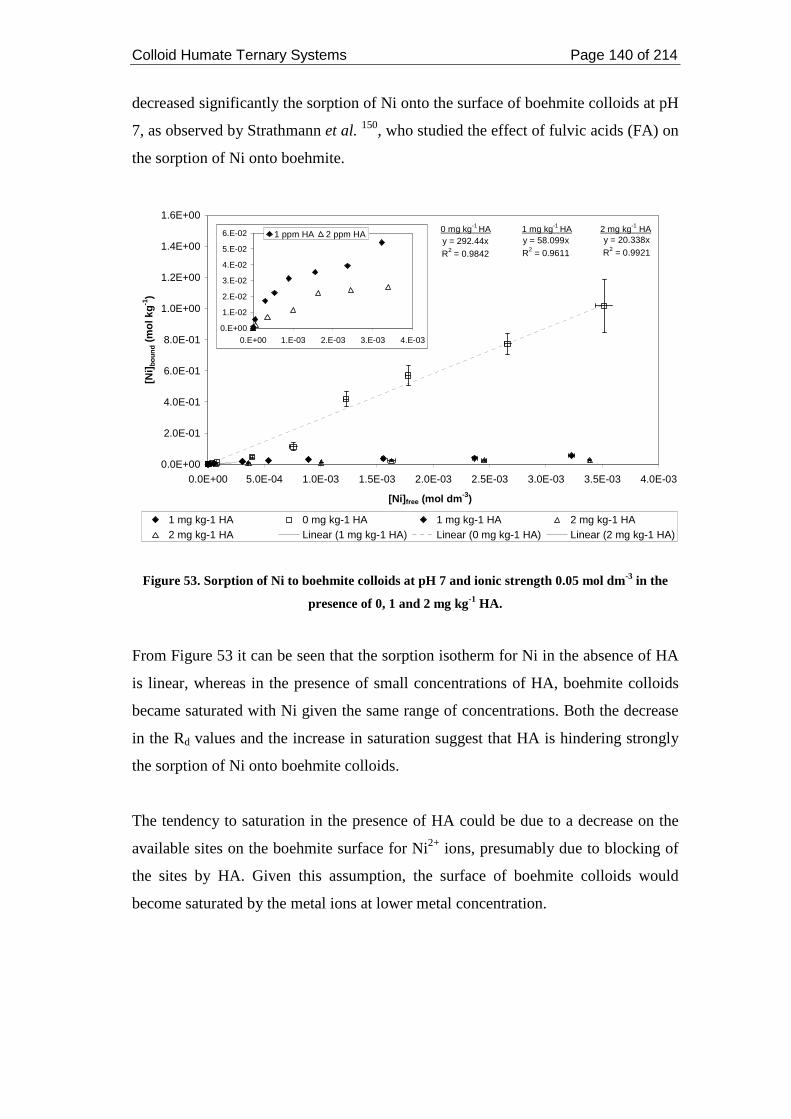
Colloid Humate Ternary Systems Page 140 of 214
decreased significantly the sorption of Ni onto the surface of boehmite colloids at pH
7, as observed by Strathmann et al. 150, who studied the effect of fulvic acids (FA) on
the sorption of Ni onto boehmite.
y = 58.099xR2 = 0.9611
y = 292.44xR2 = 0.9842
y = 20.338xR2 = 0.9921
0.0E+00
2.0E-01
4.0E-01
6.0E-01
8.0E-01
1.0E+00
1.2E+00
1.4E+00
1.6E+00
0.0E+00 5.0E-04 1.0E-03 1.5E-03 2.0E-03 2.5E-03 3.0E-03 3.5E-03 4.0E-03
[Ni]free (mol dm-3)
[Ni]
bo
un
d (
mo
l kg
-1)
1 mg kg-1 HA 0 mg kg-1 HA 1 mg kg-1 HA 2 mg kg-1 HA2 mg kg-1 HA Linear (1 mg kg-1 HA) Linear (0 mg kg-1 HA) Linear (2 mg kg-1 HA)
0.E+00
1.E-02
2.E-02
3.E-02
4.E-02
5.E-02
6.E-02
0.E+00 1.E-03 2.E-03 3.E-03 4.E-03
1 ppm HA 2 ppm HA0 mg kg-1 HA 1 mg kg-1 HA 2 mg kg-1 HA
Figure 53. Sorption of Ni to boehmite colloids at pH 7 and ionic strength 0.05 mol dm-3 in the
presence of 0, 1 and 2 mg kg-1 HA.
From Figure 53 it can be seen that the sorption isotherm for Ni in the absence of HA
is linear, whereas in the presence of small concentrations of HA, boehmite colloids
became saturated with Ni given the same range of concentrations. Both the decrease
in the Rd values and the increase in saturation suggest that HA is hindering strongly
the sorption of Ni onto boehmite colloids.
The tendency to saturation in the presence of HA could be due to a decrease on the
available sites on the boehmite surface for Ni2+ ions, presumably due to blocking of
the sites by HA. Given this assumption, the surface of boehmite colloids would
become saturated by the metal ions at lower metal concentration.
Colloid Humate Ternary Systems Page 141 of 214
3.3.5.3. Sorption of Eu
The effect of increasing concentrations of HA on the sorption of Eu onto boehmite
colloids was studied. The sorption isotherms for the different HA concentrations are
shown in Figure 54.
y = 104.35x
R2 = 0.9823y = 721.42x
R2 = 0.9847
y = 101.74x
R2 = 0.8201
0.0E+00
2.0E-02
4.0E-02
6.0E-02
8.0E-02
1.0E-01
1.2E-01
0.0E+00 5.0E-04 1.0E-03 1.5E-03 2.0E-03 2.5E-03 3.0E-03 3.5E-03
[Eu]free (mol dm-3)
[Eu
] bo
un
d (
mo
l kg
-1)
1 mg kg-1 HA 2 mg kg-1 HA 1 mg kg-1 HA2 mg kg-1 HA 0 mg kg-1 HA 0 mg kg-1 HALinear (1 ppm HA) Linear (2 ppm HA) Linear (0 ppm HA)
2 mg kg-1 HA1 mg kg-1 HA0 mg kg-1 HA
Figure 54. Sorption isotherm for Eu sorption on boehmite colloids in the presence of HA (0, 1
and 2 mg kg-1) at pH 7 and ionic strength 0.05 mol dm-3.
Figure 54 shows the influence of increasing concentration of HA on the sorption
isotherms for Eu sorption on boehmite colloids. In the absence of HA the sorption
isotherm shows a sharp increase but quickly reaches saturation, similarly to the
sorption isotherm in the presence of 1 mg kg-1 HA. This analogy is reflected in the Rd
value, as both yielded 102 ± 22 and 104 ± 8 dm3 kg-1, respectively. Further addition
of HA (2 mg kg-1) enhanced the sorption of Eu3+ to boehmite colloids, as reflected by
the Rd value of 721 ± 53 dm3 kg-1.
3.3.5.4. Discussions
In the case of Cs and Ni the sorption isotherms showed a significant decrease of the
Rd values in the presence of HA. In the case of Eu, the Rd values increased at higher
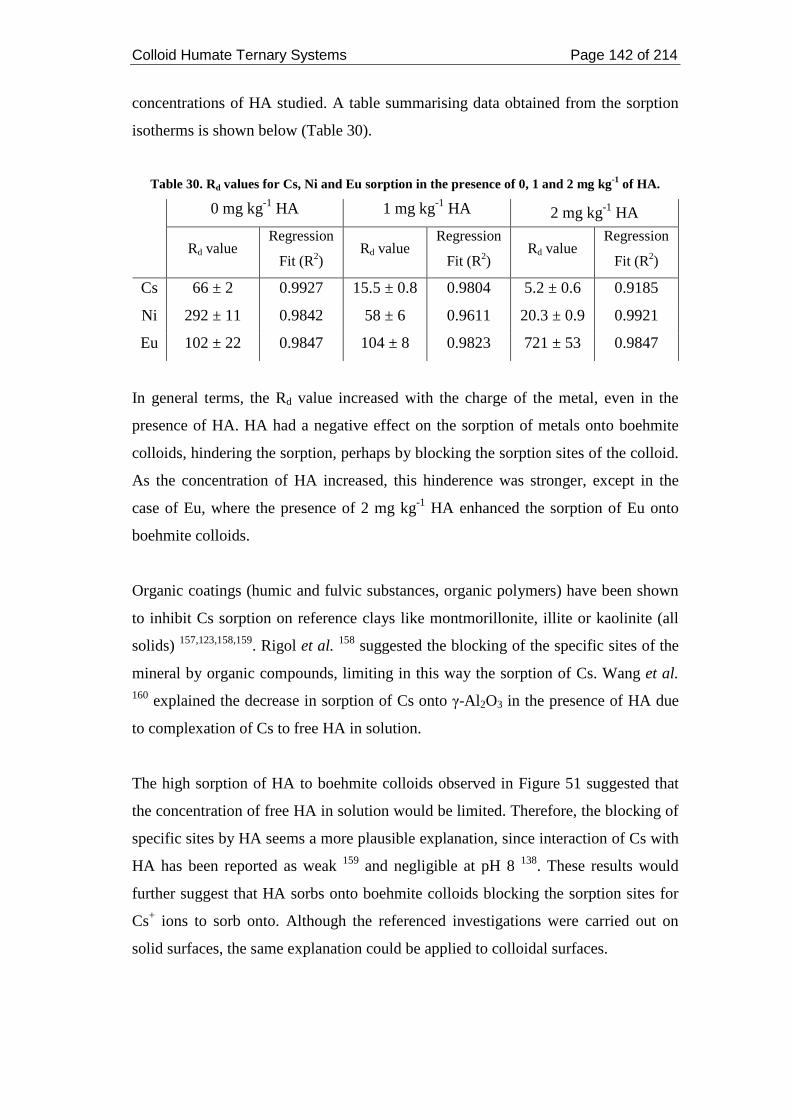
Colloid Humate Ternary Systems Page 142 of 214
concentrations of HA studied. A table summarising data obtained from the sorption
isotherms is shown below (Table 30).
Table 30. Rd values for Cs, Ni and Eu sorption in the presence of 0, 1 and 2 mg kg-1 of HA.
0 mg kg-1 HA 1 mg kg-1 HA 2 mg kg-1 HA
Rd value Regression
Fit (R2) Rd value
Regression
Fit (R2) Rd value
Regression
Fit (R2)
Cs 66 ± 2 0.9927 15.5 ± 0.8 0.9804 5.2 ± 0.6 0.9185
Ni 292 ± 11 0.9842 58 ± 6 0.9611 20.3 ± 0.9 0.9921
Eu 102 ± 22 0.9847 104 ± 8 0.9823 721 ± 53 0.9847
In general terms, the Rd value increased with the charge of the metal, even in the
presence of HA. HA had a negative effect on the sorption of metals onto boehmite
colloids, hindering the sorption, perhaps by blocking the sorption sites of the colloid.
As the concentration of HA increased, this hinderence was stronger, except in the
case of Eu, where the presence of 2 mg kg-1 HA enhanced the sorption of Eu onto
boehmite colloids.
Organic coatings (humic and fulvic substances, organic polymers) have been shown
to inhibit Cs sorption on reference clays like montmorillonite, illite or kaolinite (all
solids) 157,123,158,159. Rigol et al. 158 suggested the blocking of the specific sites of the
mineral by organic compounds, limiting in this way the sorption of Cs. Wang et al. 160 explained the decrease in sorption of Cs onto γ-Al 2O3 in the presence of HA due
to complexation of Cs to free HA in solution.
The high sorption of HA to boehmite colloids observed in Figure 51 suggested that
the concentration of free HA in solution would be limited. Therefore, the blocking of
specific sites by HA seems a more plausible explanation, since interaction of Cs with
HA has been reported as weak 159 and negligible at pH 8 138. These results would
further suggest that HA sorbs onto boehmite colloids blocking the sorption sites for
Cs+ ions to sorb onto. Although the referenced investigations were carried out on
solid surfaces, the same explanation could be applied to colloidal surfaces.
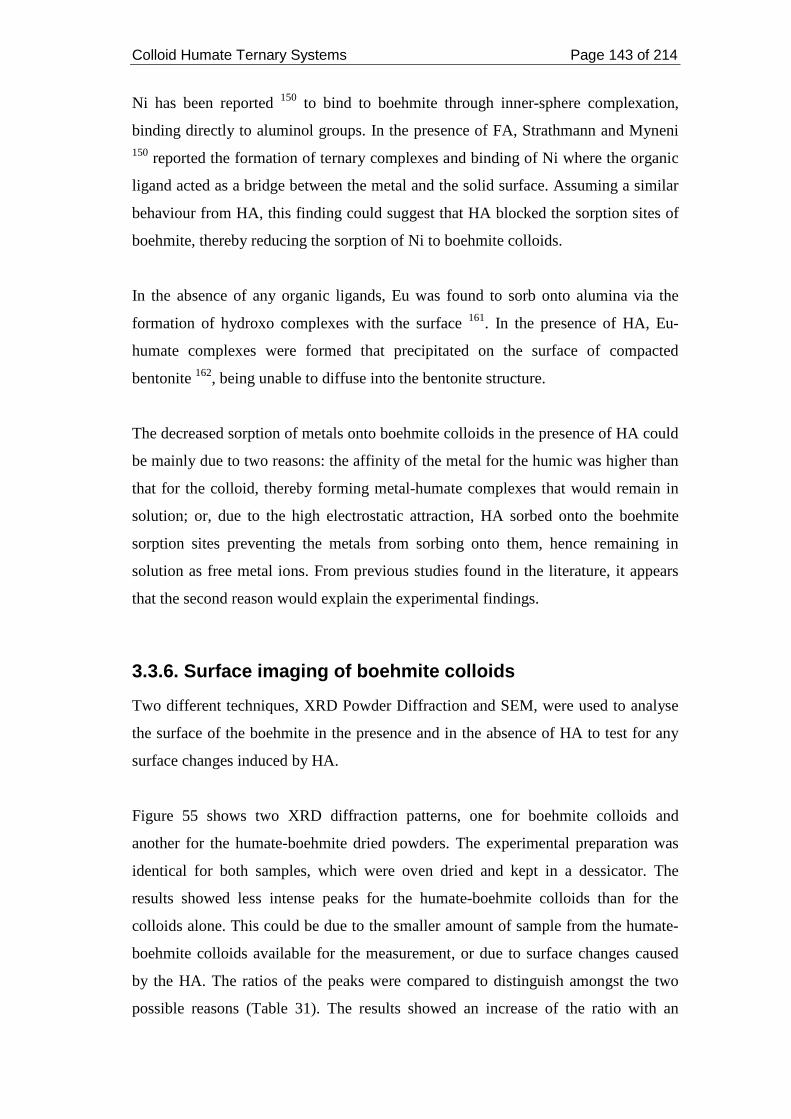
Colloid Humate Ternary Systems Page 143 of 214
Ni has been reported 150 to bind to boehmite through inner-sphere complexation,
binding directly to aluminol groups. In the presence of FA, Strathmann and Myneni 150 reported the formation of ternary complexes and binding of Ni where the organic
ligand acted as a bridge between the metal and the solid surface. Assuming a similar
behaviour from HA, this finding could suggest that HA blocked the sorption sites of
boehmite, thereby reducing the sorption of Ni to boehmite colloids.
In the absence of any organic ligands, Eu was found to sorb onto alumina via the
formation of hydroxo complexes with the surface 161. In the presence of HA, Eu-
humate complexes were formed that precipitated on the surface of compacted
bentonite 162, being unable to diffuse into the bentonite structure.
The decreased sorption of metals onto boehmite colloids in the presence of HA could
be mainly due to two reasons: the affinity of the metal for the humic was higher than
that for the colloid, thereby forming metal-humate complexes that would remain in
solution; or, due to the high electrostatic attraction, HA sorbed onto the boehmite
sorption sites preventing the metals from sorbing onto them, hence remaining in
solution as free metal ions. From previous studies found in the literature, it appears
that the second reason would explain the experimental findings.
3.3.6. Surface imaging of boehmite colloids
Two different techniques, XRD Powder Diffraction and SEM, were used to analyse
the surface of the boehmite in the presence and in the absence of HA to test for any
surface changes induced by HA.
Figure 55 shows two XRD diffraction patterns, one for boehmite colloids and
another for the humate-boehmite dried powders. The experimental preparation was
identical for both samples, which were oven dried and kept in a dessicator. The
results showed less intense peaks for the humate-boehmite colloids than for the
colloids alone. This could be due to the smaller amount of sample from the humate-
boehmite colloids available for the measurement, or due to surface changes caused
by the HA. The ratios of the peaks were compared to distinguish amongst the two
possible reasons (Table 31). The results showed an increase of the ratio with an
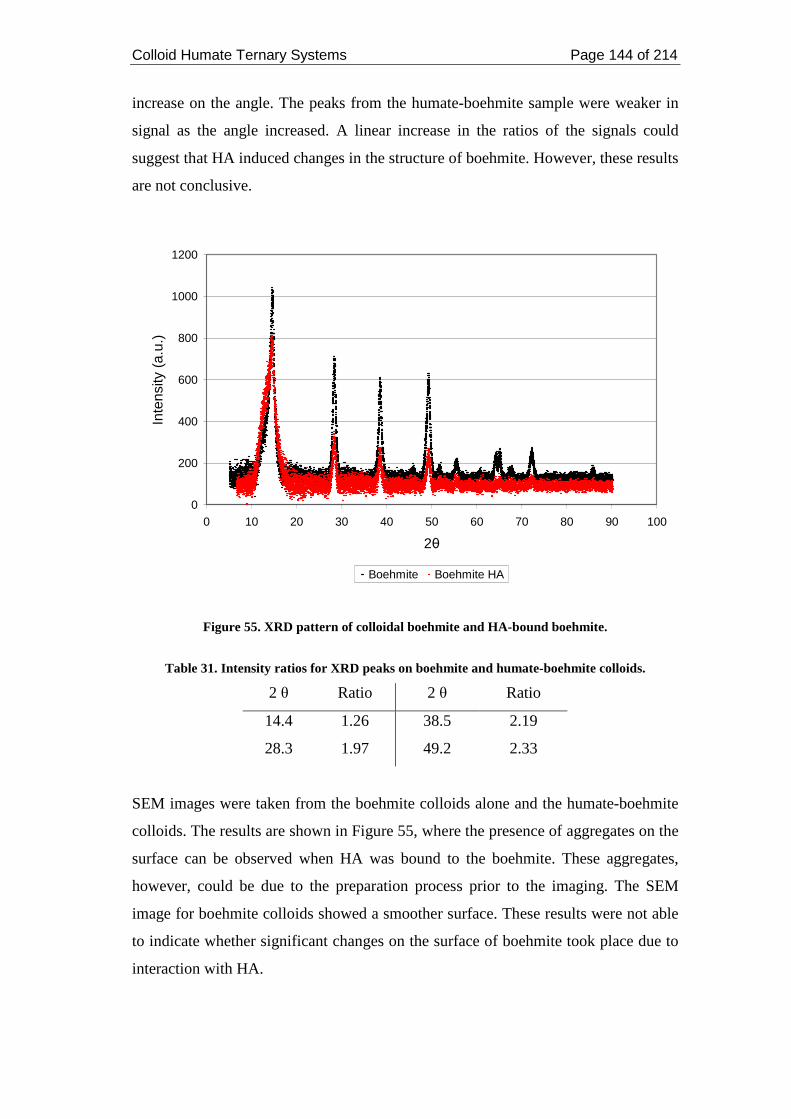
Colloid Humate Ternary Systems Page 144 of 214
increase on the angle. The peaks from the humate-boehmite sample were weaker in
signal as the angle increased. A linear increase in the ratios of the signals could
suggest that HA induced changes in the structure of boehmite. However, these results
are not conclusive.
0
200
400
600
800
1000
1200
0 10 20 30 40 50 60 70 80 90 100
2θ
Inte
nsity
(a.
u.)
Boehmite Boehmite HA
Figure 55. XRD pattern of colloidal boehmite and HA-bound boehmite.
Table 31. Intensity ratios for XRD peaks on boehmite and humate-boehmite colloids.
2 θ Ratio 2 θ Ratio
14.4 1.26 38.5 2.19
28.3 1.97 49.2 2.33
SEM images were taken from the boehmite colloids alone and the humate-boehmite
colloids. The results are shown in Figure 55, where the presence of aggregates on the
surface can be observed when HA was bound to the boehmite. These aggregates,
however, could be due to the preparation process prior to the imaging. The SEM
image for boehmite colloids showed a smoother surface. These results were not able
to indicate whether significant changes on the surface of boehmite took place due to
interaction with HA.
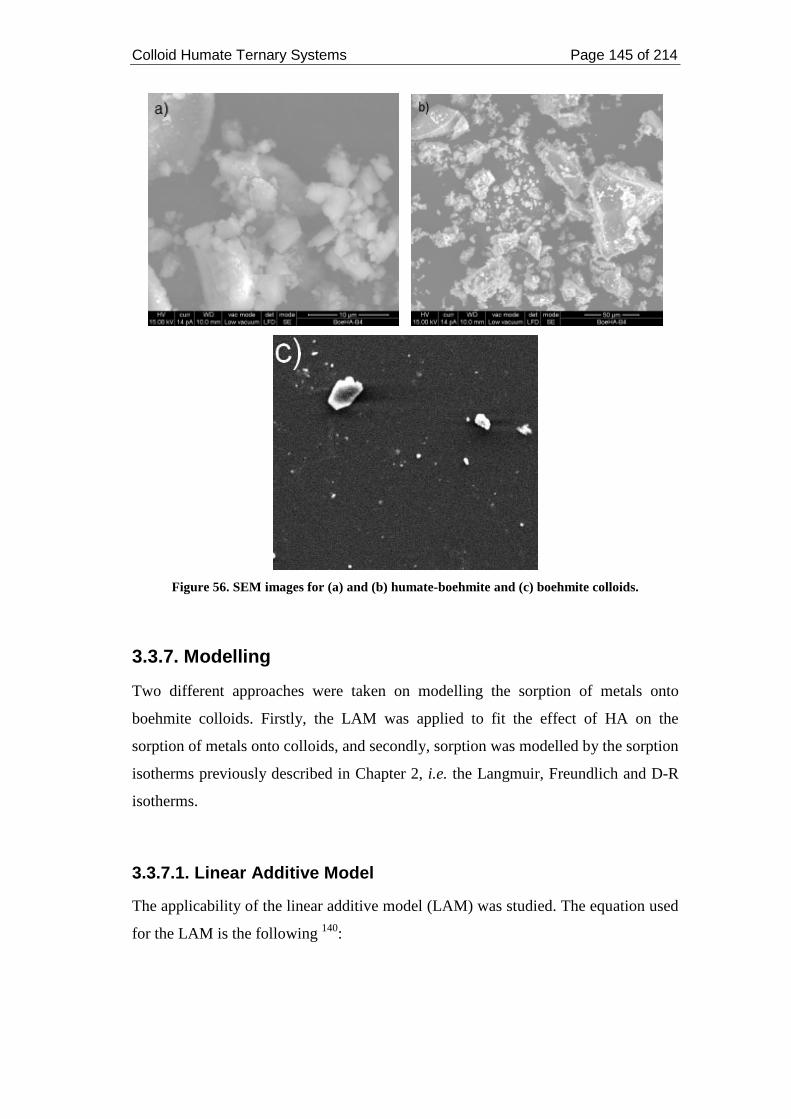
Colloid Humate Ternary Systems Page 145 of 214
Figure 56. SEM images for (a) and (b) humate-boehmite and (c) boehmite colloids.
3.3.7. Modelling
Two different approaches were taken on modelling the sorption of metals onto
boehmite colloids. Firstly, the LAM was applied to fit the effect of HA on the
sorption of metals onto colloids, and secondly, sorption was modelled by the sorption
isotherms previously described in Chapter 2, i.e. the Langmuir, Freundlich and D-R
isotherms.
3.3.7.1. Linear Additive Model
The applicability of the linear additive model (LAM) was studied. The equation used
for the LAM is the following 140:
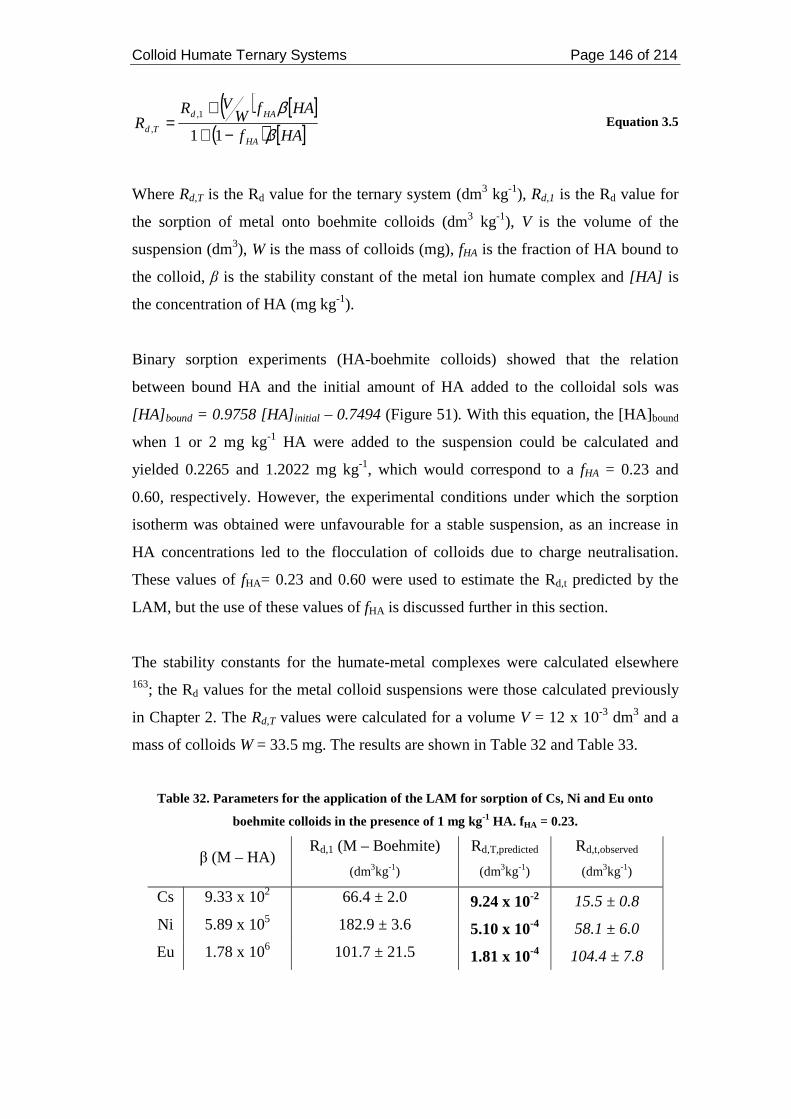
Colloid Humate Ternary Systems Page 146 of 214
( ) [ ]( ) [ ]HAf
HAfWVR
RHA
HAd
Td ββ
−+
+=
11
1,
, Equation 3.5
Where Rd,T is the Rd value for the ternary system (dm3 kg-1), Rd,1 is the Rd value for
the sorption of metal onto boehmite colloids (dm3 kg-1), V is the volume of the
suspension (dm3), W is the mass of colloids (mg), fHA is the fraction of HA bound to
the colloid, β is the stability constant of the metal ion humate complex and [HA] is
the concentration of HA (mg kg-1).
Binary sorption experiments (HA-boehmite colloids) showed that the relation
between bound HA and the initial amount of HA added to the colloidal sols was
[HA] bound = 0.9758 [HA]initial – 0.7494 (Figure 51). With this equation, the [HA]bound
when 1 or 2 mg kg-1 HA were added to the suspension could be calculated and
yielded 0.2265 and 1.2022 mg kg-1, which would correspond to a fHA = 0.23 and
0.60, respectively. However, the experimental conditions under which the sorption
isotherm was obtained were unfavourable for a stable suspension, as an increase in
HA concentrations led to the flocculation of colloids due to charge neutralisation.
These values of fHA= 0.23 and 0.60 were used to estimate the Rd,t predicted by the
LAM, but the use of these values of fHA is discussed further in this section.
The stability constants for the humate-metal complexes were calculated elsewhere 163; the Rd values for the metal colloid suspensions were those calculated previously
in Chapter 2. The Rd,T values were calculated for a volume V = 12 x 10-3 dm3 and a
mass of colloids W = 33.5 mg. The results are shown in Table 32 and Table 33.
Table 32. Parameters for the application of the LAM for sorption of Cs, Ni and Eu onto
boehmite colloids in the presence of 1 mg kg-1 HA. fHA = 0.23.
β (M – HA) Rd,1 (M – Boehmite)
(dm3kg-1)
Rd,T,predicted
(dm3kg-1)
Rd,t,observed
(dm3kg-1)
Cs 9.33 x 10² 66.4 ± 2.0 9.24 x 10⁻² 15.5 ± 0.8
Ni 5.89 x 10⁵ 182.9 ± 3.6 5.10 x 10⁻⁴ 58.1 ± 6.0
Eu 1.78 x 10⁶ 101.7 ± 21.5 1.81 x 10⁻⁴ 104.4 ± 7.8
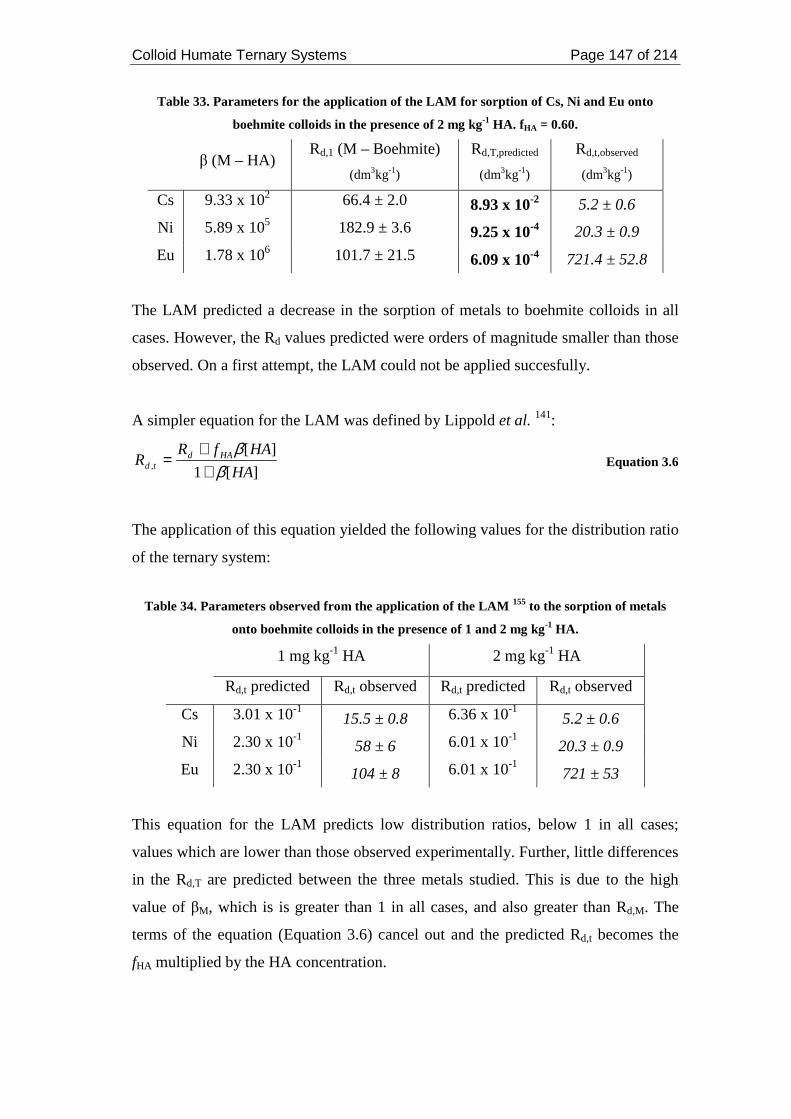
Colloid Humate Ternary Systems Page 147 of 214
Table 33. Parameters for the application of the LAM for sorption of Cs, Ni and Eu onto
boehmite colloids in the presence of 2 mg kg-1 HA. fHA = 0.60.
β (M – HA) Rd,1 (M – Boehmite)
(dm3kg-1)
Rd,T,predicted
(dm3kg-1)
Rd,t,observed
(dm3kg-1)
Cs 9.33 x 10² 66.4 ± 2.0 8.93 x 10⁻² 5.2 ± 0.6
Ni 5.89 x 10⁵ 182.9 ± 3.6 9.25 x 10⁻⁴ 20.3 ± 0.9
Eu 1.78 x 10⁶ 101.7 ± 21.5 6.09 x 10⁻⁴ 721.4 ± 52.8
The LAM predicted a decrease in the sorption of metals to boehmite colloids in all
cases. However, the Rd values predicted were orders of magnitude smaller than those
observed. On a first attempt, the LAM could not be applied succesfully.
A simpler equation for the LAM was defined by Lippold et al. 141:
][1
][, HA
HAfRR HAd
td ββ
++
= Equation 3.6
The application of this equation yielded the following values for the distribution ratio
of the ternary system:
Table 34. Parameters observed from the application of the LAM 155 to the sorption of metals
onto boehmite colloids in the presence of 1 and 2 mg kg-1 HA.
1 mg kg-1 HA 2 mg kg-1 HA
Rd,t predicted Rd,t observed Rd,t predicted Rd,t observed
Cs 3.01 x 10⁻¹ 15.5 ± 0.8 6.36 x 10⁻¹ 5.2 ± 0.6
Ni 2.30 x 10⁻¹ 58 ± 6 6.01 x 10⁻¹ 20.3 ± 0.9
Eu 2.30 x 10⁻¹ 104 ± 8 6.01 x 10⁻¹ 721 ± 53
This equation for the LAM predicts low distribution ratios, below 1 in all cases;
values which are lower than those observed experimentally. Further, little differences
in the Rd,T are predicted between the three metals studied. This is due to the high
value of βM, which is is greater than 1 in all cases, and also greater than Rd,M. The
terms of the equation (Equation 3.6) cancel out and the predicted Rd,t becomes the
fHA multiplied by the HA concentration.
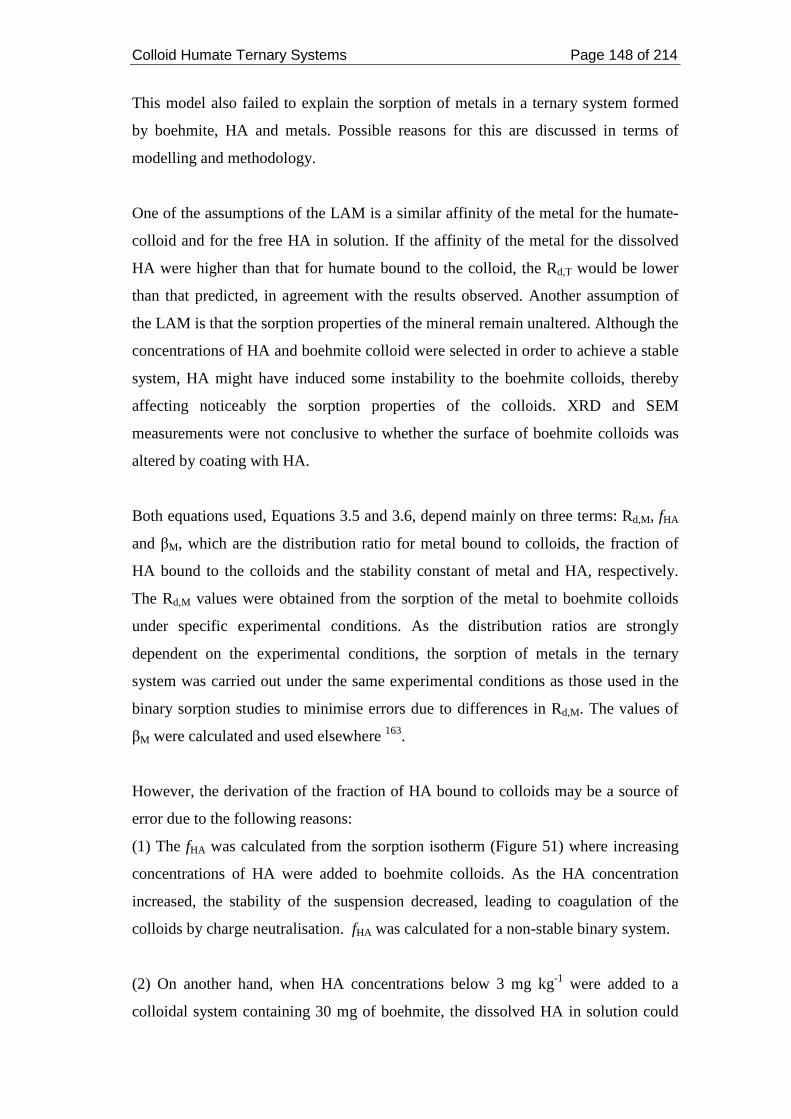
Colloid Humate Ternary Systems Page 148 of 214
This model also failed to explain the sorption of metals in a ternary system formed
by boehmite, HA and metals. Possible reasons for this are discussed in terms of
modelling and methodology.
One of the assumptions of the LAM is a similar affinity of the metal for the humate-
colloid and for the free HA in solution. If the affinity of the metal for the dissolved
HA were higher than that for humate bound to the colloid, the Rd,T would be lower
than that predicted, in agreement with the results observed. Another assumption of
the LAM is that the sorption properties of the mineral remain unaltered. Although the
concentrations of HA and boehmite colloid were selected in order to achieve a stable
system, HA might have induced some instability to the boehmite colloids, thereby
affecting noticeably the sorption properties of the colloids. XRD and SEM
measurements were not conclusive to whether the surface of boehmite colloids was
altered by coating with HA.
Both equations used, Equations 3.5 and 3.6, depend mainly on three terms: Rd,M, fHA
and βM, which are the distribution ratio for metal bound to colloids, the fraction of
HA bound to the colloids and the stability constant of metal and HA, respectively.
The Rd,M values were obtained from the sorption of the metal to boehmite colloids
under specific experimental conditions. As the distribution ratios are strongly
dependent on the experimental conditions, the sorption of metals in the ternary
system was carried out under the same experimental conditions as those used in the
binary sorption studies to minimise errors due to differences in Rd,M. The values of
βM were calculated and used elsewhere 163.
However, the derivation of the fraction of HA bound to colloids may be a source of
error due to the following reasons:
(1) The fHA was calculated from the sorption isotherm (Figure 51) where increasing
concentrations of HA were added to boehmite colloids. As the HA concentration
increased, the stability of the suspension decreased, leading to coagulation of the
colloids by charge neutralisation. fHA was calculated for a non-stable binary system.
(2) On another hand, when HA concentrations below 3 mg kg-1 were added to a
colloidal system containing 30 mg of boehmite, the dissolved HA in solution could
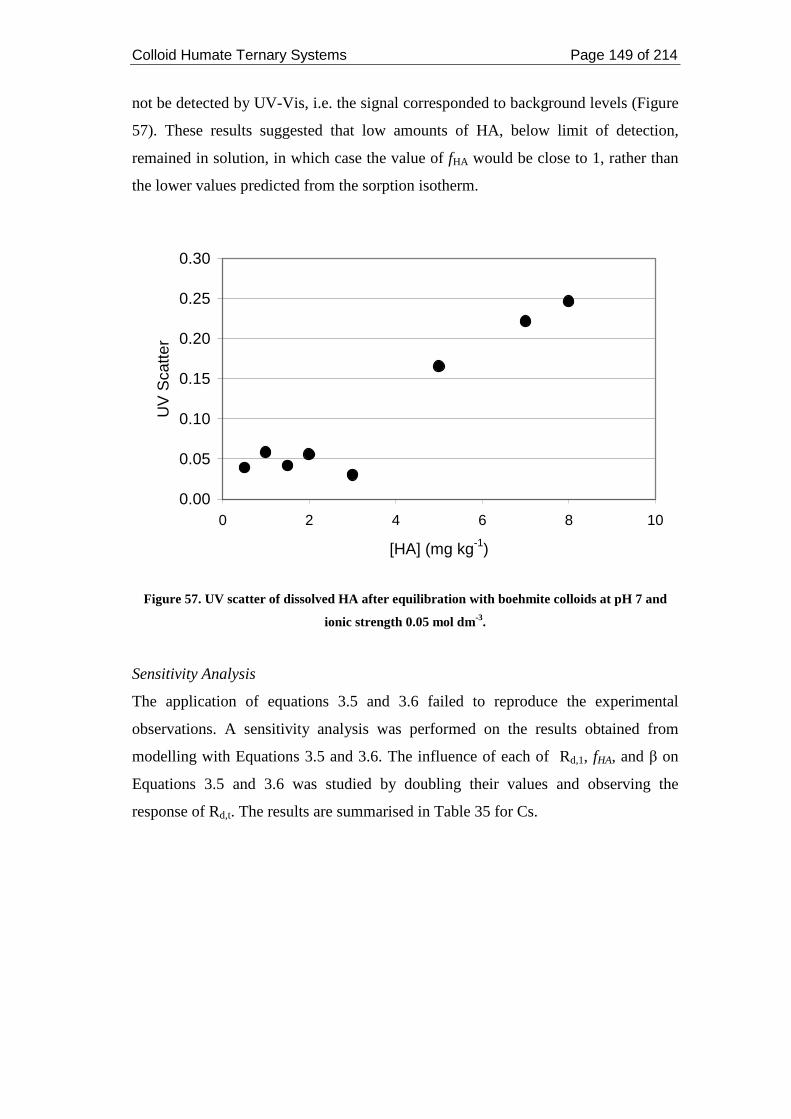
Colloid Humate Ternary Systems Page 149 of 214
not be detected by UV-Vis, i.e. the signal corresponded to background levels (Figure
57). These results suggested that low amounts of HA, below limit of detection,
remained in solution, in which case the value of fHA would be close to 1, rather than
the lower values predicted from the sorption isotherm.
0.00
0.05
0.10
0.15
0.20
0.25
0.30
0 2 4 6 8 10
[HA] (mg kg-1)
UV
Sca
tter
Figure 57. UV scatter of dissolved HA after equilibration with boehmite colloids at pH 7 and
ionic strength 0.05 mol dm-3.
Sensitivity Analysis
The application of equations 3.5 and 3.6 failed to reproduce the experimental
observations. A sensitivity analysis was performed on the results obtained from
modelling with Equations 3.5 and 3.6. The influence of each of Rd,1, fHA, and β on
Equations 3.5 and 3.6 was studied by doubling their values and observing the
response of Rd,t. The results are summarised in Table 35 for Cs.
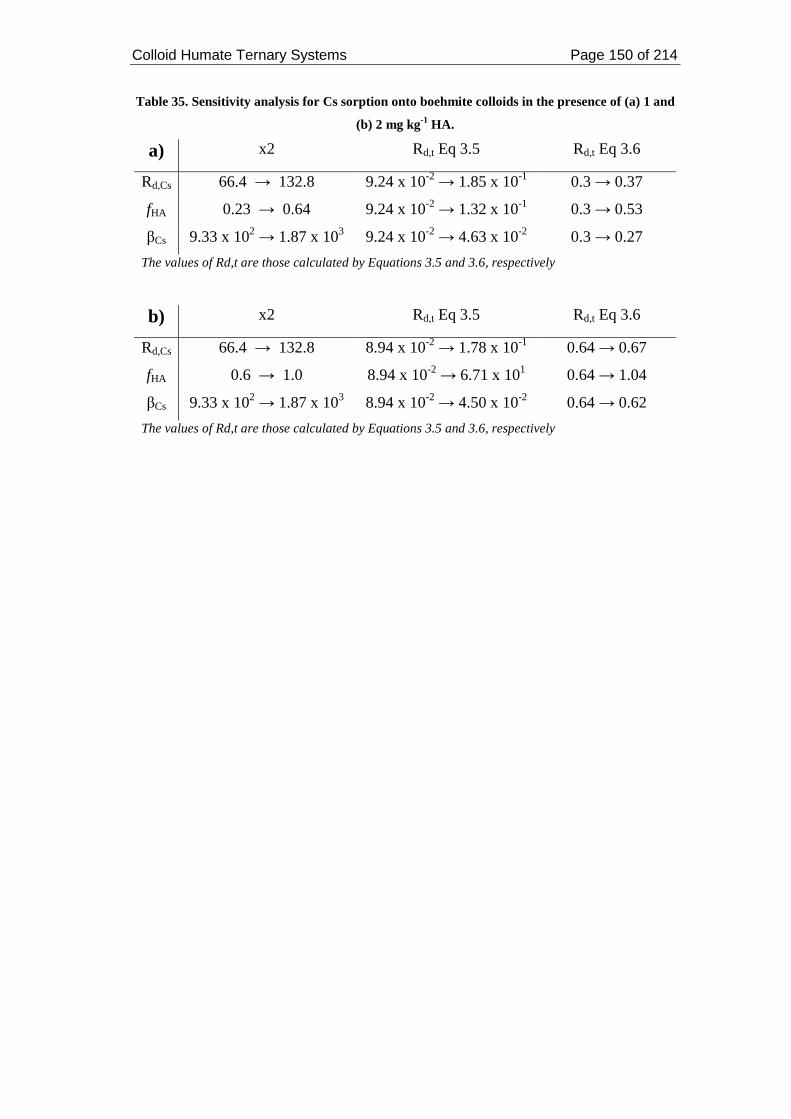
Colloid Humate Ternary Systems Page 150 of 214
Table 35. Sensitivity analysis for Cs sorption onto boehmite colloids in the presence of (a) 1 and
(b) 2 mg kg-1 HA.
a) x2 Rd,t Eq 3.5 Rd,t Eq 3.6
Rd,Cs 66.4 → 132.8 9.24 x 10⁻² → 1.85 x 10⁻¹ 0.3 → 0.37
fHA 0.23 → 0.64 9.24 x 10⁻² → 1.32 x 10⁻¹ 0.3 → 0.53
βCs 9.33 x 10² → 1.87 x 10³ 9.24 x 10⁻² → 4.63 x 10⁻² 0.3 → 0.27
The values of Rd,t are those calculated by Equations 3.5 and 3.6, respectively
b) x2 Rd,t Eq 3.5 Rd,t Eq 3.6
Rd,Cs 66.4 → 132.8 8.94 x 10⁻² → 1.78 x 10⁻¹ 0.64 → 0.67
fHA 0.6 → 1.0 8.94 x 10⁻² → 6.71 x 101 0.64 → 1.04
βCs 9.33 x 10² → 1.87 x 10³ 8.94 x 10⁻² → 4.50 x 10⁻² 0.64 → 0.62
The values of Rd,t are those calculated by Equations 3.5 and 3.6, respectively
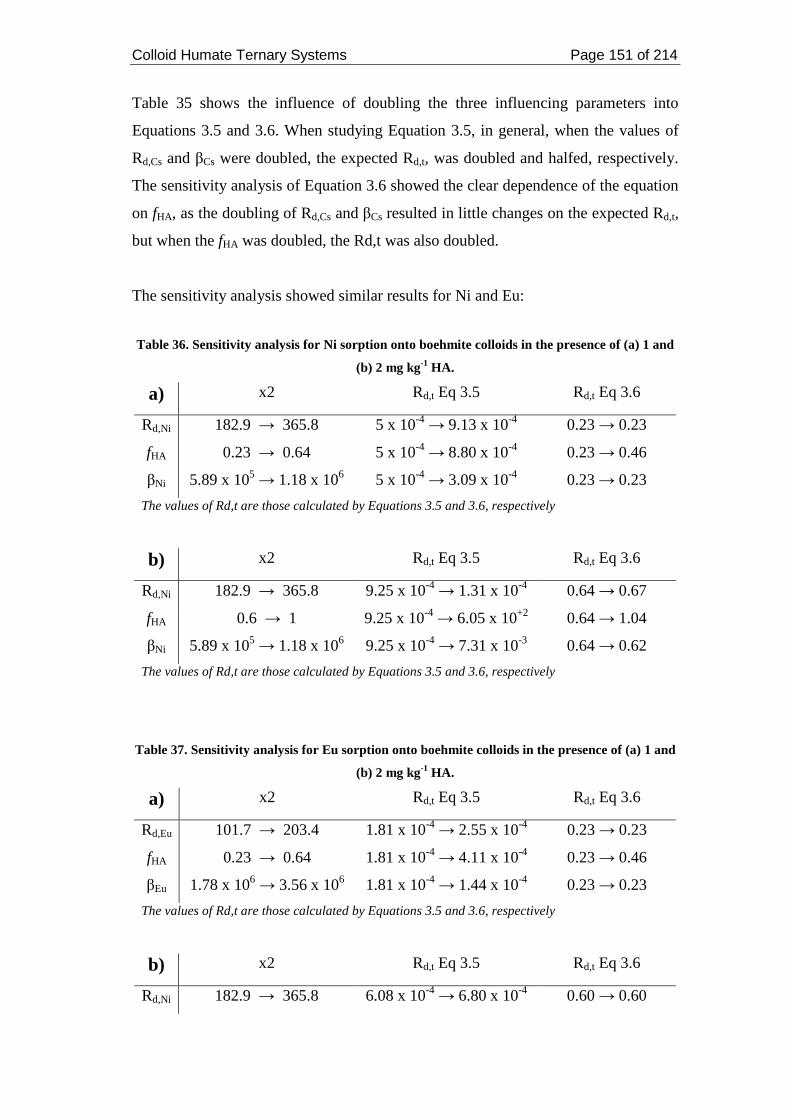
Colloid Humate Ternary Systems Page 151 of 214
Table 35 shows the influence of doubling the three influencing parameters into
Equations 3.5 and 3.6. When studying Equation 3.5, in general, when the values of
Rd,Cs and βCs were doubled, the expected Rd,t, was doubled and halfed, respectively.
The sensitivity analysis of Equation 3.6 showed the clear dependence of the equation
on fHA, as the doubling of Rd,Cs and βCs resulted in little changes on the expected Rd,t,
but when the fHA was doubled, the Rd,t was also doubled.
The sensitivity analysis showed similar results for Ni and Eu:
Table 36. Sensitivity analysis for Ni sorption onto boehmite colloids in the presence of (a) 1 and
(b) 2 mg kg-1 HA.
a) x2 Rd,t Eq 3.5 Rd,t Eq 3.6
Rd,Ni 182.9 → 365.8 5 x 10⁻⁴ → 9.13 x 10⁻⁴ 0.23 → 0.23
fHA 0.23 → 0.64 5 x 10⁻⁴ → 8.80 x 10⁻⁴ 0.23 → 0.46
βNi 5.89 x 10⁵ → 1.18 x 10⁶ 5 x 10⁻⁴ → 3.09 x 10⁻⁴ 0.23 → 0.23
The values of Rd,t are those calculated by Equations 3.5 and 3.6, respectively
b) x2 Rd,t Eq 3.5 Rd,t Eq 3.6
Rd,Ni 182.9 → 365.8 9.25 x 10⁻⁴ → 1.31 x 10⁻⁴ 0.64 → 0.67
fHA 0.6 → 1 9.25 x 10⁻⁴ → 6.05 x 10+2 0.64 → 1.04
βNi 5.89 x 10⁵ → 1.18 x 10⁶ 9.25 x 10⁻⁴ → 7.31 x 10⁻³ 0.64 → 0.62
The values of Rd,t are those calculated by Equations 3.5 and 3.6, respectively
Table 37. Sensitivity analysis for Eu sorption onto boehmite colloids in the presence of (a) 1 and
(b) 2 mg kg-1 HA.
a) x2 Rd,t Eq 3.5 Rd,t Eq 3.6
Rd,Eu 101.7 → 203.4 1.81 x 10⁻⁴ → 2.55 x 10⁻⁴ 0.23 → 0.23
fHA 0.23 → 0.64 1.81 x 10⁻⁴ → 4.11 x 10⁻⁴ 0.23 → 0.46
βEu 1.78 x 10⁶ → 3.56 x 10⁶ 1.81 x 10⁻⁴ → 1.44 x 10⁻⁴ 0.23 → 0.23
The values of Rd,t are those calculated by Equations 3.5 and 3.6, respectively
b) x2 Rd,t Eq 3.5 Rd,t Eq 3.6
Rd,Ni 182.9 → 365.8 6.08 x 10⁻⁴ → 6.80 x 10⁻⁴ 0.60 → 0.60
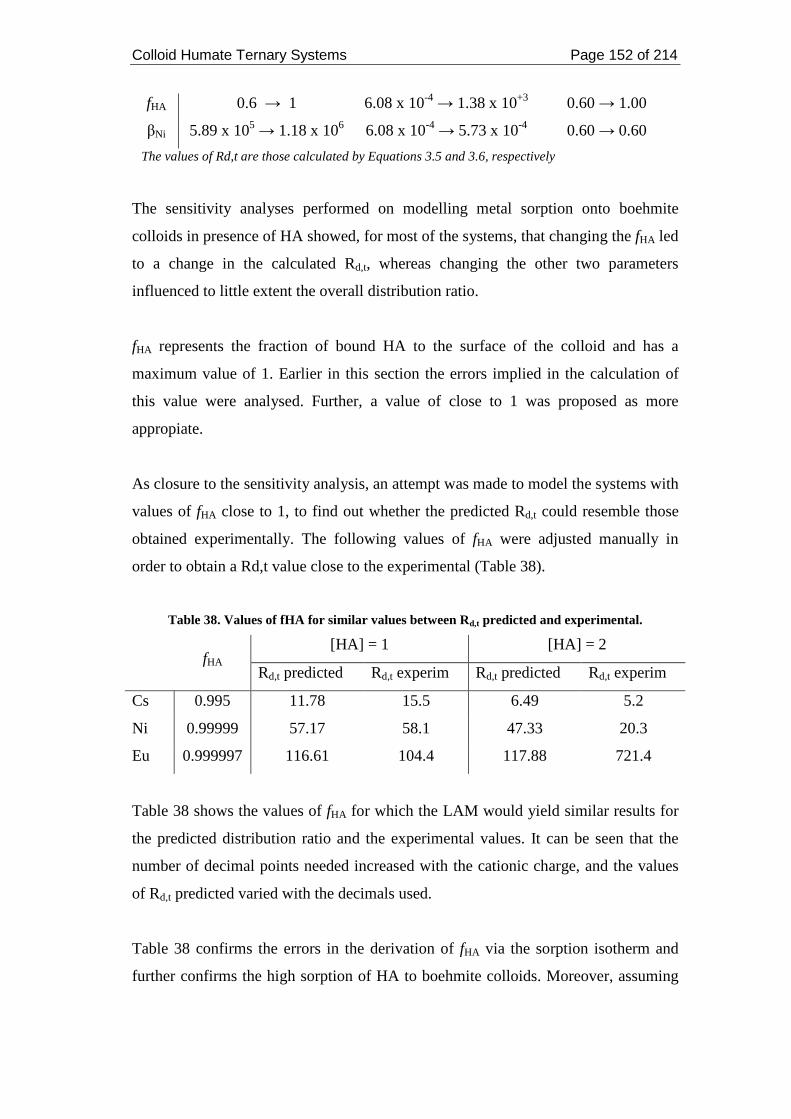
Colloid Humate Ternary Systems Page 152 of 214
fHA 0.6 → 1 6.08 x 10⁻⁴ → 1.38 x 10+3 0.60 → 1.00
βNi 5.89 x 10⁵ → 1.18 x 10⁶ 6.08 x 10⁻⁴ → 5.73 x 10⁻⁴ 0.60 → 0.60
The values of Rd,t are those calculated by Equations 3.5 and 3.6, respectively
The sensitivity analyses performed on modelling metal sorption onto boehmite
colloids in presence of HA showed, for most of the systems, that changing the fHA led
to a change in the calculated Rd,t, whereas changing the other two parameters
influenced to little extent the overall distribution ratio.
fHA represents the fraction of bound HA to the surface of the colloid and has a
maximum value of 1. Earlier in this section the errors implied in the calculation of
this value were analysed. Further, a value of close to 1 was proposed as more
appropiate.
As closure to the sensitivity analysis, an attempt was made to model the systems with
values of fHA close to 1, to find out whether the predicted Rd,t could resemble those
obtained experimentally. The following values of fHA were adjusted manually in
order to obtain a Rd,t value close to the experimental (Table 38).
Table 38. Values of fHA for similar values between Rd,t predicted and experimental.
[HA] = 1 [HA] = 2 fHA
Rd,t predicted Rd,t experim Rd,t predicted Rd,t experim
Cs 0.995 11.78 15.5 6.49 5.2
Ni 0.99999 57.17 58.1 47.33 20.3
Eu 0.999997 116.61 104.4 117.88 721.4
Table 38 shows the values of fHA for which the LAM would yield similar results for
the predicted distribution ratio and the experimental values. It can be seen that the
number of decimal points needed increased with the cationic charge, and the values
of Rd,t predicted varied with the decimals used.
Table 38 confirms the errors in the derivation of fHA via the sorption isotherm and
further confirms the high sorption of HA to boehmite colloids. Moreover, assuming
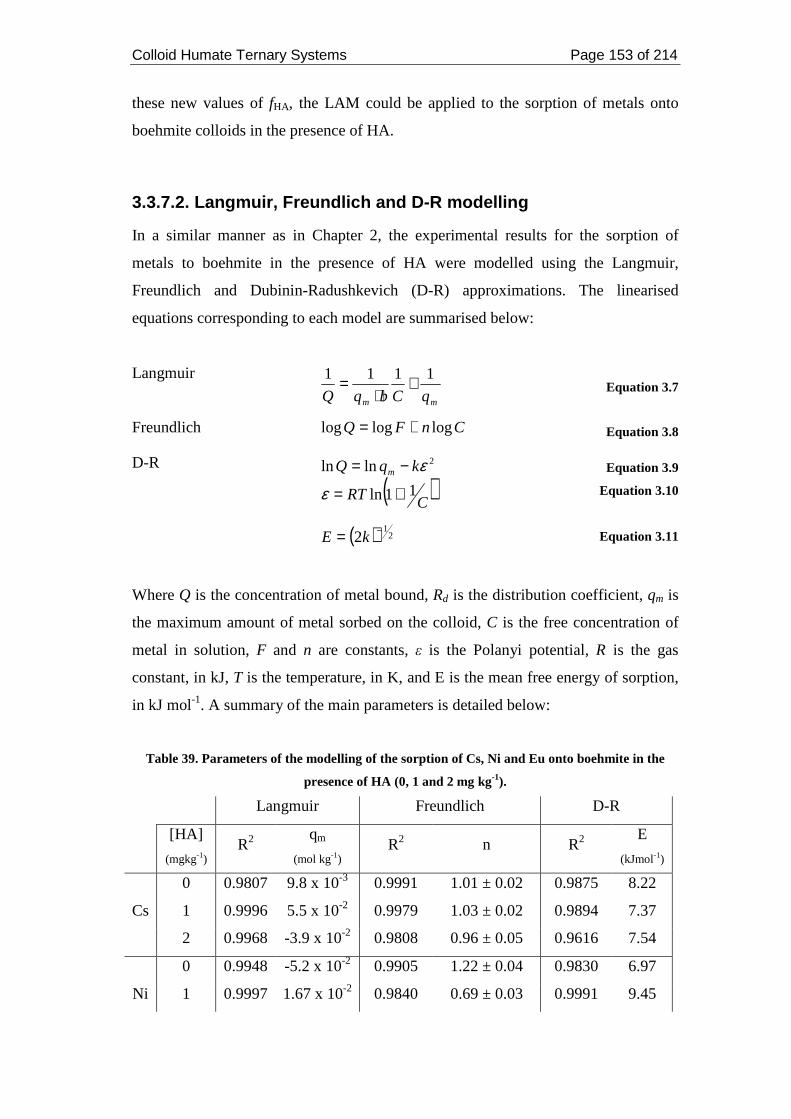
Colloid Humate Ternary Systems Page 153 of 214
these new values of fHA, the LAM could be applied to the sorption of metals onto
boehmite colloids in the presence of HA.
3.3.7.2. Langmuir, Freundlich and D-R modelling
In a similar manner as in Chapter 2, the experimental results for the sorption of
metals to boehmite in the presence of HA were modelled using the Langmuir,
Freundlich and Dubinin-Radushkevich (D-R) approximations. The linearised
equations corresponding to each model are summarised below:
Langmuir
mm qCbqQ
1111 +⋅
= Equation 3.7
Freundlich CnFQ logloglog += Equation 3.8
D-R
( )CRT
kqQ m
11ln
lnln 2
+=
−=
ε
ε
( ) 21
2 −= kE
Equation 3.9
Equation 3.10
Equation 3.11
Where Q is the concentration of metal bound, Rd is the distribution coefficient, qm is
the maximum amount of metal sorbed on the colloid, C is the free concentration of
metal in solution, F and n are constants, ε is the Polanyi potential, R is the gas
constant, in kJ, T is the temperature, in K, and E is the mean free energy of sorption,
in kJ mol-1. A summary of the main parameters is detailed below:
Table 39. Parameters of the modelling of the sorption of Cs, Ni and Eu onto boehmite in the
presence of HA (0, 1 and 2 mg kg-1).
Langmuir Freundlich D-R
[HA]
(mgkg-1) R2
qm
(mol kg-1) R2 n R2
E
(kJmol-1)
0 0.9807 9.8 x 10⁻³ 0.9991 1.01 ± 0.02 0.9875 8.22
Cs 1 0.9996 5.5 x 10⁻² 0.9979 1.03 ± 0.02 0.9894 7.37
2 0.9968 -3.9 x 10⁻² 0.9808 0.96 ± 0.05 0.9616 7.54
0 0.9948 -5.2 x 10⁻² 0.9905 1.22 ± 0.04 0.9830 6.97
Ni 1 0.9997 1.67 x 10⁻² 0.9840 0.69 ± 0.03 0.9991 9.45
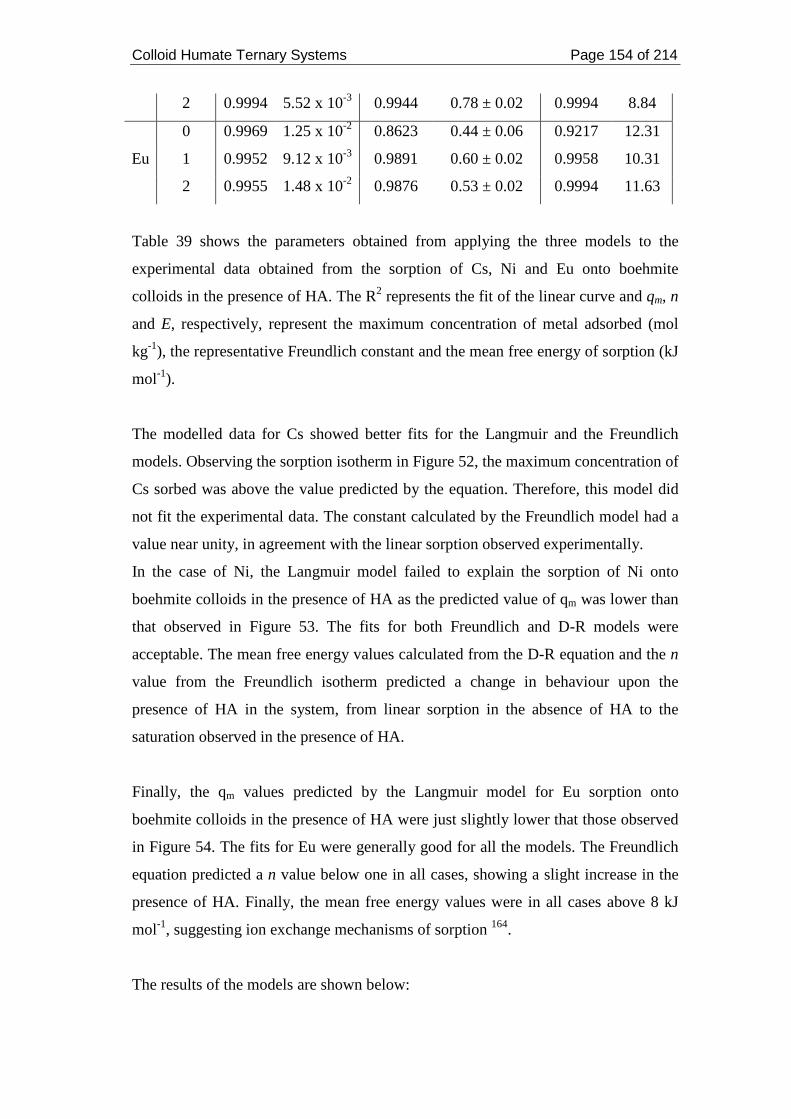
Colloid Humate Ternary Systems Page 154 of 214
2 0.9994 5.52 x 10⁻³ 0.9944 0.78 ± 0.02 0.9994 8.84
0 0.9969 1.25 x 10⁻² 0.8623 0.44 ± 0.06 0.9217 12.31
Eu 1 0.9952 9.12 x 10⁻³ 0.9891 0.60 ± 0.02 0.9958 10.31
2 0.9955 1.48 x 10⁻² 0.9876 0.53 ± 0.02 0.9994 11.63
Table 39 shows the parameters obtained from applying the three models to the
experimental data obtained from the sorption of Cs, Ni and Eu onto boehmite
colloids in the presence of HA. The R2 represents the fit of the linear curve and qm, n
and E, respectively, represent the maximum concentration of metal adsorbed (mol
kg-1), the representative Freundlich constant and the mean free energy of sorption (kJ
mol-1).
The modelled data for Cs showed better fits for the Langmuir and the Freundlich
models. Observing the sorption isotherm in Figure 52, the maximum concentration of
Cs sorbed was above the value predicted by the equation. Therefore, this model did
not fit the experimental data. The constant calculated by the Freundlich model had a
value near unity, in agreement with the linear sorption observed experimentally.
In the case of Ni, the Langmuir model failed to explain the sorption of Ni onto
boehmite colloids in the presence of HA as the predicted value of qm was lower than
that observed in Figure 53. The fits for both Freundlich and D-R models were
acceptable. The mean free energy values calculated from the D-R equation and the n
value from the Freundlich isotherm predicted a change in behaviour upon the
presence of HA in the system, from linear sorption in the absence of HA to the
saturation observed in the presence of HA.
Finally, the qm values predicted by the Langmuir model for Eu sorption onto
boehmite colloids in the presence of HA were just slightly lower that those observed
in Figure 54. The fits for Eu were generally good for all the models. The Freundlich
equation predicted a n value below one in all cases, showing a slight increase in the
presence of HA. Finally, the mean free energy values were in all cases above 8 kJ
mol-1, suggesting ion exchange mechanisms of sorption 164.
The results of the models are shown below:
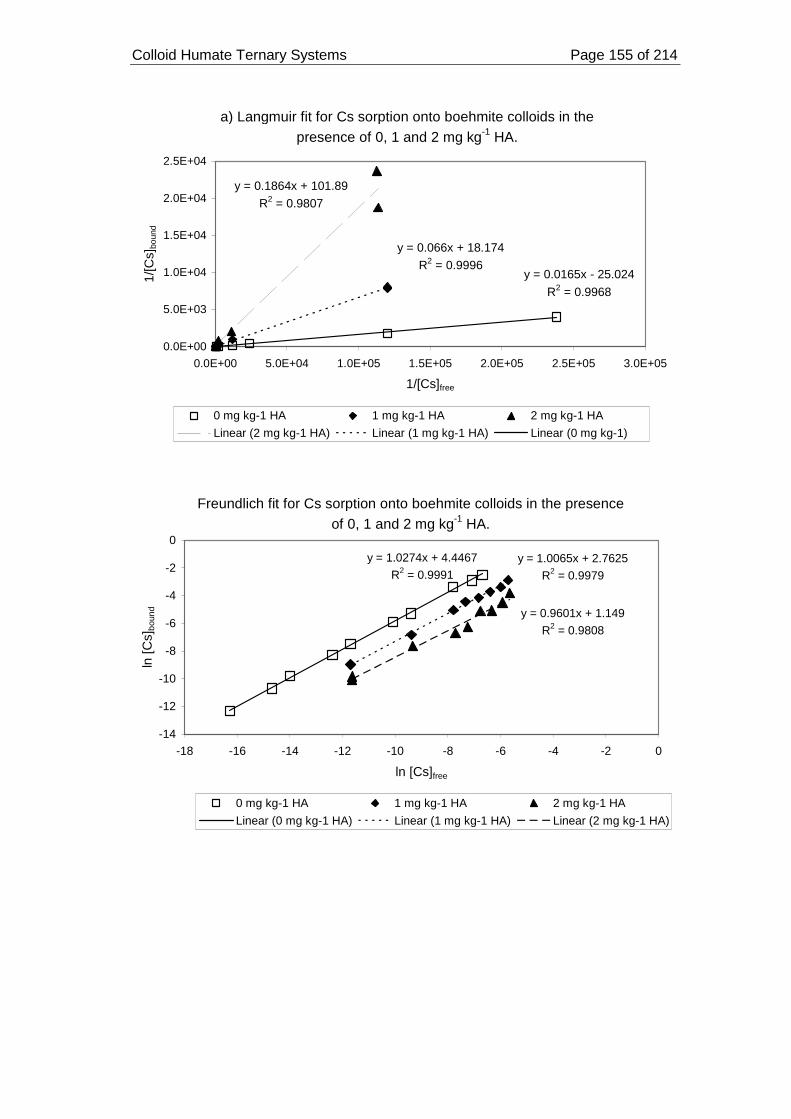
Colloid Humate Ternary Systems Page 155 of 214
a) Langmuir fit for Cs sorption onto boehmite colloids in the presence of 0, 1 and 2 mg kg-1 HA.
y = 0.1864x + 101.89
R2 = 0.9807
y = 0.066x + 18.174
R2 = 0.9996y = 0.0165x - 25.024
R2 = 0.9968
0.0E+00
5.0E+03
1.0E+04
1.5E+04
2.0E+04
2.5E+04
0.0E+00 5.0E+04 1.0E+05 1.5E+05 2.0E+05 2.5E+05 3.0E+05
1/[Cs]free
1/[C
s]bo
und
0 mg kg-1 HA 1 mg kg-1 HA 2 mg kg-1 HA
Linear (2 mg kg-1 HA) Linear (1 mg kg-1 HA) Linear (0 mg kg-1)
Freundlich fit for Cs sorption onto boehmite colloids in the presence of 0, 1 and 2 mg kg-1 HA.
y = 1.0274x + 4.4467
R2 = 0.9991y = 1.0065x + 2.7625
R2 = 0.9979
y = 0.9601x + 1.149
R2 = 0.9808
-14
-12
-10
-8
-6
-4
-2
0
-18 -16 -14 -12 -10 -8 -6 -4 -2 0
ln [Cs]free
ln [C
s]bo
und
0 mg kg-1 HA 1 mg kg-1 HA 2 mg kg-1 HA
Linear (0 mg kg-1 HA) Linear (1 mg kg-1 HA) Linear (2 mg kg-1 HA)
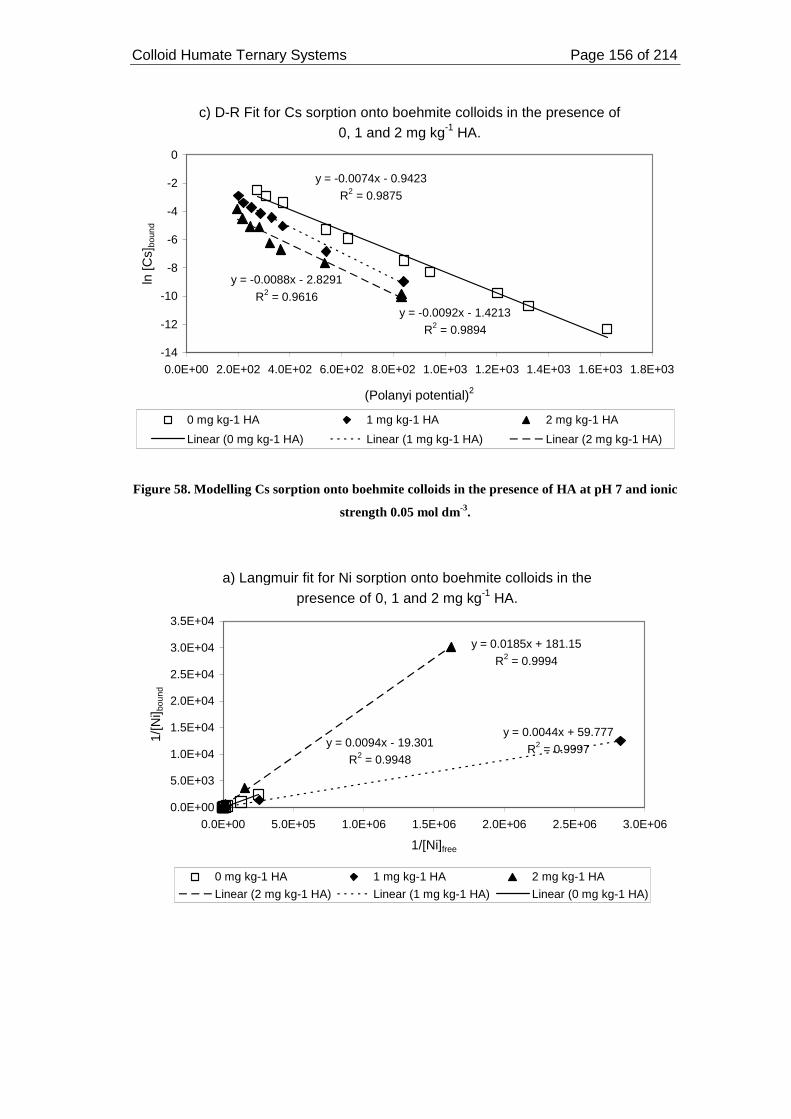
Colloid Humate Ternary Systems Page 156 of 214
c) D-R Fit for Cs sorption onto boehmite colloids in the presence of 0, 1 and 2 mg kg-1 HA.
y = -0.0074x - 0.9423
R2 = 0.9875
y = -0.0092x - 1.4213
R2 = 0.9894
y = -0.0088x - 2.8291
R2 = 0.9616
-14
-12
-10
-8
-6
-4
-2
0
0.0E+00 2.0E+02 4.0E+02 6.0E+02 8.0E+02 1.0E+03 1.2E+03 1.4E+03 1.6E+03 1.8E+03
(Polanyi potential)2
ln [C
s]bo
und
0 mg kg-1 HA 1 mg kg-1 HA 2 mg kg-1 HA
Linear (0 mg kg-1 HA) Linear (1 mg kg-1 HA) Linear (2 mg kg-1 HA)
Figure 58. Modelling Cs sorption onto boehmite colloids in the presence of HA at pH 7 and ionic
strength 0.05 mol dm-3.
a) Langmuir fit for Ni sorption onto boehmite colloids in the presence of 0, 1 and 2 mg kg-1 HA.
y = 0.0185x + 181.15
R2 = 0.9994
y = 0.0044x + 59.777
R2 = 0.9997y = 0.0094x - 19.301
R2 = 0.9948
0.0E+00
5.0E+03
1.0E+04
1.5E+04
2.0E+04
2.5E+04
3.0E+04
3.5E+04
0.0E+00 5.0E+05 1.0E+06 1.5E+06 2.0E+06 2.5E+06 3.0E+06
1/[Ni]free
1/[N
i] bou
nd
0 mg kg-1 HA 1 mg kg-1 HA 2 mg kg-1 HA
Linear (2 mg kg-1 HA) Linear (1 mg kg-1 HA) Linear (0 mg kg-1 HA)
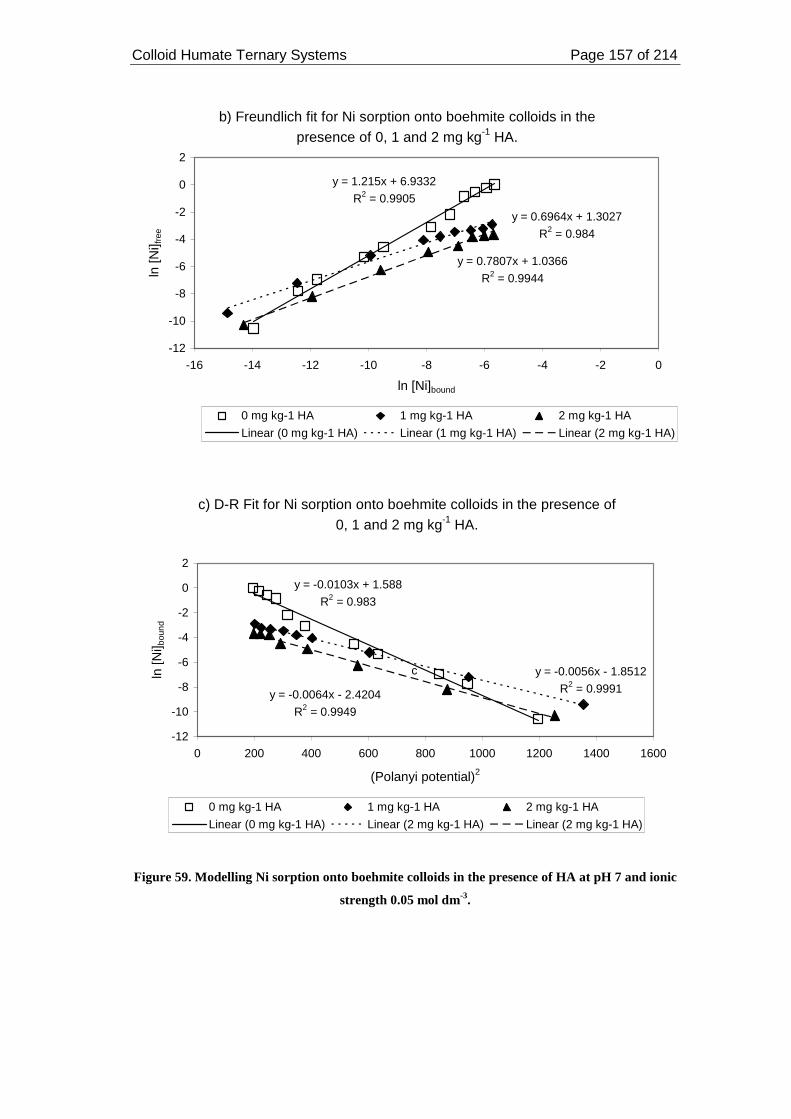
Colloid Humate Ternary Systems Page 157 of 214
b) Freundlich fit for Ni sorption onto boehmite colloids in the presence of 0, 1 and 2 mg kg-1 HA.
y = 1.215x + 6.9332
R2 = 0.9905
y = 0.6964x + 1.3027
R2 = 0.984
y = 0.7807x + 1.0366
R2 = 0.9944
-12
-10
-8
-6
-4
-2
0
2
-16 -14 -12 -10 -8 -6 -4 -2 0
ln [Ni]bound
ln [N
i] fre
e
0 mg kg-1 HA 1 mg kg-1 HA 2 mg kg-1 HA
Linear (0 mg kg-1 HA) Linear (1 mg kg-1 HA) Linear (2 mg kg-1 HA)
c) D-R Fit for Ni sorption onto boehmite colloids in the presence of 0, 1 and 2 mg kg-1 HA.
y = -0.0103x + 1.588
R2 = 0.983
y = -0.0056x - 1.8512
R2 = 0.9991y = -0.0064x - 2.4204
R2 = 0.9949
-12
-10
-8
-6
-4
-2
0
2
0 200 400 600 800 1000 1200 1400 1600
(Polanyi potential)2
ln [N
i] bou
nd
0 mg kg-1 HA 1 mg kg-1 HA 2 mg kg-1 HA
Linear (0 mg kg-1 HA) Linear (2 mg kg-1 HA) Linear (2 mg kg-1 HA)
c
Figure 59. Modelling Ni sorption onto boehmite colloids in the presence of HA at pH 7 and ionic
strength 0.05 mol dm-3.
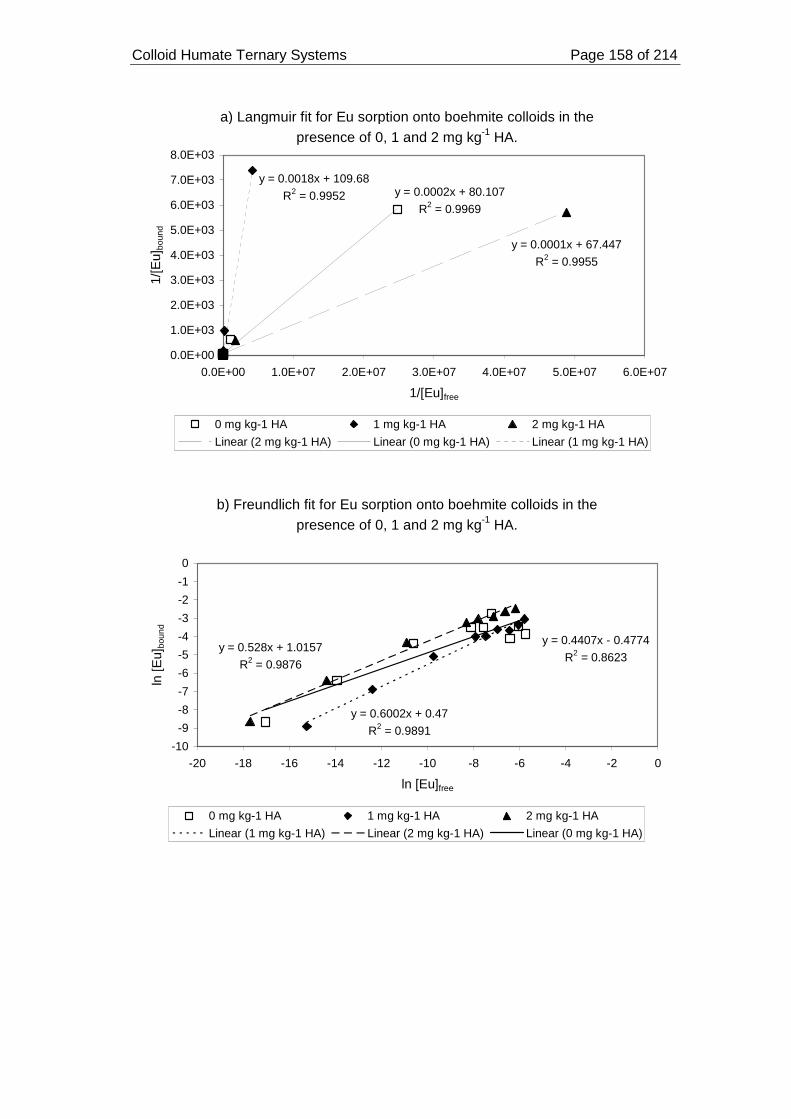
Colloid Humate Ternary Systems Page 158 of 214
a) Langmuir fit for Eu sorption onto boehmite colloids in the presence of 0, 1 and 2 mg kg-1 HA.
y = 0.0001x + 67.447
R2 = 0.9955
y = 0.0002x + 80.107
R2 = 0.9969
y = 0.0018x + 109.68
R2 = 0.9952
0.0E+00
1.0E+03
2.0E+03
3.0E+03
4.0E+03
5.0E+03
6.0E+03
7.0E+03
8.0E+03
0.0E+00 1.0E+07 2.0E+07 3.0E+07 4.0E+07 5.0E+07 6.0E+07
1/[Eu]free
1/[E
u]bo
und
0 mg kg-1 HA 1 mg kg-1 HA 2 mg kg-1 HA
Linear (2 mg kg-1 HA) Linear (0 mg kg-1 HA) Linear (1 mg kg-1 HA)
b) Freundlich fit for Eu sorption onto boehmite colloids in the presence of 0, 1 and 2 mg kg-1 HA.
y = 0.6002x + 0.47
R2 = 0.9891
y = 0.528x + 1.0157
R2 = 0.9876
y = 0.4407x - 0.4774
R2 = 0.8623
-10
-9
-8
-7
-6
-5
-4
-3
-2
-1
0
-20 -18 -16 -14 -12 -10 -8 -6 -4 -2 0
ln [Eu]free
ln [E
u]bo
und
0 mg kg-1 HA 1 mg kg-1 HA 2 mg kg-1 HA
Linear (1 mg kg-1 HA) Linear (2 mg kg-1 HA) Linear (0 mg kg-1 HA)
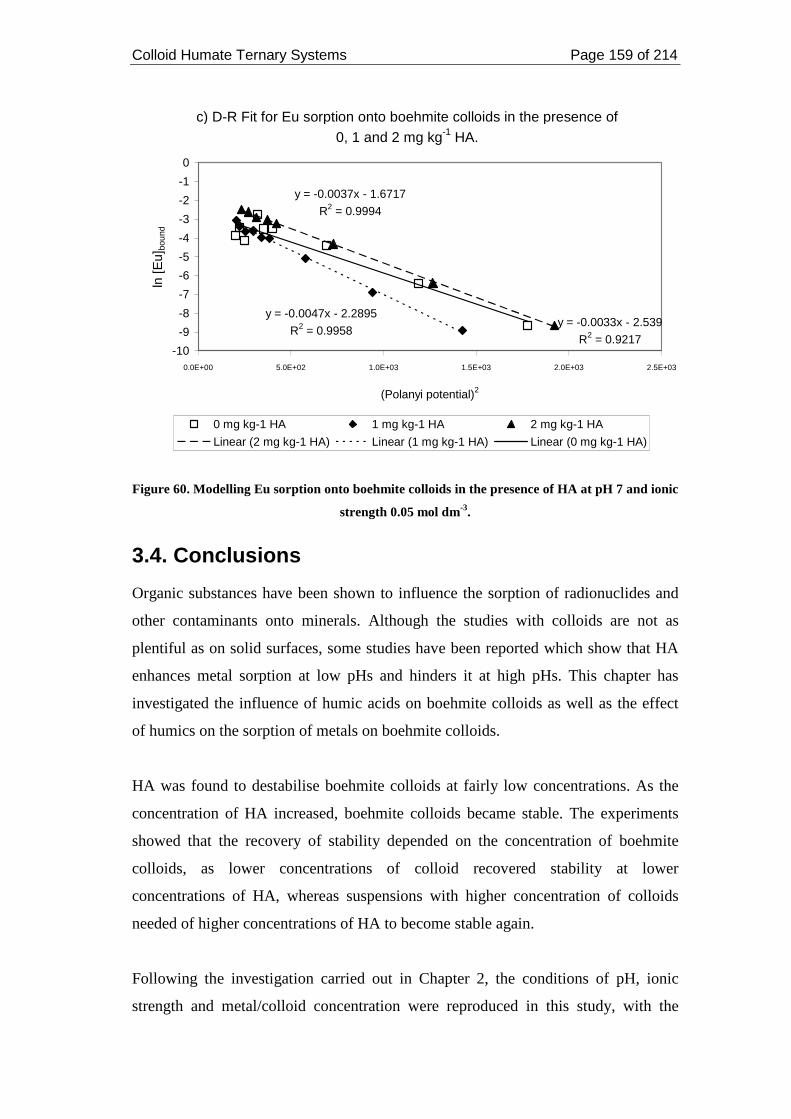
Colloid Humate Ternary Systems Page 159 of 214
c) D-R Fit for Eu sorption onto boehmite colloids in the presence of 0, 1 and 2 mg kg-1 HA.
y = -0.0037x - 1.6717
R2 = 0.9994
y = -0.0047x - 2.2895
R2 = 0.9958y = -0.0033x - 2.539
R2 = 0.9217-10
-9
-8
-7
-6
-5
-4
-3
-2
-1
0
0.0E+00 5.0E+02 1.0E+03 1.5E+03 2.0E+03 2.5E+03
(Polanyi potential)2
ln [E
u]bo
und
0 mg kg-1 HA 1 mg kg-1 HA 2 mg kg-1 HA
Linear (2 mg kg-1 HA) Linear (1 mg kg-1 HA) Linear (0 mg kg-1 HA)
Figure 60. Modelling Eu sorption onto boehmite colloids in the presence of HA at pH 7 and ionic
strength 0.05 mol dm-3.
3.4. Conclusions
Organic substances have been shown to influence the sorption of radionuclides and
other contaminants onto minerals. Although the studies with colloids are not as
plentiful as on solid surfaces, some studies have been reported which show that HA
enhances metal sorption at low pHs and hinders it at high pHs. This chapter has
investigated the influence of humic acids on boehmite colloids as well as the effect
of humics on the sorption of metals on boehmite colloids.
HA was found to destabilise boehmite colloids at fairly low concentrations. As the
concentration of HA increased, boehmite colloids became stable. The experiments
showed that the recovery of stability depended on the concentration of boehmite
colloids, as lower concentrations of colloid recovered stability at lower
concentrations of HA, whereas suspensions with higher concentration of colloids
needed of higher concentrations of HA to become stable again.
Following the investigation carried out in Chapter 2, the conditions of pH, ionic
strength and metal/colloid concentration were reproduced in this study, with the
Colloid Humate Ternary Systems Page 160 of 214
inclusion of HA at different concentrations. In order to have a stable ternary system,
either low concentrations of HA (below 5 mg kg-1), or higher concentrations of HA
were to be used. At high concentrations of HA, the surface coverage of boehmite by
HA might have been too large as to allow sorption of metals onto colloids to be
significant. Therefore, only 1 and 2 mg kg-1 HA could be used in this investigation.
Further studies including higher concentrations of HA would be needed to better
understand the mechanisms of sorption of metals onto boehmite colloids in the
presence of HA, i.e. whether or not the metal in solution is present as free metal ions
or as metal-humate complexes.
The investigation reported here revealed that HA, even at low concentrations,
influenced greatly the sorption of metals onto boehmite colloids, hindering it in all
cases. From previous literature, the most plausible explanation was the blocking of
sorption sites by the HA.
Mathematical tools were used to model the sorption of metals onto boehmite colloids
in the presence of HA. Two different equations of the linear additive model were
used, but, in a first attempt, both failed to explain the effect of HA in the ternary
system. A rigurous analysis of the possible sources of error was performed, from
which a change in the value of fHA, which represents the sorption of HA onto the
boehmite colloids, was made. This modification led to the successful application of
the LAM. Further, this modification highlighted the importance of considering a
stable binary (colloid-HA) system.
Mobility of Colloids and Colloid-Facilitated Transport Page 161 of 214
Chapter 4. MOBILITY OF COLLOIDS AND COLLOID-
FACILITATED TRANSPORT
4.1. Introduction
Migration of colloids has been widely studied using a large number of techniques,
including fluorescence spectrophotometry 165,166167, UV-Vis spectrophotometry 168,169,170,171,172 turbidity 172, Rutherford backscattering spectrometry 173 and high
sensitivity liquid in situ spectrometry 174. The movement of colloids has been studied
both in laboratory conditions 167,171 and in field experiments 175,165,176,177. Factors
affecting the retention of colloids through a column may be attachment, straining and
filtering 167.
The influence that organic and inorganic colloids have on the mobility of
contaminants through the Geosphere has also been assessed 174,176,177,178,179,180, and
generally, the transport of contaminants was enhanced by the colloids.
Radiolabelling colloids can be used to track the colloid during a transport process, as
it involves the incorporation of a radioactive spike in the structure of the colloid
during its synthesis. It has been generally applied for medical purposes 181,182,183.
However, it could also be used to follow radiometrically the movement of colloids
through a column.
The aims of this chapter were to synthesise stable radiolabelled colloids, study their
migration through a sand column and assess the influence of colloids on the mobility
of caesium through a sand column. Hence, this chapter may be divided into two
parts, one concerning the synthesis and stability of radiolabelled silica colloids, and a
second, concerning the migration of both silica colloids and caesium associated with
the silica colloids through a sand column.
Mobility of Colloids and Colloid-Facilitated Transport Page 162 of 214
4.2. Experimental
A known method for synthesising silica colloids was used to generate radiolabelled
silica colloids 184. The stability of both the silica colloids and the radiolabel was
studied by spectroscopic and radiometric techniques. Once the stability of colloids
was assured, migration experiments were carried out by passing the radiolabelled
silica colloids through a sand column.
4.2.1. Method development
2.1.1. Materials used
Silica colloids were synthesised from TEOS (tetraethyl orthosilicate), provided by
Alfa Aesar. 0.88 mol dm-3 NH4OH (Sigma Aldrich) and ethanol 99% were used in
the synthesis. The dialysis bags used were Spectra/por Biotech Cellulose Ester (CE)
Dialysis Membranes MWCO: 100-500 D. These were previously wetted in 0.1%
NaN3, from Alfa Aesar. The NaClO4, 95%, was purchased from Sigma Aldrich.
BDH sand was used in the migration experiments.
152Eu and 137Cs are detailed in Table 1.
4.2.1.2. Preparation for measurements
Following those experiments carried out by Fairhust 198, characterisation of silica
colloids took place by measuring the average size and zeta potential with a Zeta
Master S (Malvern Instruments, UK). Approximately 3 cm3 aliquots were used. UV
measurements were carried out using a UV Type Varian Cary Series 50 Bio
Spectrophotometer. A quartz cuvette was filled with approximately 1 cm3 of sample
and the absorbance spectra were recorded at 240.1 nm.
Migration studies were carried out by means of column experiments. A Pharmacia
glass column with the following dimensions was used: 30 cm in length and 2.6 cm in
diameter. 20 µm membranes were fitted at both ends of the column. A Pharmcia P1
pump was used. 1 cm3 aliquots from the effluent were collected with a RediFRAC
Mobility of Colloids and Colloid-Facilitated Transport Page 163 of 214
fraction collector. The radioactive samples were measured by gamma counting (152Eu
and 137Cs) using a Cobra II Auto-Gamma Counter (Packard Ltd), or by beta counting
(tritiated water) using a Tricarb 1900TR Liquid Scintillation Analyzer (Packard Ltd).
The activity along the length of the column was measured using a Na-I detector,
Teledyne Brown Engineering Environmental Services – Scintillation Amplifier
model 5010.
4.2.2. Synthesis and stability of radiolabelled silica colloids
4.2.2.1. Synthesis of silica colloids
Silica colloids were prepared by a method based on that detailed by Stöber et al. 184,
where 50 cm3 of ethanol 99% were added to 2 g of TEOS (tetraethyl orthosilicate).
The sample was then placed in a sonicating bath whilst adding 2 cm3 of 0.88 mol dm-
3 NH4OH. The samples were sonicated for a further 20 minutes and then placed in a
shaker overnight. After this time, the samples were placed in dialysis bags
previously wetted in 0.1 % NaN3. 0.05 mol dm-3 NaClO4 was used as the dialysis
solution. This solution was changed every 12 hours until no ethanol was detected,
usually 7 to 10 days (qualitative detection of ethanol was carried out by HPLC). The
silica colloids were transferred to a previously dried beaker for gravimetric
determination.
4.2.2.2. Synthesis of Eu-doped silica colloids
50 cm3 of ethanol 99% were added to 2 g of TEOS. 1 cm3 of 152Eu (approximately
341.5 kBq dm-3) was added. The sample was placed in a sonicating bath whilst
adding 2 cm3 of 0.88 mol dm-3 NH4OH. The sample was left in the sonicating bath
for a further 20 minutes and then placed in a shaker overnight. After this time the
samples were transferred to a dialysis bag, previously wetted in NaN3. 1 dm3 0.05
mol dm-3 NaClO4 solution was added to the measuring cylinder where the dialysis
bag was placed. The sample was left in the dialysis bag for 10 days, changing the
dialysis solution twice a day. After this time, the dialysis bag was emptied and the
silica colloids were characterised.
Mobility of Colloids and Colloid-Facilitated Transport Page 164 of 214
4.2.2.3. Characterisation and stability of Eu-doped silica colloids
UV measurements at a wavelength of 240.1 nm were used to characterise the
generated colloids. Gamma counting was used to monitor the stability of the
radiolabel. Also, the average size and zeta potential of the synthesised colloids were
measured using a Zeta Master S. A calibration curve was produced by plotting the
measurements obtained by UV spectroscopy and gamma counting versus the dilution
of Eu-doped silica colloids in water.
4.2.3. Migration experiments
Following the characterisation experiments, the synthesised silica colloids were used
to assess the migration of silica colloids through a sand column, as well as the
influence of silica colloids on the transport of a radioactive spike.
4.2.3.1. Migration of Eu-doped silica colloids through sand column
The migration of silica colloids was studied radiometrically by following the
breakthrough of the synthesised Eu-doped silica colloids through a sand column. The
overall dimensions of the column were 30 cm in length and 2.6 cm in diameter. The
column was packed with approximately 250 g of sand (particle size diameter 100 –
300 µm 185,186,187), previously wetted in DI water. To avoid the formation of air
bubbles, water was preintroduced into the column from its bottom to a certain height;
the sand was then poured slowly into the column while mechanical stirring took
place with a glass rod. The top and the base of the column were fitted with 20 µm
membranes. The eluants were flooded upwards through the column (see Figure 61).
The flow rate of the eluant used in all measurements was adjusted to approximately
0.25 cm3 min-1. Tritiated water (82 kBq dm-3) was used as a conservative tracer to
measure the porosity of the column. Following the porosity measurement, migration
experiments were carried out by flooding 100 cm3 suspension of the synthesised Eu
doped silica colloids into the column until it was all added, at which point it was
switched to deionised water, until no activity was detected in the outlet. A fraction
collector was connected to the outlet at the top of the column. 1.25 cm3 fractions of
eluant were collected and measured in the gamma counter for activity.
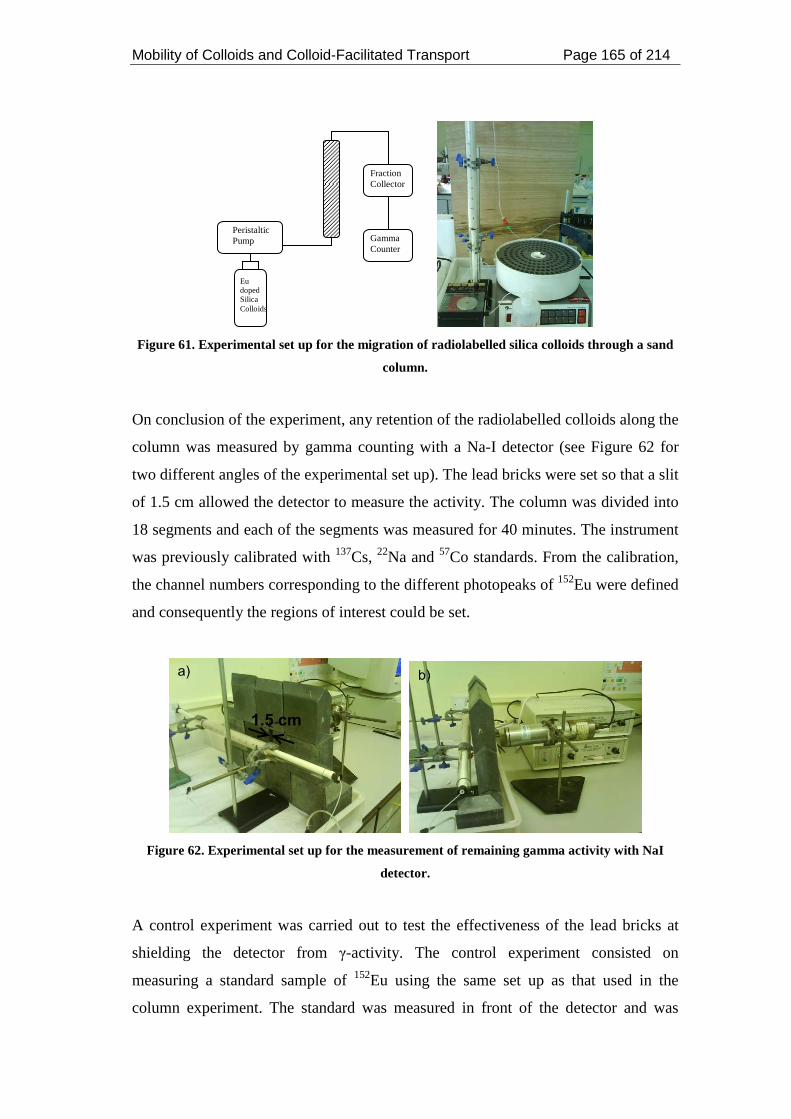
Mobility of Colloids and Colloid-Facilitated Transport Page 165 of 214
Figure 61. Experimental set up for the migration of radiolabelled silica colloids through a sand
column.
On conclusion of the experiment, any retention of the radiolabelled colloids along the
column was measured by gamma counting with a Na-I detector (see Figure 62 for
two different angles of the experimental set up). The lead bricks were set so that a slit
of 1.5 cm allowed the detector to measure the activity. The column was divided into
18 segments and each of the segments was measured for 40 minutes. The instrument
was previously calibrated with 137Cs, 22Na and 57Co standards. From the calibration,
the channel numbers corresponding to the different photopeaks of 152Eu were defined
and consequently the regions of interest could be set.
Figure 62. Experimental set up for the measurement of remaining gamma activity with NaI
detector.
A control experiment was carried out to test the effectiveness of the lead bricks at
shielding the detector from γ-activity. The control experiment consisted on
measuring a standard sample of 152Eu using the same set up as that used in the
column experiment. The standard was measured in front of the detector and was
Gamma Counter
Fraction Collector
Eu doped Silica Colloids
Peristaltic Pump
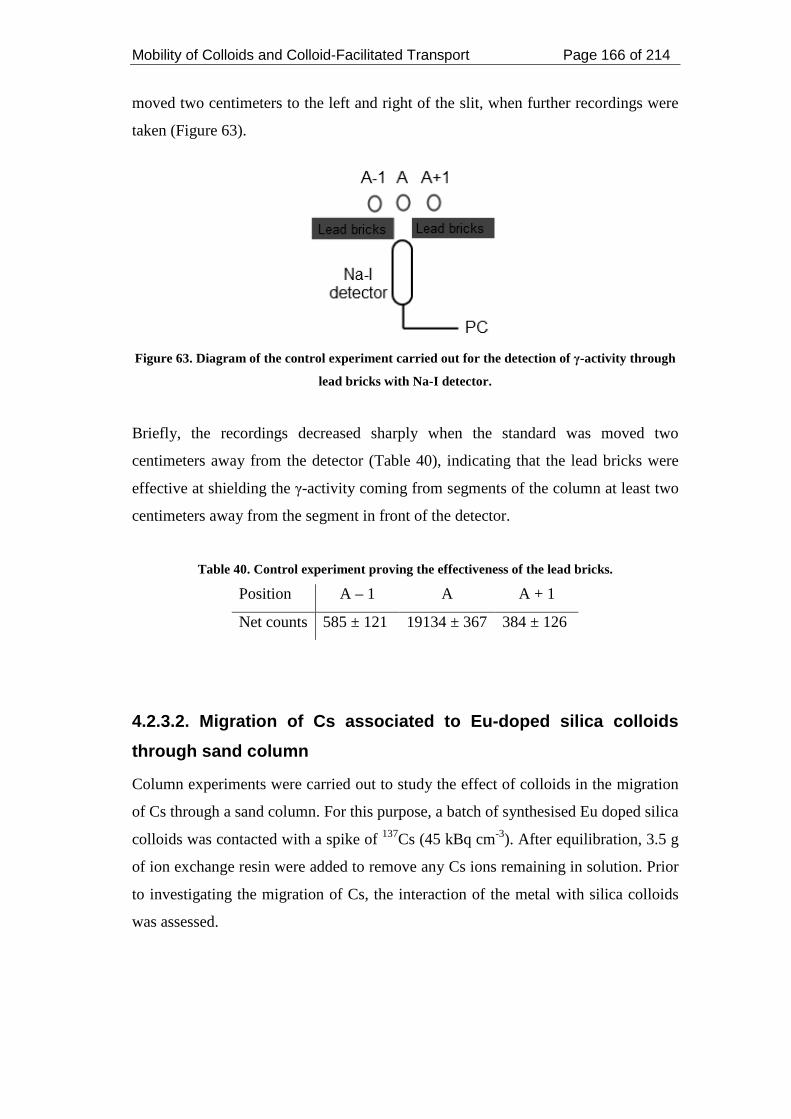
Mobility of Colloids and Colloid-Facilitated Transport Page 166 of 214
moved two centimeters to the left and right of the slit, when further recordings were
taken (Figure 63).
Figure 63. Diagram of the control experiment carried out for the detection of γ-activity through
lead bricks with Na-I detector.
Briefly, the recordings decreased sharply when the standard was moved two
centimeters away from the detector (Table 40), indicating that the lead bricks were
effective at shielding the γ-activity coming from segments of the column at least two
centimeters away from the segment in front of the detector.
Table 40. Control experiment proving the effectiveness of the lead bricks.
Position A – 1 A A + 1
Net counts 585 ± 121 19134 ± 367 384 ± 126
4.2.3.2. Migration of Cs associated to Eu-doped silica colloids
through sand column
Column experiments were carried out to study the effect of colloids in the migration
of Cs through a sand column. For this purpose, a batch of synthesised Eu doped silica
colloids was contacted with a spike of 137Cs (45 kBq cm-3). After equilibration, 3.5 g
of ion exchange resin were added to remove any Cs ions remaining in solution. Prior
to investigating the migration of Cs, the interaction of the metal with silica colloids
was assessed.
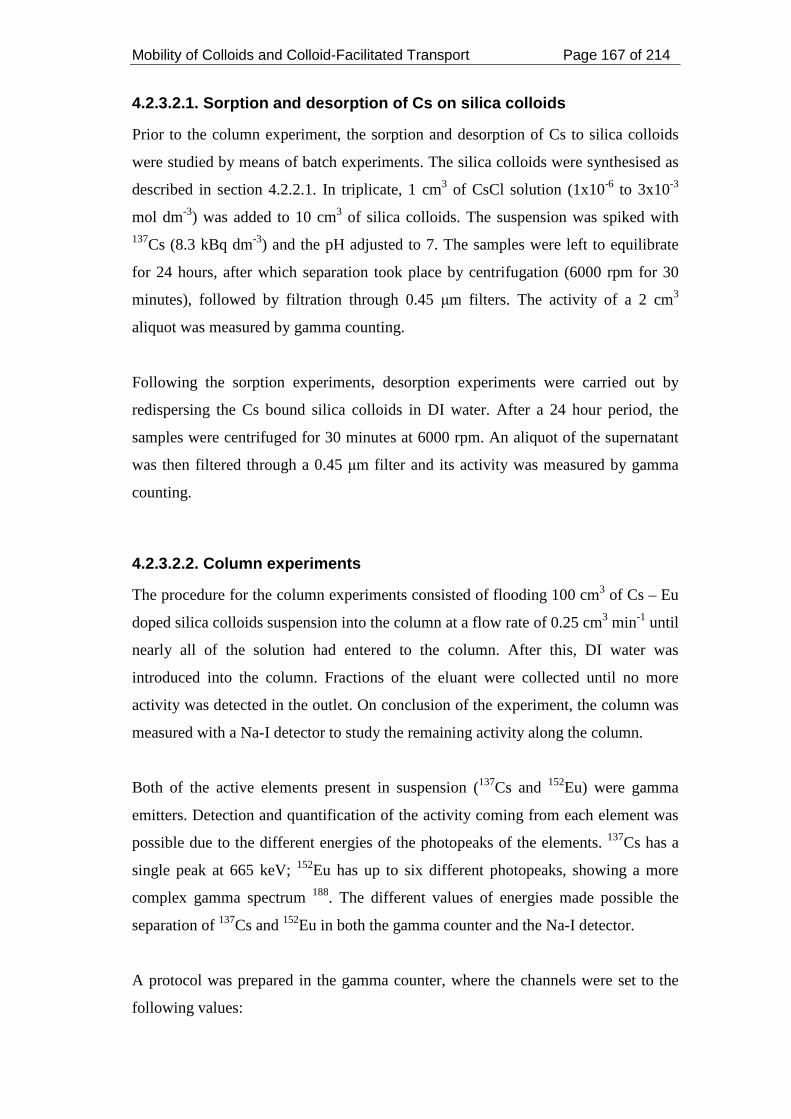
Mobility of Colloids and Colloid-Facilitated Transport Page 167 of 214
4.2.3.2.1. Sorption and desorption of Cs on silica colloids
Prior to the column experiment, the sorption and desorption of Cs to silica colloids
were studied by means of batch experiments. The silica colloids were synthesised as
described in section 4.2.2.1. In triplicate, 1 cm3 of CsCl solution (1x10⁻⁶ to 3x10⁻³
mol dm-3) was added to 10 cm3 of silica colloids. The suspension was spiked with 137Cs (8.3 kBq dm-3) and the pH adjusted to 7. The samples were left to equilibrate
for 24 hours, after which separation took place by centrifugation (6000 rpm for 30
minutes), followed by filtration through 0.45 µm filters. The activity of a 2 cm3
aliquot was measured by gamma counting.
Following the sorption experiments, desorption experiments were carried out by
redispersing the Cs bound silica colloids in DI water. After a 24 hour period, the
samples were centrifuged for 30 minutes at 6000 rpm. An aliquot of the supernatant
was then filtered through a 0.45 µm filter and its activity was measured by gamma
counting.
4.2.3.2.2. Column experiments
The procedure for the column experiments consisted of flooding 100 cm3 of Cs – Eu
doped silica colloids suspension into the column at a flow rate of 0.25 cm3 min-1 until
nearly all of the solution had entered to the column. After this, DI water was
introduced into the column. Fractions of the eluant were collected until no more
activity was detected in the outlet. On conclusion of the experiment, the column was
measured with a Na-I detector to study the remaining activity along the column.
Both of the active elements present in suspension (137Cs and 152Eu) were gamma
emitters. Detection and quantification of the activity coming from each element was
possible due to the different energies of the photopeaks of the elements. 137Cs has a
single peak at 665 keV; 152Eu has up to six different photopeaks, showing a more
complex gamma spectrum 188. The different values of energies made possible the
separation of 137Cs and 152Eu in both the gamma counter and the Na-I detector.
A protocol was prepared in the gamma counter, where the channels were set to the
following values:
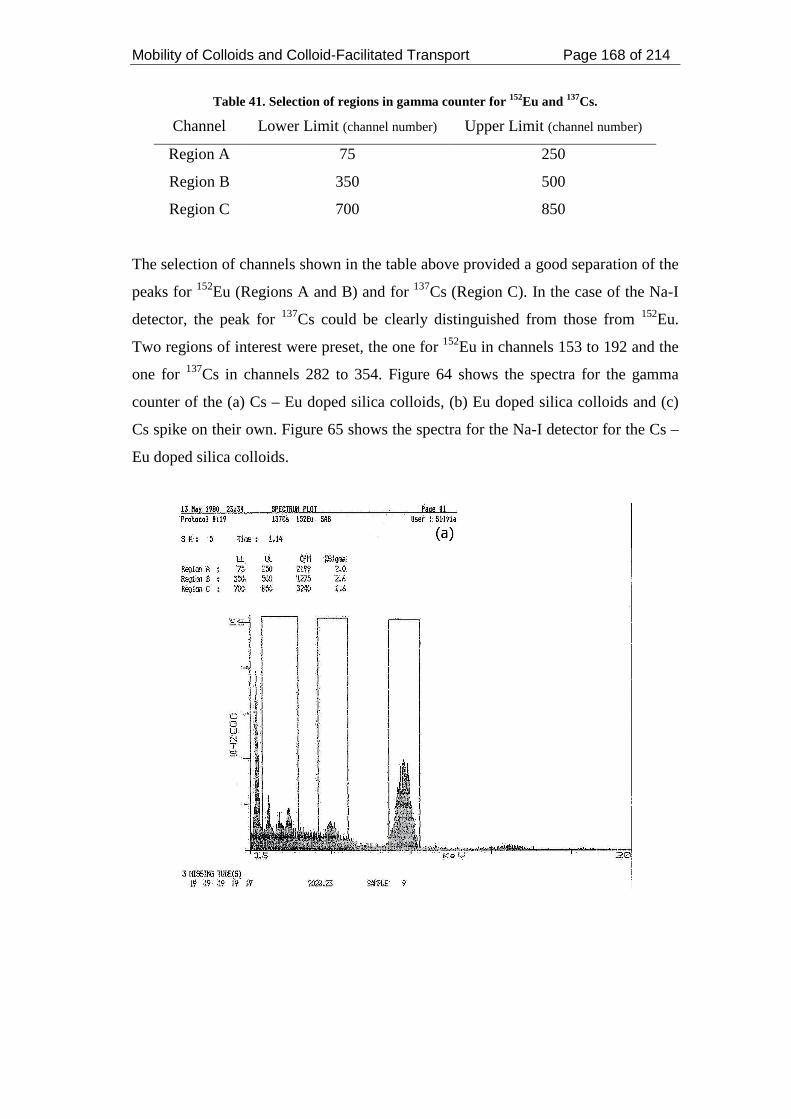
Mobility of Colloids and Colloid-Facilitated Transport Page 168 of 214
Table 41. Selection of regions in gamma counter for 152Eu and 137Cs.
Channel Lower Limit (channel number) Upper Limit (channel number)
Region A 75 250
Region B 350 500
Region C 700 850
The selection of channels shown in the table above provided a good separation of the
peaks for 152Eu (Regions A and B) and for 137Cs (Region C). In the case of the Na-I
detector, the peak for 137Cs could be clearly distinguished from those from 152Eu.
Two regions of interest were preset, the one for 152Eu in channels 153 to 192 and the
one for 137Cs in channels 282 to 354. Figure 64 shows the spectra for the gamma
counter of the (a) Cs – Eu doped silica colloids, (b) Eu doped silica colloids and (c)
Cs spike on their own. Figure 65 shows the spectra for the Na-I detector for the Cs –
Eu doped silica colloids.
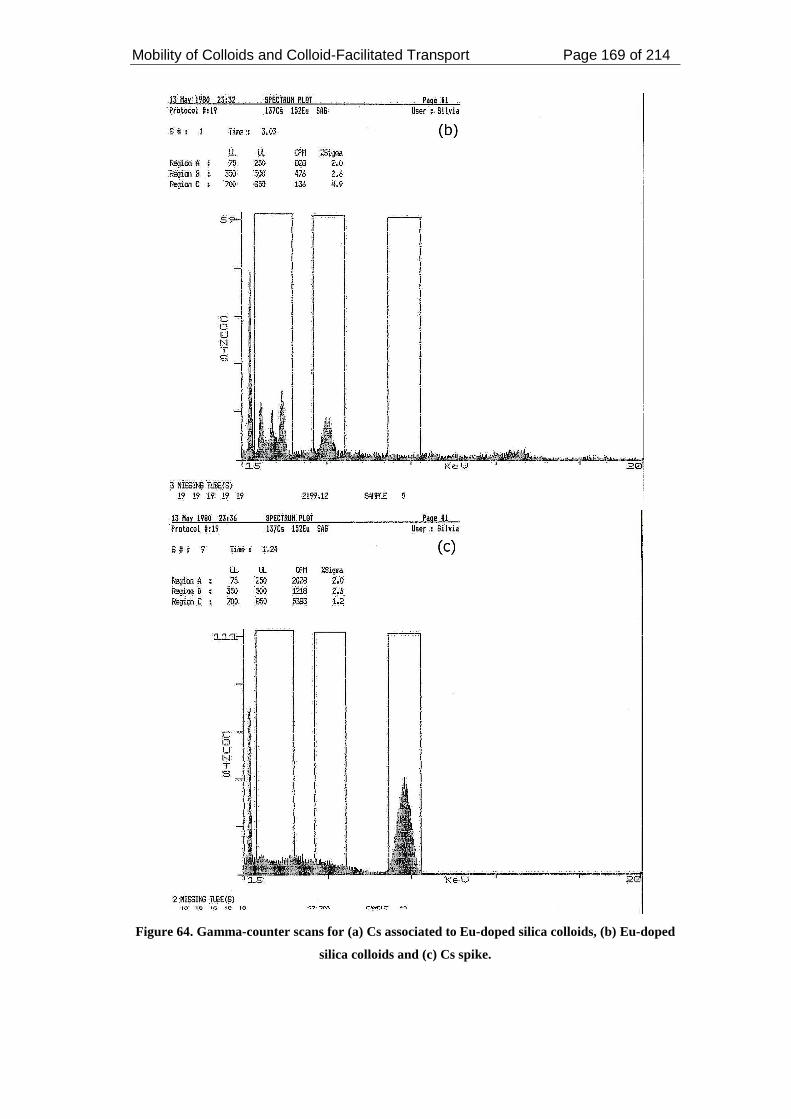
Mobility of Colloids and Colloid-Facilitated Transport Page 169 of 214
Figure 64. Gamma-counter scans for (a) Cs associated to Eu-doped silica colloids, (b) Eu-doped
silica colloids and (c) Cs spike.
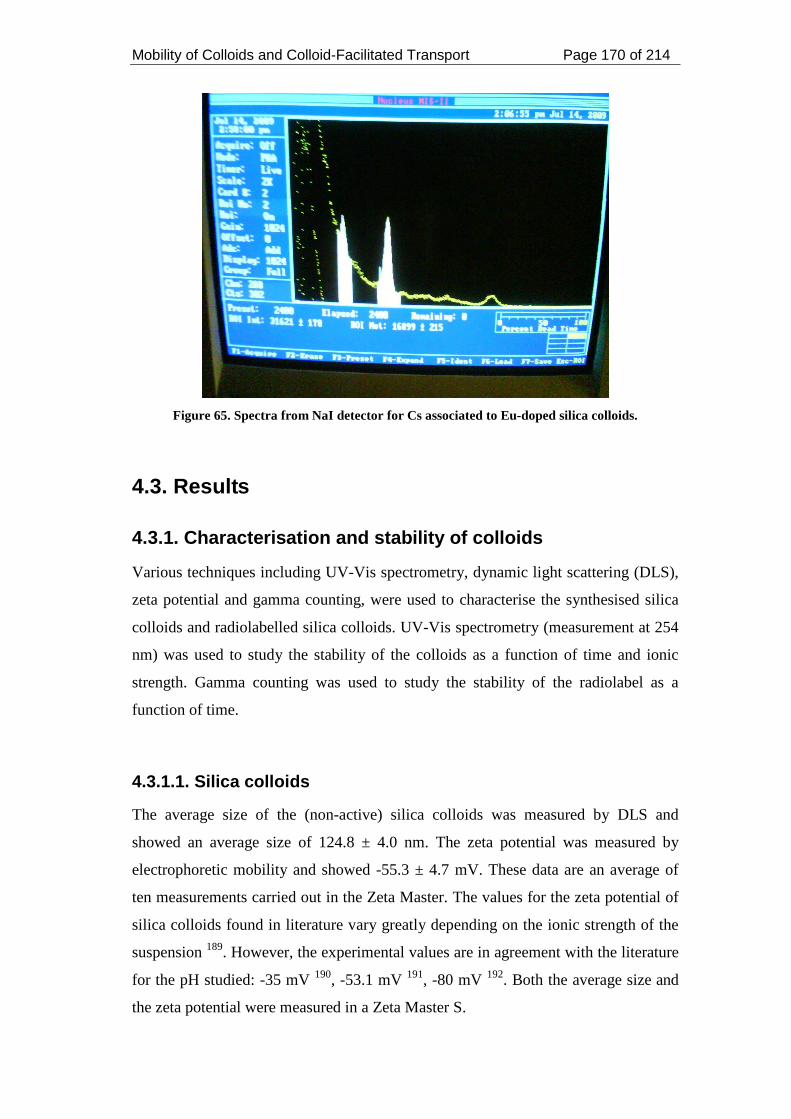
Mobility of Colloids and Colloid-Facilitated Transport Page 170 of 214
Figure 65. Spectra from NaI detector for Cs associated to Eu-doped silica colloids.
4.3. Results
4.3.1. Characterisation and stability of colloids
Various techniques including UV-Vis spectrometry, dynamic light scattering (DLS),
zeta potential and gamma counting, were used to characterise the synthesised silica
colloids and radiolabelled silica colloids. UV-Vis spectrometry (measurement at 254
nm) was used to study the stability of the colloids as a function of time and ionic
strength. Gamma counting was used to study the stability of the radiolabel as a
function of time.
4.3.1.1. Silica colloids
The average size of the (non-active) silica colloids was measured by DLS and
showed an average size of 124.8 ± 4.0 nm. The zeta potential was measured by
electrophoretic mobility and showed -55.3 ± 4.7 mV. These data are an average of
ten measurements carried out in the Zeta Master. The values for the zeta potential of
silica colloids found in literature vary greatly depending on the ionic strength of the
suspension 189. However, the experimental values are in agreement with the literature
for the pH studied: -35 mV 190, -53.1 mV 191, -80 mV 192. Both the average size and
the zeta potential were measured in a Zeta Master S.
Mobility of Colloids and Colloid-Facilitated Transport Page 171 of 214
The surface area of the silica colloids was measured by the method described by
Sears 193. Briefly, 30 g of NaCl were added to 1.5 g of silica acidified to pH 3 to 3.5.
The volume was made up to 150 cm3 with DI water. After taking the pH to 4, the
solution was titrated with 0.1 mol dm-3 NaOH to pH 9. The volume required to rise
the pH from 4 to 9 is related to the surface area as described by the following
relation:
S = 32V – 25 Equation 4.1
Where S is the surface area (m2 g-1) and V is the volume required for the titration
(cm3). This procedure yielded a surface area of 48.6 m2 g-1. Although this is a low
result compared to values found in the literature, which are in the range of hundreds
of m2g-1 194,195,196, Vasconcelos et al. 196 found that the specific surface area (as well
as other physical properties), depend on the proportion of reactants, i.e. TEOS,
NH3OH, and ethanol, added to synthesise the silica colloids. In their experimental
observations, the specific surface areas measured ranged from <1 to 900 m2 g-1.
The UV-vis scatter of the synthesised silica colloids was measured at 240.1 nm. The
stability of the silica colloids was studied as a function of time and ionic strength
(Figure 66).
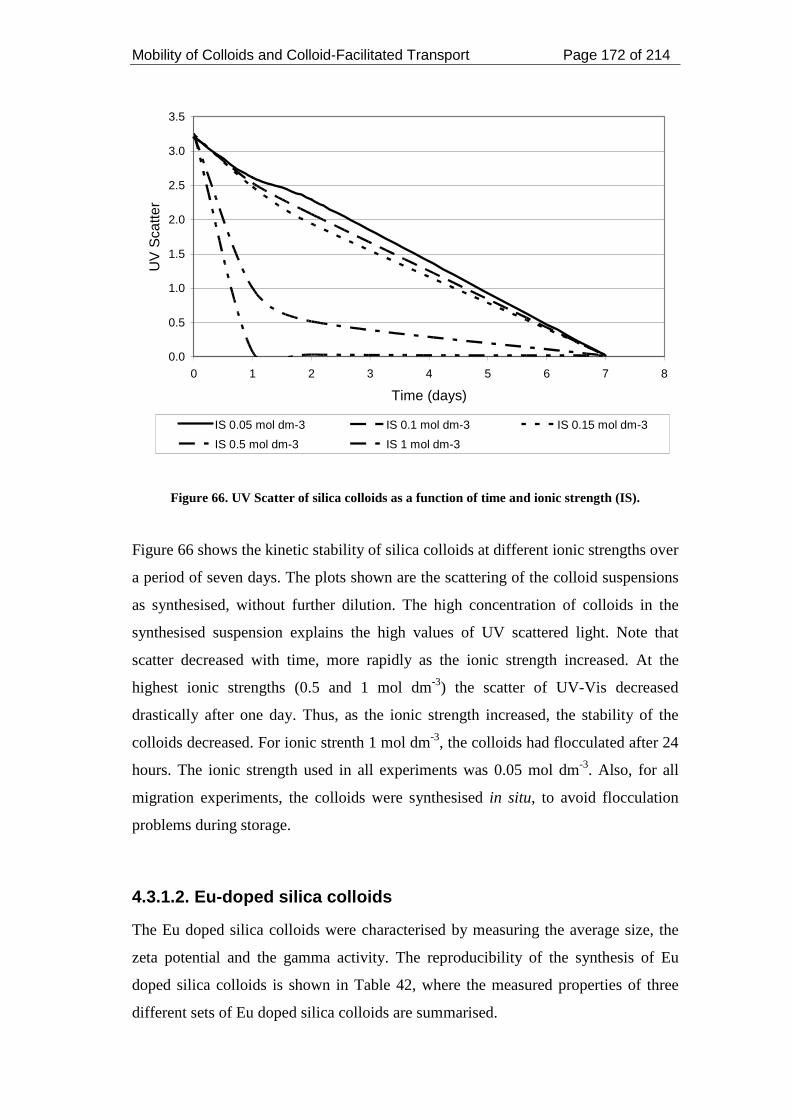
Mobility of Colloids and Colloid-Facilitated Transport Page 172 of 214
0.0
0.5
1.0
1.5
2.0
2.5
3.0
3.5
0 1 2 3 4 5 6 7 8
Time (days)
UV
Sca
tter
IS 0.05 mol dm-3 IS 0.1 mol dm-3 IS 0.15 mol dm-3
IS 0.5 mol dm-3 IS 1 mol dm-3
Figure 66. UV Scatter of silica colloids as a function of time and ionic strength (IS).
Figure 66 shows the kinetic stability of silica colloids at different ionic strengths over
a period of seven days. The plots shown are the scattering of the colloid suspensions
as synthesised, without further dilution. The high concentration of colloids in the
synthesised suspension explains the high values of UV scattered light. Note that
scatter decreased with time, more rapidly as the ionic strength increased. At the
highest ionic strengths (0.5 and 1 mol dm-3) the scatter of UV-Vis decreased
drastically after one day. Thus, as the ionic strength increased, the stability of the
colloids decreased. For ionic strenth 1 mol dm-3, the colloids had flocculated after 24
hours. The ionic strength used in all experiments was 0.05 mol dm-3. Also, for all
migration experiments, the colloids were synthesised in situ, to avoid flocculation
problems during storage.
4.3.1.2. Eu-doped silica colloids
The Eu doped silica colloids were characterised by measuring the average size, the
zeta potential and the gamma activity. The reproducibility of the synthesis of Eu
doped silica colloids is shown in Table 42, where the measured properties of three
different sets of Eu doped silica colloids are summarised.
Mobility of Colloids and Colloid-Facilitated Transport Page 173 of 214
Table 42. Characterisation of Eu doped silica colloids.
Set 1 Set 2 Set 3
Initial Activity (Bq cm-3) 385.17 316.78 322.44
Final Specific Activity (Bq cm-3) 310.84 152.93 194.09
Radiolabelling yield (%) 80.7 48.3 60.2
Average Size (nm) 167.8 ± 2.9 100.6 ± 15.8 253.7 ± 6.8
Zeta Potential (mV) -56.7 ± 3.7 -50.6 ± 11.4 -46.8 ± 2.9
The initial activity refers to the activity of 152Eu added at the beginning of the
synthesis procedure, and the specific activity refers to the activity of the radiolabelled
colloids measured at the end of the synthesis procedure. The radiolabelling yield
varies in the three sets prepared. As the ratio of reactants added to each set of
samples was equal in all three cases, the following experimental factors are discused:
• Prior to the average size and zeta potential measurements, the samples were
diluted due to the high concentration of colloids. Dilution, however, should
not affect the properties of the synthesised colloids.
• A different batch of dialysis bags were used for the synthesis of Set 3. This
could be a reason for the slightly higher values of average size observed
compared to the other two sets.
• The ionic strength is an important factor influencing the stability of colloids,
but in this case, the ionic strength of the dialysis solution was kept constant at
0.05 mol dm-3, as the solution was prepared in situ.
• The pH of the suspensions was adjusted on conclusion of the synthesis.
Changes in pH could have occurred during the synthesis steps, explaining the
differing properties of the colloids in the three different sets.
As previously mentioned, the synthesised Eu doped silica colloid suspensions were
highly concentrated. To achieve a good UV-Vis measurement, the suspensions were
diluted by taking different volumes of suspension into 10 cm3 of deionised water.
The scatter in UV-Vis light, as well as the specific activity, were measured and a
calibration curve was plot (Figure 67).
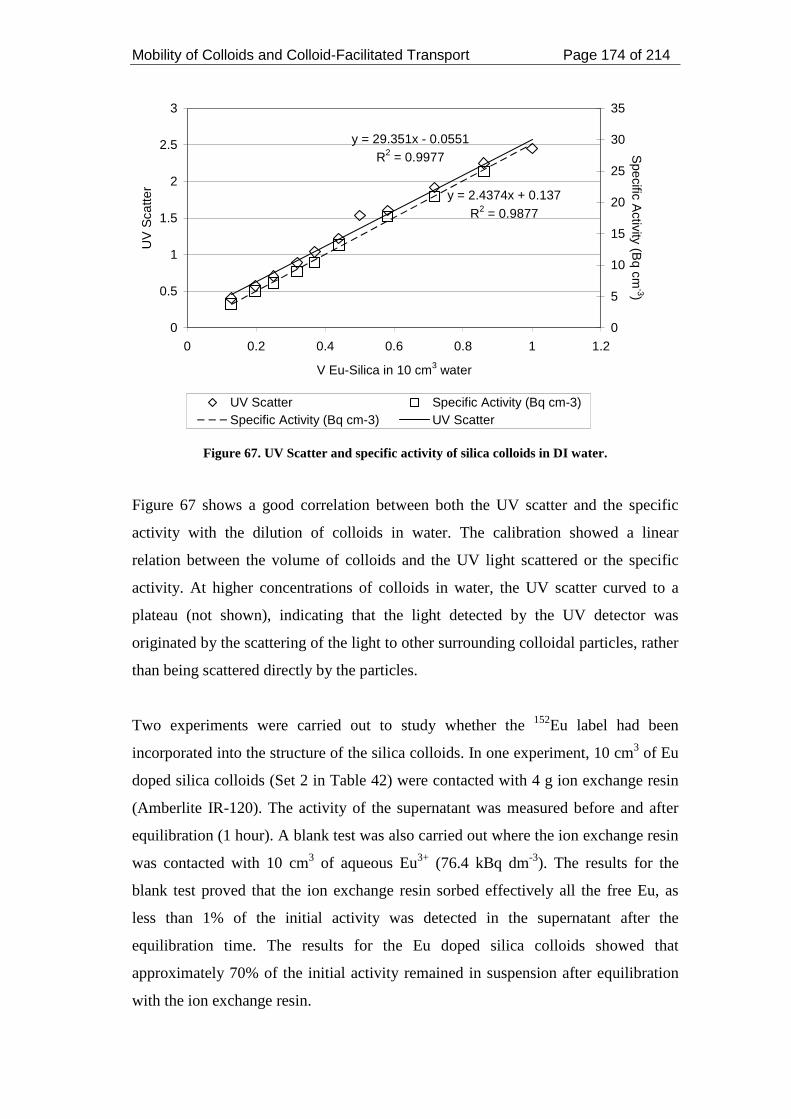
Mobility of Colloids and Colloid-Facilitated Transport Page 174 of 214
y = 29.351x - 0.0551R2 = 0.9977
y = 2.4374x + 0.137R2 = 0.9877
0
0.5
1
1.5
2
2.5
3
0 0.2 0.4 0.6 0.8 1 1.2
V Eu-Silica in 10 cm3 water
UV
Sca
tter
0
5
10
15
20
25
30
35
Specific A
ctivity (Bq cm
-3)
UV Scatter Specific Activity (Bq cm-3)Specific Activity (Bq cm-3) UV Scatter
Figure 67. UV Scatter and specific activity of silica colloids in DI water.
Figure 67 shows a good correlation between both the UV scatter and the specific
activity with the dilution of colloids in water. The calibration showed a linear
relation between the volume of colloids and the UV light scattered or the specific
activity. At higher concentrations of colloids in water, the UV scatter curved to a
plateau (not shown), indicating that the light detected by the UV detector was
originated by the scattering of the light to other surrounding colloidal particles, rather
than being scattered directly by the particles.
Two experiments were carried out to study whether the 152Eu label had been
incorporated into the structure of the silica colloids. In one experiment, 10 cm3 of Eu
doped silica colloids (Set 2 in Table 42) were contacted with 4 g ion exchange resin
(Amberlite IR-120). The activity of the supernatant was measured before and after
equilibration (1 hour). A blank test was also carried out where the ion exchange resin
was contacted with 10 cm3 of aqueous Eu3+ (76.4 kBq dm-3). The results for the
blank test proved that the ion exchange resin sorbed effectively all the free Eu, as
less than 1% of the initial activity was detected in the supernatant after the
equilibration time. The results for the Eu doped silica colloids showed that
approximately 70% of the initial activity remained in suspension after equilibration
with the ion exchange resin.
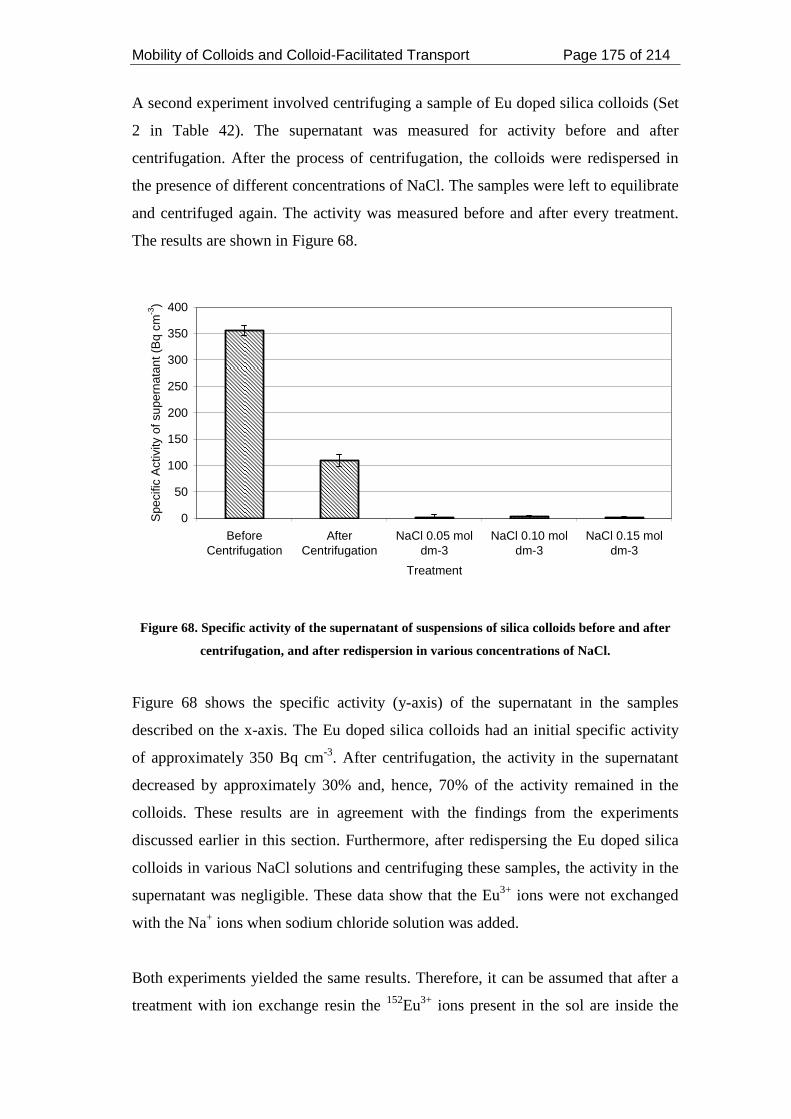
Mobility of Colloids and Colloid-Facilitated Transport Page 175 of 214
A second experiment involved centrifuging a sample of Eu doped silica colloids (Set
2 in Table 42). The supernatant was measured for activity before and after
centrifugation. After the process of centrifugation, the colloids were redispersed in
the presence of different concentrations of NaCl. The samples were left to equilibrate
and centrifuged again. The activity was measured before and after every treatment.
The results are shown in Figure 68.
0
50
100
150
200
250
300
350
400
BeforeCentrifugation
AfterCentrifugation
NaCl 0.05 moldm-3
NaCl 0.10 moldm-3
NaCl 0.15 moldm-3
Treatment
Spe
cific
Act
ivity
of s
uper
nata
nt (
Bq
cm-3
)
Figure 68. Specific activity of the supernatant of suspensions of silica colloids before and after
centrifugation, and after redispersion in various concentrations of NaCl.
Figure 68 shows the specific activity (y-axis) of the supernatant in the samples
described on the x-axis. The Eu doped silica colloids had an initial specific activity
of approximately 350 Bq cm-3. After centrifugation, the activity in the supernatant
decreased by approximately 30% and, hence, 70% of the activity remained in the
colloids. These results are in agreement with the findings from the experiments
discussed earlier in this section. Furthermore, after redispersing the Eu doped silica
colloids in various NaCl solutions and centrifuging these samples, the activity in the
supernatant was negligible. These data show that the Eu3+ ions were not exchanged
with the Na+ ions when sodium chloride solution was added.
Both experiments yielded the same results. Therefore, it can be assumed that after a
treatment with ion exchange resin the 152Eu3+ ions present in the sol are inside the
Mobility of Colloids and Colloid-Facilitated Transport Page 176 of 214
structure of the silica colloids. This treatment was applied prior to the use of the Eu
doped silica colloids in the column experiments to ensure that no free Eu3+ ions were
flooding the column.
4.3.2. Migration experiments
4.3.2.1. Migration of Eu-doped silica colloids through sand column
UV spectrophotometric techniques have been used in numerous studies to follow the
transport, deposition and release of colloids 197,198,166,168. In this work, the migration
of silica colloids was studied radiometrically by radiolabelling the silica colloids with 152Eu, which was incorporated in the structure of the colloids during its synthesis.
The Eu doped silica colloids were introduced into the column as described in section
4.2.3.1 and the results are shown below. Table 43 shows the experimental parameters
for the column experiment.
Table 43. Experimental parameters of column experiment carried out for the assessment of the
migration of Eu doped silica colloids through sand column.
Colloid size (nm) 258.5 ± 5.0
Sand grain size (µm) 200
Column diameter (cm) 2.6
Column height (cm) 30
Porosity 0.39 ± 0.03
Dead/Pore volume (cm3) 62.1 ± 4.5
pH 7.23
Colloid / water flow (cm3 min-1) 0.260 ± 0.005
The elution of the conservative tracer and Eu doped silica colloids from the column
as a function of total volume eluted is shown in Figure 69. Tritiated water was used
as the conservative tracer, since it would not exhibit anion exclusion effects. The
column porosity was calculated as the ratio between the volume filled with water
(Vw) and the total volume of the column (VT). The volume filled with water was
measured as the volume at which tritium started to be detected in the outlet of the
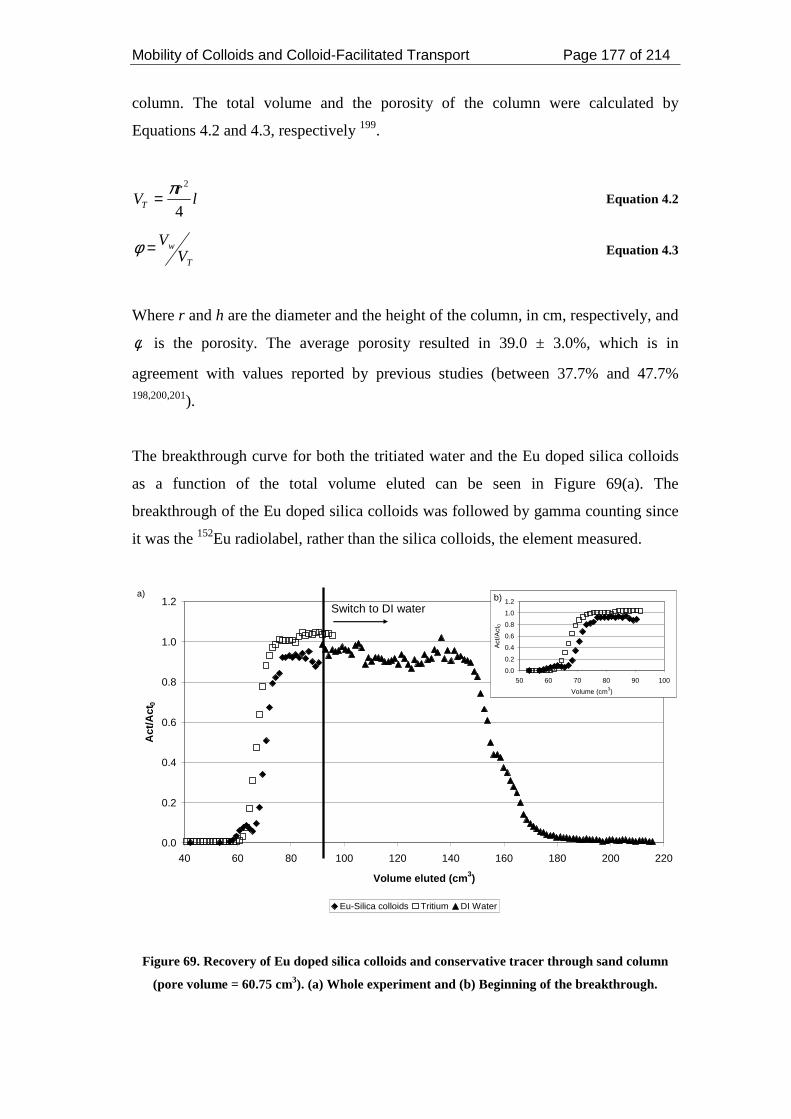
Mobility of Colloids and Colloid-Facilitated Transport Page 177 of 214
column. The total volume and the porosity of the column were calculated by
Equations 4.2 and 4.3, respectively 199.
lr
VT 4
2π= Equation 4.2
T
wV
V=φ Equation 4.3
Where r and h are the diameter and the height of the column, in cm, respectively, and
φ is the porosity. The average porosity resulted in 39.0 ± 3.0%, which is in
agreement with values reported by previous studies (between 37.7% and 47.7% 198,200,201).
The breakthrough curve for both the tritiated water and the Eu doped silica colloids
as a function of the total volume eluted can be seen in Figure 69(a). The
breakthrough of the Eu doped silica colloids was followed by gamma counting since
it was the 152Eu radiolabel, rather than the silica colloids, the element measured.
0.0
0.2
0.4
0.6
0.8
1.0
1.2
40 60 80 100 120 140 160 180 200 220
Volume eluted (cm3)
Act
/Act
0
Eu-Silica colloids Tritium DI Water
Switch to DI watera)
0.0
0.2
0.4
0.6
0.8
1.0
1.2
50 60 70 80 90 100
Volume (cm3)
Act
/Act
0
b)
Figure 69. Recovery of Eu doped silica colloids and conservative tracer through sand column
(pore volume = 60.75 cm3). (a) Whole experiment and (b) Beginning of the breakthrough.
Mobility of Colloids and Colloid-Facilitated Transport Page 178 of 214
It can be seen that after starting the upflooding of Eu doped silica colloids, C/C0 soon
reached 0.90 and fluctuated between 0.87 and 0.98, indicating that little retention of
colloids took place and almost full throughput was attained. On downflooding, the
Eu doped silica colloids returned to zero with little tailing, indicating again slight
interaction between the silica colloids and the column.
Figure 69 (b) shows the beginning of the elution curve, where it can be observed that
the Eu doped silica colloids elute at a similar velocity as the conservative tracer.
Previous studies have shown that breakthrough of silica colloids took place slightly
faster or at the same time than tritiated water 198,165,174. The slight retention observed
in the experiment is most probably due to the electrostatic repulsion occurring
between the negative surface charge of both silica colloids and the quartz sand bed in
the column 174. Several studies have observed little or no retention of negatively
charged colloids passing through quartz sand columns 169,166,168,202.
The high recovery of Eu doped silica colloids suggests that the 152Eu radiolabel was
stable throughout the whole experiment. Studies investigating the elution of 152Eu
through a sand column in the absence and presence of colloids showed a 20%
recovery of 152Eu after approximately 20 pore volumes in the presence of colloids
and no recovery in the absence of colloids 198. Therefore, the detection of 152Eu can
be attributed solely to the 152Eu doped silica colloids.
The total recovery of Eu doped silica colloids at the end of the experiment was
calculated from the ratio of the overall activity measured from the outlet and the
initial activity in the inlet, i.e. 3.38 kBq were recovered from the original 4.05 kBq
in the suspension. These results yielded a 83.4% recovery of Eu doped silica colloids
at the end of the downflood with DI water, indicating partial retention of the silica
colloids in the sand column. A second wash with DI water was carried out, but no
significant activity was detected in the outlet, suggesting the possibility that colloids
were retained in the column in some manner that the colloids could not be released
by further elution.
Mobility of Colloids and Colloid-Facilitated Transport Page 179 of 214
4.3.2.2. Migration of Cs associated to Eu-doped silica colloids
4.3.2.2.1. Sorption of Cs to silica colloids
The migration of 137Cs contacted with Eu doped silica colloids was studied through a
column of the same dimensions as the one described in the previous section. Prior to
these experiments, the sorption of Cs onto silica colloids was investigated by means
of batch experiments to study the extent of sorption of Cs onto silica colloids. The
sorption isotherm as well as the percentages bound are shown in Figure 70 and
Figure 71.
y = 66.435xR2 = 0.9838
0.0E+00
1.0E-02
2.0E-02
3.0E-02
4.0E-02
5.0E-02
6.0E-02
0.0E+00 5.0E-04 1.0E-03 1.5E-03 2.0E-03 2.5E-03 3.0E-03
[Cs]free (mol dm-3)
[Cs]
boun
d (m
ol k
g-1)
Figure 70. Sorption isotherm of Cs sorption onto silica colloids at pH 7.
The sorption isotherm shows a rapid increase of the amount of Cs bound with
increasing Cs in solution, to a point where it curves and saturation begins. The slope
of the linear part of the curve corresponds to the Rd value, which has a value of
approximately 65.3 ± 4.1 dm3 kg-1 under the conditions studied (pH 7 and ionic
strength 0.05 mol dm-3). This value is significantly higher than that observed by
Flury et al. 203, who measured for 0.01 and 0.1 mol dm-3 ionic strength Rd values of
0.550 and 0.274 dm3 kg-1, respectively. The difference in Rd values are due to the
different particle size of silica colloids used in this experiment, as opposed to non-
colloidal particles used by Flury et al.203. Smaller particles provide a larger surface
area where metals can bind to (discussion in Chapter 2).
Mobility of Colloids and Colloid-Facilitated Transport Page 180 of 214
The sorption percentages (Figure 71) show how, even at lower Cs concentrations, the
sorption percentages show a maximum of 50% sorption. The findings are in
agreement with Bascetin et al. 204, who observed a sorption of Cs onto silica gel (15
to 40 µm in particle size) lower than 40%. The slightly higher sorption percentage
observed in Figure 71 is probably due to the smaller particle size (253.7 nm) used in
the present experiment.
0
10
20
30
40
50
60
0.0E+00 5.0E-04 1.0E-03 1.5E-03 2.0E-03 2.5E-03 3.0E-03
[Cs]free (mol dm-3)
% b
ound
Figure 71. Sorption percentages for Cs sorption onto silica colloids at pH 7 and ionic strength
0.05 mol dm-3.
Modelling
The sorption behaviour of Cs onto silica colloids was modelled by fitting the
isotherms to the Langmuir, Freundlich and D-R isotherms.
The parameters obtained from each isotherm, as well as the fitting parameters are
shown in Table 44. The Langmuir model did not fit the experimental values, as
reflected by the low R2 value observed. The Freundlich and D-R models could
explain the sorption behaviour of Cs onto silica colloids.
Mobility of Colloids and Colloid-Facilitated Transport Page 181 of 214
Table 44. Modelling parameters for Cs sorption onto silica colloids.
Langmuir 0.9282
Freundlich 0.9925 R2
D-R 0.9917
F = 7.63
n = 0.76 ± 0.03 Freundlich parameters
Qmax = 2.75 x 10⁻² mol kg-1
K = (6.21 ± 0.03) x 10-3 D-R parameters
E = 8.97 kJ mol-1
The Qmax parameter calculated (2.75x10⁻² mol kg-1) corresponds to the maximum
amount of Cs that would sorb onto the surface of the silica colloids. This value
would correspond to the plateau which the curve tends to in the isotherm (Figure 70).
It can be observed that although the predicted value is in the same order of
magnitude as the experimental value, it is slightly lower than the observed value in
the isotherm, which is approximately 4.5 x 10⁻² mol kg-1. The results from modelling
shown in Table 44 are in good agreement with the findings reported by Bascetin et
al. 205 and Pathak et al. 206 (see Table 45 for comparison). Noell et al. 174 reported a
Kd value of 23.8 ± 1.2 dm3 kg-1 and a Freundlich parameter n = 0.88 ± 0.01. The
sorption energy (E) calculated from the D-R model resulted in 8.97 kJ mol-1, which
is also in agreement with the literature. This value of energy suggested an ion
exchange sorption mechanism.
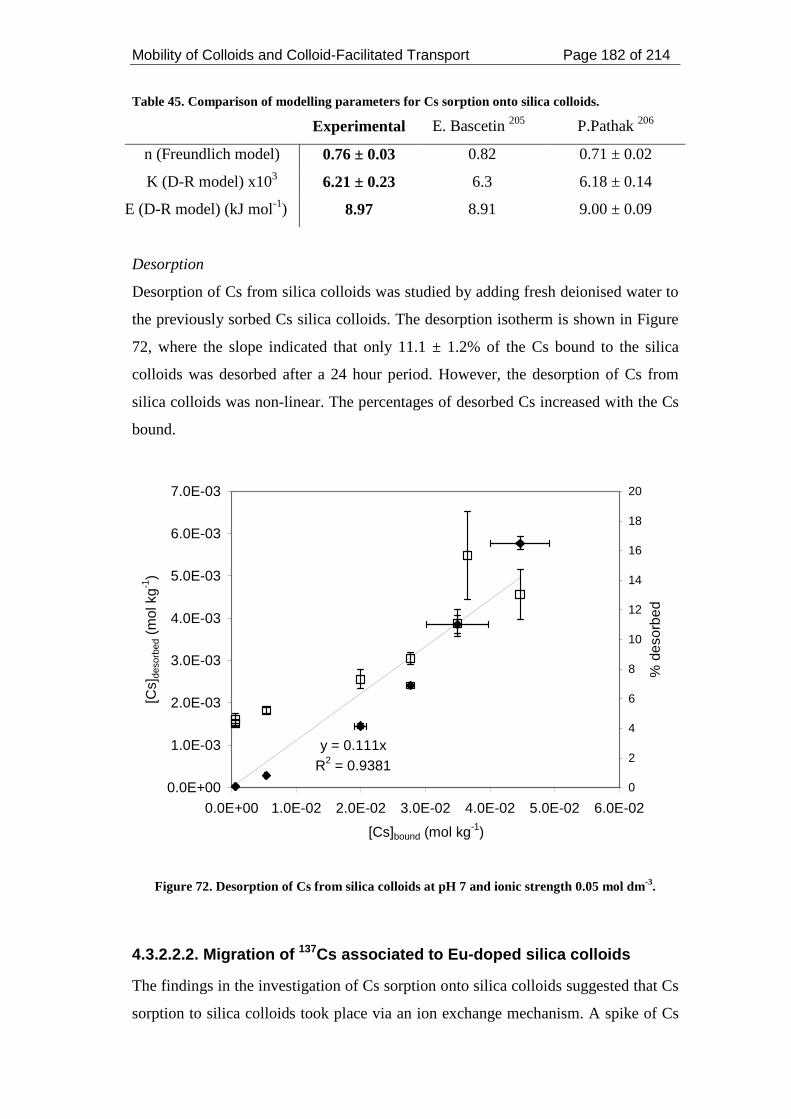
Mobility of Colloids and Colloid-Facilitated Transport Page 182 of 214
Table 45. Comparison of modelling parameters for Cs sorption onto silica colloids.
Experimental E. Bascetin 205 P.Pathak 206
n (Freundlich model) 0.76 ± 0.03 0.82 0.71 ± 0.02
K (D-R model) x103 6.21 ± 0.23 6.3 6.18 ± 0.14
E (D-R model) (kJ mol-1) 8.97 8.91 9.00 ± 0.09
Desorption
Desorption of Cs from silica colloids was studied by adding fresh deionised water to
the previously sorbed Cs silica colloids. The desorption isotherm is shown in Figure
72, where the slope indicated that only 11.1 ± 1.2% of the Cs bound to the silica
colloids was desorbed after a 24 hour period. However, the desorption of Cs from
silica colloids was non-linear. The percentages of desorbed Cs increased with the Cs
bound.
y = 0.111xR2 = 0.9381
0.0E+00
1.0E-03
2.0E-03
3.0E-03
4.0E-03
5.0E-03
6.0E-03
7.0E-03
0.0E+00 1.0E-02 2.0E-02 3.0E-02 4.0E-02 5.0E-02 6.0E-02
[Cs]bound (mol kg-1)
[Cs]
deso
rbed
(m
ol k
g-1)
0
2
4
6
8
10
12
14
16
18
20
% d
esor
bed
Figure 72. Desorption of Cs from silica colloids at pH 7 and ionic strength 0.05 mol dm-3.
4.3.2.2.2. Migration of 137Cs associated to Eu-doped silica colloids
The findings in the investigation of Cs sorption onto silica colloids suggested that Cs
sorption to silica colloids took place via an ion exchange mechanism. A spike of Cs
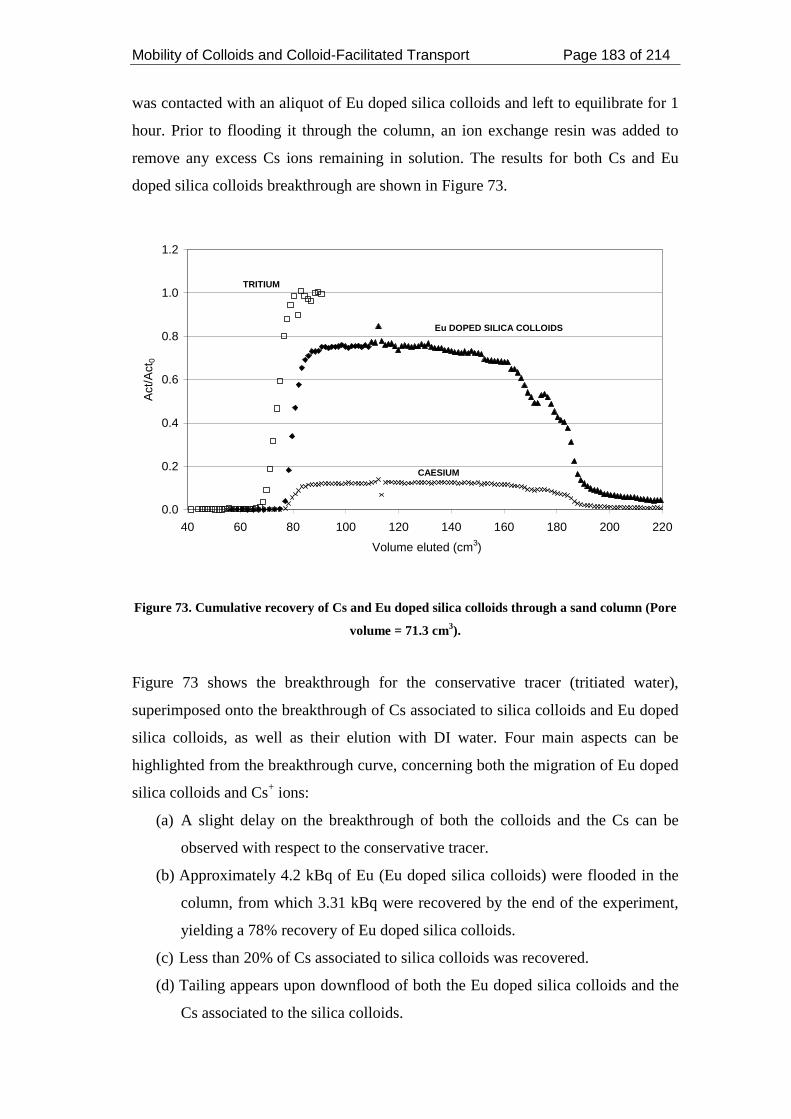
Mobility of Colloids and Colloid-Facilitated Transport Page 183 of 214
was contacted with an aliquot of Eu doped silica colloids and left to equilibrate for 1
hour. Prior to flooding it through the column, an ion exchange resin was added to
remove any excess Cs ions remaining in solution. The results for both Cs and Eu
doped silica colloids breakthrough are shown in Figure 73.
0.0
0.2
0.4
0.6
0.8
1.0
1.2
40 60 80 100 120 140 160 180 200 220
Volume eluted (cm3)
Act
/Act
0
Eu DOPED SILICA COLLOIDS
CAESIUM
TRITIUM
Figure 73. Cumulative recovery of Cs and Eu doped silica colloids through a sand column (Pore
volume = 71.3 cm3).
Figure 73 shows the breakthrough for the conservative tracer (tritiated water),
superimposed onto the breakthrough of Cs associated to silica colloids and Eu doped
silica colloids, as well as their elution with DI water. Four main aspects can be
highlighted from the breakthrough curve, concerning both the migration of Eu doped
silica colloids and Cs+ ions:
(a) A slight delay on the breakthrough of both the colloids and the Cs can be
observed with respect to the conservative tracer.
(b) Approximately 4.2 kBq of Eu (Eu doped silica colloids) were flooded in the
column, from which 3.31 kBq were recovered by the end of the experiment,
yielding a 78% recovery of Eu doped silica colloids.
(c) Less than 20% of Cs associated to silica colloids was recovered.
(d) Tailing appears upon downflood of both the Eu doped silica colloids and the
Cs associated to the silica colloids.
Mobility of Colloids and Colloid-Facilitated Transport Page 184 of 214
The migration of silica colloids through the sand column was markedly different
when the colloids were associated with Cs+ ions. The experimental observations will
be discussed in order to understand the effect of the introduction of positive charges
in the system studied.
In the absence of Cs (Figure 69) the Eu doped silica colloids eluted similarly to the
tritiated water, suggesting that the electrostatic repulsions between the sand and the
silica colloids prevented the silica colloids from being retained in a significant extent.
However, the presence of positive charges altered the system, introducing attractive
van der Waals forces between the exchangeable Cs cations attached to the silica
colloids interacting with the sand in the column. These interactions resulted in the
retardation of the migration of the silica colloids, as well as in the retention of Eu-
doped silica colloids.
The total retention of Eu doped silica colloids was calculated as the ratio between the
activity measured in the effluent at the end of the experiment (3.15 kBq) and the
activity in the inlet (4.25 kBq). These results showed a 74.3% recovery of the Eu
doped silica colloids. Compared to the recovery obtained in the absence of Cs ions
associated to the silica colloids (83.4%), the value calculated in this section is
slightly lower, suggesting again that the presence of Cs altered the migration
behaviour of the silica colloids.
The elution and downflood of Cs occurred at the same time as the silica colloids,
indicating that the recovery of Cs is due to association with the colloids.
Furthermore, the elution of Cs takes place after 1.2 pore volumes, whereas in the
absence of colloids, Saiers et al. 207 observed elution of Cs after 10 pore volumes
through a quartz sand column at pH 7.2 and ionic strength 0.01 mol dm-3. Moreover,
prior to flooding the column with Cs associated to silica colloids, cation exchange
resin was added to the equilibrated suspension to remove any free Cs from
suspension; therefore, any Cs passing through the column was bound to the silica
colloids.
The total recovery observed for Cs was approximately 13% (0.58 kBq were
measured in the effluent from the original 4.4 kBq in the inlet). Monitoring of the
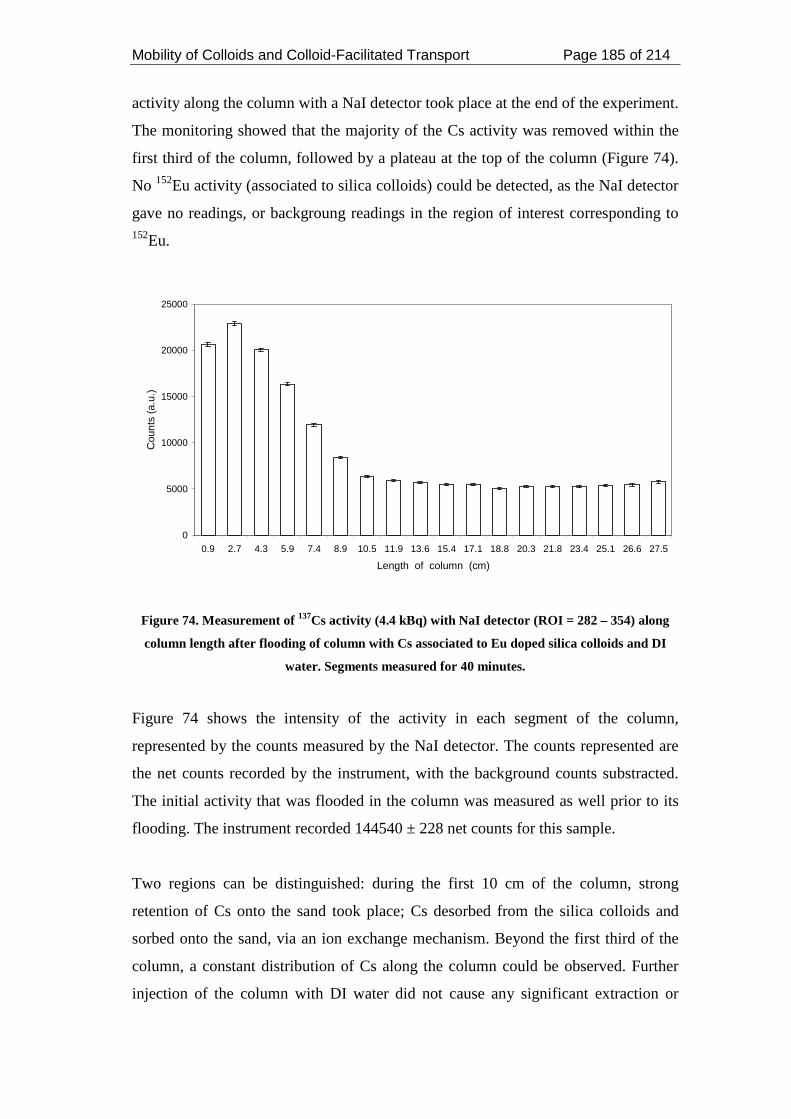
Mobility of Colloids and Colloid-Facilitated Transport Page 185 of 214
activity along the column with a NaI detector took place at the end of the experiment.
The monitoring showed that the majority of the Cs activity was removed within the
first third of the column, followed by a plateau at the top of the column (Figure 74).
No 152Eu activity (associated to silica colloids) could be detected, as the NaI detector
gave no readings, or backgroung readings in the region of interest corresponding to 152Eu.
0
5000
10000
15000
20000
25000
0.9 2.7 4.3 5.9 7.4 8.9 10.5 11.9 13.6 15.4 17.1 18.8 20.3 21.8 23.4 25.1 26.6 27.5
Length of column (cm)
Cou
nts
(a.u
.)
Figure 74. Measurement of 137Cs activity (4.4 kBq) with NaI detector (ROI = 282 – 354) along
column length after flooding of column with Cs associated to Eu doped silica colloids and DI
water. Segments measured for 40 minutes.
Figure 74 shows the intensity of the activity in each segment of the column,
represented by the counts measured by the NaI detector. The counts represented are
the net counts recorded by the instrument, with the background counts substracted.
The initial activity that was flooded in the column was measured as well prior to its
flooding. The instrument recorded 144540 ± 228 net counts for this sample.
Two regions can be distinguished: during the first 10 cm of the column, strong
retention of Cs onto the sand took place; Cs desorbed from the silica colloids and
sorbed onto the sand, via an ion exchange mechanism. Beyond the first third of the
column, a constant distribution of Cs along the column could be observed. Further
injection of the column with DI water did not cause any significant extraction or
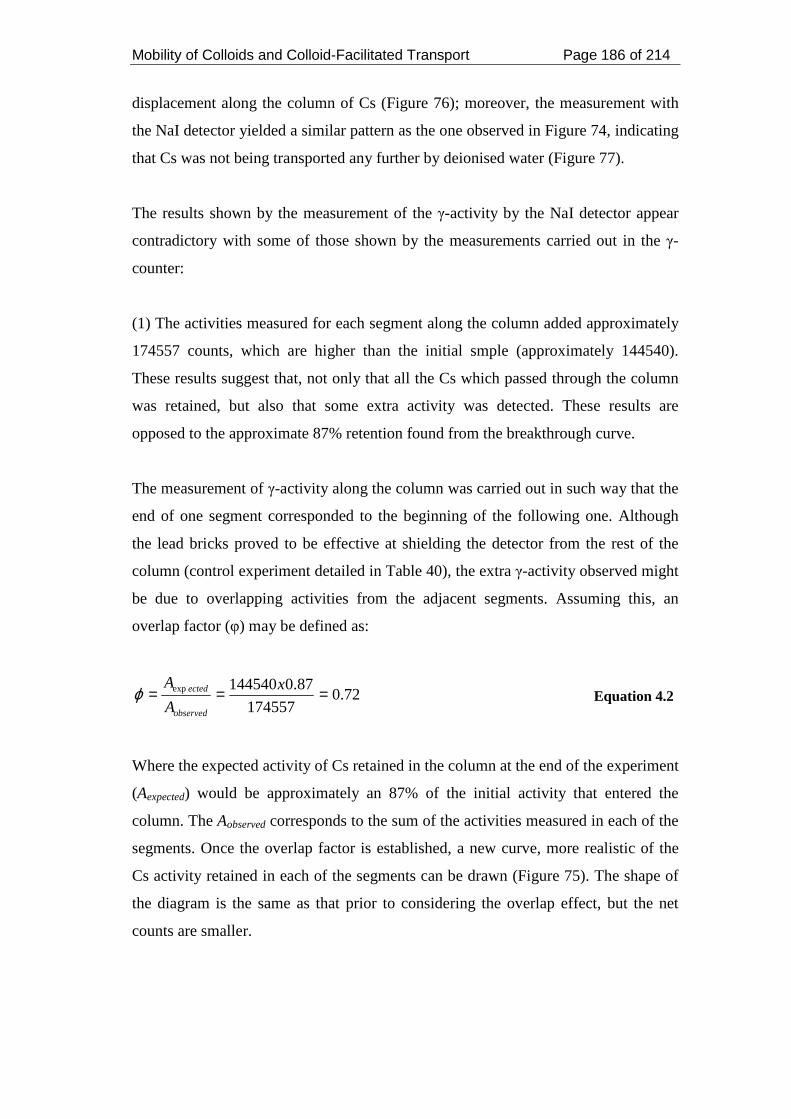
Mobility of Colloids and Colloid-Facilitated Transport Page 186 of 214
displacement along the column of Cs (Figure 76); moreover, the measurement with
the NaI detector yielded a similar pattern as the one observed in Figure 74, indicating
that Cs was not being transported any further by deionised water (Figure 77).
The results shown by the measurement of the γ-activity by the NaI detector appear
contradictory with some of those shown by the measurements carried out in the γ-
counter:
(1) The activities measured for each segment along the column added approximately
174557 counts, which are higher than the initial smple (approximately 144540).
These results suggest that, not only that all the Cs which passed through the column
was retained, but also that some extra activity was detected. These results are
opposed to the approximate 87% retention found from the breakthrough curve.
The measurement of γ-activity along the column was carried out in such way that the
end of one segment corresponded to the beginning of the following one. Although
the lead bricks proved to be effective at shielding the detector from the rest of the
column (control experiment detailed in Table 40), the extra γ-activity observed might
be due to overlapping activities from the adjacent segments. Assuming this, an
overlap factor (φ) may be defined as:
72.0174557
87.0144540exp === x
A
A
observed
ectedϕ Equation 4.2
Where the expected activity of Cs retained in the column at the end of the experiment
(Aexpected) would be approximately an 87% of the initial activity that entered the
column. The Aobserved corresponds to the sum of the activities measured in each of the
segments. Once the overlap factor is established, a new curve, more realistic of the
Cs activity retained in each of the segments can be drawn (Figure 75). The shape of
the diagram is the same as that prior to considering the overlap effect, but the net
counts are smaller.
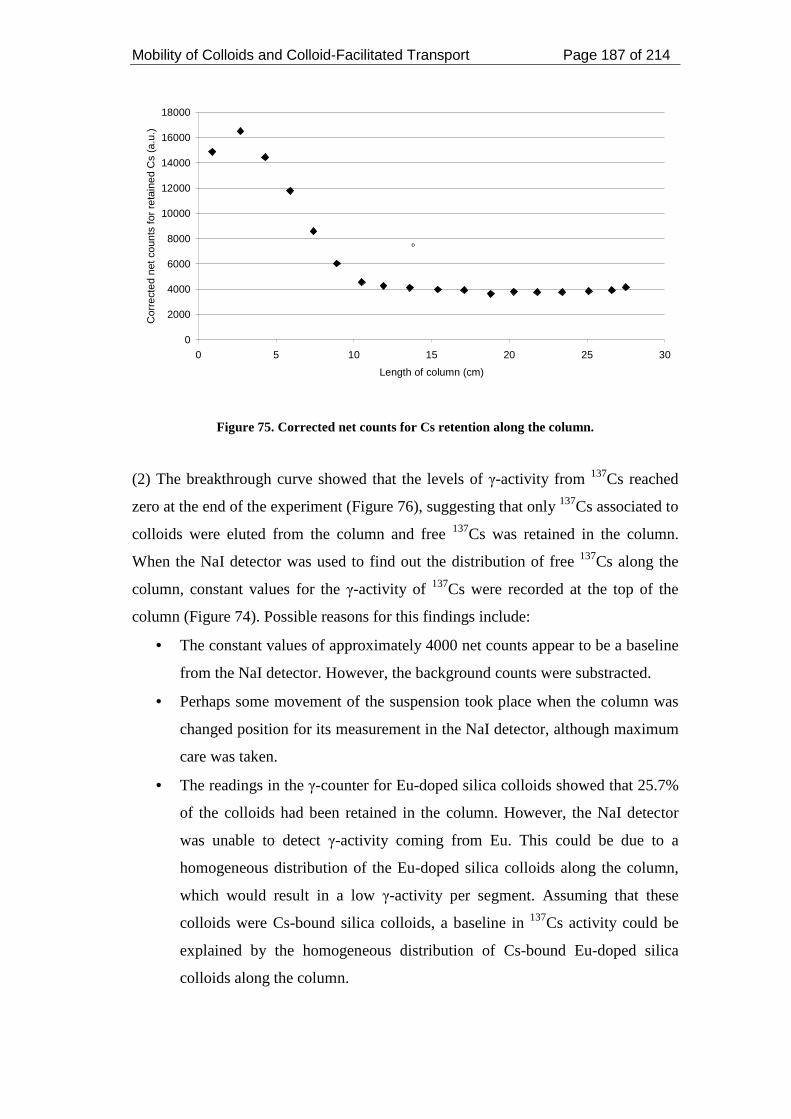
Mobility of Colloids and Colloid-Facilitated Transport Page 187 of 214
0
2000
4000
6000
8000
10000
12000
14000
16000
18000
0 5 10 15 20 25 30
Length of column (cm)
Cor
rect
ed n
et c
ount
s fo
r re
tain
ed C
s (a
.u.)
º
Figure 75. Corrected net counts for Cs retention along the column.
(2) The breakthrough curve showed that the levels of γ-activity from 137Cs reached
zero at the end of the experiment (Figure 76), suggesting that only 137Cs associated to
colloids were eluted from the column and free 137Cs was retained in the column.
When the NaI detector was used to find out the distribution of free 137Cs along the
column, constant values for the γ-activity of 137Cs were recorded at the top of the
column (Figure 74). Possible reasons for this findings include:
• The constant values of approximately 4000 net counts appear to be a baseline
from the NaI detector. However, the background counts were substracted.
• Perhaps some movement of the suspension took place when the column was
changed position for its measurement in the NaI detector, although maximum
care was taken.
• The readings in the γ-counter for Eu-doped silica colloids showed that 25.7%
of the colloids had been retained in the column. However, the NaI detector
was unable to detect γ-activity coming from Eu. This could be due to a
homogeneous distribution of the Eu-doped silica colloids along the column,
which would result in a low γ-activity per segment. Assuming that these
colloids were Cs-bound silica colloids, a baseline in 137Cs activity could be
explained by the homogeneous distribution of Cs-bound Eu-doped silica
colloids along the column.
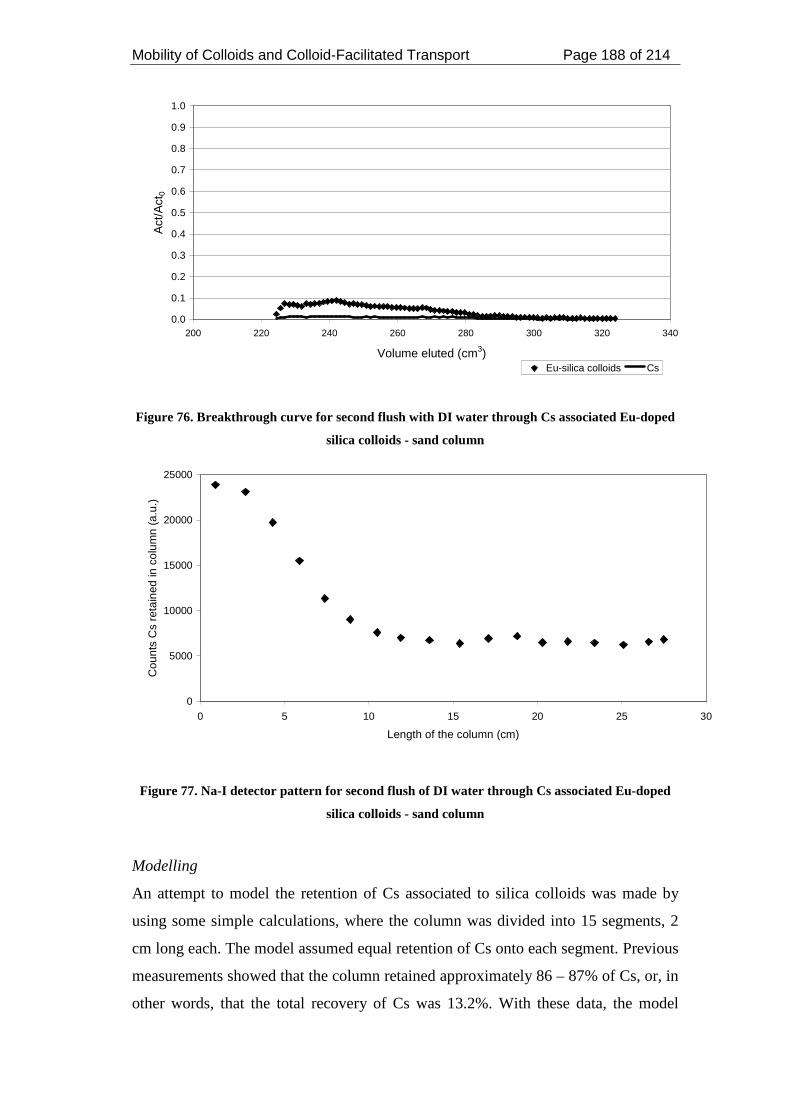
Mobility of Colloids and Colloid-Facilitated Transport Page 188 of 214
0.0
0.1
0.2
0.3
0.4
0.5
0.6
0.7
0.8
0.9
1.0
200 220 240 260 280 300 320 340
Volume eluted (cm3)
Act
/Act
0
Eu-silica colloids Cs
Figure 76. Breakthrough curve for second flush with DI water through Cs associated Eu-doped
silica colloids - sand column
0
5000
10000
15000
20000
25000
0 5 10 15 20 25 30
Length of the column (cm)
Cou
nts
Cs
reta
ined
in c
olum
n (a
.u.)
Figure 77. Na-I detector pattern for second flush of DI water through Cs associated Eu-doped
silica colloids - sand column
Modelling
An attempt to model the retention of Cs associated to silica colloids was made by
using some simple calculations, where the column was divided into 15 segments, 2
cm long each. The model assumed equal retention of Cs onto each segment. Previous
measurements showed that the column retained approximately 86 – 87% of Cs, or, in
other words, that the total recovery of Cs was 13.2%. With these data, the model
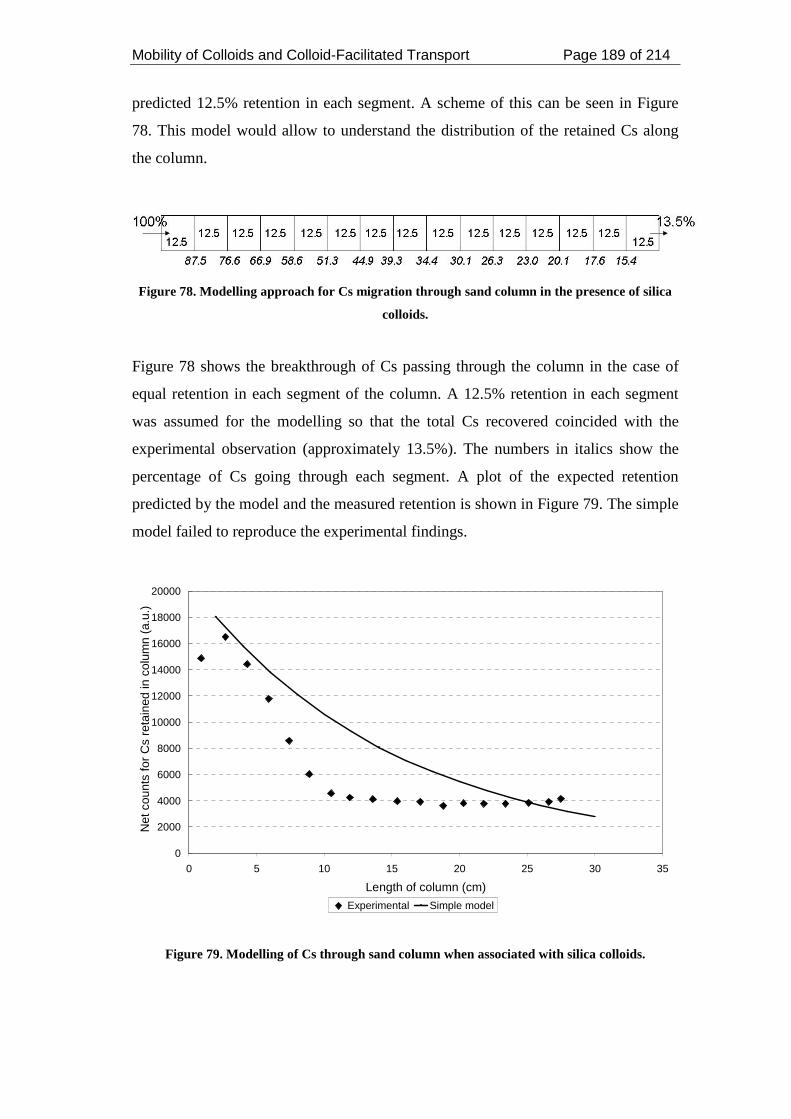
Mobility of Colloids and Colloid-Facilitated Transport Page 189 of 214
predicted 12.5% retention in each segment. A scheme of this can be seen in Figure
78. This model would allow to understand the distribution of the retained Cs along
the column.
Figure 78. Modelling approach for Cs migration through sand column in the presence of silica
colloids.
Figure 78 shows the breakthrough of Cs passing through the column in the case of
equal retention in each segment of the column. A 12.5% retention in each segment
was assumed for the modelling so that the total Cs recovered coincided with the
experimental observation (approximately 13.5%). The numbers in italics show the
percentage of Cs going through each segment. A plot of the expected retention
predicted by the model and the measured retention is shown in Figure 79. The simple
model failed to reproduce the experimental findings.
0
2000
4000
6000
8000
10000
12000
14000
16000
18000
20000
0 5 10 15 20 25 30 35
Length of column (cm)
Net
cou
nts
for
Cs
reta
ined
in c
olum
n (a
.u.)
Experimental Simple model
Figure 79. Modelling of Cs through sand column when associated with silica colloids.
Mobility of Colloids and Colloid-Facilitated Transport Page 190 of 214
4.4. Conclusions
The aims of this study were to synthesise stable Eu-doped silica colloids, and use
these as a tool to investigate the migration of silica colloids through a sand column.
The Eu-doped silica colloids were succesfully synthesised by modification of a
known method. Stability experiments were performed and indicated that the colloids
were sufficiently stable to use them for migration experiments. Also, the stability of
the radiolabel was such that the radiolabelled colloids could be detected and
quantified by radiometric measurements.
The transport of Eu-doped silica colloids was thus studied radiometrically, showing
near-complete recovery of silica colloids when passed through a sand column. The
study also revealed low retention and little tailing of the silica colloids; results which
were expected due to the similar nature of both silica colloids and sand, where the
major interaction would be electrostatic repulsion, generating a rapid migration of
the colloids through the column.
Using the same radiometric techniques, the migration of Cs ions when associated to
Eu doped silica colloids was investigated. This experiment proved an enhancement
of the transport of Cs by silica colloids, as approximately a 13% recovery was
observed. The interaction of Cs+ ions with the silica colloids and the surface of the
sand in the column slightly retarded the transport of silica colloids through the
column.
Conclusions Page 191 of 214
Chapter 5. CONCLUSIONS AND FURTHER WORK
The work presented in this thesis is divided into three parts: (i) the sorption of metals
onto colloidal particles; (ii) the effect that organic colloids, HA, have on such
sorption; and (iii) the effect that colloids may have on the migration of radionuclides.
The stability of colloidal particles is one of the necessary conditions for migration of
colloids to occur, as non-stable colloids flocculate or coagulate leading to retention
of the particles. The main parameters influencing stability are pH and ionic strength.
Findings reported in this work have shown that stability of boehmite and
montmorillonite colloids is achieved at low concentrations of ionic strength. The
dependence of the stability of these colloids with pH was opposite for each of the
colloids, due to the difference in overall positive charge for boehmite and negative
charge for montmorillonite, which caused boehmite colloids to achieve stability at
low to neutral pHs, whereas montmorillonite colloids would gain stability at neutral
to high pHs. The stability of boehmite colloids was found to depend on the
concentration of HA present; low and high concentrations promoted the stability of
colloids whereas intermediate concentrations caused flocculation and coagulation.
Given stable colloidal suspensions in motion with groundwater flow, radionuclides
found in the subsurface may interact with these suspensions, thereby enhancing the
transport of contaminants. Chapter 2 focused on the sorption of metals onto two
different colloidal minerals. Results showed that metal sorption onto the colloidal
suspensions occurred and this sorption was quantified by the distribution ratio, Rd,
which is the ratio between the surface-bound metal concentration and the
concentration of dissolved metal in solution. Despite boehmite having an overall
positive charge, the metals showed affinity for the hydroxyl groups on the surface
and bound effectively to the colloids.
The sorption of metals was also measured on the solid phases of the same minerals.
The general trend observed was that sorption was higher on the colloidal phase. A
quantitative approach introduced an Rd relationship between colloids and solid
surfaces by a proportionality factor, which for boehmite used the ratios between the
cation exchange capacities of the colloid and the solid multiplied by the charge of the
Conclusions Page 192 of 214
metal. This approach however, was only examined for the experimental values
obtained for boehmite. Further research includes the application of this mathematical
approach to different colloidal systems, i.e. montmorillonite, bentonite, goethite. The
success of such mathematical approach would be time-saving in the calculation of
distribution ratios for binary systems with metals and colloids.
Knowledge of desorption processes is relevant in order to assess the transport of
radionuclides through the Geosphere because the enhancement of the transport of
contaminants is achieved if the association is irreversible. Results reported herein
indicated that Ni desorbed by 50% from colloidal montmorillonite, whereas Eu only
desorbed by 3%. The findings suggest that Eu could be transported by
montmorillonite longer distances than Ni, due to the low desorption percentage
exhibited by the former.
Both ion exchange and surface complexation were used to explain the partial
reversibility observed in the sorption of the minerals. Ion exchange would account
for the desorption of the metal by replacement by other metal ions present in
solution; whereas surface complexation would explain the irreversible fraction of the
sorption, i.e. chemical bonding of the metals onto surface sites led to their fixation to
the surface. The mechanisms of sorption, however, were qualitative and based on
findings reported in the literature.
The specific surface area of colloids was measured by the BET method, which
involved the solidification of the colloidal suspension. During this process, the
surface of the colloids was altered by the formation of aggregates. The sorption of
dyes has been used to measure the specific surface area of colloids like
montmorillonite. However, on an attempt to use the same method on boehmite
colloids, the use of four different dyes yielded unsuccesful results. Further work in
this field is strongly suggested, as measurement of this property by drying processes
have shown to affect negatively the results obtained.
Humic acids are ubiquitous in all natural soils, thereby affecting the stability of
colloids as well as the sorption of metals onto them. The findings reported herein
were consistent with those found in the literature and suggested a decrease in the
Conclusions Page 193 of 214
sorption of metals onto boehmite colloids in the presence of HA, when compared to
that observed in the absence of humics. Thus, transport of radionuclides by inorganic
colloids would probably be hindered in the presence of HA.
An attempt to model the influence of HA, using the LAM was applied to the ternary
system. The application of the LAM was successful assuming that the fraction of HA
bound to the colloids was close to unity.
The stability of boehmite colloids was clearly influenced by HA concentration. The
repulsive interactions introduced by HA at intermediate concentrations favoured
flocculation and coagulation of the particles. As the boehmite concentration of
colloids increased, HA concentration necessary to induce flocculation also increased.
Hence, at higher colloidal concentrations, batch sorption experiments should be
carried out to investigate whether the LAM could be applied. Due to comparison
with the results carried out in Chapter 2, these experiments were not analysed.
As stated in the introductory chapter, for colloids to be of relevance in the migration
of radionuclides, two of the factors to be met were (1) sorption of metals onto the
colloids, which Chapter 2 investigated for two colloidal minerals; (2) and the
mobility of colloids with groundwater flow. Chapter 4 investigated the mobility of
silica colloids and also investigated the facilitation of Cs transport by silica colloids.
The migration of colloids was assessed by studying the mobility of silica colloids
through a sand column. Rather than traditional spectroscopic techniques, a
radiolabelling technique was used for radiometrically detecting the colloidal phase
along the length of the column. For this experiment, stable silica colloids were
labelled from early stages of the synthesis so that the radiolabel would be embedded
in the structure of the silica at the end of the process. Migration experiments showed
that silica colloids migrated through the sand column with little retention. Moreover,
the mobility of Cs was enhanced by the presence of colloids.
Overall, the investigations carried out herein clarify the interactions of multi-valent
metals with colloidal particles, the influence of HA on these and the influence
colloids may have on the mobility of radionuclides. Considering the results observed,

Conclusions Page 194 of 214
it is suggested that colloidal phases present in the environment may significantly
alter the retention of contaminants, particularly radionuclides by enhancing their
transport, to a higher or lower extent, depending on the reversibility.

Personal Development Training Page 195 of 214
PERSONAL DEVELOPMENT TRAINING
Date & Location Title Training Type Duration
6th – 7th November
2006, Loughborough
University
Long Term Nuclear Waste
Management: Next Steps
Conference
attendance 2 Day
15th November 2006,
Loughborough
University
Induction Day Orientational
course 1 Day
29th November 2006,
University of Leeds RSC Annual Meeting 1 Day
11th December 2006,
Louhborough
University
Designing and Producing
Conference Posters Training course ½ Day
6th February 2007,
London
A report of the
Loughborough Workshop 1 Day
8th – 9th February
2007, Sellafield
Underpinning Assessment
Sciences Programme
Symposia
Tour and open
day 2 ½ Day
8th March 2007,
Loughborough
University
Talks on Analytical
Chemistry Lecture series ½ Day
28th March 2007,
Loughborough
University
Report Writing Training course ½ Day
17th – 19th April 2007,
Loughborough
University
COGER
Conference
attendance and
presentation of
first year work
3 Day
25th April 2007, Leeds
Latest Developments in
Particle & Material
Characterisation
Complimentary Seminars
Lecture series 1 ½ Day
30th May 2007, AQUANET Colloids Conference 2 Day

Personal Development Training Page 196 of 214
University of
Birmingham
Workshop 2007 attendance
25th – 30th August
2007, Münich,
Germany
Migration Munich Conference
attendance 7 Day
January – September
2007, Loughborough
Malvern Instruments
Webinars
Online lecture
series 1 Day
23rd January 2008,
BGS, Keyworth
Talk by Dr. Patrick
Landais
Lecture
attendance ½ Day
30th January 2008,
Loughborough
University
Teaching Skills
Professional Development
Course
Training course 1 Day
7th February 2008,
Sheffield
Environmental Process
Symposia (Nexia
Solutions)
Conference
attendance 1 Day
7th – 9th April 2008,
University of
Nottingham
COGER
Presentation of
second year
work
3 Day
16th April 2008,
London
Young Researchers
Meeting Presentation 1 Day
23rd April 2008 PhD Research Training
Programme: Plagiarism Training course ½ Day
2007 – 2008
Physical Chemistry
Foundation Year & First
Year
Laboratory
Demonstrating
+ 50
Hours
6th – 7th October 2008,
Barcelona
3rd FUNMIG Training
Course
Workshop
attendance 2 Day
3rd – 6th August 2009,
Glasgow IUPAC Congress
Poster
presentation and
conference
attendance
4 Day
21st – 24th September
2009, Kennewick, Migration Seattle
Poster
presentation and 4 Day

Personal Development Training Page 197 of 214
Seattle conference
attendance
2006 – 2009,
Loughborough
University
Radiochemistry Group
Meetings
Group meetings
and
presentations
Weekly
References Page 198 of 214
REFERENCES
1 International Atomic Energy Agency. Use of Natural Analogues to Support Radionuclide transport Models for Deep Geological Repositories for Long Lived Radioactive Wastes. Vienna : IAEA, 1999. Technical Document. IAEA-TECHDOC-1109. 2 NDA Radioactive Waste Management Directorate. Proposed research and development strategy. Nuclear Decomissioning Authority 2008. 3 E. Tipping, J.J.W. Higgo. The role of colloids in the release and transport of radionuclides in the near and far field. British Geological Survey 1991. Fluid Processes Research Group Technical Report WE/91/16. 4 D.J. Shaw. Introduction to colloid and surface chemistry. Butterworth-Heinemann. Fourth Edition 5 M. Manciu, E. Ruckenstein. Role of the hydration force in the stability of colloids at high ionic strengths. Langmuir 17 (2001) 7061 – 7070. 6 B. Sudhir, S. Kumar. Existence of a new force in colloidal systems – Hydrophobic attraction between macroscopic surfaces. Resonance April 2002 67 – 81. 7 R. J. Hunter, Foundations of Colloid Science, Clarendon Press, Oxford, 2001. 8 B.P. Singh, R. Menchavez, C. Takai, M. Fuji, M. Takahashi. Stability of dispersions of colloidal alumina particles in aqueous suspensions. Journal of Colloid and Interface Science 291 (2005) 181 – 186. 9 J. Sun, B.V. Velamakanni, W.W. Gerberich, L.F. Francis. Aqueous latex/ceramic nanoparticle dispersions: colloidal stability and coating properties. Journal of Colloid and Interface Science 280 (2004) 387 – 399. 10 P. Zhao, S.A. Steward. Literature review of intrinsic actinide colloids related to spent fuel waste package release rates. 1997. Lawrence Livermore National Laboratory, Contract W-7405-Eng-48. 11 H.M. Beckhit, M.A. El-Kordy, A.E. Hassan. Contaminant transport in groundwater in the presence of colloids and bacteria: Model development and verification. Journal of Contaminant Hydrology 108 (2009) 152 – 167. 12 T. Ilina, M. Panfilov, M. Buès, I. Panfilova. A pseudo two-phase model of colloid transport in porous media. Transport of Porous Media 71 (2008) 311 – 329. 13 J.F. McCarthy, L.D. McKay. Colloid Transport in the Subsurface: Past, Present, and Future Challenges. Vadose Zone Journal 3 (2004) 326 – 337.
References Page 199 of 214
14 E. Wieland, J. Tits, M.H. Bradbury. The potential effect of cementitious colloids on radionuclide mobilisation in a repository for radioactive waste. Applied Geochemistry 19 (2004) 119 – 135. 15 A. Javaid, R. Bajwa, U. Shafique, J. Anwar. Removal of heavy metals by adsorption on Pleurotus ostreatus. Biomass and Bioenergy 35 (2011) 1675 – 1682. 16 J. Maresova, M. Pipiska, M. Rozloznik, M. Horník. Cobalt and strontium sorption by moss biosorbent: Modeling of single and binary metal systems. Desalination 266 (2011) 134 – 141. 17 J. Simunek, C. He, L. Pang, S.A. Bradford. Colloid-facilitated solute transport in variably saturated porous media: numerical model and experimental verification. Vadose Zone Journal 5 (2006) 1035 – 1047. 18 R.A.A. Muzzarelli. Potential of chitin/chitosan-bearing materials for uranium recovery: An interdisciplinary review. Carbohydrate Polymers 84 (2011) 54 – 63. 19 W.W. Wan Ngah, L.C. Teong, M.A.K.M. Hanafiah. Adsorption of dyes and heavy metal ions by chitosan composites: A review. Carbohydrate Polymers 83 (2011) 1446 – 1456. 20 X. Yang, R. Flynn, F. von der Kammer, T. Hofmann. Quantifying the influence of humic acid adsorption on colloidal microsphere deposition onto iron-oxide-coated sand. Environmental Pollution 158 (2010) 3498 – 3506. 21 A.B.M. Giasuddin, S.R. Kanel, H. Choi. Adsorption of HA onto nanoscale zerovalent iron and its effect on arsenic removal. Environmental Science and Technology 41 (2007) 2022 – 2027. 22 A. Liu, R.D. Gonzalez. Adsorption/desorption in a system consisting of humic acid, heavy metals and clay minerals. Journal of Colloid and Interface Science 218 (1999) 225 – 232. 23 T. Yoshida, M. Suzuki. Effects of humic acid on migration of montmorillonite and alumina colloid in a quartz sand column. Colloids and Surfaces A: Physicochemical and Engineering Aspects 325 (2008) 115 – 119. 24 N. Evans, P. Warwick, T. Lewis, N. Bryan. Influence of humic acid on the sorption of U(IV) to kaolin. Environmental Chemistry Letters 9 (2011) 25 – 30. 25 P.W. Warwick, A. Hall, V. Pashley, N.D. Bryan, D. Griffin. Modelling the effect of humic substances on the transport of europium through porous media: a comparison of equilibrium and equilibrium/kinetic models. Journal of Contaminant Hydrology 42 (2000) 19 – 34. 26 T.S. Anirudhan, P.S. Suchithra. Heavy metals uptake from aqueous solutions and industrial wastewaters by humic acid-immobilized polymer/bentonite composite:
References Page 200 of 214
Kinetics and equilibrium modeling. Chemical Engineering Journal 156 (2010) 146 – 156. 27 J.F. Boily, J.B. Fein. Proton binding to humic acids and sorption of P(II) and humic acid to the corundum surface. Chemical Geology 168 (2000) 239 – 253. 28 D. Grolimund, M. Borkovec. Colloid-facilitated transport of strongly sorbing contaminants in natural porous media: mathematical modeling and laboratory column experiments. Environmental Science and Technology 39 (2005) 6378 – 6386. 29 T. Kanti Sen, K.C. Khilar. Review on subsurface colloids and colloid-associated contaminant transport in saturated porous media. Advances in Colloid and Interface Science 119 (2006) 71 – 96. 30 J.N. Ryan, M. Elimelech. Colloid mobilization and transport in groundwater. Colloids and Surfaces A: Physicochemical and Engineering Aspects 107 (1996) 1 – 56. 31 T. Ilina, M. Panfilov, M. Buès, I. Panfilova. A pseudo two-phase model of colloid transport in porous media. Transport of Porous Media 71 (2008) 311 – 329. 32 J.W. Bridge, S.A. Banwart, A.L. Heathwaite. Noninvasive quantitative measurement of colloid transport in mesoscale porous media using time lapse fluorescence imaging. Environmental Science and Technology 40 (2006) 5930 – 5936. 33 O. Spalla, S. Desset. Direct evidence of lateral migration of mineral colloids adsorbed at a water-solid interface. Langmuir 16 (2000) 2133 – 2140. 34 C. Hinz. Description of sorption data with isotherm equations. Geoderma 99 (2001) 225 – 243. 35 A. Delos, C. Walther, T. Schäfer, S. Büchner. Size dispersion and colloid mediated radionuclide transport in a synthetic porous media. Journal of Colloid and Interface Science 324 (2008) 212 – 215. 36 S. Kurosawa, S.C. James, M. Yui, M. Ibaraki. Model analysis of the colloid and radionuclide retardation experiment at the Grimsel Test Site. Journal of Colloid and Interface Science 298 (2006) 467 – 475. 37 N. Albarran, T. Missana, M. García-Gutiérrez, U. Alonso, M. Mingarro. Strontium migration in a crystalline medium: effects of the presence of bentonite colloids. Hournal of Contaminant Hydrology 122 (2011) 76 – 85. 38 D. Grolimund, M. Borkovec. Colloid-facilitated transport of strongly sorbing contaminants in natural porous media: mathematical modeling and laboratory column experiments. Environmental Science and Technology 39 (2005) 6378 – 6386.
References Page 201 of 214
39 S. Nagasaki, S. Tanaka, A. Suzuki. Interfacial behavior of actinides with colloids in the geosphere. Journal of Nuclear Materials 248 (1997) 323 – 327. 40 S. Kurosawa, M. Ibaraki, M. Yui, S. Ueta, H. Yoshikawa. Experimental and numerical studies on colloid-enhanced radionuclide transport - The effect of kinetic radionuclide sorption onto colloidal particles. Materials Research Society Symposium Proceedings 824 (2004) CC8.40.1 – 6. 41 A.L. Noell, J.L. Thompson, M.Y. Corapcioglu, I. R. Triay. The role of silica colloids on facilitated cesium transport through glass bead columns and modeling. Journal of Contaminant Hydrology 31 (1998) 23 – 56. 42 P. Vilks, M.H. Baik. Laboratory migration experiments with radionuclides and natural colloids in a granite fracture. Journal of Contaminant Hydrology 47 (2001)197 – 210. 43 G. Limousin, J.P. Gaudet, L. Charlet, S. Szenknect, V. Barthès, M. Krimissa. Sorption isotherms: A review on physical bases, modeling and measurement. Applied Geochemistry 22 (2007) 249 – 275. 44 S. Goldberg, L.J. Criscenti, D.R. Turner, J.A, Davis, K.J. Cantrell. Adsorption-desorption processes in subsurface reactive transport modeling. Vadose Zone Journal 6 (2007) 407 – 435. 45 T. Missana, M. García-Gutiérrez, C. Maffiotte. Experimental and modelling study of the uranium (VI) sorption on goethite. Journal of Colloid and Interface Science 260 (2003) 291 – 301. 46 A.M.L. Kraepiel, K. Keller, F.M.M. Morel. A model for metal adsorption on montmorillonite. Journal of Colloid and Interface Science 210 (1999) 43 – 54. 47 J.M.A. Caiut, S.J.L. Ribeiro, Y. Messadeq, J. Dexpert-Ghys, M. Varelst, H. Dexpert. Synthesis and luminescence properties of water dispersible Eu3+-doped boehmite nanoparticles. Nanotechnology 18 (2007) 455606 (8pp). 48 J. Theo Kloprogge, L.V. Duong, B.J. Wood, R.L. Frost. XPS study of the major minerals in bauxite: gibbsite, bayerite and (pseudo-)boehmite. Journal of Colloid and Interface Science 296 (2006) 572 – 576. 49 R. Frost, H. Ruan, T. Kloprogge. Comparison of the Raman spectra of bayerite, boehmite, diaspore and gibbsite. Journal of Raman Spectroscopy 32 (2001) 745 – 750. 50 J. He, C.B. Ponton. Hydrothermal synthesis and morphology control of boehmite. High Pressure Research 20 (2001) 241 – 254.
References Page 202 of 214
51 Y. Watanabe, H. Yamada, T. Kasama, J. Tanaka, Y. Komatsu, Y. Moriyoshi. Adsorption behaviour of phosphorus on synthetic boehmites. Proceedings of the 19th International Japan – Korea Seminar on Ceramics, 2002, pp 80 – 84. 52 B.S. Gevert, Z-S. Ying. Formation of fibrillar boehmite. Journal of Porous Materials 6 (1999) 63 – 67. 53 J. Zhang, S. Liu, J. Lin, H. Song, J. Luo, E.M. Elssfah, E. Ammar, Y. Huang, X. Ding, J. Gao, S. Qi, C. Tang. Self-assembly of flowerlike AlOOH (boehmite) 3D nanoarchitectures. Journal of Physical Chemsitry B 110 (2006) 14249 – 14252. 54 Q. Liu, A. Wang, X. Wang, P. Gao, X. Wang, T. Zhang. Synthesis, characterisation and catalitic applications of mesoporous γ-alumina from boehmite sol. Microporous and Mesoporous Materials 111 (2008) 323 – 333. 55 S. Music, D. Dragcevic, S. Popovic, N. Vdovic. Microstructural properties of boehmite formed under hydrothermal conditions. Materials Science and Engineering B52 (1998) 145 – 153. 56 P. Zhang, J.L. Krumhansl, P.V. Brady. Boehmite sorbs perrhenate and pertechnetate. Radiochimica Acta 88 (2000) 369 – 373. 57 J. He, C.B. Ponton. Hydrothermal synthesis and morphology control of boehmite. High Pressure Research 20 (2001) 241 – 254. 58 J. Subrt, V. Stengl, S. Bakardjieva, L. Szatmary. Synthesis of spherical metal oxide particles using homogeneous precipitation of aqueous solutions of metal sulfates with urea. Powder Technology 169 (2006) 33 – 40. 59 F. Granados-Correa, J. Jiménez-Becerril. Chromium (VI) adsorption on boehmite. Journal of Hazardous Materials 162 (2009) 1178 – 1184. 60 P. De Souza Santos, A.C. Vieira Coelho, H. De Souza Santos, P.K. Kiyohara. Hydrothermal synthesis of well-characterised boehmite crystals of various shapes. Materials Research 12 (2009) 437 – 445. 61 R. Dähn, A.M. Scheidegger, A. Manceau, M.L. Schlegel, B. Baeyens, M.H. Bradbury, D. Chateigner. Structural evidence for the sorption of Ni(II) atoms on the edges of montmorillonite clay minerals: A polarized X-ray absorption fine structure study. Geochimica et Cosmochimica Acta 67 (2003) 1 – 15. 62 C. Volzone, J.O. Rinaldi, J. Ortiga. N2 and CO2 adsorption by TMA- and HDP-montmorillonites. Materials Research 5 (2002) 475 – 479. 63 B. Baeyens, M.H. Bradbury. A mechanistic description of Ni and Zn sorption on Na-montmorillonite. Part I: Titration and sorption measurements. Journal of Contaminant Hydrology 27 (1997) 199 – 222.
References Page 203 of 214
64 J.L. Krumhansl, P.V. Brady, H.L. Anderson. Reactive barriers for 137Cs retention. Journal of Contaminant Hydrology 47 (2001) 233 – 240. 65 T. Boonfueng, L. Axe, Y. Xu, T.A. Tyson. Nickel and lead sequestration in manganese oxide-coated montmorillonite. Journal of Colloid and Interface Science 303 (2006) 87 – 98. 66 D. Xu, X. Zhou, X. Wang. Adsorption and desorption of Ni2+ on Na-montmorillonite: effect of pH, ionic strength, fulvic acid, humic acid and addition sequences. Applied Clay Science 39 (2008) 133 – 141. 67 S. Kraemer, J. Xu, K.N. Raymond, G. Sposito. Adsorption of Pb(II) and Eu(III) by oxide minerals in the presence of natural and synthetic hydroxamate siderophores. Environmental Science and Technology 36 (2002) 1287 – 1291. 68 S. Goldberg, L.J. Criscenti, D.R. Turner, J.A. Davis, K.J. Cantrell. Adsorption-desorption processes in subsurface reactive transport modelling. Vadose Zone Journal 6 (2007) 407 – 435. 69 N. Filipovic-Vincekovic, L. Brecevic, D. Krali. Interactions in clay/electrolyte systems. Journal of Radioanalytical and Nuclear Chemistry 130 (1989) 155 – 167. 70 A. Agrawal, K. K. Sahu, B. D. Pandey. A comparative adsorption study of copper on various industrial solid wastes. American Institute of Chemical Engineers 50 (2004) 2430 – 2438. 71 S. J. Allinson. Investigation of Inorganic Colloids in the Near-Field of a Waste Repository. PhD Thesis. Loughborough University, 2004. 72 P. Klobes. Precision Measurement of the Specific Surface Area of Solids by Gas Adsorption. Federal Institute for Materials Research and Testing. BAM Reference Procedure, Chapter 4, 2011. 73 J.J. Freeman, A.I. McLeod. Nitrogen BET surface area measurement as a fingerprint method for the estimation of pore volume in active carbons*. Fuel 62 (1983) 1090 – 1091. 74 S.J. Kemp, G. Turner, D. Wagner. Initial testing and a laboratory manual for the Micromeritics Gemini VI physisorption system. British Geological Survey, Laboratory Operations Programme, Internal Report IR/08/086, 2009. 75 M. Mazloumi, M. Attarchi, A. Lak, M.S. Mohajerani, A. Kajbafvala, S. Zanganeh, S.K. Sadrnezhaad. Boehmite nanopetals self assembled to form rosette-like nanostructures. Materials Letters 62 (2008) 4184 – 4186. 76 S. Music, O. Dragcevic, S. Popovic. Hydrothermal crystallization of boehmite from freshly precipitated aluminium hydroxide. Materials Letters 40 (1999) 269 – 274.
References Page 204 of 214
77 V. Pierre, D. Pierre, A.C. Pierre. Copper-alumina materials made by infiltration in boehmite. Journal of Materials Science 10 (1995) 2271 – 2276 78 A.E. Blum and D.D. Eberl. Measurement of surface areas by polyvinylpyrrolidine sorption, G01N 30/96, U.S.A, 2003. 79 M.J. Avena, L.E. Valenti, V. Pfaffen, C.P. De Pauli. Methylene blue dimerization does not interfere in surface-area measurements of kaolinite and soils. Clays and Clay Minerals 49 (2001) 168 – 173. 80 B. A. Keiser and J. E. Whitten, Colloids Comprising Amorphous Borosilicate, C01B 35/00 (20060101); C01B 35/10 (20060101); D21H 21/10 (20060101); D21H 17/00 (20060101); D21H 17/68 (20060101); C01B 033/20 (); C01B 035/00 (), U.S., 2002. 81 L.M. He, B.M. Tebo. Surface Charge Properties of and Cu(II) Adsorption by Spores of the Marine Bacillus sp. Strain SG-1. Applied Environmental Microbiology 64 (1998) 1123 – 1129. 82 R. Dohrmann. Cation exchange capacity methodology I: An efficient model for the detection of incorrect cation exchange capacity and exchangeable cation results. Applied Clay Science 34 (2006) 31 – 37. 83 K. Takazi. Transformations of Al-interlayered montmorillonite upon aging. Canadian Mineralogist 25 (1987) 347 – 352. 84 H. Ciesielski, T. Sterckeman. A comparison between three methods for the determination of cation exchange capacity and exchangeable cations in soils. Agronomie 17 (1997) 9 – 16. 85 D. Aran, A. Maul, J.F. Masfaraud. A spectrophotometric measurement of soil cation exchange capacity based on cobaltihexamine chloride absorbance. Comptes Rendus Geoscience 340 (2008) 865 – 871. 86 R. Wood, D. Fornasiero, J. Ralston. Electrochemistry of the boehmite – water interface. Colloids and Surfaces 51 (1990) 389 – 403. 87 M. Del Nero, C. Galindo, R. Barillon, E. Halter, B. Madé. Surface reactivity of α-Al 2O3 and mechanisms of phosphate sorption: In situ ATR-FTIR spectroscopy and ζ potential studies. Journal of Colloid and Interface Science 342 (2010) 437 – 444. 88 A.J. Fairhust, P. Warwick. The influence of humic acid on europium-mineral interactions. Colloids and Surfaces A: Physicochemical and Engineering Aspects 145 (1998) 229 – 234. 89 A. Kaya, Y. Yukselen. Zeta potential of soils with surfactants and its relevance to electrokinetic remediation. Journal of Hazardous Materials B120 (2005) 119 – 126.

References Page 205 of 214
90 A.M.L. Kraepiel, K. Keller, F.M.M. Morel. A model for metal adsorption on montmorillonite. Journal of Colloid and Interface Science 210 (1999) 43 – 54. 91 S.A. Adeleye, P.G. Clay, M.O.A. Oladipo. Sorption of caesium, strontium and europium ions on clay minerals. Journal of Materials Science 29 (1994) 954 – 958. 92 P. Zhang, J.L. Krumhansl, P.V. Brady. Boehmite sorbs perrhenate and pertechnetate. Radiochimica Acta 88 (2000) 369 – 373. 93 Y.Z. Wei, P. Chiang, S. Sridhar. Ion size effects on the dynamic and static dielectric properties of aqueous alkali solutions. Journal of Chemical Physics 96 (1992) 4569 – 4573. 94 T. Akyüz, S. Akyüz, A. Bassari. The sorption of cesium and strontium ions onto red-clay from Sivrihisar-Eskisehir (Turkey). Journal of Inclusion Phenomena and Macrocyclic Chemistry 38 (2000) 337 – 344. 95 G. Atun, B. Bilgin, A. Mardinli. Sorption of cesium on montmorillonite and effects of salt concentration. Journal of Radioanalytical and Nuclear Chemistry 211 (1996) 435 – 442. 96 A.R. West. Solid state chemistry and its applications, Chapter 5. John Wiley & Sons 1985. 97 M.B. McBride. Influence of glycine on Cu2+ adsorption by microcrystalline gibbsite and boehmite. Clays and Clay Minerals 33 (1985) 397 – 402. 98 B.T. Beaulieu, K.S. Savage. Arsenate adsorption structures on aluminum oxide and phyllosilicate mineral surfaces in smelter-impacted soils. Environmental Science and Technology 39 (2005) 3571 – 3579. 99 T. Hiemstra, W.H. van Riemsijk. Adsorption and surface oxidation of Fe(II) on metal (hydr)oxides. Geochimica et Cosmochimica Acta 71 (2007) 5913 – 5933. 100 Y.S. Meng, D.J. Wang, J. Wu, H.J. Liu, S.H. Ju. Fluorescence studies of Eu ions adsorption on pseudo-boehmite colloidal particle surface. Guang Pu Xue Yu Guan Pu Fen Xi [Abstract] 29 (2009) 180 – 183. 101 R.W. Taylor, W.F. Bleam, S.I. Tu. On the Langmuir phosphate adsorption maximum. Communications in Soil Science and Plant Analysis 27 (1996) [Abstract]. 102 G. Liu, P. Wang, Q. Liu, W. Han. Removal of Cd(II) by nanometer AlO(OH) loaded on fiberglass with activated carbon fiber felt as carrier. Chinese Journal of Chemical Engineering 16 (2008) 805 – 811. 103 Y. Kim, R.J. Kirkpatrick. 23Na and 133Cs NMR study of cation adsorption on mineral surfaces: local environments, dynamics and effects of mixed cations. Geochimica et Cosmochimica Acta 61 (1997) 5199 – 5208.
References Page 206 of 214
104 E. Tertre, G. Berger, S. Castet, M. Loubet, E. Giffaut. Experimental sorption of Ni2+, Cs+ and Ln3+ onto a montmorillonite up to 150ºC. Geochimica et Cosmochimica Acta 69 (2005) 4937 – 4948. 105 G. Villaseñor-Nano, T.J. Strathmann. Ferrous iron sorption by hydrous metal oxides. Journal of Colloidal and Interface Science 297 (2006) 443 – 454. 106 B. Piriou, M. Fedoroff, J. Jeanjean, L. Bercis. Characterization of the sorption of europium(III ) on calcite by site-selective and time-resolved luminescence spectroscopy. Journal of Colloid and Interface Science 194 (1997) 440 – 447. 107 A. Naveau, F. Monteil-Rivera, J. Dumonceau, S. Boudesocque. Sorption of europium on a goethite surface: influence of background electrolyte. Journal of Contaminant Hydrology 77 (2005) 1 – 16. 108 R.W. Puls, H.L. Bohn. Sorption of cadmium, nickel and zinc by kaolinite and montmorillonite suspensions. Soil Science Society of America Journal 52 (1988) 1289 – 1292. 109 A. Alfarra, E. Frackowiak, F. Bégouin. The HSAB concept as a means to interpret the adsorption of metal ions onto activated carbons. Applied Surface Science 228 (2004) 84 – 92. 110 A. Beerbower, W.B. Jensen. The HSAB principle and extended solubility theory. Inorganica Chimica Acta 75 (1983) 193 – 197. 111 R. Jayakrapash, J. Shanker. Correlation between electronegativity and high temperature superconductivity. Journal of Physics and Chemistry of Solids 54 (1993) 365 – 369. 112 S. Trazzi Breviglieri, E.T. Gomes Cavalheiro, G.Orivaldo Chierice. Correlation between ionic radius and thermal decomposition of Fe(II), Co(II), Ni(II), Cu(II) and Zn(II) diethanoldithiocarbamates. Thermochimica Acta 356 (2000) 79 – 84. 113 D. Phanon, A. Mosset, I. Gautier-Luneau. New iodate materials as potential laser matrices. Preparation and characterisation of α-M(IO3)3 (M = Y, Dy) and β-M(IO3)3 (M = Y, Ce, Pr, Nd, Eu, Gd, Tb, Dy, Ho, Er). Structural evolution as a function of the Ln3+ cationic radius. Solid State Sciences 9 (2007) 496 – 505. 114 M. Cruz-Guzmán, R. Celis, M.C. Hermosín, W.C. Koskinen, E.A. Nater, J. Cornejo. Heavy metal adsorption by montmorillonites modified with natural organic cations. Soil Society of America Journal 70 (2006) 215 – 221. 115 E. Morillo, C. Maqueda. Simultaneous adsorption of chlordimeform and zinc on montmorillonite. The Science of the Total Environment 123/124 (1992) 133 – 143. 116 O. Ínel, F. Albayrak, A. Askin. Cu and Ph adsorption on some bentonitic clays. Turkish Journal of Chemistry 22 (1998) 243 – 252.
References Page 207 of 214
117 M.M. Wahba, A.M. Zaghloul. Adsorption characteristics of some heavy metals by some soil minerals. Journal of Applied Sciences Research 3 (2007) 421 – 426. 118 M. Bouby, H. Geckeis, J. Lützenkirchen, S. Mihai, T. Schäfer. Interaction of bentonite colloids with Cs, Eu, Th and U in presence of húmica acid: A flow field-flow fractionation study. Geochimica et Cosmochimica Acta 75 (2011) 3866 – 3880. 119 A. Czímerová, L. Jankovic, J. Bujdák. Spectral properties of rhodamine 6G in smectite dispersions: Effect of the monovalent cations. Journal of Colloid and Interface Science 357 (2011) 322 – 330. 120 N. Lu, C.F.V. Mason. Sorption-desorption behaviour of strontium-85 onto montmorillonite and silica colloids. Applied Geochemistry 16 (2001) 1653 – 1662. 121 M-H. Baik, W-J. Cho. An experimental study on the sorption of Uranium (VI) onto a bentonite colloid. Journal of the Korean Radioactive Waste Society 4 (2006) 235 – 243. 122 D. Karamanis, P.A. Assimakopoulos. Efficiency of aluminum-pillared montmorillonite on the removal of cesium and copper from aqueous solutions. Water Research 41 (2007) 1897 – 1906. 123 J-P. Bellenger, S. Staunton. Adsorption and desorption of 85Sr and 137Cs on reference minerals, with and without inorganic and organic surface coatings. Journal of Environmental Radioactivity 99 (2008) 831 – 840. 124 A. Dyer, J.K.K. Chow, I.M. Umar. The uptake of caesium and strontium radioisotopes onto clays. Journal of Materials Chemistry 10 (2000) 2734 – 2740. 125 B.C. Bostick, M.A. Vairavamurthy, K.G. Karthikeyan, J. Chorover. Cesium Adsorption on Clay Minerals: An EXAFS Spectroscopic Investigation. Environmental Science Technology 36 (2002) 2670 – 2676. 126 G. Lujaniené, S. Motiejünas, J. Sapolaité. Sorption of Cs, Pu and Am on clay minerals. Journal of Radioanalytical and Nuclear Chemistry 274 (2007) 345 – 353. 127 B. Lotenbach, G. Furrer, R. Schulin. Immobilization of heavy metals by polynuclear aluminium and montmorillonite compounds. Environmental Science and Technology 31 (1997) 1452 – 1462. 128 S. Wold. Sorption of prioritized elements on montmorillonite colloids and their potential to transport radionuclides. Technical Report TR-10-20. Swedish Nuclear Fuel and Waste Management Co, April 2010. 129 M.H. Bradbury, B. Baeyens. Sorption of Eu on Na- and Ca-montmorillonites: Experimental investigations and modelling with cation exchange and surface complexation. Geochimica et Cosmochimica Acta 66 (2002) 2325 – 2334.
References Page 208 of 214
130 Th. Rabung, M.C. Pierret, A. Bauer, H. Geckeis, M.H. Bradbury, B. Baeyens. Sorption of Eu(III)/Cm(III) on Ca-montmorillonite and Na-illite. Part 1: Batch sorption and time-resolved laser fluorescence spectroscopy experiments. Geochimica et Cosmochimica Acta 69 (2005) 5393 – 5402. 131 J. Liu, H. Lippold, J. Wang, J. Lippmann-Pipke, Y. Chen. Sorption of thallium(I) onto geological materials: Influence of pH and humic matter. Chemosphere 82 (2011) 866 – 871. 132 Z. Tao, W. Li, F. Zhang, Y. Ding, Z. Yu. Am(III) adsorption on oxides of aluminium and silicon: effects of humic substances, pH and ionic strength. Journal of Colloid and Interface 265 (2003) 221 – 226. 133 C. Chen, X. Wang. Sorption of Th (IV) on silica as a function of pH, humic/fulvic acid, ionic strength, electrolyte type. Applied Radiation and Isotopes 65 (2007) 155 – 163. 134 C. Chen, X. Wang. Influence of pH, soil humic/fulvic acid, ionic strength and foreign ions on sorption of Th (IV) onto γ-Al 2O3. Applied Geochemistry 22 (2007) 436 – 445. 135 N. Zhiwei, F. Qiaohui, W. Wenhua, X. Junzheng, C. Lei, W. Wangsuo. Effect of pH, ionic strength and humic acid on the sorption of uranium(VI) to attapulgite. Applied Radiation and Isotopes 67 (2009) 1582 – 1590. 136 M. Cruz-Guzmán, R. Celis, M.C. Hermosín, P. Leone, M. Nègre, J. Cornejo. Sorption-desorption of lead (II) and Mercury (II) by model associations of soil colloids. Soil Science Society of America Journal 67 (2003) 1378 – 1387. 137 A. Soumitra Kar, S. Kumar, B.S. Tomar, V.K. Manchanda. Sorption of curium by silica colloids: Effect of humic acid. Journal of Hazardous Materials 186 (2011) 1961 – 1965. 138 B.K. Singh, A. Jain, S. Kumar, B.S. Tomar, R. Tomar, V.K. Manchanda, S. Ramanathan. Role of magnetite and humic acid in radionuclide migration in the environment. Journal of Contaminant Hydrology 106 (2009) 144 – 149. 139 A. Jain, N. Rawat, S. Kumar, B.S. Tomar, V.K. Machanda, S. Ramanathan. Sorption of neptunium by hematite colloids. BARC Newsletter 297 (2008) 297 – 301. 140 M. Samadfam, S. Sato, H. Ohashi. Effects of humic acid on the sorption of Eu(III) onto kaolinite. Radiochimica Acta 82 (1998) 361 – 365. 141 H. Lippold, N. Müller, H. Kupsch. Effect of humic acid on the pH-dependent adsorption of terbium (III) onto geological materials. Applied geochemistry 20 (2005) 1209 – 1217.
References Page 209 of 214
142 I. Christl, R. Kretzschmar. Interaction of copper and fulvic acid at the hematite-water interface. Geochimica et Cosmochimica Acta 65 (2001) 3435 – 3442. 143 T. Sakuragi, S. Sato, T. Kozaki, T. Mitsugashira, M. Hara, Y. Suzuki. Am(III) and Eu(III) uptake on hematite in the presence of humic acid. Radiochimica Acta 92 (2004) 697 – 702. 144 M. Samadfam, T. Jintoku, S. Sato, H. Ohashi, T. Mitsugashira, M. Hara, Y. Suzuki. Effects of humic acid on the sorption of Am(III) and Cm(III) on kaolinite. Radiochimica Acta 88 (2000) 717 – 721. 145 S. Kumar, B.S. Tomar, S. Ramanathan, V.K. Manchanda. Effect of humic acid on cesium sorption on silica colloids. Radiochimica Acta 94 (2006) 369 – 373. 146 S. Kumar, N. Rawat, A.S. Kar, B.S. Tomar, V.K. Manchanda. Effect of humic acid on sorption of technetium on alumina. Article in press Journal of Hazardous Materials (2011) doi:10.1016/j.jhazmat.2011.06.007 147 A.S. Kar. S. Kumar, B.S. Tomar, V.K. Manchanda. Sorption of curium by silica colloids: Effect of humic acid. Journal of Hazardous Materials 186 (2011) 1961 – 1965. 148 K.L. Titley. Fundamental studies on metal – humic acid interactions. Thesis (PhD.) Loughborough University 2009. 149 A. Pitois, L. Abrahamsen, P. Ivanov, N.D. Bryan. Humic acid adsorption onto a quartz sand surface: A kinetic study and insight into fractionation. Journal of Colloid and Interface Science 325 (2008) 93 – 100. 150 T. J. Strathmann, S.C.B. Myneni. Effect of soil fulvic acid on Nickel(II) sorption and bonding at the aqueous-boehmite (γ-AlOOH) interface. Environmental Science and Technology 39 (2005) 4027 – 4034. 151 J.C. Miller, J.N. Miller. Statistics for Analytical Chemistry. New York : Ellis Horwood PTR Prentice Hall, 1993. 3rd Edition. 152 E. Tombácz, Á. Dobos, M. Szekeres, H.D. Narres, E. Lumpp, I. Dékány. Effect of pH and ionic strength on the interaction of humic acid with aluminium oxide. Colloid Polymer Science 278 (2000) 337 – 345. 153 T. Hyun Yoon, S. B. Johnson, G.E. Brown Jr. Adsorption of organic matter at mineral/water interfaces. IV. Adsorption of humic substances at boehmite/water interfaces and impact on boehmite dissolution. Langmuir 21 (2005) 5002 – 5012. 154 C. Varadachari, T, Chattopadhyay, K. Ghosh. The crystallo-chemistry of oxide-humus complexes. Australian Journal of Soil Research 38 (2000) 789 – 806.
References Page 210 of 214
155 H. Lippold, N. Müller, H. Kupsch. Effect of humic acid on the pH-dependent adsorption of terbium (III) onto geological materials. Applied geochemistry 20 (2005) 1209 – 1217. 156 L. Carlsen, P. Lassen, P. Warwick, A. Randall. Interaction between europium ions and selected size fractions of humic acids. Chemosphere 33 (1996) 659 – 670. 157 C. Dumat, H. Quiquampoix, S. Staunton. Adsorption of cesium by synthetic clay – organic matter complexes : Effect of the nature or organic polymers. Environmental Science and Technology 34 (2000) 2985 – 2989. 158 A. Rigol, M. Vidal, G. Rauret. An overview of the effect of organic matter on soil–radiocaesium interaction: implications in root uptake. Journal of Environmental Radioactivity 58 (2002) 191 – 216. 159 S. Staunton, C. Dumat, A. Zsolnay. Possible role of organic matter in radiocaesium adosption in soils. Journal of Environmental Radioactivity 58 (2002) 163 – 173. 160 X. Wang, Th. Rabung, H. Geckeis. Effect of pH and humic acid on the adsorption of cesium onto γ-Al 2O3. Journal of Radioanalytical and Nuclear Chemistry 258 (2003) 83 – 87. 161 D. Wenming, W. Xiangke, B. Xiaoyan, W. Aixia, D. Jingzhou, T. Zuyi. Comparative study on sorption/desorption of radioeuropium on alumina, bentonite and red earth: effects of pH, ionic strength, fulvic acid and iron oxides in red earth. Applied Radiation and Isotopes 54 (2001) 603 – 610. 162 X. Wang, Y. Chen, Y. Wu. Diffusion of Eu(III) in compacted bentonite – effect of pH, solution concentration and humic acid. Applied Radiation and Isotopes 60 (2004) 963 – 969. 163 T. Lewis. Sorption of metals to clay minerals in the presence of organic complexing ligands. Thesis (PhD), Loughborough University, 2008. 164 O. Gezici, H. Kara, M. Ersöz, Y. Abali- The sorption behaviour of a nickel-insolubilized humic acid system in a column arrangement. Journal of Colloid and Interface Science 292 (2005) 381 – 391. 165 J.J.W. Higgo, G.M. Williams, I. Harrison, P. Warwick, M.P. Gardiner, G. Longworth. Colloid transport in a glacial sand aquifer. Laboratory and field studies. Colloids and Surfaces A: Physicochemical and Engineering Aspects 73 (1993) 179 – 200. 166 C. Shani, N. Weisbrod, A. Yakirevich. Colloid transport through saturated sand columns: Influence of physical and chemical surface properties on deposition. Colloids and surfaces A: Physicochem. Eng. Aspects 316 (2008) 142 – 150.
References Page 211 of 214
167 S. A. Bradford, M. Bettahar, J. Simunek, M. Th. van Genuchten. Straining and attachment of colloids in physically heterogeneous porous media. Vadose Zone Journal 3 (2004) 384 – 394. 168 K. Shiratori, Y. Yamashita, Y. Adachi. Deposition and subsequent release of Na-kaolinite particles by adjusting pH in the column packed with Toyoura sand. Colloids and surfaces A: Physicochem. Eng. Aspects 306 (2007) 137 – 141. 169 T. Yoshida, M. Suzuki. Effects of humic acid on migration of montmorillonite and alumina colloid in a quartz sand column. Colloids and Surfaces A: Physicochemical and Engineering Aspects 325 (2008) 115 – 119. 170 J. Zhuang, Y. Jin, M. Flury. Comparison of Hanford colloids and kaolinite transport in porous media. Vadose Zone Journal 3 (2004) 395 – 402. 171 F. Kuhnen, K. Barmettler, S. Bhattacharjee, M. Elimelech, R. Kretzschmar. Transport of iron oxide colloids in packed quartz sand media: monolayer and multilayer deposition. Journal of Colloid and Interface Science 231 (2000) 32 – 41. 172 S. B. Roy, D. A. Dzombak. Colloid release and transport processes in natural and model porous media. Colloids and Surfaces A: Physicochemical and Engineering Aspects 107 (1996) 246 – 262. 173 U. Alonso, T. Missana, A. Patelli, V. Rigato. Bentonite colloid diffusion through the host rock of a deep geological repository. Physics and Chemistry of the Earth 32 (2007) 469 – 476. 174 A.L. Noell, J.L. Thompson, M.Y. Corapcioglu, I. R. Triay. The role of silica colloids on facilitated cesium transport through glass bead columns and modeling. Journal of Contaminant Hydrology 31 (1998) 23 – 56. 175 P. Grindrod, M. S. Edwards, J. J. W. Higgo, G. M. Williams. Analysis of colloid and tracer breakthrough curves. Journal of Contaminant Hydrology 21 (1996) 243 – 253. 176 R. Artinger, B. Kienzler, W. Schüβler, J. I. Kim. Effects of humic substances on the 241Am migration on a sandy aquifer: column experiments with Gorleben groundwater/sediment systems. 177 H. Geckeis, T. Schäfer, W. Hauser, Th. Rabung, T. Missana, C. Degueldre, A. Möri, J. Eikenberg, Th. Fierz, W.R. Alexander. Results of the colloid and radionuclide retention experiment (CRR) at the Grimsel Test Site (GTS), Switzerland – impact of reaction kinetics and speciation on radionuclide migration. Radiochimica Acta 92 (2004) 765 – 774. 178 T.K. Sen, S.P. Mahajan, K.C. Khilar. Colloid-associated contaminant transport in porous media: 1. Experimental studies. AIChe Journal 48 (2002) 2366 – 2374.
References Page 212 of 214
179 D. Read, D. Ross, R.J. Sims. The migration of uranium through Clashach Sandstone: the role of low molecular weight organics in enhancing radionuclide transport. Journal of Contaminant Hydrology 35 (1998) 235 – 248. 180 X-Y. Tang, N. Weisbrod. Colloid-facilitated transport of lead in natural discrete fractures. Environmental Pollution 157 (2009) 2266 – 2274. 181 S. Brandriss, G. Borchardt, J. Kreuter, S. Margel. Radiolabeled 75Se-silica nanoparticles: synthesis, characterization and coating with ω-functionalized alkylsilane compounds. Reactive Polymers 25 (1995) 111 – 125. 182 Y. Lin, X. Zhang, J. Li, D. Yin, Y. Wang. Preparation and radiolabelling of antimony sulfide nanocolloids with two different particle sizes. Applied Radiation and Isotopes 58 (2003) 347 – 352. 183 C. Tsopelas. Understanding the radiolabelling mechanism of 99mTc-antimony sulphide colloid. Applied Radiation and Isotopes 59 (2003) 321 – 328. 184 W. Stöber, A. Fink, E. Bohn. Controlled growth of monodisperse silica spheres in the micron range. Journal of Colloid and Interface Science, 26 (1968) 62 – 69. 185 P. Warwick, A. Hall, V. Pashley, J. Van der Lee, A. Maes. Zinc and cadmium mobility in Podzol soils. Chemosphere, 38 (1999) 2357 – 2368. 186 G. Bavestrello, A. Arillo, B. Calcinai, C. Cerrano, S. Lanza, M. Sara, R. Cattaneo-Vietti, E. Gaino. Siliceous particles incorporation in Chondrosia reniformes (Porifera, Demospongiae). Italian Journal of Zoology, 65 (1998) 343 – 348. 187 Penna, M. Magnani, I. Fenoglio, B. Fubini, C. Cerrano, M. Giovine, G. Bavestrello. Marine diatom growth on different forms of particulate silica: evidence of cell/particle interaction. Aquatic Microbial Ecology, 32 (2003) 299 – 306. 188 J.A. Barclay, B. Perczuk. Nuclear structure and the hyperfine interaction of oriented 152Eu, 155Eu and 153Gd in gold. Hyperfine Interactions 1 (1975) 15 – 24. 189 L. Peng, W. Qisui, L. Xi, Z. Chaocan. Zeta-potentials and enthalpy changes in the process of electrostatic self-assembly of cations on silica surface. Powder Technology 193 (2009) 46 – 49. 190 M.S. Tsai, W-C. Wu. Aluminum modified colloidal silica via sodium silicate. Materials Letters 58 (2004) 1881 – 1884. 191 C.E. McNamee, M. Matsumoto, P.G. Hartley, M. Nakahara. Adsorption of quaternised polyvinylpyridine and subsequent counterion binding of perfluorinated anionic surfactants on silica as a function of concentration and pH: a zeta potential study. Colloids and Surfaces A: Physicochemical and Engineering Aspects 193 (2001) 175 – 185.
References Page 213 of 214
192 G. Xu, J. Zhang, G. Song. Effect of complexation on the zeta potential of silica powder. Powder Technology 134 (2003) 218 – 222. 193 G.W. Sears. Determination of specific surface area of colloidal silica by titration with sodium hydroxide. Analytical Chemistry 28(12) (1956) 1981 – 1983. 194 A.A. Christy. Quantitative determination of surface area of silica gel particles by near infrared spectroscopy and chemometrics. Colloids and Surfaces A: Physicochemical and Engineering Aspects 322 (2008) 248 – 252. 195 A. Karami. Study on modification of colloidal silica surface with magnesium ions. Journal of Colloid and Interface Science 331 (2009) 379 – 383. 196 D.A. Vasconcelos, W.R. Campos, V. Vasconcelos, W.L. Vasconcelos. Influence of process parameters on the morphological evolution and fractal dimension of sol-gel colloidal silica particles. Materials Science and Engineering A334 (2002) 53 – 58. 197 E. Tipping, J.J.W. Higgo. The role of colloids in the release and transport of radionuclides in the near and far field. British Geological Survey 1991. Fluid Processes Research Group Technical Report WE/91/16. 198 A. Fairhust. The Role of Inorganic Colloids in the Transport of Toxic Metals Through the Environment. Thesis (PhD). Loughborough University, 1996. 199 R.P. Schwarzenbach, P.M. Gschwend, D. M. Imboden. Environmental Organic Chemistry – Illustrative examples, problems and case studies. John Wiley and Sons 1995. 200 C. Curry, R, Bennet, M. Hulbert, K. Curry, R. Faas. Comparative study of sand porosity and a technique for determining porosity of undisturbed marine sediment. Marine Geosources and Geotechnology, 22(4) (2004) 231 – 252. 201 J. Mibus, S. Sachs, W. Pfingsten, C. Nebelung, G. Bernhardt. Migration of U(IV)/(VI) in the presence of humic acids in quartz sand: A laboratory column study. Journal of Contaminant Hydrology 89 (2007) 199 – 217. 202 R.A. Akbour, J. Douch, M. Hamdani, P. Schmitz. Transport of kaolinite colloids through quartz sand: Influence of humic acid, Ca2+ and trace metals. Journal of Colloid and Interface Science 253 (2002) 1 – 8. 203 M. Flury, S. Czigány, G. Chen, J.B. Harsh. Cesium migration in saturated silica sand and Hanford sediments as impacted by ionic strength. Journal of Contaminant Hydrology 71 (2004) 111 – 126. 204 E. Bascetin, H. Haznedaroglu, A. Y. Erkol. The adsorption behavior of cesium on silica gel. Applied Radiation and Isotopes 59 (2003) 5 – 9.

References Page 214 of 214
205 E. Bascetin, H. Haznedaroglu, A. Y. Erkol. The adsorption behavior of cesium on silica gel. Applied Radiation and Isotopes 59 (2003) 5 – 9. 206 P.N. Pathak, G.R. Choppin. Kinetic and thermodynamic studies of cesium (I) sorption on hydrous silica. Journal of Radioanalytical and Nuclear Chemistry 270(2) (2006) 299 – 305. 207 J.E. Saiers, G.M. Hornberger. Migration of 137Cs through quartz sand: experimental results and modeling approaches. Journal of Contaminant Hydrology 22 (1996) 255 – 270.