Embed Size (px)
Citation preview
Investigative Reporting Quick Start
Investigative Reporting Quick Start | Web Protection Solutions |v8.4.x, v8.5.x | 28-Feb-2018
Use investigative reports to analyze Internet activity in an interactive way.
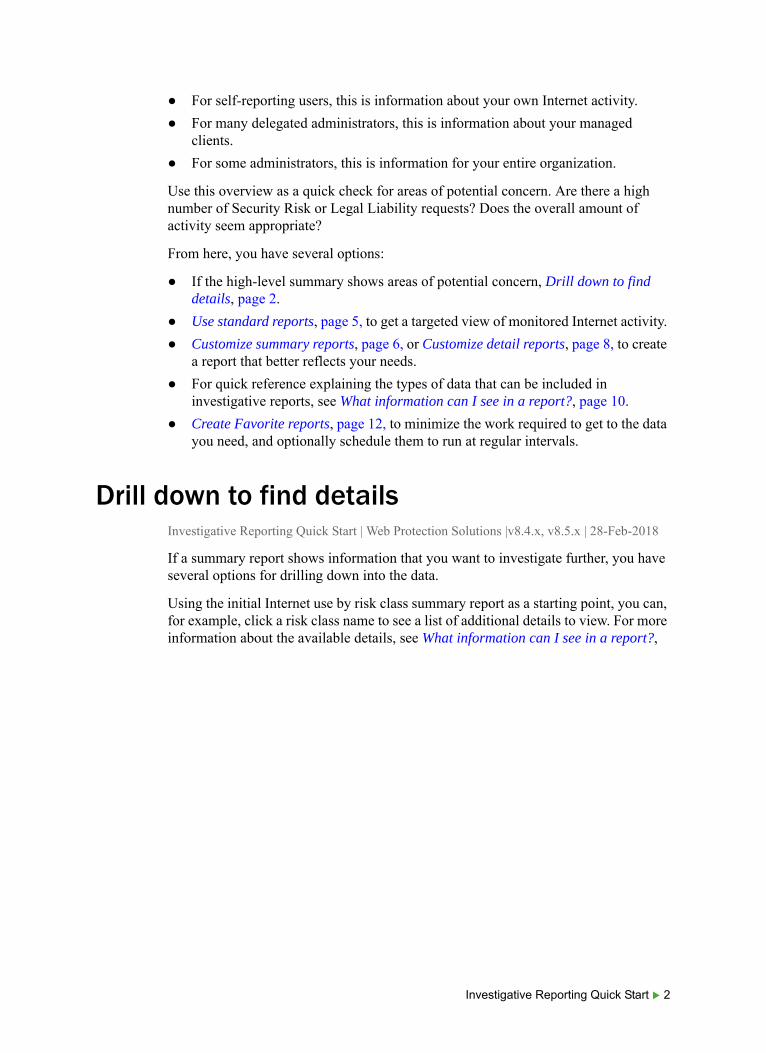
When you first open the Reporting > Investigative Reports page in the Web module of the Forcepoint Security Manager, a high-level summary report is displayed.
By default, this initial view shows activity:
1. Grouped by risk class
Risk classes are groupings of categories used to suggest possible types or levels of vulnerability posed by sites in those categories.
2. Recorded in the specified Log Database
3. That has occurred since midnight today
Only activity that you are authorized to see is displayed.
TipYou can click Options at the top of the page to change the default time period.
© 2018 Forcepoint
● For self-reporting users, this is information about your own Internet activity.
● For many delegated administrators, this is information about your managed clients.
● For some administrators, this is information for your entire organization.
Use this overview as a quick check for areas of potential concern. Are there a high number of Security Risk or Legal Liability requests? Does the overall amount of activity seem appropriate?
From here, you have several options:
● If the high-level summary shows areas of potential concern, Drill down to find details, page 2.
● Use standard reports, page 5, to get a targeted view of monitored Internet activity.
● Customize summary reports, page 6, or Customize detail reports, page 8, to create a report that better reflects your needs.
● For quick reference explaining the types of data that can be included in investigative reports, see What information can I see in a report?, page 10.
● Create Favorite reports, page 12, to minimize the work required to get to the data you need, and optionally schedule them to run at regular intervals.
Drill down to find detailsInvestigative Reporting Quick Start | Web Protection Solutions |v8.4.x, v8.5.x | 28-Feb-2018
If a summary report shows information that you want to investigate further, you have several options for drilling down into the data.
Using the initial Internet use by risk class summary report as a starting point, you can, for example, click a risk class name to see a list of additional details to view. For more information about the available details, see What information can I see in a report?,
Investigative Reporting Quick Start 2
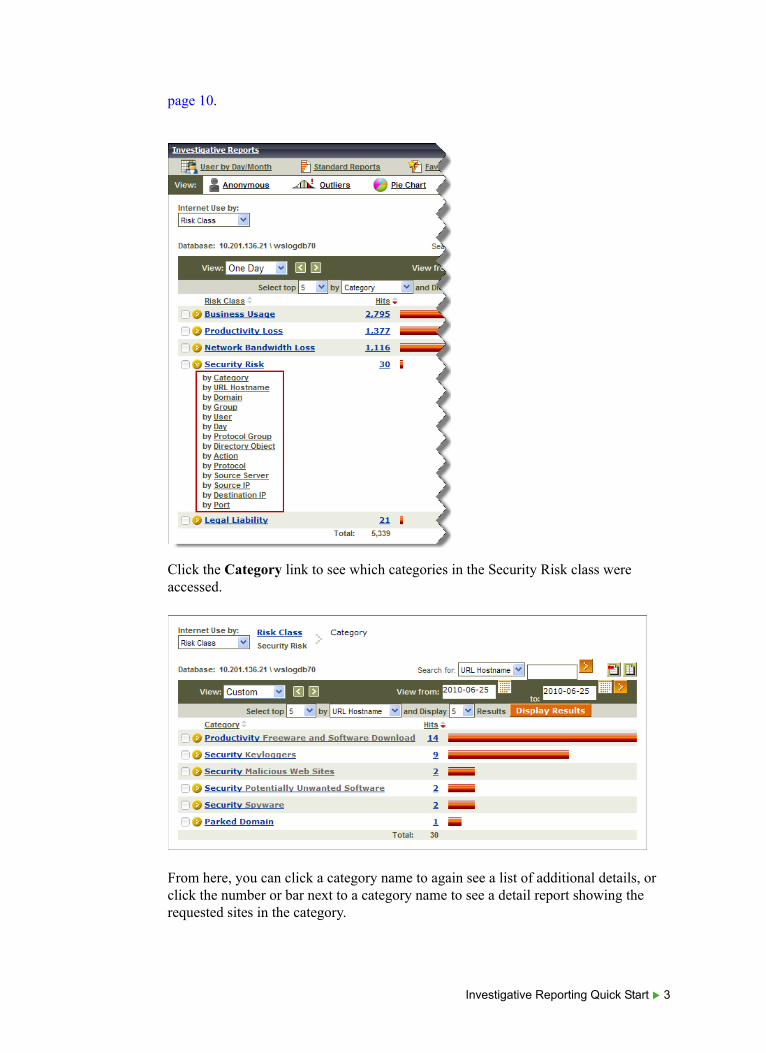
page 10.
Click the Category link to see which categories in the Security Risk class were accessed.
From here, you can click a category name to again see a list of additional details, or click the number or bar next to a category name to see a detail report showing the requested sites in the category.
Investigative Reporting Quick Start 3
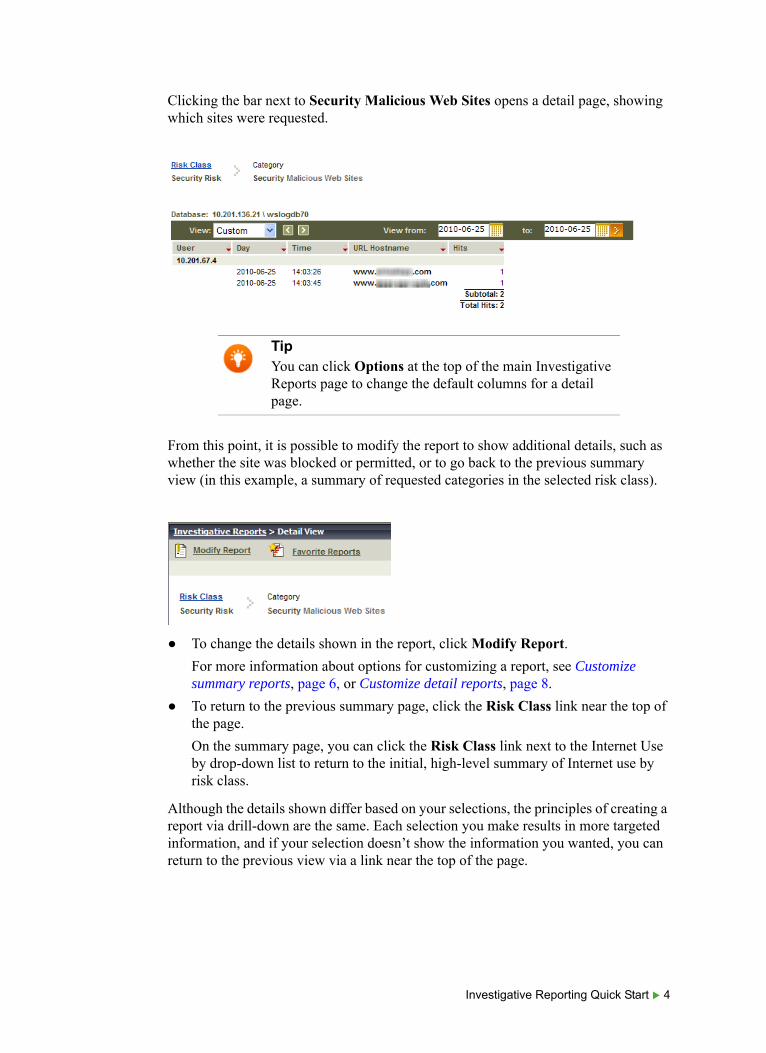
Clicking the bar next to Security Malicious Web Sites opens a detail page, showing which sites were requested.
From this point, it is possible to modify the report to show additional details, such as whether the site was blocked or permitted, or to go back to the previous summary view (in this example, a summary of requested categories in the selected risk class).
● To change the details shown in the report, click Modify Report.
For more information about options for customizing a report, see Customize summary reports, page 6, or Customize detail reports, page 8.
● To return to the previous summary page, click the Risk Class link near the top of the page.
On the summary page, you can click the Risk Class link next to the Internet Use by drop-down list to return to the initial, high-level summary of Internet use by risk class.
Although the details shown differ based on your selections, the principles of creating a report via drill-down are the same. Each selection you make results in more targeted information, and if your selection doesn’t show the information you wanted, you can return to the previous view via a link near the top of the page.
TipYou can click Options at the top of the main Investigative Reports page to change the default columns for a detail page.
Investigative Reporting Quick Start 4
Use standard reportsInvestigative Reporting Quick Start | Web Protection Solutions |v8.4.x, v8.5.x | 28-Feb-2018
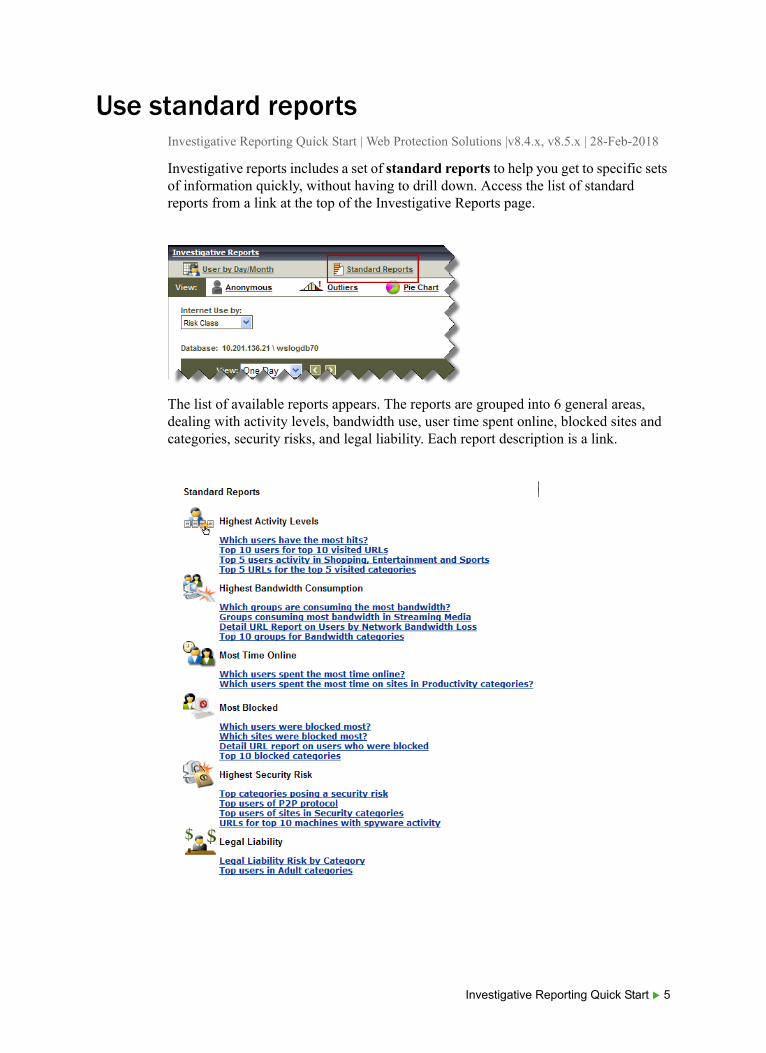
Investigative reports includes a set of standard reports to help you get to specific sets of information quickly, without having to drill down. Access the list of standard reports from a link at the top of the Investigative Reports page.
The list of available reports appears. The reports are grouped into 6 general areas, dealing with activity levels, bandwidth use, user time spent online, blocked sites and categories, security risks, and legal liability. Each report description is a link.
Investigative Reporting Quick Start 5
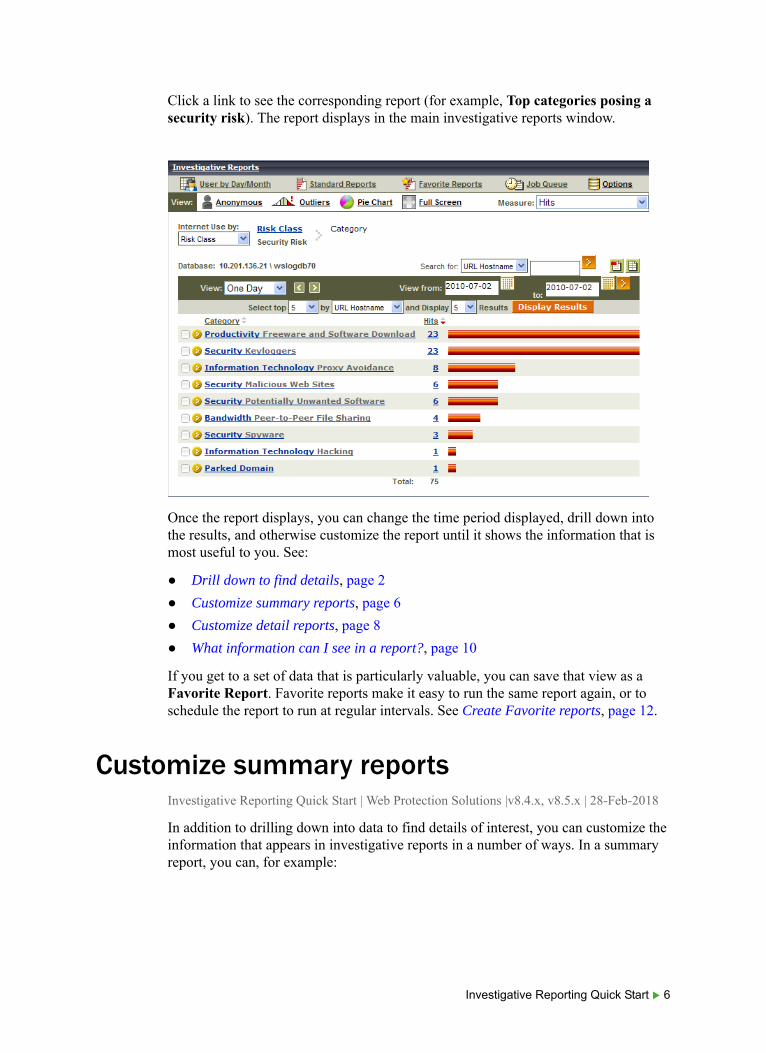
Click a link to see the corresponding report (for example, Top categories posing a security risk). The report displays in the main investigative reports window.
Once the report displays, you can change the time period displayed, drill down into the results, and otherwise customize the report until it shows the information that is most useful to you. See:
● Drill down to find details, page 2
● Customize summary reports, page 6
● Customize detail reports, page 8
● What information can I see in a report?, page 10
If you get to a set of data that is particularly valuable, you can save that view as a Favorite Report. Favorite reports make it easy to run the same report again, or to schedule the report to run at regular intervals. See Create Favorite reports, page 12.
Customize summary reportsInvestigative Reporting Quick Start | Web Protection Solutions |v8.4.x, v8.5.x | 28-Feb-2018
In addition to drilling down into data to find details of interest, you can customize the information that appears in investigative reports in a number of ways. In a summary report, you can, for example:
Investigative Reporting Quick Start 6
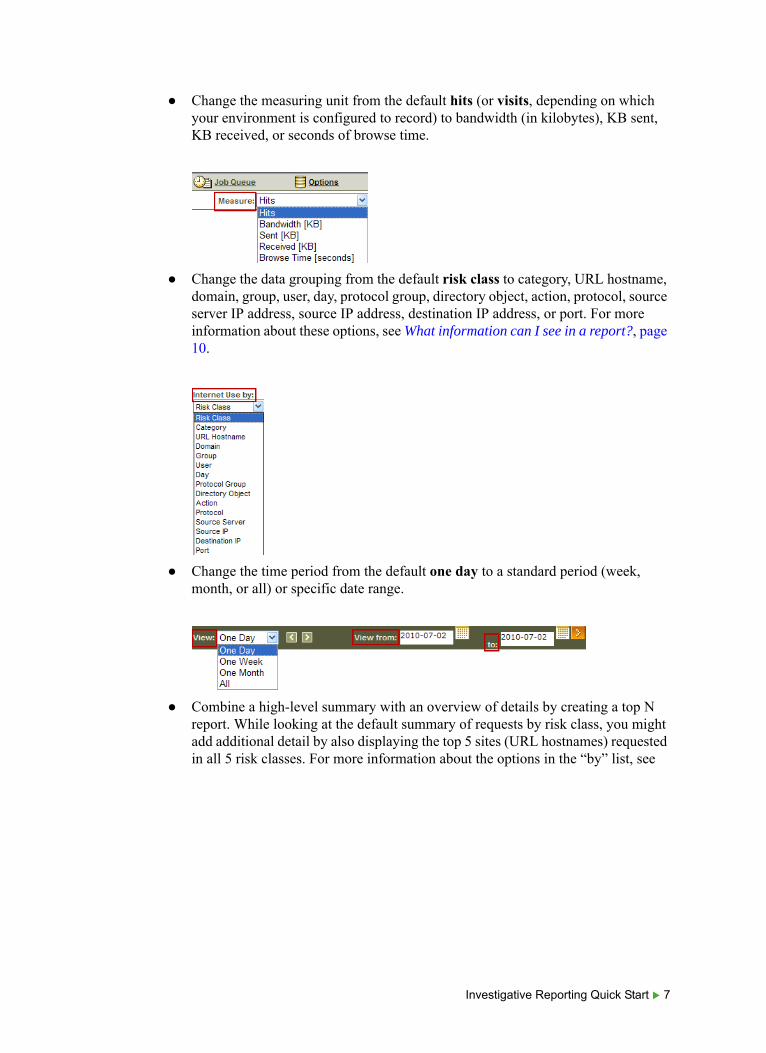
● Change the measuring unit from the default hits (or visits, depending on which your environment is configured to record) to bandwidth (in kilobytes), KB sent, KB received, or seconds of browse time.
● Change the data grouping from the default risk class to category, URL hostname, domain, group, user, day, protocol group, directory object, action, protocol, source server IP address, source IP address, destination IP address, or port. For more information about these options, see What information can I see in a report?, page 10.
● Change the time period from the default one day to a standard period (week, month, or all) or specific date range.
● Combine a high-level summary with an overview of details by creating a top N report. While looking at the default summary of requests by risk class, you might add additional detail by also displaying the top 5 sites (URL hostnames) requested in all 5 risk classes. For more information about the options in the “by” list, see
Investigative Reporting Quick Start 7
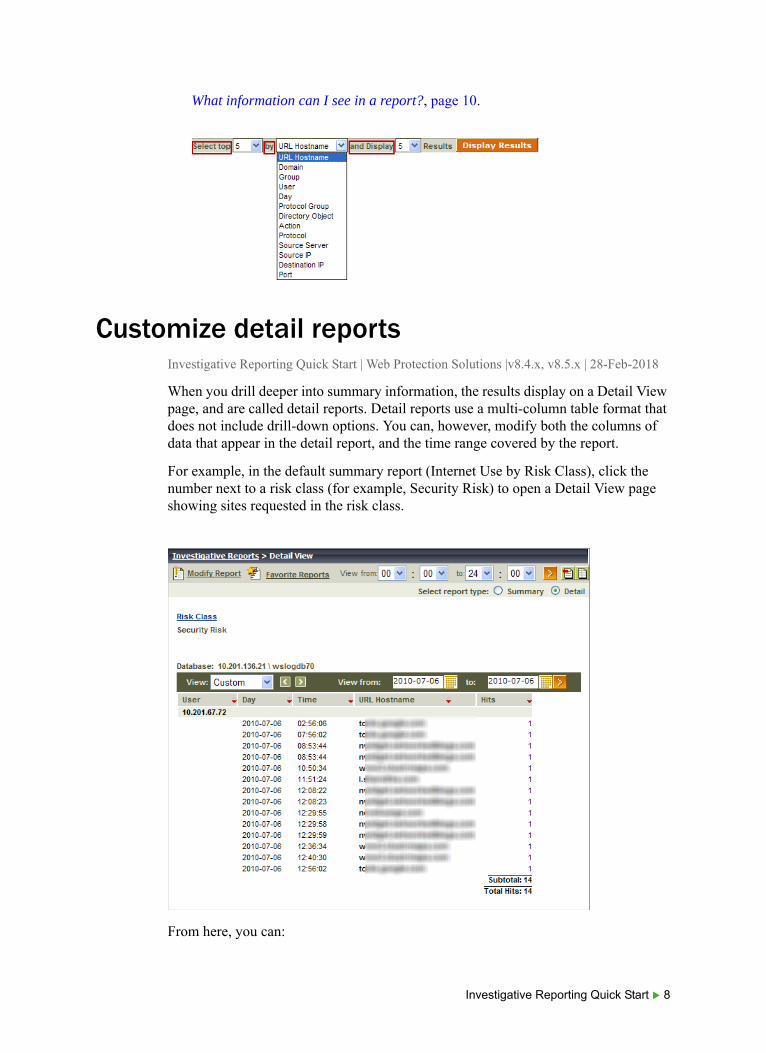
What information can I see in a report?, page 10.
Customize detail reportsInvestigative Reporting Quick Start | Web Protection Solutions |v8.4.x, v8.5.x | 28-Feb-2018
When you drill deeper into summary information, the results display on a Detail View page, and are called detail reports. Detail reports use a multi-column table format that does not include drill-down options. You can, however, modify both the columns of data that appear in the detail report, and the time range covered by the report.
For example, in the default summary report (Internet Use by Risk Class), click the number next to a risk class (for example, Security Risk) to open a Detail View page showing sites requested in the risk class.
From here, you can:
Investigative Reporting Quick Start 8
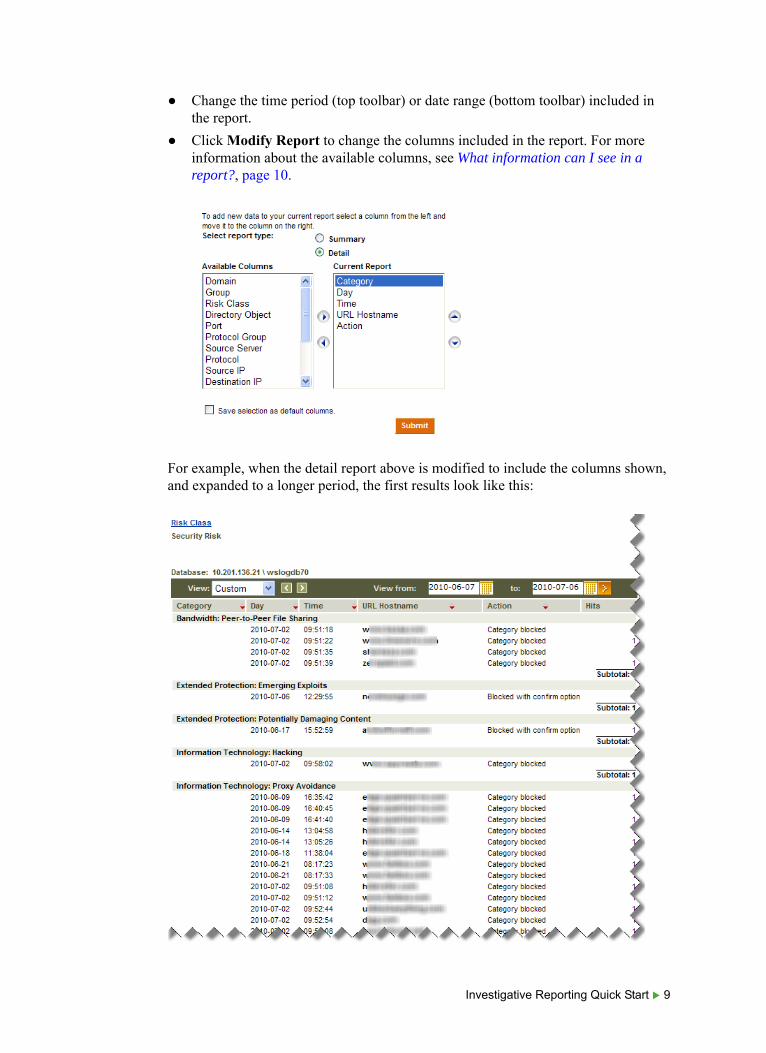
● Change the time period (top toolbar) or date range (bottom toolbar) included in the report.
● Click Modify Report to change the columns included in the report. For more information about the available columns, see What information can I see in a report?, page 10.
For example, when the detail report above is modified to include the columns shown, and expanded to a longer period, the first results look like this:
Investigative Reporting Quick Start 9
Once you have created a report that includes all of the data that you want to see, you can save the report as a Favorite so that you can easily run the report again later, or schedule the report to run later, or at regular intervals. See Create Favorite reports, page 12.
What information can I see in a report?Investigative Reporting Quick Start | Web Protection Solutions |v8.4.x, v8.5.x | 28-Feb-2018
When you customize an investigative report (see Customize summary reports, page 6, or Customize detail reports, page 8), the information that you can select for display depends on what elements are already selected. If you are looking at requests by user, for example, you cannot add group information. Likewise, if you are looking at a report by category, you cannot simultaneously view risk class data.
Some of the available information depends on how your web protection software is deployed. If your environment does not include User Service, for example, the user, group, domain, and directory object options will not appear in any selection list. Likewise, if your environment does not include Content Gateway or Network Agent, bandwidth information cannot be displayed.
In addition, the reporting permissions granted to your account can determine what information is available. User-identifying information may not be available to all reporting administrators.
The table below lists all types of data that can be displayed in an investigative report. If you have drilled down into the data to create a detail report, these are the columns that you can add to the report to create a custom view of the data.
Column Name Description
User Name of the user who made the request. User information must be available in the Log Database to include it on reports. Group information is not available in user-based reports.
Day Date the Internet request was made.
URL Hostname Domain (host) name of the requested site.
Domain Directory service domain for the directory-based client (user or group, domain, or organizational unit) that made the request.
Group Name of the group to which the requestor belongs. Individual user names are not given on group-based reports. If the user who requested the site belongs to more than one group in the directory service, the report lists multiple groups in this column.
Risk Class Risk class associated with the category to which the requested site belongs. If the category is in multiple risk classes, all relevant risk classes are listed.
Investigative Reporting Quick Start 10
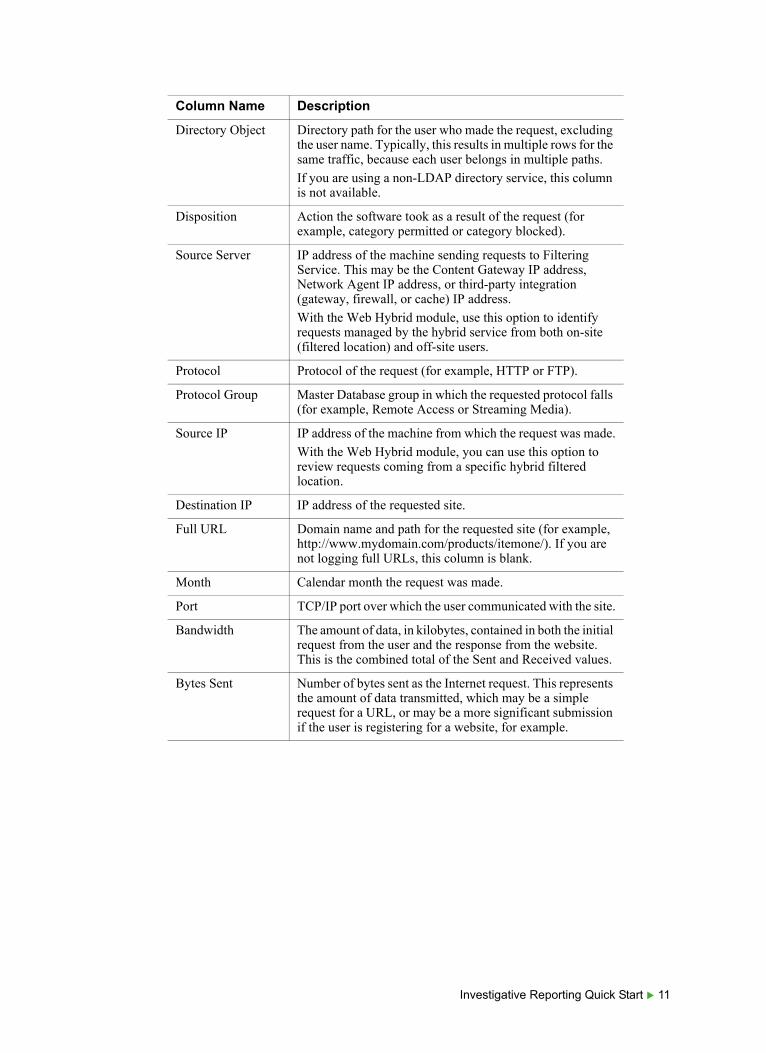
Directory Object Directory path for the user who made the request, excluding the user name. Typically, this results in multiple rows for the same traffic, because each user belongs in multiple paths.
If you are using a non-LDAP directory service, this column is not available.
Disposition Action the software took as a result of the request (for example, category permitted or category blocked).
Source Server IP address of the machine sending requests to Filtering Service. This may be the Content Gateway IP address, Network Agent IP address, or third-party integration (gateway, firewall, or cache) IP address.
With the Web Hybrid module, use this option to identify requests managed by the hybrid service from both on-site (filtered location) and off-site users.
Protocol Protocol of the request (for example, HTTP or FTP).
Protocol Group Master Database group in which the requested protocol falls (for example, Remote Access or Streaming Media).
Source IP IP address of the machine from which the request was made.
With the Web Hybrid module, you can use this option to review requests coming from a specific hybrid filtered location.
Destination IP IP address of the requested site.
Full URL Domain name and path for the requested site (for example, http://www.mydomain.com/products/itemone/). If you are not logging full URLs, this column is blank.
Month Calendar month the request was made.
Port TCP/IP port over which the user communicated with the site.
Bandwidth The amount of data, in kilobytes, contained in both the initial request from the user and the response from the website. This is the combined total of the Sent and Received values.
Bytes Sent Number of bytes sent as the Internet request. This represents the amount of data transmitted, which may be a simple request for a URL, or may be a more significant submission if the user is registering for a website, for example.
Column Name Description
Investigative Reporting Quick Start 11
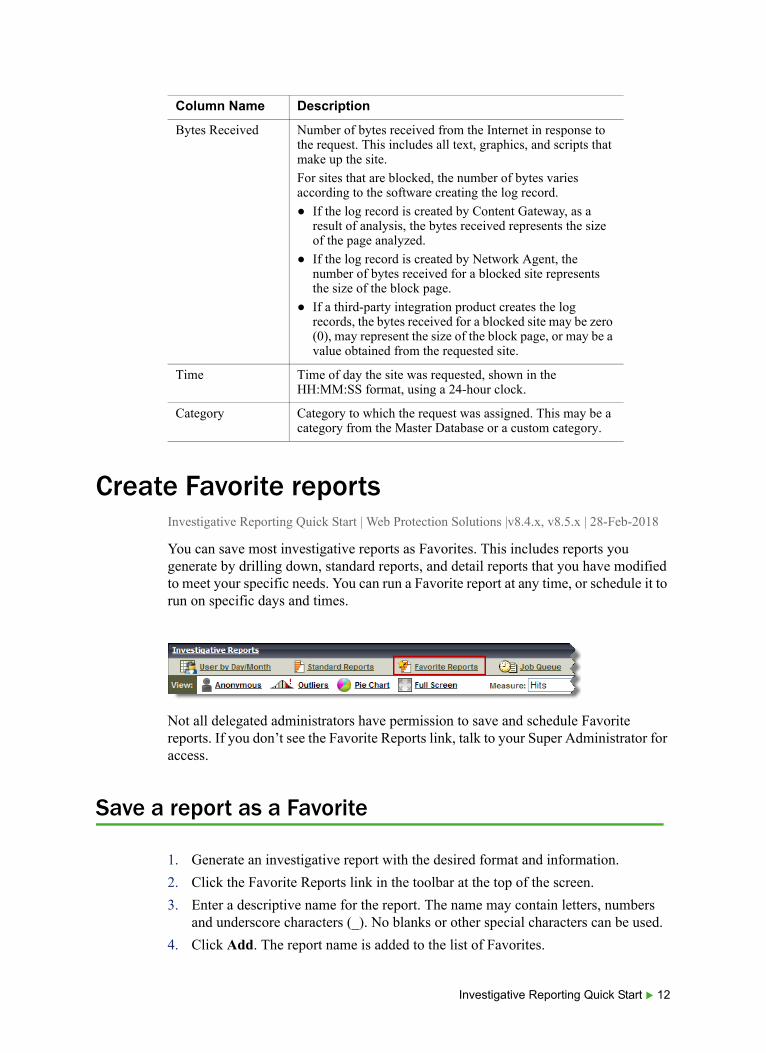
Create Favorite reportsInvestigative Reporting Quick Start | Web Protection Solutions |v8.4.x, v8.5.x | 28-Feb-2018
You can save most investigative reports as Favorites. This includes reports you generate by drilling down, standard reports, and detail reports that you have modified to meet your specific needs. You can run a Favorite report at any time, or schedule it to run on specific days and times.
Not all delegated administrators have permission to save and schedule Favorite reports. If you don’t see the Favorite Reports link, talk to your Super Administrator for access.
Save a report as a Favorite
1. Generate an investigative report with the desired format and information.
2. Click the Favorite Reports link in the toolbar at the top of the screen.
3. Enter a descriptive name for the report. The name may contain letters, numbers and underscore characters (_). No blanks or other special characters can be used.
4. Click Add. The report name is added to the list of Favorites.
Bytes Received Number of bytes received from the Internet in response to the request. This includes all text, graphics, and scripts that make up the site.
For sites that are blocked, the number of bytes varies according to the software creating the log record.
● If the log record is created by Content Gateway, as a result of analysis, the bytes received represents the size of the page analyzed.
● If the log record is created by Network Agent, the number of bytes received for a blocked site represents the size of the block page.
● If a third-party integration product creates the log records, the bytes received for a blocked site may be zero (0), may represent the size of the block page, or may be a value obtained from the requested site.
Time Time of day the site was requested, shown in the HH:MM:SS format, using a 24-hour clock.
Category Category to which the request was assigned. This may be a category from the Master Database or a custom category.
Column Name Description
Investigative Reporting Quick Start 12
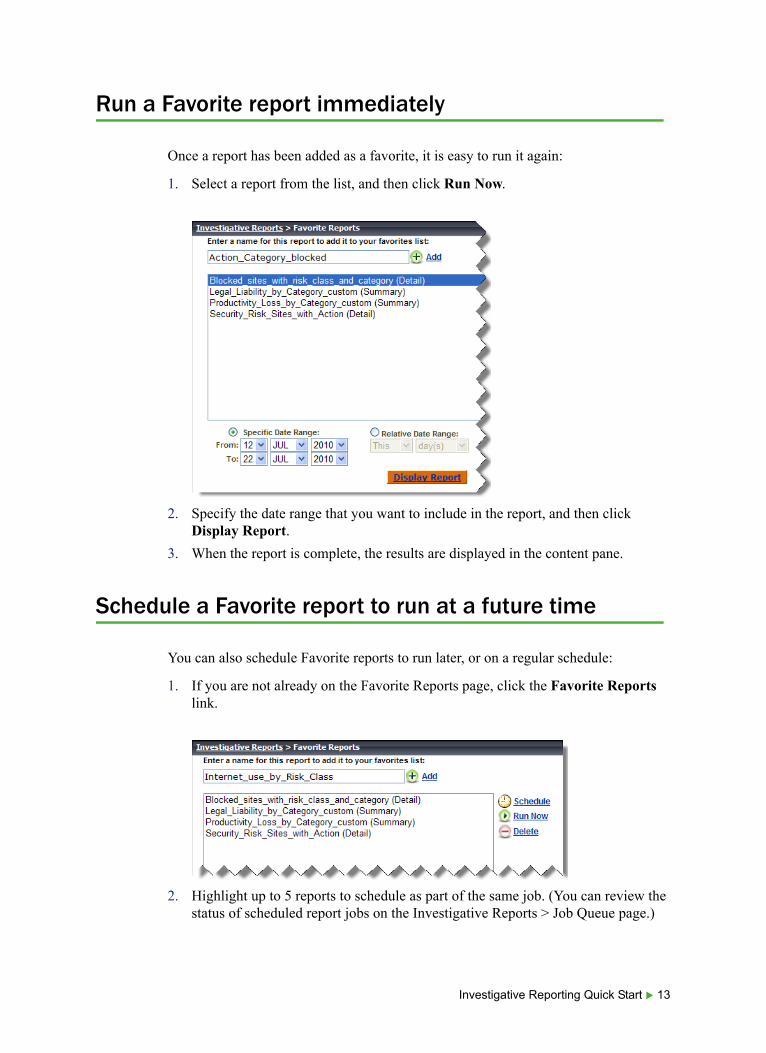
Run a Favorite report immediately
Once a report has been added as a favorite, it is easy to run it again:
1. Select a report from the list, and then click Run Now.
2. Specify the date range that you want to include in the report, and then click Display Report.
3. When the report is complete, the results are displayed in the content pane.
Schedule a Favorite report to run at a future time
You can also schedule Favorite reports to run later, or on a regular schedule:
1. If you are not already on the Favorite Reports page, click the Favorite Reports link.
2. Highlight up to 5 reports to schedule as part of the same job. (You can review the status of scheduled report jobs on the Investigative Reports > Job Queue page.)
Investigative Reporting Quick Start 13
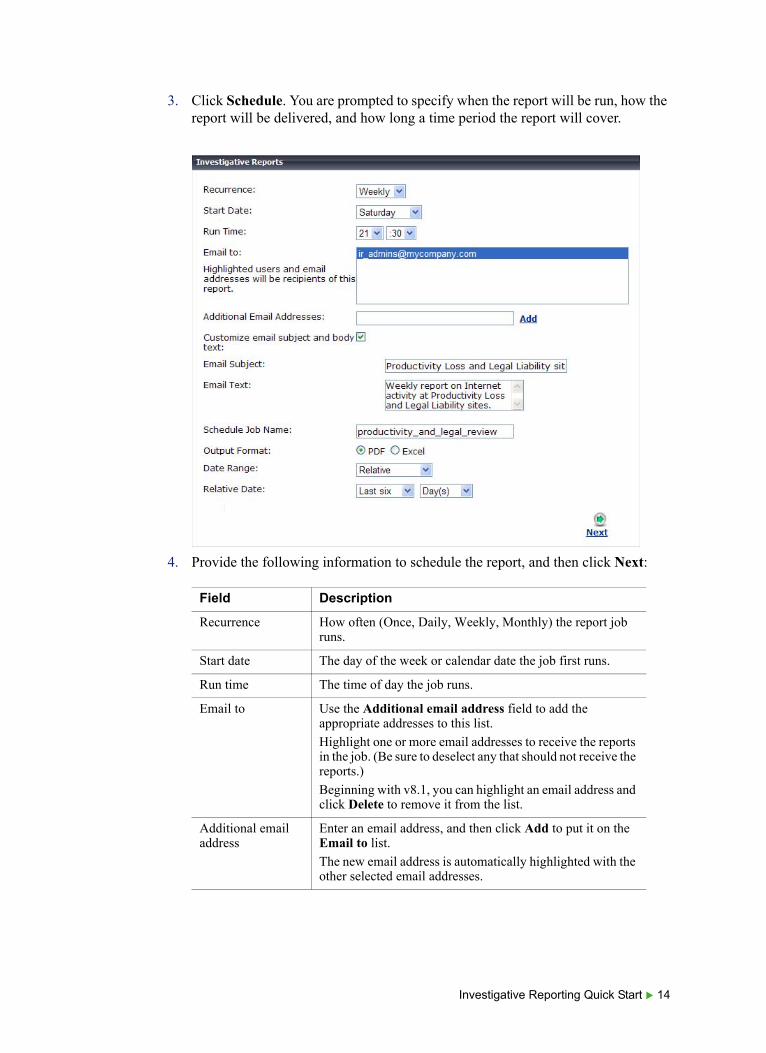
3. Click Schedule. You are prompted to specify when the report will be run, how the report will be delivered, and how long a time period the report will cover.
4. Provide the following information to schedule the report, and then click Next:
Field Description
Recurrence How often (Once, Daily, Weekly, Monthly) the report job runs.
Start date The day of the week or calendar date the job first runs.
Run time The time of day the job runs.
Email to Use the Additional email address field to add the appropriate addresses to this list.
Highlight one or more email addresses to receive the reports in the job. (Be sure to deselect any that should not receive the reports.)
Beginning with v8.1, you can highlight an email address and click Delete to remove it from the list.
Additional email address
Enter an email address, and then click Add to put it on the Email to list.
The new email address is automatically highlighted with the other selected email addresses.
Investigative Reporting Quick Start 14
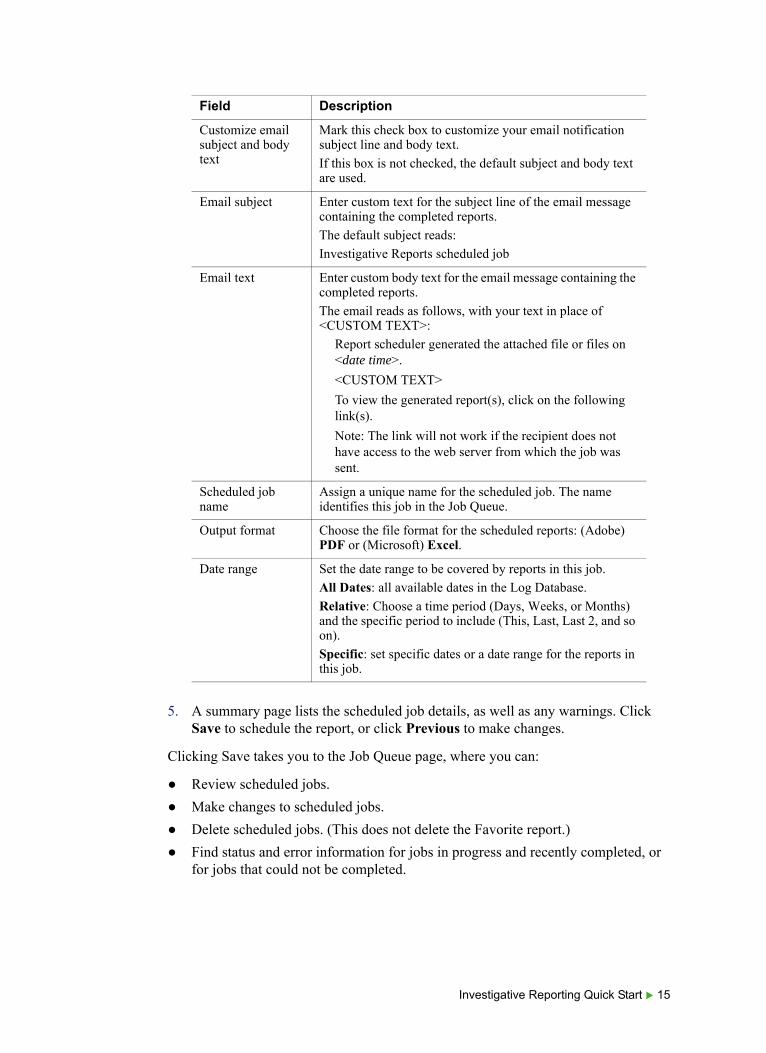
5. A summary page lists the scheduled job details, as well as any warnings. Click Save to schedule the report, or click Previous to make changes.
Clicking Save takes you to the Job Queue page, where you can:
● Review scheduled jobs.
● Make changes to scheduled jobs.
● Delete scheduled jobs. (This does not delete the Favorite report.)
● Find status and error information for jobs in progress and recently completed, or for jobs that could not be completed.
Customize email subject and body text
Mark this check box to customize your email notification subject line and body text.
If this box is not checked, the default subject and body text are used.
Email subject Enter custom text for the subject line of the email message containing the completed reports.
The default subject reads:
Investigative Reports scheduled job
Email text Enter custom body text for the email message containing the completed reports.
The email reads as follows, with your text in place of <CUSTOM TEXT>:
Report scheduler generated the attached file or files on <date time>.
<CUSTOM TEXT>
To view the generated report(s), click on the following link(s).
Note: The link will not work if the recipient does not have access to the web server from which the job was sent.
Scheduled job name
Assign a unique name for the scheduled job. The name identifies this job in the Job Queue.
Output format Choose the file format for the scheduled reports: (Adobe) PDF or (Microsoft) Excel.
Date range Set the date range to be covered by reports in this job.
All Dates: all available dates in the Log Database.
Relative: Choose a time period (Days, Weeks, or Months) and the specific period to include (This, Last, Last 2, and so on).
Specific: set specific dates or a date range for the reports in this job.
Field Description
Investigative Reporting Quick Start 15
The Job Queue page can also be accessed from most investigative reports pages.
When a scheduled report is run, the completed report is saved in the following directory:
<install_path>\webroot\Explorer\Other\
By default, the <install_path> is C:\Program Files (x86)\Websense\Web Security\bin.
©2018 Forcepoint. Forcepoint and the FORCEPOINT logo are trademarks of Forcepoint. Raytheon is a registered trademark of Raytheon Company. All other trademarks used in this document are the property of their respective owners.
Tips
● Recipients must have read access to the report directory to open the report.
● All reports saved from a repeating job use the same file name. If you want to save files for longer than a single cycle, be sure to change the file name or copy the file to another location.
● Depending on the size and number of reports scheduled, the Explorer directory could become very large. Super Administrators should clear the directory periodically, eliminating unneeded report files.
Investigative Reporting Quick Start 16