Embed Size (px)
Citation preview
ACOUSTICS – VIBRATION – AIR QUALITY – TRAFFIC IMPACT ASSESSMENTS – FORENSIC ENGINEERING EXPERT WITNESS – ENVIRONMENTAL ASSESSMENTS AND COMPLIANCE
Scientific, Environmental, and Forensic Consultants INVESTIGATIVE SCIENCE AND ENGINEERING, INC.
SAN DIEGO CORPORATE OFFICE 16486 Bernardo Center Drive, #278
San Diego, CA 92128 Phone: 858-451-3505
Fax: 858-487-0096 www.ise.us
The leader in acoustics and vibration…
May 10, 2007 (Revised) Mr. David DeMoranville D.R. Horton Inc. 5927 Priestly Drive, Suite 200 Carlsbad, CA 92008 RE: ACOUSTICAL SITE ASSESSMENT LAGO DE SAN MARCOS – SAN DIEGO CA ISE PROJECT #06-056 Dear Mr. DeMoranville: At your request, Investigative Science and Engineering (ISE) were directed to investigate potential noise impacts to the proposed Lago de San Marcos (TM 5388) project located in San Diego, California. The results of that survey, as well as predicted future sound levels at the site, are presented in this letter report.
INTRODUCTION AND DEFINITIONS Existing Site Characterization The project site consists of 1.97 acres located in the northern portion of the County of San Diego, California. The project site is located approximately southeast of Rancho Santa Fe Road and south of Lake San Marcos Drive. San Marcos Blvd provides regional access to the project area via State Route 78 (SR-78) to the east (refer to Figure 1 on the following page).
The project site currently resides as undeveloped open space with no existing
residential structure onsite. Elevations across the entire property range from approximately 584 to 621 feet above mean sea level (MSL). A project site map is shown below in Figure 2 on Page 3.
Project Description
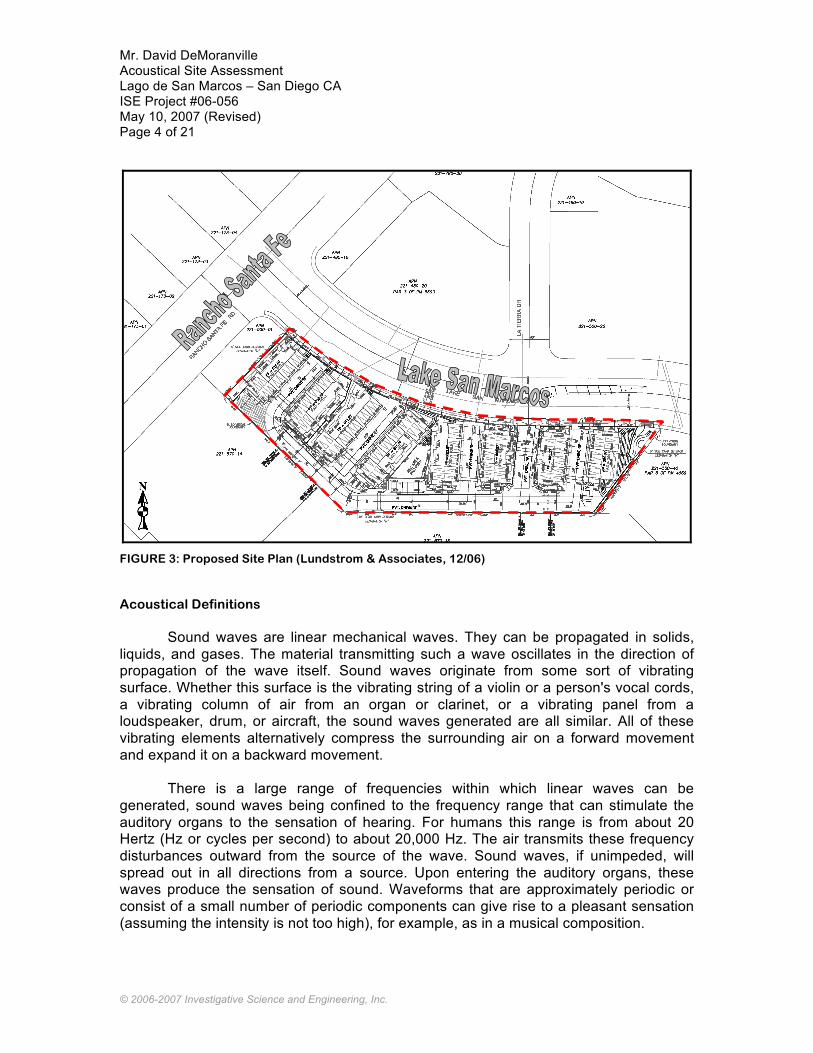
The proposed development plan calls for the construction of multi-family residences on the Tentative Map 5388 consisting of eight building structures. The proposed site development plan can be seen in Figure 3 on Page 4 of this report.

Mr. David DeMoranville Acoustical Site Assessment Lago de San Marcos – San Diego CA ISE Project #06-056 May 10, 2007 (Revised) Page 2 of 21
© 2006-2007 Investigative Science and Engineering, Inc.
FIGURE 1: Project Vicinity Map – Lago de San Marcos (ISE 8/06)
PROJECT SITE

Mr. David DeMoranville Acoustical Site Assessment Lago de San Marcos – San Diego CA ISE Project #06-056 May 10, 2007 (Revised) Page 3 of 21
© 2006-2007 Investigative Science and Engineering, Inc.
FIGURE 2: Project Site Map – Lago de San Marcos (ISE 5/06)
PROJECT SITE
Mr. David DeMoranville Acoustical Site Assessment Lago de San Marcos – San Diego CA ISE Project #06-056 May 10, 2007 (Revised) Page 4 of 21
© 2006-2007 Investigative Science and Engineering, Inc.
FIGURE 3: Proposed Site Plan (Lundstrom & Associates, 12/06) Acoustical Definitions Sound waves are linear mechanical waves. They can be propagated in solids, liquids, and gases. The material transmitting such a wave oscillates in the direction of propagation of the wave itself. Sound waves originate from some sort of vibrating surface. Whether this surface is the vibrating string of a violin or a person's vocal cords, a vibrating column of air from an organ or clarinet, or a vibrating panel from a loudspeaker, drum, or aircraft, the sound waves generated are all similar. All of these vibrating elements alternatively compress the surrounding air on a forward movement and expand it on a backward movement.
There is a large range of frequencies within which linear waves can be
generated, sound waves being confined to the frequency range that can stimulate the auditory organs to the sensation of hearing. For humans this range is from about 20 Hertz (Hz or cycles per second) to about 20,000 Hz. The air transmits these frequency disturbances outward from the source of the wave. Sound waves, if unimpeded, will spread out in all directions from a source. Upon entering the auditory organs, these waves produce the sensation of sound. Waveforms that are approximately periodic or consist of a small number of periodic components can give rise to a pleasant sensation (assuming the intensity is not too high), for example, as in a musical composition.

Mr. David DeMoranville Acoustical Site Assessment Lago de San Marcos – San Diego CA ISE Project #06-056 May 10, 2007 (Revised) Page 5 of 21
© 2006-2007 Investigative Science and Engineering, Inc.
Noise, on the other hand, can be represented as a superposition of periodic waves with a large number of components and is generally defined as unwanted or annoying sound that is typically associated with human activity and which interferes with or disrupts normal activities. Although exposure to high noise levels has been demonstrated to cause hearing loss, the principal human response to environmental noise is annoyance. The response of individuals to similar noise events is diverse and influenced by the type of noise, the perceived importance of the noise and its appropriateness in the setting, the time of day, and the sensitivity of the individual hearing the sound. Airborne sound is a rapid fluctuation of air pressure above and below atmospheric levels. The loudest sounds the human ear can hear conformably are approximately one trillion times the acoustic energy that the ear can barely detect. Because of this vast range, any attempt to represent the acoustic intensity of a particular sound on a linear scale becomes unwieldy. As a result, a logarithmic ratio originally conceived for radio work known as the decibel (dB) is commonly employed. A sound level of zero “0” dB is scaled such that it is defined as the threshold of human hearing and would be barely audible to a human of normal hearing under extremely quiet listening conditions. Such conditions can only be generated in anechoic or “dead rooms”. Typically, the quietest environmental conditions (extreme rural areas with extensive shielding) yield sound levels of approximately 20 decibels. Normal speech has a sound level of approximately 60 dB. Sound levels above 120 dB roughly correspond to the threshold of pain.
The minimum change in sound level that the human ear can detect is approximately 3 dB. A change in sound level of 10 dB is usually perceived by the average person as a doubling (or halving) of the sounds loudness. A change in sound level of 10 dB actually represents an approximately 90 percent change in the sound intensity, but only about a 50 percent change in the perceived loudness. This is due to the nonlinear response of the human ear to sound. As mentioned above, most of the sounds we hear in the environment do not consist of a single frequency, but rather a broad band of frequencies differing in sound level. The intensities of each frequency add to generate the sound we hear. The method commonly used to quantify environmental sounds consists of determining all of the frequencies of a sound according to a weighting system that reflects the nonlinear response characteristics of the human ear. This is called "A" weighting, and the decibel level measured is called the A-weighted sound level (or dBA). In practice, the level of a noise source is conveniently measured using a sound level meter that includes a filter corresponding to the dBA curve.
Although the A-weighted sound level may adequately indicate the level of
environmental noise at any instant in time, community noise levels vary continuously. Most environmental noise includes a conglomeration of sounds from distant sources that create a relatively steady background noise in which no particular source is identifiable.

Mr. David DeMoranville Acoustical Site Assessment Lago de San Marcos – San Diego CA ISE Project #06-056 May 10, 2007 (Revised) Page 6 of 21
© 2006-2007 Investigative Science and Engineering, Inc.
For this type of noise, a single descriptor called the Leq (or equivalent sound level) is used. Leq is the energy-mean A-weighted sound level during a measured time interval. It is the ‘equivalent’ constant sound level that would have to be produced by a given source to equal the average of the fluctuating level measured. For most acoustical studies, the monitoring interval is generally taken as one-hour and is abbreviated Leq-h.
To describe the time-varying character of environmental noise, the statistical
noise descriptors L10, L50, and L90 are commonly used. They are the noise levels equaled or exceeded during 10 percent, 50 percent, and 90 percent of a stated time. Sound levels associated with the L10 typically describe transient or short-term events, while levels associated with the L90 describe the steady state (or most prevalent) noise conditions. In addition, it is often desirable to know the acoustic range of the noise source being measured. This is accomplished through the maximum and minimum measured sound level (Lmax and Lmin) indicators. The Lmin value obtained for a particular monitoring location is often called the acoustic floor for that location.
Finally, another sound measure employed by the State of California and the
County of San Diego is known as the Community Noise Equivalence Level (CNEL) is defined as the “A” weighted average sound level for a 24-hour day. It is calculated by adding a 5-decibel penalty to sound levels in the evening (7:00 p.m. to 10:00 p.m.), and a 10-decibel penalty to sound levels in the night (10:00 p.m. to 7:00 a.m.) to compensate for the increased sensitivity to noise during the quieter evening and nighttime hours.
APPLICABLE SIGNIFICANCE CRITERIA Vehicular/Transportation Noise Impact Thresholds
Transportation noise levels in the County of San Diego are governed under Policy 4b of the Noise Element of the County’s General Plan. Exterior noise standards are typically applied to areas within a proposed development that would be classified as “usable exterior space”, such as rear and some side yards. The relevant sections of the Noise Element are cited below.
1. Whenever possible, development in San Diego County should be planned and constructed so
that noise sensitive areas are not subject to noise levels in excess if 55 dBA CNEL.
2. Whenever it appears that new development will result in any (existing or future) noise sensitive areas being subjected to noise levels in excess of 60 dBA CNEL or greater, an acoustical study should be required.
3. If the acoustical study shows that noise levels at any noise sensitive areas will exceed 60 dBA CNEL, the development should not be approved unless the following findings are made:
a. Modifications to the development have been or will be made which reduce the exterior noise level below 60 dBA CNEL; or,
b. If, with the current noise abatement technology, it is infeasible to reduce the exterior CNEL to 60 dBA, then modifications to the development will be made which reduce interior noise below a CNEL equal to 45 dBA. Particular attention shall be given to noise sensitive interior spaces such as bedrooms; and,

Mr. David DeMoranville Acoustical Site Assessment Lago de San Marcos – San Diego CA ISE Project #06-056 May 10, 2007 (Revised) Page 7 of 21
© 2006-2007 Investigative Science and Engineering, Inc.
c. If finding ‘b’ above is made, a further finding will be made that there are specifically identified overriding social or economic considerations which warrant approval of the development without modifications as described in ‘a’ above.
4. If the acoustical study shows that the noise levels at any noise sensitive areas will exceed 75 dBA CNEL; the development should not be approved.
5. Interior noise levels should not exceed 45 dBA CNEL within any habitable living space of any residential unit.
Operational Noise Standards
The San Diego County Noise Ordinance Section 36.404 governs fixed source
and/or operational noise. The applicable sound levels are a function of the time of day and the land use zone. Sound levels are measured at the boundary of the property containing the noise source. The relevant limits are given below in Table 1.
The proposed Lago De San Marcos residential development is zoned Multi-
Family Residential. The standard for this zoning would be a one-hour average sound level of 50 dBA between the hours of 7 am and 10 pm and a one-hour average sound level of 45 dBA between the hours of 10 pm and 7 am. Adjacent land use to the south and north are zoned RS-7 Residential Suburban would have the same applicable noise standard. Adjacent land use to the southeast are zoned C-31 commercial that allows a one-hour average sound level of 55 dBA between the hours of 7 am and 10 pm and a one-hour average sound level of 50 dBA between the hours of 10 pm and 7 am. TABLE 1: County of San Diego Noise Ordinance Limits
Land Use Zone Time of Day 1-Hour Average Sound Level (dBA Leq)
R-S, R-D, R-R, R-MH, A-70, A-72, S-80, S-81, S-87, S-88, S-90, S-92, R-V, and R-U
7 a.m. to 10 p.m. 10 p.m. to 7 a.m.
50 45
R-R0, R-C, R-M, C-30, and S-86 7 a.m. to 10 p.m. 10 p.m. to 7 a.m.
55 50
S-94 and other commercial zones 7 a.m. to 10 p.m. 10 p.m. to 7 a.m.
60 55
M-50, M-52, and M-54 any time 70
S-82 and M-58 any time 70
Source: County of San Diego Noise Ordinance Section 36.404, 1981.
State of California CCR Title 24 Interior Noise Requirements
The California Code of Regulations (CCR), Title 24, Noise Insulation Standards, states that multi-family dwellings, hotels, and motels located where the CNEL exceeds 60 dBA, must obtain an acoustical analysis showing that the proposed design will limit

Mr. David DeMoranville Acoustical Site Assessment Lago de San Marcos – San Diego CA ISE Project #06-056 May 10, 2007 (Revised) Page 8 of 21
© 2006-2007 Investigative Science and Engineering, Inc.
interior noise to less than 45 dBA CNEL. Interior noise standards are typically applied to sensitive areas within the structure where low noise levels are desirable (such as living rooms, dining rooms, bedrooms, and dens or studies).
Worst-case noise levels, either existing or future, must be used for this
determination. Future noise levels must be predicted at least ten years from the time of building permit application. The County of San Diego has adopted the CCR Title 24 standards through the implementation of Policy 4b above, although for the purposes of environmental analysis, utilizes the interior threshold (above) from the Noise Element of the General Plan. Thus, for the purposes of analysis, the applicable exterior noise design threshold is 60 dBA CNEL. The applicable interior noise standard is 45 dBA CNEL.
ANALYSIS METHODOLOGY
Existing Conditions Field Survey
A Quest Model 2900 ANSI Type 2 integrating sound level meter was used as the data collection device. The equipment was mounted to a post six-feet in height directly within the proposed pad for building 1. This area was deemed to be a representative worst-case location for traffic noise impact determination. Onsite traffic volumes were collected with the IRD Traffic A.C.E (Automatic Counting Equipment) on both Rancho Santa Fe Road and Lake San Marcos Drive adjacent to the site. The noise and traffic monitoring setups are shown in Figures 4a through -e on Page 8 of this report.
The meter was placed on the western portion of the site 125 feet from Rancho
Santa Fe Road and 75 feet from Lake San Marcos Drive (refer to Monitoring Location ML 1 in Figure 4 on the following page) and the traffic volume counters north of the property on Rancho Santa Fe Road and Lake San Marcos Drive (refer to TL 1 and TL 2 in Figure 4). This was done in order to obtain an estimate of the worst-case existing onsite noise and traffic volumes during normal traffic conditions. All monitoring sites were spatially logged using a geographic positioning system (GPS).
The measurements were collected from 7/20/06 to 7/26/06. All equipment was
calibrated before testing at ISE’s acoustics and vibration laboratory to verify conformance with ANSI S1-4 1983 Type 2 and IEC 651 Type 2 standards. Traffic Noise Impact Assessment Approach
The Traffic Noise Model version 2.5 (TNM 2.5) (based on FHWA RD-77-108 and FHWA/CA/TL-87/03 standards) was used to calculate future onsite vehicular traffic noise levels. These components are supported by a scientifically founded and experimentally calibrated acoustic computation methodology. The database is made up of over 6000 individual pass-by events measured at forty sites across the country. Currently TNM 2.5 is the only accepted noise modeling program by Caltrans.

Mr. David DeMoranville Acoustical Site Assessment Lago de San Marcos – San Diego CA ISE Project #06-056 May 10, 2007 (Revised) Page 9 of 21
© 2006-2007 Investigative Science and Engineering, Inc.
FIGURE 4a-c: Ambient Monitoring Locations – Lago de San Marcos (ISE 8/06)
Receptor elevations were considered five feet above the appropriate floor (pad) elevation and were taken at the façades of each of the proposed buildings. Second floor receptor areas were modeled at 15 feet above the respective pad elevation. Second floor balconies were also modeled utilizing a sit down height of 13 feet above the respective pad elevation. The receptor locations can be seen in Figure 5a-b on the following page.
TL 1 TL 2
TL 2
TL 1 ML 1

Mr. David DeMoranville Acoustical Site Assessment Lago de San Marcos – San Diego CA ISE Project #06-056 May 10, 2007 (Revised) Page 10 of 21
© 2006-2007 Investigative Science and Engineering, Inc.
FIGURE 5a: Modeled Receptor Locations - Facades (ISE 4/07)
1
10
2 3
4
5
6
7 8 9 11
12
Modeled Receptor Locations #
13

Mr. David DeMoranville Acoustical Site Assessment Lago de San Marcos – San Diego CA ISE Project #06-056 May 10, 2007 (Revised) Page 11 of 21
© 2006-2007 Investigative Science and Engineering, Inc.
FIGURE 5b: Modeled Receptor Locations – Open Patio Locations (ISE 4/07) Input to the acoustical model includes the following:
o A digitized representation of all major roadways (i.e., Rancho Santa Fe Rd & Lake
San Marcos Drive). o Future Average Daily Trips (ADTs) for nearby major roadways (Source: Traffic
Impact Study TM 5388, 12/06). o An 82/6/11/0/0 (automobiles/medium/heavy vehicles/buses/motorcycles) traffic mix
for Rancho Santa Fe Road and a 96/1/1/1/1 (automobiles/medium/heavy vehicles/buses/motorcycles) in accordance with County staff.
o A peak hour traffic percentage of 10% of the ADT (for values between approximately 8 and 12 percent, the energy-mean A-weighted sound level is equivalent to the CNEL. Outside this range, a maximum variance of up to two dBA occurs between Leq-h and CNEL).
o Receptor and topographic elevations as identified in the project site plans (Source: Lundstrom & Associates 2006).
1 2
3
4
5 6
7
8
9 10
Modeled Receptor Locations #
12 13 20 19
15 11 18
16
14
17

Mr. David DeMoranville Acoustical Site Assessment Lago de San Marcos – San Diego CA ISE Project #06-056 May 10, 2007 (Revised) Page 12 of 21
© 2006-2007 Investigative Science and Engineering, Inc.
Onsite Noise Analysis Procedure
Onsite noise generation due to the proposed Lago de San Marcos residential development project would consist of HVAC units ground mounted. The proposed development anticipates the use of approximately 17 2.5-ton HVAC units, and 25 three-ton HVAC units as shown in Attachment Acoustical Illustrative Site Plan. For the purposes of this assessment, HVAC operations was assumed to run at a duty cycle of 100% and was modeled with sound ratings ranging from 65 to 68 dBA at three feet based upon typical manufacturer data (see attached cut sheet). Traffic Segment Impact Assessment Approach
The ISE RoadNoise v1.0 traffic noise prediction model which is based upon
Caltrans Sound 32 Traffic Noise Prediction Model with California (CALVENO) noise emission factors (based on FHWA RD-77-108 and FHWA/CA/TL-87/03 standards) was used to calculate the increase in vehicular traffic noise levels along major servicing roadways due to the proposed development project. The model assumed a ‘hard-site’ propagation rule (i.e., 3.0 dBA loss per doubling of distance (DD) between source and receiver), thereby yielding a representative worst-case noise contour set.
Traffic noise model input included a tabulation of the major servicing roadway
alignments identified in the aforementioned project traffic study as well as intersection turning movement and segment diagrams which were analytically reduced to peak hour traffic movements and ultimately daily segment ADT levels assuming a 10% flow pattern. Modeled traffic speeds represent observed and future predicted average values.
FINDINGS / RECOMMENDATIONS
Ambient Sound Measurement Results
Testing conditions were during the week of 7/20/06 to 7/26/06. The results of the one-hour energy equivalent sound levels (Leq), statistical indicators L90, traffic volumes (both Rancho Santa Fe Road and Lake San Marcos Drive), and the CNEL for the site are given below in Figure 6. The CNEL was averaged over a period of 6 days in order to get a realistic approximation of the CNEL for site.

Mr. David DeMoranville Acoustical Site Assessment Lago de San Marcos – San Diego CA ISE Project #06-056 May 10, 2007 (Revised) Page 13 of 21
© 2006-2007 Investigative Science and Engineering, Inc.
Noise to Traffic Correlation
0
10
20
30
40
50
60
70
80
7/20/2006 0:00 7/21/2006 0:00 7/22/2006 0:00 7/23/2006 0:00 7/24/2006 0:00 7/25/2006 0:00 7/26/2006 0:00 7/27/2006 0:00
Logged Time
dBA
0
500
1000
1500
2000
2500
3000
3500
Traf
fic V
olum
e
Leq Ln90 Rancho Santa Fe Lake San Marcos
FIGURE 6: Correlation between existing traffic volumes and existing noise levels
Measurements collected at the monitoring locations ML 1, TL 1, and TL 2 reflect
the typical sound levels and traffic volumes associated with the community setting with existing adjacent major roadway activities. The hourly average sound levels (or Leq-h) recorded over the monitoring period ranged from the high 40’s to the low 60’s dBA, and was observed to be solely due to street traffic.
As indicated by the monitoring equipment, at least 90 percent of the time (L90) the onsite sound level ranged from mid 30’s to mid 50’s dBA (again indicating the relative frequency of traffic along the adjacent roadways). Future Traffic Noise Impacts
The primary source of future traffic noise near the project site would be from Rancho Santa Fe Road and Lake San Marcos Drive. Future traffic estimates for these roadways predict volumes as high as 41,900 and 10,400 ADT (Source: Traffic Study for Lago De San Marcos TM 5388, 12/06. The future speed limits along these roadways are projected to be 50 and 35 MPH respectively.
The results of the acoustical modeling are shown below in Tables 2a-b. Table 2a
predicts both the ground and second level noise levels for a representative sampling of
CNEL = 60.9

Mr. David DeMoranville Acoustical Site Assessment Lago de San Marcos – San Diego CA ISE Project #06-056 May 10, 2007 (Revised) Page 14 of 21
© 2006-2007 Investigative Science and Engineering, Inc.
lots, common areas, and façades within the proposed development area. The receptor labeled Calibrator and numbered on Figure 5a was used in accordance with the existing average six-day traffic volumes as well as the six-day acoustical data acquired at (ML 1) in order to calibrate the model. An acoustical model was set up within TNM 2.5 with a calibration point located at ML 1 geographically. A hard-site propagation scenario was examined per County staff recommendations.
Table 2b predicts balcony sound levels onsite. The project applicant has decided
to remove all the balconies from building 1 adjacent to Rancho Santa Fe Road. The balcony locations are also shown in Figure 5b. Each balcony is expected to consist of a 42-inch high solid guard wall enclosing its open space.
The acoustical model predicted a sound level of 64.8 CNEL at ML 1 utilizing a
hard-soil propagation while the actual CNEL measurement onsite was 60.9 CNEL. For model accuracy a -3.9 dBA-adjustment factor was needed in order to calibrate the model for future analysis.
TABLE 2a: Predicted Transportation Noise Levels – Lago de San Marcos Façades
Modeled Receptor No. Corresponding TNM # Unmitigated 1st Floor Façade Sound Levels
Resultant 2nd Floor Facade Sound Levels
1 26 69.1 73.7 2 27 68.9 737 3 28 68.0 73.0 4 29 60.2 64.4 5 30 63.9 68.1 6 31 63.1 67.3 7 32 65.8 65.7 8 33 66.0 66.0 9 34 65.9 65.7
10 35 65.6 65.4 11 36 65.8 65.4 12 37 58.6 59.1 13 39 (common area) 52.7 n/a
All levels given in dBA CNEL
Based on the model results, no exterior mitigation would be necessary for the project since the only noise sensitive area (common area, receptor 13) was under the County’s threshold. Additionally, all of the proposed balcony areas would be below the County’s significance criteria and would not require noise mitigation.

Mr. David DeMoranville Acoustical Site Assessment Lago de San Marcos – San Diego CA ISE Project #06-056 May 10, 2007 (Revised) Page 15 of 21
© 2006-2007 Investigative Science and Engineering, Inc.
TABLE 2b: Predicted Transportation Noise Levels – Lago de San Marcos Balconies
Modeled Receptor No. Corresponding TNM # Balcony Sound Levels
1 3 52.9 2 4 54.8 3 5 54.0 4 6 54.9 5 7 50.8 6 8 52.0 7 9 48.5 8 10 55.9 9 12 51.6
10 13 53.3 11 15 53.0 12 16 52.8 13 17 59.9 14 18 55.9 15 19 55.3 16 20 55.8 17 21 58.3 18 22 54.2 19 23 54.6 20 24 60.0
All levels given in dBA CNEL
Figure 7 below shows the approximate unobstructed 60 and 75 dBA CNEL noise
contours. It should be noted that structures within the 60 dBA CNEL contour line would exceed the CCR, Title 24, Noise Insulation Standards and would need to be further analyzed in order to demonstrate that the 45 dBA CNEL interior noise threshold can attained. Once the project building plans are complete, final recommendations can be made in order to ensure these thresholds are met.

Mr. David DeMoranville Acoustical Site Assessment Lago de San Marcos – San Diego CA ISE Project #06-056 May 10, 2007 (Revised) Page 16 of 21
© 2006-2007 Investigative Science and Engineering, Inc.
FIGURE 7: Unobstructed Worst Case CNEL Contours – Lago de San Marcos Site (ISE, 5/07)
Expected Outdoor Operational HVAC Noise Levels
The proposed residential development anticipates the use of approximately 42 HVAC units ranging in size from 2.5 to 3 tons (i.e., LENNOX XC15 - 030 or 036, refer to attachments) and would be ground-mounted. Operation of HVAC equipment would be expected to comply with the property line standards identified in Table 1 above. HVAC operations were assumed to run continuously (Worst-Case) and were modeled with a sound rating of 65 or 68 dBA as indicated by the product specifications.
Utilizing the ISE IS3 noise field model, a rectangular grid of receptor points within
the vicinity of the HVAC units were created with the resultant radiated sound level calculated at each point. The results are shown as a color contour plot of the radiated HVAC noise superimposed atop the proposed structural shell. The model input deck is provided as an attachment to this report. The worst-case noise output contours as well as the HVAC locations and types as well as property line noise levels are identified in Attachments 1 and -2 at the end of this report.
The color-shaded areas within Attachment 1 represent areas of equal noise exposure within the roofline and surrounding property and are a composite of the 112,945 data points generated by the computer model. Based upon these findings, the proposed project would not require any mitigation measures in order to comply with the County’s property line noise standards.
60 CNEL
75 CNEL

Mr. David DeMoranville Acoustical Site Assessment Lago de San Marcos – San Diego CA ISE Project #06-056 May 10, 2007 (Revised) Page 17 of 21
© 2006-2007 Investigative Science and Engineering, Inc.
Predicted Vehicular Noise Levels along Adjacent Roadways
The results showing the effect of traffic noise increases on the various servicing
roadway segments associated with the proposed project are presented in Tables 3a through -f starting on Page 18 of this report for the following scenarios:
Table 3a) Existing Site Conditions Table 3b) Existing plus Project Conditions Table 3c) Near Term Cumulative Without Project Traffic Conditions Table 3d) Near Term Cumulative plus Project Traffic Conditions Table 3e) Existing plus Project Related Traffic Noise Increases Table 3f) Near Term plus Project Related Traffic Noise Increases
For each roadway segment examined in Tables 3a through -i, the worst case
average daily traffic volume (ADT) and observed/predicted speeds are shown along with the corresponding reference noise level at 50-feet (in dBA). Additionally, the line-of-sight distance to the 60 and 65 dBA CNEL contours from the roadway centerline are provided as an indication of the worst-case unobstructed theoretical traffic noise contour placement.
TABLE 3a: Existing Traffic Noise Conditions
CNEL Contour Distances (feet)
Roadway Segment ADT Speed (MPH) SPL 65 dBA Contour 60 dBA Contour
Rancho Santa Fe Road Sr-78 to San Marcos Blvd. 30,544 45 74.1 405 1,281 San Marcos to Lake San Marcos 32,547 45 74.4 432 1,365 Lake San Marcos to Melrose 30,909 45 74.1 410 1,297
San Marcos Boulevard w/o Rancho Santa Fe 35,867 45 74.8 476 1,505 Rancho Santa Fe to Las Posas 38,322 45 75.1 508 1,608 Las Posas Rd. to Bent 36,039 45 74.8 478 1,512
Lake San Marcos Drive Rancho Santa Fe to La Tierra 5,614 25 62.4 27 87 La Tierra to San Marino 5,614 25 62.4 27 87
San Marino Drive ne/o Lake San Marcos 4,995 25 61.9 24 77
La Tierra Drive n/o Lake San Marcos 576 25 52.5 3 9
Notes: o PHV = Peak Hour Volume - Source: Darnell & Associates, Inc. 1/06. o SPL = Sound Pressure Level in dBA at 50-feet from the road edge. CNEL = Community Noise Exposure Level. o All values given in dBA CNEL. Contours assumed to be line-of-sight perpendicular (⊥) distance.

Mr. David DeMoranville Acoustical Site Assessment Lago de San Marcos – San Diego CA ISE Project #06-056 May 10, 2007 (Revised) Page 18 of 21
© 2006-2007 Investigative Science and Engineering, Inc.
TABLE 3b: Existing Traffic Conditions plus Project
CNEL Contour Distances (feet)
Roadway Segment ADT Speed (MPH) SPL 65 dBA Contour 60 dBA Contour
Rancho Santa Fe Road Sr-78 to San Marcos Blvd. 30,632 45 74.1 406 1,285 San Marcos to Lake San Marcos 32,728 45 74.4 434 1,373 Lake San Marcos to Melrose 30,967 45 74.1 411 1,299
San Marcos Boulevard w/o Rancho Santa Fe 35,922 45 74.8 477 1,507 Rancho Santa Fe to Las Posas 38,360 45 75.1 509 1,609 Las Posas Rd. to Bent 36,064 45 74.8 478 1,513
Lake San Marcos Drive Rancho Santa Fe to La Tierra 5,853 25 62.6 29 91 La Tierra to San Marino 5,627 25 62.4 28 87
San Marino Drive ne/o Lake San Marcos 5,003 25 61.9 24 77
La Tierra Drive n/o Lake San Marcos 576 25 52.5 3 9
Notes: o PHV = Peak Hour Volume - Source: Darnell & Associates, Inc. 1/06. o SPL = Sound Pressure Level in dBA at 50-feet from the road edge. CNEL = Community Noise Exposure Level. o All values given in dBA CNEL. Contours assumed to be line-of-sight perpendicular (⊥) distance.

Mr. David DeMoranville Acoustical Site Assessment Lago de San Marcos – San Diego CA ISE Project #06-056 May 10, 2007 (Revised) Page 19 of 21
© 2006-2007 Investigative Science and Engineering, Inc.
TABLE 3c: Near Term Cumulative Without Project Traffic Conditions
CNEL Contour Distances (feet)
Roadway Segment ADT Speed (MPH) SPL 65 dBA Contour 60 dBA Contour
Rancho Santa Fe Road Sr-78 to San Marcos Blvd. 31,594 45 74.2 419 1,325 San Marcos to Lake San Marcos 36,757 45 74.9 488 1,542 Lake San Marcos to Melrose 35,729 45 74.8 474 1,499
San Marcos Boulevard w/o Rancho Santa Fe 36,994 45 74.9 491 1,552 Rancho Santa Fe to Las Posas 41,168 45 75.4 546 1,727 Las Posas Rd. to Bent 39,168 45 75.2 520 1,643
Lake San Marcos Drive Rancho Santa Fe to La Tierra 6,497 25 63.0 32 100 La Tierra to San Marino 6,497 25 63.0 32 100
San Marino Drive ne/o Lake San Marcos 5,448 25 62.3 27 84
La Tierra Drive n/o Lake San Marcos 600 25 52.7 3 9
Notes: o PHV = Peak Hour Volume - Source: Darnell & Associates, Inc. 1/06. o SPL = Sound Pressure Level in dBA at 50-feet from the road edge. CNEL = Community Noise Exposure Level. o All values given in dBA CNEL. Contours assumed to be line-of-sight perpendicular (⊥) distance.

Mr. David DeMoranville Acoustical Site Assessment Lago de San Marcos – San Diego CA ISE Project #06-056 May 10, 2007 (Revised) Page 20 of 21
© 2006-2007 Investigative Science and Engineering, Inc.
TABLE 3a: Near Term Cumulative plus Project Traffic Conditions
CNEL Contour Distances (feet)
Roadway Segment ADT Speed (MPH) SPL 65 dBA Contour 60 dBA Contour
Rancho Santa Fe Road Sr-78 to San Marcos Blvd. 31,682 45 74.2 420 1,329 San Marcos to Lake San Marcos 36,938 45 74.9 490 1,549 Lake San Marcos to Melrose 35,787 45 74.8 475 1,501
San Marcos Boulevard w/o Rancho Santa Fe 37,049 45 74.9 491 1,554 Rancho Santa Fe to Las Posas 41,206 45 75.4 547 1,729 Las Posas Rd. to Bent 39,193 45 75.2 520 1,644
Lake San Marcos Drive Rancho Santa Fe to La Tierra 6,736 25 63.2 33 104 La Tierra to San Marino 6,510 25 63.0 32 101
San Marino Drive ne/o Lake San Marcos 5,456 25 62.3 27 84
La Tierra Drive n/o Lake San Marcos 600 25 52.7 3 9
Notes: o PHV = Peak Hour Volume - Source: Darnell & Associates, Inc. 1/06. o SPL = Sound Pressure Level in dBA at 50-feet from the road edge. CNEL = Community Noise Exposure Level. o All values given in dBA CNEL. Contours assumed to be line-of-sight perpendicular (⊥) distance.

Mr. David DeMoranville Acoustical Site Assessment Lago de San Marcos – San Diego CA ISE Project #06-056 May 10, 2007 (Revised) Page 21 of 21
© 2006-2007 Investigative Science and Engineering, Inc.
TABLE 3e: Existing plus Project Related Traffic Noise Increases
Roadway Segment Existing (SPL)
Existing plus Project (SPL)
Project Related Difference (SPL)
Rancho Santa Fe Road Sr-78 to San Marcos Blvd. 74.1 74.1 0.0 San Marcos to Lake San Marcos 74.4 74.4 0.0 Lake San Marcos to Melrose 74.1 74.1 0.0
San Marcos Boulevard w/o Rancho Santa Fe 74.8 74.8 0.0 Rancho Santa Fe to Las Posas 75.1 75.1 0.0 Las Posas Rd. to Bent 74.8 74.8 0.0
Lake San Marcos Drive Rancho Santa Fe to La Tierra 62.4 62.6 0.2 La Tierra to San Marino 62.4 62.4 0.0
San Marino Drive ne/o Lake San Marcos 61.9 61.9 0.0
La Tierra Drive n/o Lake San Marcos 52.5 52.5 0.0
Notes: o SPL = Sound Pressure Level in dBA at 50-feet from the road edge. CNEL = Community Noise Exposure Level. o All values given in dBA CNEL. Contours assumed to be line-of-sight perpendicular (⊥) distance.
Mr. David DeMoranville Acoustical Site Assessment Lago de San Marcos – San Diego CA ISE Project #06-056 May 10, 2007 (Revised) Page 22 of 21
© 2006-2007 Investigative Science and Engineering, Inc.
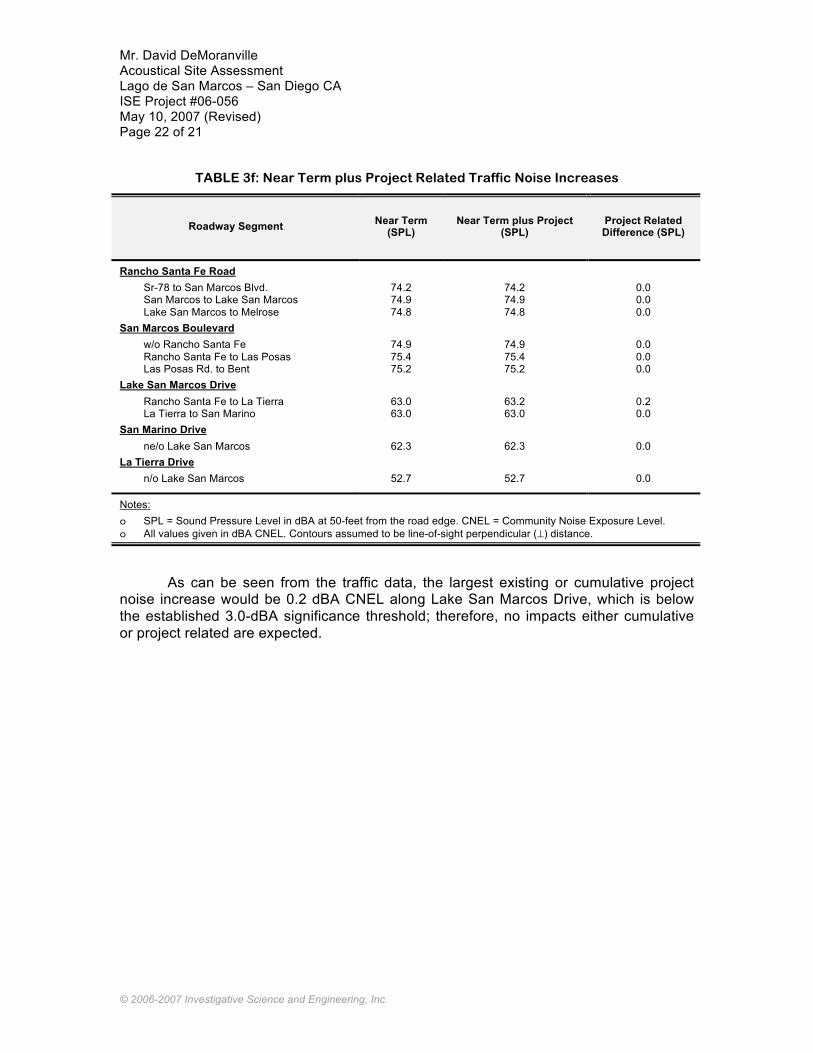
TABLE 3f: Near Term plus Project Related Traffic Noise Increases
Roadway Segment Near Term (SPL)
Near Term plus Project (SPL)
Project Related Difference (SPL)
Rancho Santa Fe Road Sr-78 to San Marcos Blvd. 74.2 74.2 0.0 San Marcos to Lake San Marcos 74.9 74.9 0.0 Lake San Marcos to Melrose 74.8 74.8 0.0
San Marcos Boulevard w/o Rancho Santa Fe 74.9 74.9 0.0 Rancho Santa Fe to Las Posas 75.4 75.4 0.0 Las Posas Rd. to Bent 75.2 75.2 0.0
Lake San Marcos Drive Rancho Santa Fe to La Tierra 63.0 63.2 0.2 La Tierra to San Marino 63.0 63.0 0.0
San Marino Drive ne/o Lake San Marcos 62.3 62.3 0.0
La Tierra Drive n/o Lake San Marcos 52.7 52.7 0.0
Notes: o SPL = Sound Pressure Level in dBA at 50-feet from the road edge. CNEL = Community Noise Exposure Level. o All values given in dBA CNEL. Contours assumed to be line-of-sight perpendicular (⊥) distance.
As can be seen from the traffic data, the largest existing or cumulative project noise increase would be 0.2 dBA CNEL along Lake San Marcos Drive, which is below the established 3.0-dBA significance threshold; therefore, no impacts either cumulative or project related are expected.

Mr. David DeMoranville Acoustical Site Assessment Lago de San Marcos – San Diego CA ISE Project #06-056 May 10, 2007 (Revised) Page 23 of 21
© 2006-2007 Investigative Science and Engineering, Inc.
CERTIFICATION OF ACCURACY AND QUALIFICATIONS This report was prepared by Investigative Science and Engineering, Inc. (ISE)
located at 16486 Bernardo Center Drive, Suite 278, San Diego, CA 92128. The members of its professional staff contributing to the report are listed below:
Rick Tavares B.S. Aerospace Engineering / Engineering Mechanics ([email protected]) M.S. Mechanical Engineering M.S. Structural Engineering Ph.D. Civil Engineering
Andre Estrada B.S. Mechanical Engineering ([email protected])
ISE affirms to the best of its knowledge and belief that the statements and
information contained herein are in all respects true and correct as of the date of this report. Should the reader have any questions regarding the findings and conclusions presented in this report, please do not hesitate to contact ISE at (858) 451-3505. Content and information contained within this report is intended only for the subject project and is protected under 17 U.S.C. §§ 101 through 810. Original reports contain non-photo blue ISE watermark at the bottom of each page. Approved as to Form and Content:
Rick Tavares, Ph.D. Project Principal Investigative Science and Engineering, Inc. Attachments to this report: IS3 Model Input TNM 2.5 Model Input/Output Decks HVAC Noise Exposure Plot for Worst-Case Acoustical Illustrative Site Plan HVAC Cut Sheet (LENNOX XC – 030/0360)

Mr. David DeMoranville Acoustical Site Assessment Lago de San Marcos – San Diego CA ISE Project #06-056 May 10, 2007 (Revised) Page 24 of 21
© 2006-2007 Investigative Science and Engineering, Inc.
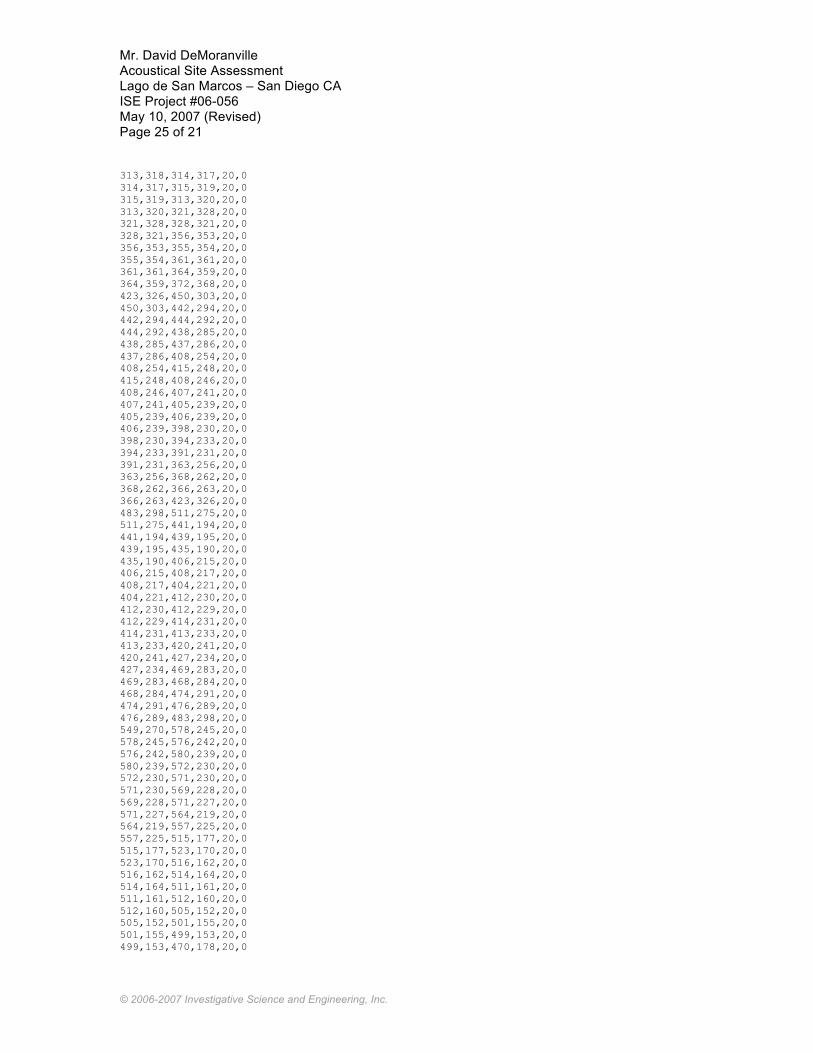
IS3 Model Input / Output Data LAGO DE SAN MARCOS HVAC 260 = START X POINT IN FEET 95 = START Y POINT IN FEET 950 = END X POINT IN FEET 462 = END Y POINT IN FEET 42 = NUMBER OF SOURCE POINTS 500 = DOMINANT FREQUENCY OF SOURCE IN HZ 3 = REFERENCE DISTANCE IN FEET 1.5 = DISTANCE BETWEEN STEPS 160 = NUMBER OF BARRIER PAIRS 5 = RECEPTOR ELEVATION IN FEET SOURCE POINTS IN FEET (XYZ - LEVEL IN DBA) 337,277,3,65 314,319,3,65 341,338,3,68 355,353,3,68 364,361,3,68 444,294,3,68 437,285,3,68 421,267,3,68 407,240,3,65 363,258,3,65 436,190,3,65 413,231,3,65 439,250,3,68 453,267,3,68 468,283,3,68 476,290,3,68 571,228,3,68 544,208,3,68 531,193,3,68 517,177,3,68 513,162,3,65 470,179,3,65 548,270,3,68 623,156,3,65 580,175,3,65 589,206,3,68 591,228,3,68 592,239,3,68 705,220,3,68 695,189,3,68 702,175,3,65 655,163,3,65 661,239,3,68 791,230,3,68 781,154,3,65 739,176,3,65 748,189,3,68 744,220,3,68 866,217,3,65 855,187,3,65 853,175,3,65 824,238,3,68 BARRIER SOURCE PAIRS IN FEET (START XY - END XY - HEIGHT - STC) 372,368,398,344,20,0 398,344,341,281,20,0 341,281,339,282,20,0 339,282,334,277,20,0 334,277,306,303,20,0 306,303,308,305,20,0 308,305,305,308,20,0 305,308,313,318,20,0
IS3 INPUT DECK
Mr. David DeMoranville Acoustical Site Assessment Lago de San Marcos – San Diego CA ISE Project #06-056 May 10, 2007 (Revised) Page 25 of 21
© 2006-2007 Investigative Science and Engineering, Inc.
313,318,314,317,20,0 314,317,315,319,20,0 315,319,313,320,20,0 313,320,321,328,20,0 321,328,328,321,20,0 328,321,356,353,20,0 356,353,355,354,20,0 355,354,361,361,20,0 361,361,364,359,20,0 364,359,372,368,20,0 423,326,450,303,20,0 450,303,442,294,20,0 442,294,444,292,20,0 444,292,438,285,20,0 438,285,437,286,20,0 437,286,408,254,20,0 408,254,415,248,20,0 415,248,408,246,20,0 408,246,407,241,20,0 407,241,405,239,20,0 405,239,406,239,20,0 406,239,398,230,20,0 398,230,394,233,20,0 394,233,391,231,20,0 391,231,363,256,20,0 363,256,368,262,20,0 368,262,366,263,20,0 366,263,423,326,20,0 483,298,511,275,20,0 511,275,441,194,20,0 441,194,439,195,20,0 439,195,435,190,20,0 435,190,406,215,20,0 406,215,408,217,20,0 408,217,404,221,20,0 404,221,412,230,20,0 412,230,412,229,20,0 412,229,414,231,20,0 414,231,413,233,20,0 413,233,420,241,20,0 420,241,427,234,20,0 427,234,469,283,20,0 469,283,468,284,20,0 468,284,474,291,20,0 474,291,476,289,20,0 476,289,483,298,20,0 549,270,578,245,20,0 578,245,576,242,20,0 576,242,580,239,20,0 580,239,572,230,20,0 572,230,571,230,20,0 571,230,569,228,20,0 569,228,571,227,20,0 571,227,564,219,20,0 564,219,557,225,20,0 557,225,515,177,20,0 515,177,523,170,20,0 523,170,516,162,20,0 516,162,514,164,20,0 514,164,511,161,20,0 511,161,512,160,20,0 512,160,505,152,20,0 505,152,501,155,20,0 501,155,499,153,20,0 499,153,470,178,20,0

Mr. David DeMoranville Acoustical Site Assessment Lago de San Marcos – San Diego CA ISE Project #06-056 May 10, 2007 (Revised) Page 26 of 21
© 2006-2007 Investigative Science and Engineering, Inc.
470,178,475,183,20,0 475,183,473,185,20,0 473,185,543,266,20,0 543,266,544,264,20,0 544,264,549,270,20,0 630,247,624,162,20,0 624,162,622,162,20,0 622,162,621,155,20,0 621,155,584,158,20,0 584,158,584,161,20,0 584,161,579,161,20,0 579,161,579,174,20,0 579,174,580,174,20,0 580,174,581,176,20,0 581,176,578,176,20,0 578,176,579,187,20,0 579,187,589,186,20,0 589,186,592,228,20,0 592,228,590,229,20,0 590,229,591,238,20,0 591,238,594,238,20,0 594,238,595,250,20,0 595,250,630,247,20,0 700,237,700,234,20,0 700,234,705,233,20,0 705,233,704,221,20,0 704,221,703,221,20,0 703,221,704,219,20,0 704,219,705,219,20,0 705,219,703,208,20,0 703,208,695,209,20,0 695,209,693,188,20,0 693,188,703,187,20,0 703,187,702,177,20,0 702,177,700,177,20,0 700,177,700,174,20,0 700,174,701,174,20,0 701,174,700,162,20,0 700,162,695,162,20,0 695,162,695,159,20,0 695,159,657,161,20,0 657,161,657,169,20,0 657,169,655,169,20,0 655,169,660,233,20,0 660,233,662,233,20,0 662,233,662,240,20,0 662,240,700,237,20,0 789,232,789,225,20,0 789,225,791,225,20,0 791,225,783,161,20,0 783,161,781,161,20,0 781,161,780,154,20,0 780,154,742,159,20,0 742,159,742,162,20,0 742,162,737,163,20,0 737,163,739,175,20,0 739,175,740,175,20,0 740,175,740,177,20,0 740,177,738,177,20,0 738,177,739,188,20,0 739,188,749,187,20,0 749,187,752,208,20,0 752,208,742,209,20,0 742,209,743,219,20,0 743,219,745,219,20,0

Mr. David DeMoranville Acoustical Site Assessment Lago de San Marcos – San Diego CA ISE Project #06-056 May 10, 2007 (Revised) Page 27 of 21
© 2006-2007 Investigative Science and Engineering, Inc.
745,219,745,222,20,0 745,222,744,222,20,0 744,222,746,234,20,0 746,234,751,233,20,0 751,233,752,237,20,0 752,237,789,232,20,0 868,231,866,218,20,0 866,218,865,218,20,0 865,218,865,216,20,0 865,216,867,216,20,0 867,216,866,206,20,0 866,206,856,207,20,0 856,207,854,185,20,0 854,185,855,185,20,0 855,185,854,176,20,0 854,176,851,176,20,0 851,176,850,165,20,0 850,165,814,169,20,0 814,169,822,233,20,0 822,233,825,232,20,0 825,232,825,239,20,0 825,239,868,231,20,0 END OF INPUT FILE - REV 3.1