Embed Size (px)
Citation preview

Investing Basics
October 6, 2008
Why do we invest?
Capital Preservation
Building Wealth, Retirement
Take Advantage of Time and Compounding
Savings Rate
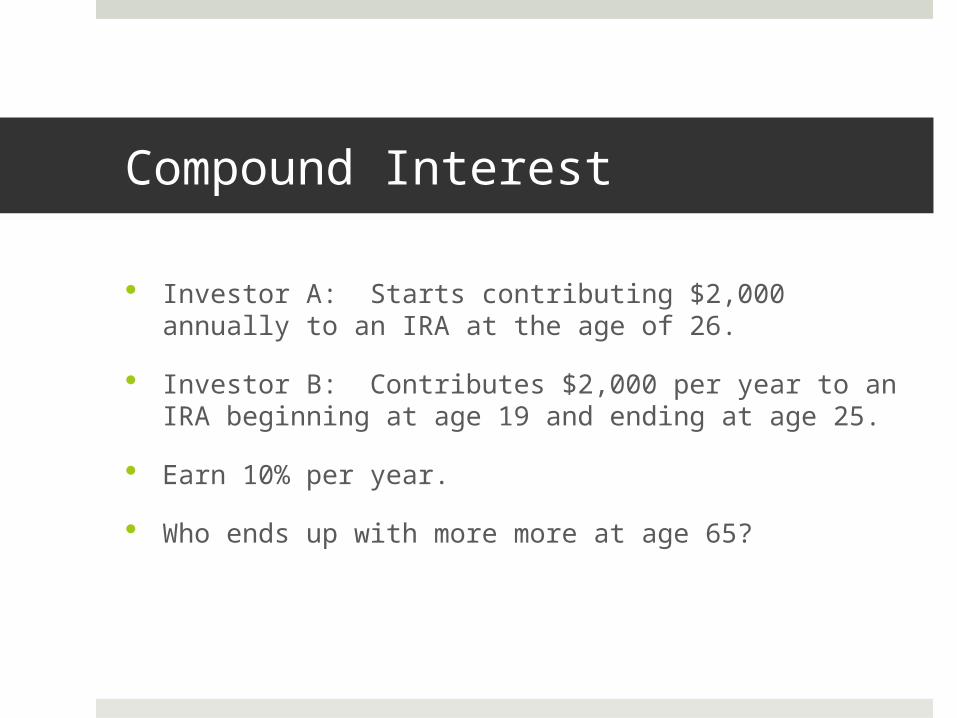
Compound Interest
Investor A: Starts contributing $2,000 annually to an IRA at the age of 26.
Investor B: Contributes $2,000 per year to an IRA beginning at age 19 and ending at age 25.
Earn 10% per year.
Who ends up with more more at age 65?
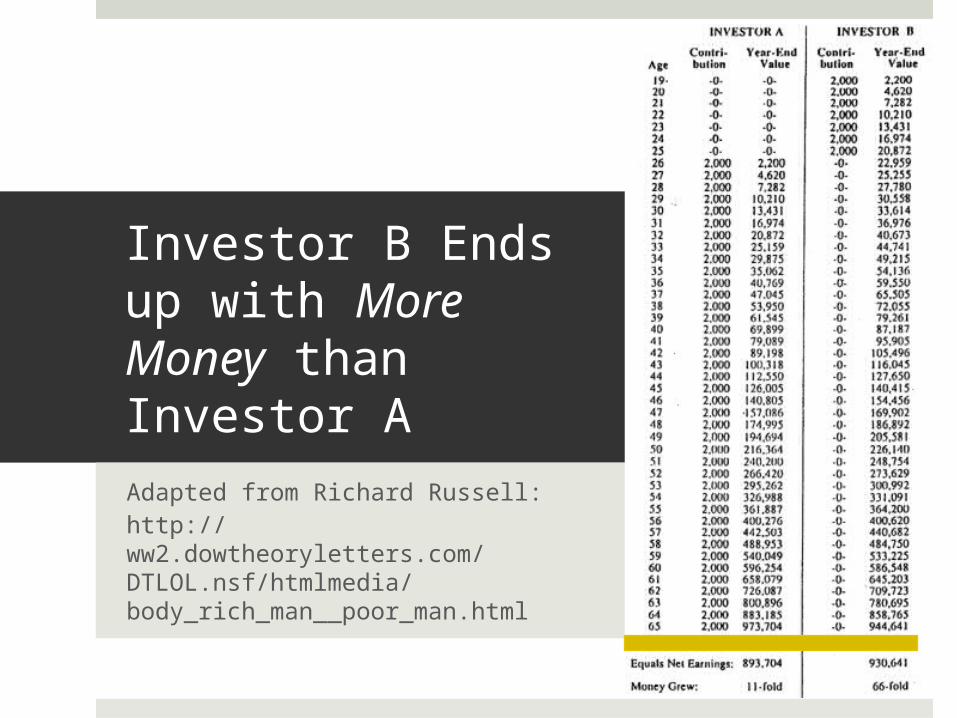
Investor B Ends up with More Money than Investor A
Adapted from Richard Russell:http://ww2.dowtheoryletters.com/DTLOL.nsf/htmlmedia/body_rich_man__poor_man.html
Morals of the Story
Start saving and investing as early as possible.
At a young age, savings rate is probably the most important factor in building wealth (although investing responsibly helps too).
(The moral isn’t necessarily to stop investing after age 25. Consider that a hypothetical investor C who started investing $2,000 annually at age 19 would have ended with nearly $2 million.)
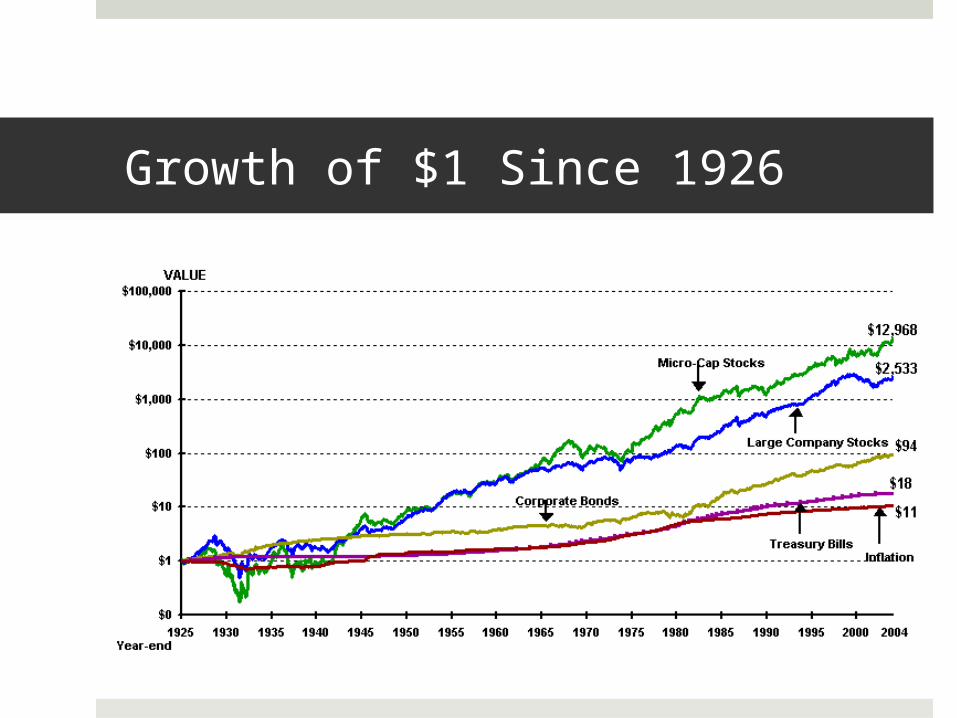
Growth of $1 Since 1926
Active vs. Passive Management
Definitions
Advantages and Disadvantages
Investing in Funds
What do these terms mean?
Active Management The use of an active means such as stock selection or
market timing in an attempt to outperform the market.
Passive Management Matches the return of a given market index by owning all
(or substantially all) the securities in the underlying index.
Active Management
Incentive Problems: Fee structure. Risk.
Higher fees in general.
Higher turnover and lower tax efficiency.
Most actively managed funds underperform passive indexes over time. It’s also hard to pick funds that will be long term winners.
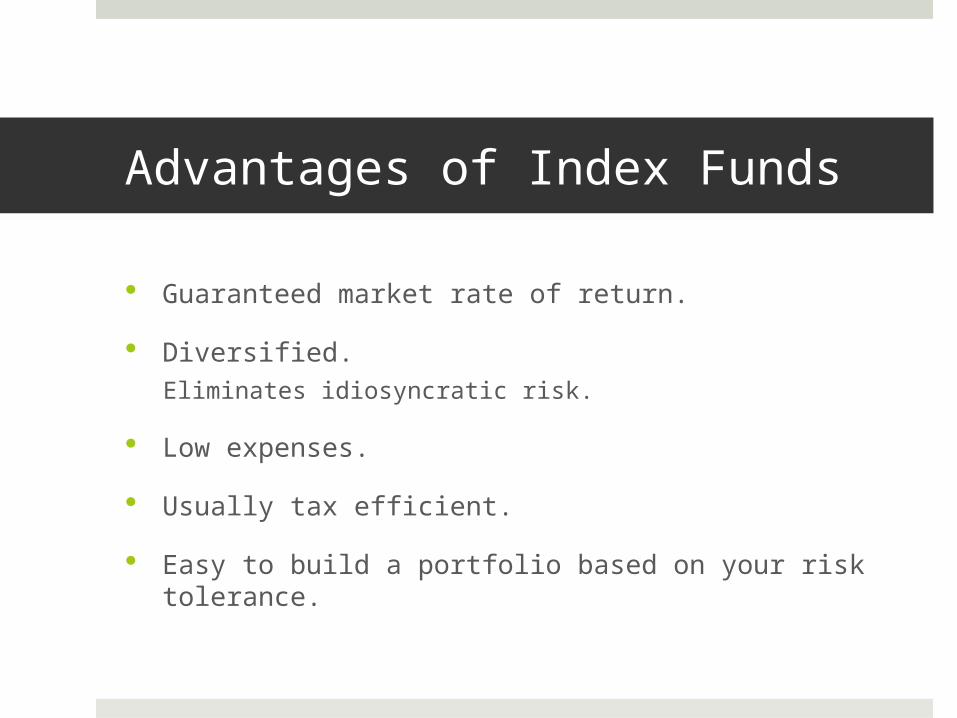
Advantages of Index Funds
Guaranteed market rate of return.
Diversified.Eliminates idiosyncratic risk.
Low expenses.
Usually tax efficient.
Easy to build a portfolio based on your risk tolerance.
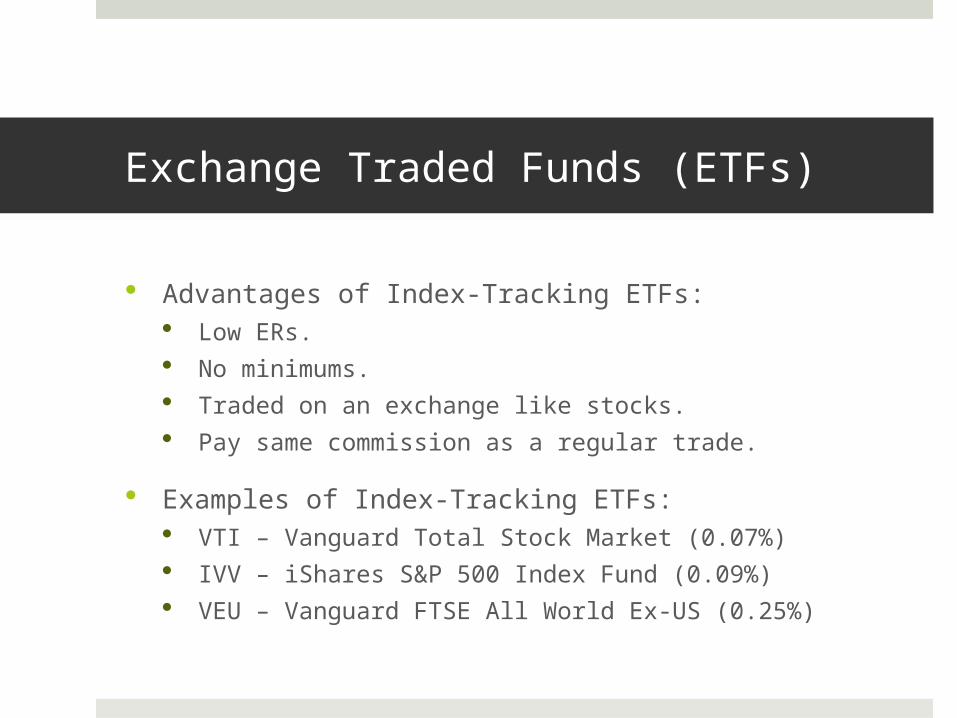
Exchange Traded Funds (ETFs)
Advantages of Index-Tracking ETFs: Low ERs. No minimums. Traded on an exchange like stocks. Pay same commission as a regular trade.
Examples of Index-Tracking ETFs: VTI – Vanguard Total Stock Market (0.07%) IVV – iShares S&P 500 Index Fund (0.09%) VEU – Vanguard FTSE All World Ex-US (0.25%)
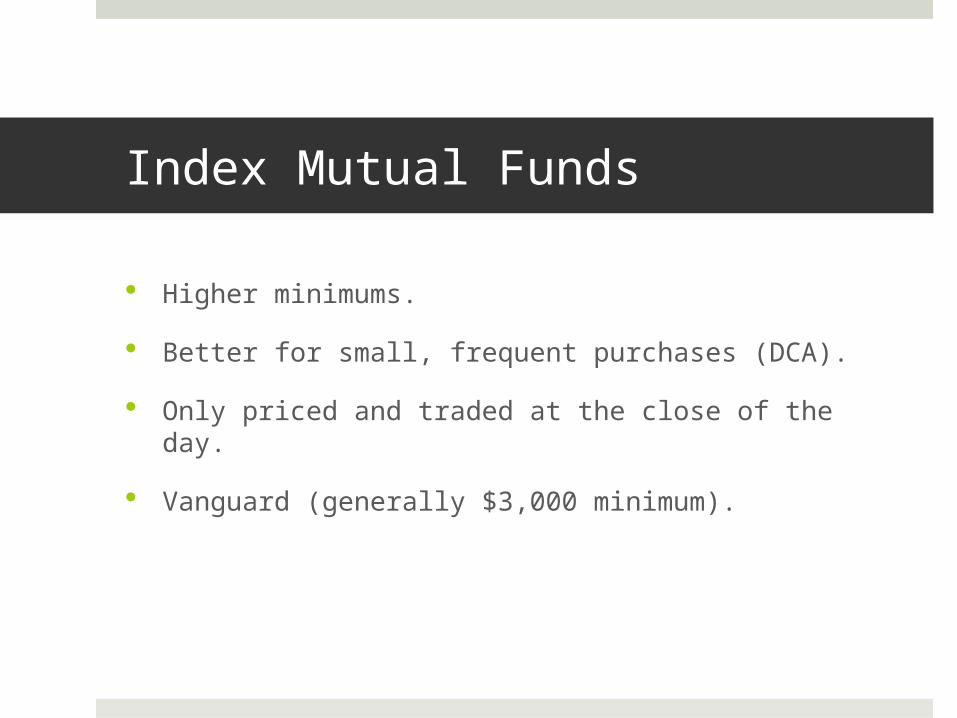
Index Mutual Funds
Higher minimums.
Better for small, frequent purchases (DCA).
Only priced and traded at the close of the day.
Vanguard (generally $3,000 minimum).

More on Investing in Funds Next Week…
Investing Basics
Business Analysis
Accounting Analysis
Financial Analysis
Valuation
Business Analysis
Remember last week?
Procter & Gamble Competitive advantages? Brand names? Ability to raise prices with inflation? Economic moat? Industry and type of product? Consistency?
Accounting Analysis
Do the firm’s accounting policies reflect the business reality of the firm?
If not, we must make adjustments.
More on accounting analysis later. Yes, it needs its own week (or two..).
Financial Statements
Balance Sheet: A list of the things owned and owed by the firm and the difference between the two.
Income Statement: A list of the resources acquired and consumed by a firm over a period of time.
Cash Flow Statement: A list of the flows of cash in and out of a company over a period of time.
Basic Accounting Terms
Balance Sheet Assets: Probable future benefits owned or controlled by a
firm. Liabilities: Probable future sacrifice of benefits. Equity: The difference between total assets and total
liabilities.
Income Statement Earnings: The increase in net assets (equity) resulting
from operations over a period of time.
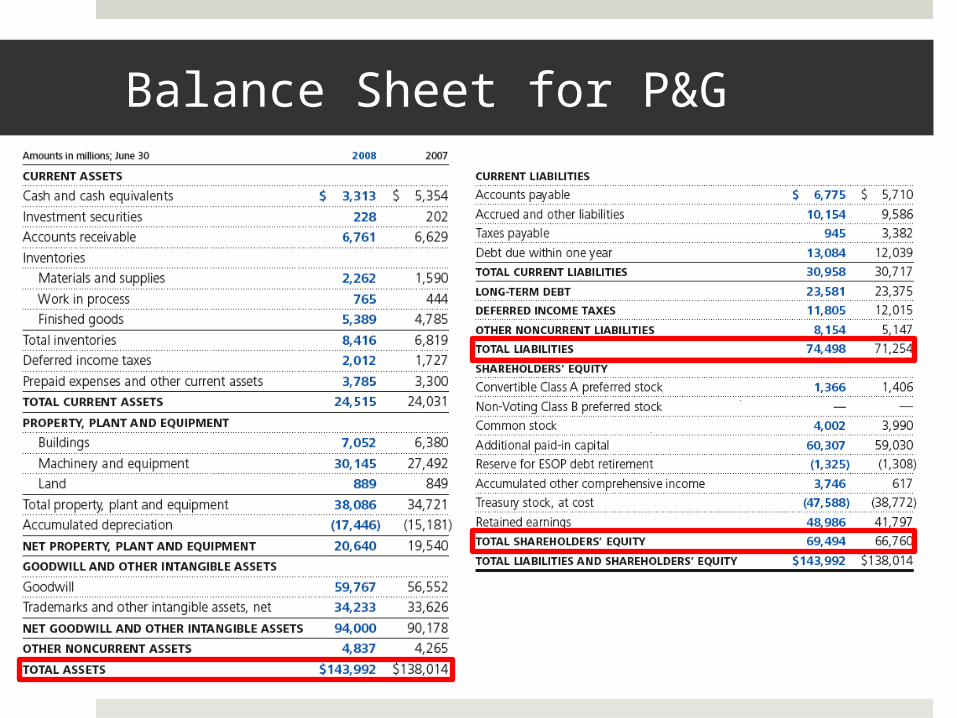
Balance Sheet for P&G
Things to Remember
The Balance Sheet Equation: Assets = Liabilities + Equities Equity is the residual left over for shareholders after a
company’s other creditors (represented by liabilities) have been satisfied.
One of the best sources of information is the company itself and its management. This means reading annual and quarterly reports, which
can be found on SEC.gov or on the company’s website. We still need to be cognizant of management’s incentives
and biases.
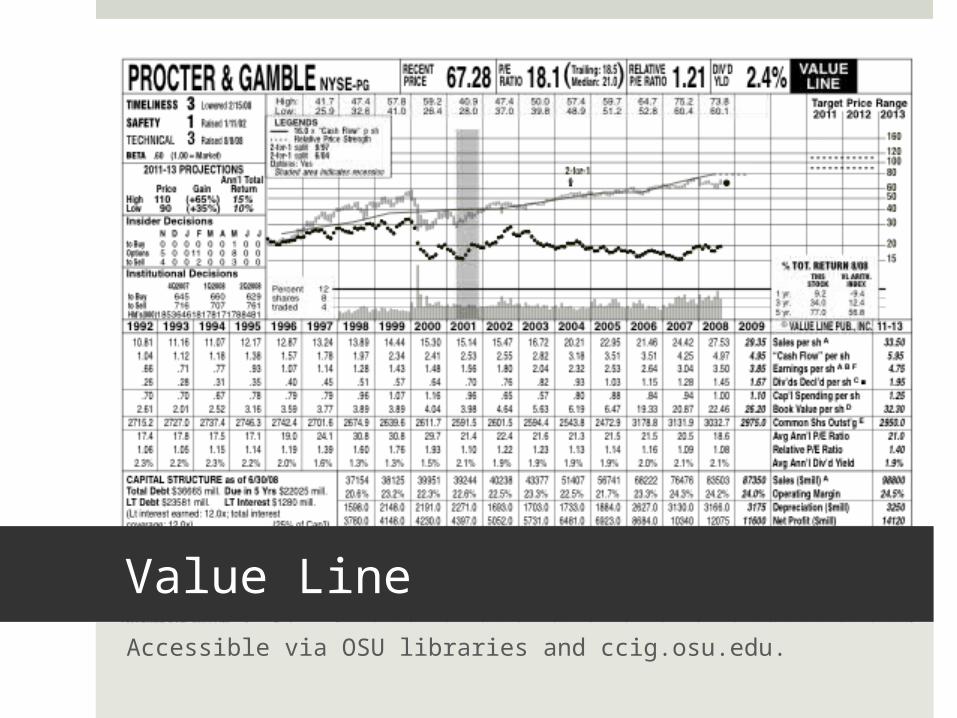
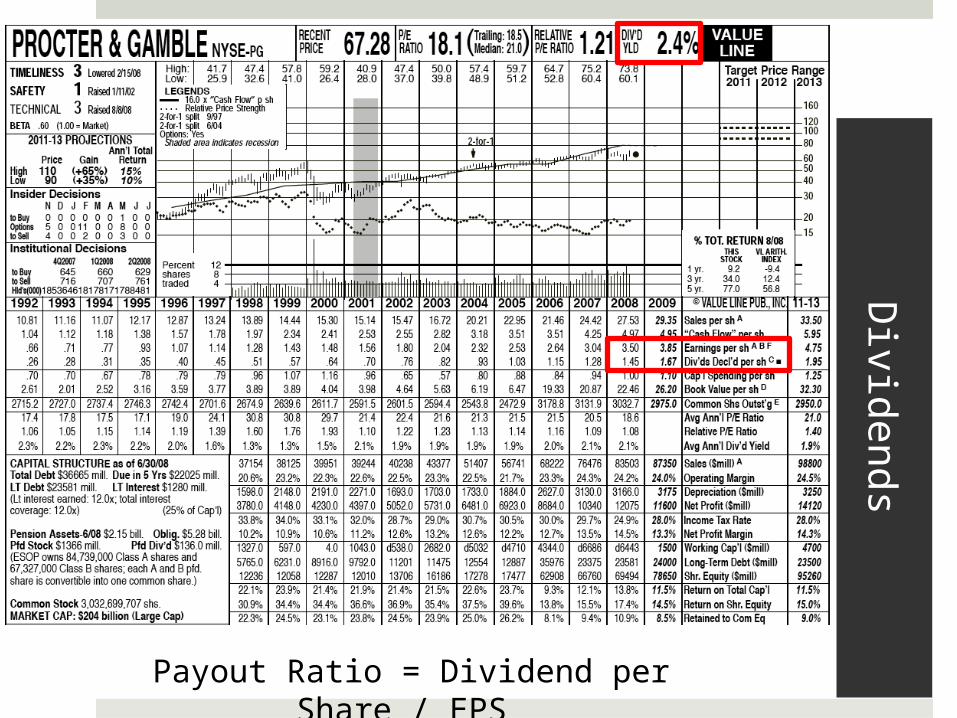
Value LineAccessible via OSU libraries and ccig.osu.edu.
Reminders About Value Line
Good starting point.
Usually a reliable source for objective data aggregated in a consistent format.
It’s generally a good idea to ignore Value Line’s predictions (or any analyst predictions for that matter).
The Basics of a Stock
Share of Stock: A security representing fractional ownership in a firm and a claim on its net assets and earnings.
Shares Outstanding: The total number of shares issued by a company.
Market Capitalization (Market Cap): The total market value of a company based on the share
price and number of shares outstanding. Share Price x Number of Shares Outstanding.
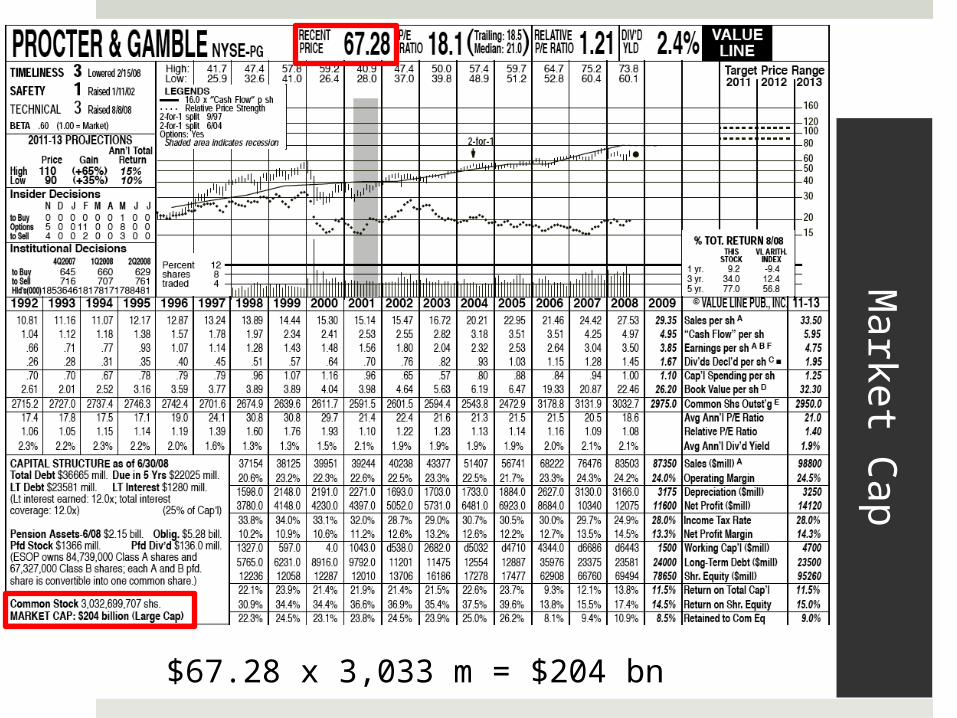
Marke
t Cap
$67.28 x 3,033 m = $204 bn
Implications
Share Price One share of P&G costs $67.28.
Shares Outstanding There are about 3 billion shares outstanding, so if you buy
one share, you’re buying 1 / 3 billionth of the company.
Market Cap The total market value of P&G (based on the share price
and shares outstanding) is $204 billion.
Earnings
Definition Again: The increase in net assets (equity) resulting from operations over a period of time.
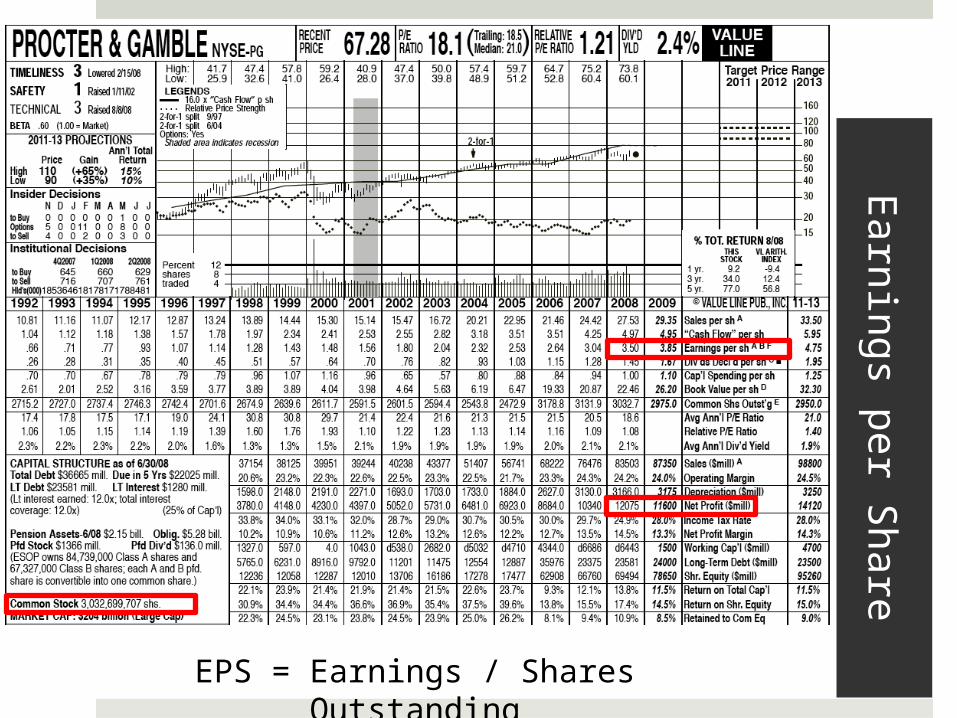
Earnings per Share (EPS) = Earnings / Number of Shares
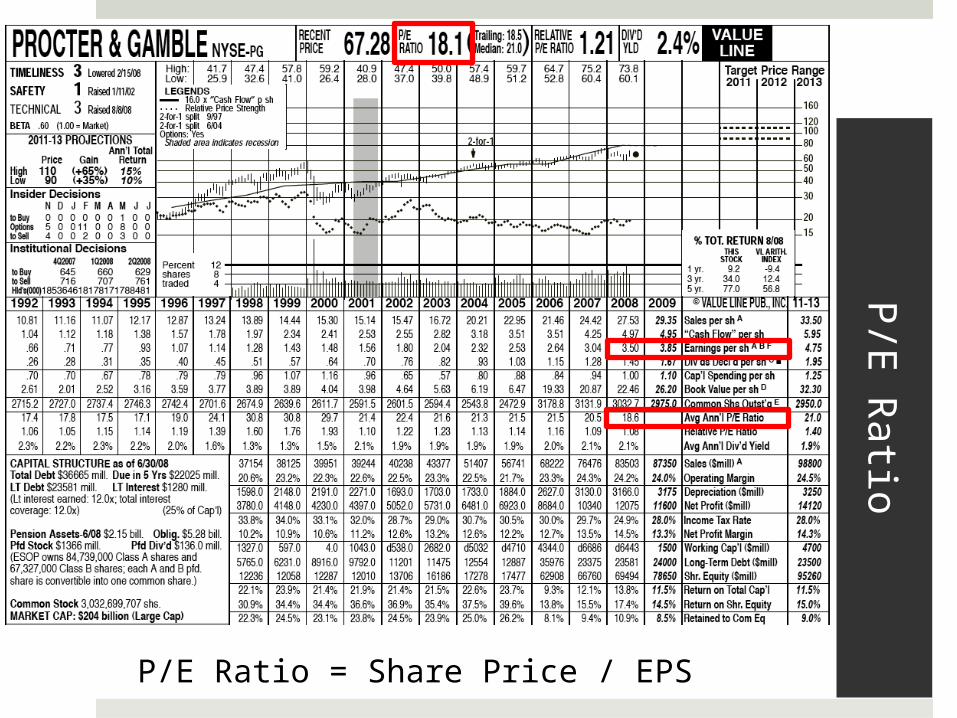
Price to Earnings Ratio (P/E Ratio) = Share Price / Earnings per Share
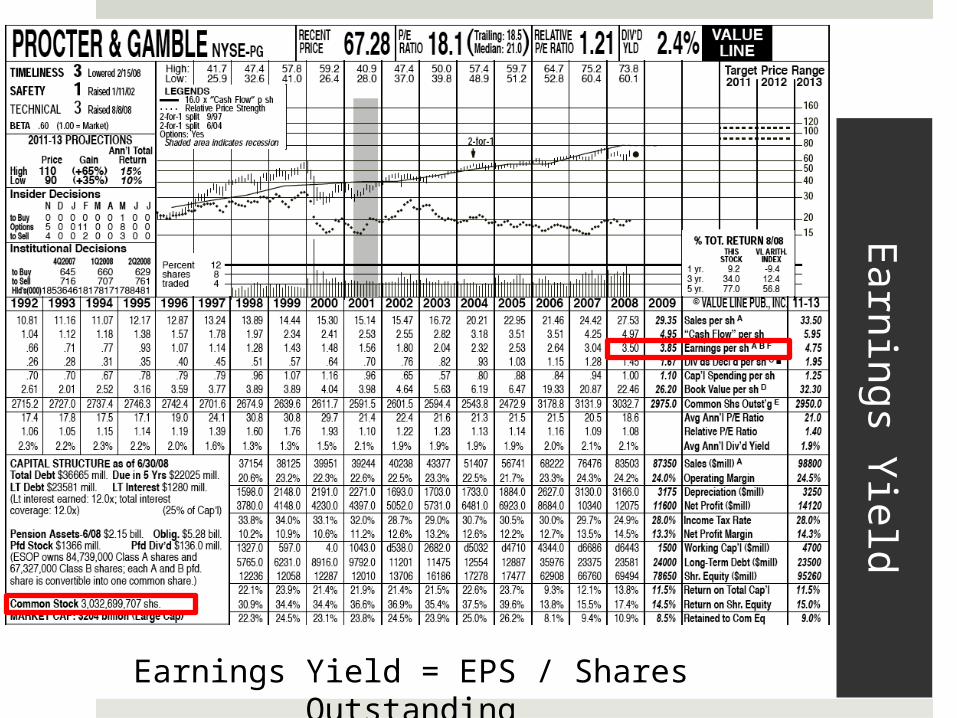
Earnings Yield = Earnings per Share / Share Price
Earn
ing
s per S
hare
EPS = Earnings / Shares Outstanding
P/E
Ratio
P/E Ratio = Share Price / EPS
Earn
ings Yie
ld
Earnings Yield = EPS / Shares Outstanding
Implications
P/E Ratio You’re paying $18.10 per dollar of P&G’s earnings. Depends on factors such as expected growth and industry.
Earnings Yield The initial yield you’re earning on your investment is
5.5%. Since the earnings yield is the reciprocal of the P/E ratio, a
lower P/E ratio results in a higher earnings yield.
Note: You might run those calculations and end up with numbers slightly different than those reported by Value Line because they use a weighted average of shares outstanding.
Dividend
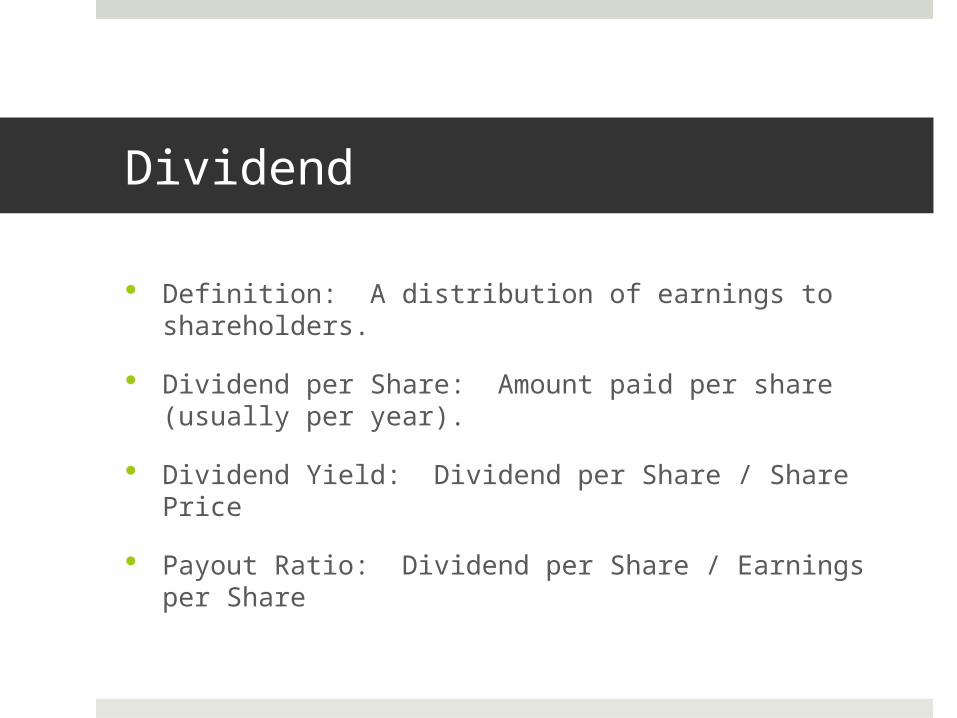
Definition: A distribution of earnings to shareholders.
Dividend per Share: Amount paid per share (usually per year).
Dividend Yield: Dividend per Share / Share Price
Payout Ratio: Dividend per Share / Earnings per Share
Div
iden
ds
Payout Ratio = Dividend per Share / EPS
Implications
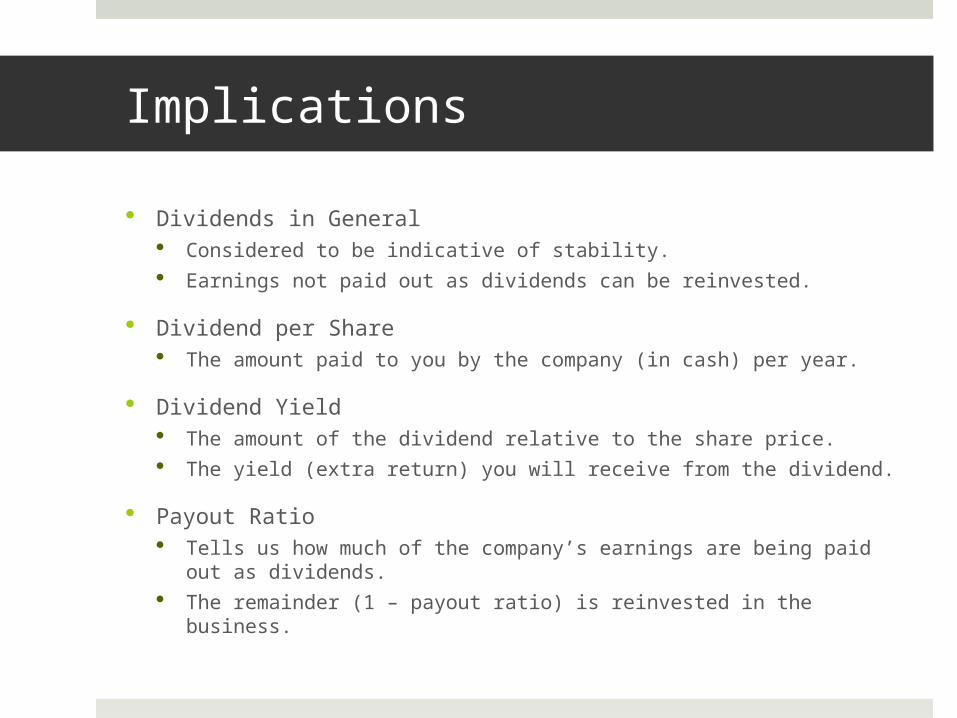
Dividends in General Considered to be indicative of stability. Earnings not paid out as dividends can be reinvested.
Dividend per Share The amount paid to you by the company (in cash) per year.
Dividend Yield The amount of the dividend relative to the share price. The yield (extra return) you will receive from the dividend.
Payout Ratio Tells us how much of the company’s earnings are being paid out
as dividends. The remainder (1 – payout ratio) is reinvested in the business.
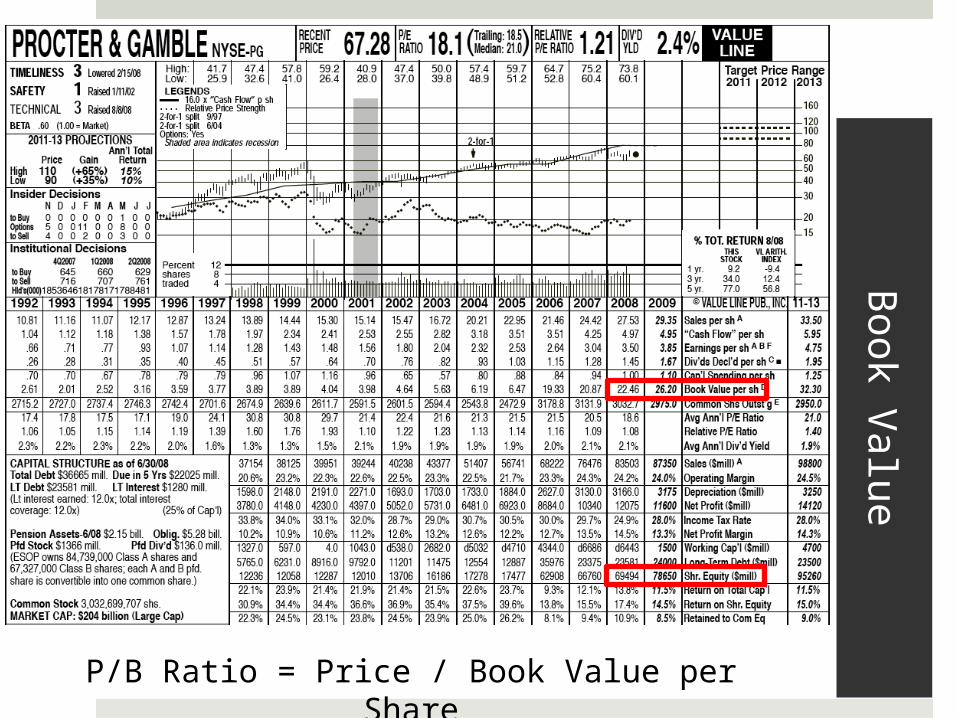
Book Value of Equity
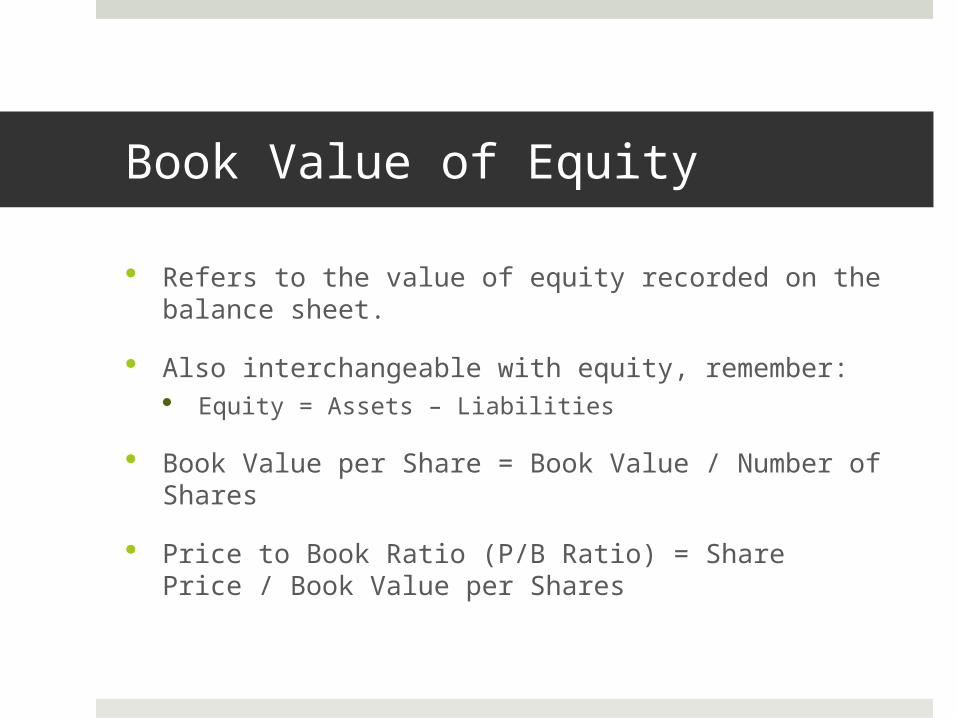
Refers to the value of equity recorded on the balance sheet.
Also interchangeable with equity, remember: Equity = Assets – Liabilities
Book Value per Share = Book Value / Number of Shares
Price to Book Ratio (P/B Ratio) = Share Price / Book Value per Shares
Book V
alu
e
P/B Ratio = Price / Book Value per Share

Implications
Book Value Broadly refers to values assigned to various entries on a
firm’s balance sheet. Sometimes requires adjustments (for example, book value
of equity often requires the deduction of intangible assets that cannot be readily priced and sold).
P/B Ratio Above 1 indicates that the firm is priced at a value greater
than the book value of its net assets. Most firms trade at a market value above book value. Intangibles and other advantages can result in a higher
P/B ratio. High or low P/B ratio does not necessarily make
something a good or bad investment.
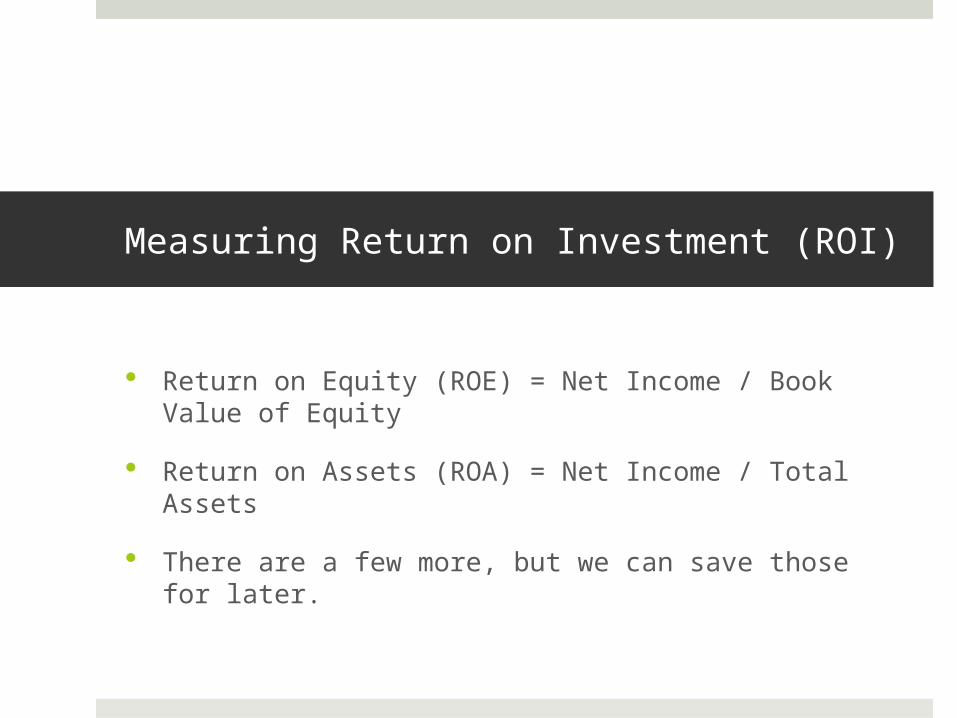
Measuring Return on Investment (ROI)
Return on Equity (ROE) = Net Income / Book Value of Equity
Return on Assets (ROA) = Net Income / Total Assets
There are a few more, but we can save those for later.
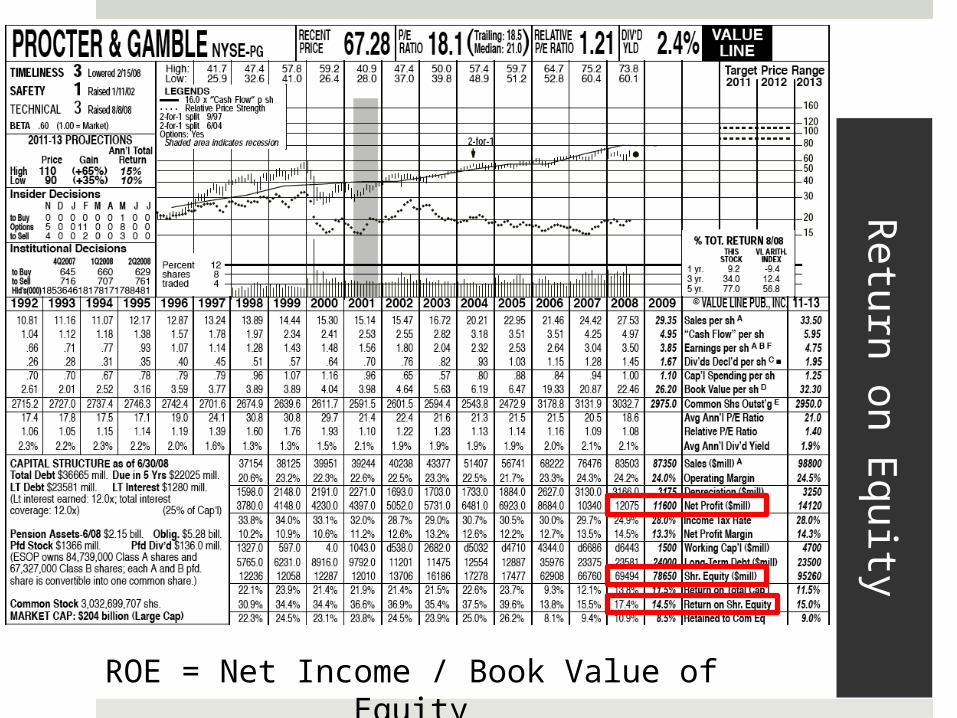
Retu
rn o
n E
qu
ity
ROE = Net Income / Book Value of Equity
Implications
Return on Equity A (relatively) comprehensive measure of how profitable a
firm is in relation to money invested by shareholders. We prefer an above-average ROE.
Return on Assets Measures a firm’s profitability relative to its total assets.
Differences Between ROE and ROA are generally caused by leverage, which can enhance a firm’s ROE.
We will break down these ratios later.
More on Valuation Later…

Don’t Feel Overwhelmed.
We covered a LOT of material today.
It takes time for these concepts to sink in.
After a few more meetings and some outside reading, you’ll catch on quickly.
This PowerPoint will be posted online for future reference and review.
Outside of meetings, ask questions on the Forum!
Some Recommended Reading for the Mean Time
The Wall Street Journal
The Superinvestors of Graham-and-Doddsville by Warren Buffett
The Dhandho Investor by Mohnish Pabrai
The Intelligent Investor by Benjamin Graham
Margin of Safety by Seth Klarman
Next Week
Getting Started Choosing a Broker Account Types
More on Investing in Funds
Starting the Club Portfolio Look at Core-Mark (CORE)
ccig.osu.edu
October 6, 2008