Embed Size (px)
Citation preview
Annual General Meeting
Fund Managers’ Presentation
December 2020
Investing in Biotechnology for a Healthier FutureHigh Growth Sector / Competitive Dividend Yield

www.ibtplc.com 2
This Presentation is intended for existing shareholders of International Biotechnology Trust Plc (“the Company”) for informational purposes. It is not a recommendation or solicitation to
buy or sell any particular security, including shares in the Company or any of the securities or companies mentioned herein. Any company or security mentioned in the Presentation will
not necessarily be a constituent of the portfolio by the time this document is published, or if viewed on any subsequent date. Any views expressed herein may no longer be current and
may have already been acted upon and are subject to change without notice.
The information in this Presentation is not intended for and should not be relied upon to make any investment decision.
The value of investments, and the income from them, may go down as well as up, and is not guaranteed, and investors may not get back the full amount invested. Past performance is
not a guide to future performance and exchange rate changes may cause the value of overseas investments to rise or fall.
Investors should bear in mind that investment in biotechnology shares can be subject to risks not normally associated with more developed markets or stocks. Investing in the
biotechnology sector carries some particular risks and investment in the Company should be regarded both as long term and as carrying a high level of financial risk.
In addition, there is no guarantee that the market price of shares in investment trusts will fully reflect their underlying NAV and it is not uncommon for the market price of such shares to
trade at a substantial discount to their NAV.
The Company’s portfolio companies are subject to change and should not be construed as research or investment advice. Similarly, any reference to a specific company does not
constitute a recommendation to buy, sell, hold or subscribe in any company or its securities.
This Presentation and the material referred to herein is only made available to recipients who may lawfully receive it in accordance with applicable laws, regulations and rules and binding
guidance of regulators. Every effort is taken to ensure the accuracy of the data used herein but no warranties are given.
All views expressed in this Presentation are current as at the date of recording of this Presentation and may be subject to change. No part of this material may, without SV Health
Managers LLP’s prior written consent, be (i) copied, photocopied or duplicated in any form, by any means, or (ii) distributed to any person that is not an employee, officer, director, or
authorised agent of the recipient.
Full details of the Company, including risk warnings, are published in the Investor Disclosure Document and the Key Information Document which can be obtained on request and on our
website at www.ibtplc.com together with the latest annual reports and factsheets.
This Presentation is issued and approved by SV Health Managers LLP. SV Health Managers LLP is authorised and regulated by the Financial Conduct Authority.
Copyright © 2020, SV Health Managers LLP. All rights reserved.
Disclaimer and risk warning

www.ibtplc.com 3
Growth and yieldProvides investors exposure to both
growth and a competitive yield
Diversified portfolioAccess to a broad spectrum of quoted
and unquoted investments
Investment strategyBottom up stock selection with
diversification overlay
InnovationInvested in some of the most innovative
companies in the world
Expert teamMedically and financially experienced
Fund Managers with access to specialists at SV Health
Six key attributes of our Trust
Trust overview
Strong fundamentalsDriven by strong fundamentals of the
Biotech sector

www.ibtplc.com 4
Dr Carl Harald JansonLead Investment Manager,
CEFA, PhD, Medical Doctor
20 years healthcare investing,
7 years pharma industry
experience - including Danske,
H&Q, KD, Astra and Carnegie,
where he managed the
Carnegie Biotech Fund. While
at Carnegie, he was
recognised by Bloomberg as
the world’s top performing
Biotech fund manager.
Ailsa CraigInvestment Manager, BSc
11 years healthcare investing,
3 years as an analyst.
Previously, at Baring Asset
Management as a research
analyst and Insight
Investment/ Rothschild Asset
Management (merged 2003)
within the Global/US
investment team.
Marek PoszepczynskiInvestment Manager, MSc
17 years of international
experience in the life sciences
industry with a focus on
licensing and financing. Marek
has held management
positions at several biotech
companies and participated in
two initial public offerings and
several licensing deals.
Kate Bingham
Investment Manager, MBA
28 years healthcare investing
at SV where she is Managing
Partner. Her biotech
investments have resulted in
the launch of six drugs.
Kate currently serves as the
Chair of the UK Vaccine
Taskforce.
Medical and financial expertise with over 75 years combined experience
Management team
Houman Ashrafian
SV Managing Partner,
BM BCh, DPhil
Houman joined SV in 2016 as
a Venture Partner, was
promoted Managing Partner in
2018. He has founded five SV
portfolio companies. Houman
serves on the Dementia
Discovery Fund (DDF)
Investment Committee and as
a Director of Karus
Therapeutics.

www.ibtplc.com 5
The Trust’s investment team can draw on the wider expertise of SV Health Investors
SV Health Managers LLP - The Trust’s Investment Manager
Biotechnology
Dementia
Healthcare growth
Medtech
A leading healthcare investment manager
Diversified global life sciences franchise started in 1993
Talented team of over 50 experienced investment professionals
and healthcare industry veterans based in Boston and London
Managed or advised International Biotechnology Trust since 2001
USD 3.2bn committed capital
as at 30 June 2020
USD 2.4bn AUM as at 30 June 2020

www.ibtplc.com 6
Total return 1yr (%) 3yr (%) 5yr (%)
International Biotechnology Trust Share Price to 28 August* 18.7 32.3 55.8
International Biotechnology Trust NAV to 31 August 22.4 23.2 40.9
NASDAQ Biotechnology Index (benchmark) to 31 August 20.6 19.6 40.1
FTSE All-Share Index to 28 August* -12.6 -8.2 17.4
NAV and share price have outperformed the NBI over all time periods reported below
The Trust’s performance
Source: SVHM and Bloomberg. Past performance is not a guide to future performance
* Due to 31 August 2020 being a UK public holiday, the Trust’s share price and FTSE All-Share Index performance data is reported to 28 August 2020.

www.ibtplc.com 7
The Trust pays a dividend of 4% of net asset value per annum out of capital reserves
Sufficient capital reserves allows investment policy to be unaffected by dividend
11.5 13.5 14.0 12.4
0
50
100
150
200
250
300
0
2
4
6
8
10
12
14
16
2016/17 2017/18 2018/19 2019/20 2020/21T
ota
l N
AV
(G
BP
) a
t p
rece
din
g y
ea
r e
nd
Div
ide
nd
pe
r sh
are
(G
Bp
)
Dividend per share vs total NAV for thepreceding year end*
First interim dividend Second interim dividend NAV
* NAV at 31 Aug year end sets level of dividend paid out in Jan and Aug the following year
Dividend
Source: SV Health Managers LLP

www.ibtplc.com 8
300
400
500
600
700
800
06/2015 11/2015 04/2016 09/2016 02/2017 07/2017 12/2017 05/2018 10/2018 03/2019 08/2019 01/2020 06/2020
Share Price
NAV per share
Discount
Premium
The Trust actively manages its discount through share buy-backs and issuances
Buybacks
Issuances Issuances
Buybacks
Dividend announced
Discount management
Source: SVHM and Bloomberg. Past performance is not a guide to future performance
Since year end, the Trust has issued 1.6mil shares, growing the Trust by £12.7mil

www.ibtplc.com 9
The Trust is diversified over the following key metrics
Portfolio composition
As at 31 August 2020: NAV of £284m; 69 (93 with SV Fund VI) portfolio companies
Source: SV Health Managers LLP
55%29%
5%7%
4%
Large Cap > USD 10bn
Mid cap USD 2bn - USD 10bn
Small Cap < USD 2bn
SV Fund VI
Directly-held unquoted
35%
39%
26%Profitable
Revenue Growth
Early Stage
31%
27%
13%
5%
4%
3%
2%
15%
Rare disease
Oncology
CNS
Infectious disease
Inflammation
Metabolic
Opthalmology
Other
NAV% by Size
NAV% by Therapeutic Area
NAV% by Development Stage
NAV% by Geography
86%
12%
2%
US & Canada
Europe
United Kingdom

www.ibtplc.com 10
As at 31 August 2020
Top 10 quoted Therapeutics splitGeographic
location£’m
% of
NAV
Horizon Rare diseases US 21.8 7.7
Immunomedics Oncology US 15.8 5.6
Gilead Infectious diseases US 15.1 5.3
BioMarin Rare disease US 14.4 5.1
Acadia CNS US 13.7 4.8
Vertex Rare disease US 13.5 4.8
PTC Therapeutics Rare disease US 11.0 3.9
Genmab Oncology Europe 11.0 3.9
Neurocrine CNS US 9.2 3.2
Chemocentryx Rare diseases US 8.9 3.1
TOTAL 134.4 47.4
Diversification in size and therapeutic area
Top ten quoted holdings
As at 31 August 2020: quoted NAV of £267m; 57 quoted portfolio companies
Source: SV Health Managers LLP* For full portfolio listing, please refer to pages 6 to 9 of the Annual Report.
As at 31 August 2019
Top 10 quoted Therapeutics splitGeographic
location£’m
% of
NAV
Gilead Infectious diseases US 16.5 6.9
Vertex Rare disease US 14.5 6.0
Celgene Oncology US 13.6 5.7
Neurocrine CNS US 13.1 5.5
Amgen Oncology US 11.3 4.7
PTC Therapeutics Rare disease US 8.6 3.6
Alexion Rare disease US 8.5 3.5
Stemline Oncology US 8.2 3.4
Regeneron Ophthalmology US 7.5 3.1
Genmab Oncology Europe 7.1 2.9
TOTAL 108.9 45.3
www.ibtplc.com 11
0%
20%
40%
60%
80%
100%
120%
11
/20
17
12
/20
17
01
/20
18
02
/20
18
03
/20
18
04
/20
18
05
/20
18
06
/20
18
07
/20
18
08
/20
18
09
/20
18
10
/20
18
11
/20
18
12
/20
18
01
/20
19
02
/20
19
03
/20
19
04
/20
19
05
/20
19
06
/20
19
07
/20
19
08
/20
19
09
/20
19
10
/20
19
11
/20
19
12
/20
19
01
/20
20
02
/20
20
03
/20
20
04
/20
20
05
/20
20
06
/20
20
07
/20
20
08
/20
20
09
/20
20
10
/20
20
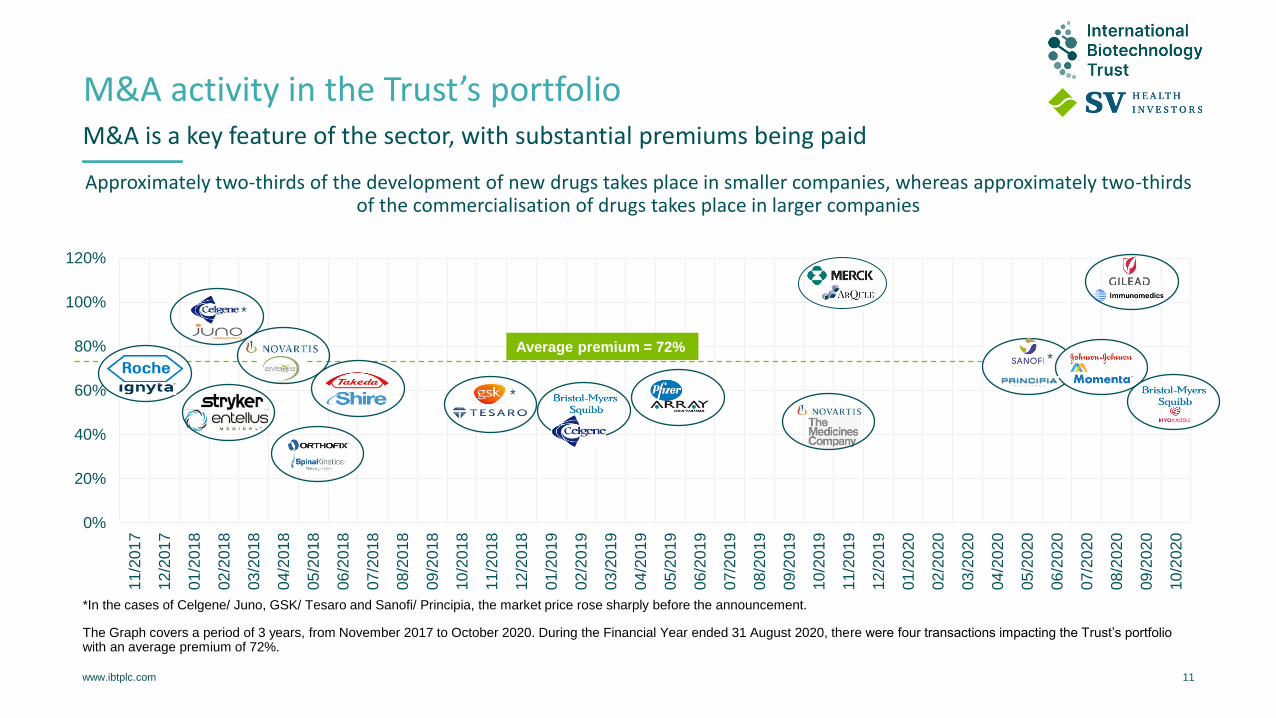
M&A is a key feature of the sector, with substantial premiums being paid
*In the cases of Celgene/ Juno, GSK/ Tesaro and Sanofi/ Principia, the market price rose sharply before the announcement.
The Graph covers a period of 3 years, from November 2017 to October 2020. During the Financial Year ended 31 August 2020, there were four transactions impacting the Trust’s portfolio with an average premium of 72%.
*
*
Average premium = 72%*
Approximately two-thirds of the development of new drugs takes place in smaller companies, whereas approximately two-thirds of the commercialisation of drugs takes place in larger companies
M&A activity in the Trust’s portfolio

www.ibtplc.com 12
Core exposure through a venture fund, offering broad diversification
Unquoted portfolio
Source: SV Health Managers LLP
NAV (£m) as at 31 Aug % NAV as at 31 Aug Number of
2020 2019 2020 2019 Investments
SV Fund VI 21.6* 22.6 7.6% 9.4% 25**
Exited investments with contingent
milestones9.9 6.6 3.4% 2.8% 5
Directly-held unquoted investments 3.8 6.0 1.3% 2.4% 6
Total unquoted portfolio 35.3 35.2 12.3% 14.6% 36
75%
25%
Direct unquoted
U.S. UK/ EU
Maturity of companies
57%
43%
SV Fund VI
Growth stage
Venture stage
100%
Direct unquoted
Growth stage
Sector split
42%
43%
15%
SV Fund VI
Biotechnology
Healthcare services
Medical devices
87%
10%
3%
Direct unquoted
Biotechnology
Healthcare services
Medical devices
Geographic split
84%
16%
SV Fund VI
U.S. EU
*Less net distributions of £4.0mil made by SV Fund VI
**Includes 4 quoted investments as at 31 August 2020.

www.ibtplc.com 13
ValuationModelling and analysis to identify
value opportunities
MonitoringNews flow management and
company meetings
Trading disciplineMethodical approach to timing of
investments and profit taking
Cash/ gearingAnalytical approach to gearing based
on market volatility
Risk mitigationPortfolio construction and reducing
exposure to binary events
The management team has a rigorous, multi-faceted investment process
Investment process
Idea generationMeetings with management and
attendance at conferences

www.ibtplc.com 14
Stock selectionBottom up analysis with top down diversification overlay

www.ibtplc.com 15
0
500
1,000
1,500
2,000
2,500
3,000
3,500
4,000
4,500
5,000
08/2010 08/2011 08/2012 08/2013 08/2014 08/2015 08/2016 08/2017 08/2018 08/2019 08/2020
NASDAQ Biotech Index 2010 - 2020 (USD)
P/E ratio =
14.3x
P/E ratio =
25.9x
Source: Graph data sourced from Bloomberg up to 31 Aug 2020; PE data sourced from EvercoreISI(Large Cap Bio = AMGN, BIIB, GILD, ALXN, REGN)
After a 5-year consolidation, is the biotech sector ready to break out?
Sector update

www.ibtplc.com 16
0
5,000
10,000
15,000
20,000
25,000
30,000
35,000
2010 2011 2012 2013 2014 2015 2016 2017 2018 2019 2020YTD
Number of drugs in development as measured by number of ongoing clinical studies
0
10
20
30
40
50
60
70
2010 2011 2012 2013 2014 2015 2016 2017 2018 2019 2020YTD
Novel drug approvals by U.S. FDA
Source: New clinical studies disclosed per year on clinicaltrials.gov (as of 8 September 2020) Source: U.S. Food and Drug Administration (FDA) (as of 4 September 2020)
Unprecedented levels of innovation driving drug pipeline and approvals
Innovation - more drugs in development

www.ibtplc.com 17
Cell based therapies Gene therapies RNA therapies Gene editing
The transfer of intact, live cells
into a patient
Offsetting the effect of a genetic
mutation by inserting a healthy
version of the gene
Modification or provision of
ribonucleic acid (RNA) to
patients’ cells using messenger
RNA (mRNA)
A type of genetic engineering in
which a mutated gene is
revised, removed or replaced
The Trust invests in some of the most innovative companies in the biotech sector
Innovation - expanding treatment options and modalities

www.ibtplc.com 18
Estimated and projected global population by broad age group, 1950-2100
Demographics driving healthcare spendOver 65s growing fast and set to double
Source: United Nations, World Population Prospects: the 2019 Revision

www.ibtplc.com 19
Sector driving the solution and showing resilience to market turmoil
COVID-19 and the biotech sector
TreatmentsSeveral treatments already approved and
many more being investigated
Vaccines37 vaccines in human trials and 91 vaccines
in earlier stage investigations*
IdentificationRNA analysed and genome sequenced
within one week
Co-operationGlobal co-operation among companies and Governments
Market impactBiotech companies recognised as being part of the pandemic
solution. Solid fundamentals and visibility of earnings underpinned resilience of sector to global turmoil
*Source: New York Times 4 Sept 2020

www.ibtplc.com 20
Trump win + Republican Sen majority Biden win + Republican Sen majority
Likely to remain the status quo Gridlock
Trump win + Democratic Sen majority Biden win + Democratic Sen majority
Gridlock Probability of pricing reform increased but Biden is
industry friendly
Gridlock or a blue sweep?
Biden as president but what about the Senate?
U.S. political backdrop and impact on sector

www.ibtplc.com 21
Portfolio construction Investment process Team
Bottom up approach Disciplined and systematic Expertise
Diversification Proactive Experience/ track record
Medical need Direct company contact Part of the SV Health Investors team
Pricing power Valuation driven Motivated
Venture fund Event forecasting Dedicated
Diversified portfolio - rigorous investment process - focus on risk mitigation - experienced team
Summary
Source: SV Health Managers LLP
www.ibtplc.com 22
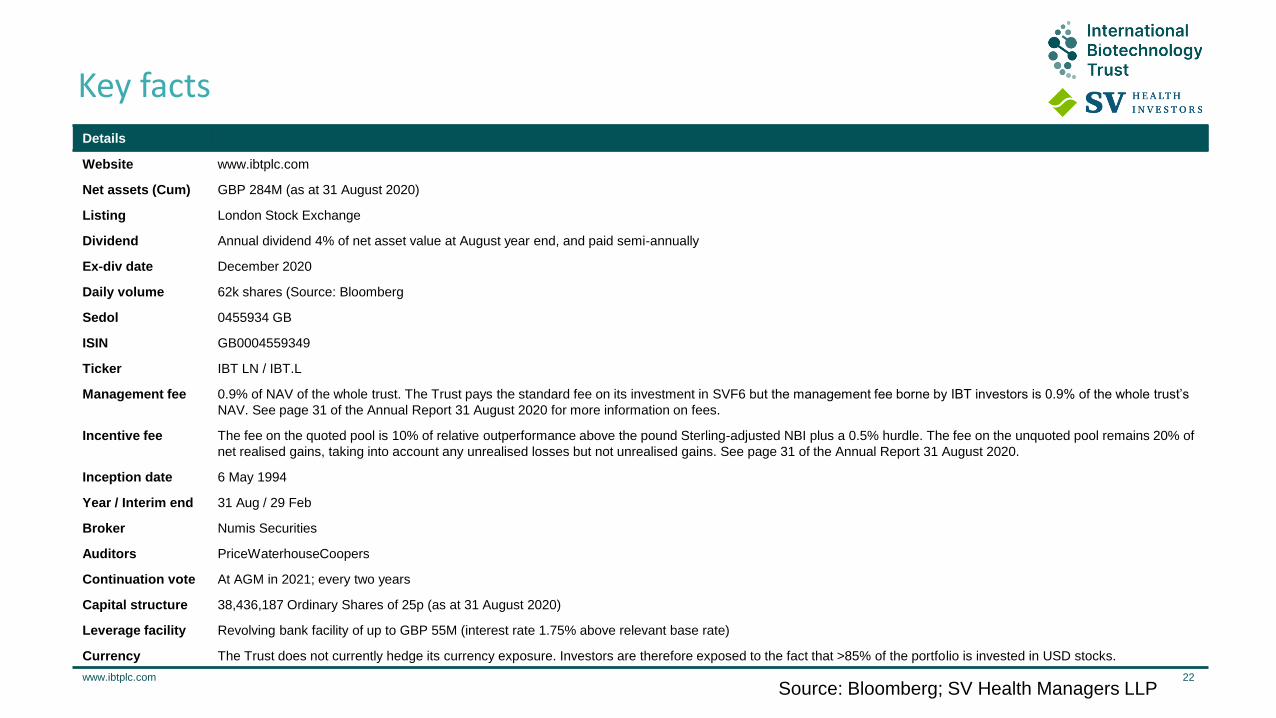
Details
Website www.ibtplc.com
Net assets (Cum) GBP 284M (as at 31 August 2020)
Listing London Stock Exchange
Dividend Annual dividend 4% of net asset value at August year end, and paid semi-annually
Ex-div date December 2020
Daily volume 62k shares (Source: Bloomberg
Sedol 0455934 GB
ISIN GB0004559349
Ticker IBT LN / IBT.L
Management fee 0.9% of NAV of the whole trust. The Trust pays the standard fee on its investment in SVF6 but the management fee borne by IBT investors is 0.9% of the whole trust’s
NAV. See page 31 of the Annual Report 31 August 2020 for more information on fees.
Incentive fee The fee on the quoted pool is 10% of relative outperformance above the pound Sterling-adjusted NBI plus a 0.5% hurdle. The fee on the unquoted pool remains 20% of
net realised gains, taking into account any unrealised losses but not unrealised gains. See page 31 of the Annual Report 31 August 2020.
Inception date 6 May 1994
Year / Interim end 31 Aug / 29 Feb
Broker Numis Securities
Auditors PriceWaterhouseCoopers
Continuation vote At AGM in 2021; every two years
Capital structure 38,436,187 Ordinary Shares of 25p (as at 31 August 2020)
Leverage facility Revolving bank facility of up to GBP 55M (interest rate 1.75% above relevant base rate)
Currency The Trust does not currently hedge its currency exposure. Investors are therefore exposed to the fact that >85% of the portfolio is invested in USD stocks.
Source: Bloomberg; SV Health Managers LLP
Key facts