Embed Size (px)
Citation preview

Investing in Climate Change 2012 Investment Markets & Strategic Asset Allocation: Broadening and Diversifying the Approach
May 2012
Whitepaper available online: http://www.dbcca.com/research
Carbon Counter widget available for download at: www.Know-The-Number.com

Climate Change Investment Research
2 Investing in Climate Change 2012
Mark Fulton Managing Director Global Head of Climate Change Investment Research New York Bruce M. Kahn, Ph.D. Director Senior Investment Analyst New York Camilla Sharples Assistant Vice President New York Jake Baker Assistant Vice President New York Lucy Cotter Associate London Reid Capalino Analyst New York

Table of Contents
3 Investing in Climate Change 2012
Executive Summary............................................................................................................................................................................................ 7
Section I. Strategic Asset Allocation Review .............................................................................................................................................. 7 Section II. Climate Change Investment Markets & Asset Classes ............................................................................................................. 8 Section III. Climate Change Investment Markets: Consensus Outlook ................................................................................................... 10
Section I. Strategic Asset Allocation Review ................................................................................................................................................. 13 Section II. Climate Change Investment Markets & Asset Classes ................................................................................................................ 29
Key Themes ................................................................................................................................................................................................. 29 Pure-Play Clean Energy Investment Overview .......................................................................................................................................... 31 Public Markets ............................................................................................................................................................................................. 33
Introduction............................................................................................................................................................................................. 33 Cleaner Energy ....................................................................................................................................................................................... 34 Agriculture .............................................................................................................................................................................................. 41
Venture Capital and Private Equity ............................................................................................................................................................ 44 Introduction............................................................................................................................................................................................. 44 Clean Energy........................................................................................................................................................................................... 44
Agriculture .............................................................................................................................................................................................. 50 Infrastructure – Asset Financings .............................................................................................................................................................. 54
Introduction............................................................................................................................................................................................. 54 Cleaner Energy ....................................................................................................................................................................................... 55 Agriculture .............................................................................................................................................................................................. 60
Section III. Climate Change Investment Markets: Consensus Outlook ........................................................................................................ 62 Key Themes ................................................................................................................................................................................................. 62 Cleaner Energy ............................................................................................................................................................................................ 66
Solar PV ................................................................................................................................................................................................... 66 Wind Power ............................................................................................................................................................................................. 70 Natural Gas ............................................................................................................................................................................................. 74
Energy Efficiency and Management........................................................................................................................................................... 78
Light Emitting Diodes (LEDs) ................................................................................................................................................................ 78 Industrial Energy Efficiency................................................................................................................................................................... 80 Smart Grid ............................................................................................................................................................................................... 81 Energy Storage ....................................................................................................................................................................................... 84
Sustainable Transportation ........................................................................................................................................................................ 86
Electric Vehicles and Plug-in Hybrid Electric Vechicles ..................................................................................................................... 86 Natural Gas Vehicles .............................................................................................................................................................................. 89 Biofuels ................................................................................................................................................................................................... 90
Agriculture and Water ................................................................................................................................................................................. 93 Agriculture .............................................................................................................................................................................................. 93 Water ....................................................................................................................................................................................................... 95
Appendix I: Risk and Returns for Climate Change Investors ........................................................................................................................ 97 Appendix II: Structural Comparison of Key Climate Indices ....................................................................................................................... 101
Appendix III: Glossary of Key Terms and Indices ........................................................................................................................................ 102

List of Figures
4 Investing in Climate Change 2012
Figure 1: Range of Climate Change Investment Themes and Sectors ......................................................................................................... 13 Figure 2: Climate Change Investment Universe, 2012 ................................................................................................................................... 14 Figure 3: Illustrative Risk Adjusted Portfolio Allocation Framework ........................................................................................................... 15 Figure 4: Example of Portfolio Mix across Climate Scenarios (portfolio to target 7% returns) .................................................................. 17 Figure 5: Risks by Asset Class for Climate Change Strategies .................................................................................................................... 18 Figure 6: Annualized Returns and Volatility across Asset Class Proxies, Traditional Energy and Climate Public Equity Sectors ........ 19 Figure 7: Performance of Pure-Play Equity Indices, Compared to Broader Equity Indices ....................................................................... 20 Figure 8: Performance of Pure-Play Equity Indices, Sector by Sector compared to Broader Equity Indices .......................................... 20 Figure 9: Comparing Relative Performance of Commodities, Land, Infrastructure and Equity ................................................................ 21 Figure 10: Venture Capital, Private Equity and Infrastructure Target and Actual Returns, 1990-2011 ...................................................... 22 Figure 11: Annualized Correlations among Asset Classes ........................................................................................................................... 23 Figure 12: Global Emissions Scenarios and Abatement by Technology ..................................................................................................... 24 Figure 13: Global Natural Gas Consumption, 2008-2035 ............................................................................................................................... 25 Figure 14: Agricultural Production Must Double to Feed the Global Population in 2030 ........................................................................... 26 Figure 15: Business as Usual Approaches will not satisfy growing Demand for Water ............................................................................. 27 Figure 16: DBCCA Sector and Investment Strategy Recommendations by Asset Class for the Climate Change Investor ..................... 28 Figure 17: Annual New Investment in Clean Energy by Region, 2004-2011................................................................................................. 31 Figure 18: Annual New Investment in Clean Energy by Asset Class, 2004-2011 ........................................................................................ 32 Figure 19: Investment Pillars for Public Equities ........................................................................................................................................... 33 Figure 20: Performance of Pure-Play Equity Indices, Compared to Broader Equity Indices (since 2007) ............................................... 34 Figure 21: Indexed Returns of MSCI World and Natural Gas Indices (since 2011) ...................................................................................... 35 Figure 22: Indexed Returns of WTI Oil and Various Gas Commodity Indices (since 2010) ........................................................................ 36 Figure 23: Annual New Clean Energy Public Market Investment by Sector, 2004 - 2011 ............................................................................ 38 Figure 24: Annual New Clean Energy Public Market Investment by Major Country/Region, 2004 - 2011 .................................................. 38 Figure 25: Top 10 Clean Energy IPOs in 2011 ................................................................................................................................................ 39 Figure 26: Global Natural Gas Consumption, 2008-2035 ............................................................................................................................... 40 Figure 27: Launches of “Green” Public Equity Funds, 2001-2011 ................................................................................................................ 41 Figure 28: Indexed Returns of MSCI World, DBIQ and DAX Agriculture Indices (since 2009) ................................................................... 42 Figure 29: Indexed Returns of Key Energy and Agricultural Commodities (since 2006) ............................................................................ 43 Figure 30: The Different Stages of VC and PE Investing ............................................................................................................................... 44 Figure 31: Annual New Clean Energy VC/PE Investment by Major Country/Region, 2004 - 2011 .............................................................. 45 Figure 32: Annual New Clean Energy VC/PE Investment by Sector, 2004 - 2011 ........................................................................................ 46 Figure 33: New “Green” Private Investment Funds Launched by Year and Type ....................................................................................... 47 Figure 34: Type of New “Green” Private Investment Funds Launched by Year (in % terms) ..................................................................... 47 Figure 35: “Green” Private Investment Capital Raised by Vintage Year ...................................................................................................... 48 Figure 36: Targeted and Actual “Green” VC/PE Returns Data ...................................................................................................................... 48 Figure 37: Actual “Green” Venture Stage (LHS) and Growth/Expansion/Buyout Stage (RHS) Funds Performance ................................ 49 Figure 38: Actual “Green” Private Investment Funds Performance ............................................................................................................. 50 Figure 39: New Agriculture VC/PE Funds Launched by Year and Type ....................................................................................................... 51 Figure 40: Type of New Agriculture VC/PE Funds Launched by Year (in % terms) ..................................................................................... 51 Figure 41: Agriculture VC/PE Capital Raised by Vintage Year ...................................................................................................................... 52 Figure 42: Targeted and Actual Agriculture VC/PE Returns Data ................................................................................................................. 52 Figure 43: Actual Agriculture VC/PE Returns Data ........................................................................................................................................ 53 Figure 44: Different Stages of an Energy Infrastructure Project ................................................................................................................... 54 Figure 45: Annual New Clean Energy Investment by Asset Class, 2004 – 2011 .......................................................................................... 55 Figure 46: Percentage Change in Investment by Asset Class Year over Year, 2005-2011 ......................................................................... 56 Figure 47: Annual New Clean Energy Asset Finance Investment by Region, 2004 – 2011 ......................................................................... 56 Figure 48: Annual New Clean Energy Asset Finance Investment by Sector, 2004 – 2011 .......................................................................... 57 Figure 49: Annual New Clean Energy Small Distributed Capacity Investment by Region, 2004 – 2011 .................................................... 58 Figure 50: New “Green” Private Infrastructure Funds Launched by Year ................................................................................................... 59 Figure 51: Targeted and Actual “Green” Infrastructure Returns Data ......................................................................................................... 60 Figure 52: Actual “Green” Infrastructure Returns Data ................................................................................................................................. 60 Figure 53: Annual Global New Additions of Solar PV Generating Capacity (GW), 2005-2013E ................................................................. 66 Figure 54: New Installed Solar PV Capacity in Top 7 Countries, 2007-2012E (GW)..................................................................................... 67 Figure 55: Supply/Demand Balance in the Global PV Industry, 2009-2014E ................................................................................................ 68 Figure 56: Factory Gate Prices for c-Si PV Modules, 2009-2013E................................................................................................................. 68 Figure 57: Gross Margins across the Solar Value Chain, 2012 Q1 ............................................................................................................... 69 Figure 58: Views on Investment in the Solar PV Market ................................................................................................................................ 69 Figure 59: Annual Global New Additions of Wind Power Generating Capacity (GW), 2005-2015E ............................................................ 70 Figure 60: Volatility of US Wind Installations in Years Surrounding PTC Renewal, 1999-2013E (MW) ...................................................... 71 Figure 61: Global Discounted Wind Turbine Capacity Forecast 2009-15E (GW) ......................................................................................... 72 Figure 62: Global Offshore Wind Installations by Region, 2010–15E ........................................................................................................... 72 Figure 63: Views on Investment in the Wind Power Market .......................................................................................................................... 73

List of Figures
5 Investing in Climate Change 2012
Figure 64: Views on the Natural Gas Market – Spotlight on the US.............................................................................................................. 74 Figure 65: Henry Hub Spot Price of Natural Gas, 1995-2015E ...................................................................................................................... 75 Figure 66: US Shale Lifecycle and Key Basin Maturity .................................................................................................................................. 76 Figure 67: Fully Delivered Coal versus Gas Spread, Feb 2005 – May 2011 ($/MWh) ................................................................................... 76 Figure 68: Views on Investment in the Natural Gas Market........................................................................................................................... 77 Figure 69: Views on the LED market ............................................................................................................................................................... 78 Figure 70: Projected growth in LED revenue, 2012-14E ................................................................................................................................ 79 Figure 71: Views on Investment in the LED market ....................................................................................................................................... 79 Figure 72: Sector Margins for Industrial EE Plays at Record Levels, 1990-2012E (may be difficult to increase further) ......................... 80 Figure 73: Views on Investment in Industrial EE ........................................................................................................................................... 81 Figure 74: Views on the Smart Grid Market .................................................................................................................................................... 81 Figure 75: Projected Growth of Non-US Smart Grid Market, 2012-2016E .................................................................................................... 82 Figure 76: European Smart Grid Deployments Expected to Start 2H12, but Begin Large Volumes in 2013 ............................................. 83 Figure 77: Views on Investment in the Smart Grid Market ............................................................................................................................ 83 Figure 78: Views on the Energy Storage Market ............................................................................................................................................ 84 Figure 79: Views on Investment in the Energy Storage Market .................................................................................................................... 85 Figure 80: Views on the EV/PHEV Market ....................................................................................................................................................... 86 Figure 81: Projections for 2020 Penetration of EV+PHEV ............................................................................................................................. 87 Figure 82: Actual, Projected, and Target Costs of Li-ion Battery Packs for EVs ......................................................................................... 87 Figure 83: LiB Market Opportunity in EV/PHEV ............................................................................................................................................. 88 Figure 84: Views on Investment in the EV/PHEV Market ............................................................................................................................... 89 Figure 85: Views on Investment in the NGV Market ....................................................................................................................................... 90 Figure 86: Capacity and Number of Plants for Production of Corn Ethanol, 1999-2012E ........................................................................... 90 Figure 87: Views on Investment in the Biofuels Market ................................................................................................................................ 92 Figure 88: US Farmer Economics by Crop ..................................................................................................................................................... 93 Figure 89: US Corn Stock-to-Use Ratio, 2009/10 – 2012/2013 ....................................................................................................................... 94 Figure 90: Analysis of the Agricultural Value Chain ...................................................................................................................................... 94 Figure 91: Views on Investment in Agriculture .............................................................................................................................................. 95 Figure 92: Views on the Global Water Market ............................................................................................................................................... 95 Figure 93: Views on Investment in the Global Water Market ......................................................................................................................... 96

Editorial Letter
6 Investing in Climate Change 2012
In this fifth year of the Investing in Climate Change Series, we review events in the climate change investment markets over the past 18 months and look to a continued megatrend and broadening opportunity set in the coming years. Much commentary is taken up in relation to renewable energy and wind and solar especially. Public equity markets are the most readily accessible source of “performance” indicators. And there is no doubt that there is substantial uncertainty in some countries over policy and the outlook for pure-play companies in these sectors. Our survey of market performance and expectations in Sections II and III of this paper confirms investor concerns. However, in this edition we are emphasizing the breadth and depth of the climate change investment opportunity both in terms of a wide and deep universe of sectors and technologies, and in terms of the ability to capture this through broad and diversified investment strategies and companies. In effect, investing in more diversified companies with either a multi-sector approach to climate change or a mixed exposure to climate change (vs. other industries) can - combined with corporate leadership in climate change (in terms of market share and a strategic commitment to the industry) – help to lower risk and can give access to a broader range of opportunities. It is certainly not just about pure-play wind and solar public equities! Energy efficiency, agriculture and water all stand out as opportunities that are performing well in relation to mitigation of, and adaptation to, climate change. Renewable energy is still growing strongly in markets like China and Germany. As we have previously discussed, natural gas is a cleaner (and lower emission) energy source than most traditional fossil fuel sources, and is a major and growing global market. This report is split into three separate Sections: (I) a review of how DBCCA has approached Strategic Asset Allocation in recent years, within the context of a broad investment mandate based on a wide and inclusive Climate Change Investment Universe, and a look at current performance attributes of climate change investing; (II) a review of the recent market performance, investment trends, and fund launches and returns of several central components to the climate change investment universe – cleaner energy, energy efficiency and agriculture – across three main asset classes: public markets, venture capital and private equity, and infrastructure; and (III) a survey of the market consensus outlook for most of the key climate change sectors. This review of these specific climate change investment markets and asset classes supports the focus on a broader approach with less emphasis on only “pure-play” clean energy companies and technologies, particularly for public market investors. The wider cleaner energy sector offers a more diverse range of investment opportunities with less exposure to government policy and a greater range of technology and company maturity and diversification. Energy efficiency cuts across the whole economy and remains a key opportunity. Agriculture, meanwhile, also offers substantial investment opportunities, particularly within the venture capital, private equity and infrastructure markets, as it is less subject to commodity and stock price volatility, which has been particularly prevalent recently. Diversified water has outperformed and proven to be a less volatile investment opportunity. Returns in project-based (infrastructure) markets should prove to be more predictable.
Mark Fulton Managing Director Global Head of Climate Change Investment Research New York

Executive Summary
7 Investing in Climate Change 2012
Executive Summary Investing in Climate Change 2012 examines the performance of and outlook for climate change investment opportunities, and continues to broaden the focus of our climate investment universe and the choice of “vehicles” or investment strategies to capture a superior risk adjusted return at an asset class level. In particular, in public equities we recommend looking to more diversified and larger cap companies that offer a wide range of climate solutions, rather than emphasizing “pure-play” companies focusing solely on renewable energy technologies such as wind and solar.
Section I. Strategic Asset Allocation Review1
In Section I we review the Climate Change Investment Universe, examine the historical processes of asset allocation that we have conducted, and look at current performance attributes of climate change investing – including which type of companies and investment strategies work best. Our overall theme is a broadening of the range of climate change opportunities. Historically, our analysis has tended to focus on (narrower) pure-play investment strategies comprising companies engaged in a specific climate change sector. This year, we expand our focus of Investing in Climate Change by broadening the approach to investment strategies (and proxies/indices that illustrate them) that include a broader set of climate change sectors and technology solutions, as well as companies that take a more diversified approach to providing products and services in mitigation and adaptation solutions. By "diversified" companies, we mean: (i) companies that operate across multiple climate change sectors (for example, a company that operates in wind power, water and agriculture); and (ii) companies that operate in one or more climate change sectors, in addition to other (non-climate change related) industries, and that exhibit "climate change leadership" through a strategic commitment and leading market share position in climate change solutions. In general, this implies less emphasis on a revenue threshold for inclusion in a climate change related universe. We then review how DBCCA has approached Strategic Asset Allocation (SAA) in recent years, and put this in the context of a broad investment mandate based on a wide and inclusive investment universe. We use an historical starting analysis to look forward to our expected outcomes. Following on from “Investing in Climate Change 2011”2
, we provide an updated overview of the continued variation in returns across asset class proxies as measured by market indices by sectors, and across time frames. We find that more diversified companies engaged in the climate change sector have out-performed purer play companies (particularly pure-play clean energy stocks), while returns for energy efficiency companies were robust over the past two to three years, but lagged somewhat in 2011. Water and agriculture, meanwhile, have out-performed the broader market substantially on a cumulative basis over the last five years.
Finally, we look at the size of various climate change market opportunities, broken down by sector, and outline our key investment strategies and our expected outlook for climate change investors. Recommendations based on this Section, and Sections II and III, are outlined in the table below.
1 A word about our expected outcomes. First, our expected outcomes reflect performance of a strategy not [historically] offered to investors and do NOT represent returns that any investor actually attained. Backtested results are calculated by the retroactive application of a model constructed on the basis of historical data and based on assumptions integral to the model which may or may not be testable and are subject to losses. Please note that backtested performance results have inherent limitations. The performance results do not represent results of actual trading using client assets, but were obtained by the retroactive application of constraint assumptions to actual allocations. No representation is being made that any account will achieve profits or losses similar to those shown. The results obtained in many cases has been obtained with the use of index performance which is shown for illustrative purposes only and is not intended to predict future performance of any specific investment or Deutsche Asset Management strategy. Deutsche Asset Management products may have experienced negative performance over these time periods. The performance results shown are presented gross-of-fees and do not include the effect of transaction costs, management fees, performance fees or expenses. Past performance is not a guarantee of future results. 2 Access the research report at: http://www.dbcca.com/dbcca/EN/investment-research/investment_research_2361.jsp

Executive Summary
8 Investing in Climate Change 2012
DBCCA Sector and Investment Strategy Recommendations by Asset Class for the Climate Change Investor3
Asset Class Sector Investment Strategy Outlook Risk /Volatility Equity Overall Climate Change Broad/Diversified Positive Medium Sub-Themes
Clean tech Pure-play Negative High Clean tech Broad/Diversified Neutral High
Energy Efficiency (Buildings, Grid, Transport, Industrial)/ Energy Management Broad/Diversified Positive Medium
Energy Efficiency (Buildings, Grid, Transport, Industrial)/ Energy
Management Pure-play Positive Medium Agriculture Broad/Diversified Positive Medium Agriculture Pure-play Positive High Water Broad/Diversified Positive Medium Water Pure-play Positive Medium
Fixed Income Climate Change/Carbon tilt Broad Neutral/Positive Low
PE Clean tech/Agri-tech Pure-play Positive High
VC Clean tech/Agri-tech Pure-play Positive High
Infrastructure Renewable Energy, Natural Gas, Water, Agriculture Broad/Diversified Positive Medium
Real Estate (Land) Agriculture/timber Pure-play Neutral Low
Source: DBCCA analysis 2012
Section II. Climate Change Investment Markets & Asset Classes In Section II we review the historical performance of several key climate change investment markets – cleaner energy (including pure-play clean energy and efficiency, and natural gas) and agriculture – in terms of investment trends, fund launches and fund or stock performance (where relevant). In conducting this analysis we focus on three asset classes: – public markets, venture capital and private equity (VC/PE), and infrastructure. Our analysis supports a view of the current phase of development in global climate change markets where a focus on a broader and more diversified opportunity set, with less emphasis on pure-play companies and technologies, produces better risk adjusted returns. Relative to the overall equity market, there has been more volatility especially in the cleaner energy space, but on a 5 year longer term basis it has only been in the last year that cumulative returns on the broader climate indices have dipped below the wider market. We have always maintained that the climate investment theme is for longer term investors. Agriculture, meanwhile, has also offered
3 Please note certain information in this presentation constitutes forward-looking statements. Due to various risks, uncertainties and assumptions made in our analysis, actual events or results or the actual performance of the markets covered by this presentation report may differ materially from those described. The information herein reflect our current views only, are subject to change, and are not intended to be promissory or relied upon by the reader. There can be no certainty that events will turn out as we have opined herein.

Executive Summary
9 Investing in Climate Change 2012
substantial investment opportunities, particularly for VC/PE investors, as it is less subject to commodity and stock price volatility, which has been particularly prevalent recently. Public Markets 2011 was a very mixed and highly volatile year for investors in general, and the story was no different for investors in the climate change investment universe. Pure-play clean energy public equities had a very poor year in 2011, with 38% decline in the DB Nasdaq OMX Cleantech Index (DBCC) and a 41% decline in the WilderHill New Energy Global Innovation Index (NEX) over the course of the year. The broader HSBC Climate Change (HSCCB) Index performed somewhat better, with a 22% decline; while the even broader MSCI Climate Index did better still with a decline of 16%. However all of these climate indices underperformed the 8% annual decline in the MSCI World Index. With regard to energy efficiency, this sector also performed very poorly in 2011, with a 24% decline in the HSBC Energy Efficiency and Management sub-index. Year-to-date in 2012 (through the end of April), the performance of these indices is vastly improved, with the NEX, DBCC, HSCCB and MSCI Climate indices up between 0.3% and 4.8% – with MSCI Climate the highest performer so far. Energy efficiency has performed even better, with returns of nearly 8.6% in the HSBC EEM sub-index. Nevertheless, the MSCI World is up 9.5% so these indices are still under-performing the broader market. An analysis of the performance of several natural gas indices over the course of 2011 demonstrated market outperformance, with returns ranging between -6% for E&P players (Bloomberg Research Large Cap Natural Gas E&P Index) to +14% for US gas utilities (S&P Natural Gas Utilities Index). Year-to-date in 2012 (through the end of April), the performance of these indices shows a reversal in the performance of US gas utilities, while global gas utilities continue to perform well – the former lost 4.7% while the latter gained 2.7%. Upstream companies have also had a mixed performance, with the Goldman Sachs Custom Natural Gas E&P Index down a significant 11.9% while Large Cap stocks are up 4.1%. Agricultural public equities also clearly out-performed pure-play clean energy in 2011, although they under-performed natural gas and the broader market. The DBIQ Diversified Agriculture Index Excess Return and DAX Agribusiness Index were down 10.7% and 10.2%, respectively. Water investments have tended to be lower volatility than other climate sectors and have provided relatively more stable returns, with considerable outperformance over the last several years. Actual new investment in pure-play clean energy public markets reflects investor uncertainty, with a 16% decrease in total public markets investment, from $14.2 billion in 2010 to $11.9 billion over the course of 2011. This is the lowest annual public markets investment in the sector since 2006, and as of the end of Q1 2012 the situation does not appear to be improving (with investment of only $0.6 billion). Venture Capital and Private Equity (VC/PE) Despite investor uncertainty and associated volatility in clean energy public markets in 2011, VC/PE investment in pure-play clean energy has remained relatively consistent throughout the economic downturn and through 2011 – with investment of $8.9 billion last year, and $1.9 billion in Q1 2012 (a slight increase over $1.8 billion in Q1 2011). This bodes well for continued technological innovation and is particularly prevalent in the US, which accounts for the vast majority of private clean energy investment; >50% since 2007, and a record 68% of a total $8.9 billion of global VC/PE investment in 2011. In terms of VC/PE fund launches and fundraising, however, the ”green” sector still remains challenged, with a decline in the number of funds launched and capital raised. Returns for “green” funds4
4 We define “green” funds as those engaged in clean technology, environmental services and renewable energy. Note that these funds do not have to be solely or even dominantly focused on these sectors, but must be listed in the Preqin database as covering “clean technology, “environmental services” and/or “renewable energy” in order to be included as an eligible fund engaged in the sector
show a wide range in performance, although funds

Executive Summary
10 Investing in Climate Change 2012
in the top decile are beating expected returns, with returns of greater than 73% for private equity stage funds, and nearly 33% for venture-stage funds – or greater than 40% for all types of green private investment funds (including mezzanine, infrastructure, etc.). Agricultural private investment, by contrast, is experiencing a growth trend, despite a lull in 2009, in terms of capital deployed, funds launched and capital raised by VC/PE funds with an interest in the sector. Returns for these funds though, are similarly wide with the top decile of Agricultural funds producing even more impressive returns of greater than 56%. Infrastructure In contrast to public markets, clean energy project financing reached a record annual investment figure of $145.6 billion in 2011, representing 56% of overall investment in all clean energy. In terms of a regional breakdown, China continues to dominate global clean energy infrastructure investing, accounting for 30% of the global total in 2011 as it strives to meet growing energy demand and ambitious clean energy targets. The US rebounded somewhat in 2011, and came a close second at 25%, as wind and solar installations boomed to meet pending federal policy incentive deadlines. Returns are project specific, and depend on the stage of development. Early stage returns are expected to yield high teens falling away with risk at the operational stage to around low double digits. These frequently include subsidies in energy markets and hence carry some risk, at least looking forward (rarely retrospectively), of change. However, strong sales agreements – for example, Power Purchase Agreements (PPAs) or Feed-in Tariffs (FiTs) offer lower risk in terms of forecasting expected cash flows compared to other types of infrastructure. Upstream oil and gas infrastructure investment also hit a new record of greater than $552 billion in 2011 – 8% higher than capital spending in 2010 and 10% higher than the previous peak in 2008. This does not represent only gas infrastructure investing as disaggregating spending between oil and gas sectors is very difficult as most “majors” are integrated oil and gas companies. Nonetheless, this growth trend is representative of the gas industry – as well as oil – and the IEA expects continued growth in the sector, with $9.5 trillion of investment in gas infrastructure over the 2011 to 2035 period. The opportunity to invest in the gas supply chain and power infrastructure is also open to investors as well as the large corporations who tend to dominate the flows. The growth prospects of agricultural infrastructure investment are huge due to rapidly increasing demand for food and upward pressure on prices, particularly from emerging and developing economies. The UN, for example, believes $10 trillion will need to be invested in agricultural infrastructure, research and development by 2050 to ensure sufficient food supplies. Emerging and developing economies are increasingly taking account of this trend, and investing heavily in agricultural infrastructure in order to attract both domestic and foreign investors to the sector. China, for example, is increasing 2012 agricultural infrastructure investing by 10% from 2011 to 2012, targeting $3.8 billion of investment.
Section III. Climate Change Investment Markets: Consensus Outlook In Section III we have also undertaken a nearer term consensus outlook of the status, and key drivers and challenges for the following sectors: pure-play clean energy (solar PV, wind power), cleaner energy (natural gas), energy efficiency (LED lighting, industrial efficiency) and management (energy storage, smart grid), sustainable transportation (electric vehicles & hybrids, and natural gas vehicles), water and agriculture. In order to conduct this analysis we undertook a review of recent research covering these sectors, with a particular focus on investment bank reports. The market believes that the pure play renewable energy sectors, such as wind and solar remain constrained in the face of necessary upstream consolidation and policy uncertainty, particularly in Europe and the US. Long-term drivers for pure-play renewable energy still remain strong, particularly in emerging markets where there is strong power demand growth. However,

Executive Summary
11 Investing in Climate Change 2012
in the shorter term, investing in more diversified companies with either a multi-sector approach to climate change, and/or have a mixed exposure to climate change (vs. other industries) combined with corporate leadership in climate change (in terms of market share and a strategic commitment to the industry), seems to be a more attractive and less risky investment thesis. Cleaner energy technologies, such as natural gas, are also on a more robust growth path at present, as they are more established and lower cost technologies that can provide baseload power and an attractive alternative to traditional coal. Energy efficiency and management remain emerging growth markets, with efficient LED lighting, and industrial energy efficiency expected to become increasingly adopted. There still remains uncertainty in the energy storage area, as technologies have not advanced as rapidly as expected and costs still remain prohibitively high. Similarly the wide-scale adoption of electric vehicles and hybrid electric vehicles have not kept pace with expectations and are now being complemented (or in some cases potentially challenged) by the excitement of natural gas powered vehicles. There is mixed optimism for second generation biofuels (again, due to continued high costs), and tempered near-term growth for first generation biofuels. Pressure on food inventories from a growing population in emerging and developing economies, and changing weather patterns is expected to make all aspects of agriculture very interesting. The value chain is complex and can be fragmented in terms of returns, depending on volatile commodity prices (mostly relevant for public agricultural equities) and ever escalating land prices. Water efficiency in agriculture will continue to an interesting part of the water “story”, particularly in regions facing supply constraints. Water, like food, is an increasingly scarce resource, and this sector thus presents substantial current and future investment opportunities. For this sector to recognize its full potential, however, growing privatization and streamlining of infrastructure development will need to occur. Summary Table of Consensus View of Status, Key Drivers/Challenges and Near-term Outlook for Key Sectors5
Sector Status Key Drivers/Challenges Near-Term Outlook
Solar PV 2011 global market had 27 GW
of demand, $91.6bn of
revenues, module APSs <$1/W,
and nearly 50% excess
production capacity.
Reduction of subsidies in
Germany/Italy/Spain, exit of zero/negative-
margin wafer/cell/module production
capacity.
GW volumes increase slightly but global
revenues decrease slightly (due to
decreasing module prices). Sentiment
toward manufacturers remains negative
until pending rationalization of excess
capacity; low ASPs deter entry of next-
generation technologies.
Wind
Power
2011 global market had 41.6
GW of demand (half of this from
China), $71.5bn in revenues,
and significant excess
production capacity.
Electricity grid challenges in China,
potential expiration of US production tax
credit, growth of off-shore wind
installations.
Similar to solar, GW volumes may increase
but global revenues likely to decrease.
Commentators expect upstream
consolidation via bankruptcy/M&A; access
to offshore market will be a key to survival.
Natural
Gas
In N. America, key story has
been growth of shale gas
production and decline of spot
prices to under $2/MMBtu.
Continued coal-to-gas switching by US
utilities, “standardization” of US shale
production, shift from dry gas plays to wet
gas plays, steady growth of LNG market.
Low spot price of gas in US favors utilities
with under-used gas capacity; mature
phase of shale production favors E&Ps with
large-scale operational expertise; and
growth of LNG market favors integrated
companies with global footprint.
5 Please note certain information in this presentation constitutes forward-looking statements. Due to various risks, uncertainties and assumptions made in our analysis, actual events or results or the actual performance of the markets covered by this presentation report may differ materially from those described. The information herein reflect our current views only, are subject to change, and are not intended to be promissory or relied upon by the reader. There can be no certainty that events will turn out as we have opined herein.

Executive Summary
12 Investing in Climate Change 2012
Sector Status Key Drivers/Challenges Near-Term Outlook
LEDs $11.5bn market segmented
among high-brightness (e.g.
lighting), medium-brightness
(TVs), and low-brightness (cell
phones) applications.
Rising use of LEDs for general lighting
(currently less than 5% socket
penetration), increasing commoditization
of LED chips/components.
LED market increasingly segments
between higher-margin, faster-growing
general lighting segment and lower-margin,
slower-growing medium/low-brightness
segments. Downstream best positioned.
Industrial
EE
Diversified sector that from
2004-2011 grew at 5%+ CAGR
(BRICs key drivers).
Rising resource prices and stricter
environmental regulation, but also
headwinds from slower growth in BRICs.
Generally bullish as widespread potential
for strong earnings growth; greening data
centers could be key growth market.
Energy
Storage
Deployment of battery storage
systems increasing, but market
still in embryonic stage.
Cost trajectory of Li-ion batteries,
increasing penetration of variable
renewable generation.
Cheaper Li-ion batteries open new
applications, but market still awaits
“breakthrough” technology with capex of
~$100/kWh (vs. $700/kWh for Li-ion).
Smart Grid Majority of activity has come via
orders from N. American utilities
(backed by federal stimulus
dollars).
EU mandate for 80% smart metering by
2022; smart meter deployment in Japan,
Thailand, S. Korea
Led by France/UK/Spain, non-US market
grows to > $3bn in 2015 (vs. $0.5bn in
2012). Commoditization of advanced
meters means more upside in
data/analytics/software companies. 2012
likely to see M&A and IPO activity.
EV/PHEV 70 million units sold in 2011
marked first step toward
commercially-relevant volumes
– but EV/PHEV still a rounding
error in global auto market.
Cost trajectory for Li-ion batteries,
gasoline prices, durability of government
rebates.
Falling costs for Li-ion batteries shorten
paybacks and spur adoption, but estimates
for 2020 penetration vary from 3% - 15%.
$9-$17bn incremental opportunity by 2015
is positive for battery manufacturers, but
winning chemistry still an open question.
NGVs NGVs currently 1% of global
vehicle sales (0.1% in US)
Spread between natural gas and diesel
prices, public emphasis on more fuel-
efficient forms of transport.
Entry of gas producers and OEMs sets
stage for volume growth in 2014+; refueling
infrastructure remains key bottleneck.
Biofuels 34bn gallon/yr biofuels market
reached a record $83bn in
2011. Brazil (sugar-based) and
US (corn-based) are dominant
ethanol producers. Biofuels still,
however, less than 2% of $1.5T
transportation fuels market (2nd-
gen biofuels less than 0.1%).
Rising US policy mandates for
advanced/cellulosic biofuels, continually
high oil prices.
Negligible growth in production of
corn/sugar ethanol, but substantial growth
in production of advanced/ cellulosic
biofuels as 12+ demonstration projects
come online. $1-2bn of biofuel-related
IPOs in the pipeline for 2012.
Agriculture $100bn+ US net farm income in
2011 was all-time high.
Growing incomes/population in Asia and
LatAM drive higher grain/protein demand.
High grain prices mean profits for farmers
and seed/fertilizer companies but squeezed
margins for protein producers.
Water $500bn global market growing
at 4-6% CAGR (with BRICs as
chief demand drivers).
Regional supply-demand imbalances that
spur new investment in water
treatment/efficiency solutions; budget
crunches that spur privatization of water
infrastructure.
Promising opportunities in desalination,
wastewater treatment, and water efficiency
solutions (e.g. leak detection).
Infrastructure investors must balance
attractive returns but also significant
political risks.
Source: DBCCA analysis, 2012.

Strategic Asset Allocation Review
13 Investing in Climate Change 2012
Section I. Strategic Asset Allocation Review
Introduction In this Section we review the investment universe, examine the historical processes of asset allocation that we have conducted, and look at current performance attributes of climate change investing – including which type of companies and investment strategies work best. Our overall theme is a broadening of the range of climate change opportunities.
The Climate Change Investment Universe As we have previously stated in our “Investing in Climate Change” Series, we define the Climate Change Investment Universe as those technologies, sectors and companies that mitigate climate change by developing low-carbon emissions technologies; or those that adapt to climate change (Figure 1 below shows this at a sector level). We have always pointed out this represents a broad core infrastructure theme in economies. Figure 1: Range of Climate Change Investment Themes and Sectors
Source: DBCCA analysis 2011
At a more technology-focused level, over the last few of years in energy we have expanded our thinking to increasingly focus on the broader definition of “cleaner” energy. This broader definition includes fuels and technologies such as natural gas and combined heat and power, which although they still generate fossil fuel-based power, represent cleaner and more efficient types of energy than many of those in dominant use today – most notably, traditional coal plants. This shows up in our overall Climate Change Investment Universe which encapsulates our sectors and the technologies that drive them under 3 key overall themes as shown in Figure 2 below.
Mitigation Adaptation
Cleaner Energy Agriculture
Energy Efficiency Water
Transport Waste
Carbon Markets
Climate Change Investment

Strategic Asset Allocation Review
14 Investing in Climate Change 2012
Figure 2: Climate Change Investment Universe, 2012
Source: DBCCA analysis 2012 Source: DBCCA analysis 2012
The question is then how to capture these technologies and sector opportunities in companies and investment strategies in investment “vehicles”. The first stage of that is identifying the opportunities at the asset class level (public markets, VC/PE, etc.). Then it is a matter of specific investment strategies (funds, indices, etc.) that can access companies and projects that feed into these asset classes. Our analytical focus in Investing in Climate Change has always been focused on trends at the technology or market level, feeding into investment strategies and asset classes, not at the specific company and project level.
However, in looking at investment strategies, particularly in the public equity space, historically our analysis tended to focus on (narrower) pure-play companies engaged only in one specific climate change sector yielding a high revenue contribution. This year, we expand our focus of Investing in Climate Change by broadening the approach to investment strategies (and proxies/indices that illustrate them) that include a broader set of climate change sectors and technology solutions, as well as companies that take a more diversified approach to providing products and services in mitigation and adaptation solutions. By "diversified" companies, we mean: (i) companies that operate across multiple climate change sectors (for example, a company that operates in wind power, water and agriculture); and (ii) companies that operate in one or more climate change sectors, in addition to other (non-climate change related) industries, and that exhibit "climate change leadership" through a strategic commitment and leading market share position in climate change solutions. In general, this implies less emphasis on a revenue threshold for inclusion in a climate change related universe. Historical Review of Strategic Asset Allocation At DBCCA, our investment thesis rests on the longer-term mega-trend of climate change which creates various opportunities and risks across asset classes, particularly as markets, economies and policy support for climate change industries can be
Transport High ef f iciency / lower emissions vehicles Sustainable biofuels Flex fuel vehicles Hybrids Electric vehicles Battery technology Natural gas vehicles Hydrogen fuel cells
Water Filtration & membrane technology Purif ication & disinfection: pre-chlorination,
coagulation, sedimentation Equipment: pipes, valves, etc. Safe chemicals Desalination Distribution & management: monitoring &
metering Energy recovery devices Wastewater treatment
Agriculture (Climate) smart machinery (Climate) smart irrigation Seeds & breeding technologies: GMO’s &
hybrids Clean/bio pesticides & fungicides Smart fertilizers GIS management systems
Waste Management Recycling & e-cycling Advanced/sustainable materials Anaerobic digestion Mechanical heat and biologic treatment Waste to energy Land remediation Material mgmt strategies Advanced waste sorting
Building Efficiency Eff icient & LED lighting Advanced materials Micro generation / CHP Retrof its, ESCO & Energy Services Advanced/ef ficient appliances & lighting Heating & cooling systems Building mgmt: home energy displays &
smart meters District power/heat networks
Power Grid Efficiency Energy mgmt systems Inf rastructure: advanced metering, UHV
transmission, electric charging Storage: compressed air, batteries, f lywheels Wide area monitoring Smart grid Distributed grid Grid security
Power Generation Solar (PV, CSP, thermal) Wind (onshore, of fshore) Other clean power (geothermal, hydro, landf ill
gas, marine, tidal, etc.) Fuel switch: coal to natural gas/ biomass;
biomass to biomethane Clean coal and gas (CCS) Nuclear f ission Increased ef f iciency Combined heat and power Mass energy storage Fuel cells Future breakthrough technologies (e.g.
nuclear fusion)
Industrial Efficiency Expanded, ef ficient technology products Recycling of steel Valve f itting and improvements Speed controls Waste heat recovery Insulating distribution systems Membrane use Low carbon cement
Cleaner Energy Environmental ResourcesEnergy & Material Efficiency

Strategic Asset Allocation Review
15 Investing in Climate Change 2012
volatile and require sector-specific, in-depth understanding and active management. Figure 3 below provides an overview of the asset allocation process that occurs when making investments to include the climate change opportunity: an in depth analysis of asset class attributes, sector selection and risk exposure. Markets, such as the public equity markets, are volatile and movements in prices can be dramatic. Economic cycles are also volatile, and the recent recession is evidence that systemic risk can impact all asset values. Many cleaner energy (both power and transport) technologies are in different maturity stages, and therefore require different levels of funding, coming from different sources of capital. Often financing of renewable energy will be subject to a variable rate of adoption and commercialization of new technologies. And finally government policy volatility, or more obviously lack of policy, can result in short-term asset mispricing and a reluctance to deploy capital. This policy uncertainty has been a particular issue over the last couple of years, having severe impacts on pure-play clean energy markets, once again reinforcing our view of the need to take a wider perspective on the Climate Change Universe when considering potential investment opportunities. Figure 3: Illustrative Risk Adjusted Portfolio Allocation Framework
Source: DBCCA analysis 2012 At a fundamental level some asset owners or managers could incorporate climate change factors and analyses into their existing asset class strategies. We call this the Integrated Investment Process approach, where climate change investment analysis becomes integrated into overall risk and return analysis. At DBCCA, we have long held that investing with or through the lens of climate change requires a bottoms–up approach through stock, bond, private company or project analysis which can be variously applied to many investment opportunities.
BondsPublic equityInfrastructure
PE / VC
Cleaner energyEnergy efficiency
TransportAgriculture
WasteWater
Asset Allocation
Sector Selection
Themed Investment Strategies
Risk ExposureMarket Price, Policy, Climate, Economic, Technology
Asset Class SelectionRisk, Target return, Liquidity, Geography
Risk A
djusted Portfolio Allocation
Integrated Investment Process

Strategic Asset Allocation Review
16 Investing in Climate Change 2012
However, our focus has been more on how to identify and measure “themed” investment strategies, as well as incorporating them into a top-down approach known as Strategic Asset Allocation (SAA). In our first attempt at incorporating climate change into asset allocation – “Investing in Climate Change 2009: Necessity and Opportunity in Turbulent Times”6
– we took the approach of classical portfolio theory, suggesting that a portfolio seeking to reach its efficient frontier could include climate change sectors. From a historical perspective, public equity portfolios that included climate change sector exposure did shift along the efficient frontier thereby increasing returns with a slight increase in total portfolio volatility versus the traditional portfolio. The addition of climate change assets therefore improved the efficient frontier. Incremental increases in return were associated with each increase in allocation with similar measures of risk. This indicated to us the positive impact of climate change sectors on portfolio performance.
The previous analysis was admittedly focused on the public equity asset class during a “bull” market, so therefore our subsequent work sought to explore risk and return from the perspective of a Chief Investment Officer of an institutional investor by incorporating climate change into an overall portfolio – “Investing in Climate Change 2010: A Strategic Asset Allocation Perspective”7
. We started with a SAA with a traditional portfolio representing the investment allocation of a typical institutional investor. Then in order to test the impact of the Climate Change theme, we used proxies for each asset class for climate change. We then developed views of how the traditional asset classes and the climate change themes would perform in the future. This was done by evaluating past returns and volatility of the traditional asset classes as well as the relative performance of the climate change proxies within each asset class.
Our results were based on a total allocation to climate change sectors of 6% of the total portfolio with a simulated mean return and volatility. Notably, the climate change sectors were highly correlated to each other in public equity markets; while private equity showed moderate correlation and bonds showed very low correlation to the equity markets. The modest correlation to private equity and infrastructure demonstrates the diversification benefits in portfolio construction. Using the results of the model, we looked at the probability of achieving a target return of 6% with the addition of climate change. The probability of achieving the target return increased in the portfolio integrating climate change. Our conclusion again, was that that allocating to climate change offered investors a greater probability of achieving the target returns and that climate change allocations had a positive impact on investment performance. See Appendix I for a fuller discussion of these findings. However, this exercise had some limitations. Firstly, the adoption rate of this level of climate investment modeling among institutional investors proved to be limited. On top of this, growing recessionary pressures, and deteriorating market conditions, dictated a much more conservative perspective to overall asset allocation and some key climate themes such as pure-play clean energy suffered. Therefore we sought in our 2011 series – “Investing in Climate Change 2011: The Mega-Trend Continues – Exploring Risk and Return”8 – to examine, qualitatively, the risks associated with climate change investing. It was good timing, as Mercer Investment Consulting was also running some quantitative studies on the risk of climate change and the role of climate change (including themed strategies) in SAA in a portfolio, concluding that climate change increases uncertainties for institutional investors that can potentially have a significant impact on the performance of a portfolio mix over the long-term9
. In addition, they concluded that investment flows from long-term institutional investors will be those that take the lead in finding alternative sources of energy, improving efficiency, reducing carbon emissions and investing in new technological developments such as in agriculture and water. Mercer’s analysis suggests that under certain scenarios, a typical portfolio seeking a return of 7% could manage the risk of climate change by ensuring ~40% of assets are held in a range of different, but climate-sensitive assets including themed strategies. Figure 4 below illustrates their example of asset class portfolio mixes by climate scenario.
6 Access the research report at: http://www.dbcca.com/dbcca/EN/_media/DBCCA_Investing_in_CC_09.pdf 7 Access the research report at: http://www.dbcca.com/dbcca/EN/_media/InvestingInClimateChange2010.pdf 8 Access the research report at: http://www.dbcca.com/dbcca/EN/investment-research/investment_research_2361.jsp 9 “Climate Change Scenarios: Implications for Strategic Asset Allocation”, Mercer Investment Consulting, Responsible Investment Team, 2011

Strategic Asset Allocation Review
17 Investing in Climate Change 2012
Figure 4: Example of Portfolio Mix across Climate Scenarios (portfolio to target 7% returns)10
Source: “Climate Change Scenarios: Implications for Strategic Asset Allocation”, Mercer Investment Consulting, Responsible Investment Team, 2011
We applauded the Mercer report and expounded on their themes in 2011 by examining how markets, economies and policy support for climate change industries can generate asset-class specific risks that require in-depth understanding and active management. We examined how these risks manifest in the different asset classes and we made specific recommendations on how to manage these risks. We mapped economic and market risk, technology risk, and climate policy risk against bonds, public markets, VC/PE, and infrastructure11
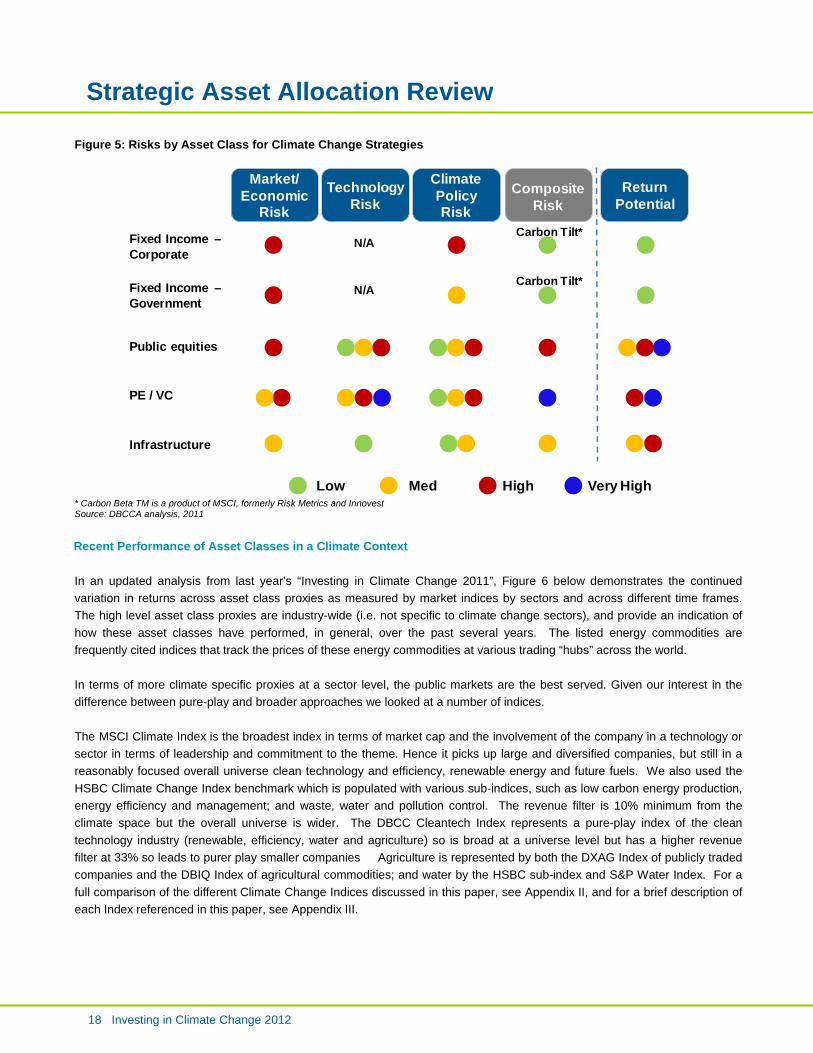
. And while the above-mentioned risks certainly require management, the returns investors look for partly reflect the nature of the asset classes and are commensurate with the risks inherent in each asset class. The resulting overview of risk analysis by asset class for climate change strategies is outlined in Figure 5 below.
10 Represents backtested performance data. No assurance is made that similar results will be achieved. Past performance is no guarantee of future results. 11 Access the research report at: http://www.dbcca.com/dbcca/EN/investment-research/investment_research_2361.jsp
Strategic Asset Allocation Review
18 Investing in Climate Change 2012
Figure 5: Risks by Asset Class for Climate Change Strategies
* Carbon Beta TM is a product of MSCI, formerly Risk Metrics and Innovest Source: DBCCA analysis, 2011
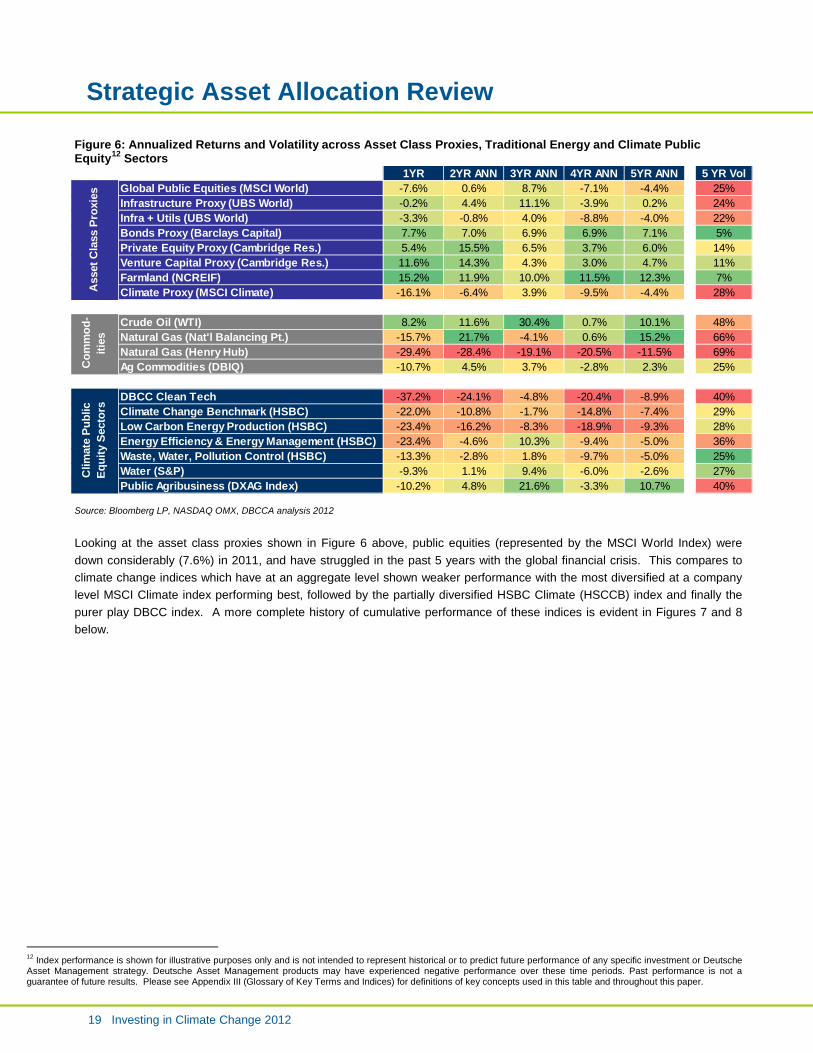
Recent Performance of Asset Classes in a Climate Context In an updated analysis from last year’s “Investing in Climate Change 2011”, Figure 6 below demonstrates the continued variation in returns across asset class proxies as measured by market indices by sectors and across different time frames. The high level asset class proxies are industry-wide (i.e. not specific to climate change sectors), and provide an indication of how these asset classes have performed, in general, over the past several years. The listed energy commodities are frequently cited indices that track the prices of these energy commodities at various trading “hubs” across the world. In terms of more climate specific proxies at a sector level, the public markets are the best served. Given our interest in the difference between pure-play and broader approaches we looked at a number of indices. The MSCI Climate Index is the broadest index in terms of market cap and the involvement of the company in a technology or sector in terms of leadership and commitment to the theme. Hence it picks up large and diversified companies, but still in a reasonably focused overall universe clean technology and efficiency, renewable energy and future fuels. We also used the HSBC Climate Change Index benchmark which is populated with various sub-indices, such as low carbon energy production, energy efficiency and management; and waste, water and pollution control. The revenue filter is 10% minimum from the climate space but the overall universe is wider. The DBCC Cleantech Index represents a pure-play index of the clean technology industry (renewable, efficiency, water and agriculture) so is broad at a universe level but has a higher revenue filter at 33% so leads to purer play smaller companies Agriculture is represented by both the DXAG Index of publicly traded companies and the DBIQ Index of agricultural commodities; and water by the HSBC sub-index and S&P Water Index. For a full comparison of the different Climate Change Indices discussed in this paper, see Appendix II, and for a brief description of each Index referenced in this paper, see Appendix III.
Fixed Income –Corporate
Public equities
PE / VC
Infrastructure
Fixed Income –Government
Low Med High
Climate Policy Risk
Market/Economic
Risk
Return Potential
CompositeRisk
Carbon Tilt*
TechnologyRisk
N/A
N/A
Very High
Carbon Tilt*
Strategic Asset Allocation Review
19 Investing in Climate Change 2012
Figure 6: Annualized Returns and Volatility across Asset Class Proxies, Traditional Energy and Climate Public Equity12
Sectors
Source: Bloomberg LP, NASDAQ OMX, DBCCA analysis 2012
Looking at the asset class proxies shown in Figure 6 above, public equities (represented by the MSCI World Index) were down considerably (7.6%) in 2011, and have struggled in the past 5 years with the global financial crisis. This compares to climate change indices which have at an aggregate level shown weaker performance with the most diversified at a company level MSCI Climate index performing best, followed by the partially diversified HSBC Climate (HSCCB) index and finally the purer play DBCC index. A more complete history of cumulative performance of these indices is evident in Figures 7 and 8 below.
12 Index performance is shown for illustrative purposes only and is not intended to represent historical or to predict future performance of any specific investment or Deutsche Asset Management strategy. Deutsche Asset Management products may have experienced negative performance over these time periods. Past performance is not a guarantee of future results. Please see Appendix III (Glossary of Key Terms and Indices) for definitions of key concepts used in this table and throughout this paper.
1YR 2YR ANN 3YR ANN 4YR ANN 5YR ANN 5 YR VolGlobal Public Equities (MSCI World) -7.6% 0.6% 8.7% -7.1% -4.4% 25%Infrastructure Proxy (UBS World) -0.2% 4.4% 11.1% -3.9% 0.2% 24%Infra + Utils (UBS World) -3.3% -0.8% 4.0% -8.8% -4.0% 22%Bonds Proxy (Barclays Capital) 7.7% 7.0% 6.9% 6.9% 7.1% 5%Private Equity Proxy (Cambridge Res.) 5.4% 15.5% 6.5% 3.7% 6.0% 14%Venture Capital Proxy (Cambridge Res.) 11.6% 14.3% 4.3% 3.0% 4.7% 11%Farmland (NCREIF) 15.2% 11.9% 10.0% 11.5% 12.3% 7%Climate Proxy (MSCI Climate) -16.1% -6.4% 3.9% -9.5% -4.4% 28%
Crude Oil (WTI) 8.2% 11.6% 30.4% 0.7% 10.1% 48%Natural Gas (Nat'l Balancing Pt.) -15.7% 21.7% -4.1% 0.6% 15.2% 66%Natural Gas (Henry Hub) -29.4% -28.4% -19.1% -20.5% -11.5% 69%Ag Commodities (DBIQ) -10.7% 4.5% 3.7% -2.8% 2.3% 25%
DBCC Clean Tech -37.2% -24.1% -4.8% -20.4% -8.9% 40%Climate Change Benchmark (HSBC) -22.0% -10.8% -1.7% -14.8% -7.4% 29%Low Carbon Energy Production (HSBC) -23.4% -16.2% -8.3% -18.9% -9.3% 28%Energy Efficiency & Energy Management (HSBC) -23.4% -4.6% 10.3% -9.4% -5.0% 36%Waste, Water, Pollution Control (HSBC) -13.3% -2.8% 1.8% -9.7% -5.0% 25%Water (S&P) -9.3% 1.1% 9.4% -6.0% -2.6% 27%Public Agribusiness (DXAG Index) -10.2% 4.8% 21.6% -3.3% 10.7% 40%
Ass
et C
lass
Pro
xies
Com
mod
- iti
esC
limat
e Pu
blic
Eq
uity
Sec
tors

Strategic Asset Allocation Review
20 Investing in Climate Change 2012
Figure 7: Performance of Pure-Play Equity Indices, Compared to Broader Equity Indices
Note: Indexed to 100 as of Jan 1 2007 Source: Bloomberg LP, NASDAQ OMX, DBCCA analysis 2012
Figure 8: Performance of Pure-Play Equity Indices, Sector by Sector compared to Broader Equity Indices
Note: Indexed to 100 as of Jan 1 2007 Source: Bloomberg LP, NASDAQ OMX, DBCCA analysis 2012
20
40
60
80
100
120
140
160
180
Jan-
07
Apr-
07
Jul -0
7
Oct
-07
Jan-
08
Apr-
08
Jul-0
8
Oct
-08
Jan-
09
Apr-
09
Jul -0
9
Oct
-09
Jan-
10
Apr-
10
Jul-1
0
Oct
-10
Jan-
11
Apr-
11
Jul-1
1
Oct
-11
Jan-
12
Apr-
12
Clos
ing
Price
(Ind
exed
)
MSCI World
MSCI Climate
HSBC Climate Change
DB Nasdaq Cleantech
NEX Wilderhill Clean Energy
20
40
60
80
100
120
140
160
Jan-
07M
ar-0
7
May
-07
Jul-0
7
Sep-
07
Nov-
07
Jan-
08
Mar
-08
May
-08
Jul-0
8
Sep-
08
Nov-
08
Jan-
09M
ar-0
9
May
-09
Jul-0
9
Sep-
09
Nov-
09
Jan-
10M
ar-1
0
May
-10
Jul-1
0
Sep-
10
Nov-
10
Jan-
11M
ar-1
1
May
-11
Jul-1
1
Sep-
11
Nov-
11
Jan-
12
Mar
-12
Clos
ing
Price
(Ind
exed
)
MSCI WorldS&P WaterHSBC Climate ChangeHSBC Energy Efficiency & ManagementHSBC Water, Waste & Pollution ControlHSBC Low Carbon Energy Production

Strategic Asset Allocation Review
21 Investing in Climate Change 2012
As Figures 7 and 8 above demonstrate, starting in 2007 when climate change and related companies really emerged as targets of specific investor interest, substantial market out-performance occurred. Although there was even then a great deal of volatility, none of these climate indices (except for the pure-play NEX Wilderhill index) starting underperforming on a cumulative basis until the second quarter of 2011 when the purer play clean energy stocks (wind and solar) in particular really suffered due to industry and policy dynamics (for a fuller discussion of these dynamics, see Section II of this paper). This has not reversed as yet in 2012 – although there has been a marginal improvement, it is not as substantial as the bounce back in broader markets, as represented by the 9.5% rise in the MSCI World through the end of April 2012 . Furthermore, when looking at sub-indices in Figure 8, such as that of the HSBC sub-index of Energy Efficiency and Management (EEM), over a medium to longer-term view (in this case, a 3-year view), these stocks have out-performed and generally kept pace with overall markets in other time frames. In 2011, however, energy efficiency stocks did not perform well, with a 24% decline in the HSBC Energy Efficiency and Management sub-index. Year-to-date in 2012 (through the end of April), however, the energy efficiency has rebounded, with returns of nearly 8.6% in the HSBC EEM sub-index. Water, meanwhile, has outperformed the market very considerably, as represented by the S&P Water index, and to a lesser extent, by the HSBC Water, Waste and Pollution Control sub-index. In fact, the former index has been the highest out-performer of all climate change indices on a cumulative basis since 2007, as is clearly evident from Figure 8. The agribusiness sector has also significantly out-performed all other indices, although with high volatility – as is evident from Figure 9 below. Figure 9: Comparing Relative Performance of Commodities, Land, Infrastructure and Equity
Source: Bloomberg LP, Cambridge Associates, DBCCA analysis 2012
Figure 9 above shows the relative performance of various proxies since 2005. The following conclusions can be reached: Infrastructure (represented by the UBS Global Infrastructure Index) stayed relatively flat (-0.2%) while the better
performing “green” VC/PE infrastructure funds, outlined in Figure 10 below, have produced returns up to 21%. These “green” funds are most likely well diversified rather than just pure play.
0
50
100
150
200
250
300
Dec-
05
Mar
-06
Jun-
06
Sep-
06
Dec-
06
Mar
-07
Jun-
07
Sep-
07
Dec-
07
Mar
-08
Jun-
08
Sep-
08
Dec -
08
Mar
-09
Jun-
09
Sep-
09
Dec-
09
Mar
-10
Jun-
10
Sep-
10
Dec-
10
Mar
-11
Jun-
11
Sep-
11
Dec-
11
Mar
-12
Clos
ing
Pric
e (In
dexe
d)
MSCI World UBS Global Infrastructure
DBIQ Diversified Agriculture Excess Return DAX Global Agribusiness
NCREIF Total Return Farmland UBS Global Infrastructure and Utilities 50-50
Cambridge Associates PE Cambridge Associates VC

Strategic Asset Allocation Review
22 Investing in Climate Change 2012
We also have the NCREIF Farmland index which represents US Farmland. Infrastructure, VC and PE returns are captured as best as possible through fund returns, which are highly dispersed and so we show a range.
Venture capital and private equity (represented by Cambridge Research VC and PE quarterly returns) yielded
positive returns. Again best in class “green” and agricultural VC/PE funds were able to deliver strong returns, but the dispersion is high.
Bonds (as exhibited in Figure 6) have overall been a diversifier for volatile equity markets the past few years,
although also in some markets have suffered from the debt crisis. Climate change fixed income strategies are only recently emerging, and we expect to follow their progress in coming years.
Energy commodities have experienced even greater volatility than equities over the past four years, and US natural
gas prices continued their downward plunge in 2011, with UK natural gas prices not far behind. Meanwhile crude oil, although experiencing considerable volatility, has been on an upward trajectory recently, and has yielded positive returns for investors. For correlations of each asset class, please see Figure 11 below.
Clearly those asset classes that are not as subject to the vagaries of the public markets performed better, which is unsurprising given the extreme volatility of public equities over the past four years (i.e. since the end of 2007). For example, a more granular look at venture capital, private equity and infrastructure returns in the “green” and agricultural sectors demonstrates potential for significant out-performance – as outlined in Figure 10 below. These returns are discussed in greater depth in Section II of this paper. Figure 10: Venture Capital, Private Equity and Infrastructure Target and Actual Returns, 1990-201113
Type of Investment Target Returns Actual Returns “Green” VC/PE Equity Investment 25%+ -51% to 106%
Agriculture VC/PE Equity Investment 25%+ -100% to +165%
“Green” Infrastructure Equity Investment 12% to 18% -13% to +21%
“Green” Infrastructure Debt Investment 6% to 10% -13% to +21%
Note: For more detailed information on fund performance across sub-sectors, please see Figures 38, 43, 51, and 52. Returns data is as of the end of 2011 since fund inception (i.e. vintage year), for all funds with reported returns. Vintage years vary from 1990 – 2011. These funds may be still actively investing and thus the returns to date will not necessarily reflect the final returns of the fund once it reaches the end of its "lifetime." All data is at a fund level, and is net to investor. Source: Preqin 2012, DBCCA analysis 2012.
Asset classes that are highly correlated with one another include equity based asset classes. Fixed income, land and commodity asset classes tend to be less correlated with land being the least correlated to any other asset class. VC and PE are also less correlated. Much of the climate change investment opportunities beyond equities lie in infrastructure and including waste and water infrastructure, strongly associated with utilities. Both these indices are highly correlated with equity but are themselves equity proxies, so, in our opinion do not accurately reflect the underlying characteristics of infrastructure projects. We believe those returns would be more similar to a fixed income stream in the high single digits to low double digits.
13 Please see Appendix III (Glossary of Key Terms and Indices) for definitions of key concepts used in this table and throughout this paper
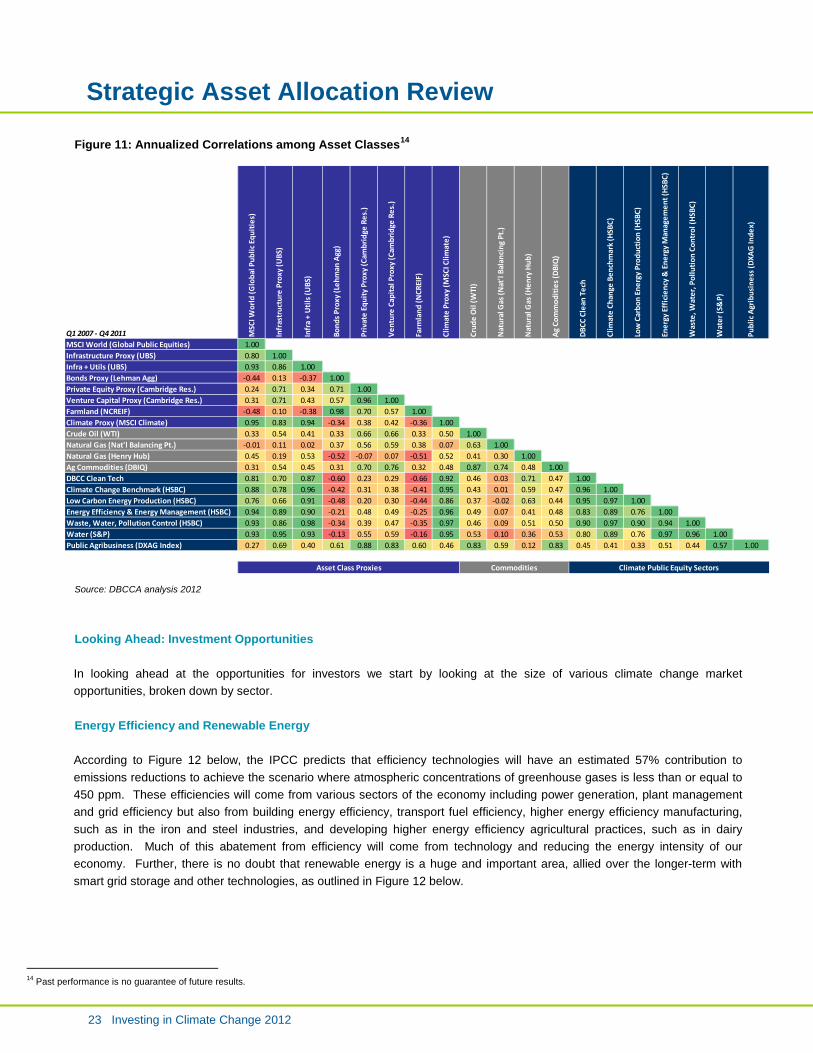
Strategic Asset Allocation Review
23 Investing in Climate Change 2012
Figure 11: Annualized Correlations among Asset Classes14
Source: DBCCA analysis 2012
Looking Ahead: Investment Opportunities In looking ahead at the opportunities for investors we start by looking at the size of various climate change market opportunities, broken down by sector. Energy Efficiency and Renewable Energy According to Figure 12 below, the IPCC predicts that efficiency technologies will have an estimated 57% contribution to emissions reductions to achieve the scenario where atmospheric concentrations of greenhouse gases is less than or equal to 450 ppm. These efficiencies will come from various sectors of the economy including power generation, plant management and grid efficiency but also from building energy efficiency, transport fuel efficiency, higher energy efficiency manufacturing, such as in the iron and steel industries, and developing higher energy efficiency agricultural practices, such as in dairy production. Much of this abatement from efficiency will come from technology and reducing the energy intensity of our economy. Further, there is no doubt that renewable energy is a huge and important area, allied over the longer-term with smart grid storage and other technologies, as outlined in Figure 12 below.
14 Past performance is no guarantee of future results.
Q1 2007 - Q4 2011 MSC
I Wor
ld (G
loba
l Pub
lic E
quiti
es)
Infr
astr
uctu
re P
roxy
(UBS
)
Infr
a +
Util
s (U
BS)
Bond
s Pro
xy (L
ehm
an A
gg)
Priv
ate
Equi
ty P
roxy
(Cam
brid
ge R
es.)
Vent
ure
Capi
tal P
roxy
(Cam
brid
ge R
es.)
Farm
land
(NCR
EIF)
Clim
ate
Prox
y (M
SCI C
limat
e)
Crud
e O
il (W
TI)
Nat
ural
Gas
(Nat
'l Ba
lanc
ing
Pt.)
Nat
ural
Gas
(Hen
ry H
ub)
Ag C
omm
oditi
es (D
BIQ
)
DBCC
Cle
an T
ech
Clim
ate
Chan
ge B
ench
mar
k (H
SBC)
Low
Car
bon
Ener
gy P
rodu
ctio
n (H
SBC)
Ener
gy E
ffic
ienc
y &
Ene
rgy
Man
agem
ent (
HSBC
)
Was
te, W
ater
, Pol
lutio
n Co
ntro
l (HS
BC)
Wat
er (S
&P)
Publ
ic A
grib
usin
ess (
DXAG
Inde
x)
MSCI World (Global Public Equities) 1.00Infrastructure Proxy (UBS) 0.80 1.00Infra + Utils (UBS) 0.93 0.86 1.00Bonds Proxy (Lehman Agg) -0.44 0.13 -0.37 1.00Private Equity Proxy (Cambridge Res.) 0.24 0.71 0.34 0.71 1.00Venture Capital Proxy (Cambridge Res.) 0.31 0.71 0.43 0.57 0.96 1.00Farmland (NCREIF) -0.48 0.10 -0.38 0.98 0.70 0.57 1.00Climate Proxy (MSCI Climate) 0.95 0.83 0.94 -0.34 0.38 0.42 -0.36 1.00Crude Oil (WTI) 0.33 0.54 0.41 0.33 0.66 0.66 0.33 0.50 1.00Natural Gas (Nat'l Balancing Pt.) -0.01 0.11 0.02 0.37 0.56 0.59 0.38 0.07 0.63 1.00Natural Gas (Henry Hub) 0.45 0.19 0.53 -0.52 -0.07 0.07 -0.51 0.52 0.41 0.30 1.00Ag Commodities (DBIQ) 0.31 0.54 0.45 0.31 0.70 0.76 0.32 0.48 0.87 0.74 0.48 1.00DBCC Clean Tech 0.81 0.70 0.87 -0.60 0.23 0.29 -0.66 0.92 0.46 0.03 0.71 0.47 1.00Climate Change Benchmark (HSBC) 0.88 0.78 0.96 -0.42 0.31 0.38 -0.41 0.95 0.43 0.01 0.59 0.47 0.96 1.00Low Carbon Energy Production (HSBC) 0.76 0.66 0.91 -0.48 0.20 0.30 -0.44 0.86 0.37 -0.02 0.63 0.44 0.95 0.97 1.00Energy Efficiency & Energy Management (HSBC) 0.94 0.89 0.90 -0.21 0.48 0.49 -0.25 0.96 0.49 0.07 0.41 0.48 0.83 0.89 0.76 1.00Waste, Water, Pollution Control (HSBC) 0.93 0.86 0.98 -0.34 0.39 0.47 -0.35 0.97 0.46 0.09 0.51 0.50 0.90 0.97 0.90 0.94 1.00Water (S&P) 0.93 0.95 0.93 -0.13 0.55 0.59 -0.16 0.95 0.53 0.10 0.36 0.53 0.80 0.89 0.76 0.97 0.96 1.00Public Agribusiness (DXAG Index) 0.27 0.69 0.40 0.61 0.88 0.83 0.60 0.46 0.83 0.59 0.12 0.83 0.45 0.41 0.33 0.51 0.44 0.57 1.00
Climate Public Equity SectorsAsset Class Proxies Commodities

Strategic Asset Allocation Review
24 Investing in Climate Change 2012
Figure 12: Global Emissions Scenarios and Abatement by Technology
Note: OECD+ = OECD plus other EU; OME = Other Major Economies; OC = Other Countries Source: OECD/IEA 450 ppm Scenario, “World Energy Outlook 2009”, IEA; IPCC; DBCCA analysis 2012 The energy efficiency investment opportunity cuts across most of the economy. It includes upgrades to industrial efficiency, transportation, buildings, manufacturing, and other systems. Most large companies can see operational benefits, including costs reductions, through a focus on energy efficiency. Providers of efficient technology also span the mix of different sectors, from existing incumbent providers as well as emerging technology innovators. A particular near-term focus for us is upgrading and replacing energy-consuming equipment in buildings, which offers an important capital investment opportunity with the potential for significant economic, climate, and employment impacts. In the United States alone, more than $279 billion could be invested across the residential, commercial, and institutional market segments. As the building energy efficiency market emerges further, there will be opportunities for investment across multiple asset classes. A major current trend targeted by both early-stage and public market investors is the major shift towards “smarter buildings” where operators are applying data analytics and sensor technologies to extract deeper insight about buildings in order to run them more efficiently. A single large building could have 100,000+ points of information. New technology companies are innovating around analytics and algorithms which can parse and interpret this data to inform operators about more efficient ways to run their buildings. Many venture capitalists have pursued this “big data” trend in buildings with a number of software and hardware investments. Additionally, large public corporations are pursuing acquisition and organic growth strategies to expand their offerings in the space. Natural Gas According to the EIA’s “International Energy Outlook 2011” (reference case), natural gas is the world's fastest-growing fossil fuel, with consumption increasing at an average rate of 1.6% per year from 2008 to 2035. Growth in consumption occurs globally but is most concentrated in non-OECD countries, where demand increases nearly three times as fast as in OECD countries. Because increases in production in non-OECD regions is expected to more than meet projected consumption growth, exports of gas from non-OECD exports to OECD countries is expected to grow substantially through 2035. The EIA expects non-OECD producers to account for more than 81% of the total growth in world natural gas production from 2008 to 2035.
Efficiency – 57%
Renewables & Biofuels – 23%
Nuclear – 10%
CCS – 10%
Abatement by Technology, 2030
Global Emissions in the IEA 2009 Reference and 450 Scenarios by Region

Strategic Asset Allocation Review
25 Investing in Climate Change 2012
Figure 13: Global Natural Gas Consumption, 2008-2035
Source: “International Energy Outlook 2011”, Energy Information Administration, DOE, 2011
Agriculture According to many estimates the world’s agricultural production must increase by substantial amounts to meet demand for food, feed, fuel and fiber. Moreover, the world’s food systems suffer from gross complexity which results in enormous inefficiencies. Demand for increased food, feed, fuel and fiber is driven by increased population, and an increase in the middle class in emerging economies. Coupled with a shift in dietary preferences from grains and staple carbohydrates to more protein based diets including pork and beef (and perhaps fish), and biofuels production, more grains will be used to feed animals and fuel our automobiles. As an energy intensive sector, agriculture is closely linked to energy markets, with crop production and demand potentially adversely affected by higher oil prices, while crop inputs (such as fertilizer) may benefit from lower natural gas prices. These shifting dynamics will affect profit margins in different segments of the agricultural supply chain. In addition to energy prices, likely constraints to the productivity growth of agriculture include climate change, water resources, infrastructure, education and training of producers, and social / governmental policy that distort agricultural markets. New technologies, product platforms and innovative business models in agriculture technology and food systems will dominate the shift from a conventional polluting industrial and socially detrimental industrial agriculture to a more socially just and environmentally sustainable food production and distribution system. The agricultural technology sector is large, comprising over 8,500 companies generating over $1.3 trillion of revenue per year, in the US alone. Moreover the volume of transactions in the agricultural sector is greater than $15 billion per year with an estimated peak of over $70 billion in 2007. Agricultural production is forecast however, to grow fastest in developing economies. Latin America and Eastern Europe are expected to see growth in crop area, crop yields, and livestock inventories. Russian Federation and other former Soviet republics may play an increasingly significant role in export markets for wheat and coarse grains. Despite the end of spectacular growth in soybeans, Argentina and Brazil, as relatively low cost producers,
110.7
123.1133.4
144.4
156.8168.7
0
20
40
60
80
100
120
140
160
180
200
2008 2015 2020 2025 2030 2035
Con
sum
ptio
n (T
rillio
n C
ubic
Fee
t)
Non-OECD
OECD

Strategic Asset Allocation Review
26 Investing in Climate Change 2012
will continue to exhibit solid growth in oilseeds, cereals and livestock production. Production prospects appear to be equally strong in Sub-Saharan Africa, with much of this growth originating from a relatively low production base, and driven by population growth in rural areas and by higher investment. Figure 14: Agricultural Production Must Double to Feed the Global Population in 2030
Demand Scenario Assumptions 2030 low case: Only population growth drives increase in total demand 2030 high case: Per capita food consumption and caloric intake aligned to European level; high biofuel expansion
Source: Mckinsey, 2009
Water Water continues to garner significant attention and is becoming a much more constrained and limited resource. In fact, it is estimated that an 80% increase in fresh water demand is expected by 2050. This increase in demand comes from agriculture and from the increased biofuels mandates as well as increased industrial water withdrawals. However, there will be 25% less water available in 2050 from traditional sources due to over-extraction of groundwater, climate change, inefficient use, lack of regulatory frameworks and industry restructuring. As a result, the Water Resources Group expects a 60% gap between supply and demand of water by 2030 – as outlined in Figure 15 below. Both agriculture and industry can improve efficiencies, but considerable water infrastructure build out is also necessary. Not only increasing the quantity, but also improving the quality of water is essential. Due to dilapidated infrastructure and increasing pollution, it is estimated that over 2 billion people will lack access to safe drinking water in 2030. Infrastructure spending on water is expected to reach $41 trillion over the 2005-2030 period.15
15 “Lights! Water! Motion!”, Booz Allen Hamilton extract, 2007

Strategic Asset Allocation Review
27 Investing in Climate Change 2012
Figure 15: Business as Usual Approaches will not satisfy growing Demand for Water
Source: “Charting Our Water Future”, Water Resource Group, 2009
For further discussion of historic investment flows see subsequent section (Section II) on Climate Change Investment Markets & Asset Classes. And for a full discussion of the Climate Change Investment Markets Growth Outlook see the final section (Section III) of this report. Our 2012 Focus Asset Classes and Investment Strategies As the previous discussion demonstrates, the climate change universe is wide and deep, it covers most asset classes and can be captured in diversified and pure-play investment strategies. So, after careful consideration we have focused this year on the themes of cleaner energy, energy efficiency and energy management, and agriculture as the core investment opportunities presented by climate change at present – with some commentary on water as well. Cleaner energy, including gas as a transition fuel, and energy efficiency and management remain vital tools in the mitigation of climate change. Meanwhile, agricultural technology and development, and improved water management and distribution, are key adaptive responses to climate change. In addition, both cleaner energy deployment and improved agricultural productivity are critical to meeting growing global demand for energy and food as a result of demographic and economic changes across the world, and particularly in emerging markets. Figure 16 below provides a description of the asset classes based on general terms and expectations. Within these asset classes we then identify the key climate change investment sectors and key investment strategies to capture these, indicating our outlook on a medium term view. In public equities we emphasize a broader focus on diversified and most likely larger cap companies and ongoing caution short term on pure-play clean energy investments. Longer term, a market “bottom” is likely to form in this space. VC/PE and infrastructure opportunities generally look promising.

Strategic Asset Allocation Review
28 Investing in Climate Change 2012
Figure 16: DBCCA Sector and Investment Strategy Recommendations by Asset Class for the Climate Change Investor 16
Asset Class Sector Investment Strategy Outlook Risk /Volatility Equity Overall Climate Change Broad/Diversified Positive Medium Sub-Themes
Clean tech Pure-play Negative High Clean tech Broad/Diversified Neutral High
Energy Efficiency (Buildings, Grid, Transport, Industrial)/ Energy Management Broad/Diversified Positive Medium
Energy Efficiency (Buildings, Grid, Transport, Industrial)/ Energy
Management Pure-play Positive Medium Agriculture Broad/Diversified Positive Medium Agriculture Pure-play Positive High Water Broad/Diversified Positive Medium Water Pure-play Positive Medium
Fixed Income Climate Change/Carbon tilt Broad Neutral/Positive Low
PE Clean tech/Agri-tech Pure-play Positive High
VC Clean tech/Agri-tech Pure-play Positive High
Infrastructure Renewable Energy, Natural Gas, Water, Agriculture Broad/Diversified Positive Medium
Real Estate (Land) Agriculture/timber Pure-play Neutral Low
Source: DBCCA analysis 2012
16 Please note certain information in this presentation constitutes forward-looking statements. Due to various risks, uncertainties and assumptions made in our analysis, actual events or results or the actual performance of the markets covered by this presentation report may differ materially from those described. The information herein reflect our current views only, are subject to change, and are not intended to be promissory or relied upon by the reader. There can be no certainty that events will turn out as we have opined herein.

Climate Change Investment Markets & Asset Classes: Key Themes
29 Investing in Climate Change 2012
Section II. Climate Change Investment Markets & Asset Classes
Key Themes
The climate change universe is wide and deep, so given readily available data resources we have focused this year on the themes of cleaner energy (with a specific focus on pure-play clean energy and natural gas), efficiency and agriculture. Cleaner energy remains a vital tool in the mitigation of climate change and agriculture technology and development is a key adaptive response to climate change, and improved deployment and/or productivity in both sectors are critical to meeting growing global demand for energy and food. We therefore review how cleaner energy, efficiency and agriculture have performed in terms of investment trends, fund launches and fund or stock performance (where relevant) across three main asset classes: public equity, venture capital / private equity, and infrastructure.
2011 was a very mixed and highly volatile year for investors in general, and the story was no different for investors in clean energy and agriculture. And while 2012 started on a firmer note, many challenges remain. The good news is that overall, investment in both agriculture and clean energy are on the increase, even despite the recent global turmoil in public markets. Certain asset classes and sectors are receiving more investment and performing better than others, but the overall investment trend in both sectors is positive.
Clean energy public equities had a very poor year in 2011, with a 38% decline in the DB Nasdaq OMX Cleantech Index (DBCC) and a 41% decline in the WilderHill New Energy Global Innovation Index (NEX) over the course of the year. The broader HSBC Climate Change (HSCCB) index performed somewhat better, with a 22% decline; while the even broader MSCI Climate index did better still with a decline of 16%. This is relative to an 8% decline in the MSCI Global Index. The best performing sectors have been water and agriculture, and to a lesser extent energy efficiency.
Year-to-date in 2012 (through the end of April), the performance of the climate indices is vastly improved, with the NEX, DBCC, HSCCB and MSCI Climate indices up between 0.3% and 4.8% – with MSCI Climate the highest performer so far. However, MSCI World is up 9.5% so these indices are still under-performing the broader market.
Meanwhile, natural gas indices ended up outperforming the market by generating returns ranging between -6% or +14% over 2011, depending on which part of the value chain is being focused on. Performance to date in 2012 also continues to be mixed, and given positive broader market returns these stocks have started to under-perform.
Actual new investment in clean energy public markets reflects investor uncertainty in the sector, with a 16% decrease in total public markets investment, from $14.2 billion in 2010 to $11.9 billion over the course of 2011. This is the lowest public markets investment in the sector since 2006. This trend continued in Q1 2012 with investment of only $0.6 billion – a very significant decrease from $4.6 billion in Q1 2011, and a slight decrease from investment of $0.7 billion in the preceding quarter (Q4 2011).
Relative to clean energy and the broader market, agricultural public equities only slightly under-performed in 2011, with the DBIQ Diversified Agriculture Index Excess Return and DAX Agribusiness indices down 10.7% and 10.2%, respectively.
There was a relatively strong upswing in agricultural commodity prices and agricultural equities in the earlier part of 2011 (particularly Q1), driven by growing global demand, but this regressed later in the year, with the sustained onset of higher oil prices and market turmoil resulting from the European sovereign debt crisis. Overall though, agricultural commodities had higher and more volatile prices in 2011 relative to 2010.

Climate Change Investment Markets & Asset Classes: Key Themes
30 Investing in Climate Change 2012
So far in 2012 (through April) agricultural equities have had a complete turnaround and a reflection of Q1 one year prior, with the DAX Agribusiness Index up 11.6% over this four month period – out-performing the broader market. Meanwhile, agricultural commodities have continued their downward trajectory so far in 2012, losing 5.2% through April – as represented by the DBIQ Index.
Despite investor uncertainty and associated volatility in clean energy public markets in 2011, venture capital and private equity (VC/PE) investment in the sector has remained relatively consistent throughout the economic downturn and through 2011– with investment of $8.9 billion last year, and $1.9 billion in Q1 2012 (a slight increase over $1.8 billion in Q1 2011). This bodes well for continued technological innovation and is particularly prevalent in the US, which accounts for the vast majority of private clean energy investment; >50% since 2007, and a record 68% in 2011.
In terms of VC/PE fund launches and fundraising, however, the clean energy sector (among others) still remains challenged, with a decline in the number of “green” funds launched and capital raised. Returns for these funds show a wide range in performance, although funds in the top decile are beating expected returns, with returns of greater than 73% for private equity stage funds, and nearly 33% for venture-stage funds – or greater than 40% for all types of green private investment funds (including mezzanine, infrastructure, etc.).
Agricultural VC/PE investment, by contrast, is experiencing a growth trend, despite a lull in 2009, in terms of capital deployed, funds launched and capital raised by VC/PE funds with an interest in the sector. Returns for these funds though, are similarly wide with the top decile of Agricultural funds producing even more impressive returns of greater than 56%.
Clean energy project financing reached a record annual investment figure of $145.6 billion in 2011 – a >5% increase over 2010’s record investment, and 56% of overall investment in all clean energy; thereby dwarfing other types of investment in the sector. In Q1 2012, clean energy infrastructure investing continues to be robust, although down slightly over the same quarter in 2011 – $24.2 billion was invested in the first quarter of this year, relative to $27.9 billion in Q1 2011.
China continues to dominate global clean energy infrastructure investing, accounting for 30% of the global total in 2011 as it strives to meet growing energy demand and ambitious clean energy targets. The US rebounded somewhat this year, and came a close second at 25%, as wind and solar installations boomed to meet pending federal policy incentive deadlines.
Global upstream oil and gas investment also grew strongly in 2011, hitting a new record of $552.6 billion – 9% more than capital spending in 2010 and 10% higher than the previous peak in 2008. This growth was not just due to additional oil investment, as is evident from natural gas consumption figures – with consumption growing by 7.4% in 2010, the most rapid increase since 1984.
Agricultural infrastructure investment offers huge potential growth due to rapidly increasing demand for food and upward pressure on prices, particularly from emerging and developing economies. Emerging and developing economies are increasingly taking account of this trend, and investing heavily in agricultural infrastructure in order to attract both domestic and foreign investors to the sector.

Climate Change Investment Markets & Asset Classes: Overview – Pure-Play Clean Energy
31 Investing in Climate Change 2012
Pure-Play Clean Energy Investment Overview
Figure 17: Annual New Investment in Clean Energy by Region, 2004-2011
Source: Bloomberg New Energy Finance, 2012
As can be seen from Figure 17 above, global investment in clean energy reached another record in 2011, increasing 5% to $260 billion – according to Bloomberg New Energy Finance, more than $1 trillion has now been invested in the sector since 2004. Several interesting trends are apparent from looking at the data: The US exceeded China’s investment in the sector for the first time since 2008, thanks in large part to substantial
infrastructure investing in wind and solar to meet the deadline for expiring federal incentives – the hugely successful 1603 Treasury Cash Grant expired at the end of 2011, the Loan Guarantee Program in September 2011 (although some funding still remains), and the wind Production Tax Credit (PTC) expires at the end of 2012, causing a surge in installations (particularly in Q4 2011) that is expected to continue through 2012. However, if key policy initiatives such as the PTC are not extended beyond 2012, analysts expect a slump in US investment and installations, particularly for wind (the solar equivalent – the Investment Tax Credit – continues through 2016).
Solar investment increased 36% to $137 billion and is now nearly double that of investment in wind, which used to dominate clean energy investment. Given the fact that solar PV module prices have been low for several years now, and manufacturers’ margins are being squeezed, this growth in investment is particularly interesting and demonstrates the vast volume of modules that are being sold and installed. This increasing volume and continued low module prices bodes well for the continued decline in the overall costs of solar, and the prospects for solar reaching grid parity in the near future.
$14 $16$33 $37 $46 $37 $42
$56$22$32
$43$64
$73$73
$97$100
$6
$10
$15
$25 $40
$47
$47
$9
$13 $7
$7
$8
$2
$6
$4 $4
$7
$10
$53.6
$74.6
$112.9
$152.9
$187.1 $188.7
$247.0$260.1
$0
$50
$100
$150
$200
$250
$300
2004 2005 2006 2007 2008 2009 2010 2011
Annu
al N
ew In
vest
men
t ($
Bill
ions
)Th
ousa
nds
ROW
India
Brazil
China
Europe
US

Climate Change Investment Markets & Asset Classes: Overview – Pure-Play Clean Energy
32 Investing in Climate Change 2012
Figure 18: Annual New Investment in Clean Energy by Asset Class, 2004-2011
Source: Bloomberg New Energy Finance, 2012 Note: “Other” includes corporate and government research and development expenditure, and re-investment (the latter is subtracted from the total). SDC is small distributed capacity.
In terms of assets classes, clean energy infrastructure investing received the largest amount of capital, with investment in renewable energy projects increasing from $138 billion in 2010 to $146 billion in 2011. This does not include investment in small distributed capacity (SDC), namely rooftop solar, which also increased from $60 billion in 2010 to $74 billion in 2011. Clearly, renewable energy projects (as opposed to technologies) are currently receiving the greatest amount of investor attention.
However, public market investment in the sector dropped in 2011, declining from $14 billion in 2010 to $12 billion in 2011. Clean energy public equities are high beta stocks that performed very poorly – both in terms of share declines and high volatility – during the global market turmoil of H2 2011, shaking investor confidence in the sector. The margin pressure being experienced by most clean energy manufacturers also negatively affected the profitability of midstream players in the sector, and associated poor earnings reports further shook investor confidence.
Despite public market turmoil, private market investors remain committed to the sector in terms of capital deployment, which again increased in 2011. However, in terms of VC/PE fund launches and fundraising, the sector remains challenged, with a decline in the number of funds launched and capital raised.
Overall then, although 2011 was a highly volatile year and the pure-play clean energy sector remains challenged in many areas (particularly public equities), there is continued investment growth and long-term drivers for the sector remain robust. There has been a slight decline in this growth trend so far in 2012, however, with $26.7 billion of new investment in the first quarter17
17 This statistic excludes corporate and government R&D, and small distributed capacity, which are calculated by Bloomberg New Energy Finance at year-end
- a decline from Q1 2011 investment of $34.3 billion. This does not necessarily mean 2012 investment will be down on an annual basis at year-end, but does draw attention to the challenges the sector faces right now, particularly in the public markets.
$23$40
$71$92
$121$108
$138 $146
$9
$11
$7
$13
$22$31
$60$74
$5
$12
$25
$13 $15
$14
$12
$6
$8
$12 $7
$9
$9
$53.6
$74.6
$112.9
$152.9
$187.1 $188.7
$247.0$260.1
$0
$50
$100
$150
$200
$250
$300
2004 2005 2006 2007 2008 2009 2010 2011
Annu
al N
ew In
vest
men
t ($
Bill
ions
)Th
ousa
nds
Other (R&D, Re-Inv.)
VC/PE
Public Markets
SDC
Asset Finance

Climate Change Investment Markets & Asset Classes: Performance Review – Public Markets
33 Investing in Climate Change 2012
Public Markets
Introduction
The investment thesis for climate change public equities is structurally similar to all public equities – growth will occur at a top line and/or bottom line level, faster than the market expects (see Figure 19 below). These investors also have the same tools to manage portfolio risk as all equity managers have: allocation to cash, weighting of the portfolio and in some cases using shorts or derivatives to protect positions. However, there are a number of specific sector and thematic drivers and risks to climate change investments, which include the following: (i) government subsidization and policy changes; (ii) a shift in the competitive landscape/market share shifts; (iii) time to commercialization of technologies and applications; (iv) the rate of technology progression toward grid price parity; (v) concrete metrics and perception regarding competing and non-competing energy sources; (vi) potential value chain margin compression as the technology industry matures; and (vii) general economic risk.18
Figure 19: Investment Pillars for Public Equities
Source: DBCCA analysis, 2011.
All of the above factors must therefore be taken into account by climate change public equity investors, particularly those investing in newer technologies or sectors, such as clean energy, which tend to involve less mature technologies that rely on a level of policy support. Solar firms that rely on direct incentives and subsidies, for example, may see multiple expansions at the onset of the policy regime, but uncertainty or scale-back in these programs affects the trading multiple of the firm – as has occurred recently in Europe. As a result, investors in this sector should have an in-depth understanding of the policy structure in a given region (and even potentially at a global scale), and whether or not this policy structure is robust (e.g. a mandate or a temporary subsidy that can be repealed). Other climate change sectors are less policy dependent, such as agriculture or more established cleaner energy technologies (such as natural gas), although an investor in this sector would need to be aware of many of the other factors listed above, such as shifts in the competitive landscape, potential value chain margin compression, and so on.
18 Deutsche Bank Research, Solar Photovoltaic Industry: 2011 Outlook – FIT cuts in key markets point to oversupply. January 5, 2011. Peter Kim, Hari Polavarapu.
Revenue Growth
Expected Rate of Growth
Public Equity
Margin Growth and Potential for Earnings
Surprises

Climate Change Investment Markets & Asset Classes: Performance Review – Public Markets
34 Investing in Climate Change 2012
Cleaner Energy Public Equities Performance 2011 was an extremely challenging year for the global pure-play clean energy sector, especially for wind and solar companies. The industry was confronted with a “perfect storm” of exogenous and endogenous factors that on a net basis caused industry fundamentals to deteriorate substantially and led to substantial capital outflows, particularly among public equity investors. Multiple different changes in global subsidy regimes raised risk premiums while the European debt crisis triggered a substantial reduction in project financing. Finally, the pull forward of demand from the US stimulus program, a growing recognition that the production tax credit (PTC) may well not be renewed after 2012, and China flooding its renewable sector with cheap financing to stimulate supply but not taking a firm policy stance to stimulate demand all exacerbated the supply/demand dynamics. By late-2011 the solar market was flooded with excess modules selling in the spot market below the cost of production. Taken together, these factors added substantial volatility to supply chains and triggered a series of successive disappointments relative to expectations in the space. In our view, 2011 is likely to have marked a key transition period in the global pure-play clean energy space with many of the weaker players succumbing to competitive pressures. Figure 20: Performance of Pure-Play Equity Indices, Compared to Broader Equity Indices (since 2007)
Note: Indexed to 100 as of Jan 1 2007 Source: Bloomberg LP, NASDAQ OMX, DBCCA analysis 2012
These trends are quite clearly reflected in the performance of several key climate or clean energy indices, as exhibited in Figure 20 above. The DB Nasdaq OMX Cleantech Index (DBCC)19
19 The DB NASDAQ OMX Clean Tech Index is a global index tracking the clean tech industry, which covers clean energy, energy efficiency, transport, waste management and water. The index includes companies with at least a third of revenues derived from clean technology within investable geographies and exchanges identified by NASDAQ OMX.
and the WilderHill New Energy Global Innovation Index
20
40
60
80
100
120
140
160
180
Jan-
07
Apr-
07
Jul-0
7
Oct
-07
Jan-
08
Apr-
08
Jul-0
8
Oct
-08
Jan-
09
Apr-
09
Jul-0
9
Oct
-09
Jan-
10
Apr-
10
Jul-1
0
Oct
-10
Jan-
11
Apr-
11
Jul-1
1
Oct
-11
Jan-
12
Apr-
12
Clos
ing
Price
(Ind
exed
)
MSCI World
MSCI Climate
HSBC Climate Change
DB Nasdaq Cleantech
NEX Wilderhill Clean Energy
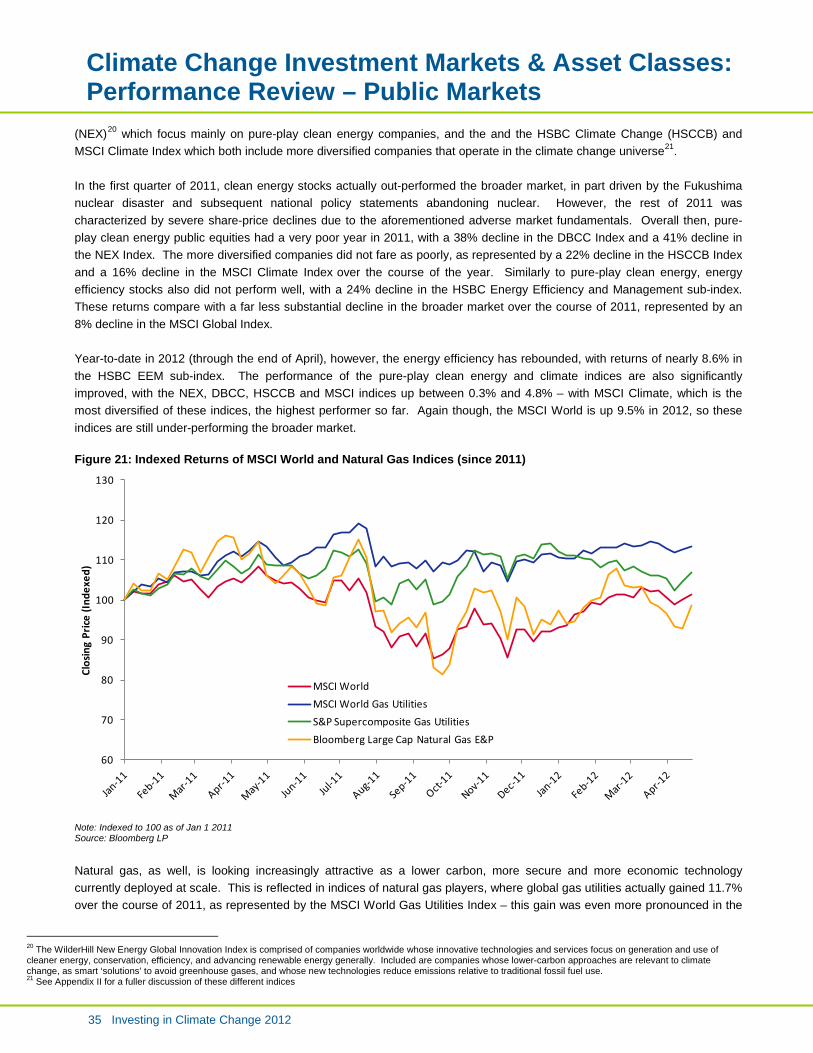
Climate Change Investment Markets & Asset Classes: Performance Review – Public Markets
35 Investing in Climate Change 2012
(NEX)20 which focus mainly on pure-play clean energy companies, and the and the HSBC Climate Change (HSCCB) and MSCI Climate Index which both include more diversified companies that operate in the climate change universe21
.
In the first quarter of 2011, clean energy stocks actually out-performed the broader market, in part driven by the Fukushima nuclear disaster and subsequent national policy statements abandoning nuclear. However, the rest of 2011 was characterized by severe share-price declines due to the aforementioned adverse market fundamentals. Overall then, pure-play clean energy public equities had a very poor year in 2011, with a 38% decline in the DBCC Index and a 41% decline in the NEX Index. The more diversified companies did not fare as poorly, as represented by a 22% decline in the HSCCB Index and a 16% decline in the MSCI Climate Index over the course of the year. Similarly to pure-play clean energy, energy efficiency stocks also did not perform well, with a 24% decline in the HSBC Energy Efficiency and Management sub-index. These returns compare with a far less substantial decline in the broader market over the course of 2011, represented by an 8% decline in the MSCI Global Index. Year-to-date in 2012 (through the end of April), however, the energy efficiency has rebounded, with returns of nearly 8.6% in the HSBC EEM sub-index. The performance of the pure-play clean energy and climate indices are also significantly improved, with the NEX, DBCC, HSCCB and MSCI indices up between 0.3% and 4.8% – with MSCI Climate, which is the most diversified of these indices, the highest performer so far. Again though, the MSCI World is up 9.5% in 2012, so these indices are still under-performing the broader market. Figure 21: Indexed Returns of MSCI World and Natural Gas Indices (since 2011)
Note: Indexed to 100 as of Jan 1 2011 Source: Bloomberg LP
Natural gas, as well, is looking increasingly attractive as a lower carbon, more secure and more economic technology currently deployed at scale. This is reflected in indices of natural gas players, where global gas utilities actually gained 11.7% over the course of 2011, as represented by the MSCI World Gas Utilities Index – this gain was even more pronounced in the
20 The WilderHill New Energy Global Innovation Index is comprised of companies worldwide whose innovative technologies and services focus on generation and use of cleaner energy, conservation, efficiency, and advancing renewable energy generally. Included are companies whose lower-carbon approaches are relevant to climate change, as smart ‘solutions’ to avoid greenhouse gases, and whose new technologies reduce emissions relative to traditional fossil fuel use. 21 See Appendix II for a fuller discussion of these different indices
60
70
80
90
100
110
120
130
Clos
ing
Price
(Ind
exed
)
MSCI WorldMSCI World Gas UtilitiesS&P Supercomposite Gas UtilitiesBloomberg Large Cap Natural Gas E&P

Climate Change Investment Markets & Asset Classes: Performance Review – Public Markets
36 Investing in Climate Change 2012
US where gas utilities gained 14.1% over the same time period, as represented by the S&P Supercomposite Gas Utilities Index. Utilities reflect the “downstream” market segment of natural gas, while the “upstream” market segment is represented by exploration and production (E&P) companies. These companies did not perform as well, with a decline of 2.4% according to the Goldman Sachs Custom Natural Gas E&P Index, or 6.0% according to the Bloomberg Research Large Cap Natural Gas E&P Index. These declines though in the upstream segment are still markedly less than declines in the overall market, indicating overall outperformance of this energy sector. Year-to-date in 2012 (through the end of April), the performance of these indices shows a reversal in the performance of US gas utilities, while global gas utilities continue to perform well – the former lost 4.7% while the latter gained 2.7%. Upstream companies have also had a mixed performance, with the Goldman Sachs Custom Natural Gas E&P Index down a very significant 11.9% while Large Cap stocks are up 4.1%. The relative performance of all these indices can be seen in Figure 21 above. The natural gas industry has experienced some fundamental changes in the past several years, particularly in the US, where a vast quantity of “unconventional” gas resources (e.g. shale gas) have been discovered and explored, pushing down the price of natural gas to historic levels. Natural gas as an energy commodity is priced regionally – not globally, like oil – and there has been a growing disparity between regional natural gas prices recently, as US prices have decreased, while European and Asian prices have remained relatively strong. In addition, the historic positive correlation between natural gas prices and oil prices has been broken in some regions, with US natural gas prices actually declining, even as global oil prices rise. European natural gas prices, and Asian liquefied natural gas (LNG) prices, by contrast, still remain somewhat tied to global oil prices. Figure 22: Indexed Returns of WTI Oil and Various Gas Commodity Indices (since 2010)
Note: Indexed to 100 as of Jan 1 2010 Source: Bloomberg LP
Over the course of 2011, global oil prices rose 12.3%, as represented by the WTI Oil Index, while US natural gas prices fell a massive 32.7%, as represented by the Henry Hub Index. UK natural gas prices, as represented by the UK Balancing Point Index, actually fell 7.2%, and Singapore LNG prices rose 5.0%. LNG is obviously a somewhat different commodity than
0
50
100
150
200
250
Clos
ing
Price
(Ind
exed
WTI Oil - SpotHenry Hub (US) - SpotUK Balancing Point - Day Ahead SpotNaptha LNG (Singapore) - (fob) Spot
Climate Change Investment Markets & Asset Classes: Performance Review – Public Markets
37 Investing in Climate Change 2012
natural gas and is priced differently, in part because it is traded across larger distances. However, LNG is most representative of the Asian market as natural gas production in that region is very low, so the majority of gas consumption is through imports of LNG – Japan, for example, is a major LNG consumer. Year-to-date in 2012 (through the end of April), energy commodities have largely continued in the direction they were going in 2011 – WTI oil is up 3.3%, Henry Hub gas is down 28.3% (a seeming acceleration of the price decline seen in 2011), and Singapore LNG prices are already up 5.8%. UK natural gas meanwhile has had a reversal in price performance, with a 12% increase. Figure 22 above shows the pricing relationship between these commodities over the past 2+ years, and in particular the “break” of US natural gas prices from both global oil and other regional gas prices. In our view then, the pure-play clean energy industry is in the early stages of consolidation and over the next year or two it will become clearer which companies are the winners and losers. Ultimately we foresee a few global “giants” who control the solar value chain and wind manufacturers embedded in divisions of leading global industrial companies that have the depth and scale to support the business throughout the cycle. Leading companies in the renewables space will have strong balance sheets, better cost control, global sales forces and consistent profitability. Meanwhile, there exists substantial opportunities in cleaner energy technologies, such as natural gas. This is particularly the case for downstream players in markets where natural gas prices are low, and for upstream players in markets where natural gas prices are higher. Global trade in LNG is also expected to expand, and the US is looking to export some of its natural gas to growing markets such as Asia, as domestic supplies are so high at present. Public market investors are clearly recognizing these opportunities, as is evident from the positive performance of various natural gas indices.
Investment Trends Actual new investment in pure-play clean energy public markets reflects the growing investor uncertainty in the sector, with a 16% decrease in total public markets investment, from $14.2 billion in 2010 to $11.9 billion over the course of 201122
. The fourth quarter of 2011 and the first quarter of 2012 have been particularly poor, with only $0.7 billion invested globally in Q4 2011, declining to $0.6 billion in Q1 2012 – these are lows not seen since Q1 2009 when only $0.3 billion was invested in public markets. On an annual basis too, 2011 is the lowest public markets investment in the sector since 2006, and pales in comparison to public market investment of more than $25 billion in 2007 – although it should be recognized that this level of investment was a record and anomalous year, even at the time.
In terms of the dominant sectors, wind continues to receive a steady amount of capital, while public markets investment in solar has declined somewhat over recent years. Solar had accounted for the largest portion of clean energy public market investment since the economic crisis began in 2008, but in 2011 tied with investment in wind at $4.4 billion (or 37% of the total). This contrasts, however, with solar investment on a cumulative scale (including all asset classes), with solar investment increasing 33% in 2011 and representing more than double that invested in wind. Energy Smart Technologies (EST) meanwhile, which includes pure-play efficiency companies23
, also received a reduced amount of capital in 2011, after consistent growth from 2008 to 2010, even as other sectors received fluctuating or declining amounts of capital.
22 Defined as “funds raised by publicly quoted or OTC quoted pure-play clean energy companies on the capital markets. This may be through initial public offerings (IPOs) or follow-on offerings (secondary, PIPEs, convertibles etc).” Source: Bloomberg New Energy Finance 2012 23 Defined by Bloomberg New Energy Finance as “a range of non renewable clean energy technologies including digital energy and smart grids, power storage, hydrogen and fuel cells, advanced transportation and energy efficiency on both the demand and supply side”

Climate Change Investment Markets & Asset Classes: Performance Review – Public Markets
38 Investing in Climate Change 2012
Figure 23: Annual New Clean Energy Public Market Investment by Sector, 2004 - 2011
Note: EST is energy smart technology. For definition see footnote 23. Source: Bloomberg New Energy Finance, 2012
The European sovereign debt crisis had a very significant impact on the clean energy sector in 2011 as investors fled to “safer” investments, such as US bonds and currency, and large, established companies. Part of this was driven by policy uncertainty for a sector that still mostly relies on government incentives while it continues to scale up and achieve a cost structure that is competitive with incumbent energy technologies. Fiscal austerity is a new political necessity in many key clean energy markets, affecting any industry that is still dependent on government support, and there is also diminishing “stimulus” funding being deployed relative to the aftermath of the original financial crisis in 2008 and 2009. Figure 24: Annual New Clean Energy Public Market Investment by Major Country/Region, 2004 - 2011
Source: Bloomberg New Energy Finance, 2012
$1.2 $1.5
$10.7
$3.7 $4.8 $4.6 $4.4$1.6
$4.7
$7.4
$6.4$6.1 $5.4
$4.4
$0.8
$3.7
$3.5
$0.9$0.8
$1.1$1.0
$0.8
$1.1
$2.6
$1.4$2.3 $2.4
$1.6
$0.8
$5.0
$11.9
$25.5
$13.1$14.5 $14.2
$11.9
$0
$5
$10
$15
$20
$25
$30
2004 2005 2006 2007 2008 2009 2010 2011
Annu
al In
vest
men
t ($
Bill
ions
)
Other
EST
Bioenergy
Solar
Wind
$1.3$3.4
$7.0 $6.3$4.7
$3.3$2.0
$2.2
$7.4
$14.0
$5.3
$1.8$2.4
$2.2
$0.8
$0.2
$4.7 $6.3
$4.9
$0.8
$5.0
$11.9
$25.5
$13.1$14.5 $14.2
$11.9
$0
$5
$10
$15
$20
$25
$30
2004 2005 2006 2007 2008 2009 2010 2011
Annu
al In
vest
men
t ($
Bill
ions
)
ROW
India
Brazil
China
Europe
US

Climate Change Investment Markets & Asset Classes: Performance Review – Public Markets
39 Investing in Climate Change 2012
Since 2009, China has accounted for the largest portion of global public market investment in the sector (>30%) – a remarkable feat, given that in 2008, China accounted for only 1% of this type of investment. Meanwhile, the US has seen a relatively steady decline in activity in this sector, while Europe has seen a very substantial decline from its pre-crisis peaks. 2011 was no different in this regard, with a considerable 42% of global public market clean energy investment occurring in China. An analysis of initial public offerings (IPOs) in the sector in 2011 reflects these trends, with only $4.2 billion raised in IPOs in 2011 relative to $10.0 billion in 201024, and 7 of the top ten IPOs in 2011 (by capital raised) occurring in China – the remaining 3 occurred in the US (see Figure 25 below for more details). Overall, 84% of the $4.2 billion of capital raised via IPO activity in 2011 occurred in China, 12% in the US, 2.1% in other Asian countries (excluding China), and only 1.2% in Europe25
. This latter point reflects the severe impact of the European sovereign debt crisis on public clean energy markets in the region.
Figure 25: Top 10 Clean Energy IPOs in 201126
Company Name Sector Location Capital Raised ($m) Date Sinovel Wind Group Wind China $1,432 Jan 13th
Huaneng Renewables Wind China $850 June 10th
Beijing Jinguntong Technology Solar China $394 Sep 8th
Solazyme Biofuels US $227 May 26th
Sungrow Power Supply Solar China $215 Nov 2nd
Ningbo Sanxing Electric EST China $207 June 15th
Jioangsu Jixin Wind Energy Technology Wind China $176 May 6th
KIOR Biofuels US $162 June 23rd
Jiangsu Akcome Solar Science & Technology Solar China $125 August 15th
Gevo Biofuels US $123 Feb 8th
Source: Bloomberg New Energy Finance database, 2012
Given this 2011 context, the outlook for “pure-play” clean energy public equities through the remainder of 2012 and into 2013 hinges chiefly on: (i) how the policy retrenchment currently underway in the US and certain European countries affects demand for clean energy technologies; and (ii) when solar PV and wind turbine manufacturers commence a (seemingly inevitable) process of “rationalization” and industry consolidation. Right now then, cleaner energy technologies, such as natural gas, are lower volatility and lower risk for public market investors. Finding statistics on actual public market investment in natural gas is difficult, partly because disaggregating oil from gas companies is difficult as most E&P companies engage in both the oil and gas extraction. What is clear though, is that the demand growth story for natural gas is strong and the public stocks linked to this commodity are outperforming. Natural gas demand increased between ~7% in 2010 on a global scale27, with particularly strong growth in non-OECD countries such as China, where demand rose by 19% in 2010, making it the fourth largest gas consumer in the world (after the US, Russia and Iran). This trend is expected to continue as gas represents a “bridge” fuel for many nations as it is cleaner-burning and offers greater security and as unconventional gas resources are more geographically distributed than conventional resources, the recent and growing discoveries of unconventional resources have major positive implications for gas security – the IEA estimates that all major regions now have total recoverable gas resources equal to at least 75 years of current consumption28
.
24 $3.5 billion was raised in only 1 IPO – Italian multinational renewable energy firm Enel Green Power 25 Sources: Bloomberg New Energy Finance database 2012, DBCCA analysis 2012 26 For illustrative purposes only. Not intended as the recommendation for the purchase or sale of any security. 27 IEA and BP, 2011 28 “World Energy Outlook 2011”, IEA, November 2011

Climate Change Investment Markets & Asset Classes: Performance Review – Public Markets
40 Investing in Climate Change 2012
Gas is also particularly attractive for countries with rapid urbanization, and also in Middle Eastern countries where an oil-to-gas power shift is occurring so that more valuable oil reserves can be freed up for export. Energy policy and economic growth are the key demand drivers of natural gas going forward, with OECD countries expected to experience gas demand growth of 0.7% per annum out to 2035, relative to 2.4% in non-OECD countries – or a global growth rate of 1.7% per year to 2035. This compares to -1% for OECD countries, 1.5% for OECD countries, and 0.8% on a global basis for coal29
. The EIA, in its 2011 projection, expects consumption increasing at an average rate of 1.6% per year from 2008 to 2035. Because increases in production in non-OECD regions is expected to more than meet projected consumption growth, exports of gas from non-OECD exports to OECD countries is expected to grow substantially through 2035. The EIA expects non-OECD producers to account for more than 81% of the total growth in world natural gas production from 2008 to 2035.
Figure 26: Global Natural Gas Consumption, 2008-2035
Source: “International Energy Outlook 2011”, Energy Information Administration, DOE, 2011
This growth story for natural gas supports our view of an interim period in which pure-play energy technologies may be less attractive – at least for public market investors who are less risk tolerant than VC/PE investors, for example. Given the current difficult global political and economic situation we expect to progress through these key energy, efficiency and environmental services transitions, driven more by efficiency and economics as opposed to government policy. Nonetheless, multiple profitable transitional phase investment opportunities will arise during this mega shift, and investors need to have a fundamental understanding of the key value opportunities these “bridge” or intermediary technologies offer, as we transition towards a long-term end-state scenario, where more “pure-play” opportunities will likely dominate. Fundraising and Funds Launched Perhaps reflective of the largely poor returns experienced by investors in clean energy public equities in recent years, according to Bloomberg New Energy Finance there were no new launches of clean energy, environment and cleantech, or climate change public equity funds in 201130
29 According to the IEA’s New Policies Scenario. Source: “World Energy Outlook 2011”, IEA, November 2011
. Figure 27 below shows the dramatic decline in the number of new launches public equity funds dedicated to this space, following a peak of 45 in 2007. However, it should be noted that although there have been no recent fund launches, many of these public equity funds continue to operate in the market. There is not,
30 As of 16 December 2011
110.7
123.1133.4
144.4
156.8168.7
0
20
40
60
80
100
120
140
160
180
200
2008 2015 2020 2025 2030 2035
Con
sum
ptio
n (T
rillio
n C
ubic
Fee
t)
Non-OECD
OECD
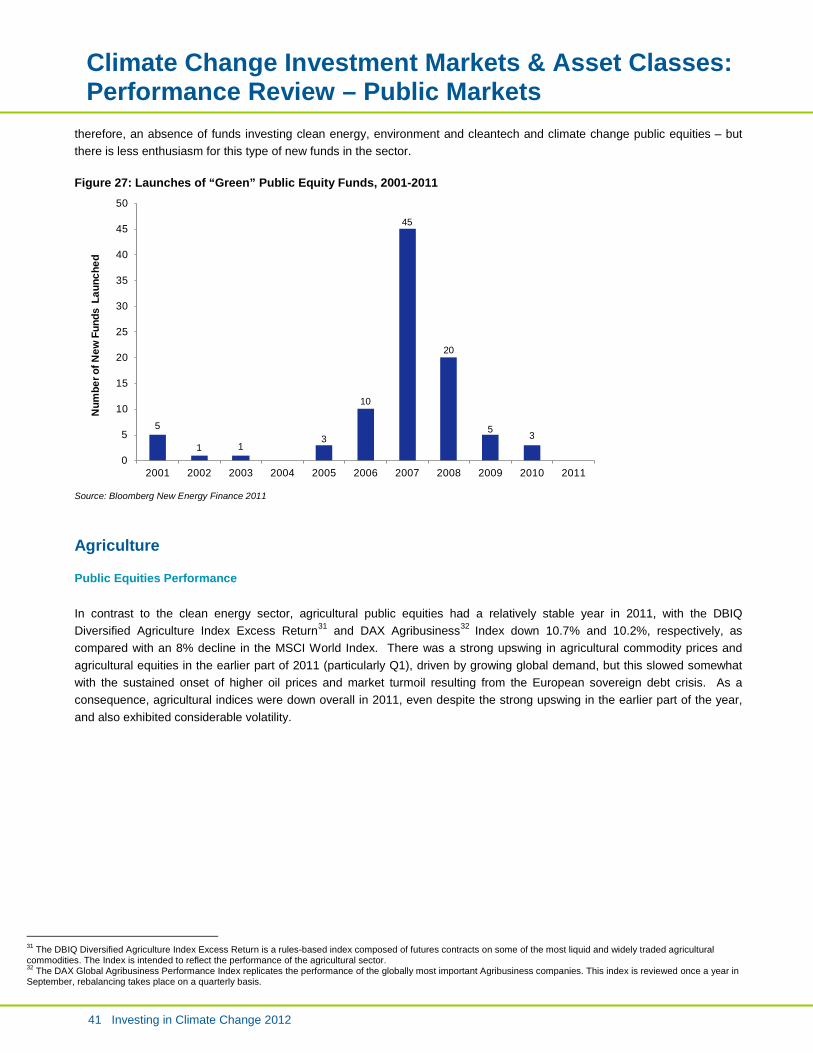
Climate Change Investment Markets & Asset Classes: Performance Review – Public Markets
41 Investing in Climate Change 2012
therefore, an absence of funds investing clean energy, environment and cleantech and climate change public equities – but there is less enthusiasm for this type of new funds in the sector. Figure 27: Launches of “Green” Public Equity Funds, 2001-2011
Source: Bloomberg New Energy Finance 2011
Agriculture Public Equities Performance
In contrast to the clean energy sector, agricultural public equities had a relatively stable year in 2011, with the DBIQ Diversified Agriculture Index Excess Return31 and DAX Agribusiness32
Index down 10.7% and 10.2%, respectively, as compared with an 8% decline in the MSCI World Index. There was a strong upswing in agricultural commodity prices and agricultural equities in the earlier part of 2011 (particularly Q1), driven by growing global demand, but this slowed somewhat with the sustained onset of higher oil prices and market turmoil resulting from the European sovereign debt crisis. As a consequence, agricultural indices were down overall in 2011, even despite the strong upswing in the earlier part of the year, and also exhibited considerable volatility.
31 The DBIQ Diversified Agriculture Index Excess Return is a rules-based index composed of futures contracts on some of the most liquid and widely traded agricultural commodities. The Index is intended to reflect the performance of the agricultural sector. 32 The DAX Global Agribusiness Performance Index replicates the performance of the globally most important Agribusiness companies. This index is reviewed once a year in September, rebalancing takes place on a quarterly basis.
5
1 13
10
45
20
5 3
0
5
10
15
20
25
30
35
40
45
50
2001 2002 2003 2004 2005 2006 2007 2008 2009 2010 2011
Num
ber o
f New
Fun
ds L
aunc
hed

Climate Change Investment Markets & Asset Classes: Performance Review – Public Markets
42 Investing in Climate Change 2012
Figure 28: Indexed Returns of MSCI World, DBIQ and DAX Agriculture Indices (since 2009)
Note: Indexed to 100 as of Jan 1 2006 Source: Bloomberg LP
The performance of global agricultural equities so far in 2012 (through April) demonstrates a complete turnaround and a reflection of Q1 one year prior, with the DAX Agribusiness Index up 11.6% over this four month period – out-performing the broader market (MSCI World is up 9.8% through the end of April). Similarly to agricultural equities, following a sharp increase in agricultural commodities in the first half of 2011, global food prices declined 8% in Q4 2011 due to increasing supplies and uncertainty about the global economy – although as with equities, this period also experienced very high price volatility (see Figure 29 below)33. Overall, on an annual basis food prices (particularly staples such as wheat, maize and rice) in 2011 were both volatile and high with the 2011 World Bank Food Price Index 24% percent higher than its average in 201034. In 2012, agricultural commodities continued their downward trajectory in 2012, losing 5.2% through April – as represented by the Diversified Agriculture Index Excess Return. However, looking forward, some upward price pressures remain, including a possible increase in demand for biofuels if oil prices pick up again, very low stock-to-use levels for maize, volatility in oil prices as a result of unrest in producer countries, and weather changes35
. In addition, over the medium to longer-term, higher and more volatile food prices are expected to be the norm as global demand increasingly outpaces supply.
33 “Quarterly Food Prices Decline, but Remain Volatile”, World Bank Group, January 31, 2012 34 “Quarterly Food Prices Decline, but Remain Volatile”, World Bank Group, January 31, 2012 35 La Niña, for instance, is expected to affect the growing season of maize and soybeans in Argentina and Brazil. Source: “Quarterly Food Prices Decline, but Remain Volatile”, World Bank Group, January 31, 2012
0
50
100
150
200
250
300
350
Jan-
06
Apr-
06
Jul-0
6
Oct
-06
Jan-
07
Apr-
07
Jul-0
7
Oct
-07
Jan-
08
Apr-
08
Jul-0
8
Oct
-08
Jan-
09
Apr-
09
Jul-0
9
Oct
-09
Jan-
10
Apr-
10
Jul-1
0
Oct
-10
Jan-
11
Apr-
11
Jul-1
1
Oct
-11
Jan-
12
Apr-
12
Clos
ing
Price
(Ind
exed
)
DBIQ Diversified Agriculture Index Excess Return
DAX Global Agribusiness
MSCI World

Climate Change Investment Markets & Asset Classes: Performance Review – Public Markets
43 Investing in Climate Change 2012
Figure 29: Indexed Returns of Key Energy and Agricultural Commodities (since 2006)36
Note: Indexed to 100 as of Jan 1 2006 Source: Bloomberg LP
Indeed, the medium to longer-term prospects for investing in agricultural public equities are relatively strong, as similarly to clean energy there are substantial long term drivers of this sector. These include growing demand (for food and fuel) and associated higher and more volatile agricultural commodity prices, a supply-demand mismatch, a need for new and improved technologies and infrastructure to increase crop yields and food distribution, and weather-induced fluctuations in food production (again increasing food prices and volatility).
36 For illustrative purposes only. Not intended as the recommendation for the purchase or sale of any security.
0
50
100
150
200
250
300
350
400
450
Jan-
06
Apr-
06
Jul-0
6
Oct
-06
Jan-
07
Apr-
07
Jul-0
7
Oct
-07
Jan-
08
Apr-
08
Jul-0
8
Oct
-08
Jan-
09
Apr-
09
Jul-0
9
Oct
-09
Jan-
10
Apr-
10
Jul-1
0
Oct
-10
Jan-
11
Apr-
11
Jul-1
1
Oct
-11
Jan-
12
Apr-
12
Clos
ing
Price
(Ind
exed
)
Crude Oil Corn
Ethanol KC Wheat
Soy Oil Soybeans
Chi Wheat
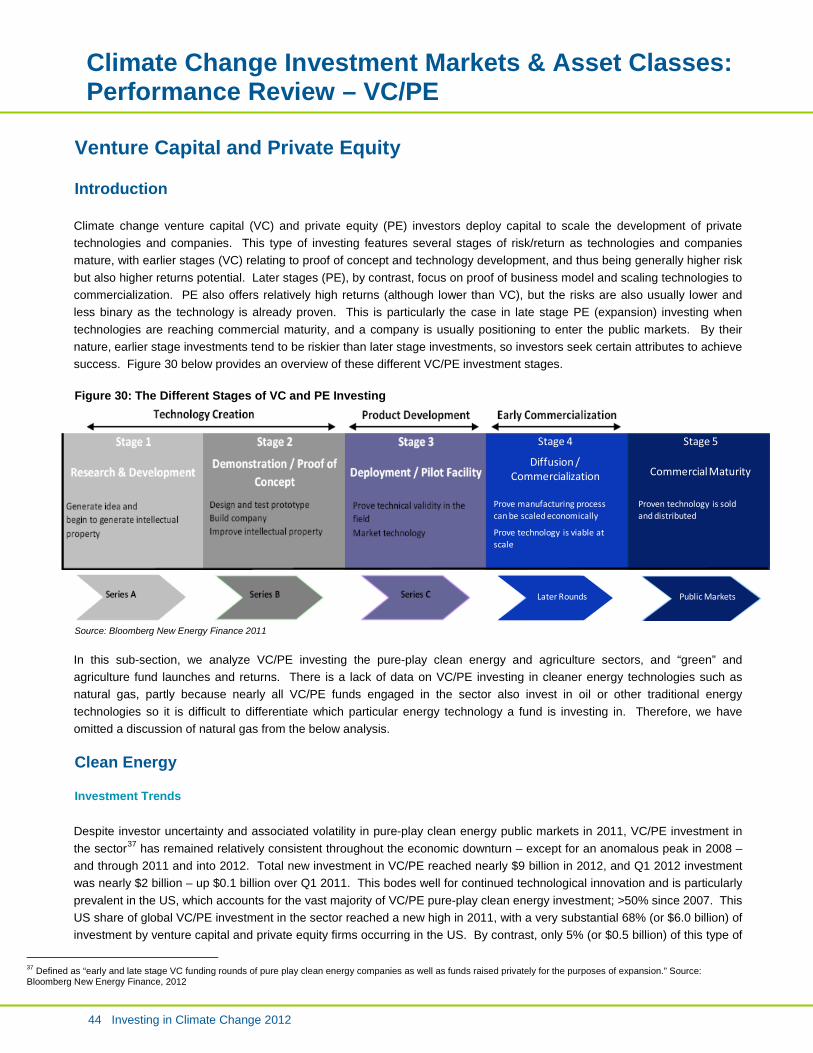
Climate Change Investment Markets & Asset Classes: Performance Review – VC/PE
44 Investing in Climate Change 2012
Venture Capital and Private Equity Introduction
Climate change venture capital (VC) and private equity (PE) investors deploy capital to scale the development of private technologies and companies. This type of investing features several stages of risk/return as technologies and companies mature, with earlier stages (VC) relating to proof of concept and technology development, and thus being generally higher risk but also higher returns potential. Later stages (PE), by contrast, focus on proof of business model and scaling technologies to commercialization. PE also offers relatively high returns (although lower than VC), but the risks are also usually lower and less binary as the technology is already proven. This is particularly the case in late stage PE (expansion) investing when technologies are reaching commercial maturity, and a company is usually positioning to enter the public markets. By their nature, earlier stage investments tend to be riskier than later stage investments, so investors seek certain attributes to achieve success. Figure 30 below provides an overview of these different VC/PE investment stages. Figure 30: The Different Stages of VC and PE Investing
Source: Bloomberg New Energy Finance 2011
In this sub-section, we analyze VC/PE investing the pure-play clean energy and agriculture sectors, and “green” and agriculture fund launches and returns. There is a lack of data on VC/PE investing in cleaner energy technologies such as natural gas, partly because nearly all VC/PE funds engaged in the sector also invest in oil or other traditional energy technologies so it is difficult to differentiate which particular energy technology a fund is investing in. Therefore, we have omitted a discussion of natural gas from the below analysis. Clean Energy
Investment Trends Despite investor uncertainty and associated volatility in pure-play clean energy public markets in 2011, VC/PE investment in the sector37
37 Defined as “early and late stage VC funding rounds of pure play clean energy companies as well as funds raised privately for the purposes of expansion.” Source: Bloomberg New Energy Finance, 2012
has remained relatively consistent throughout the economic downturn – except for an anomalous peak in 2008 – and through 2011 and into 2012. Total new investment in VC/PE reached nearly $9 billion in 2012, and Q1 2012 investment was nearly $2 billion – up $0.1 billion over Q1 2011. This bodes well for continued technological innovation and is particularly prevalent in the US, which accounts for the vast majority of VC/PE pure-play clean energy investment; >50% since 2007. This US share of global VC/PE investment in the sector reached a new high in 2011, with a very substantial 68% (or $6.0 billion) of investment by venture capital and private equity firms occurring in the US. By contrast, only 5% (or $0.5 billion) of this type of
Proven technology is sold and distributed
Stage 5
Commercial Maturity
Public Markets
Prove manufacturing process can be scaled economically
Prove technology is viable at scale
Stage 4
Diffusion / Commercialization
Later Rounds

Climate Change Investment Markets & Asset Classes: Performance Review – VC/PE
45 Investing in Climate Change 2012
early-stage, technology investing occurred in China, a country that has instead been focusing more on building out clean energy infrastructure. Europe, as well, accounted for only 15% of VC/PE investment in the sector in 2011 – and this region has seen a steady decline in its share of VC/PE investing in clean energy, from 43% in 2004 (when it was on a level with the US). This geographical concentration of VC/PE investment activity in the US suggests, we believe, that new, breakthrough clean energy technologies may be more likely to come from the US than China or Europe in the next few years. Figure 31: Annual New Clean Energy VC/PE Investment by Major Country/Region, 2004 - 2011
Source: Bloomberg New Energy Finance, 2012
With regard to the specific sectors receiving VC/PE investment, solar continues to be a recipient of a high proportion of early-stage investing – accounting for 30% in 2011. Energy Smart Technologies (EST) – defined by Bloomberg New Energy Finance as consisting of energy efficiency, energy storage, advanced transportation and digital energy – continues to be a sector of growing interest for both public market and VC/PE investors, and accounted for the largest portion of VC/PE investment in 2011, at 39%. Wind is receiving a declining proportion of this type of investing, most likely because this technology is reaching a level of maturity where it requires less venture or expansion-type capital. The wind upstream market (i.e. turbine manufacturers), for example, is dominated by leading publicly-traded companies producing new turbines and investing in R&D; while the downstream market (i.e. wind developers) is dominated by the leading publicly-traded developers in each geographic market – not leaving much room for VC/PE investment. Figure 32 below shows the evolution of VC/PE investing by sector over time.
$0.6$1.4
$2.6$3.9
$7.1
$3.9
$5.7 $6.0
$0.6
$0.8
$1.6
$1.7
$2.7
$1.5
$1.3$1.3
$0.7
$0.5
$0.7
$0.2
$0.3$0.5
$0.6
$0.4
$0.8
$0.5
$1.5
$2.4
$5.7
$7.8
$12.3
$6.7
$8.5$8.9
$0
$2
$4
$6
$8
$10
$12
$14
2004 2005 2006 2007 2008 2009 2010 2011
Annu
al In
vest
men
t ($
Bill
ions
)
ROW
India
Brazil
China
Europe
US

Climate Change Investment Markets & Asset Classes: Performance Review – VC/PE
46 Investing in Climate Change 2012
Figure 32: Annual New Clean Energy VC/PE Investment by Sector, 2004 - 2011
Note: EST is energy smart technology. For definition see footnote 23. Source: Bloomberg New Energy Finance, 2012
Fundraising and Fund Launches Despite the recent uptick in VC/PE market investing by venture capital and private equity firms in this sector, there has been a continued decline since 2008 in new fund launches by these same firms. Only 15 new funds engaged in clean technology, environmental services and renewable energy (referred to here as “green” funds) were launched in 201138
(i.e. “2011 vintage funds”); 8 of which are venture capital, 6 of which are private equity (growth/expansion/buyout), and 1 of which is an infrastructure fund. This compares to 19 funds launched in 2010, 30 in 2009 and a very significant 52 in 2008 – a majority (21) of which were venture-stage funds (see Figure 33 below for more detail). This decline is reflective of the difficult fundraising environment that has persisted since the onset of the financial crisis in 2008, combined with the fact that very few “Green” funds have finished deploying capital and so their performance cannot yet be fully assessed. This latter point is particularly true for clean energy funds, which are typically First Time Funds (FTFs) and thus their managers do not have prior Fund experience to demonstrate a track record and attract further investment in a new fund. Many institutional investors are thus adopting a “wait-and-see” approach to evaluating the performance of funds in this sector before deploying further capital, explaining the recent decline in new fund launches.
38 Note that these funds do not have to be solely or even dominantly focused on these sectors, but must state that they cover “clean technology, “environmental services” and/or “renewable energy” in order to be included as an eligible fund engaged in the sector
$0.2$0.8 $0.6
$2.0$1.2 $1.4
$0.5$0.5
$1.4$2.6
$4.9
$1.6$2.2
$2.6
$0.8
$1.8
$1.8
$2.3
$1.5$1.0 $1.9
$0.8
$1.4
$1.9
$2.0
$2.0
$3.1$3.4
$1.5
$2.4
$5.7
$7.8
$12.3
$6.7
$8.5$8.9
$0
$2
$4
$6
$8
$10
$12
$14
2004 2005 2006 2007 2008 2009 2010 2011
Annu
al In
vest
men
t ($
Bill
ions
)
Other
EST
Bioenergy
Solar
Wind

Climate Change Investment Markets & Asset Classes: Performance Review – VC/PE
47 Investing in Climate Change 2012
Figure 33: New “Green” Private Investment Funds Launched by Year and Type
Source: Preqin 2012 Note: “Other” includes Fund of Funds, Co-Investment and Special Situation Funds; “Growth / Buyout” are typically standard PE funds
In addition to the decline in the number of funds, there has also been a shift in the type of funds preferred by fund managers – as Figures 33 and 34 illustrate, infrastructure funds have been less popular in recent years, while growth / buyout and venture stage funds have proportionally increased. Infrastructure funds typically demand lower returns and venture stage funds the highest returns (but also higher risks), while growth / buyout (or typical expansion PE) funds fall somewhere in the middle. This decline in private infrastructure fund launches is particularly interesting, given that investing in this asset class has dominated the sector for several years now, and is on the increase. Evidently, the majority of capital is coming from existing private clean energy infrastructure funds, project developers, banks/lenders, governments, and other sources.
Figure 34: Type of New “Green” Private Investment Funds Launched by Year (in % terms)
Source: Preqin 2012
As previously mentioned, fundraising for private equity and venture capital firms – and particularly “Green” funds – has been challenging since 2008, and 2011 was no exception. 2011 vintage funds raised $8.4 billion of capital over the course of the
3 614
9 127 6
7
12
21
218
6 82
5
612
5
2 112
24
45
52
30
1915
0
10
20
30
40
50
60
2005 2006 2007 2008 2009 2010 2011
Num
ber o
f New
Fun
ds L
aunc
hed
Other
Infrastructure
Venture Stage
Growth / Buyout
25% 25%31%
17%
40% 37% 40%
58%50%
47%
40%
27% 32%
53%
17%21% 13%
23%17% 11%
7%4% 9%19% 17% 21%
0%
10%
20%
30%
40%
50%
60%
70%
80%
90%
100%
2005 2006 2007 2008 2009 2010 2011
Type
of F
unds
Lau
nche
d (%
of T
otal
)
Other
Infrastructure
Venture Stage
Growth / Buyout

Climate Change Investment Markets & Asset Classes: Performance Review – VC/PE
48 Investing in Climate Change 2012
year. For those 2011 vintage funds that have not yet raised capital (or disclosed any capital raised), they have a combined targeted fund size of $1.1 billion. Added together then, 2011 saw new funds in this sector targeting or raising $9.5 billion of capital – a not insignificant number. When compared with previous years though, this was slightly less – even than 2006 funds. However, it should be noted that comparing with previous years can be misleading given that some of the previous year’s vintage funds may well have raised capital in later years (e.g. 2010 and 2011), yet this would be reflected in the vintage year when the fund was launched – perhaps 1 or even 2 years prior, if a long fundraising period occurred. Nonetheless, it is clear from Figure 35 below that less VC/PE capital is being raised since the “PE heydays” of 2007 and 2008, and the fundraising environment remains difficult. Figure 35: “Green” Private Investment Capital Raised by Vintage Year
Source: Preqin 2012
Fund Returns With regard to returns, private equity, and particularly venture capital funds, target higher returns than either public market or infrastructure funds as they invest in earlier stage (usually private) companies and are thus considered a riskier asset class. In general, the higher the risk profile, the higher the target returns of a fund – typically 25%+ for a private equity fund, and even higher for a venture capital fund. This is because, as previously mentioned, an investment is typically exposed to higher technology and business model risks at the earlier-stage, which are somewhat moderated as companies move into the expansion stage of capital requirements. Investors can also mitigate risk through sector selection and policy knowledge. Figure 36: Targeted and Actual “Green” VC/PE Returns Data39
Type of Investment Target Returns Actual Returns VC/PE Equity Investment 25%+ -51% to 106%
Source: Preqin, 2012; DBCCA analysis 2012
Fund returns are not typically published by VC/PE funds as it is not a regulatory requirement (in most countries) to publicly disclose fund performance. In addition, due to the long fundraising and investment period of private equity funds in particular – typically 5 to 10 years –, returns data tends to be somewhat out of date and/or incomplete if and when it is published. For
39 Please see Appendix III (Glossary of Key Terms and Indices) for definitions of concepts used in this table and throughout this paper
$2.1
$14.3
$39.8$42.2
$33.4
$11.2$9.5
$-
$5
$10
$15
$20
$25
$30
$35
$40
$45
$50
Vintage 2005
Vintage 2006
Vintage 2007
Vintage 2008
Vintage 2009
Vintage 2010
Vintage 2011
$ B
illio
ns o
f Cap
ital
Target Fund Size
Fund Size

Climate Change Investment Markets & Asset Classes: Performance Review – VC/PE
49 Investing in Climate Change 2012
“green” investment funds, for example, the earliest data available is for 2008 vintage funds. This general lack of returns data is particularly evident for clean technology, environmental services and renewable energy VC/PE funds, given that it is a relatively new sector, and so many funds have not yet completed their investment periods. As a result, much of the data – if reported at all – does not accurately reflect a Fund’s overall performance, but rather just its performance at a particular point in time. Therefore, looking at the range of investment performance among funds is a more accurate method of assessing the historic performance of VC/PE funds engaged in this sector. Figure 37: Actual “Green” Venture Stage (LHS) and Growth/Expansion/Buyout Stage (RHS) Funds Performance40
Note: LHS includes all funds in Preqin database that are defined as “Venture” stage, disclose returns data and cover one or more of the following sectors: clean technology, environmental services and renewable energy – this equates to ~18% of all 344 funds in database post-1990; RHS includes all funds in Preqin database that are defined as “growth”, “expansion” or” buyout” stage, disclose returns data and cover one or more of the following sectors: clean technology, environmental services and renewable energy – this equates to ~9% of all 344 funds in database post-1990 Source: Preqin 2012; DBCCA analysis 2012
The charts above demonstrate the considerable range in returns achieved by VC (on the left) and PE (on the right) funds in this sector that have disclosed their performance data – with the lowest IRR reported at -51% (vintage 2008) for a venture-stage fund, and the highest at +106% (vintage 2005) for a private equity (expansion, growth or buyout) stage fund. Despite this large range, the top-performing funds (those in the top decile) have had meaningful returns of greater than 73% for private equity stage funds, and nearly 33% for venture-stage funds. If all private investment funds are included in the analysis (infrastructure, Fund of Funds, mezzanine and “natural resources” – in addition to pure venture or expansion/growth/buyout funds), a return of greater than 40% is achieved across the board for top decile funds (see Figure 38 below).
40 Please see Appendix III (Glossary of Key Terms and Indices) for definitions of key concepts used in this table and throughout this paper. Past performance is no guarantee of future results.
-40
-20
0
20
40
60
80
100
120
1990 1992 1994 1996 1998 2000 2002 2004 2006 2008
Net
IRR
(%)
-60
-40
-20
0
20
40
60
1990 1992 1994 1996 1998 2000 2002 2004 2006 2008
Net
IRR
(%)

Climate Change Investment Markets & Asset Classes: Performance Review – VC/PE
50 Investing in Climate Change 2012
Figure 38: Actual “Green” Private Investment Funds Performance41
Note: includes all funds in Preqin database that cover one or more of the following sectors: clean technology, environmental services and renewable energy; only those funds with disclosed returns data are included in the analysis –~36% of all 344 funds in database post-1990 Source: Preqin 2012; DBCCA analysis 2012
Agriculture
Investment Trends There is less available investment data for agriculture, but this is clearly a sector experiencing rapid growth: Boston-based farm consultancy HighQuest estimates that global agricultural assets under management are currently $10.8 billion, and are expected to nearly double to $18.1 billion in the next 3 years42
. They identify the key driver of this trend as supply-demand fundamentals and returns (i.e. rising food prices in response to growing demand – particularly for meat and increasingly from Asia), which in turn encourages investments in farm land and production facilities. In terms of geographical concentration, agriculture investors from the US and Europe are increasingly looking to invest in South America due to the surplus land and existence of large-scale farm operations. Africa is also being looked at as a key potential growth region, although large-scale agricultural operations do not really exist as much in this region. In terms of crops, feed grains, corn and soybeans are being targeted – partly to supply livestock as meat demand grows.
Fundraising and Fund Launches This growing private investor interest in agriculture is evident from an analysis of the private equity and venture capital funds engaged in this sector43 – as exhibited in Figure 39 below. Unlike with clean energy, except for a brief decline in 2009, there has been sustained growth in new funds engaged in agriculture, food, beverages, biotechnology and life sciences44
. This is an interesting and encouraging trend, given that the VC/PE investment market in general, in terms of new funds launched and ease of fundraising, has suffered somewhat since the onset of the financial crisis.
41 Please see Appendix III (Glossary of Key Terms and Indices) for definitions of concepts used throughout this paper. Past performance is no guarantee of future results. 42 “Ag as an Asset Class”, HighQuest Partners, Global AgInvesting Conference 2011 43 Note that these funds do not have to be solely or even dominantly focused on these sectors, but must state that they cover “agriculture” in order to be included as an eligible fund engaged in the sector 44 Note that these funds do not have to be solely or even dominantly focused on these sectors, but must state that they cover “agriculture”, “food”, “beverages”, “biotechnology” and/or “life sciences” in order to be included as an eligible fund engaged in the sector
-60
-40
-20
0
20
40
60
80
100
120
1990 1992 1994 1996 1998 2000 2002 2004 2006 2008 2010
Net
IRR
(%)

Climate Change Investment Markets & Asset Classes: Performance Review – VC/PE
51 Investing in Climate Change 2012
Figure 39: New Agriculture VC/PE Funds Launched by Year and Type
Note: includes all funds in Preqin database that cover one or more of the following sectors: agriculture, food, beverages, biotechnology and life sciences; “Other” includes Fund of Funds, Mezzanine, Hybrid, Special Situation and “Natural Resource” Funds; “Growth / Buyout” are typically standard PE funds Source: Preqin 2012
In terms of the type of fund launched, there has been a steady increase in the proportion of private equity growth/buyout funds launched, and a steady proportional decline in early stage, venture funds. This compares with a majority of venture funds engaging in the agricultural sector in 2005 through 2010, and demonstrates that there is something of a trend toward less of a current investor focus on innovative technologies and more of a focus on later-stage, growth companies, and real assets. Figure 40: Type of New Agriculture VC/PE Funds Launched by Year (in % terms)
Note: includes all funds in Preqin database that cover one or more of the following sectors: agriculture, food, beverages, biotechnology and life sciences Source: Preqin 2012
As Figure 41 below shows, these new agriculture funds being launched are raising fairly consistent amounts of capital, and the target fund size has increased substantially since 2009 – with a record combined target fund size and actual fund size of nearly $63 billion in 2011. Again, this indicates that investors and fund managers are increasingly engaging in this sector.
23 21 32 41 3558
79
72 8086 72
51
66
7317
26
33 34
17
45
46
112127
151 147
103
169
198
0
50
100
150
200
250
2005 2006 2007 2008 2009 2010 2011
Num
ber o
f New
Fun
ds L
aunc
hed
Other
Venture Stage
Growth / Buyout
21% 17% 21%28%
34% 34%40%
64%63% 57%
49%50%
39%37%
15% 20% 22% 23%17%
27% 23%
0%
10%
20%
30%
40%
50%
60%
70%
80%
90%
100%
2005 2006 2007 2008 2009 2010 2011
Type
of F
unds
Lau
nche
d (%
of T
otal
)
Other
Venture Stage
Growth / Buyout

Climate Change Investment Markets & Asset Classes: Performance Review – VC/PE
52 Investing in Climate Change 2012
Vintage 2011 funds have not yet raised even close to their target fund size, but that is not surprising seeing as most VC/PE funds will engage in fundraising – particularly in the current environment – for greater than 12 months. The data therefore suggests a continued current and future growth trend occurring in VC/PE investment in this sector. As we have outlined elsewhere in this “Investing in Climate Change 2012” report, there is a very significant expected future global supply-demand imbalance for food, and it seems that VC/PE market investors are recognizing this as an investment opportunity and investing in VC/PE funds dedicated to the sector. Figure 41: Agriculture VC/PE Capital Raised by Vintage Year
Note: includes all funds in Preqin database that cover one or more of the following sectors: agriculture, food, beverages, biotechnology and life sciences Source: Preqin 2012 Fund Returns Figure 42: Targeted and Actual Agriculture VC/PE Returns Data45
Type of Investment Target Returns Actual Returns VC/PE Equity Investment 25%+ -100% to +165%
Note: includes all funds in Preqin database that cover one or more of the following sectors: agriculture, food, beverages, biotechnology and life sciences Source: Preqin 2012; DBCCA analysis 2012 As previously mentioned, private equity and venture capital funds typically target returns (measured as net internal rate of return) of 25% or higher. Out of a total of 2,051 venture capital or private equity funds with a full or partial focus on agriculture launched since 1992, only 564 (or ~28%) of these funds have disclosed returns data – again, this data set therefore represents a limited sample size, and the vast majority of funds are not disclosing returns data. Of these funds, there is a substantial range in returns (as measured by net IRR), from a low of -100% to a high of +165%, as can be seen in Figure 43 below. Despite this large range, the top-performing funds (those in the top decile) have had impressive returns (net IRR) of greater than 56%.
45 Please see Appendix III (Glossary of Key Terms and Indices) for definitions of key concepts used in this table and throughout this paper
$42.0
$30.8
$57.7
$42.5
$25.0
$36.6
$62.6
$-
$10
$20
$30
$40
$50
$60
$70
Vintage 2005
Vintage 2006
Vintage 2007
Vintage 2008
Vintage 2009
Vintage 2010
Vintage 2011
$ B
illio
ns o
f Cap
ital
Target Fund Size
Fund Size

Climate Change Investment Markets & Asset Classes: Performance Review – VC/PE
53 Investing in Climate Change 2012
Figure 43: Actual Agriculture VC/PE Returns Data46
Source: Preqin 2012; DBCCA analysis 2012 Note: includes all funds in Preqin database that cover one or more of the following sectors: agriculture, food, beverages, biotechnology and life sciences; only those funds with disclosed returns data are included in this analysis (~28% of all 2,051 funds in database post-1990)
46 Please see Appendix III (Glossary of Key Terms and Indices) for definitions of key concepts used throughout this paper. Past performance is no guarantee of future results.
-100
-50
0
50
100
150
200
1990 1992 1994 1996 1998 2000 2002 2004 2006 2008 2010
Net
IRR
(%)

Climate Change Investment Markets & Asset Classes: Performance Review – Infrastructure
54 Investing in Climate Change 2012
Infrastructure – Asset Financings Introduction
As an asset class, infrastructure investment focuses on establishing long-term contracted cash-flows from physical operating assets. Infrastructure investors seek to de-risk all components that affect the certainty of these cash-flows, including financing and operational risks – for example, by investing in experienced teams with proven track records and secured financing. Infrastructure investment in climate change sectors is driven by project level economics, which can vary across geographies and by technology sector. Risks to the asset class occur inherently at the local / project level, although diversified portfolios of projects can distribute and mitigate the risks. Infrastructure also faces some liquidity risks, as investors must hold a relatively illiquid asset for longer periods of time, although this is mitigated by streams of contracted, steady cash-flows. A requirement of infrastructure investment is “bankable” technology. Bankable technologies are those technologies which are sufficiently mature to qualify for bank financing options. Currently, wind and solar technologies are the largest areas of focus for infrastructure investors in pure-play clean energy sectors, although within the broader framework of cleaner energy, many investors are also considering natural gas assets. Some areas, such as energy efficiency, are more difficult for infrastructure investors to access. For example, the deployment of Light Emitting Diodes (LEDs) is a major trend across climate change investments, but it is not easily invested in from an infrastructure perspective as most LED installations are self-financed by building owners, with limited use of outside financing. Similarly, agricultural infrastructure can be difficult to define and separate from other types of infrastructure, such as highways and storage facilities to transport and store agricultural products. Figure 44: Different Stages of an Energy Infrastructure Project
Source: DBCCA analysis, 2011.
As is evident from Figure 44 above, in terms of energy infrastructure projects risks to investors include price volatility of the feedstock (although this is less for non-recurring feedstock energy sources such as wind and solar) and the power sold, as well as regulatory risks. Price volatility is typically managed through hedges and fuel supply contracts and the power is typically sold via contracted off-take agreements, referred to in the US as Power Purchase Agreements (PPAs), and tariffs where Feed-in Tariffs (FiTs) exist in other regions. The key to managing the regulatory risk in these infrastructure projects is to lock-in the cash flow to the project during the window of policy certainty. The overall risk to the infrastructure fund manager is deployment of the capital in a timely manner as well as identifying the best policy framework in the right geography and
Capital Structure
---------Debt /
Equity %
Cost of Funds
Pricing
PPA / FITs / Offtake
Agreements
Commodity Pricing
Funding Operating Asset Sale of Electricity

Climate Change Investment Markets & Asset Classes: Performance Review – Infrastructure
55 Investing in Climate Change 2012
administrative level (federal, state, local, etc.). Other risks include those related to operations, and any industrial risks typical of all infrastructure projects. Cleaner Energy Investment Trends Pure play clean energy project financing (debt and equity) reached a record annual investment figure of $145.6 billion in 201147
– a >5% increase over 2010’s record investment, and 56% of overall investment in all clean energy. In Q1 2012, clean energy infrastructure investing continues to be robust, although down slightly over the same quarter in 2011 – $24.2 billion was invested in the first quarter of this year, relative to $27.9 billion in Q1 2011.
Asset finance has always exceeded public market and VC/PE investment, but now consistently dwarfs investment in these other asset classes (see Figure 45 below). The largest contrast is the 2009-2011 decline in public market investment relative to the recent boom in asset financings – this divergence in investor interest between these asset classes demonstrates that clean energy projects continue to be financed and built, despite uncertainty in the public markets. Figure 45: Annual New Clean Energy Investment by Asset Class, 2004 – 2011
Source: Bloomberg New Energy Finance, 2012
47 Defined as “the financing of renewable energy generating projects. This includes both electricity generating and biofuels production assets. Projects may be financed via the balance sheets of the project owners, or through financing mechanisms such as syndicated equity from institutional investors, or project debt from banks.” Source: Bloomberg New Energy Finance 2012
$22.8
$40.3
$70.8
$92.2
$120.9
$107.6
$138.3$145.6
$5.0$11.9
$25.5
$13.1 $14.5 $14.2 $11.9
$2.4$5.7
$7.8$12.3
$6.7 $8.5 $8.9$0
$20
$40
$60
$80
$100
$120
$140
$160
2004 2005 2006 2007 2008 2009 2010 2011
Annu
al In
vest
men
t ($
Bill
ions
)
Asset Finance
Public Markets
VC/PE

Climate Change Investment Markets & Asset Classes: Performance Review – Infrastructure
56 Investing in Climate Change 2012
Figure 46: Percentage Change in Investment by Asset Class Year over Year, 2005-2011
Source: Bloomberg New Energy Finance, 2012
As Figure 46 above shows, both VC/PE and infrastructure investing have only had one year where pure-play clean energy investment was less than the year below – this was in 2009. This is unlike public investment which has seen considerable volatility and several “down” years since the onset of the financial crisis. In addition, asset finance has seen the largest gains over the last couple of years, even in percentage terms. Figure 47: Annual New Clean Energy Asset Finance Investment by Region, 2004 – 2011
Source: Bloomberg New Energy Finance, 2012
In terms of a regional breakdown, there has been a consistently strong growth trend in pure-play clean energy asset finance investment in China over the past several years, while the US has seen considerable fluctuations, and Europe has been on a
76%
30% 31%
-11%
29%
5%
136%
114%
-49%
11%
-2%-16%
134%
38%
58%
-45%
27%
4%
-100%
-50%
0%
50%
100%
150%
2005-06 2006-07 2007-08 2008-09 2009-10 2010-11
Perc
enta
ge C
hang
e in
Inve
tmen
t (Yo
Y)
Asset Finance
Public Markets
VC/PE
$3.8 $7.7$22.2 $21.7 $23.3
$12.4$21.0
$36.5
$10.9$17.3
$23.2$35.8
$45.3
$41.4$39.7
$35.1
$1.4
$4.7
$8.5
$12.7
$22.8
$32.4
$42.4
$44.3
$4.2
$7.1
$12.5$6.3
$6.6
$7.9
$22.8
$40.3
$70.8
$92.2
$120.9
$107.6
$138.3$145.6
$0
$20
$40
$60
$80
$100
$120
$140
$160
2004 2005 2006 2007 2008 2009 2010 2011
Annu
al In
vest
men
t ($
Bill
ions
)
ROW
India
Brazil
China
Europe
US

Climate Change Investment Markets & Asset Classes: Performance Review – Infrastructure
57 Investing in Climate Change 2012
downward trajectory since 2008 (see Figure 47 above). Relative to 2009 and 2010, 2011 has been a particularly robust year for pure-play clean energy infrastructure investments in the US, with nearly $36.5 billion of investment in 2011 (this compares to $21.0 billion in 2010). This substantial increase in the US is largely the result of a boom in investment in wind and solar to meet the Treasury Grant Program deadline, which expired at the end of 2011, and in anticipation of the expiry of the wind PTC at the end of 2012. And the US made some progress in closing the gap with China’s clean energy infrastructure investing – the US accounted for 25% of the global total, relative to China’s 30% in 2011. However, China once again maintained its lead in clean energy infrastructure investing in 2011, a position it has held since 2010 (or earlier if Europe is disaggregated into individual countries) as it strives to meet growing energy demand and ambitious clean energy targets. For these reasons – and in contrast to many developed countries where power demand may be somewhat flat –, we expect to see continued and increasing growth in clean energy infrastructure investing in emerging economies for some time. Figure 48: Annual New Clean Energy Asset Finance Investment by Sector, 2004 – 2011
Source: Bloomberg New Energy Finance, 2012
With regard to infrastructure investments by clean energy sector, wind continues to dominate, although there was a decline in wind asset financings in 2011, which is interesting considering: (i) the fact this has not occurred since Bloomberg New Energy Finance began tracking this data in 2004; and (ii) the US boom in wind installations – these increased 31% to 6.8 GW in the US in 2011 (relative to 2010)48
. Meanwhile, solar infrastructure investment nearly doubled between 2010 and 2011, and solar is now receiving a very substantial 36% ($52.9 billion) of global clean energy infrastructure investing, relative to only 21% ($28.4 billion) in 2010. By contrast, wind’s share of infrastructure investment has declined from 63% ($87.1 billion) in 2010 to 51% ($73.6 billion) in 2011.
48 American Wind Energy Association, 2012
$12.3$21.6
$29.7$41.0
$62.6 $68.3
$87.1$73.6
$0.9
$4.1
$11.6
$22.3 $15.9
$28.4 $52.9
$7.9
$12.8
$31.2
$32.7
$28.8$17.8
$17.0
$14.6
$22.8
$40.3
$70.8
$92.2
$120.9
$107.6
$138.3$145.6
$0
$20
$40
$60
$80
$100
$120
$140
$160
2004 2005 2006 2007 2008 2009 2010 2011
Annu
al In
vest
men
t ($
Bill
ions
)
Other
Bioenergy
Solar
Wind

Climate Change Investment Markets & Asset Classes: Performance Review – Infrastructure
58 Investing in Climate Change 2012
Figure 49: Annual New Clean Energy Small Distributed Capacity Investment by Region, 2004 – 2011
Source: Bloomberg New Energy Finance, 2012
An analysis of investment in small distributed capacity (SDC) also shows the strong growth trend in investment in renewable energy projects, particularly residential solar, as these are what constitute the SDC database, with record investment of nearly $74 billion in 2011 (see Figure 49 above)49
. The vast majority of these projects are being built in Europe where there are strong incentives for rooftop solar, such as Feed-in Tariffs, particularly in Germany. China has started investing in SDC in recent years, but the total investment numbers are still negligible, as is the case for other emerging economies, such as Brazil and India. In the US, as well, investment in SDC is not that considerable, as there are only a few state initiatives targeting rooftop solar, and only in some of these states do the economics make sense for residential projects (for example, California).
With regard to natural gas infrastructure investment, the IEA “World Energy Outlook 201150
” forecasted global upstream oil and gas investment to continue its strong growth trend in 2011. Based on the announced spending plans of 70 leading oil and gas companies, overall upstream oil and gas investment hit a new record of $552.6 billion in 2011 – 9% more than capital spending in 2010 and 10% higher than the previous peak in 2008. It should be noted though that this data is for oil and gas spending – not just gas – as it is very difficult to disaggregate spending between these sectors given that nearly all major companies engaged in this space are active in both oil and gas. However, in general, US natural gas companies have been substantially increasing spending on infrastructure, even though companies in some other regions (e.g. Russia) may be slightly reducing investment, although to a lesser extent.
Overall then, the IEA expects the increasing investment trend to continue, with total gas investment of $9.5 trillion over the 2011 to 2035 period – this compares with an expected $10.0 trillion of investment in the oil industry over the same time period.51
The aforementioned historic and projected growth in natural gas demand will be a key driver of this increasing investment in natural gas infrastructure.
49 Note that Q1 2012 SDC statistics are not yet available.SDC investment is an estimate calculated on an annual basis to compensate for missed deals due to the fact the BNEF “asset finance” database does not track residential clean energy projects (usually less than 1 MW). Source: Bloomberg New Energy Finance 2012 50 Published in November 2011 51 “World Energy Outlook 2011”, IEA, November 2011
$1 $1 $2 $3 $3 $4 $4$5 $7$5
$8
$15$22
$45
$54
$0
$1
$1
$1
$8.6$10.8
$7.2
$13.4
$21.6
$31.2
$60.4
$73.8
$0
$10
$20
$30
$40
$50
$60
$70
$80
2004 2005 2006 2007 2008 2009 2010 2011
Annu
al N
ew In
vest
men
t ($
Bill
ions
)Th
ousa
nds
ROW
China
Europe
US

Climate Change Investment Markets & Asset Classes: Performance Review – Infrastructure
59 Investing in Climate Change 2012
Fundraising and Fund Launches An analysis of all “green” private investment funds – divided into venture, private equity (growth/expansion/buyout), and infrastructure – is included in the preceding sub-section on VC/PE Investment. If one looks specifically at private funds in the space that are categorized as “infrastructure”, there has been a clear decline in the number of these funds launched each year since 2008 (see Figure 50 below). As previously mentioned, this decline in private infrastructure fund launches is particularly interesting, given that investing in this asset class has dominated the sector for several years now, and is on the increase. Evidently, the majority of capital is coming from existing private clean energy infrastructure funds (i.e. funds that were launched prior to 2011 and are currently investing), project developers, banks/lenders, governments, and other sources. Indeed there are several relatively large clean energy infrastructure funds currently investing in the sector – for example, Impax Asset Management and HgCapital each have two funds currently investing in clean energy infrastructure. However, no public clean energy infrastructure funds were launched in 2011. Figure 50: New “Green” Private Infrastructure Funds Launched by Year
Source: Preqin 2012; DBCCA analysis 2012
Fund Returns As previously outlined, infrastructure as an asset class has relatively low technology risk, and the return profile is based on steady, long-term contracted cash flows. As a result, infrastructure investors require lower returns than typical private equity or venture capital investors – usually in the 12-18% range for an equity investment, or 6-10% for a debt investment. Infrastructure debt investors require lower returns than infrastructure equity investors as this represents the fixed income component of infrastructure assets – debt investors are higher in the capital structure and therefore take on less risk than equity investors (as they will get paid back first). With regard to infrastructure investing, returns are also very site (and thus deal) -specific, particularly in the case of clean energy projects as the resource availability, government incentives, planning process and associated costs, etc. all vary considerably by locality (both at a national and sub-national level). As a result, determining a global average target returns range can be particularly difficult for green infrastructure investors.
2
5
6
12
5
2
1
0
2
4
6
8
10
12
14
2005 2006 2007 2008 2009 2010 2011
Num
ber o
f New
Fun
ds L
aunc
hed

Climate Change Investment Markets & Asset Classes: Performance Review – Infrastructure
60 Investing in Climate Change 2012
Figure 51: Targeted and Actual “Green” Infrastructure Returns Data52
Type of Investment
Target Returns Actual Returns Infrastructure Equity Investment 12% to 18% -13% to +21%
Infrastructure Debt Investment 6% to 10% -13% to +21%
Sources: Preqin 2012; DBCCA analysis 2012
An analysis of the available returns data for private “Green” infrastructure funds reveals returns in the range of -13% to +21%. Unfortunately it is not possible to distinguish if these returns result from infrastructure equity or debt investments, and it should also be noted that this data is from a small sample size of only 15 funds. In terms of top performers, the top decile of these funds received returns of 20.3%, demonstrating that these types of funds can indeed exceed their target returns if successfully managed and executed. Figure 52: Actual “Green” Infrastructure Returns Data53
Source: Preqin 2012; DBCCA analysis 2012 Note: includes all infrastructure funds in Preqin database that cover one or more of the following sectors: clean technology, environmental services and renewable energy; only those funds with disclosed returns data are included in the analysis (total of 15 funds)
As mentioned in the previous VC/PE Performance Review sub-section, there is a lack of data on fund investing in cleaner energy technologies such as natural gas, partly because nearly all VC/PE funds engaged in the sector also invest in oil or other traditional energy technologies so it is difficult to differentiate which particular energy technology a fund is investing in. Therefore, we have omitted a discussion of natural gas from this fund returns analysis, focusing instead on “green” funds. Agriculture Investment Trends While current statistics on global investment in agricultural infrastructure are difficult to attain, this sector offers huge potential growth due to rapidly increasing demand for food and associated upward pressure on prices, particularly from emerging and developing economies. The UN, for example, believes $10 trillion will need to be invested in agricultural infrastructure, research and development by 2050 to ensure sufficient food supplies54
52 Please see Appendix III (Glossary of Key Terms and Indices) for definitions of key concepts used in this table and throughout this paper
. Countries with rapidly increasing demand for food are
53 Please see Appendix III (Glossary of Key Terms and Indices) for definitions of key concepts used throughout this paper. Past performance is no guarantee of future results. 54 As cited in: “Heavy Investment Required in Agricultural Infrastructure”, allAfrica, October 25, 2011.
-15
-10
-5
0
5
10
15
20
25
2004 2005 2006 2007 2008
Net
IRR
(%)
Climate Change Investment Markets & Asset Classes: Performance Review – Infrastructure
61 Investing in Climate Change 2012
increasingly taking account of this trend, and investing heavily in agricultural infrastructure – the Chinese government, for example, announced in December 2011 that it is increasing 2012 agricultural infrastructure investing by 10% from 2011, to reach nearly $3.8 billion55
. China is planning to increase all of its spending on infrastructure in 2012, but is placing a particular focus on agriculture.
We expect this investment trend to be particularly strong in emerging economies, such as China, Brazil and India, with rapid growth in agriculture infrastructure investment in these countries (particularly China) to meet burgeoning demand for food. Agriculture is also seen as an “engine” of economic growth for many developing nations, and substantial investment in this sector is already occurring – and expected to grow – in many countries in Africa and Latin America. African nations, in particular, tend to lack advanced agricultural infrastructure and therefore need greater infrastructure investment for this sector to continue to grow and to attract more foreign investors.
55 As cited in: “China to increase infrastructure investment in 2012”, WantChinaTimes, December 28, 2011
Climate Change Investment Markets: Consensus Outlook Key Themes
62 Investing in Climate Change 2012
Section III. Climate Change Investment Markets: Consensus Outlook
Key Themes
In this Section we have undertaken a nearer term consensus outlook of the status, and key drivers and challenges for the following sectors: cleaner energy (solar PV, wind power and natural gas), energy efficiency (LED lighting, industrial efficiency) and management (energy storage, smart grid), sustainable transportation (electric vehicles and hybrids, and natural gas vehicles), water and agriculture. In order to conduct this analysis we undertook a review of recent research covering these sectors, with a particular focus on investment bank reports. Key findings are as follows: Solar PV is expected to continue to grow in terms of deployment of power generating capacity,
largely driven by emerging markets and the US. However, this growth will be at a slower rate than in recent years, with the traditional solar demand center of Europe slowing down as many subsides are reduced or eliminated. Meanwhile, substantial overcapacity among solar manufacturers is expected to drive consolidation of the upstream solar PV industry.
Deployment of new wind capacity is expected to continue at current rates, largely driven by emerging markets – in particular, China, Brazil and India –, and substantial growth (from a low base) is expected in offshore wind. Meanwhile, deployment of new wind power in the US and Europe is expected to be muted due to low power demand growth and power prices and the reduction or elimination of many subsidies. Similarly to the solar sector, consolidation is expected in the upstream wind industry due to over-capacity among manufacturers.
Meanwhile, cleaner energy production, in the form of natural gas, has been experiencing a boom in North America, where prices are very low. This is leading to a coal to gas switch in the US56
With regard to energy efficiency (EE), this remains an emerging growth market. LEDs are becoming increasingly important in the general lighting market, but there is continued downward pricing pressure due to modest demand growth and excess supply. Market consensus therefore expects compressed margins and reduced earnings growth for companies that rely solely on upstream revenues, while prospects for downstream companies are positive.
, driven by a combination of an abundance of available gas (due to vast extraction of unconventional (i.e. shale) gas resources) and impending federal regulations that make coal a less attractive (economically and environmentally) power source. There is also strong demand for liquefied natural gas (LNG) from Asia, a region with high power demand growth and limited regional gas resources.
Meanwhile, industrial efficiency is becoming increasingly critical for competitive advantage purposes, particularly in emerging markets and in capital-intensive sectors. However, sluggish growth of global GDP and tightening of government budgets threatens to diminish opportunities. Consensus is similarly divided on the earnings outlook for those in the industrial EE space: some argue that with average margins in 2011 already at a record level (>12%), margin compression is inevitable (particularly if market growth is slowing); while others estimate the industrial EE space to offer the highest potential EPS growth of any climate-related sector. One particularly promising area may involve providing energy-efficiency solutions to data centers, with analysts projecting industrial EE applications for data centers to be a $40 billion market by 2015.
Energy management systems such as energy storage and smart grid, are also emerging growth markets, although the former are at an earlier stage of evolution as current energy storage technologies are still too costly to deploy at scale – however, projected cost reductions make these a very promising early stage technology, with this sector classified as “ripe” for VC/PE
56 See our recent research report on this trend – “Natural Gas and Renewables: The Coal to Gas and Renewables Switch is On!” Note can be accessed at: http://www.dbcca.com/dbcca/EN/_media/NaturalGasAndRenewables-Oct_2011_Update.pdf

Climate Change Investment Markets: Consensus Outlook Key Themes
63 Investing in Climate Change 2012
investment in early-stage technologies with the potential to store energy at dramatically lower cost points. Energy storage sub-sector offers 12-month forward Earnings per Share (EPS)57
Smart grids are expected to expand from the US market into Europe and Asia over the next several years, with some industry consolidation expected. In the public equities markets, analysts view the near-term outlook for smart grid shares as largely depending on how much weight investors will attach to the earnings growth potential associated with increased deployment volumes in 2013. Analysts also emphasize that, as a result of growing “commoditization” of smart grid hardware, smart grid companies involves in providing software solutions and analyzing data may see the most favorable margins.
growth of 29%, compared with 2% for global equities generally and -19% for the HSBC Climate Change index.
Sustainable transportation alternatives are still a relatively niche market, in particular vehicle electrification (EVs/PHEVs) and natural gas vehicles (NGVs). Presently, EVs and PHEVs still depend heavily on government support as they cannot compete independently at scale without reductions in the cost of battery technologies and are also constrained by limited infrastructure. How EV/PHEV economics will evolve depends mostly on how quickly Li-ion batteries can descend the technology cost curve, so analysts favor battery manufacturers that can rapidly increase efficiency while reducing cost. Meanwhile, key prospects for early-stage investors remain in “game-changing” battery technologies which could be commercialized within 10 years.
NGVs similarly suffer from constrained refueling infrastructure, even though the economics are currently very favorable in regions with low natural gas prices, such as the US. Despite infrastructure representing the main bottleneck to NGVs, analysts are generally bearish on investment in NGV infrastructure, as shifting regulatory climate risks commoditizing suppliers. Investors are instead advised to focus on vehicle manufacturers and suppliers of proprietary enabling technologies.
Global biofuels production also continues to grow, although it has just reached something of a near-term plateau and the real future growth prospects now lie in the commercial production of 2nd generation biofuels, which generally remain at very high costs of production. Several companies have filed to go public this year, so “investor fatigue” is expected, with analysts favoring capital-efficient companies with partners who can supply market access and – for second generation biofuels companies – those that can synthesize feedstock from biomass or commercialize breakthroughs in process economics that upend established markets.
Agriculture continues to remain a key growth industry, particularly as food demand from emerging economies is expected to grow substantially in the coming years. Profit margins, however, vary considerably among different segments of the supply chain, with high grain prices (which is the situation at present) resulting in profits for farmers and seed/fertilizer companies but squeezed margins for protein producers.
Water is also a key growth industry, driven by regional supply-demand imbalances. Expected future water shortages also present promising opportunities for alternative and/or more efficient water production and transportation opportunities, with analysts favoring companies involved in providing, treating, and distributing freshwater. For this sector to recognize its full opportunity, however, growing privatization and streamlining of infrastructure development will need to occur. Privatization of assets may induce greater investment in efficiency technologies such as smart meters and new filtration technologies, suggesting potential opportunities for VC/PE investors. However, VC/PE investors must contend with the political risk of higher water prices and a slow investment cycle that tends to constrain deployment of new water technologies.
57 Please see Appendix III (Glossary of Key Terms and Indices) for definitions of key concepts throughout this paper

Climate Change Investment Markets: Consensus Outlook Key Themes
64 Investing in Climate Change 2012
Summary Table of Consensus View of Status, Key Drivers/Challenges and Near-term Outlook for Key Sectors 58
Sector Status Key Drivers/Challenges Near-Term Outlook
Solar PV 2011 global market had 27
GW of demand, $91.6bn of
revenues, module APSs
<$1/W, and nearly 50%
excess production
capacity.
Reduction of subsidies in Germany/Italy/Spain,
exit of zero/negative-margin wafer/cell/module
production capacity.
GW volumes increase slightly but global
revenues decrease slightly (due to
decreasing module prices). Sentiment
toward manufacturers remains negative
until pending rationalization of excess
capacity; low ASPs deter entry of next-
generation technologies.
Wind Power 2011 global market had
41.6 GW of demand (half
of this from China),
$71.5bn in revenues, and
significant excess
production capacity.
Electricity grid challenges in China, potential
expiration of US production tax credit, growth of
off-shore wind installations.
Similar to solar, GW volumes may
increase but global revenues likely to
decrease. Commentators expect
upstream consolidation via
bankruptcy/M&A; access to offshore
turbine market will be a key to survival.
Natural Gas In N. America, key story
has been growth of shale
gas production and decline
of spot prices to under
$2/MMBtu.
Continued coal-to-gas switching by US utilities,
“standardization” of US shale production, shift
from dry gas plays to wet gas plays, steady
growth of LNG market.
Low spot price of gas in US favors
utilities with under-used gas capacity;
mature phase of shale production favors
E&Ps with large-scale operational
expertise; and growth of LNG market
favors integrated companies with global
footprint.
LEDs $11.5bn market
segmented among high-
brightness (e.g. general
lighting), medium-
brightness (TVs, monitors),
and low-brightness (mobile
phones) applications.
Rising use of LEDs for general lighting
(currently less than 5% socket penetration),
increasing commoditization of LED
chips/components.
LED market increasingly segments
between higher-margin, faster-growing
general lighting segment and lower-
margin, slower-growing medium/low-
brightness segments. Companies with
downstream channels are best
positioned.
Industrial EE Diversified sector that from
2004-2011 grew at 5%+
CAGR (BRICs key
drivers).
Rising resource prices and stricter
environmental regulation, but also headwinds
from slower growth in BRICs.
Generally bullish as widespread potential
for strong earnings growth; greening data
centers could be key growth market.
Energy
Storage
Deployment of battery
storage systems
increasing, but market still
in embryonic stage.
Cost trajectory of Li-ion batteries, increasing
penetration of variable renewable generation.
Less expensive Li-ion batteries open new
storage applications, but market still
awaits “breakthrough” technologies with
capital costs ~$100/kWh (vs. $600-
$800/kWh for Li-ion batteries).
58 Please note certain information in this presentation constitutes forward-looking statements. Due to various risks, uncertainties and assumptions made in our analysis, actual events or results or the actual performance of the markets covered by this presentation report may differ materially from those described. The information herein reflect our current views only, are subject to change, and are not intended to be promissory or relied upon by the reader. There can be no certainty that events will turn out as we have opined herein.

Climate Change Investment Markets: Consensus Outlook Key Themes
65 Investing in Climate Change 2012
Sector Status Key Drivers/Challenges Near-Term Outlook
Smart Grid Majority of activity has
come via orders from N.
American utilities (backed
by federal stimulus
dollars).
EU mandate for 80% smart metering by 2022;
smart meter deployment in Japan, Thailand, S.
Korea
Led by France/UK/Spain, non-US market
grows to > $3bn in 2015 (vs. $0.5bn in
2012). Commoditization of advanced
meters means more upside in
data/analytics/software companies. 2012
likely to see M&A and IPO activity.
EV/PHEV 70 million units sold in
2011 marked first step
toward commercially-
relevant volumes – but
EV/PHEV still a rounding
error in global auto market.
Cost trajectory for Li-ion batteries, gasoline
prices, durability of government rebates.
Falling costs for Li-ion batteries shorten
paybacks and spur adoption, but
estimates for 2020 penetration vary from
3% - 15%. $9-$17bn incremental
opportunity by 2015 is positive for battery
manufacturers, but winning battery
chemistry is still an open question.
NGVs NGVs currently only 1% of
total global vehicle sales –
and only 0.1% in US.
Spread between natural gas and diesel prices,
public emphasis on more fuel-efficient forms of
transport.
Entry of gas producers and OEMs sets
stage for volume growth in 2014+; key
bottleneck remains need to develop
refueling infrastructure
Biofuels 34bn gallon/yr biofuels
market reached a record
$83bn in 2011. Brazil
(sugar-based) and US
(corn-based) are dominant
ethanol producers.
Biofuels still, however, less
than 2% of $1.5T
transportation fuels market
(advanced biofuels less
than 0.1%).
Rising US policy mandates for
advanced/cellulosic biofuels, continually high oil
prices.
Negligible growth in production of
corn/sugar ethanol, but substantial
growth in production of advanced/
cellulosic biofuels as 12+ demonstration
projects come online. $1-2bn of biofuel-
related IPOs in the pipeline for 2012.
Agriculture $100bn+ US net farm
income in 2011 was all-
time high.
Rising demand for grain and protein due to
growing populations and rising incomes across
Asia and LatAM.
High grain prices (e.g. corn ~$6.00/bu)
mean profits for farmers and
seed/fertilizer companies but squeezed
margins for protein producers.
Water $500bn global market
growing at 4-6% CAGR
(with BRICs as chief
demand drivers).
Regional supply-demand imbalances that spur
new investment in water treatment/efficiency
solutions; budget crunches that spur
privatization of water infrastructure.
Promising opportunities in desalination,
wastewater treatment, and water
efficiency solutions (e.g. leak detection).
Infrastructure investors must balance
attractive returns but also significant
political risks.
Source: DBCCA analysis, 2012

Climate Change Investment Markets Growth Outlook: Cleaner Energy
66 Investing in Climate Change 2012
Cleaner Energy Solar PV
Propelled by a 50% decrease in the price of solar PV modules, global new solar PV installations grew from 18.2 GW in 2010 to 27 GW in 2011. In its annual “Clean Energy Trends” report, Clean Edge Research calculates that this growth in physical volumes increased the global market for solar PV products (including modules, system components, and installation) from $71.2 billion in 2010 to $91.6 billion in 2011.59
Projections on physical volumes for 2012 center in the range of 25-29 GW – representing modest growth over 2011 installations. Due to falling module prices, however, the dollar size of the solar PV market may shrink even as physical volumes grow.
Figure 53: Annual Global New Additions of Solar PV Generating Capacity (GW), 2005-2013E
Source: BNEF, Goldman Sachs, Citi, Morgan Stanley, Barclays, Credit Agricole, DBCCA analysis, 2012.
A key solar theme for 2012-13 is reduction of incentives in Europe, and a consequent shift of demand away from Europe and toward the US and Asia. In 2011, Europe continued to be the strongest region for PV demand. In 2012, 90% of Europe’s 2011 PV market – Germany, Italy, Spain, and France – have announced or are preparing to announce substantially reduced solar subsidy programs. The two countries with the most generous FiTs (on an estimated Internal Rate of Return basis) – Italy and Spain – are at the center of the Eurozone crisis. Italy has already lowered 2012 FiTs for ground-mount systems and is in the process of devising caps on total expenditures on renewable energy incentives. Germany – where FiT payments are estimated at €7 billion per year – has, as of April 1 impose a cap on the quantity of ground-based PV systems eligible for FiT payments. These revisions will slow the pace of additions in some markets (e.g. Germany) and may eliminate new additions almost entirely in others (e.g. Spain).
59 Clean Edge Research, Clean Energy Trends 2012, March 2012
25
28
21
19
23 23 25
1 2 3
7 8
18
27
25
28
-
5
10
15
20
25
30
2005 2006 2007 2008 2009 2010 2011 2012 2013
GW
BNEF
Credit Suisse
Goldman Sachs
Citi
Morgan Stanley
UBS

Climate Change Investment Markets Growth Outlook: Cleaner Energy
67 Investing in Climate Change 2012
Switching to positive catalysts, however, CEOs of two leading Chinese solar manufacturers observed recently that they expect China to add between 4-5 GW of new PV capacity in 2012 (from between 2-3 GW this year). Recent evidence also suggests that – despite headwinds from low natural gas prices – the US market will continue to grow strongly; in the Nov 2011 California RPS auctions, solar PV projects secured virtually all new contracts from utilities. In Japan, a new FiT for solar PV will in July 2012 take effect at a rate of $0.50/kWh (40 yen/kWh). Given Japan’s post-Fukushima need for power, this could spur Japan’s PV demand to more than double to 2,400 MW. The conclusion from this is that China, Japan, and the US are likely to overtake Europe as drivers of incremental PV demand. Figure 54: New Installed Solar PV Capacity in Top 7 Countries, 2007-2012E (GW)
Note: 2012 estimates are from Credit Suisse, which has the most bullish forecast for 2012 Source: IEA, Credit Suisse, DBCCA analysis, 2012
Flagging demand in Europe amid an unprecedented expansion of production capacity in China has created a situation where 50% of module production capacity is idle. The global PV industry’s fundamental supply-demand imbalance will persist through 2012; estimated 2012 supply (36 GW) is 1.2-1.5X estimated 2012 demand. There is now underway a significant exit of production capacity at all stages of the solar value chain. While the logic of who exits (via bankruptcy or acquisition) will everywhere be the same – the most expensive $/W capacity first, with others in descending order to follow – the pattern of exit will likely vary by region and across different segments of the value chain. While technical expertise and incumbent economies of scale will help to protect enable polysilicon manufacturers in Europe and the US, cell and module manufacturing will continue to migrate to China and other Asian nations. As China’s global market share continues to increase, recent statements indicate that the government may support consolidating domestic production among a handful of firms.
7.4
20.5
27
28.8
0
5
10
15
20
25
30
35
2009 2010 2011 2012
GW
ROW
Japan
India
Italy
US
Spain
China
Germany

Climate Change Investment Markets Growth Outlook: Cleaner Energy
68 Investing in Climate Change 2012
Figure 55: Supply/Demand Balance in the Global PV Industry, 2009-2014E
Source: BNEF, BAML, Credit Suisse, DBCCA analysis, 2012.
Average selling prices (ASPs) under $1/W and wintry financing conditions may deter or delay the arrival of new PV technologies. Through 2015 crystalline silicon’s 80%+ share of the global module market appears likely to continue or increase.
Figure 56: Factory Gate Prices for c-Si PV Modules, 2009-2013E
Source: BAML, UBS, Goldman Sachs, DBCCA analysis, 2012
0.00
0.20
0.40
0.60
0.80
1.00
1.20
1.40
1.60
1.80
2.00
2006 2007 2008 2009 2010 2011 2012 2013 2014
Prod
uctio
n/De
man
d Ra
tio
BNEF - conservative
BNEF - optimistic
BAML
Credit Suisse
$2.41
$2.09
$1.50
$0.94$0.86
$0.95$0.85
$0.00
$0.50
$1.00
$1.50
$2.00
$2.50
$3.00
2009 2010 2011 2012 2013
$/W
BAML
UBS
Goldman Sachs

Climate Change Investment Markets Growth Outlook: Cleaner Energy
69 Investing in Climate Change 2012
Figure 57: Gross Margins across the Solar Value Chain, 2012 Q1
Source: BNEF, DBCCA analysis, 2012.
The Figure below outlines a selection of views on where the solar PV market is headed over the next two to three years.
Figure 58: Views on Investment in the Solar PV Market
Broker/Forecaster Public Equities BNEF Companies will seek to recapitalize via secondary offerings.
DB Research Incentive reductions in Italy/Germany and weak pricing across the supply chain (due to excess supply of
polysilicon) keep valuation multiples under pressure in 1H12. Projects solar sector to enter “grid parity” era in 2H12
timeframe – significant impact on demand from grid parity markets, however, not to occur until 2013.
Goldman Sachs Current valuations reflect limited earnings visibility and policy headwinds; but analysts still see longer-term upside
to “competitively advantaged companies with strong balance sheets.” Awaits additional signs of consolidation and
influence of market forces (as opposed to government policies) before turning more constructive on the sector.
HSBC As of Mar 2012, forecasts 12-month forward P/E60
JPMorgan
of 15 and EPS growth of -67% (versus PE of 13.2 and EPS
growth of -19% for overall HSBC Climate Change Index).
So long as European subsidy schemes remain in flux and excess manufacturing capacity persists, recommends
avoiding US solar stocks.
Source: BNEF, DB Research, Goldman Sachs, HSBC, JPMorgan, DBCCA analysis 2012
60 Please see Appendix III (Glossary of Key Terms and Indices) for definitions of key concepts used in this table and throughout this paper
20%
-43%
-8%
7%9%
-52%
-22%
11%
-60%
-50%
-40%
-30%
-20%
-10%
0%
10%
20%
30%Polysilicon Ingot and Wafer Cell Module
Gro
ss M
argi
n
Chinese Producers
International Producers

Climate Change Investment Markets Growth Outlook: Cleaner Energy
70 Investing in Climate Change 2012
Wind Power
Over the past two years the annual growth rate for global new wind capacity additions has decelerated from ~40% (in 2008 and 2009) to single-digit levels; the 2012-15 period will see global wind capacity additions continue to grow at (or just above) single-digit rates. Having reached 41.6 GW globally in 2011, major forecasters are projecting 38-48 GW of new wind power installations in 2012. In 2011, the capital costs of new wind power installations totaled $71.5 billion, according to Clean Edge Research; by 2012 this amount is projected to rise to $116.3 billion.61
Figure 59: Annual Global New Additions of Wind Power Generating Capacity (GW), 2005-2015E
Source: BNEF, Goldman Sachs, UBS, GWEC, DBCCA analysis, 2012.
Last year China installed over 43% of the world’s new wind power capacity (17.6 GW out of a global total of 40.6 GW)62
– making 2011 the fourth consecutive year in which China has led the world in wind power installations. While China dominated overall installation numbers, however, other nations (chiefly the US, Brazil, and India) accounted for all of the year-on-year growth in new installations. With grid connectivity issues likely to moderate the pace of future construction in China, nations other than China are likely to continue to drive incremental growth of wind power installations in 2012 and 2013. Continuation of China’s massive build-out coupled with strong wind development in India and Brazil will shift the global wind market (particularly for onshore applications) away from Europe and toward emerging economies.
Throughout much of Europe, wind power developers confront a perfect storm of: (i) low to zero power demand growth and associated low wholesale power prices; (ii) looming downward revisions to feed-in tariffs and other government subsidies (a result of action to correct fiscal imbalances): and (iii) increased debt costs and reduced access to financing (a result of higher credit spreads for sovereign debt and stricter capital requirements on bank balance sheets). This confluence of negative
61 Clean Edge Research, Clean Energy Trends 2012, March 2012 62 Global Wind Energy Council 2012
12
15
19
27
39
54
47 4649 49
38 37 38 3941
43
43
48 49
52
56
44
53
57
63
0
10
20
30
40
50
60
70
2005 2006 2007 2008 2009 2010 2011 2012 2013 2014 2015
GW
BNEF
Goldman Sachs
UBS
GWEC
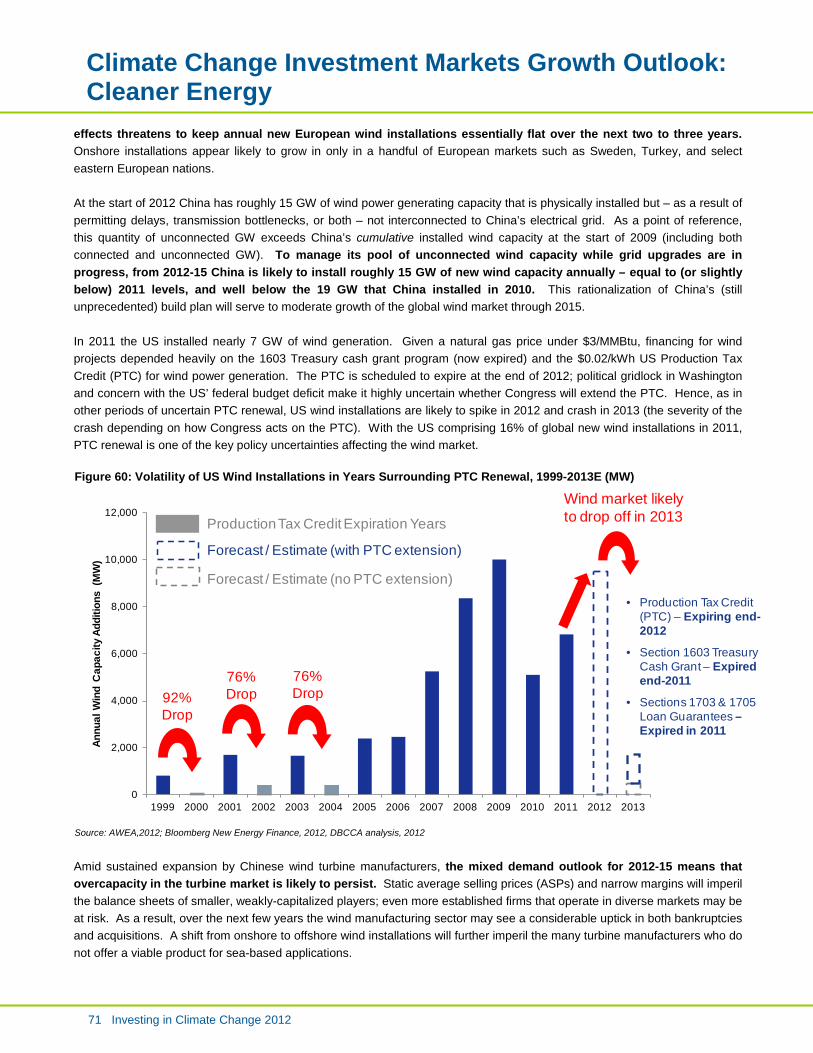
Climate Change Investment Markets Growth Outlook: Cleaner Energy
71 Investing in Climate Change 2012
effects threatens to keep annual new European wind installations essentially flat over the next two to three years. Onshore installations appear likely to grow in only in a handful of European markets such as Sweden, Turkey, and select eastern European nations.
At the start of 2012 China has roughly 15 GW of wind power generating capacity that is physically installed but – as a result of permitting delays, transmission bottlenecks, or both – not interconnected to China’s electrical grid. As a point of reference, this quantity of unconnected GW exceeds China’s cumulative installed wind capacity at the start of 2009 (including both connected and unconnected GW). To manage its pool of unconnected wind capacity while grid upgrades are in progress, from 2012-15 China is likely to install roughly 15 GW of new wind capacity annually – equal to (or slightly below) 2011 levels, and well below the 19 GW that China installed in 2010. This rationalization of China’s (still unprecedented) build plan will serve to moderate growth of the global wind market through 2015.
In 2011 the US installed nearly 7 GW of wind generation. Given a natural gas price under $3/MMBtu, financing for wind projects depended heavily on the 1603 Treasury cash grant program (now expired) and the $0.02/kWh US Production Tax Credit (PTC) for wind power generation. The PTC is scheduled to expire at the end of 2012; political gridlock in Washington and concern with the US’ federal budget deficit make it highly uncertain whether Congress will extend the PTC. Hence, as in other periods of uncertain PTC renewal, US wind installations are likely to spike in 2012 and crash in 2013 (the severity of the crash depending on how Congress acts on the PTC). With the US comprising 16% of global new wind installations in 2011, PTC renewal is one of the key policy uncertainties affecting the wind market. Figure 60: Volatility of US Wind Installations in Years Surrounding PTC Renewal, 1999-2013E (MW)
Source: AWEA,2012; Bloomberg New Energy Finance, 2012, DBCCA analysis, 2012
Amid sustained expansion by Chinese wind turbine manufacturers, the mixed demand outlook for 2012-15 means that overcapacity in the turbine market is likely to persist. Static average selling prices (ASPs) and narrow margins will imperil the balance sheets of smaller, weakly-capitalized players; even more established firms that operate in diverse markets may be at risk. As a result, over the next few years the wind manufacturing sector may see a considerable uptick in both bankruptcies and acquisitions. A shift from onshore to offshore wind installations will further imperil the many turbine manufacturers who do not offer a viable product for sea-based applications.
0
2,000
4,000
6,000
8,000
10,000
12,000
1999 2000 2001 2002 2003 2004 2005 2006 2007 2008 2009 2010 2011 2012 2013
Annu
al W
ind
Cap
acity
Add
ition
s (M
W)
92% Drop
76% Drop
76% Drop
Production Tax Credit Expiration Years
• Production Tax Credit (PTC) – Expiring end-2012
• Section 1603 Treasury Cash Grant – Expired end-2011
• Sections 1703 & 1705 Loan Guarantees –Expired in 2011
Wind market likely to drop off in 2013
Forecast / Estimate (with PTC extension)
Forecast / Estimate (no PTC extension)

Climate Change Investment Markets Growth Outlook: Cleaner Energy
72 Investing in Climate Change 2012
Figure 61: Global Discounted Wind Turbine Capacity Forecast 2009-15E (GW)
Note: Effective supply models the actual amount of turbines available after discounts to nominal manufacturing capacity. These include phasing out of old capacity, cuts to production made by OEMs and possible consolidation within the industry. Source: Bloomberg New Energy Finance, 2012.
Finally, on the heels of a year when only 1 GW of new offshore wind capacity came online, the years 2012-2015 will see aggressive government targets begin to scale offshore wind development. The UK’s target for 33 GW of new offshore wind capacity by 2020 implies a build rate in excess of 3 GW per year; Europe and China plan to deploy offshore wind capacity at similarly ambitious rates through 2020 (with China informally targeting 5 GW of offshore wind by 2015).
Figure 62: Global Offshore Wind Installations by Region, 2010–15E
Note: Projects expected to take a minimum of 24 months for completion from the start of onshore construction. Projects greater than 450MW have been phased into annual installations of 350MW
20.726.4 29.6 29.7 29.8 30.3 29.6
7.3
9.610.5 13.3 13.0 12.0 12.0
3.5
9.79.8
12.0 14.4 15.8 16.6
6.1
13.1
19.1
21.9 20.1 18.7 18.5
2.3
3.5
4.4
4.3 4.1 3.4 2.1
2009 2010 2011 2012e 2013e 2014e 2015e
China Tier 3China Tier 2China Tier 1Global Tier 2Global Tier 1Demand
39.9
62.2
73.4
81.1 81.4 80.2 78.8
1.3
0.4
3.8 3.6
8.48.6
1.3
0.4
2.12.5
4.4
5.8
0.0
1.0
2.0
3.0
4.0
5.0
6.0
7.0
8.0
9.0
10.0
2010 2011E 2012E 2013E 2014E 2015E
GW
Goldman Sachs
BNEF

Climate Change Investment Markets Growth Outlook: Cleaner Energy
73 Investing in Climate Change 2012
Source: Bloomberg New Energy Finance, Goldman Sachs, DBCCA analysis 2012. The Figure below outlines a selection of views on where the wind power market is headed over the next two to three years.
Figure 63: Views on Investment in the Wind Power Market
Broker/Forecaster Public Equities Infrastructure Bernstein Research Industry structure remains poor and in need of consolidation.
Key downside risks include overcapacity, weak European
financing, US policy uncertainty, and managerial changes.
Bank de-leveraging due to Basel III capital
requirements – particularly in France and Europe
– will squeeze project loans to wind projects.
BNEF Expecting “casualties among turbine manufacturers”,
particularly those without a viable product for offshore
installations. Remaining companies will seek to recapitalize
via secondary offerings.
Low probability for reappearance of dedicated
publicly-listed vehicles to invest in wind projects.
Goldman Sachs Financing risk and Euro-zone concerns reasons to be neutral
on the wind industry in the near-term; favor wind farm
developers with defensive and stable earnings.
HSBC As of Mar 2012, forecasts 12-month forward P/E of 11.4 and
EPS growth of -31% (versus PE of 13.2 and EPS growth of -
19% for overall HSBC Climate Change Index).
UBS Avoid any investment in a pure-play wind turbine producer, as
consensus EPS estimates are 20-40% too high.
Source: BNEF, Bernstein Research, DB Research, Goldman Sachs, HSBC, UBS, DBCCA analysis 2012

Climate Change Investment Markets Growth Outlook: Cleaner Energy
74 Investing in Climate Change 2012
Natural Gas
Figure 64: Views on the Natural Gas Market – Spotlight on the US
Broker/Forecaster Outlook on Supply-Demand (S/D) Balance Outlook on Prices Goldman Sachs US market likely to stay in over-supply through 2012 as production from
shale wells continues to exceed demand response; supply-demand
balance tightens in 2013+ as production growth decelerates and new
sources of demand (e.g. from coal plant retirements) continue to come
online.
Henry Hub gas prices of $3.10-
$4.25/MMBtu in 2012/13, with a
$5.50/MMBtu mid-range estimate for
2014 and beyond.
Morgan Stanley US gas market likely to remain in oversupply over the next 12-18 months
(at minimum); coupled with continued tightness in global LNG markets,
excess US supply increasing likelihood of LNG exports from North
America to Asia.
US gas prices likely to remain low,
European prices likely to remain high.
Citi In 2012 ~1.0 Bcf/d decrease in US onshore natural gas production and
increase in gas demand. Key supply-side story is shift in gas production
from “dry” gas plays (e.g. Haynesville and Barnett) to liquid-rich “wet” gas
plays; key demand-side story continues to be coal-to-gas switch. To
clear market, coal-to-gas switch must rise from ~3.5 Bcf/d in 2011 to ~5.2
Bcf/d in 2012.
“Normalizing” for variations in
weather, US gas price remains
$4.50/MMBtu; actual forecast of
$2.40/MMBtu in 2012, $3.85/MMBtu
in 2013, and $4.45/MMBtu in 2014.
Bernstein Research At current forward gas prices US utilities can economically increase gas-
fired generation by 450 million MWh in 2012; corresponding 3.3 Tcf/y
growth in utility demand for natural gas would equal 13.5% of total US
gas consumption in 2011.
Utility coal-to-gas switching sufficient
to drive US gas prices toward
$3.90/MMBtu equilibrium beginning in
2013.
PFC Energy –
Guggenheim
Estimates that by 2013, seven of the nine largest US shale plays –
comprising 76% of the total estimated US potential shale resource – will
be in the ‘Standardization’ phase of production. Drive for volumes will
push the number of wells drilled in existing basins (versus new basins)
from 50% currently to 90% in 2016.
BP US likely to permit 2-6 LNG terminals to export on the order of ~6bcf/d
(2017-20) – 10% of current US gas production.
$4/MMBtu through 2014 and beyond
is threshold gas price for continued
coal-to-gas switching in the US.
Statoil Spread between oil-equivalent gas
price and the Henry hub spot price
needs to be at least $4/MMbtu for US
LNG exports to be economically
viable. Source: BP, Statoil, Goldman Sachs, Bernstein Research, Citi, Morgan Stanley, PFC Guggeheim, DBCCA analysis 2012
Since 2009 the dominant theme for the natural gas sector has been the dramatic increase in production from US shale basins. From a 2006 level of 0.6 million barrels of oil equivalent per day (mmboe/d), in 2011 US shale production rose to 3.2 mmboe/d last year and may increase by another 5.3 mmboe/d by 2016. The impacts of tapping into this vast new resource include: (i) a decrease in price of US natural gas, as the Henry Hub spot price has fallen from over $9.00/MMBtu in 2008 to less than $3.00/MMBtu today; (ii) new sources of US demand for natural gas, as gas displaces coal as the fuel of choice for power generation and enables (for the first time in decades) substantial investment by the petrochemicals industry in new US capacity; and (iii) a reversal of America’s role in the growing international gas trade, from growing importer to potentially large exporter.

Climate Change Investment Markets Growth Outlook: Cleaner Energy
75 Investing in Climate Change 2012
Figure 65: Henry Hub Spot Price of Natural Gas, 1995-2015E
Note: Values are in nominal dollars. Source: BP, Citi, Bloomberg, EIA, BNEF, DBCCA analysis 2012
2012-13 will witness a shift to the next phase of the shale gas transformation. On the supply-side, two key themes are the shift from initial production to resource exploitation and a shift from dry gas to wet gas. The largest US basins are now moving from a period of initial production/optimization to a period of sustained resource exploitation. This shift will serve to both increase output and change shale basins from dramatic new discoveries to stable, long-term sources of supply. The second key supply-side theme is a shift in production from dry gas plays (e.g. the Barnett and the Haynesville) to wet gas play. Gas is classified as either “dry” or wet” depending on its liquid petroleum content (dry gas is 90%+ gas, whereas wet gas – or associated gas – is 50%-90% gas – with the remainder being liquid petroleum). In North America, the spread between oil prices and gas prices – currently over 20-1 – is giving E&P companies a strong incentive to drill for liquids as opposed to gas. Whereas as recently as 2009 “oily” wells (wells with over 50% liquids) accounted for less than one-fifth of all new wells drilled, in 2012 oily wells are likely to account for over one-half of new wells drilled. The result is likely to be a surge in production of wet gas relative to dry gas.
$0
$1
$2
$3
$4
$5
$6
$7
$8
$9
$10
1995 1996 1997 1998 1999 2000 2001 2002 2003 2004 2005 2006 2007 2008 2009 2010 2011 2012E2013E2014E2015E
$/M
MB
tu
EIA
BNEF
Street Consensus

Climate Change Investment Markets Growth Outlook: Cleaner Energy
76 Investing in Climate Change 2012
Figure 66: US Shale Lifecycle and Key Basin Maturity
Source: PFC Guggenheim On the demand-side, in the US the key driver remains the power sector coal-to-gas switch, which accounted for ~3.5 bcf/d of demand in 2011. Combined with the capital costs of new gas-fired power plants being 30-50% lower than new coal-fired plants, the prospect of structurally lower and more stable gas prices means gas is likely to continue to displace coal in the years ahead. The rate and magnitude of the switch, however, will depend to some extent on how forthcoming environmental regulations affect the schedule of coal plant retirements (i.e. whether the US Court of Appeals upholds the Environmental Protection Agency’s Cross-State Air Pollution Rule, which was challenged in court in April 2012).
Figure 67: Fully Delivered Coal versus Gas Spread, Feb 2005 – May 2011 ($/MWh)
Source: Bloomberg LP, DBCCA analysis, 2012 *Note: Data adjusted to take into account the relative thermal efficiencies of gas and coal-fired generators.
0
20
40
60
80
100
120
Jan-05
Jun-05
Nov-05
Apr-06
Sep-06
Feb -07
Jul-07
Dec-07
May-08
Oct-08
Mar-09
Aug-09
Jan-10
Jun-10
Nov-10
Apr-11
Sep-11
Feb-12
Jul-12
Dec-12
$/M
Wh
NYMEX gas
NYMEX delivered coal

Climate Change Investment Markets Growth Outlook: Cleaner Energy
77 Investing in Climate Change 2012
Outside the US, the principal demand story involves the continuance of strong LNG demand from Asia, especially China, India, and Japan. In 2010, 11% of the world’s gas was transported via LNG; as Asian demand for gas continues to increase over this decade, the role of LNG in the global gas market is likely to increase and new sources of LNG exports are likely to come online. Globally, there are currently 18 new onshore LNG projects in the pre-Final Investment Decision (FID) phase; if built, these projects would increase the number of onshore LNG terminals in the world by nearly 50%. One frequently discussed candidate to become an LNG exporter is the US; current price spreads between US gas and Japanese LNG imports are widely estimated to make US LNG exports to Asia economically competitive. While the US government has so far permitted only one LNG export terminal, all of the announced US LNG export projects awaiting approvals add up to ~12bcf/d – or roughly 20% of current US natural gas production. The progress of LNG projects in the US (and Canada) will be a key medium-term story for global gas markets in years ahead. Focusing chiefly on the US, the Figure below outlines a selection of views on investment opportunities in natural gas markets. Figure 68: Views on Investment in the Natural Gas Market
Broker/Forecaster Public Equities Infrastructure Bernstein Research Coal-to-gas switch creates an opportunity for generators with low-
capacity factor gas-fired fleets to significantly increase their output
in 2012. For E&P investors with time horizons exceeding one year,
potentially opportunity time to play the gas theme.
DB Research Bullish on gas-related infrastructure
spending; gas is a secular shift to a
cheaper product which offers rapid
paybacks on infrastructure investment and
durable operating cost savings from a
switch.
HSBC As of Mar 2012, forecasts 12-month forward P/E of 16.7 and EPS
growth of 6% (versus PE of 13.2 and EPS growth of -19% for
overall HSBC Climate Change Index).
Morgan Stanley Bullish outlook for global gas markets a positive for integrated
players (specifically in Europe) poised to benefit from growth of
LNG market and arbitrage opportunities arising from international
price discrepancies.
Goldman Sachs In US, period of continued production growth amid lower prices
favors natural gas consumers (e.g. petrochemical names) and
midstream/service stocks that benefit from infrastructure build-out.
More optimistic view on gas-focused E&Ps awaits 2014 uptick in
long-term demand from coal plant retirements, LNG exports, and/or
CNG vehicles.
PFC Energy –
Guggenheim
Transition of US shale plays from Optimization to Standardization
advantages larger companies that can enhance value through field-
level execution, scale, diversity and lower capital costs – skills that
are distinct from simply holding the best acreage.
Source: Goldman Sachs, Bernstein Research, Morgan Stanley, PFC Guggeheim, DB Research, HSBC, DBCCA analysis 2012

Climate Change Investment Markets Growth Outlook: Energy Efficiency and Management
78 Investing in Climate Change 2012
Energy Efficiency and Management
Light Emitting Diodes (LEDs) Figure 69: Views on the LED market
Broker/Forecaster Volumes Prices/Margins Market Size ($) Jefferies From 2011-13 LED shipments
will grow at a CAGR of 27%;
key driver of 2012-13 demand
is adoption of LEDs for
commercial indoor lighting
applications.
Pricing declines – especially in the
medium (e.g. monitors, TVs) and low-
brightness (mobile phones) markets -
gives blended LED ASP a -19% CAGR
from 2011-13.
Overall LED market grows at a
moderate 2% CAGR from 2011-13
– reaches $14b by 2014.
Goldman Sachs General lighting is primary
near-term driver of incremental
growth for industry; longer-
term, unit volumes for LED
lighting will grow at 30%+
CAGR through 2020 (to
achieve 2020 penetration of
50%).
Forecasts better supply/demand balance
emerging in 2012-13. General lighting
applications will support higher LED
margins and ASPs than in other
applications (e.g. TVs or automobiles).
LED market grows from $11bn in
2011 to $20bn in 2015; by 2015
general lighting accounts for over
half of total LED sales. Growing
market divide between low-end,
product-driven consumer cycles
and the high-end, lighting market.
DB Research Weak fundamentals will persist
through 1H12 and improve in
2H12; positive catalyst is
stronger demand for general
lighting applications.
Downward pricing pressure in chip
segment will persist through 1H12 due to
weak fundamentals in the backlighting
segment and elevated inventory levels at
Chinese/Taiwanese suppliers. Pricing
conditions better in general lighting
segment.
Improving market conditions in
backlighting segment and volume
growth in general lighting will
improve fundamentals in 2H12.
Source: Jefferies, Goldman Sachs, DB Research, DBCCA analysis 2012
Market consensus is that – in both the near and medium-terms – demand for light-emitting diodes (LEDs) is likely to grow chiefly via increased sales into the $73 billion general lighting market. LEDs current “socket penetration into general lighting is less than 5%; as a result, in 2011 the general lighting (or “high brightness”) market accounted for less than one-quarter of total LED sales (with the rest coming from the “medium brightness” – monitors, TVs – and “low brightness” – cellular phones – markets). It is widely projected, however, that superior light quality and reduced operating costs relative to incandescent and compact-fluorescent bulbs will rapidly increase LEDs’ share of the general lighting market. Commercial and industrial customers are cited as the initial drivers of demand, with penetration of the cost-conscious residential bulb market being a longer-term play. While unit volumes into general lighting are projected to grow at a 50%+ CAGR, in 2012-13 the dollar size of the overall LED market is projected to grow only at a single-digit CAGR. Partly this reflects continued downward pricing pressure in the medium and low brightness markets; modest demand growth for medium/low brightness applications plus excess supply at Chinese and Taiwanese suppliers is projected to pull down both ASPs and margins. Analysts generally argue that in 2012+ a growing divide in the LED market will emerge between the faster-growing, higher-margin general lighting segment and the slower-growing, lower-margin monitor/TV/mobile phone segment.

Climate Change Investment Markets Growth Outlook: Energy Efficiency and Management
79 Investing in Climate Change 2012
Figure 70: Projected growth in LED revenue, 2012-14E
Source: Jefferies, Goldman Sachs Research estimates, DBCCA analysis, 2012.
Beyond growing market division, a second key trend in the LED market is increasing commoditization of the upstream chip/component segment. Market consensus is that increased competition and difficulty of technical differentiation is likely to compress margins and reduce earnings growth for companies that rely solely on upstream revenues. Hence, the market consensus is most bullish on LED companies with downstream channels – particularly to commercial/industrial customers in the general lighting market.
The Figure below outlines a selection of views on investment opportunities in LEDs.
Figure 71: Views on Investment in the LED market
Broker/Forecaster Public Equities Jefferies Cheaper LED chips and components will enable growing volumes and high margins for downstream lighting
companies. Prefers companies with commercial and industrial channels.
Goldman Sachs Most stock upside in names with differentiated technology that can seize market share in fast-growing general
lighting market.
DB Research Expect companies with downstream presence to benefit more than upstream companies and expect shares to
trend higher at some point in early Q2 in anticipation of a 2H12 rebound.
Source: Jefferies, Goldman Sachs, DB Research, DBCCA analysis 2012
$11.3
$13.7
$16.0
$17.8
$11.3
$12.5$13.0
$14.0
$0.0
$2.0
$4.0
$6.0
$8.0
$10.0
$12.0
$14.0
$16.0
$18.0
$20.0
2011 2012 2013 2014
LED
Rev
enue
($bn
)
Goldman Sachs
Jefferies

Climate Change Investment Markets Growth Outlook: Energy Efficiency and Management
80 Investing in Climate Change 2012
Industrial Energy Efficiency
Strong secular drivers (rising resource prices, stricter environmental regulations) and a diverse opportunity set underpin a generally bullish consensus on the theme of industrial energy efficiency (industrial EE). Broadly defined, industrial EE involves making industry more productive by reducing the energy and power consumption of processes and equipment (for example through automation, more sophisticated controls, or new patterns of heat transfer). This sector grew robustly from 2004-2011 (CAGR of >5%), chiefly owing to demand from the BRICs and other emerging economies. Analysts describe the near-term macro picture for Industrial EE as somewhat mixed. Sluggish growth of global GDP and tightening of government budgets threatens to diminish opportunities, particularly in areas such as public infrastructure; at the same time, new opportunities are emerging in capital-intensive areas such as the managing of shale gas reservoirs and construction of LNG terminals. One particularly promising area may involve providing energy-efficiency solutions to data centers. Already estimated to consume ~2% of global electricity, the cumulative power consumption of data centers is projected to continue doubling every five years. Industrial EE technologies, however (such as advanced heat exchangers), can reduce the energy consumption of a typical data center by 20-50%, generating significant reductions in operating costs. As a result, analysts project Industrial EE applications for data centers to be a $40 billion market by 2015. Figure 72: Sector Margins for Industrial EE Plays at Record Levels, 1990-2012E (may be difficult to increase further)
Source: BAML, 2012.
Consensus is similarly divided on the earnings outlook for those in the industrial EE space. Some argue that with average margins in 2011 already at a record level (>12%), margin compression is inevitable – particularly if weak macro fundamentals are slowing growth of the overall market. Others, however, estimate the industrial EE space to offer the highest potential EPS growth of any climate-related sector.

Climate Change Investment Markets Growth Outlook: Energy Efficiency and Management
81 Investing in Climate Change 2012
The Figure below summarizes several analysts’ outlook for public equities in the industrial EE space.
Figure 73: Views on Investment in Industrial EE
Broker/Forecaster Public Equities
BAML Sector earnings growth likely to be lower than in 2004-2011; best exposure to theme is via structural opportunities
in shale gas, food/beverage and pharma capex, LNG, transmission, and aerospace.
HSBC Preferred sub-sector within entire HSBC climate universe, given 12-month forward PE of 12.2 and EPS growth of
12% (versus PE of 13.2 and EPS growth of -19% for overall HSBC Climate Change Index). Rising oil prices
provide additional positive catalyst.
Barclays Fundamental trends remain positive; EE segment offers most promising stock ideas within entire clean-tech
universe.
Source: BAML, HSBC, Barclays, DBCCA analysis 2012
Smart Grid
Figure 74: Views on the Smart Grid Market
Broker/Forecaster Outlook on Volumes Outlook on Revenues BNEF Strongest driver of growth will be Asia-Pacific region, particularly Thailand, Taiwan,
South Korea, and Japan.
Credit Suisse Next 12 months will see smart metering transition from a North American-centric
industry to a global market. Key drivers include EU smart metering mandate (80%
by 2020) and forthcoming legislation in Brazil. In advance of actual deployments,
2012 and early 2013 will witness heavy outpouring of partnership/award
announcements.
Projects non-US smart
meter market to grow from
$0.5 bn in 2012 to $3.9 bn
in 2016.
DB Research Continued weakness in North American market creates uncertainty in 2012; next
wave of smart grid spending will begin in 2013. Majority of activity will be in UK,
France, and Spain; also optimistic about near/medium-term growth in Brazil and
China.
Pike Research Expiration of US stimulus funds will reduce N. American smart meter shipments from
12.4MM units in 2011 to 7.2MM units in 2013.
Jefferies Europe will drive next large wave of AMI deployments (e.g. UK, France, Spain,
Finland, etc.); China and Japan will also create strong Asian demand.
Source: BNEF, Credit Suisse, DB Research, Jefferies, DBCCA analysis 2012
In 2012-13, the key story for the smart grid industry is expansion into markets outside North America. US investor-owned utilities – backed in part by funds from the 2009 American Recovery and Reinvestment Act – have largely driven the smart grid market over the past few years. Of the 200 million smart meters deployed worldwide, one-fifth of them have been deployed in North America; the last phase of US stimulus funding drove North American smart meter shipments to a record

Climate Change Investment Markets Growth Outlook: Energy Efficiency and Management
82 Investing in Climate Change 2012
12.4 million units in 2011 – bringing the overall smart meter penetration in North America to 35%.63
As this market reaches saturation and stimulus funding evaporates, however, the hot-bed of smart grid deployment is projected to shift to Europe and Asia.
Figure 75: Projected Growth of Non-US Smart Grid Market, 2012-2016E
Source: Credit Suisse estimates, DBCCA analysis
In Europe, the key driver for smart grid deployment is the EU’s mandate for 80% smart metering by 2022 – and December 2012 deadline for all countries to present a business case for smart metering. Though secular developments such as electric vehicle adoption (and resulting stress on electrical grids) create added opportunity for smart grid solutions, in the near-term it is the EU’s mandate that is expected to weigh on utility deployment decisions. While many European utilities may announce awards in the second half of 2012, substantial spending is not expected to begin until 2013. Within Europe, three countries that collectively account for roughly 80 million endpoints – Spain, the UK, and France – are expected to account for the majority of near-term smart grid activity. Outside of Europe, key areas for smart grid growth include China (which has massive infrastructure needs), Japan (which, in the wake of the Fukushima disaster, is seeking ways to make its electrical grid more robust and resilient), and Brazil (which has passed a mandate to replace 68 million meters). Other potential hot-spots include Thailand, Taiwan, and South Korea.
63 Pike Research, Smart Grid: Ten Trends to Watch in 2012 and Beyond, March 22 2012
$0.5
$1.1
$2.3
$3.3
$3.9
0
0.5
1
1.5
2
2.5
3
3.5
4
4.5
2012 2013 2014 2015 2016
$bn

Climate Change Investment Markets Growth Outlook: Energy Efficiency and Management
83 Investing in Climate Change 2012
Figure 76: European Smart Grid Deployments Expected to Start 2H12, but Begin Large Volumes in 2013
Source: DB Research, 2012.
In the public equities markets, analysts view the near-term outlook for smart grid shares as largely depending on how much weight investors will attach to the earnings growth potential associated with increased deployment volumes in 2013. Analysts also emphasize that – as a result of growing “commoditization” of smart grid hardware (e.g. electric meters) – smart grid companies involves in providing software solutions and analyzing data (rather than merely selling hardware) may see the most favorable margins.
Figure 77: Views on Investment in the Smart Grid Market
Broker/Forecaster Public Equities DB Research While investors are currently focused on a bleak 2012, valuation multiples will improve as investors begin to
recognize earnings growth opportunities in 2013.
Credit Suisse 2012 likely to see volatile share prices and significant M&A activity. Given competitive pressures on base electric
meter vendors, recommends companies active in the higher-margin parts of the smart grid ecosystem (data,
analytics and networking).
Jefferies Prefers companies exposed to end markets in distribution automation, home energy management, demand
response, and Europe/Asia.
BNEF Expects to see IPO activity in smart-grid sector.
Source: BNEF, Credit Suisse, DB Research, Jefferies, DBCCA analysis 2012

Climate Change Investment Markets Growth Outlook: Energy Efficiency and Management
84 Investing in Climate Change 2012
Energy Storage
Figure 78: Views on the Energy Storage Market
Broker/Forecaster Outlook on Volumes Outlook on Prices BNEF Expects increasing number of renewable energy
projects to integrate battery storage; positive catalyst
is reduction in the price of Li-ion batteries.
Excess supply of Lithium-ion (L-ion) batteries for
EV market has knock-on effect of reducing price
of batteries for grid applications.
Jefferies Expects deployment of grid-scale storage to increase
in 2012.
Source: BNEF, Jefferies, DBCCA analysis 2012
2011 saw more new grid-scale storage projects come online than in any previous year. Markets seeing new storage installations ranged from Hawaii and Texas to Chile and China. In 2012-13, the key opportunities and challenges for energy storage will remain largely the same as in 2011. The key opportunities arise chiefly from integration of variable-output renewable energy technologies such as wind and solar generators into electrical grids. Such integration creates opportunities for storage technologies to: (i) help manage short-term (e.g. seconds to minutes) deviations between the supply and demand for power; and (ii) exploit differentials in prices between peak and off-peak periods, which can widen due to increasing generation from renewable resources (e.g. wind) during off-peak periods. The chief challenge for storage technologies remains cost. In seeking to fund breakthrough energy storage technologies, the US Department of Energy targets a full system capital cost - including capital costs of the energy storage system, power conversion system, and balance-of-plant – of $100/kWh. Conversely, the technology of choice for recent storage installations – Lithium-ion (L-ion) batteries – have a full system capital cost above $1,000/kWh. This cost point constrains the range of markets and applications in which Li-ion batteries can be profitably deployed. In the near-term, the key positive catalyst for the energy storage space is expected to be a significant reduction in the cost of Li-ion batteries. Excess production capacity for Li-ion batteries – a result of manufacturing scale-up overshooting current demand for electric vehicles – is likely to have a knock-on effect of reducing the cost of Li-ion batteries for storage applications to the $600-$800/kWh range in the next few years. This reduction is likely to spur incremental growth of storage applications. Due to the high (e.g. 30%) balance-of-plant costs for energy storage systems, however, this reduction in battery costs will be less of a positive catalyst for storage applications than it will be for electric vehicle applications. Other positive catalysts involve recent regulatory changes in the US market – including, most prominently, FERC Order 755 – that increase compensation for fast-responding storage technologies. This regulatory tailwind is expected to enhance storage deployment in 2012-13. Longer term, the energy storage space still awaits breakthroughs to dramatically lower the capital costs of energy storage technologies. Analysts note that – unlike the micro-processor industry – batteries for energy storage have yet to demonstrate a “Moore’s Law” correlation between increased production levels and reduced costs.64
The energy storage space thus remains ripe for investment in early-stage technologies – whether batteries or something else – with the potential to store energy at dramatically lower cost points.
64 Explain Moore’s law

Climate Change Investment Markets Growth Outlook: Energy Efficiency and Management
85 Investing in Climate Change 2012
Figure 79: Views on Investment in the Energy Storage Market
Broker/Forecaster Public Equities VC/PE Jefferies Notes that as yet no “Moore’s Law” for energy
storage; despite production scale-up over last few
years cost/performance of batteries has improved
only modestly.
HSBC Energy storage sub-sector offers 12-month forward EPS
growth of 29% - highest in climate change universe
(compared with 2% for global equities generally and -19%
for overall HSBC Climate Change Index).
Source: Jefferies, HSBC, DBCCA analysis 2012

Climate Change Investment Markets Growth Outlook: Sustainable Transportation
86 Investing in Climate Change 2012
Sustainable Transportation
Electric Vehicles and Plug-in Hybrid Electric Vehicles
Figure 80: Views on the EV/PHEV Market
Broker/Forecaster “Payback” Unit Volumes Revenues
Jefferies Expect PHEV/EVs to penetrate 1% of
US market (~170k units) by 2016 and
3.1% (~500k+ units) by 2020. Tougher
fuel-emission standards and higher fuel
prices support faster adoption in
Europe.
By 2020 auto demand for Li-ion
batteries (including from hybrid
electric vehicles) reaches $35b
annually – nearly doubling the
size of the global battery industry.
.
Goldman Sachs With $5,000 in subsidies and
$100/bbl oil price, Return On
Investment (ROI) period65
Project PHEVs/EVs to reach a
combined 4.7 million units globally by
2020 (4% penetration). on EV
reaches 10 years by 2015 (without
subsidies, by 2020)
Expect PHEV/EV market for Li-
ion batteries to reach $9.6bn in
2013, $17.6bn in 2015, and
$37.5bn in 2020.
Lazard By 2015 calculates ROI period on
PHEV of 8.7 years in US and 5
years in EU.
PHEV/EV penetration in US, China,
Japan reaches 1.6% in 2015 and 3.6%
in 2020.
Expect PHEV/EV market for Li-
ion batteries to reach $4bn in
2013, $9bn in 2015, and $17bn in
2020.
Pike Research Reduction in fully-installed cost of
Li-ion batteries – from $600-
800/kWh currently to $523/kWh by
2017 – significantly shortens ROI
period on EV/PHEV investment.
EVs to achieve less than 1.4% global
market share by 2017. Asia (mostly
China) accounts for half of total
demand, with the Europe 25% and the
US 21%. respectively
Transport market for Li-ion
batteries (including hybrids) will
grow from $2.0 billion annually in
2011 to more than $14.6 billion
by 2017.
Source: Jefferies, Goldman Sachs, Lazard, Pike Research, DBCCA analysis 2012
The 70 million electric and plug-in hybrid electric vehicles (EVs and PHEVs) sold in 2011 marked the first year ever in which such cars have registered noticeable commercial volumes. While they remain a rounding error in the global automobile market, introduction of nearly a dozen new models will likely accelerate growth of EV/PHEV sales in 2012. Near-term demand for EV/PHEVs will continue to depend critically on government policy, in the form of both regulations (e.g. CAFÉ standards and EU carbon regulations) and direct subsidies (e.g. the $7,500 federal tax credit in the US).
65 Please see Appendix III (Glossary of Key Terms and Indices) for definitions of key concepts used in this table and throughout this paper

Climate Change Investment Markets Growth Outlook: Sustainable Transportation
87 Investing in Climate Change 2012
Figure 81: Projections for 2020 Penetration of EV+PHEV
Source: Global Insight, MarkLines, Company data, Electrification Coalition, PA Consulting, Goldman Sachs research estimates, 2011.
Broad commercial acceptance, however, will depend on whether EV/PHEV products can offer consumers a compelling return on investment (ROI) – ideally, without the need for subsidies. Recognizing differences in fuel costs and driving patterns, most analysts suggest that at current vehicle prices the (subsidized) payback period for PHEVs (in both the US and Europe) is 5-10 years – and, for EVs, exceeds 10 years. The recent experience of hybrid electric vehicles (HEVs) suggests that delivering payback periods shorter than 10 years will be key to increasing consumer demand for EVs/PHEVs.
Figure 82: Actual, Projected, and Target Costs of Li-ion Battery Packs for EVs
Source: DBCCA analysis, 2012
15.0%
14.0%
9.0%
8.0%
7.0%
6.0%
5.0%
5.0%
4.4%
4.0%
3.0%
3.0%
2.5%
0% 2% 4% 6% 8% 10% 12% 14% 16%
International Energy Agency
Roland Berger
Boston Consulting Group
McKinsey & Co.
Deutsche Bank
IHS Global Insight
Boston Consulting Group
CA Air Resources Board
Goldman Sachs - EV + PHEV
Lazard Capital Markets
NRDC-Planning Edge
Jefferies
Goldman Sachs - EV only
2020
Pen
etra
tion
of G
loba
l Aut
o M
arke
t
$1,370
$620
$523
$400 $360
$250
$0
$200
$400
$600
$800
$1,000
$1,200
$1,400
$1,600
2010 Goldman Sachs 2015 Pike Research 2017 BCG 2020 Goldman Sachs 2020 US Advanced Battery Consortium target
$/kW
h

Climate Change Investment Markets Growth Outlook: Sustainable Transportation
88 Investing in Climate Change 2012
How EV/PHEV economics will evolve depends mostly on how quickly Li-ion batteries (LiB) can descend the technology cost curve. The US Advanced Battery Consortium has estimated that catalyzing broad adoption of EVs (without subsidies) will require Li-ion battery packs to have a fully-installed cost of $250/kWh. Fully-installed costs of current battery packs, however, are currently in the range of $800-$1000/kWh. Closing that gap will producers of Li-ion batteries to dramatically reduce materials costs, optimize process efficiency, and heighten production yields. Most analysts expect scale-up of manufacturing capacity to enable these improvements and reduce the cost of Li-ion battery packs to ~$500/kWh by 2017 and ~$400/kWh by 2020.
Figure 83: LiB Market Opportunity in EV/PHEV
Source: LCM Research, Lazard Capital Markets, 2012.
$5.1
$9.7
$14.5
$17.7
$22.0
$25.5
$30.3
$34.3
$37.6
$1.6
$4.0
$6.2
$9.1
$11.6 $13.0
$14.4 $15.8
$17.1
$-
$5.0
$10.0
$15.0
$20.0
$25.0
$30.0
$35.0
$40.0
2012 2013 2014 2015 2016 2017 2018 2019 2020
Rev
enue
s ($
bn)
Goldman Sachs
Lazard

Climate Change Investment Markets Growth Outlook: Sustainable Transportation
89 Investing in Climate Change 2012
The Figure below outlines a selection of views on investment opportunities in EV/PHEVs.
Figure 84: Views on Investment in the EV/PHEV Market
Broker/Forecaster Public Equities VC/PE
Jefferies Oversupply in Li-ion battery industry advantages suppliers who
can rapidly increase yield/efficiency while reducing cost.
Debate over dominant lithium chemistry has
faded into background as current industry
players focus on achieving scale and
favorable pricing.
Goldman Sachs Preference of automakers for EVs over gasoline-hybrids is
positive catalyst for battery makers. Expects Korean and
Japanese battery companies to maintain their early capacity and
cost advantages.
Key trend is R&D on "game-changing" battery
technologies (e.g. non-lithium -based cell
chemistries) which could be commercialized
within 10 years.
Lazard Vehicle electrification "inflection point" positive catalyst for vehicle
supply chain, including suppliers for AGM (absorbent glass mat) /
Li ion batteries, control software & power train manufacturers.
Pike Research By mid-decade, Li-ion battery industry shrinks to four or five
suppliers who optimize performance/reliability/cost. China to
displace Japan as leading producer of Li-ion batteries.
By 2017 expects superior safety to make
lithium iron phosphate preferred battery
chemistry for transport applications.
Source: Jefferies, Goldman Sachs, Lazard, Pike Research, DBCCA analysis 2012
Natural Gas Vehicles With roughly 12 million natural gas vehicles (NGVs) on the road worldwide – running on either compressed natural gas (CNG) or liquefied natural gas (LNG) - NGVs comprise around 1% of total vehicles globally. Their share of the vehicle market varies dramatically by country, from over 60% in Pakistan to less than 0.1% of vehicles in the US. NGVs tend to be more heavily represented in commercial and trucking fleets than in passenger vehicles; for example, CNG vehicles represent 25% of US transit bus fleets, up from 1% in 1995. Key positive catalysts for deployment of NGVs include the desire to reduce emissions from transport and, most importantly, more compelling economics relative to alternative fuels. Based on retail prices in the US, natural gas has a cost advantage of more than $1.50/gal when compared with diesel; the resulting fuel-cost savings can enable payback periods on new vehicle purchases of 2-4 years - or even more quickly if tax credits and rebates are taken into account. The key challenge to deployment of NGVs remains the need for significant investment in a network of refueling stations; this hurdle will likely require the efforts of both government and natural gas producers to solve.

Climate Change Investment Markets Growth Outlook: Sustainable Transportation
90 Investing in Climate Change 2012
Figure 85: Views on Investment in the NGV Market
Broker/Forecaster Public Equities Infrastructure
Jefferies Involvement by OEMS and natural gas producers will
accelerate adoption of natural gas as a transportation fuel.
Investors should focus on vehicle manufacturers and
suppliers of proprietary enabling technologies.
Distribution infrastructure represents the main
bottleneck to NGV; bearish on investment in NGV
infrastructure, however, as shifting regulatory climate
risks commoditizing suppliers.
Macquarie Cheap CNG prices, low NGV premiums, existing refueling
infrastructure, low levels of vehicle ownership, and strong
economic outlooks make S. America and Asia brightest
markets for future NGV growth.
Source: Jefferies, Macquarie, DBCCA analysis 2012
Biofuels
The 34 billion gallon/yr market for biofuels (global production and wholesale pricing of ethanol and biodiesel) reached a record $83bn in 2011 (vs. $56.4bn in 2010).66
While still only 2% of the total $1.5 trillion transportation fuels market, 2011 marked a significant growth year for biofuels production. Nearly all of 2011 biofuel production took the form of so-called “first generation” ethanol, meaning ethanol produced from either corn (in the US) or sugarcane (in Brazil). Among the more surprising developments of 2011 was that – due to a small sugarcane harvest in Brazil, a surplus of corn in the US, and appreciation of the Brazilian real against the US dollar – Brazil became a net importer of US ethanol as a means to meet their 25% ethanol blending mandate.
Figure 86: Capacity and Number of Plants for Production of Corn Ethanol, 1999-2012E
Source: CIBC 2012
66 Clean Edge Research, Clean Energy Trends 2012, March 2012

Climate Change Investment Markets Growth Outlook: Sustainable Transportation
91 Investing in Climate Change 2012
In 2012 analysts project global production of first generation biofuels to be relatively flat or rise slightly. In the US, the chief positive catalyst is an increase in the Renewable Fuels Standard (RFS2) ethanol mandate from 12.6 billion gallons per year (bgy) in 2011 to 13.2 bgy in 2012. 2011 production levels, however, were already nearly sufficient to meet the 2012 mandate. Moreover, the positive impact of RFS2 is partly counteracted by expiration of the Volumetric Ethanol Excise Tax Credit (VEETC), which paid blenders $0.45 for every gallon of ethanol blended into the fuel supply. In Brazil, reduction of the ethanol blending mandate from 25% to 18% will likely reduce the portion of the country’s sugarcane crop devoted to ethanol production. Lower Brazilian production (in concert with a deprecating Brazilian real) are two reasons why analysts generally expect US net ethanol exports to Brazil to decline significantly in 2012.
While this year may be lacklustre for first-generation biofuels, analysts predict 2012 to be a defining year for so-called “second generation” biofuels (i.e. those made from cellulosic material or low-value waste products). Currently less than 0.1% of the $1.5 trillion transportation fuel market, in 2012 production capacity for advanced biofuels may more than double (to several hundred million gallons). By the end of 2012 around 20 significant demonstration-scale projects (using a variety of feedstock and processing technologies) will be online (with nearly a dozen more to come in 2013). As with first-generation biofuels, the key drivers of second-generation biofuels production are government mandates such as the US Renewable Fuels Standard (RFS2); RFS2 may grow US production of advanced biofuels to 5.5 billion gallons by 2015 and 21 billion gallons by 2022. Across the word, there are regulatory mandates for nearly 60 billion gallons of biofuels by 2022. Other key drivers include Asia’s rising demand for ethanol, pursuit of ethanol from non-food based sources, and high crop prices that diminish margins for producers of ethanol form corn or sugarcane. Analysts generally agree that the key obstacle to success for second-generation biofuels remains cost; the capital-intensity of production facilities - plus, in some cases, the difficulty of breaking down the crystal structure of cellulose - creates considerable risk for new biofuel ventures. The consensus is that that successful commercialization of new fuels is likely to require both economical production processes as well as engagement with external partners who can provide additional capital, access to end markets, or both. Production scale-up is also shifting discussion from process metrics such as yield to financial metrics such as opex/gallon and Return on Invested Capital (excluding subsidies).
In 2012 the public equity markets are likely to see much biofuel-related activity. Analysts note that the 80 or so publicly-traded biofuel-related companies will require billions in additional capital in order to execute current production plans. Moreover, public filings suggest that as many as 9 new biofuel-related companies aim to go public in 2012. Finally, observers of the current advanced biofuel industry note a fragmented set of companies each using a different feedstock and production process in an effort to create different products (both fuels and chemicals) that come from a barrel of oil. They note that – should any of the emerging technologies prove successful – strategic investors in the energy and chemicals industries may begin to aggregate different biofuel technologies into a product that can displace the “whole barrel” of oil.

Climate Change Investment Markets Growth Outlook: Sustainable Transportation
92 Investing in Climate Change 2012
Figure 87: Views on Investment in the Biofuels Market
Broker/Forecaster Public Equities VC/PE
Goldman Sachs
Key 2012 themes are competition for capital and
consolidation of complementary technologies.
Favors capital-efficient companies with partners
who can supply market access.
Industry dividing into two sub-categories: (1)
synthesis of cheap sugar sources (e.g. from
cellulosic biomass), and (2) conversion of
low or zero-cost feedstock such as municipal
waste.
DB Research Positive long-term view on 2nd-gen biofuels, but
first key data points will be results of
demonstration projects (due in 2013). In 2012
investors will analyze on construction milestones
and initial production economics.
Jefferies Capital flows will favor companies that: (i)
synthesize feedstock (e.g. sugar, syngas, or
CO2) from biomass, or (ii) commercialize
breakthroughs in process economics that upend
established markets.
Validation of new technologies will create
arbitrage opportunities between agricultural,
fuel, chemical, and waste management value
chains - and attract investment from strategic
players in fuel and chemical industries.
Citi "Risk of investor fatigue remains high" as up to 9
biofuel-related companies aiming to go public in
2012, implying $1-2bn in new issue capital (on
top of ~1.5bn in additional capital that current US
public companies require to execute current
ramp plans).
Potential for large multinational
refining/chemicals companies to eventually
aggregate successful biofuel technologies
into something that can replace the "whole
barrel" of oil.
HSBC Brazilian sugar ethanol is “climate smart” good
with $1bn export value in 2010; annual exports
projected to rise from 2bn liters in 2010-12 to
~7bn liters in 2020.
Source: Citi, DB Research, Jefferies, Goldman Sachs, HSBC, DBCCA analysis 2012
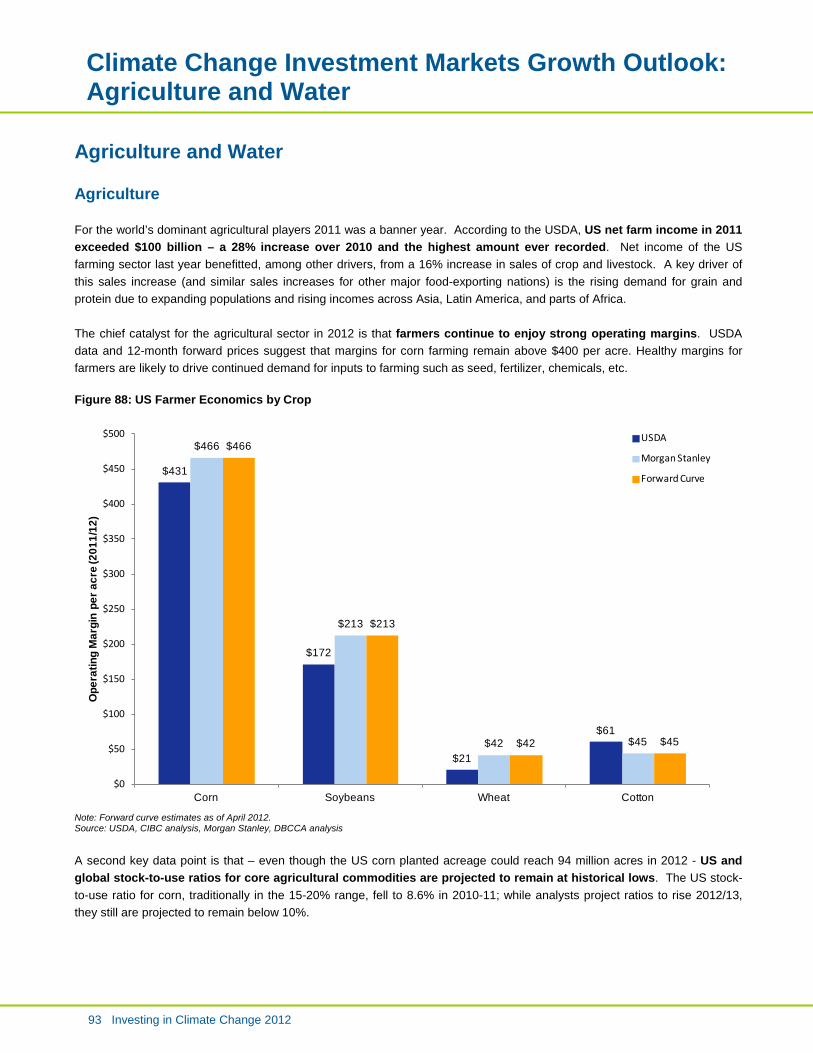
Climate Change Investment Markets Growth Outlook: Agriculture and Water
93 Investing in Climate Change 2012
Agriculture and Water
Agriculture For the world’s dominant agricultural players 2011 was a banner year. According to the USDA, US net farm income in 2011 exceeded $100 billion – a 28% increase over 2010 and the highest amount ever recorded. Net income of the US farming sector last year benefitted, among other drivers, from a 16% increase in sales of crop and livestock. A key driver of this sales increase (and similar sales increases for other major food-exporting nations) is the rising demand for grain and protein due to expanding populations and rising incomes across Asia, Latin America, and parts of Africa. The chief catalyst for the agricultural sector in 2012 is that farmers continue to enjoy strong operating margins. USDA data and 12-month forward prices suggest that margins for corn farming remain above $400 per acre. Healthy margins for farmers are likely to drive continued demand for inputs to farming such as seed, fertilizer, chemicals, etc. Figure 88: US Farmer Economics by Crop
Note: Forward curve estimates as of April 2012. Source: USDA, CIBC analysis, Morgan Stanley, DBCCA analysis
A second key data point is that – even though the US corn planted acreage could reach 94 million acres in 2012 - US and global stock-to-use ratios for core agricultural commodities are projected to remain at historical lows. The US stock-to-use ratio for corn, traditionally in the 15-20% range, fell to 8.6% in 2010-11; while analysts project ratios to rise 2012/13, they still are projected to remain below 10%.
$431
$172
$21
$61
$466
$213
$42 $45
$466
$213
$42 $45
$0
$50
$100
$150
$200
$250
$300
$350
$400
$450
$500
Corn Soybeans Wheat Cotton
Ope
ratin
g M
argi
n pe
r acr
e (2
011/
12)
USDA
Morgan Stanley
Forward Curve

Climate Change Investment Markets Growth Outlook: Agriculture and Water
94 Investing in Climate Change 2012
Figure 89: US Corn Stock-to-Use Ratio, 2009/10 – 2012/2013
Source: USDA, DBCCA analysis, 2012
With some notable exceptions (i.e. the 2008-2009 period), tight stocks traditionally have correlated with high grain prices and increased profits for the farming and fertilizer sectors. High grain prices, however, exhibit different impacts on different segments of the agricultural value chain. While a boon to farmers and (inasmuch as they signal strong end-use demand) and retailers, higher grain prices – by raising input costs for producers of agricultural livestock – can negatively affect protein producers, processors, and other midstream agricultural players.
Figure 90: Analysis of the Agricultural Value Chain
Source: DBCCA analysis 2012
13.1%
8.6%
6.7%
7.7%
13.1%
8.6%
4.6%
7.7%
0.0%
2.0%
4.0%
6.0%
8.0%
10.0%
12.0%
14.0%
2009/10 2010/11 2011/12 2012/13
US
Cor
n St
ock-
to-U
se R
atio
USDA
Morgan Stanley
Inputs Input Distributor
Agricultural Production
Primary Trade and Wholesale
Agricultural Processing
Retail & Distribution
Description
•Manufactured inputs/capital goods for agricultural production
•Wholesale supply of inputs to farms
•Production of crops and livestock
•Storage and wholesale trade of crops and livestock
•Preparation and processing for retail
•Storage, trade, wholesale and retail of final agricultural products
GDP Contribution as % of
Agricultural Total
30% 5% 15% 50%

Climate Change Investment Markets Growth Outlook: Agriculture and Water
95 Investing in Climate Change 2012
The Figure below compares a selection of views on the near-term outlook for the agricultural sector. Figure 91: Views on Investment in Agriculture
Broker/Forecaster Public Equities Citi Growth of biofuels market and high oil prices are positive catalysts for profitability in agricultural sector. Expects
focus on maximizing yields to benefit fertilizer and crop protection segments in 2012.
Credit Suisse Strong supply-side response to high prices creates risk to agricultural producers, particularly fertilizer companies.
More positive on palm-oil sector. Low intra-portfolio correlation within agricultural sector creates potential for wide
variance in performance across value chain.
Goldman Sachs High corn prices and strong fertilizer demand will benefit North American fertilizer manufacturers.
Source: Citi, Credit Suisse, Goldman Sachs, DBCCA analysis 2012
Water
Figure 92: Views on the Global Water Market
Source: BAML, Jefferies, Frost and Sullivan, DBCCA analysis 2012
Defined broadly, the water sector is a $500 billion global market that has been growing at a CAGR of up to 6%. Water and wastewater infrastructure offers attractive returns to investors – currently, the OECD estimates $4-$12 returns per $1 invested and UNEP estimates $3-$34 returns per $1 invested.67
For much of the last decade the water sector has also been a source of high returns for public equity investors- with the exception of 2010 and 2011 - the water sector outperformed the S&P 500 by ~11% per year since 2001.
Strong demand drivers appear likely to sustain water as an attractive near-term investment theme. Companies involved in providing, treating, and distributing freshwater are likely to benefit from demand for freshwater (growing at twice that of population growth) outstripping locally and regionally available supply. For example, BAML calculates that – on a global basis – the water sector needs efficiency gains of 1-5%-2.0% just to support projected population growth (and even greater efficiency gains to limit global demand growth to what the recharge rate of earth’s natural hydrological cycle can support). The need to use existing water resources as efficiently as possible is catalyzing investments in efficiency solutions across Asia, the Middle East, and Latin America. For example, throughout the rest of the decade China and
67 Jefferies, Clean Technology Primer, “Water Q&A: Secular Themes, Tactical Opportunities”, p. 297, February 21, 2012
Broker/Forecaster Outlook on Market Size
Citi Estimates global water sector to be a $450bn global market; expects “megatrends” of water quality, scarcity, and safety to underpin long-term, defensive 4-6% p.a. growth.
Jefferies Expects water sector to reach $500-$550bn in sales this year and to have global CAGR of 4-6% p.a. (2-3X higher in BRICs).
BAML Today water is a $500bn market with ~6% CAGR; by 2030-35 industry could be worth $800bn - $1tn (largest growth in Asia and S America).
Frost and Sullivan Europe’s smart water meter market will be worth US$20bn by 2020.

Climate Change Investment Markets Growth Outlook: Agriculture and Water
96 Investing in Climate Change 2012
Saudi Arabia will invest a combined $88.5 billion in water conservation and wastewater treatment projects. Within developed economies, Frost and Sullivan, the smart water meter market in Europe will be worth $20 billion by the 2020s. Within the infrastructure space, near-term reductions in government spending may lead to the privatization and consolidation of water assets. Privatization of assets may induce greater investment in efficiency technologies such as smart meters, new filtration technologies, etc – suggesting potentially new opportunities for PE/VC investors. That said, a key risk to investors in water infrastructure is political objection to raising prices for end-users (particularly for residential consumers); moreover, VC/PE investors who play the water space must contend with a slow investment cycle that tends to constrain deployment of new water technologies. These asset-class specific risks compound more generalized risks to water investment such as disjointed end markets and a paucity of “pure play” investments. The Figure below surveys views on how best to navigate the water sector in the years ahead. Figure 93: Views on Investment in the Global Water Market
Public Equities Infrastructure BNEF Over next 10 years China will invest $600bn in water
conservation infrastructure and $160bn in waste and sewage treatment. Expects China to announce record desalination deals in 2012.
Jefferies Prefers companies with exposure to desalination, metering, and infrastructure repairs. Attractive niche themes include “green” building designs, point-of-use drinking water, closed-loop wastewater management, and storm-water management.
BAML Favors companies with exposure to water treatment, water management (e.g. leak detection), and water infrastructure.
HSBC As of Mar 2012, forecasts 12-month forward PE of 12.8 and EPS growth of -3% (versus PE of 13.2 and EPS growth of -19% for overall HSBC Climate Change Index).
Source: BAML, BNEF, Jefferies, HSBC, DBCCA analysis 2012

Appendix I Risk and Returns for Climate Change Investors
97 Investing in Climate Change 2012
Appendix I: Risk and Returns for Climate Change Investors
The DBCCA view of forecasted risks and returns by asset class for climate change investors68
Source: Bloomberg, Cambridge Associates, CRB Research, UBS, MSCI ACWI, DBCCA analysis 2010. The study is conducted over the common timeframe of 2003-2009; however with inputs from indices that range back to 2001 for the climate change sectors, and 1990 for the equity and bond indices. For illustrative purposes only
Using Portfolio Choice69
, a program designed by Deutsche Asset Management, we calculated predicted annual returns and volatility for our benchmarks and Climate Change Indices.
Historical weighted average return of 19% was realized by climate change sectors giving an excess return from climate change sectors of 12%, relative to the MSCI ACWI. Predicted weighted average returns of 21% resulted in an excess predicted weighted average return of 12%.
Volatility for public market climate change sectors was similar, but slightly higher to that of the MSCI ACWI benchmark.
Private equity historically showed low volatility, but our view is that private equity will have a higher volatility going forward.
Volatility for the public infrastructure index is higher than we would expect for investments in private infrastructure funds.
68 Represents hypothetical performance. Hypothetical performance results have many inherent limitations, some of which are described below. No representation is being made that any account will or is likely to achieve profits or losses similar to those shown. In fact, there are frequently sharp differences between hypothetical performance results and the actual results subsequently achieved by any particular trading program. One of the limitations of hypothetical performance results is that they are generally prepared with the benefit of hindsight. In addition, hypothetical trading does not involve financial risk, and no hypothetical trading record can completely account for the impact of financial risk in actual trading. For example, the ability to withstand losses or adhere to a particular trading program in spite of trading losses are material pints which can also adversely affect actual trading results. There are numerous other factors related to the markets in general or to the implementation of any specific trading program which cannot be fully accounted for in the preparation of hypothetical performance results and all of which can adversely affect actual trading results. 69 Portfolio Choice Information, case studies, and examples cited in this presentation are for illustrative purposes only and are being provided solely as illustrations of the Portfolio Choice selection process and approach. Any quoted Portfolio Choice performance is an estimate that is relevant only to the specified time period and return assumptions, compared with portfolios based on historical extrapolation. The data does not reflect actual performance of any single Portfolio Choice portfolio, nor was a contemporaneous investment model run. Simulated performance results have inherent limitations. Unlike an actual performance record, simulated results do not represent actual trading and are subject to the fact that they are designed with the benefit of hindsight. Also, since the trades have not actually been made, the results may not reflect the impact that certain material economic and market factors might have had on an investment adviser's actual decision-making. Therefore, performance numbers are not necessarily indicative of the results you would obtain, and no representation is being made that these or similar results are guaranteed. Results are generally based on security selection, client investment restriction (if any), market economic conditions and other factors which would all influence portfolio returns. Further, investment in international markets can be affected by a host of factors, including political or social considerations, diplomatic relations, Limitations or removal of funds or assets or imposition of (or change in) exchange control or tax regulations in such markets. Investments in hedge funds are speculative and include a high degree of risk. Investors could lose their entire investment. Additionally, investments denominated in an alternative currency will be subject to changes in exchange rates that may have an adverse effect on the value, price or income of the investment. The value of investments and income arising therefrom can fall as well as rise, and no assurance can be given that the investment objectives will be met or that an investor will receive a return of all or part of his or her investment. Investments in alternative investments are speculative and include a high degree of risk. By adding investor views to the portfolio modeling and selection process, we are introducing an element of subjective judgment. The ultimate success of the portfolio’s performance will partly depend on the quality and accuracy of the views that we used in the selection process.
ASSET CLASSNumber of
PeriodsHistorical
Ann Return
Historical Ann
VolatilityPredicted
Ann Return
Predicted Ann
VolatilityStandard Portolio:MSCI ACWI 239 6.95% 15.67% 7.70% 15.73%Cambridge Private Equity 234 13.50% 10.61% 14.11% 30.29%UBS Infrastructure Index 47 9.29% 21.97% 16.43% 21.74%Citi World Big (Bonds) 131 6.24% 6.07% 6.51% 6.14%
Climate Change Sectors:S&P Global Water 96 10.36% 17.87% 12.47% 17.81%DAXglobal Agribusiness Index 98 23.85% 23.44% 25.46% 23.34%WilderHill New Energy Global Innovation Index 107 8.44% 28.56% 15.55% 28.45%CRB Research Energy Efficiency Index 83 25.87% 24.29% 23.60% 24.38%
Public Equity (MSCI ACWI), Private Equity (CAMBRIDGE PRIVATE EQUITY), Infrastructure (UBS INFRASTRUCTURE INDEX), Bonds (CITI WORLDBIG)

Appendix I Risk and Returns for Climate Change Investors
98 Investing in Climate Change 2012
Correlation matrix: Investing across asset classes can be used to diversify risk70
Source: Bloomberg, Cambridge Associates, CRB Research, UBS, MSCI, DBCCA analysis 2010
Climate change sectors are highly correlated to each other in public equity markets; while private equity shows moderate correlation and bonds have very low correlation to the equity markets. The modest correlation to private equity and infrastructure can have diversification benefit in portfolio construction. An important component of portfolio construction is asset class as well as sector diversification. There was modest
correlation between private equity and public equity (roughly 50%), yet very low and negative correlation to bonds.
We use the infrastructure index as representative of the asset class, but in order to determine a risk return profile we used a listed index. Therefore, the correlations to the listed market are fairly high. In our allocation model, we assume infrastructure investing will be done into infrastructure funds that show lower correlation to the equity markets.
The Climate Change sectors themselves, represented by listed equity indices, are all highly correlated.
Results for climate change sector allocations: We determined the probability of achieving our target return with overweighting to climate change
Source: DBCCA analysis, 2010. The study is conducted over the common timeframe of 2003-2009; however with inputs from indices that range back to 2001 for the climate change sectors, and 1990 for the equity and bond indices. For illustrative purposes only. Please note that simulated results have inherent limitations. The results do not represent results of actual trading using client assets, but were obtained by the retroactive application of constraint assumptions to model allocations as described herein. No representation is being made that any account will achieve profits or losses similar to those shown. These simulated results do not reflect the deduction of investment advisory fees. A client’s return will be reduced by advisory fees and any other expenses that may be incurred in the management of its investment advisory account. Past performance is not guarantee of future results.
70 Past performance is not a guarantee of future results
MSCI ACWI Cambridge PE UBS Infrastructure Citi World Big Water DXAG NEX CRB Energy
EfficiencyMSCI ACWI 1.00 Cambridge PE 0.49 1.00UBS Infrastructure 0.93 0.45 1.00Citi World Big 0.35 -0.07 0.39 1.00Water 0.95 0.51 0.90 0.29 1.00DXAG 0.80 0.50 0.73 0.35 0.76 1.00NEX 0.93 0.47 0.87 0.34 0.90 0.84 1.00CRB Energy Efficiency 0.93 0.47 0.84 0.25 0.91 0.73 0.90 1.00
Standard Portfolio without Climate
Change
Portfolio Using Historical Climate Change Returns
Portfolio Using Forecast Climate Change Returns
Target Portfolio Return: 6.00% 6.00% 6.00%Asset WeightsPublic Equity 36.97% 34.75% 34.75%Private Equity 3.50% 3.29% 3.29%Infrastructure 15.21% 14.30% 14.30%Bonds 44.32% 41.66% 41.66%
Climate Change Public Equity (1200 bps) - 3.00% -Climate Change Public Equity (500 bps) - - 3.00%
Climate Change Private Equity (1200 bps) - 1.00% -Climate Change Private Equity (500 bps) - - 1.00%
Climate Change Infrastructure (50 bps) - 2.00% 2.00%
Statistical Tests Probability of Outperforming Target Return 57.94% 59.58% 58.59%Simulated Mean Return 8.73% 9.39% 9.11%Simulated Volatility 10.76% 11.30% 11.30%
Public Equity (MSCI ACWI), Private Equity (CAMBRIDGE PRIVATE EQUITY), Infrastructure (UBS INFRASTRUCTURE INDEX), Bonds (CITI WORLDBIG)

Appendix I Risk and Returns for Climate Change Investors
99 Investing in Climate Change 2012
Results of strategic asset allocation review: We have now pulled together all the inputs that we have discussed so far.
We have identified a target return of 6%.
Using the results of the model, we can look at the probability of achieving this target with the addition of climate change.
The weights of the asset classes as discussed are adjusted to keep the asset classes in the same proportion.
We then look at the statistical analysis generated by the model using the weights, returns, volatility and correlations.
The probability of achieving the target return increases in the portfolio integrating climate change.
Based on an analysis using historical data, the excess return from public equity climate change is 12%. We have also provided a set of additional results where we assumed the excess return (going forward) from public equity climate change is a more conservative 5%. For private equity climate change, we have assumed the excess return matches that of public equity climate change, and for infrastructure, we add a very minor premium to climate change of 0.5%.
A portfolio incorporating climate change sectors offers a higher probability of achieving the target return
Standard Historical Forecast
Source: DBCCA analysis, 2010. For illustrative purposes only. Please note that simulated results have inherent limitations. The results do not represent results of actual trading using client assets, but were obtained by the retroactive application of constraint assumptions to model allocations as described herein. No representation is being made that any account will achieve profits or losses similar to those shown. These simulated results do not reflect the deduction of
37.0%
3.5%
15.2%
44.3%
34.8%
3.3%
14.3%
41.7%
3.0%
1.0%
2.0%
34.8%
3.3%
14.3%
41.7%
3.0%
1.0%
2.0%
Public Equity
Private Equity
Infrastructure
Bonds
Climate Change Public Equity
Climate Change Private Equity
Climate Change Infrastructure
Standard Portfolio without Climate
Change
Portfolio Using Historical Climate Change Returns
Portfolio Using Forecast Climate Change Returns
Target Portfolio Return: 6.00% 6.00% 6.00%Statistical Tests Probability of Outperforming Target Return 57.94% 59.58% 58.59%Simulated Mean Return 8.73% 9.39% 9.11%Simulated Volatility 10.76% 11.30% 11.30%

Appendix I Risk and Returns for Climate Change Investors
100 Investing in Climate Change 2012
investment advisory fees. A client’s return will be reduced by advisory fees and any other expenses that may be incurred in the management of its investment advisory account. Past performance is not guarantee of future results.
Conclusions: Allocating to climate change offers investors a greater probability of achieving the target return.
We use an aggressive overweight of 6% allocated to climate change sectors, compared to a 2% global market capitalization benchmark. Using historical returns of 19% from climate change sectors, an excess of 12% over the benchmark, applying them to the total portfolio yielded an extra 0.7% of return to the total portfolio.
On an ongoing basis, a more conservative assumption would be a 5% excess return from climate change sectors, which would give an additional 0.4% to the total portfolio.
We did this by selecting a specific return target of 6% for the portfolio, which allowed us to analyze the probability of reaching that target.

Appendix II Structural Comparison of Key Climate Indices
101 Investing in Climate Change 2012
Appendix II: Structural Comparison of Key Climate Indices
DB NASDAQ Clean Tech IndexWilderHill New Energy Global
Innovation Index (NEX)HSBC Climate Change Index MSCI Climate Index
Description The DB NASDAQ OMX Clean Tech Index is an accurate representation of the global clean tech industry, which
covers clean energy, energy efficiency, transport, waste management and
water.
The WilderHill New Energy Global Innovation Index is comprised of
companies worldwide whose innovative technologies and services
focus on generation and use of cleaner energy, conservation and efficiency,
and advancing renewable energy generally. Included are companies
whose lower-carbon approaches are relevant to climate change, and whose
technologies help reduce emissions relative to traditional fossil fuel use.
The HSBC Global Climate Change Index is designed to track and reflect the stock market performance of key
companies that HSBC believes are best placed to profit from a changing
climate. This includes companies and industries involved and engaged in reducing emissions as well as those
that have either begun or are beginning to gear up to provide goods and services that address the issues of
climate change.
The MSCI Global Climate Index is an equal weighted index of companies
that operate in three key environmental areas: clean technology and efficiency, renewable energy, and future fuels. The index is designed to include companies that are leaders in mitigating immediate and long-term
factors that contribute to climate change and that may potentially
benefit from the de-carbonization of the economy. Constituent selection is
based on data from MSCI ESG Research.
Type Pure-play Pure-play Thematic Broad filterMarket Cap Filter >$200M >$100M >$450M Defined by MSCI review of full public
equity universe. Sectors Clean energy, transport, water, waste,
energy efficiency Wind, solar, biofuels, hydro, wave and tidal, geothermal and other renewable
energy businesses, as well as energy conversion, storage, conservation,
efficiency, materials, pollution control, emerging hydrogen and fuel
cells
Low-carbon energy production, energy efficneiy and energy management,
water and waste management
Clean technology and efficiency, renewable energy, and future fuels. To qualify for inclusion in the MSCI
Global Climate Index, indicators such as strategic commitment, investment in research and development, market
share, intellectual property and reputation of companies are
evaluated.Number of Constituents
100 98 346 100
Revenue threshold >33% from clean tech sectors "Bias to pure plays" >10% from climate change sectors None: Leadership and commitment to addressing climate change
Weighting Equal weighted Equal-weighting methodology modified by sector and market
capitalization bands
Modified-market cap weighted (adjustments made based on revenue
filters)
Equal weighted
Constituent Sources DBCCA Research team review of public equity universe to create clean tech
universe
Market review by 60 analysts HSBC's proprietary database of ~65,000 publicly traded companies
The MSCI Global Climate Index is drawn from the universe of MSCI
World IMI, a broad global benchmark of large, mid and small cap companies across developed markets countries.

Appendix III Glossary of Key Terms and Indices
102 Investing in Climate Change 2012
Appendix III: Glossary of Key Terms and Indices
Term Definition Target Fund Returns Target fund returns represent an average range of returns typically targeted by venture
capital, private equity or infrastructure fund managers (as labeled). These target returns will be specified in fund documents distributed to prospective investors, and may vary considerably between funds. These numbers do not offer any guarantee of performance, but rather represent targeted returns, as measured by net internal rate of return (net IRR).
Actual Fund Returns Actual fund returns represent the net internal rate of return, as defined by Preqin (see below definition of net IRR).
Net Internal Rate of Return (IRR) The net IRR, as defined by Preqin, is the return (in percentage terms) earned by a Limited Partner (LP) in a fund to date after fees and carry. The internal rate of return is based upon the realized cash flows and the valuation of the remaining interest in the partnership. IRR is an estimated figure, given that it relies upon not only cash flows but also the valuation of unrealized assets. The actual net IRR return estimates shown in this paper are both those as reported by the LP and / or General Partner (GP), and those that Preqin has calculated internally, based upon cash flows and valuations, provided for individual partnerships.
VC/PE Equity Investment VC or PE funds make investments directly into private companies or engage in a private investment transaction in a public company. A VC/PE equity investment refers to the buying and holding of shares of a company by VC/PE funds.
Infrastructure Equity Investment An infrastructure equity investment refers to the buying and holding of a portion of a physical asset, or at the holding company level of an infrastructure vehicle.
Infrastructure Debt Investment Infrastructure debt is the fixed income component of infrastructure assets. It is a complex investment category reserved for investors who can gauge jurisdiction-specific risk parameters, assess a project’s long-term viability, understand transaction risks, conduct due diligence, negotiate (multi)creditors’ agreements, make timely decisions on consents and waivers, and analyze loan performance over time.
Price/Earnings (P/E) P/E refers to the valuation ratio of a company's current share price compared to its per-share earnings. Calculated as: Market Value per Share / Earnings per Share (EPS)
Earnings Per Share (EPS) EPS is the portion of a company's profit allocated to each outstanding share of common stock. Earnings per share serves as an indicator of a company's profitability.
Compound Annual Growth Rate (CAGR) The year-over-year growth rate of an investment over a specified period of time. The compound annual growth rate is calculated by taking the nth root of the total percentage growth rate, where n is the number of years in the period being considered.
Index Definition MSCI World Global benchmark for publicly listed equities across all major sectors
UBS Global Infrastructure Global benchmark for infrastructure related publicly listed equities
UBS Global Infrastructure and Utilities Global benchmark for infrastructure and utility company related publicly listed equities
Barclays Capital Bonds Proxy Global benchmark index representing performance of the aggregate fixed income asset class
Cambridge Research Private Equity Proxy Global benchmark tracking underlying performance of Private Equity funds via reporting to Cambridge Research
Cambridge Research Venture Capital Proxy Global benchmark tracking underlying performance of Venture Capital funds via reporting to Cambridge Research
NCREIF Farmland Benchmark index for US farmland performance
DB Nasdaq Cleantech Benchmark index for global pure-play clean tech sector publicly listed equities, created by DBCCA and NASDAQ OMX
NEX Wilderhill Clean Energy Benchmark index for global pure-play clean tech sector publicly listed equities, created by Bloomberg New Energy Finance and Wilderhill
HSBC Climate Change Benchmark Global reference index which has been designed to reflect and track the stock market performance of key companies that are best placed to profit from the challenges presented by climate change.
HSBC Low Carbon Energy Production Sub-sector index of HSBC benchmark focused on low carbon energy production such as renewables and nuclear
HSBC Energy Efficiency and Management Sub-sector index of HSBC benchmark focused on energy efficiency sectors such as buildings, smart grid, and battery storage
HSBC Water, Waste and Pollution Control Sub-sector index of HSBC benchmark focused on water treatment and waste management
S&P Water Global benchmark of publicly listed equities involved in the water theme, including water treatment and technology companies and water utilities

Appendix III Glossary of Key Terms and Indices
103 Investing in Climate Change 2012
DBIQ Diversified World Agriculture Global benchmark of performance of agricultural commodities
DAX Global Agribusiness Global benchmark of publicly listed companies in the agri-business sector
Crude Oil (WTI) WTI Price index of a key benchmark for North American crude oil prices
Natural Gas (Henry Hub) HH Price index of a key benchmark for North American natural gas prices
Natural Gas (National Balancing Point) Nat'l Balancing Point Price index of a key benchmark for European natural gas prices

Disclaimer
104 Investing in Climate Change 2012
DB Climate Change Advisors is the brand name for the institutional climate change investment division of Deutsche Asset Management, the asset management arm of Deutsche Bank AG. In the US, Deutsche Asset Management relates to the asset management activities of Deutsche Bank Trust Company Americas, Deutsche Investment Management Americas Inc. and DWS Trust Company; in Canada, Deutsche Asset Management Canada Limited (Deutsche Asset Management Canada Limited is a wholly owned subsidiary of Deutsche Investment Management Americas Inc); in Germany and Luxembourg: DWS Investment GmbH, DWS Investment S.A., DWS Finanz-Service GmbH, Deutsche Asset Management Investmentgesellschaft mbH, and Deutsche Asset Management International GmbH; in Denmark, Finland, Iceland, Norway and Sweden, Deutsche Asset Management International GmbH ; in Australia, Deutsche Asset Management (Australia) Limited (ABN 63 116 232 154); in Hong Kong, Deutsche Asset Management (Hong Kong) Limited; in Japan, Deutsche Asset Management Limited (Japan); in Singapore, Deutsche Asset Management (Asia) Limited (Company Reg. No. 198701485N) and in the United Kingdom, Deutsche Alternative Asset Management (UK) Limited (formerly known as RREEF Limited), Deutsche Alternative Asset Management (Global) Limited (formerly known as RREEF Global Advisers Limited), and Deutsche Asset Management (UK) Limited; in addition to other regional entities in the Deutsche Bank Group. This material is intended for informational purposes only and it is not intended that it be relied on to make any investment decision. It does not constitute investment advice or a recommendation or an offer or solicitation and is not the basis for any contract to purchase or sell any security or other instrument, or for Deutsche Bank AG and its affiliates to enter into or arrange any type of transaction as a consequence of any information contained herein. Neither Deutsche Bank AG nor any of its affiliates, gives any warranty as to the accuracy, reliability or completeness of information which is contained in this document. Except insofar as liability under any statute cannot be excluded, no member of the Deutsche Bank Group, the Issuer or any officer, employee or associate of them accepts any liability (whether arising in contract, in tort or negligence or otherwise) for any error or omission in this document or for any resulting loss or damage whether direct, indirect, consequential or otherwise suffered by the recipient of this document or any other person. The views expressed in this document constitute Deutsche Bank AG or its affiliates’ judgment at the time of issue and are subject to change. This document is only for professional investors. This document was prepared without regard to the specific objectives, financial situation or needs of any particular person who may receive it. The value of shares/units and their derived income may fall as well as rise. Past performance or any prediction or forecast is not indicative of future results. No further distribution is allowed without prior written consent of the Issuer. The forecasts provided are based upon our opinion of the market as at this date and are subject to change, dependent on future changes in the market. Any prediction, projection or forecast on the economy, stock market, bond market or the economic trends of the markets is not necessarily indicative of the future or likely performance. For Investors in the United Kingdom Issued in the United Kingdom by Deutsche Asset Management (UK) Limited of One Appold Street, London, EC2A 2UU. Authorised and regulated by the Financial Services Authority. This document is a "non-retail communication" within the meaning of the FSA’s Rules and is directed only at persons satisfying the FSA’s client categorisation criteria for an eligible counterparty or a professional client. This document is not intended for and should not be relied upon by a retail client. When making an investment decision, potential investors should rely solely on the final documentation relating to the investment or service and not the information contained herein. The investments or services mentioned herein may not be appropriate for all investors and before entering into any transaction you should take steps to ensure that you fully understand the transaction and have made an independent assessment of the appropriateness of the transaction in the light of your own objectives and circumstances, including the possible risks and benefits of entering into such transaction. You should also consider seeking advice from your own advisers in making this assessment. If you decide to enter into a transaction with us you do so in reliance on your own judgment. For Investors in Australia In Australia, Issued by Deutsche Asset Management (Australia) Limited (ABN 63 116 232 154), holder of an Australian Financial Services License. This information is only available to persons who are professional, sophisticated, or wholesale investors under the Corporations Act. An investment with Deutsche Asset Management is not a deposit with or any other type of liability of Deutsche Bank AG ARBN 064 165 162, Deutsche Asset Management (Australia) Limited or any other member of the Deutsche Bank AG Group. The capital value of and performance of an investment with Deutsche Asset Management is not guaranteed by Deutsche Bank AG, Deutsche Asset Management (Australia) Limited or any other member of the Deutsche Bank Group. Deutsche Asset Management (Australia) Limited is not an Authorised Deposit taking institution under the Banking Act 1959 nor regulated by the Australian Prudential Authority. Investments are subject to investment risk, including possible delays in repayment and loss of income and principal invested. For Investors in Hong Kong Interests in the funds may not be offered or sold in Hong Kong or other jurisdictions, by means of an advertisement, invitation or any other document, other than to Professional Investors or in circumstances that do not constitute an offering to the public. This document is therefore for the use of Professional Investors only and as such, is not approved under the Securities and Futures Ordinance (SFO) or the Companies Ordinance and shall not be distributed to non-Professional Investors in Hong Kong or to anyone in any other jurisdiction in which such distribution is not authorised. For the purposes of this statement, a Professional investor is defined under the SFO. For Investors in MENA region This information has been provided to you by Deutsche Bank AG Dubai (DIFC) branch, an Authorised Firm regulated by the Dubai Financial Services Authority. It is solely directed at Market Counterparties or Professional Clients of Deutsche Bank AG Dubai (DIFC) branch, which meets the regulatory criteria as established by the Dubai Financial Services Authority and may not be delivered to or acted upon by any other person. I-027837-1.1 Copyright © 2012 Deutsche Bank AG, Frankfurt am Main