Embed Size (px)
Citation preview

© Marine Operations and Assurance Management Solutions Ltd
Martin L Shaw MBA C Eng C Mar Eng FI Mar EST AFNI
Managing Director Marine Operations and Assurance Management Solutions Ltd
Investing/Living under a carbon cloud
How oil companies can motivate a reduction in fuel consumption /CO2 emission from the
tankers they charter?

© Marine Operations and Assurance Management Solutions Ltd
Outline
Carbon Cloud.
What is it?
What can oil
companies do?
Demand drives
shipping emissions
Design Fuel Operatio
n
What the industry is
doing
Environmental clashes
© Marine Operations and Assurance Management Solutions Ltd
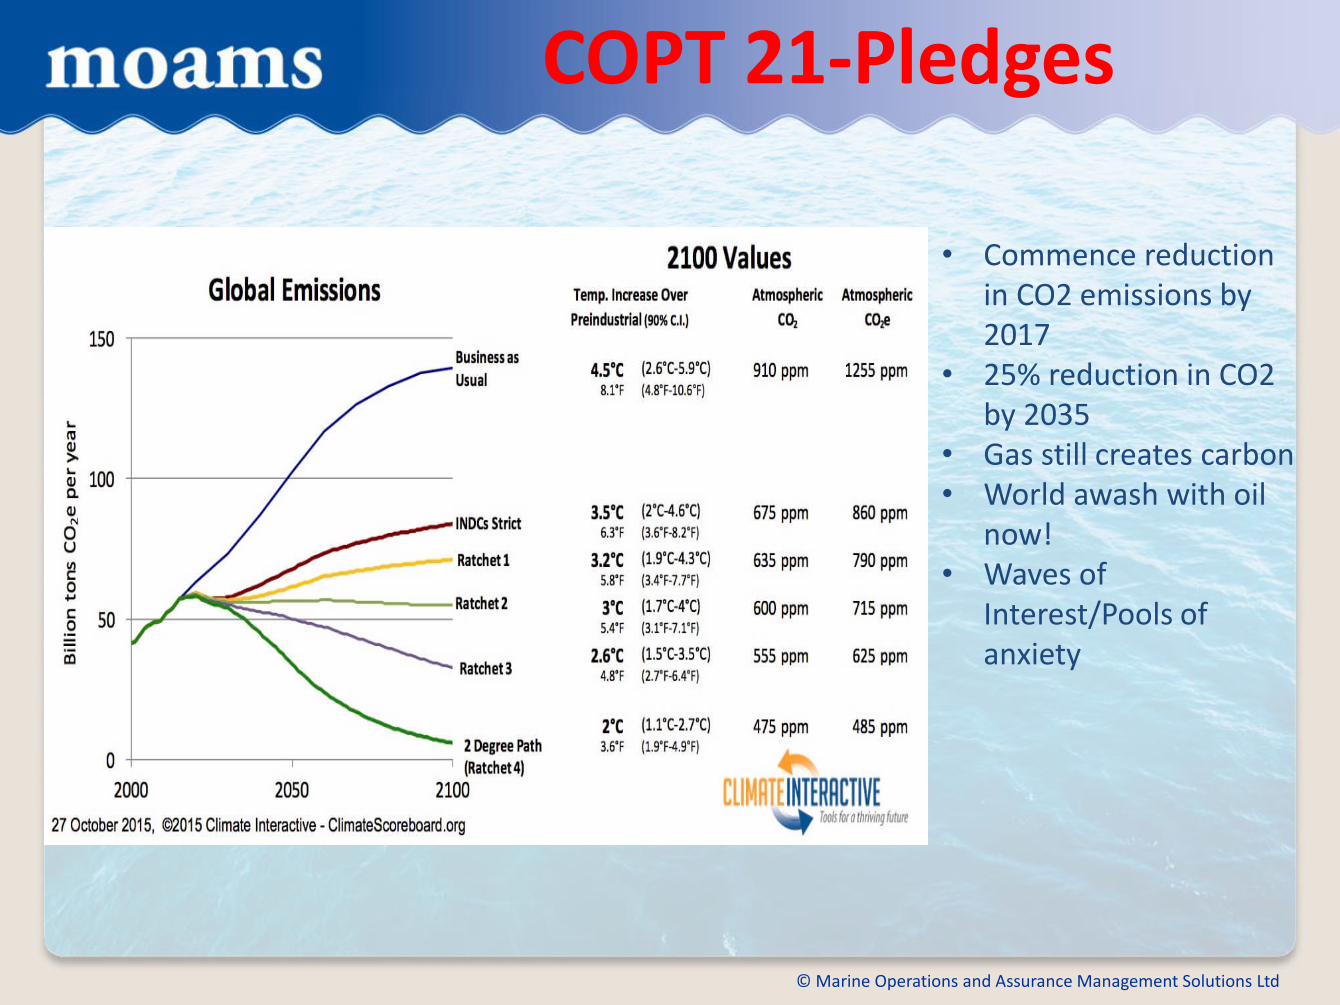
COPT 21-Pledges
• Commence reduction in CO2 emissions by 2017
• 25% reduction in CO2 by 2035
• Gas still creates carbon • World awash with oil
now! • Waves of
Interest/Pools of anxiety

© Marine Operations and Assurance Management Solutions Ltd
Shipping’s share
Year Global CO2 Total
shipping % of global
International
shipping % of global
2007 31,409 1,100 3.50% 885 2.80%
2008 32,204 1,135 3.50% 921 2.90%
2009 32,047 978 3.10% 855 2.70%
2010 33,612 915 2.70% 771 2.30%
2011 34,723 1,022 2.90% 850 2.40%
2012 35,640 938 2.60% 796 2.20%
average 33,273 1,015 3.10% 846 2.60%
Source IMO 2014 GHG Study

© Marine Operations and Assurance Management Solutions Ltd
Efficient tortoises not hungry hares

© Marine Operations and Assurance Management Solutions Ltd
Demand drives Shipping Emissions

© Marine Operations and Assurance Management Solutions Ltd
Demand-shipping moves the world

© Marine Operations and Assurance Management Solutions Ltd
Oil Movements
Source bp review of world energy

© Marine Operations and Assurance Management Solutions Ltd
What are the ship supply choices?
Spee
d
Size
• Square relationship • Law of diminishing
returns • Higher Opex • Low weight /high value
such as passengers
• Higher Capex • ‘Fixed’ energy costs
to move empty ship • Increased operating
costs
• Navigation restrictions • Port restrictions • Storage cost • Working Capital • Use for Crude not for
products

© Marine Operations and Assurance Management Solutions Ltd
Design…What Drives Ships?

© Marine Operations and Assurance Management Solutions Ltd
Ship efficiency-its complex!!!
Source mek.dtu.de
• No two days at sea are the same Winds and waves Speed over ground-tides Exclude over Beaufort 5 Fuel/speed is a square relationship How do you measure fouling?
• Subjective judgements • Big Data

© Marine Operations and Assurance Management Solutions Ltd
Back to the future
• Efficient Propellers • Ducts • Rudders • Bulbs • Hull shapes • Sails • Kites ….....Fuels

© Marine Operations and Assurance Management Solutions Ltd
Fuels

© Marine Operations and Assurance Management Solutions Ltd
Carbon Intensity

© Marine Operations and Assurance Management Solutions Ltd
Fuels Existing Fuel
• Heavy Fuel Oil
• Quality (or not) Bottom of the barrel
Fuel or refinery waste disposal
Cat Fines
Disposal of Waste Oil
Requires substantial heating and onboard processing
• Available everywhere
• Sulphur caps
Alternatives
• Self contained
– Nuclear
– Wind
– Solar
• Networked Fuels
– Distillates
– Methanol
– LNG
– Biofuels

© Marine Operations and Assurance Management Solutions Ltd
Chickens -lesson from history
Early Steam vessels had dual power, Steam and Sail, until a reliable global network of coaling stations was developed. Then the sails disappeared …...after about 40 years Chicken and Egg 19th century style

© Marine Operations and Assurance Management Solutions Ltd
Operations

© Marine Operations and Assurance Management Solutions Ltd
The Operational Cycle
Loading Port
Ballast pumping
Heating
Base Load Power
Loaded Voyage
Propulsion
Heating
Base load Power
Discharge Port
Cargo /Ballast Pumps
Inert Gas
Heating
Base Load Power
Tank Cleaning
Propulsion
Cargo/Ballast Pumps
Inert Gas/Venting
Base Load Power
Ballast Voyage
Propulsion
Base Load Power
© Marine Operations and Assurance Management Solutions Ltd
Operational Issues
• Hurry up and wait – Contracts can encourage ships to go at full speed and
then anchor potentially for long periods
• Just in time – Capital constraints can limit storage at loading and
discharge locations
– Stockholding costs in the new world with carbon pricing
• Ports – Sufficient storage for large parcels
– Locating terminals to avoid draft restrictions
– Sufficient jetties and tugs

© Marine Operations and Assurance Management Solutions Ltd
Clash of Environmental Aspects

© Marine Operations and Assurance Management Solutions Ltd
Sulphur is driving fuel change today

© Marine Operations and Assurance Management Solutions Ltd
Sulphur Caps

© Marine Operations and Assurance Management Solutions Ltd
Which Environmental Issue?
Environmental Aspect
More Carbon
Replacing sulphur as component of fuel
Fuel for scrubbers
Increased fouling
Increased Fuel Consumption
More contamination carried
Fuel used for ballast water exchange and treatment
Sox and Nox rules
Hull fouling and TBT free paints
Invasive Species

© Marine Operations and Assurance Management Solutions Ltd
What is the industry doing?

© Marine Operations and Assurance Management Solutions Ltd
What the industry is doing
Issues • Measurement • Regional requirements EU/USCG • Complex and opaque formulae
Fuels • Network fuels LNG distillate

© Marine Operations and Assurance Management Solutions Ltd
Carbon Pricing-how effective?
Market Based Measures • Carbon tax can influence demand • Cap and Trade or Levy • If levy who gets the money? • Carbon Price $100-200 per tonne?

© Marine Operations and Assurance Management Solutions Ltd
What can the oil company/charterer do?
© Marine Operations and Assurance Management Solutions Ltd
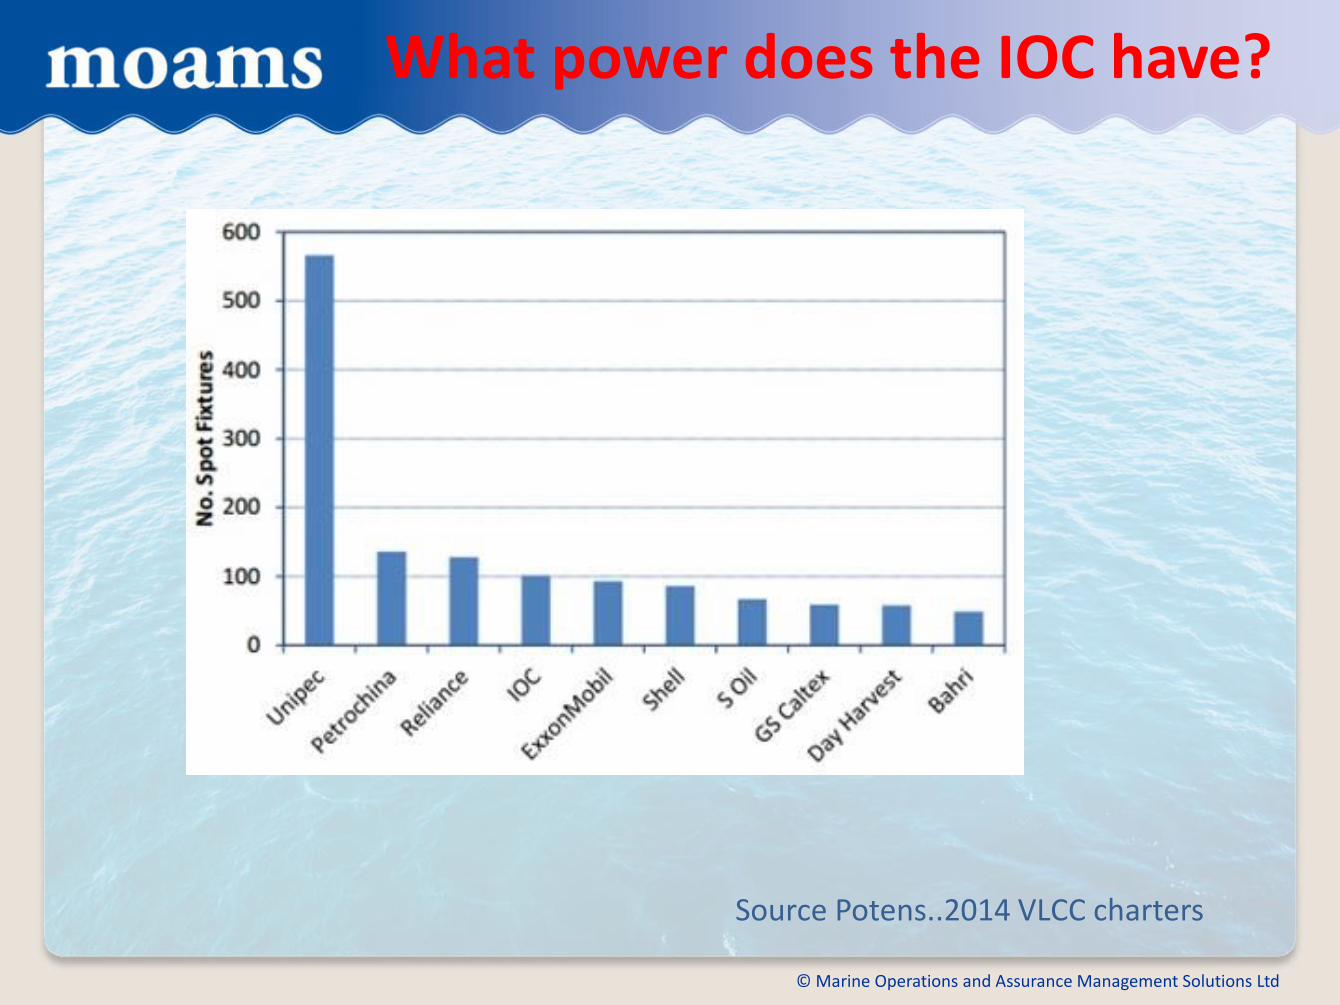
What power does the IOC have?
Source Potens..2014 VLCC charters

© Marine Operations and Assurance Management Solutions Ltd
Who owns tankers?
0 2 4 6 8 10 12 14 16
MOL
NITC
Teekay
Euronav
Sovcomflot
NYK
Bahri
AET
Frontline
Dynacom
COSCO
China VLCC
Maran
China Shipping Dev
Maersk
OSG
Minerva
SK
Thenamaris
Oman Shipping
TEN
BW
DHT
Formosa Plastics
Genmar
BP Shipping
SCI
Torm
Navios
2014 Top 30 Tanker Owners
MDWT2014
Building
Source Tanker Operator Magazine

© Marine Operations and Assurance Management Solutions Ltd
Recap
Carbon Cloud.
What is it?
What can oil
companies do?
Demand drives
shipping emissions
Design Fuel Operatio
n
What the industry is
doing
Environmental clashes

© Marine Operations and Assurance Management Solutions Ltd
What can oil co’s do?
1. World ( a naive view?) a. Production near Consumers
b. Short Voyages and Big Ships
c. Priority to environmental goal
d. Re-examine JIT and stockholding costs through carbon lens
e. Needs carbon price to change behaviours
2. Oil companies a. Use the power that reduced oil pollution to reduce CO2
b. More flexibility in design at load/discharge terminals berths, tanks etc.
c. Operational flexibility for most economic speed
d. Decent fuel that doesn’t require an onboard refinery
e. Global fuelling networks for LNG and other fuels
f. MBM for the planet not for the bottom line
g. Oil trading, does it generate unnecessary emissions?