Embed Size (px)
Citation preview
INVESTMENT BANKING AND CAPITAL MARKETS
Market Report—First Quarter 2005 Edition
New York, Frankfurt
May 31, 2005
THE BOSTON CONSULTING GROUP
TABLE OF CONTENTS
Chapter Page
Investment Banking Results First Quarter 2005
Impact of Rising U.S. Interest Rates on Global Fixed Income Revenues
Market Review
• Corporate Finance and Advisory
• Fixed-Income Trading
• Equity Trading
Data Definitions
2
10
18
25
30
36
-1-Q1 2005 Market Report-BR-TM-NYC-31May05.ppt
Investment Banking Results First Quarter 2005
-2-Q1 2005 Market Report-BR-TM-NYC-31May05.ppt
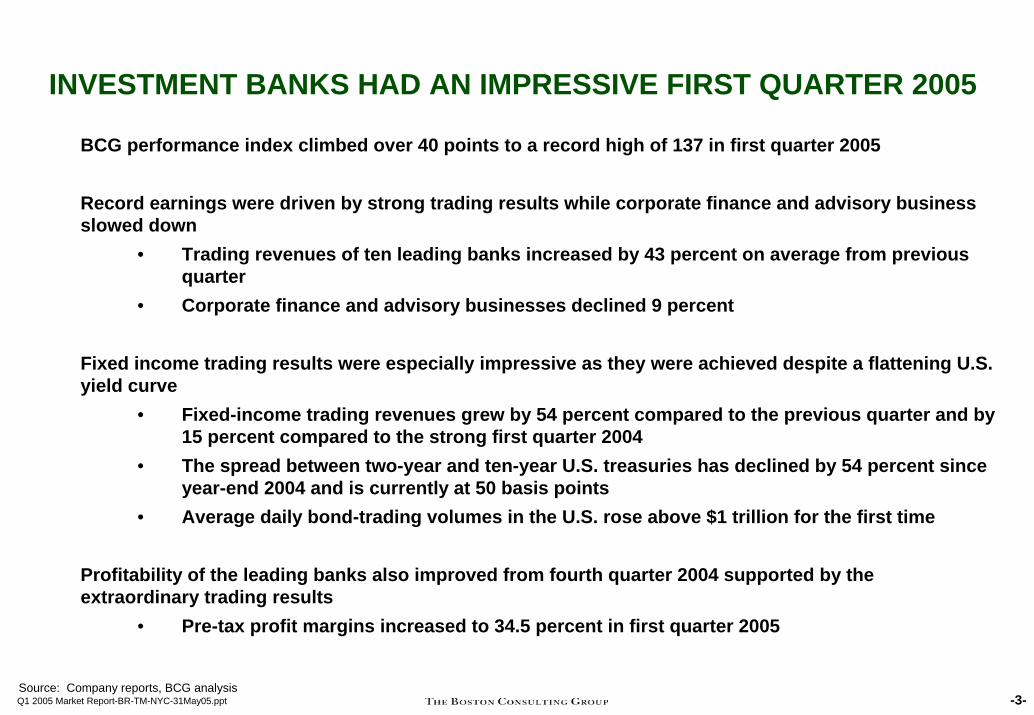
INVESTMENT BANKS HAD AN IMPRESSIVE FIRST QUARTER 2005
BCG performance index climbed over 40 points to a record high of 137 in first quarter 2005
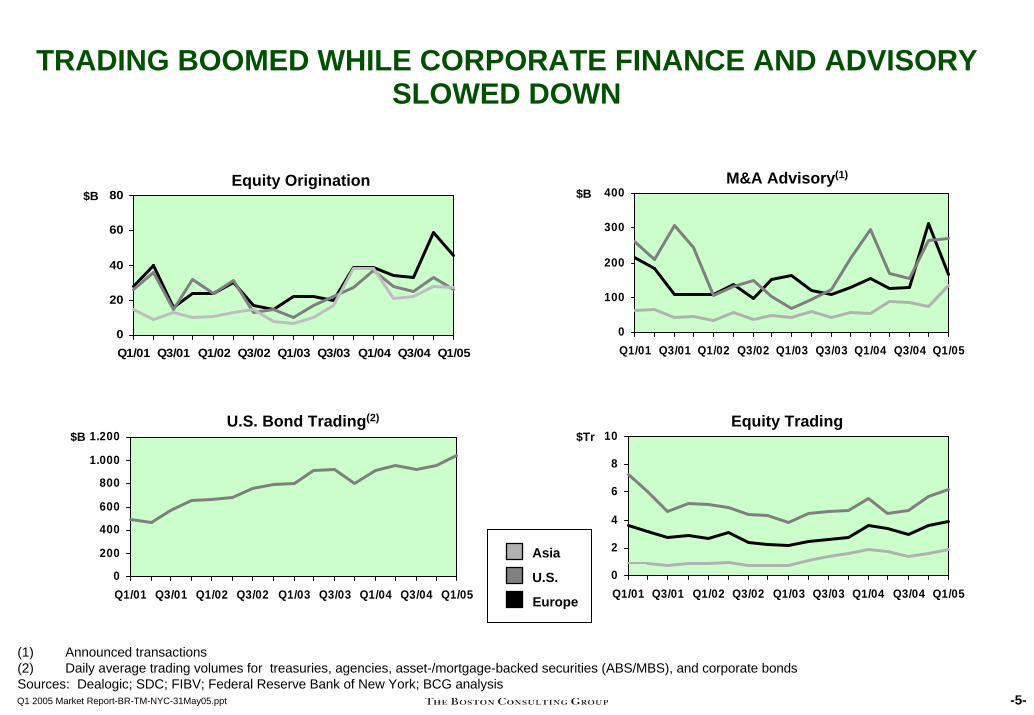
Record earnings were driven by strong trading results while corporate finance and advisory business slowed down
• Trading revenues of ten leading banks increased by 43 percent on average from previous quarter
• Corporate finance and advisory businesses declined 9 percent
Fixed income trading results were especially impressive as they were achieved despite a flattening U.S. yield curve
• Fixed-income trading revenues grew by 54 percent compared to the previous quarter and by 15 percent compared to the strong first quarter 2004
• The spread between two-year and ten-year U.S. treasuries has declined by 54 percent since year-end 2004 and is currently at 50 basis points
• Average daily bond-trading volumes in the U.S. rose above $1 trillion for the first time
Profitability of the leading banks also improved from fourth quarter 2004 supported by the extraordinary trading results
• Pre-tax profit margins increased to 34.5 percent in first quarter 2005
-3-Q1 2005 Market Report-BR-TM-NYC-31May05.pptSource: Company reports, BCG analysis
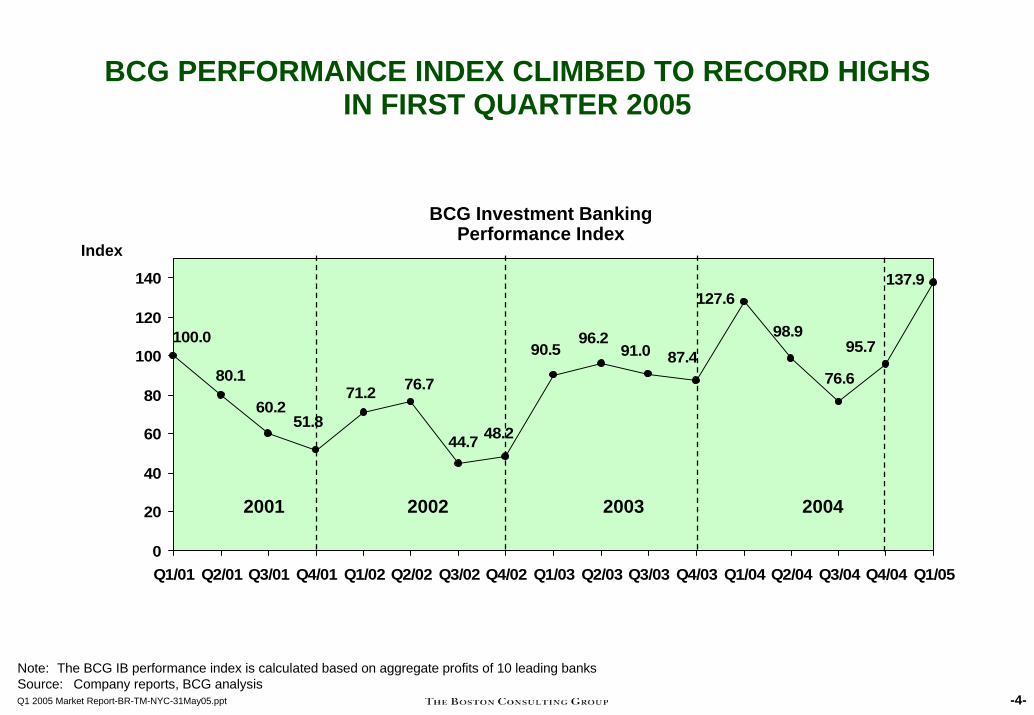
BCG PERFORMANCE INDEX CLIMBED TO RECORD HIGHS IN FIRST QUARTER 2005
76.7
100.0
80.1
60.251.8
71.2
44.7 48.2
90.596.2
91.0 87.4
127.6
98.9
76.6
95.7
137.9
0
20
40
60
80
100
120
140
Q1/01 Q2/01 Q3/01 Q4/01 Q1/02 Q2/02 Q3/02 Q4/02 Q1/03 Q2/03 Q3/03 Q4/03 Q1/04 Q2/04 Q3/04 Q4/04 Q1/05
BCG Investment BankingPerformance Index
Index
2001 2002 2003 2004
-4-Q1 2005 Market Report-BR-TM-NYC-31May05.ppt
Note: The BCG IB performance index is calculated based on aggregate profits of 10 leading banks Source: Company reports, BCG analysis
TRADING BOOMED WHILE CORPORATE FINANCE AND ADVISORY SLOWED DOWN
0
100
200
300
400
Q1/01 Q3/01 Q1/02 Q3/02 Q1/03 Q3/03 Q1/04 Q3/04 Q1/05
M&A Advisory(1)
0
20
40
60
80
Q1/01 Q3/01 Q1/02 Q3/02 Q1/03 Q3/03 Q1/04 Q3/04 Q1/05
$BEquity Origination
$B
0
2
4
6
8
10
Q1/01 Q3/01 Q1/02 Q3/02 Q1/03 Q3/03 Q1/04 Q3/04 Q1/050
200
400
600
800
1.000
1.200
Q1/01 Q3/01 Q1/02 Q3/02 Q1/03 Q3/03 Q1/04 Q3/04 Q1/05
$BU.S. Bond Trading(2)
$TrEquity Trading
U.S.
Asia
Europe
-5-Q1 2005 Market Report-BR-TM-NYC-31May05.ppt
(1) Announced transactions(2) Daily average trading volumes for treasuries, agencies, asset-/mortgage-backed securities (ABS/MBS), and corporate bondsSources: Dealogic; SDC; FIBV; Federal Reserve Bank of New York; BCG analysis
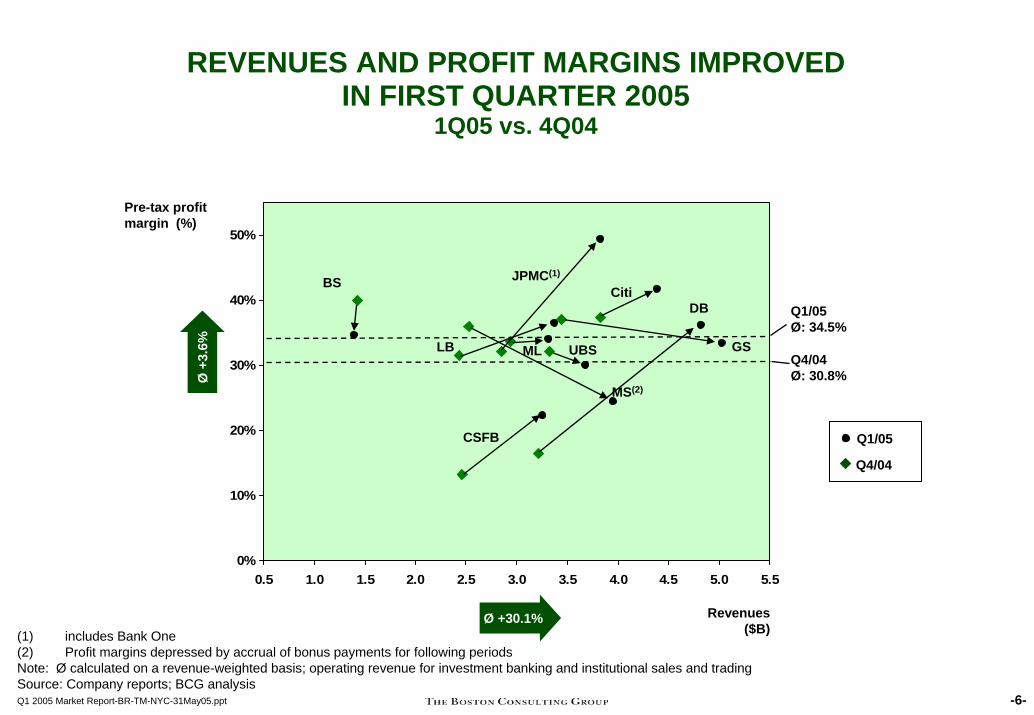
REVENUES AND PROFIT MARGINS IMPROVED IN FIRST QUARTER 2005
1Q05 vs. 4Q04
Pre-tax profit margin (%)
(1) includes Bank One(2) Profit margins depressed by accrual of bonus payments for following periodsNote: Ø calculated on a revenue-weighted basis; operating revenue for investment banking and institutional sales and tradingSource: Company reports; BCG analysis
Revenues($B)
Ø +30.1%
Ø+3
.6%
0%
10%
20%
30%
40%
50%
0.5 1.0 1.5 2.0 2.5 3.0 3.5 4.0 4.5 5.0 5.5
ML GS
MS(2)
CitiBS
DB
UBS
Q4/04
Q1/05
JPMC(1)
Q1/05 Ø: 34.5%
Q4/04 Ø: 30.8%
CSFB
LB
-6-Q1 2005 Market Report-BR-TM-NYC-31May05.ppt
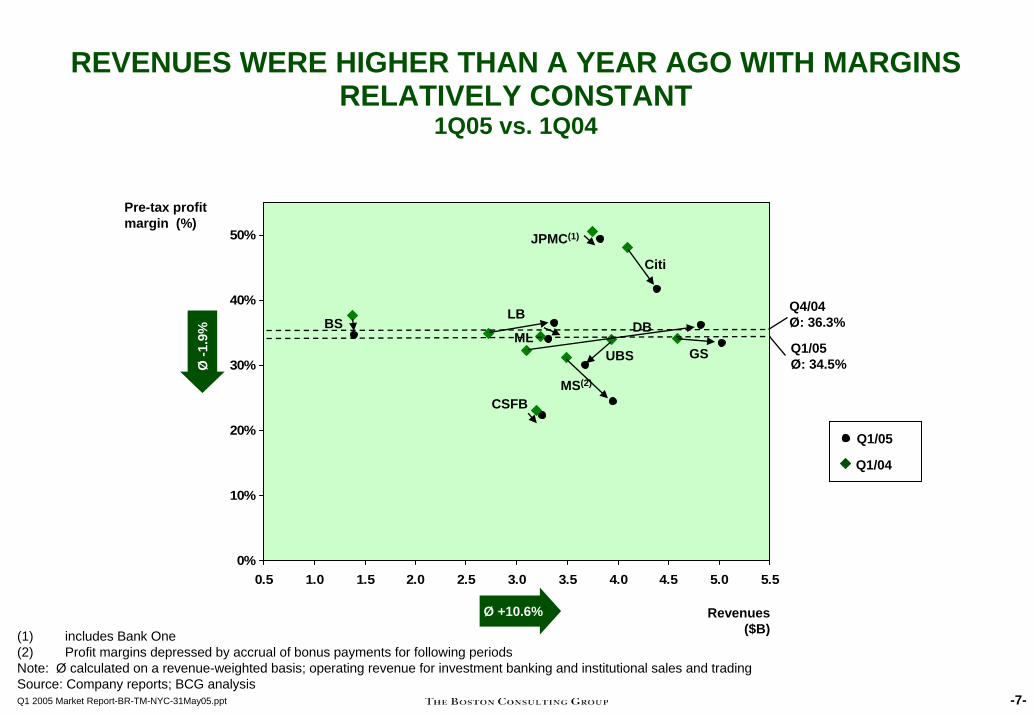
REVENUES WERE HIGHER THAN A YEAR AGO WITH MARGINS RELATIVELY CONSTANT
1Q05 vs. 1Q04
Pre-tax profit margin (%)
-7-Q1 2005 Market Report-BR-TM-NYC-31May05.ppt
(1) includes Bank One(2) Profit margins depressed by accrual of bonus payments for following periodsNote: Ø calculated on a revenue-weighted basis; operating revenue for investment banking and institutional sales and tradingSource: Company reports; BCG analysis
Revenues($B)
Ø +10.6%
Ø-1
.9%
0%
10%
20%
30%
40%
50%
0.5 1.0 1.5 2.0 2.5 3.0 3.5 4.0 4.5 5.0 5.5
MLGS
MS(2)
Citi
BS DB
UBS
Q1/04
Q1/05
JPMC(1)
Q1/05 Ø: 34.5%
Q4/04 Ø: 36.3%
CSFB
LB
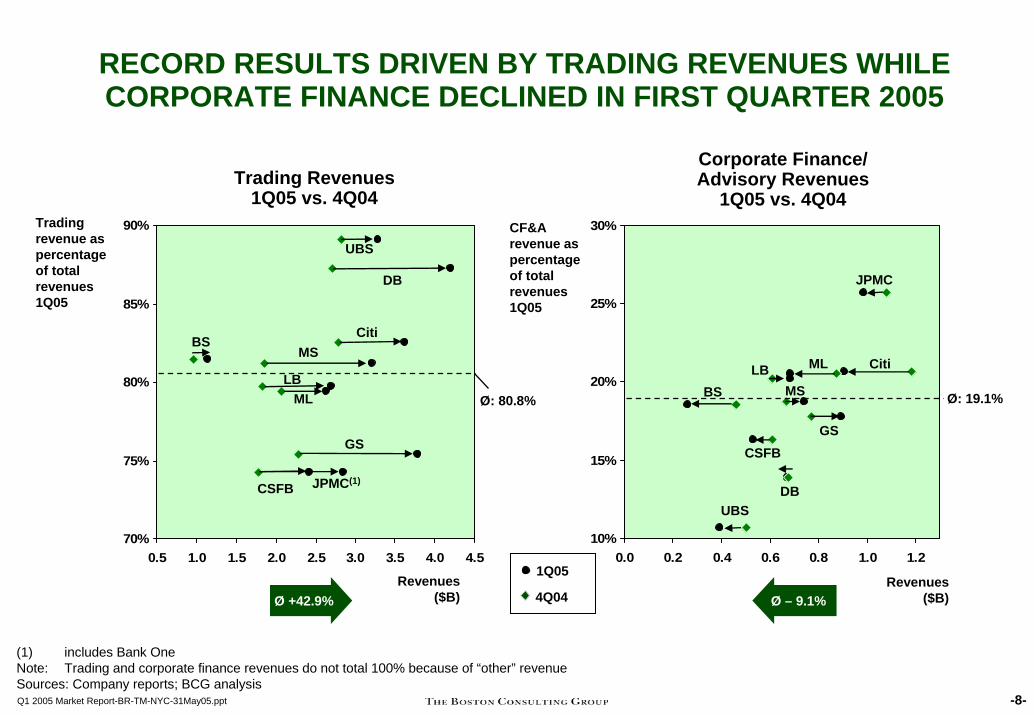
RECORD RESULTS DRIVEN BY TRADING REVENUES WHILE CORPORATE FINANCE DECLINED IN FIRST QUARTER 2005
70%
75%
80%
85%
90%
0.5 1.0 1.5 2.0 2.5 3.0 3.5 4.0 4.5
Trading Revenues1Q05 vs. 4Q04
4Q04
1Q05
10%
15%
20%
25%
30%
0.0 0.2 0.4 0.6 0.8 1.0 1.2
Corporate Finance/Advisory Revenues
1Q05 vs. 4Q04
MS
LB
Citi
GS
CF&A revenue aspercentageof totalrevenues1Q05
GS
LB Citi
MS
ML
JPMC
Revenues($B)
Revenues($B)
Tradingrevenue aspercentageof totalrevenues1Q05
Ø +42.9% Ø – 9.1%
ML
BS
BSØ: 80.8% Ø: 19.1%
JPMC(1)CSFB
DB
UBS
DBUBS
CSFB
-8-Q1 2005 Market Report-BR-TM-NYC-31May05.ppt
(1) includes Bank OneNote: Trading and corporate finance revenues do not total 100% because of “other” revenueSources: Company reports; BCG analysis
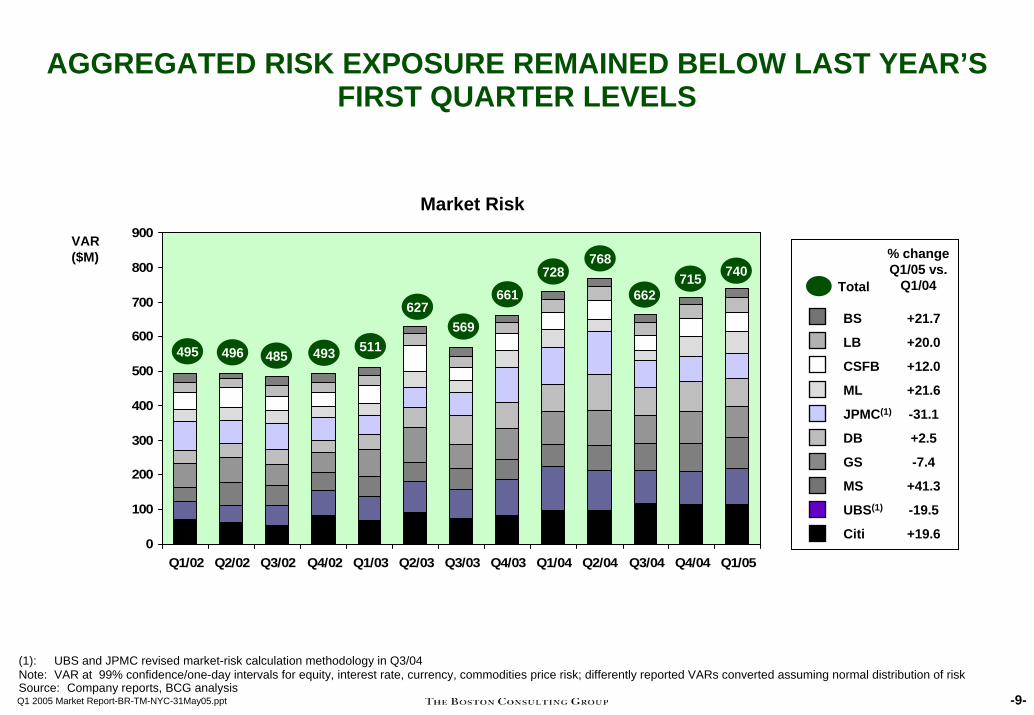
AGGREGATED RISK EXPOSURE REMAINED BELOW LAST YEAR’S FIRST QUARTER LEVELS
Market Risk
0
100
200
300
400
500
600
700
800
900
Q1/02 Q2/02 Q3/02 Q4/02 Q1/03 Q2/03 Q3/03 Q4/03 Q1/04 Q2/04 Q3/04 Q4/04 Q1/05
495 496 485 493 511
VAR($M)
Total
% changeQ1/05 vs.
Q1/04
BS
LB
CSFB
ML
JPMC(1)
DB
GS
MS
UBS(1)
Citi
+21.7
+20.0
+12.0
+21.6
-31.1
+2.5
-7.4
+41.3
-19.5
+19.6
661728
768
662715 740
627569
-9-Q1 2005 Market Report-BR-TM-NYC-31May05.ppt
(1): UBS and JPMC revised market-risk calculation methodology in Q3/04 Note: VAR at 99% confidence/one-day intervals for equity, interest rate, currency, commodities price risk; differently reported VARs converted assuming normal distribution of riskSource: Company reports, BCG analysis
Impact of Rising U.S. Interest Rates on Global Fixed Income Revenues
-10-Q1 2005 Market Report-BR-TM-NYC-31May05.ppt
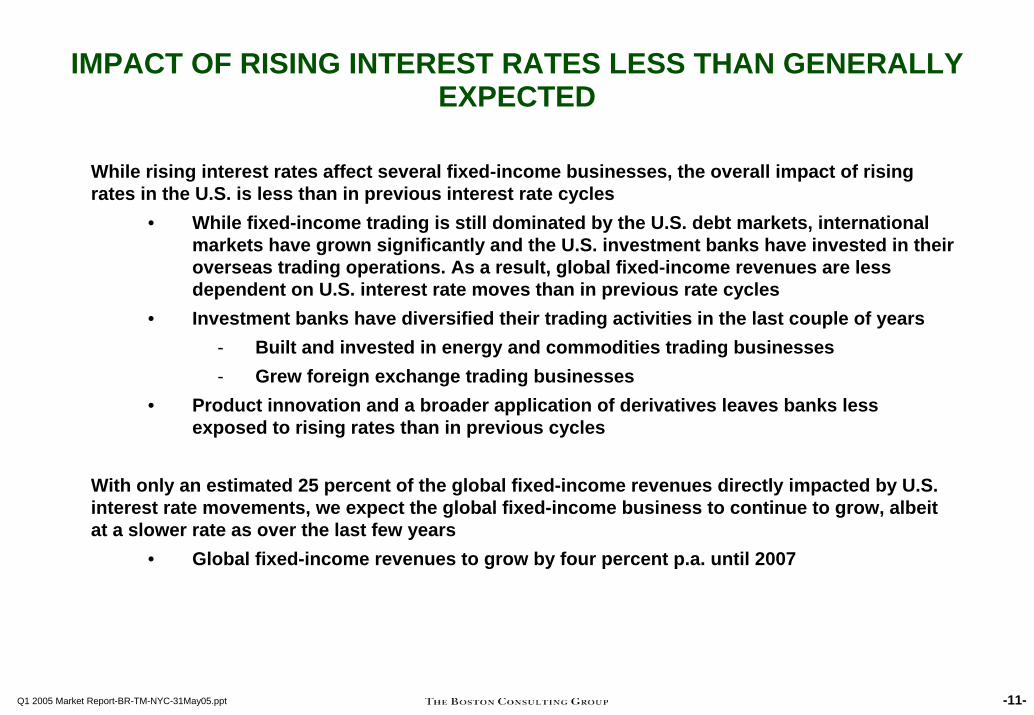
IMPACT OF RISING INTEREST RATES LESS THAN GENERALLY EXPECTED
While rising interest rates affect several fixed-income businesses, the overall impact of rising rates in the U.S. is less than in previous interest rate cycles
• While fixed-income trading is still dominated by the U.S. debt markets, international markets have grown significantly and the U.S. investment banks have invested in their overseas trading operations. As a result, global fixed-income revenues are less dependent on U.S. interest rate moves than in previous rate cycles
• Investment banks have diversified their trading activities in the last couple of years- Built and invested in energy and commodities trading businesses- Grew foreign exchange trading businesses
• Product innovation and a broader application of derivatives leaves banks less exposed to rising rates than in previous cycles
With only an estimated 25 percent of the global fixed-income revenues directly impacted by U.S. interest rate movements, we expect the global fixed-income business to continue to grow, albeit at a slower rate as over the last few years
• Global fixed-income revenues to grow by four percent p.a. until 2007
-11-Q1 2005 Market Report-BR-TM-NYC-31May05.ppt
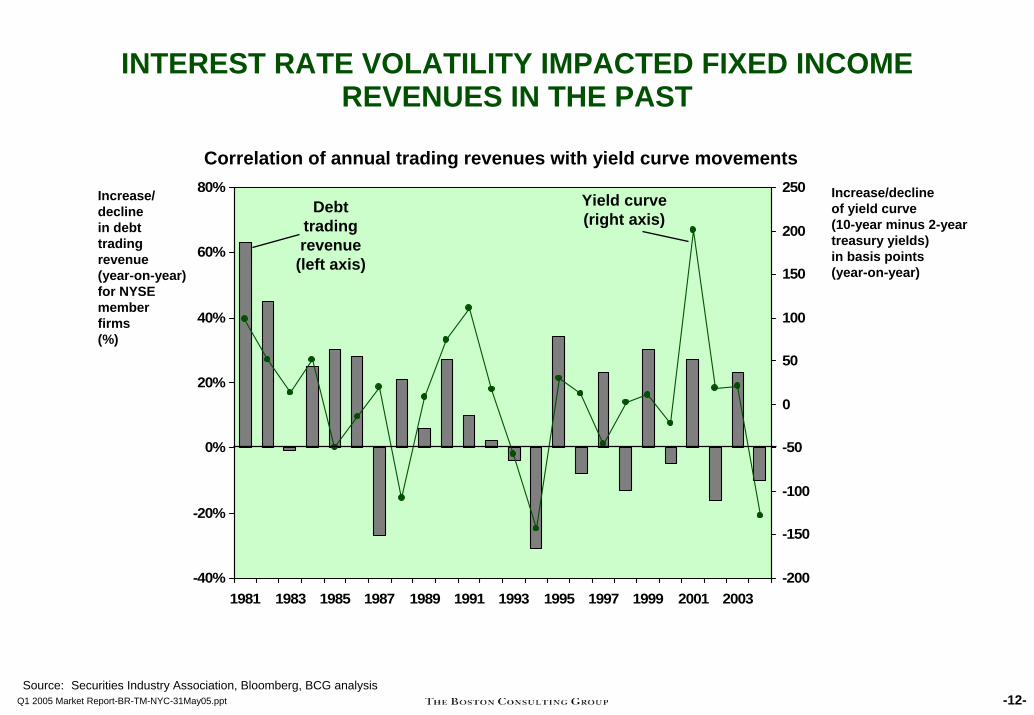
INTEREST RATE VOLATILITY IMPACTED FIXED INCOMEREVENUES IN THE PAST
-40%
-20%
0%
20%
40%
60%
80%
1981 1983 1985 1987 1989 1991 1993 1995 1997 1999 2001 2003-200
-150
-100
-50
0
50
100
150
200
250Increase/declinein debttrading revenue(year-on-year) for NYSEmemberfirms(%)
Correlation of annual trading revenues with yield curve movements
Yield curve(right axis)
Increase/decline of yield curve (10-year minus 2-year treasury yields)in basis points(year-on-year)
Debttradingrevenue
(left axis)
-12-Q1 2005 Market Report-BR-TM-NYC-31May05.pptSource: Securities Industry Association, Bloomberg, BCG analysis
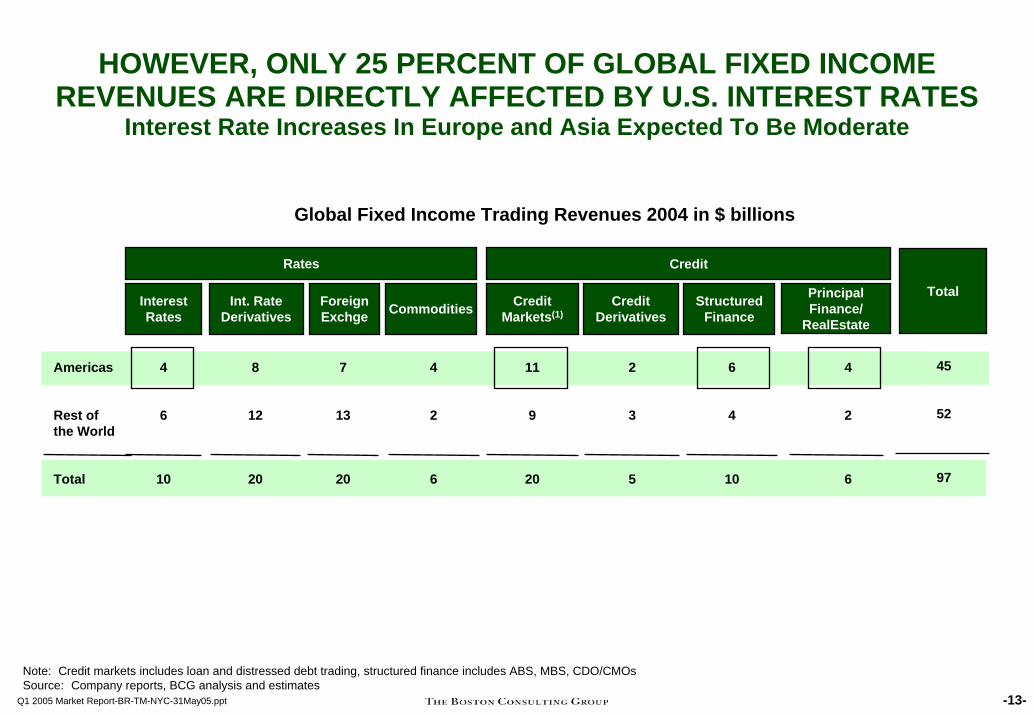
HOWEVER, ONLY 25 PERCENT OF GLOBAL FIXED INCOME REVENUES ARE DIRECTLY AFFECTED BY U.S. INTEREST RATES
Interest Rate Increases In Europe and Asia Expected To Be Moderate
Global Fixed Income Trading Revenues 2004 in $ billions
Rates
-13-Q1 2005 Market Report-BR-TM-NYC-31May05.ppt
Americas
Rest of the World
Total
InterestRates
4
6
10
Int. Rate Derivatives
8
12
20
ForeignExchge
7
13
20
Commodities
4
2
6
Credit Markets(1)
11
9
20
Credit Derivatives
2
3
5
Structured Finance
Credit
Principal Finance/
RealEstate
Total
6
4
10
4
2
6
45
52
97
Note: Credit markets includes loan and distressed debt trading, structured finance includes ABS, MBS, CDO/CMOsSource: Company reports, BCG analysis and estimates
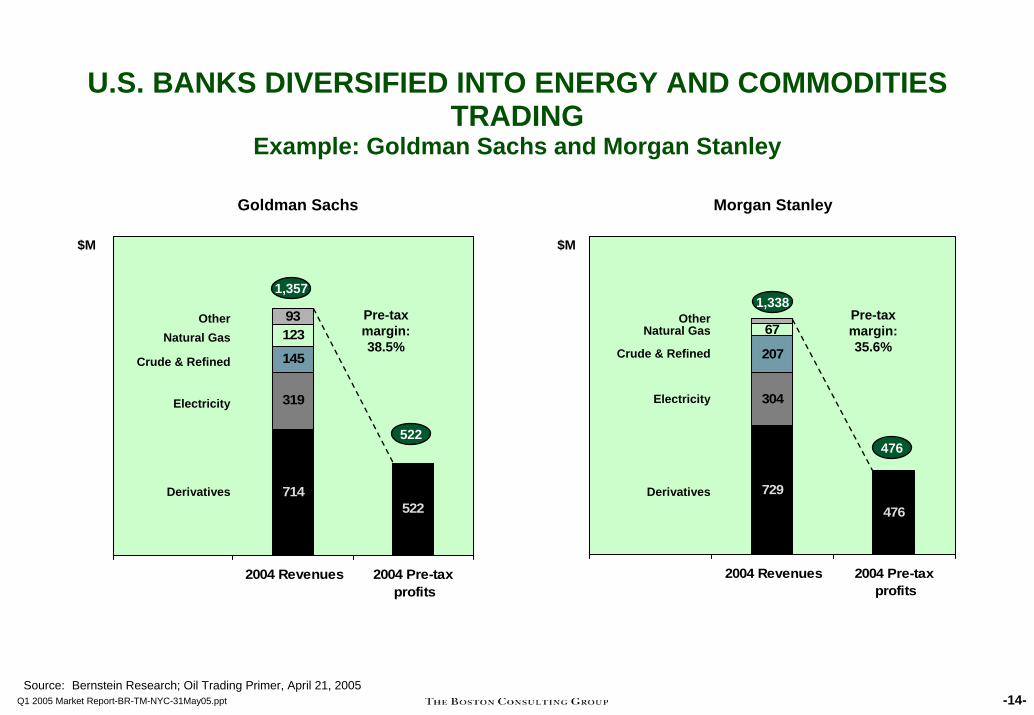
U.S. BANKS DIVERSIFIED INTO ENERGY AND COMMODITIES TRADING
Example: Goldman Sachs and Morgan Stanley
Goldman Sachs Morgan Stanley
$M
476
304
207
67
729
2004 Revenues 2004 Pre-taxprofits
$M
476
Pre-tax margin: 35.6%
OtherNatural Gas
Crude & Refined
Electricity
Derivatives
1,338
522
319
145
12393
714
2004 Revenues 2004 Pre-taxprofits
1,357
522
Pre-tax margin: 38.5%
OtherNatural Gas
Crude & Refined
Electricity
Derivatives
-14-Q1 2005 Market Report-BR-TM-NYC-31May05.pptSource: Bernstein Research; Oil Trading Primer, April 21, 2005
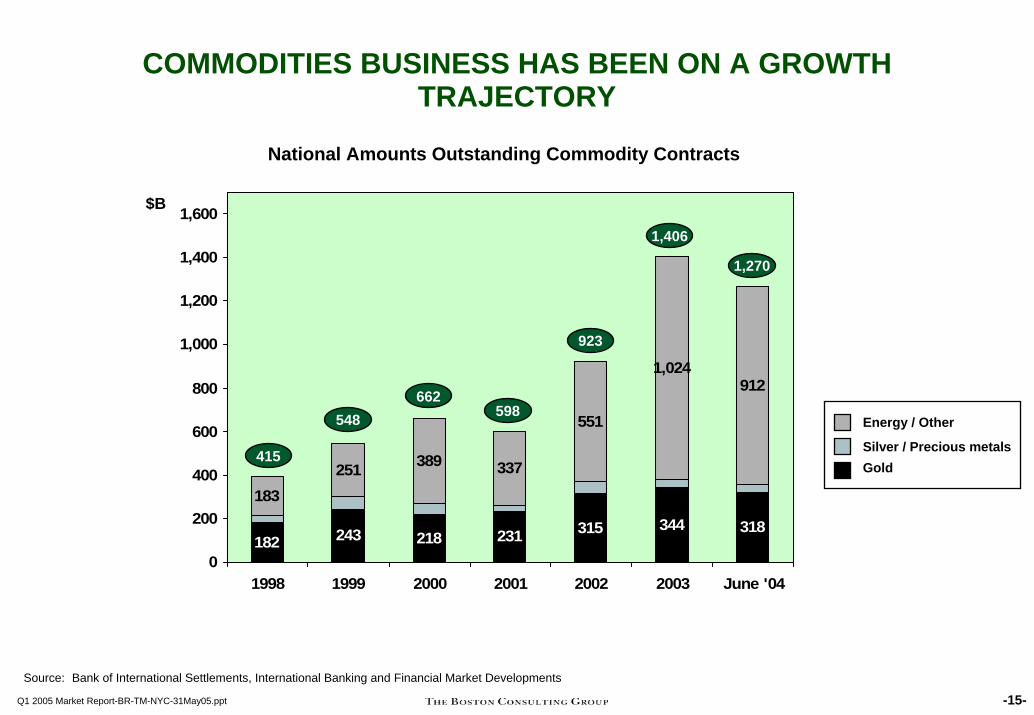
COMMODITIES BUSINESS HAS BEEN ON A GROWTH TRAJECTORY
National Amounts Outstanding Commodity Contracts
182 243 218 231 315 344 318
183251 389 337
551
1,024912
0
200
400
600
800
1,000
1,200
1,400
1,600
1998 1999 2000 2001 2002 2003 June '04
$B
415
548662
598
923
1,406
1,270
GoldSilver / Precious metals
Energy / Other
Source: Bank of International Settlements, International Banking and Financial Market Developments
-15-Q1 2005 Market Report-BR-TM-NYC-31May05.ppt
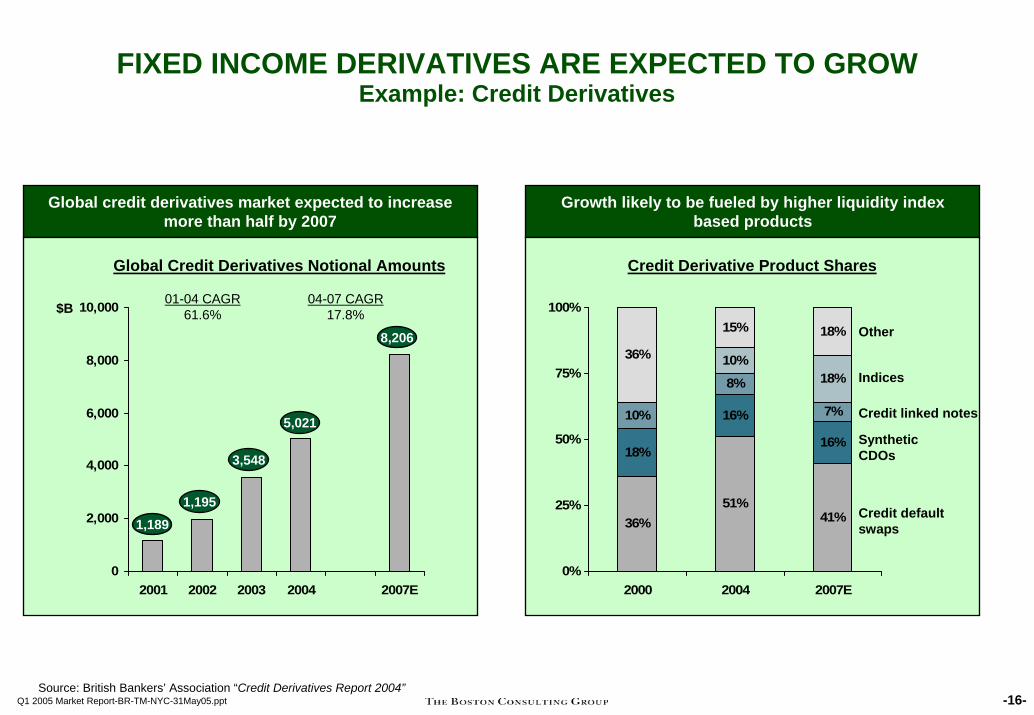
FIXED INCOME DERIVATIVES ARE EXPECTED TO GROWExample: Credit Derivatives
Global credit derivatives market expected to increase more than half by 2007
Growth likely to be fueled by higher liquidity index based products
Global Credit Derivatives Notional Amounts
-16-Q1 2005 Market Report-BR-TM-NYC-31May05.pptSource: British Bankers’ Association “Credit Derivatives Report 2004”
0
2,000
4,000
6,000
8,000
10,000
2001 2002 2003 2004 2007E
$B
36%51%
41%
18%
16%
16%
10%
8%
7%
10%18%
36%
15% 18%
0%
25%
50%
75%
100%
2000 2004 2007E
Credit default swaps
Synthetic CDOs
Credit linked notes
Indices
Other
Credit Derivative Product Shares
01-04 CAGR61.6%
04-07 CAGR17.8%
1,1891,195
3,548
5,021
8,206
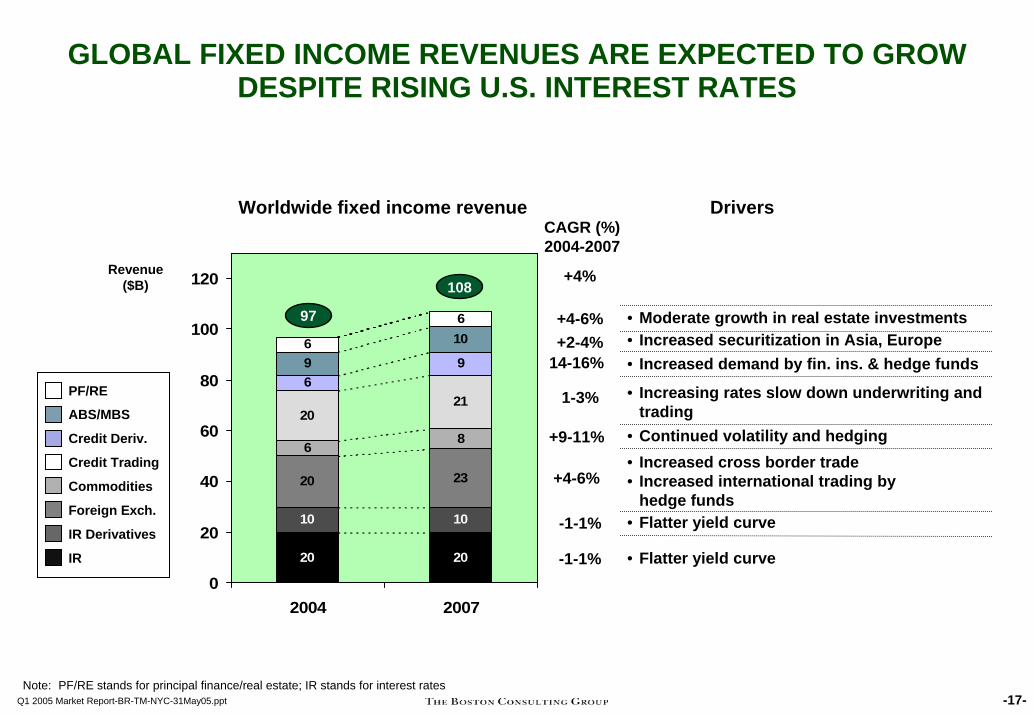
GLOBAL FIXED INCOME REVENUES ARE EXPECTED TO GROW DESPITE RISING U.S. INTEREST RATES
20 20
10 10
20 23
68
2021
699
106
6
0
20
40
60
80
100
120
2004 2007
CAGR (%)2004-2007
-1-1%
-1-1%
14-16%
1-3%
+4-6%
Worldwide fixed income revenue
Revenue ($B)
IR
IR Derivatives
Foreign Exch.
Commodities
Credit Trading
Credit Deriv.
ABS/MBS
PF/RE
Drivers
• Flatter yield curve
• Flatter yield curve
• Increased cross border trade• Increased international trading by
hedge funds
• Continued volatility and hedging
• Moderate growth in real estate investments• Increased securitization in Asia, Europe+2-4%
• Increasing rates slow down underwriting and trading
• Increased demand by fin. ins. & hedge funds
97
108
+9-11%
+4-6%
+4%
-17-Q1 2005 Market Report-BR-TM-NYC-31May05.pptNote: PF/RE stands for principal finance/real estate; IR stands for interest rates

Market Review
Corporate Finance and Advisory
-18-Q1 2005 Market Report-BR-TM-NYC-31May05.ppt

UNDERWRITING AND ADVISORY DEAL VOLUMES STARTED SUBDUED IN THE FIRST QUARTER 2005
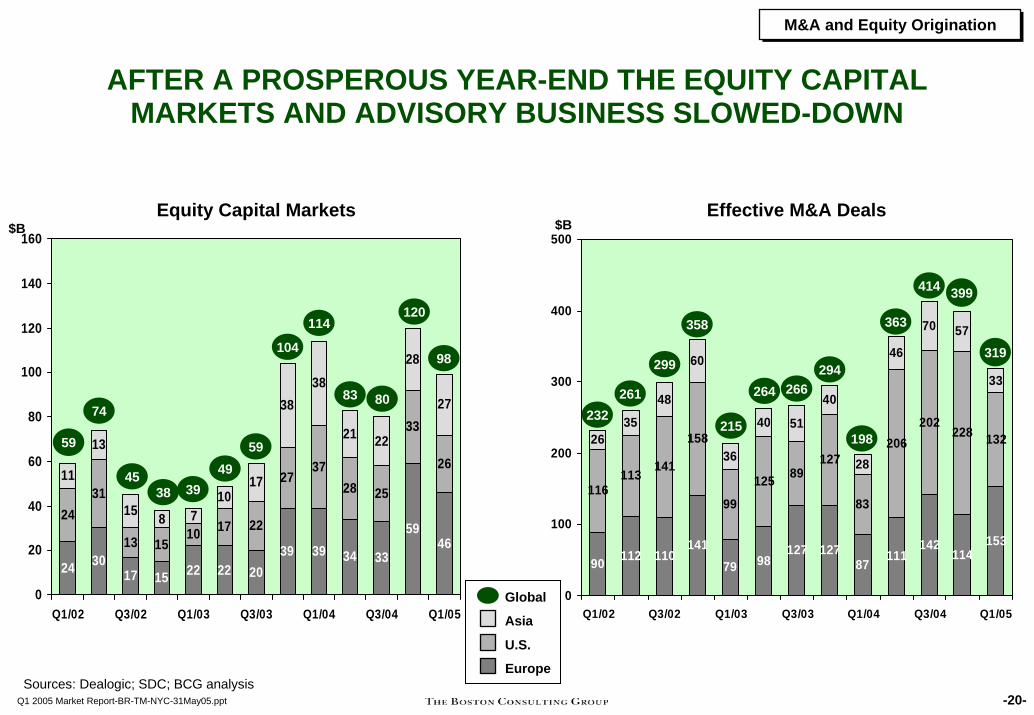
Despite a 20 percent slowdown in global M&A in the first quarter 2005, momentum returned to the European market
• European M&A market grew by 34 percent compared to year-end 2004. The volume and business appears well-diversified across sectors and countries
The first quarter in equity underwriting is typically the weakest, but prospects for equity issuance are healthy
• Cautious stock markets led to a weak start in Europe and the U.S. Markets rose four percent in Europe and declined by three percent in the U.S.
• Privatizations will constitute a large proportion of the potential IPO pipeline
While overall global bond underwriting volumes grew a steady 7 percent in the first quarter, corporate bond issuance in the U.S. decreased by 27 percent
• Fixed income continues to play an important role for investment banks, as big revenue contributions come from fixed income
• While bond spreads have fallen sharply since 2002 and are near their lowest levels in years, they could widen further due to rising interest rates
-19-Q1 2005 Market Report-BR-TM-NYC-31May05.ppt
M&A and Equity OriginationM&A and Equity Origination
AFTER A PROSPEROUS YEAR-END THE EQUITY CAPITAL MARKETS AND ADVISORY BUSINESS SLOWED-DOWN
Equity Capital Markets
-20-Q1 2005 Market Report-BR-TM-NYC-31May05.ppt
Sources: Dealogic; SDC; BCG analysis
24 3017 15 22 22 20
39 39 34 33
5946
2431
13 1510 17 22
2737
28 25
33
2611
13
15 8 710
17
3838
21 22
28
27
0
20
40
60
80
100
120
140
160
Q1/02 Q3/02 Q1/03 Q3/03 Q1/04 Q3/04 Q1/05
$B
59
74
Global
U.S.
Asia
Europe
4538 39
Effective M&A Deals
90 112 110141
79 98127 127
87111
142114
153
116113 141
158
99
125 89127
83
206202
228 1322635
48
60
36
40 51
40
28
46
70 57
33
0
100
200
300
400
500
Q1/02 Q3/02 Q1/03 Q3/03 Q1/04 Q3/04 Q1/05
$B
232
358
261
299
215
49
266
59
264
104294
114
198
83
363
80
414
120399
98 319
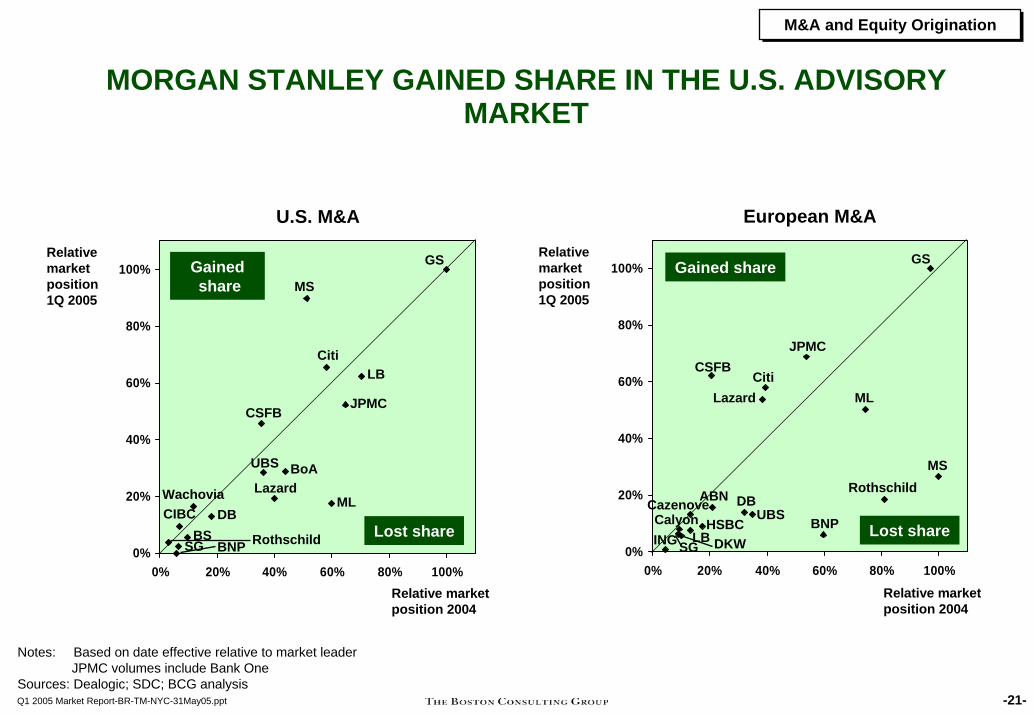
M&A and Equity OriginationM&A and Equity Origination
MORGAN STANLEY GAINED SHARE IN THE U.S. ADVISORY MARKET
-21-Q1 2005 Market Report-BR-TM-NYC-31May05.ppt
0%
20%
40%
60%
80%
100%
0% 20% 40% 60% 80% 100%0%
20%
40%
60%
80%
100%
0% 20% 40% 60% 80% 100%
Gainedshare
Lost share
Gained share
Lost share
European M&A
BNP
ABN
GS
DB
CSFB
ML
MS
Citi
JPMC
UBS
Lazard
Calyon
Relative marketposition 2004
LBHSBC
U.S. M&A
Relativemarketposition1Q 2005
Relativemarketposition1Q 2005
GS
DB
CSFB
ML
MS
CitiLB
UBS
BS
Lazard
Relative marketposition 2004
BNP
BoA
JPMC
RothschildSG
WachoviaCIBC
RothschildCazenove
SG DKWING
Notes: Based on date effective relative to market leaderJPMC volumes include Bank One
Sources: Dealogic; SDC; BCG analysis
M&A and Equity OriginationM&A and Equity Origination
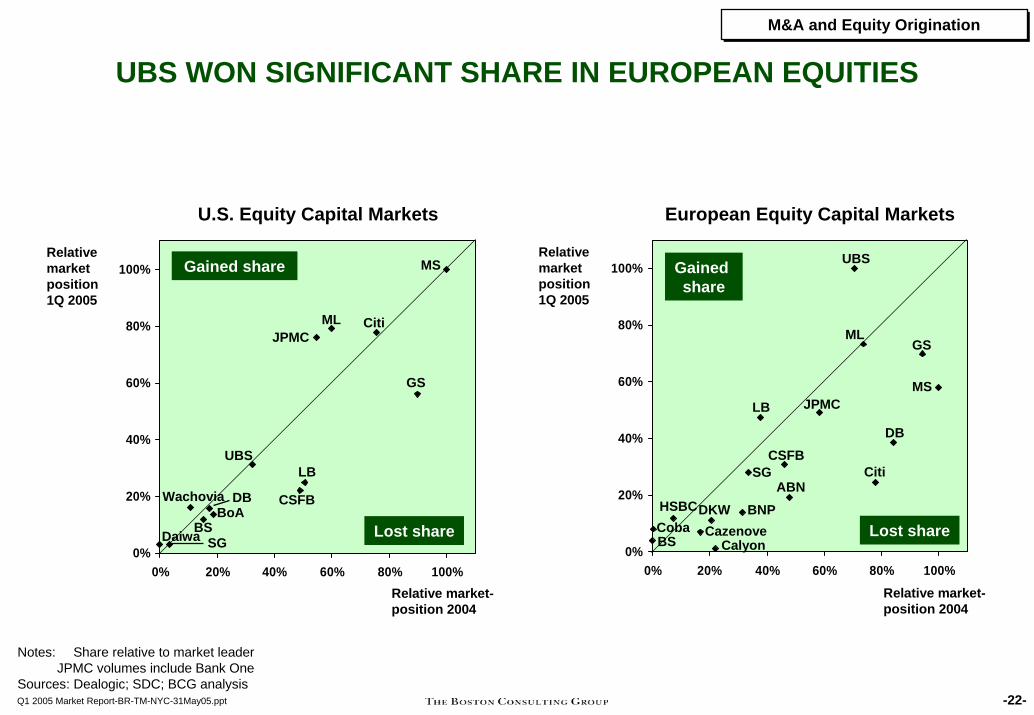
UBS WON SIGNIFICANT SHARE IN EUROPEAN EQUITIES
-22-Q1 2005 Market Report-BR-TM-NYC-31May05.ppt
0%
20%
40%
60%
80%
100%
0% 20% 40% 60% 80% 100%0%
20%
40%
60%
80%
100%
0% 20% 40% 60% 80% 100%
Gained share
Lost share
U.S. Equity Capital Markets
Gained share
Lost share
European Equity Capital Markets
ABNHSBC
GS
DBCSFB
ML
MS
Citi
JPMC
UBS
BNPCazenove
Relative market-position 2004
CobaDKW
LB
SG
Relativemarketposition1Q 2005
Relativemarketposition1Q 2005
GS
DB CSFB
ML
MS
CitiJPMC
LBUBS
BSBoA
Relative market-position 2004
Wachovia
Notes: Share relative to market leaderJPMC volumes include Bank One
Sources: Dealogic; SDC; BCG analysis
SGDaiwa CalyonBS
Fixed-Income OriginationFixed-Income Origination
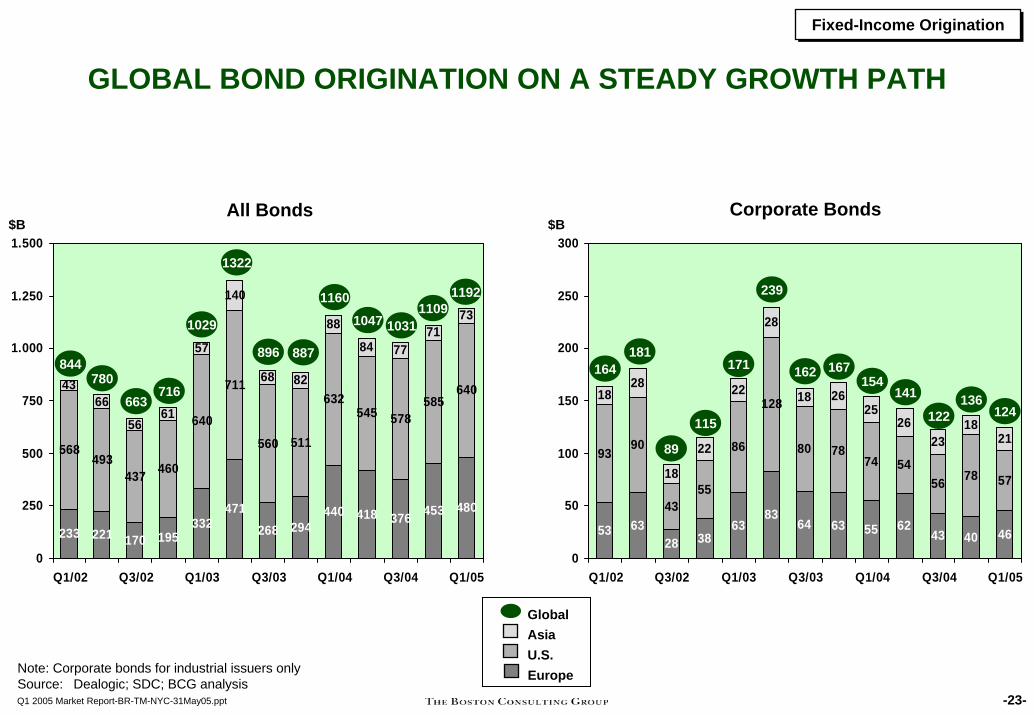
GLOBAL BOND ORIGINATION ON A STEADY GROWTH PATH
Corporate BondsAll Bonds
233 221 170 195332
471268 294
440 418 376 453 480
568493
437 460
640
711
560 511
632545 578
58564043
66
5661
57
140
68 82
88
84 7771
73
0
250
500
750
1.000
1.250
1.500
Q1/02 Q3/02 Q1/03 Q3/03 Q1/04 Q3/04 Q1/05
$B
844780
663716
1029
53 6328 38
6383
64 63 55 6243 40 46
9390
4355
86
128
80 7874 54
56 78 57
1828
18
22
22
28
18 2625
2623
1821
0
50
100
150
200
250
300
Q1/02 Q3/02 Q1/03 Q3/03 Q1/04 Q3/04 Q1/05
$B
164181
89
115
171
1322
239
887167
896162
1160
154
1047
141
1031
122
1109
136
1192
124
Global
U.S.Asia
Europe
-23-Q1 2005 Market Report-BR-TM-NYC-31May05.ppt
Note: Corporate bonds for industrial issuers onlySource: Dealogic; SDC; BCG analysis
Fixed-Income OriginationFixed-Income Origination
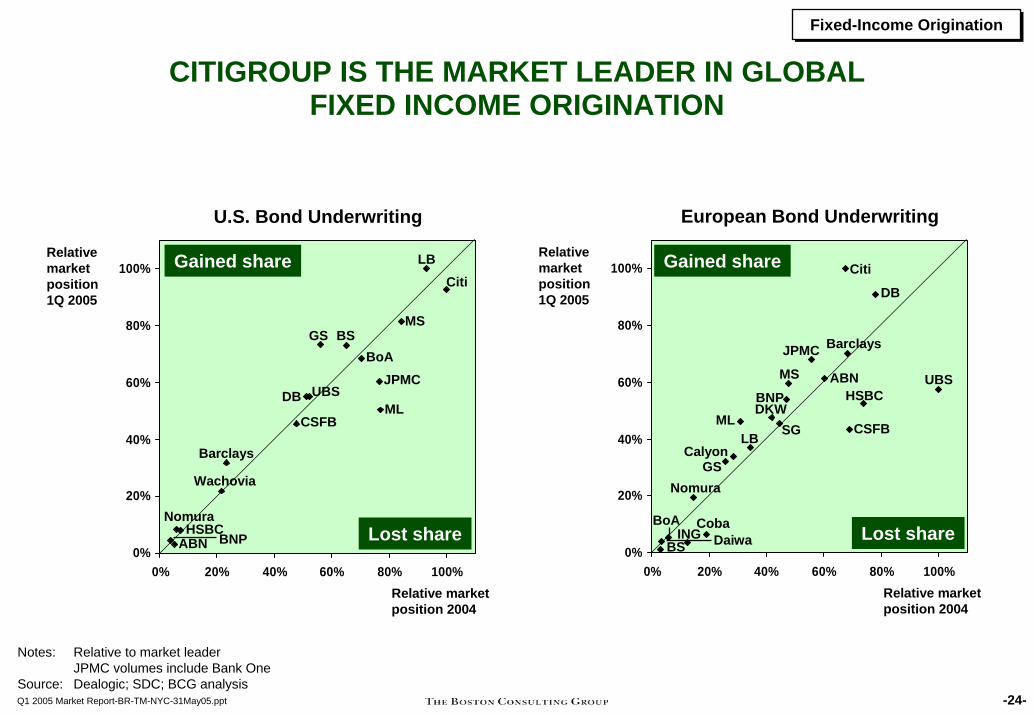
CITIGROUP IS THE MARKET LEADER IN GLOBAL FIXED INCOME ORIGINATION
European Bond Underwriting
0%
20%
40%
60%
80%
100%
0% 20% 40% 60% 80% 100%Relative marketposition 2004
BNPABN
U.S. Bond Underwriting
0%
20%
40%
60%
80%
100%
0% 20% 40% 60% 80% 100%Relative marketposition 2004
Relativemarketposition1Q 2005
Relativemarketposition1Q 2005
Gained share
Lost share
-24-Q1 2005 Market Report-BR-TM-NYC-31May05.ppt
Notes: Relative to market leaderJPMC volumes include Bank One
Source: Dealogic; SDC; BCG analysis
HSBC
SG
Barclays
Gained share
Lost share
DB
CSFB
ING
MS
Citi
DKW
JPMC
LB
UBS
BoA
GS
ML
Coba
Calyon
Nomura
BS
Barclays
GS
DB
CSFBML
MS
Citi
JPMC
LB
UBS
BS
Wachovia
BoA
NomuraBNP
HSBCABN Daiwa

Market Review
Fixed-Income Trading
-25-Q1 2005 Market Report-BR-TM-NYC-31May05.ppt
Fixed-Income TradingFixed-Income Trading
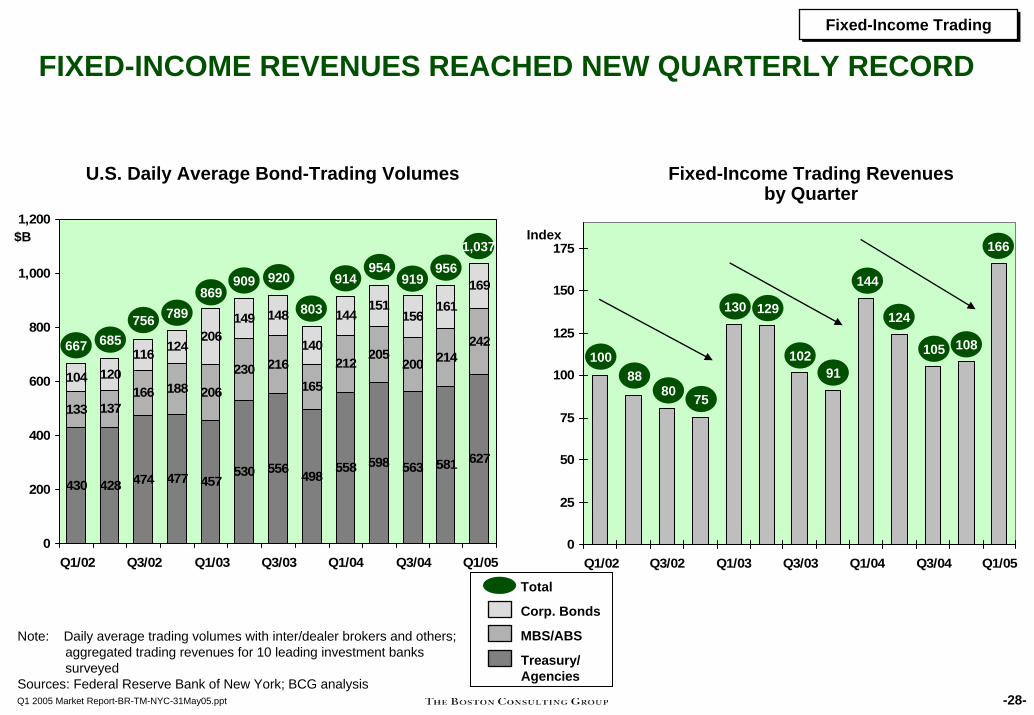
FIXED-INCOME SALES & TRADING REVENUES REACHED QUARTERLY RECORD
Investment banks achieved record revenues in fixed-income trading• Revenues grew by 54% compared to the previous quarter and were still 15% higher
compared to the strong first quarter 2004
U.S. bond trading activity reached a new quarterly high• Average daily bond-trading volumes rose above the $1 trillion for the first time in the
first quarter 2005
Results were especially impressive as they were achieved despite a flattening U.S. yield curve• The spread between two-year and ten-year U.S. treasuries has declined by 54 percent
since year-end 2004 and is currently at merely 50 basis points
Risk efficiency has improved considerably• Banks earned 46 percent more revenue at a given level of value-at-risk than in 4th
quarter 2004
Even if debt related business slows down in the subsequent quarters, 2005 will most likely be a very good year in fixed income
-26-Q1 2005 Market Report-BR-TM-NYC-31May05.ppt

Fixed-Income TradingFixed-Income Trading
YIELD CURVE FLATTENED
10-year/2-year U.S. Treasury Yield Spread
-100
-50
0
50
100
150
200
250
300
Jan 97 Jan 98 Jan 99 Dez 99 Dez 00 Dez 01 Dez 02 Dez 03 Dez 04
Basispoints
-27-Q1 2005 Market Report-BR-TM-NYC-31May05.pptSource: Bloomberg
Fixed-Income TradingFixed-Income Trading
FIXED-INCOME REVENUES REACHED NEW QUARTERLY RECORD
U.S. Daily Average Bond-Trading Volumes Fixed-Income Trading Revenues by Quarter
0
25
50
75
100
125
150
175
Q1/02 Q3/02 Q1/03 Q3/03 Q1/04 Q3/04 Q1/05
10088
102
130
80 75
129
91
Index
144
124
430 428 474 477 457530 556 498 558 598 563 581 627
133 137166 188 206
230 216165
212 205200 214
242
104 120116 124
206149 148
140
144151
156161
169
0
200
400
600
800
1,000
1,200
Q1/02 Q3/02 Q1/03 Q3/03 Q1/04 Q3/04 Q1/05
$B
667 685756 789
869909
803
920 914954
919
105
956
108
1661,037
Total
MBS/ABS
Corp. Bonds
Treasury/Agencies
-28-Q1 2005 Market Report-BR-TM-NYC-31May05.ppt
Note: Daily average trading volumes with inter/dealer brokers and others; aggregated trading revenues for 10 leading investment bankssurveyed
Sources: Federal Reserve Bank of New York; BCG analysis
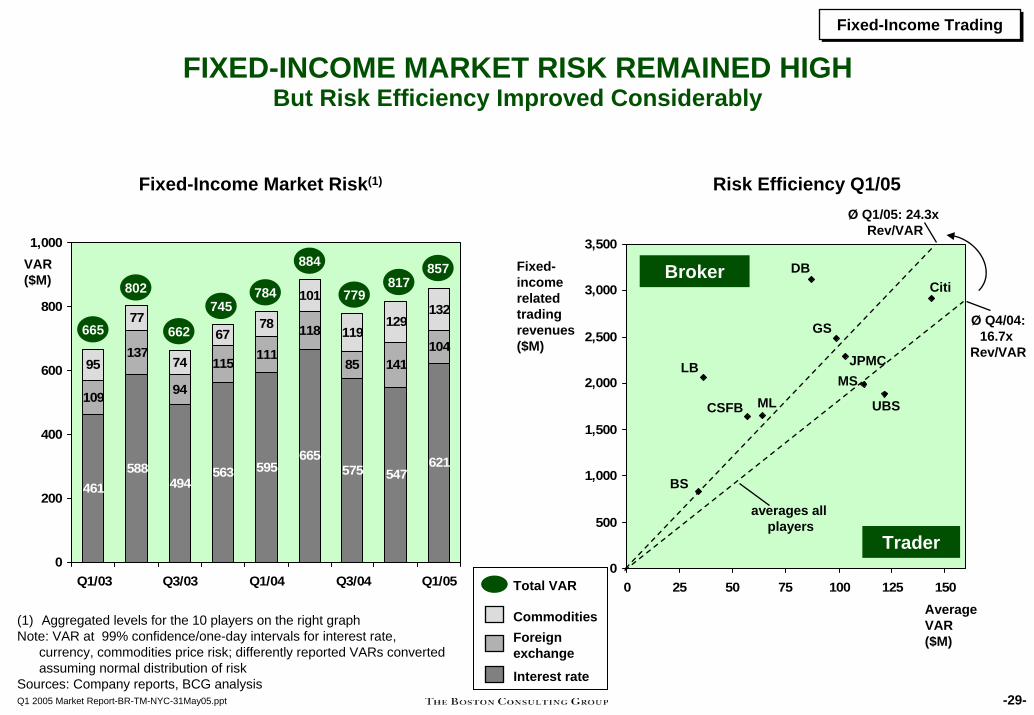
Fixed-Income TradingFixed-Income Trading
FIXED-INCOME MARKET RISK REMAINED HIGHBut Risk Efficiency Improved Considerably
Fixed-Income Market Risk(1) Risk Efficiency Q1/05
461563 595
665575 547
621
115 111
118
85 141104
7767
78
101
119129
132
494588
109 94
1377495
0
200
400
600
800
1,000
Q1/03 Q3/03 Q1/04 Q3/04 Q1/05
665
Total VAR
Foreign exchange
Commodities
Interest rate
802
VAR($M)
Fixed-incomerelatedtradingrevenues($M)
0
500
1,000
1,500
2,000
2,500
3,000
3,500
0 25 50 75 100 125 150AverageVAR ($M)
Broker
Trader
JPMCMS
DBCiti
GS
UBSCSFB ML
LB
BS
Ø Q4/04:16.7x
Rev/VAR662
745784
884
Ø Q1/05: 24.3x Rev/VAR
averages all players
779817
857
-29-Q1 2005 Market Report-BR-TM-NYC-31May05.ppt
(1) Aggregated levels for the 10 players on the right graph Note: VAR at 99% confidence/one-day intervals for interest rate,
currency, commodities price risk; differently reported VARs convertedassuming normal distribution of risk
Sources: Company reports, BCG analysis

Market Review
Equity Trading
-30-Q1 2005 Market Report-BR-TM-NYC-31May05.ppt
Equity TradingEquity Trading
EQUITIES TRADING REVENUES RECOVERED SIGNIFICANTLY
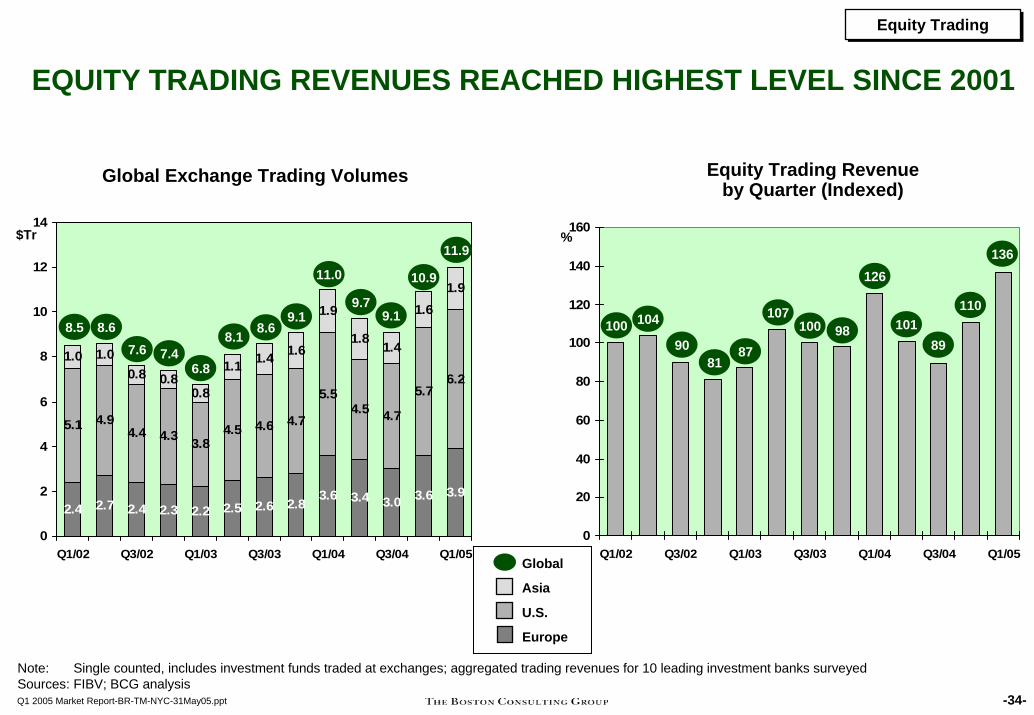
Global investment banks had best quarter in equity trading since 2001• Aggregated trading revenues increased by 24 percent from fourth quarter 2004 and
finished 36 percent higher than in the beginning of 2002
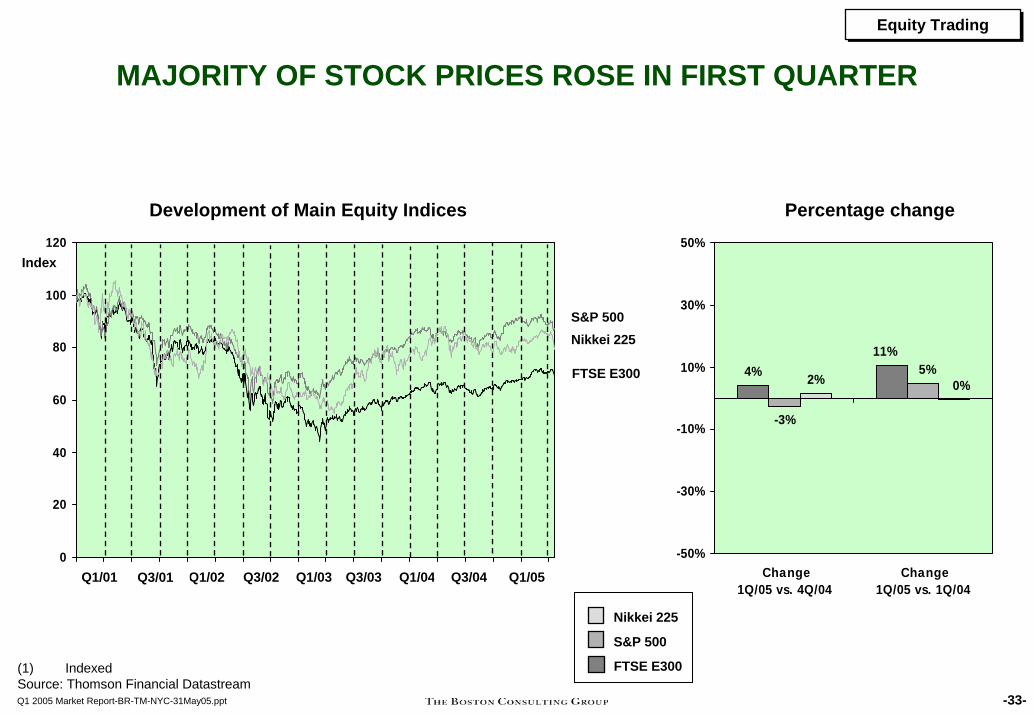
Several reasons were responsible for the upswing• Stock prices rose broadly except in the U.S.: European share prices increased by four
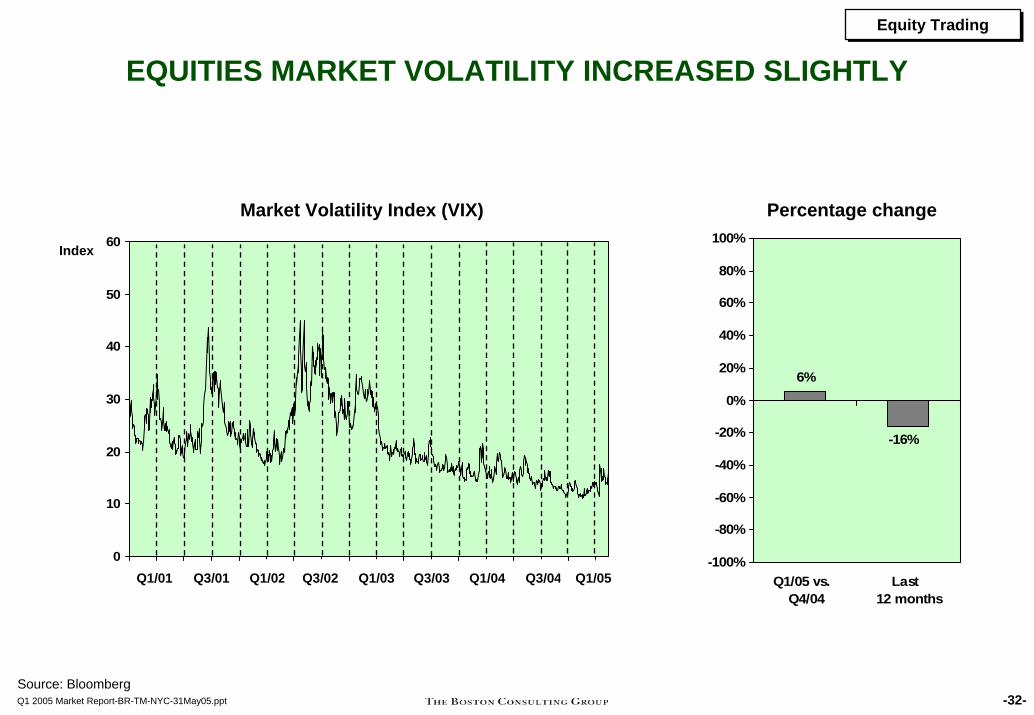
percent while the Japanese Nikkei was up two percent for the quarter• Market volatility increased for the first time since the first quarter 2003. The VIX (Volatility
Index) increased six percent from end of 2004• Continued growth in prime brokerage revenues from servicing hedge funds
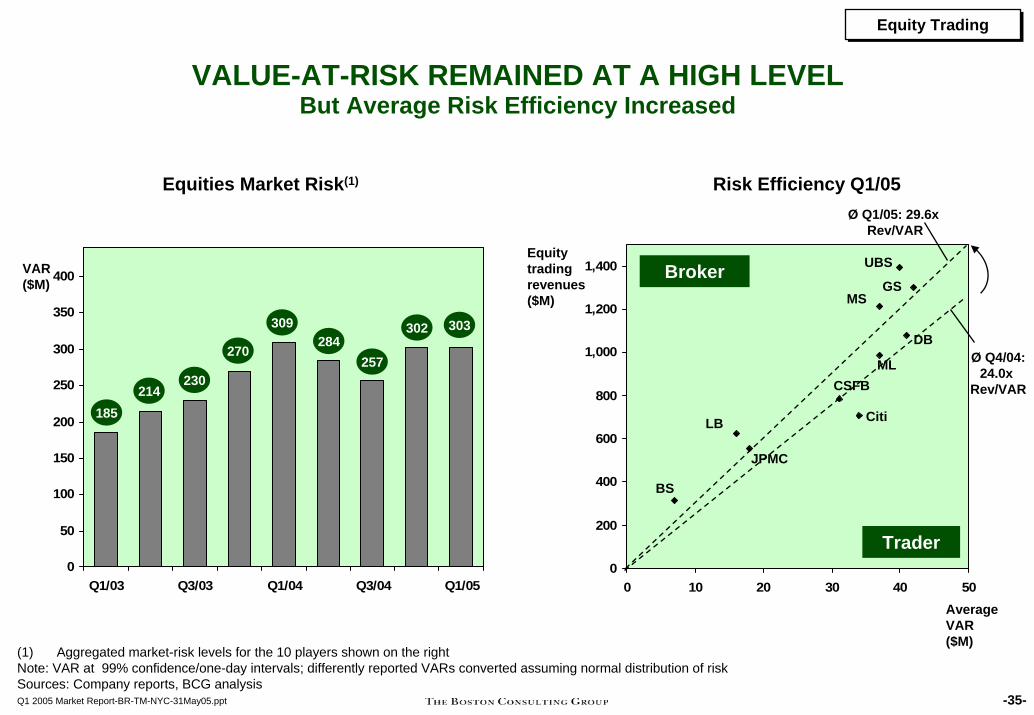
Equity market risks remained at a high level while banks improved their risk efficiency considerably• Aggregated value-at-risk of the leading banks remained unchanged• However, banks earned $5.60 more per dollar value-at-risk
-31-Q1 2005 Market Report-BR-TM-NYC-31May05.ppt
Equity TradingEquity Trading
EQUITIES MARKET VOLATILITY INCREASED SLIGHTLY
Market Volatility Index (VIX) Percentage change
6%
-16%
-100%
-80%
-60%
-40%
-20%
0%
20%
40%
60%
80%
100%
Q1/05 vs. Q4/04
Last 12 months
0
10
20
30
40
50
60
J A J O J A J O J A J O J A J O J A
-32-Q1 2005 Market Report-BR-TM-NYC-31May05.ppt
Source: Bloomberg
Q1/02Q3/01 Q3/02 Q1/03Q1/01 Q3/03 Q1/04 Q3/04 Q1/05
Index
Equity TradingEquity Trading
MAJORITY OF STOCK PRICES ROSE IN FIRST QUARTER
Development of Main Equity Indices Percentage change
0
20
40
60
80
100
120
J A J O J A J O J A J O J A J O J A
Nikkei 225 S&P 500
FTSE E300
Q1/02
-33-Q1 2005 Market Report-BR-TM-NYC-31May05.ppt
(1) Indexed Source: Thomson Financial Datastream
S&P 500
Nikkei 225
FTSE E300
Q3/01 Q3/02 Q1/03Q1/01 Q3/03
Index
Q1/04
4%
-3%
2%
11%5%
0%
-50%
-30%
-10%
10%
30%
50%
Change 1Q/05 vs. 4Q/04
Change 1Q/05 vs. 1Q/04
Q3/04 Q1/05
Equity TradingEquity Trading
EQUITY TRADING REVENUES REACHED HIGHEST LEVEL SINCE 2001
Global Exchange Trading Volumes
Global
U.S.
Asia
Europe
2.4 2.7 2.4 2.3 2.2 2.5 2.6 2.8 3.6 3.4 3.0 3.6 3.9
5.1 4.94.4 4.3 3.8
4.5 4.6 4.7
5.54.5 4.7
5.76.2
1.0 1.00.8 0.8
0.8
1.1 1.4 1.6
1.9
1.8 1.4
1.61.9
0
2
4
6
8
10
12
14
Q1/02 Q3/02 Q1/03 Q3/03 Q1/04 Q3/04 Q1/05
$Tr
8.5 8.67.6 7.4
6.8
8.1 8.69.1
Equity Trading Revenue by Quarter (Indexed)
0
20
40
60
80
100
120
140
160
Q1/02 Q3/02 Q1/03 Q3/03 Q1/04 Q3/04 Q1/05
%
100 104
9081
87
107100 98
126
101
11.0
9.79.1
89
10.9
110
11.9 136
-34-Q1 2005 Market Report-BR-TM-NYC-31May05.ppt
Note: Single counted, includes investment funds traded at exchanges; aggregated trading revenues for 10 leading investment banks surveyedSources: FIBV; BCG analysis
Equity TradingEquity Trading
VALUE-AT-RISK REMAINED AT A HIGH LEVELBut Average Risk Efficiency Increased
Equities Market Risk(1) Risk Efficiency Q1/05
-35-Q1 2005 Market Report-BR-TM-NYC-31May05.ppt
0
50
100
150
200
250
300
350
400
Q1/03 Q3/03 Q1/04 Q3/04 Q1/05
302
185214
VAR($M)
(1) Aggregated market-risk levels for the 10 players shown on the rightNote: VAR at 99% confidence/one-day intervals; differently reported VARs converted assuming normal distribution of riskSources: Company reports, BCG analysis
Equitytradingrevenues($M)
0
200
400
600
800
1,000
1,200
1,400
0 10 20 30 40 50AverageVAR ($M)
Broker
Trader
JPMC
MS
DB
Citi
GS
UBS
CSFBML
LB
BS
Ø Q4/04:24.0x
Rev/VAR
Ø Q1/05: 29.6x Rev/VAR
230
270
309284
303
257

Data Definitions
-36-Q1 2005 Market Report-BR-TM-NYC-31May05.ppt
DATA DEFINITION OVERVIEW
Regional deal allocation is based on issuer’s country (parent issuer’s country, where available). M&A deals are allocated by target nation
Dealogic was used for European capital market data, Thomson SDC for U.S. and Asian data
Relative market shares are based on bookrunner league tables
Equity origination data include common stock IPOs and secondary issues only
Bond origination data contain all convertible and nonconvertible bonds, including ABS, MBS, municipals, agency, and corporate bonds
Corporate bonds are limited to industrials and utilities excluding financial services issuers
The second quarter ended on February 28, 2005, for Bear Stearns, Goldman Sachs, Lehman Brothers, and Morgan Stanley; all others ended on March 31, 2005
-37-Q1 2005 Market Report-BR-TM-NYC-31May05.ppt