Embed Size (px)
Citation preview

INVESTMENT DECISIONS: INFLUENCE OF AN
INTERNET STOCK MESSAGE BOARD
Letitia Meier Pleis, BBA, MBA
Dissertation Prepared for the Degree of
DOCTOR OF PHILOSOPHY
UNIVERSITY OF NORTH TEXAS
December 2007
APPROVED: Alan G. Mayper, Major Professor Robert Pavur, Minor Professor Neil Wilner, Committee Member David Molina, Committee Member Barbara Merino, Interim Chair of the
Department of Accounting O. Finley Graves, Interim Dean of the College
of Business Sandra L. Terrell, Dean of the Robert B.
Toulouse School of Graduate Studies

Pleis, Letitia Meier, Investment decisions: Influence of an Internet stock
message board. Doctor of Philosophy (Accounting), December 2007, 90 pp., 15 tables,
7 figures, references, 81 titles.
The Internet provides many sources of financial information that investors can
use to help with investment decisions and in interpreting companies’ accounting
information. One source of information is Internet stock message boards such as those
at Yahoo! Finance. This source allows for anonymous postings and information
exchange. Despite the possibility of the information being incorrect many individuals
visit these message boards. The purpose of this study is to investigate Internet stock
message boards and address the primary question: From an individual investor
perspective, do message boards, which contain accounting information, influence
investment decisions?
The question is addressed using psychology rumor literature and attitude
theories. Message board postings are a type of rumor, since not all the information is
verified and is usually intended to persuade a belief or influence a decision. Further, the
messages may influence an investor by causing a change in attitude about the
investment.
Using an experiment, message board influence on an investment decision and
attitude was tested. The results indicated that individuals that received negative
message board postings did have a significantly higher change in investment amount as
compared to a control group that did not receive any message postings. The positive
message board group and the control group were not significantly different in their
amount of investment change. The results of the study also show that message board

postings influenced attitude, those that received negative (positive) postings had a
negative (positive) attitude about the investment. It was further found that those with a
negative (positive) attitude decreased (increased) their investment. Finally, contrary to
expectations, investment experience did not lead to an individual being less influenced
by message board postings.
This study contributes to the accounting literature by investigating an additional
source of Internet financial reporting that may or may not contain correct information.
The SEC is concerned over the manipulative opportunities that are available within
these message boards and many investors are exploring these new sources of
information instead of relying on traditional accounting information. This study finds that
negative postings have an influence on investment decision and possibly should be
investigated as manipulative techniques.

Copyright 2007
by
Letitia Meier Pleis
ii

TABLE OF CONTENTS
Page
LIST OF TABLES............................................................................................................ v LIST OF FIGURES..........................................................................................................vi Chapters
1. INTRODUCTION ....................................................................................... 1 1.1 Motivation........................................................................................ 1 1.2 Message Boards ............................................................................. 4
2. THEORY AND HYPOTHESIS DEVELOPMENT ..................................... 14
2.1 Rumors ......................................................................................... 14 2.2 Attitude Theory.............................................................................. 18
2.2.1 The Recipient ..................................................................... 22 2.2.2 The Message...................................................................... 23 2.2.3 The Source......................................................................... 24
3. METHODOLOGY .................................................................................... 25
3.1 Participants ................................................................................... 25 3.2 Task .............................................................................................. 26 3.3 The Message Board...................................................................... 29 3.4 Measurement and Design ............................................................. 30
4. RESULTS ................................................................................................ 38
4.1 Descriptive Statistics ..................................................................... 38 4.2 Results for Hypotheses Test ......................................................... 43
4.2.1 Message Board Effects and Investing Experience (H1 and H3) ..................................................................................... 43
4.2.2 Attitude (H2a and H2b)....................................................... 44 4.3 Additional Analysis ........................................................................ 46
4.3.1 Analysis of the Impact of Message Boards on Investment Decisions............................................................................ 46
4.3.2 Additional Analysis of Experience ...................................... 48
iii

4.3.3 Additional Analysis of Information Characteristics and Source Variables ................................................................ 51
4.3.4 Additional Variable Analysis ............................................... 53 5. CONCLUSIONS ...................................................................................... 55
APPENDIX: EXPERIMENTAL MATERIALS ................................................................. 59 REFERENCES.............................................................................................................. 85
iv

LIST OF TABLES
Page
1. Task Steps.......................................................................................................... 27
2. Information Used to Determine Lottery Entries................................................... 29
3. Design and Measurement .................................................................................. 31
4. Regression Variables ......................................................................................... 32
5. Factor Analysis to Determine Adjectives that load on the Evaluative Dimension (with Good/Bad) for Use in the Attitude Score Calculation ................................. 36
6. Descriptive Statistics for Variables ..................................................................... 38
7. Equation 1 Results ............................................................................................. 44
8. Equation 2 Results ............................................................................................. 45
9. Equation 3 Results ............................................................................................. 45
10. Investment Change for Each Subject Group ...................................................... 47
11. Perception of Tone of Messages Received ........................................................ 48
12. Moderating Effects of Experience on Regression Equations.............................. 50
13. Investment Change by Experience Level ........................................................... 51
14. Information and Source Characteristics.............................................................. 52
15. Additional Variable Analysis – Significant Differences........................................ 54
v

LIST OF FIGURES
Page
1. Message Posting 1 ............................................................................................... 7
2. Tax Rate Postings ................................................................................................ 9
3. Message Posting Insinuating Misleading Earnings............................................. 10
4. Model.................................................................................................................. 15
5. Example of a Semantic Differential Scale........................................................... 36
6. Time Taken to Make First Investment Decision.................................................. 42
7. Time to Complete Entire Task ............................................................................ 43
vi

CHAPTER 1 INTRODUCTION
1.1 Motivation
The number of individual investors participating in the stock market continues to
increase and these individual investors frequently use the Internet to obtain information
(NYSE 2000; Hodge and Pronk 2006). There is a variety of information available. A
company may provide on its Website audited and unaudited information. Some of the
information is financial other can be management’s discussion of the future. Other
information comes from third parties such as analysts, news media, and other investors.
When it comes to Wall Street, information is essential (Koenig 1985). With the Internet,
millions of people can interact daily and pass along information, factual and rumor
based, including financial accounting information (Rosnow 2001; Wysocki 1999a;
Hodge and Pronk 2006). One source of exchanging information is Internet stock market
message boards such as those on the Yahoo!® Finance website (Yahoo, Inc,
http://finance.yahoo.com). The message boards appear to be a popular medium for
communication, Yahoo! Finance had approximately 12 million registered users in Feb
2006 (Yahoo upgrades finance portal 2006). Despite this large number of users, limited
research has actually been done involving the message boards. Prior research
primarily concerns the message board relationship with and impact on the overall stock
market. On an individual investor perspective, do these message boards that contain
accounting information influence investment decisions?
Most accounting studies on Internet financial information have been limited to
evaluating the information on the corporate Website. Studies have evaluated what
information investors’ review on the corporate Website (Hodge and Pronk 2006),
1

investor search strategies (Hodge et al. 2004), what information companies provide to
investors on their Websites (Debreceny et al. 2002; Marston and Polei 2004; Osgood
1965), why they provide it (Ettredge et al. 2002; Ashbaugh et al. 1999), and the effects
that the format of the information may have (Hodge 2001; Debreceny and Gray 2001;
Dull et al. 2003). The corporate Website has been of concern because of the potential
to provide a mix of information. For instance, on a corporate Website it is possible to
link audited and unaudited information together. Hodge (2001) provided evidence that
the links could lead investors to blend the information causing them to misclassify
audited and unaudited information and assess the unaudited information as more
credible than individuals with the same information in hard copy format.
Even when the information is clearly distinguishable, perceived reliability of
audited financial information has decreased possibly due to perceived decrease in
auditor independence (Hodge 2003). In other studies it has been found that some
investors do not understand or even review financial statements (Rose 2001; Rose et
al. 2004; Epstein and Pava 1994). Epstein and Pava (1994) found that nearly 30% of
investors in the United States lack the knowledge necessary to understand basic
financial statements and Hawkins and Hawkins (1986) found that over 50% of investors
simply skim over annual reports without performing any formal analysis. Typically, more
experienced investors have better ability to understand and use unfiltered (e.g. SEC
filings) financial information where as less experienced investors are more likely to seek
help in interpreting the information (Elliott et al. 2006; Hodge and Pronk 2006). To help
with either understanding financial reports/earnings information or to gather information
that does not come from the company, investors may seek information from third parties
2

such as analysts, financial news media, and/or message boards. There can be various
degrees of accuracy within third party information. Some of the information is factual
and verifiable, other information is rumor based only. The rumor-based information can
make an impact on the market. A financial rumor can spread quickly on the Internet,
gain believability, and other sources such as television and print news media have the
opportunity to present the item as news (Kimmel 2004b). Message boards tend to be a
good source for beginning rumors (Wysocki 1999b). One instance of using Yahoo!
Finance message board to start a rumor took place in April 1999. An employee of
PairGain Technologies, Inc posted on the message board that PairGain had agreed to
be acquired and even included a link to a (fake) news announcement. PairGain’s stock
increased more than 30% (Leinweber and Madhavan 2001; Kimmel 2004a)
Through an experiment I test the influence of a set of message board postings on
MBA students’ (proxy for non-professional investor) investment decisions. I compare
the participants’ investment decisions before and after being exposed to message board
postings. The changes in investment for the participants receiving the message board
postings are compared to a control group that made an investment decision based on
only the financial data before and after completing a simple distraction task. I
hypothesize that the groups receiving message board postings will change their
investment decisions more than the control group. A fourth group received a mixed set
of message board postings (equal negative/positive) as a second control group for
additional analysis. The results indicate that when the absolute amount of change is
combined for the positive and negative message board groups there is not a significant
difference from the control group, but when separated there is a large significant
3

difference between the amounts of investment change between the control group and
the negative message board group.
I further investigate this influence by examining the participants’ attitudes. It is
believed that an attitude towards a decision (action) will be related to that decision
(action). I measure the participant’s perceived attitude toward the investment decision
and compare this to their actual investment decision. Positive (negative) attitudes
resulted in increased (decreased) investments in the company. Further it appears that
the message boards are influencing participants’ perceived attitudes since participants
receiving positive postings had more positive attitudes than those receiving negative
postings.
I also look at the mitigating relationship that investment experience has on the
potential of message boards to influence investment decisions. Previous research
indicates that investors with more experience should be less influenced by message
board postings. The results in this study do not support the assertion that experience
mitigates the relationship. Those with experience and received the negative message
board postings changed their investment significantly more than those in the control
group. For those with no experience there was not a significant difference in investment
change between those that received the negative message board postings and those in
the control group.
1.2 Message Boards
Internet stock message boards are bulletin board type sites on the World Wide
Web where individuals post messages discussing publicly traded companies (Wysocki
1999a). Typically, anyone can read these messages and, after registering with the site
4

host, post messages. A popular host of these message boards is Yahoo! Finance
where most publicly traded companies have a message board dedicated to them.
Stock message boards started on Yahoo! Finance in 1997. Message postings include
questions, factual statements, opinions, rumors, and irrelevant nonsense. Message
boards may run off topic at times, but research has found that most messages posted
around earnings announcement time relate to the discussion of the company and their
earnings (Das et al. 2005; Wysocki 1999a). These postings include questions,
clarifications, and posters’ predictions for the future. During 1999-2001, more than 35
million messages were posted on the Yahoo! stock message boards (Antweiler and
Frank 2004a).
The popular press claims that Internet stock message boards can move markets.
Most research has been limited to finding a relationship between message posting and
returns or volatility (Wysocki 2000, 1999a; Antweiler and Frank 2004b, 2004a). Some
research has tried to use computational linguistics to classify a message as overall
positive or negative while others have used software to parse off the posters claim of
buy, strong buy, sell, or strong sell (Das and Chen 2001; Das et al. 2005; Antweiler and
Frank 2004b). More recent research has been focused on categorizing and measuring
message posting sentiment and analyzing how the use of different methods of
measuring sentiment lead to different research findings (Gu et al. 2006; Zhang and
Swanson 2007a, 2007b).
The Securities Exchange Commission (SEC) is concerned how these message
postings affect individual investors. The Internet fraud section of the SEC has paid
special attention to the activity on message boards, issuing enforcement actions when
5

they believe someone has intentionally posted materially false or misleading
statement(s). The idea is that an individual would buy a low value stock, “pump it up” by
posting positive statements, then once others have bought the stock and raised the
price, the individual would sell all of his/her holdings (Langevoort 2002). In a recent
press release from the Department of Justice (2006), an individual, Faisal Zafar, is
being investigated for an alleged “pump and dump” scheme by both the Federal Bureau
of Investigation and the Securities and Exchange Commission. The complaint claims
that Zafar and others working with him purchased the securities of over 20 publicly
traded companies and then proceed to post false messages on various financial
message boards using a variety of aliases. The messages contained positive
information and the stock prices of the companies increased significantly (Morrison and
Vogel 1998). Zafar and his co-conspirators then sold their shares and received over
$870,000 in profits. This scenario is most common with low priced stocks where a low
amount of new investment could cause the price to shift up significantly. More evidence
of the ability to manipulate low priced stocks comes from two papers looking at stock
touting email spam (Frieder and Zittrain 2007; Bohme and Holz 2006). In both cases
there was a relationship found between the spam email and trading activity.
Recent events have caused the SEC to also look at both positive and negative
message board posting. The CEO of Whole Foods under a pseudonym posted various
negative messages about Wild Oats on the Wild Oats message board and various
messages touting Whole Foods on the Whole Foods message board. Later Whole
Foods proceeded to negotiate a merger between the two companies. These events
6

caused the SEC to probe into the ramifications of these particular postings and their
legality (Kesmodel and Wilke 2007; Scannell 2007).
For other stocks, short seller activity is of concern. “Short-sellers are investors
who sell borrowed stock, and subsequently close their positions by buying stock back at
a later time, using the purchased shares to extinguish the initial loan of the stock”
(Wysocki 1999a,7). Short sellers profit from a decrease in the stock price.
Wysocki (1999a) found that there was a relationship between posting volume
and short-seller activity, the amount of shares that were reported as being sold short for
the month by the firm. Potential evidence of short seller postings could include when a
company has just released great earnings news, but certain postings continue to be
negative. For instance figure 1, shows one posters response to Google, Inc beating
analyst earnings for their first quarter ended March 31, 20061.
Figure 1 -- Message Posting 1
ReChart says:OVEREXTENDED-NOTHING ELSE! by: valueplay_2000 Long-Term Sentiment: Strong Sell 04/21/06 12:45 pm Msg: 744625 of 744773 IT'LL COME OUT WITHIN WEEK OR TWO THAT THE NUMBERS SHOULD HAVE BEEN LOWER IN ALL REALITY IF ALL EXPENDITURES WERE TAKEN INTO [ACCOUNT]...27% TAX RATE IS WRONG AND 5.3 MILLION ADDITIONAL SHARES ISSUED LAST DAY OF QT 1 SHOULD HAVE BEEN INCLUDED TO BEGIN WITH ALSO ALL EXPENSES WERE NOT COUNTED & ARE BEING CARRIED FORWARD TO LATER QT'S...IT'S WRONG.
This particular post in figure 1 is responding to good news from Google in a negative
manner, trying to get individuals to sell their stock now. It is not known, but this could
represent an individual that sold the stock short and wants the stock price to decrease
1 Spelling corrections within quoted postings are placed in brackets [correct spelled word]
7

by disseminating negative information quickly in order to buy the stock back at a lower
price.
Many companies are concerned about message postings and are taking active
measures to address the issue (Bell 1998; Burns 2002). These posting may come from
employees of the company as well as any outsider. Sometimes these postings are
untrue (Burns 2002), other times postings can be very accurate warnings (Felton and
Kim 2002; Cast 2005). These postings and the potential for new postings often lead to
companies monitoring employee Internet use at work, monitoring message board
postings, and even lawsuits. There are some marketing experts and public relations
firms that urge their clients to respond to postings directly on the message boards,
though securities lawyers do warn of liability risk (Bell 1998). Carson and Felton (2004)
give an overview of message boards and offer suggestions to corporations dealing with
message board postings.
Message boards are still a relatively new source of information, but the number
of postings illustrates their popularity. Even then, the postings do not represent all the
participants involved with the message boards. The number of lurkers, participants that
only read the messages, on a message board is impossible to know since most
message board sites do not require registering before reading message postings
(Wysocki 1999a). There are multiple reasons that someone may come to a message
board including seeking more information, clarification, or anxiety relief; but are
investors’ decisions influenced by what is posted on the board. The SEC warns that
investors may be influenced negatively and have been taking legal action; companies
are beginning to make serious efforts to monitor and react; and the news media claims
8

that message postings can move markets (Antweiler and Frank 2004b). While the
general belief is that message board postings may influence individual investors, there
is a gap within the academic literature actually looking at this potential influence.
Within accounting, there is a need to consider these message boards as another
medium of Internet financial reporting. There can be distrust or confusion after an
earnings release that leads to posters on these message boards filling in the information
gaps. This information may be correct or incorrect; shared with good intentions or for
the purpose of manipulating other investors. For instance, when Google released its 4th
quarter earnings for 2005 they missed analyst estimates for earnings. One key
accounting issue posters for Google focused on was the tax rate. Figure 2 gives a few
examples that illustrate the different interpretation of the tax rate issue.
Figure 2 -- Tax Rate Postings
JUST tax rate issue/way way overdone by: sheepdog1220 (M/Texas) Long-Term Sentiment: Strong Buy 01/31/06 04:36 pm Msg: 551204 of 745969 rev's and earnings did not miss! Taxes just 10% higher-growth just as expected buy opp! Re: JUST tax rate issue/way way overdone by: quit_my_job_for_this 01/31/06 04:38 pm Msg: 551262 of 745987 If Uncle Sam is getting that money then Google and shareholders aren't. Stop trying to find excuses. This stock will be over $430 by end of by: khers69 Long-Term Sentiment: Strong Buy 01/31/06 04:38 pm Msg: 551277 of 745989 the week. It was all due to taxes. The analyst figured taxes at 26% and GOOG actually was charged 41% for the quarter. They probably even beat the number if the analyst do their numbers again. This stock will be in the $450 range by end of the week.
9

EPS is 1.44 using old tax rate by: matmik99 01/31/06 04:41 pm Msg: 551339 of 745993 Do the math, if you use a tax rate of 34% income goes up to 421,022. That comes up to an eps of 1.44. That's still a huge miss anyway you look at it. I don't own the stock to I have to interest in manipulating the data. Goog will be down big until they can provide the market with some good news Nice call on the tax rate by: rather_b_googling 01/31/06 04:42 pm Msg: 551399 of 745995 Google's tax rate was higher than expected by Wall Street, according to Reuters Estimates. At the tax rate initially forecast by Google, adjusted earnings would have been $1.81 per share, versus the consensus of $1.77
Then after the release of 1st quarter 2006 earnings, which showed Google
beating analyst earnings estimate, one poster began a discussion that insinuates that
the numbers in the earnings release were misleading, figure 3:
Figure 3 -- Message Posting Insinuating Misleading Earnings
HOW GOOG COOKED THE BOOK - DISECTED! by: jj2000426 Long-Term Sentiment: Strong Sell 04/21/06 02:11 am Msg: 742749 of 746033 One has to do due diligence and carefully analysis the GOOG earnings report, to draw the correct conclusion. If you do you will find out that all the media hype is actually a bag holder's trap. http://investor.google.com/releases/2006Q1.html The FACT is GOOG's real net income virtually STOPPED increase since last quarter. I will show you EXACTLY why. I am NOT going to [challenge] the legitimacy of any of the GOOG provided numbers, although there has already been plenty of people question how come GOOG's tax rate, at only 27%, is SO dramatically lower than last quarter. Still remember the CFO warned a couple of months ago that Q1 earnings growth will slow down since he expected HIGHER tax rate? How could the tax rate be so low, is GOOG doing tax [evasion] or what? Cooked the number? Comparing Q1,06 with Q4, 05: http://finance.yahoo.com/q/is?s=GOOG
10

What you see? Q4 contains a one time, none-recurring cost of $90M. To do a fair comparison and see the real figure how does GOOG's business grow, you need to take that one time item away for a fair comparison. Without that $90M, the numbers are: Q4, 05: adjusted (reported) Income before tax: 729,833 (639,833) Tax provision: 305,270 (267,625) Net Income: 424563 (372,208) Per Share: $1.44 Note the tax rate above is 42%. Now look at Q1,06. Pre-tax income is 810,618, but the tax is only 218,328. Tax rate only 27%. How could it be possible. Tax rate drop from 42% to 27% in just one quarter. Now let's presume GOOG did not have tax [evasion] and there is nothing illegal. They lucked out and so have higher income due to less taxation. This part of extra income from reduced tax, really does NOT reflect any real business growth, but merely reflect difference of tax law provisions. So let's make the comparison more fair, by calculating using the SAME tax rate. See what happens. Using the 42% tax rate of Q1, 05, the adjusted Q1,06 numbers are: Q1, 06 adjusted (reported) Income before tax: 810618 (no change) Tax provision: 340460 (218,327) Net Income: 470158 (592,291) Per share: $1.546 Now you see how the GOOG book was cooked. The reported net income goes up from 372,208 in Q4 up to 592,291 in Q1,06. It's [portrayed] as a huge increase in just one quarter. But the realities is the such "huge" increase is just an illusion, attributing to two things: 1. A one time charge of $90M in Q4 only 2. Considerable tax savings in Q1,06 Without that two factor, on a fair comparison, the real growth of net income is actually going from 424563 to 470157, an increase of less than 11%. If you calculate net income per share, due to stock dilution, it only increased from $1.44 to $1.546, an increase of merely 7.4% quarter over [quarter].
11

7.4% increase, that's the real figure how GOOG's business income is [improving]. The rest are just [aberrations]! Let's see how much are the [aberrations] are: 1.The $90M charge suppressed Q4 net income by $52.2, i.e., $0.18 per share. Hence give Q1,06 a $0.18 false increase when contrasted against Q4. 2.The tax rate change saved GOOG $122.133M in one time tax money, i.e., $0.40 per share. This tax difference boost GOOG net income by $0.40 per share, but it actually has NOTHING to do with business growth. It's just one time lucky tax money. The real business growth is only $0.11 per share, as stated above. GOOG bag holders, you have been SCAMMED into believing that GOOG had reported some very good business growth. It does NOT. The actual growth is rather very disappointing. Watch out below tomorrow, all your bag holders who bought on hypes without using your brain!
Significantly correct or not, these postings could influence another investor into making
an investment decision. The SEC is concerned over the manipulative opportunities that
are available within these message boards. From an accounting perspective as the
perceived usefulness, relevance or trust in traditional financial statements decreases,
investors may turn to new sources of information. Message boards are one possible
source of information. As a source of information there were postings warning of the
problems at Enron and HealthSouth with individuals posting what appears to convey
inside information (Felton and Kim 2002; Cast 2005). Understanding the potential
influence these messages have on investors may help the accounting profession
understand how different sources of information effect investors. It may also help
regulators evaluate how much focus they need to place on message boards.
While the message board postings in figures 1, 2, and 3 have some factual basis,
there are unconfirmed statements within each posting. For instance, different tax rates
12

would lead to different earnings amounts, but a claim of a company involved in tax
evasion or having “cooked books” are rumors. Including the factual information in the
message in figure 3 helps the plausibility of the story that the earnings reported are not
truthful and the stock will decline. The plausibility of the rumor message could influence
an individual’s investment decision. The message tries to create a negative feeling
towards Google’s stock. This negative feeling could in turn influence an investor’s
attitude toward the stock and investment decision.
13

14
CHAPTER 2 THEORY AND HYPOTHESIS DEVELOPMENT
Figure 4 illustrates the proposed model for this study. There are two basic paths
that will be discussed that could lead to the message boards influencing an investor’s
decision. The first path focuses on the characteristics of the message alone. This path
investigates the message as a rumor. In other research, rumors have been found to
influence individuals’ decisions and judgments. The second path follows the attitude
literature which combines stimuli (message, message source, and recipient) that impact
cognitive and affective responses which form the individual’s attitude about the
investment decision. The attitude then influences the investment decision.
2.1 Rumors
Rumors have long been a part of society. While the word “rumor” often has a
negative connotation2, rumors may contain factual based information or be completely
false, but the main component is that the information is unconfirmed. More specifically
rumor has been defined “as information that: (a) is not verified, (b) is of local or current
interest or importance, and (c) is intended primarily for belief” (DiFonzo and Bordia
1997, 330).
2 Article titles such as “When those nasty rumors start breeding on the Web, you’ve got to move fast” (Crawford 1999) illustrate the negative connotation surrounding rumors.

Figure 4 -- Model
Recipient
Cognitive Process
Attitude Investment Decision
Affective Process
Message (RUMOR)
Source
15

Despite not being able to confirm rumor information, the content has influenced
individuals (DiFonzo and Bordia 1997; Koenig 1985; Rosnow 2001). Rumors and stock
manipulation date back to the 1600’s and the Amsterdam market. At the time there
were only two main stocks – Dutch East India Company and the Dutch West India
Company – and since trading revolved around speculating what was on the boats,
rumors were spread generously through the Amsterdam coffee houses (Leinweber and
Madhavan 2001).
Rumors can cause damage and are a concern within the financial community
(Kimmel 2004b). Even when individuals admitted that they know that rumors were from
perceived non-credible sources, the rumor information affected the investors’ stock
trading activity (DiFonzo and Bordia 1997). In their study, DiFonzo and Bordia (1997)
had subjects participate in an investment simulation study. Subjects were either
presented only with stock price, stock price and Wall Street Journal® (WSJ) news
stories (Dow Jones and Company, Inc, http://www.dj.com), stock price and published
rumors from WSJ Heard on the Street® column (Dow Jones and Company, Inc,
http://www.dj.com), or stock price and rumors from brother-in-law Harry. Despite
subjects rating the credibility of the rumors as lower than the news stories, trading
based on the information was similar and less regressive than those that received no
additional information. While the DiFonzo and Bordia (1997) study investigated rumors
from known sources (i.e. brother-in-law or WSJ), the message board postings that will
be investigated in the current study come from unknown sources.
An investment decision is essentially a prediction of future events. Uncertainty
clouds these future events. Investors search out information in an attempt to lessen this
16

uncertainty or feel more confident in their decisions. Earnings announcement time can
be a unique situation. The earnings announcement can confirm or disconfirm past
expectations reducing some uncertainty, but new future expectations are created that
lead to new uncertainties. Management may give their opinion about what the current
earnings mean for the future and what future events they believe will happen, leaving
the financial community to interpret and generate expectations for the future.
One reason that rumors may have influential power is that they create a plausible
story to explain situations that may be confusing, uncertain or ambiguous (DiFonzo and
Bordia 1997). The earnings announcement time is an uncertain and ambiguous
situation and some message board postings attempt to create a plausible story. The
story may have malicious intentions, may be a warning of bad things to come, foretelling
of a positive future, or simply an attempt to clarify confusing financial data. A message
perceived to be plausible has been found to be positively associated with
persuasiveness of the message (Kadous et al. 2005). Believability, which is related to
plausibility, is also an important characteristic of a persuasive message (DiFonzo and
Bordia 1997).
Stock message board postings increase and become more focused on the
company and their earnings during earnings announcement periods ((Das et al. 2005).
During earnings announcement periods message board discussions can turn into in-
depth debates about the company’s financial reports (Wysocki 2000). Like rumors,
message board postings can vary in content but they are mostly not verified (contain
future predications), relevant to the current interest (the company for which the
message board is about), and the posting is usually intended for belief by others.
17

Message board postings are generally considered to be financial rumors (Bell 1998;
Kimmel 2004b). In a time of uncertainty, rumors are often believed and influence
actions (Rosnow 2001). Relating message board postings as a type of rumor leads to
my primary hypothesis (in alternative form):
H1: Subjects given positive or negative message board postings will change their investment in the company more than those that do not receive any postings.
In this study, I believe that message board postings will influence some subjects
because they are financial rumors. If the rumor has a positive implication then the
subject will increase their amount of investment in the stock versus what they would
invest before reading the postings and if the rumor has a negative implication then the
subject will decrease their amount of investment in the stock compared to what they
would invest before reading the postings. Combined the absolute value of the amount
of change in investment amount should be more for those receiving positive or negative
message postings than those not receiving message postings.
2.2 Attitude Theory
Traditional attitude studies have typically been grounded within social psychology
focusing on attitudes toward social polices, ideologies and social groups (Eagly and
Chaiken 1993). Attitudes, though, can be directed toward anything that can be
evaluated. All that is required is there be stimuli that evoke an evaluative response
(Eagly and Chaiken 1993; Oskamp and Schultz 2005). Attitudes can be long-term or
just a short-term response towards a particular situation/object. Within an investment
decision, an individual evaluates the information available, forms a positive, negative or
neutral attitude about the future of the investment, and then makes an investment
decision.
18

The stimuli within a communication context, such as message board postings,
that evoke an evaluative response, can include the source of information, the message,
and the receiver of the message (McGuire 1985)3. Source characteristics including
perceived credibility and similarity, sources that are more similar to ourselves, can
influence evaluative responses and investment decisions. It has been found that
characteristics of the message including plausibility, believability, and vividness, have
influence on decision-making and attitude change (DiFonzo and Bordia 1997; Oskamp
and Schultz 2005; Borgida and Nisbett 1977; Nisbett and Ross 1980). Additionally,
attributes of the individual receiving the message play an important role in attitude
formation and decision-making. Previous experience can influence what information an
individual pays attention to and uses to make an investment decision4 (Bouwman 1982,
1984; Bouwman et al. 1987; Frederickson and Miller 2004; Maines and McDaniel 2000;
Bonner and Lewis 1990; Libby and Luft 1993; Libby 1995).
Many attitude studies (Breckler 1984; Eagly et al. 1994; Huskinson and Haddock
2004) have viewed attitudes as including multiple components: affective, cognitive, and
behavioral. The stimuli discussed above impact these different components. While
research has studied all three components most recent research has focused on the
affective and cognitive components only (Verplanken et al. 1998). For this study, I will
focus on these two components.
The affective component is based on feelings (how do I feel about object,
situation, etc) and the cognitive component is based on thoughts or beliefs (Trafimow
3 McGuire (1985) discussed five input communication variables: source, message, receiver, channel, and target. Only the source, message, and receiver are relevant for this study. 4 Source characteristics, message characteristics, and recipient characteristics are discussed in further detail in later sections
19

and Sheeran 2004). Individuals can differ on the make up of their attitudes, while some
attitudes are more affective other attitudes are more cognitive (Haddock and Huskinson
2004). It has be argued, though, that in general attitudes have a strong affective or
emotional component (Perloff 1993). Message boards provide information that
influences the cognitive component and emotional appeals that influence the affective
component.
An investment decision involves making an evaluative judgment on the future of
the stock. The stimuli provide the information and the means to process that
information in order to form an attitude toward the investment. Reviews of relevant
research literature have concluded that attitudes and behavior actions (e.g. actually
choosing to invest or not to invest) are generally related (Oskamp and Schultz 2005).
Kraus (1995, 58)reported after a meta-analysis of 88 studies, “attitudes significantly and
substantially predict future behavior (mean r = 0.38; combined p < 0.000000000001).”
Given the results of previous studies, investors’ perceived attitudes towards an
investment should be related to their investment decision. Thus the following
hypotheses:
H2a: Subjects with positive (negative) attitudes will increase/buy (decrease/sell) their current investment.
Since message board postings provide information to influence cognitive
responses and emotional appeals to influence affective responses and there is a
cognitive and affective component to attitude, the postings should influence the
investor’s perceived attitude. Thus the following hypotheses:
H2b: Subjects that receive positive postings will have a more positive attitude towards the investment than those that receive negative postings.
20

This influence on attitude may not be noticeable by the investor and they may not
be able to explain their reasoning for an investment decision that is based on attitude
towards the investment. Fredrickson and Miller (2004) and Elliott (2006) studied the
effects of pro forma earnings statements on individuals’ stock price assessment. They
found that the pro forma information influenced nonprofessional investors’ decisions; the
group with pro forma statements assessed a higher stock price than the group without
the pro forma statements. The group with the pro forma statements did not use a
higher earnings number to reach the higher stock price, but did perceive the earnings
announcement as more favorable. This affective response led the nonprofessional
investors to convert either the earnings or other performance metric into a higher stock
price. The researchers concluded that these results were due to unintentional cognitive
effects rather than nonprofessionals relying on the informativeness of the pro forma
earnings. The presence of information, even if irrelevant, can have influential ability on
human information processing (Tversky and Kahneman 1974). Further, emphasizing
information (making salient or prominent) can have unintentional effects on information
process despite the relevance of that information (Elliott 2006; Taylor and Fiske 1978;
Taylor and Thompson 1982). For instance, when the message board postings focus on
one feature, such as the tax rate, to emphasize as the reason that the stock should be
bought or sold could unintentionally effect an investor’s decision.
Even if message board information is irrelevant, it may still influence information
processing by generating an affective response, which helps make up the individual’s
attitude. The feelings and emotions that are generated may appear very relevant to the
decision (Schwarz and Clore 1988) and influence the investment decision.
21

2.2.1 The Recipient Experience can have a significant impact on an individual’s attitude (Eagly and
Chaiken 1993). An individual with experience in making investment decisions may rely
on past experiences and his/her own financial knowledge to evaluate a new investment
decision rather than seeking help with interpreting the company’s financial reports from
outside sources such as stock message boards (Hodge and Pronk 2005). While most
studies treat non-professional investors as one group, Elliott, Hodge and Jackson
(2006) investigated differences based on investing experience. They found that in their
sample less experienced investors earned lower returns when the use of unfiltered (e.g.
Securities Exchange Commission [SEC] filings) information increased relative to the use
on filtered information (e.g. analyst reports), but more experienced investors earned
higher returns when the relative use of unfiltered information increased. They
concluded that inexperienced investors should be careful when relying on their own
skills to interpret financial information, but more experienced investors are successful
using their own financial knowledge.
Prior research in auditing has shown that individuals with task-specific
experience tend to be better in interpreting and using relevant information (Bonner and
Lewis 1990; Libby and Luft 1993; Libby 1995). Prior investing context research
suggests that more experienced investors predefine their information needs, focus their
information search on acquiring relevant information, and are better at integrating
financial statement information than less experienced investors (Bouwman 1982, 1984;
Bouwman et al. 1987; Frederickson and Miller 2004; Hodge et al. 2004). While
inexperienced investors may lack the skills and knowledge necessary to interpret
22

financial statements and may rely on outside sources such as message boards for help,
experienced investors are better at acquiring and using relevant information and should
not be as influenced by the rumor type information contained within message board
postings. This leads to the following hypothesis:
H3: As investing experience increases the positive association of message board postings and amount of change in subject’s investment in the company decreases. 2.2.2 The Message
The message, or the presentation of the information, is an important stimulus in
forming an attitude about the situation. Characteristics of the message can influence
the attitude, affective/cognitive responses and decision. In addition to plausibility and
believability discussed in the rumor section, vividness is an important characteristic.
Certain types of vivid messages also tend to increase persuasion (Perloff 1993).
A vivid message that depicts the situation can exert a stronger impact on an individual’s
decision than a general, but abstract type of information (Oskamp and Schultz 2005;
Borgida and Nisbett 1977; Nisbett and Ross 1980). For example, when deciding to buy
a car, information on one vivid specific instance of the car’s failure may have more
impact than an overall general rating of the car as published by Consumer Reports®
magazine (Consumers Union, https://www.consumersunion.org). The vivid story may
become more salient and thus easier to recall when trying to make a decision (Tversky
and Kahneman 1974).
In this study, message characteristics will be controlled by measuring
participants’ perception of the plausibility, believability, and vividness of the message
board postings.
23

2.2.3 The Source The source of the message is also a stimulus that affects the attitude of the
individual. Typically, it is believed that a more credible source should have more
persuasive power (Oskamp and Schultz 2005), but studies have shown times when it
appears that individuals ignore source credibility (Joyce and Biddle 1981). Many
research studies define source credibility as being composed of trustworthiness and
expertise, with expertise related to the situation (e.g. investment expertise within an
investing context) (Oskamp and Schultz 2005). The source of a message board posting
is usually unknown except for a screen name. Any information on the expertise of the
poster will be either self reported or based on prior experiences with that poster.
Without knowing the source, source credibility should be low for message board
postings.5 In this study, participants will be asked their perception of the credibility of
the source of the information.
5 Similarity is another characteristic of a source. People tend to like and be influenced more by individuals that they consider more similar to themselves (Oskamp and Schultz 2005; Perloff 1993). Similarity is most likely to influence attitudes when the similarity is relevant to the message (e.g. involving the message board, perceived similarity comes from both poster and reader of the message being individual investors not both poster and reader being dog owners) (Perloff 1993). Message boards are often referred to as on-line communities and discussion groups for individuals with similar interests. Stock message boards are no different. Das, Martinez-Jerez, and Tufano (2005) interviewed one regular stock message board poster who referred to other posters as “colleagues.” There is a common interest for those participating on a stock message board even though member identities are unknown. Participants’ perception of similarity of the source of the information will also be asked.
24

CHAPTER 3 METHODOLOGY
It is posited that message board postings will influence investor decisions. It is
further posited that the influence comes from an attitude change possibly due to the
affective appeal of message board postings. Investing experience may mitigate this
relationship between message board postings and an investor’s decision. These
assertions are tested empirically by the following experiment.
3.1 Participants
One hundred ten MBA students were used for this study. While the focus is on
nonprofessional investors, it is difficult to recruit and use members directly from this
group. Many accounting studies have used MBA students as a proxy for
nonprofessional investors (Bloomfield et al. 2003; Elliott 2006; Bloomfield and Libby
1996; Hodge et al. 2004). Libby, et al (2002) suggested the use of MBA students when
the research question allows and Elliott, Hodge, and Pronk (2007) empirically tested the
reasonableness of using certain MBA students as a proxy and found it to be a “valid
methodological choice.”
The students come from multiple universities. Permission to talk to students was
requested from program directors and professors teaching MBA classes at these
universities. Students were asked to voluntarily participate in the experiment either on
there own time in a lab setting (n=35) or through the Internet (n=75). The students were
made up of 43 females and 67 males, averaged 4.24 years of investing experience
(40% with more than 3 years experience), and had taken 2.24 accounting courses and
1.87 finance classes.
25

3.2 Task
Table 1 illustrates the experimental procedures. Subjects were randomly
assigned to one of four treatment groups and presented access to materials through a
computer task. Each subject was directed to a Website to view financial information
from a company which they were told they currently have an investment in. After
reviewing the financial information, subjects in each group were asked to make an
investment decision. Each subject was asked to increase, decrease, or maintain their
current investment, in increments of 100 shares. After each subject made their
investment decision, each subject was asked a series of semantic differential questions
to determine their perceived attitude about the investment. Next subjects in the control
group were asked to complete an unrelated task and the message board groups were
asked to complete the same unrelated task and review some message board postings
related to the company. The message board groups were separated into a group that
received messages that had an overall negative tone, a second group that received
messages that had an overall positive tone, and a third group that received a mixed set
of messages6. The messages in the mixed group had an equal weighting of negative
and positive toned messages. This mixed message group acts as a second form of
control group in order to make additional comparisons. After completing this step,
subjects in all groups had the opportunity to review the original financial information
again before being asked to make the investment decision one more time. After they
6 In a separate experiment messages were tested to determine participants’ perception of degree of positive or negative tone. Subjects were asked to evaluate the tone in terms of the messages relation to the financial information in the quarterly press release. Each negative message had a matching positive message; the degree of negative or positive was evaluated to be similar. In addition, subjects in the final experiment were asked a manipulation check question as to their perception of the overall tone of the message board. Results are reported under additional analysis in the results section.
26

made their investment decision, the computer program moved to a questionnaire. At
this point subjects were not able to go back and access any previous material. The
questionnaire was used to asses the subject’s perceived attitude towards investing in
the company, perceived source credibility and similarity, perceived information
plausibility, believability, and vividness, and the subject’s investment experience. The
questionnaire was also used to gather related basic demographic information and
perform related manipulation checks. After completing the questionnaire, the computer
program allowed for automatic storing of the responses and the subjects were
presented a Website that confirmed their submissions and thanked them for their
participation.
Table 1 - Task Steps
Group: No Message Board
Postings
Positive Message
Board Postings
Negative Message Postings
Mixed Message Postings
Step 1 Given Financial Data Step 2 Make Investment Decision Step 3 Investment Attitude Measurement Step 4 Distraction Task – General Investment Questions Step 5 Go to Step 6 Given
Positive Message
Board Postings
Given Negative Message Board
Postings
Given Mixed Message Board
Postings
Step 6 Opportunity to Review Financial Information Again Step 7 Make Second Investment Decision Step 8 Attitude Questionnaire
Step 9 Perception Questions
Step 10 Demographic Questions For motivation subjects were entered into a lottery for a chance at winning one of
ten $75 gift cards. The number of entries into the lottery was based on their
27

performance and effort as compared to the other participants. Performance was based
on the profitability of the participant’s final investment decision. The participant had a
choice to buy up to 400 more shares, hold current position, or sell up to all 400 shares
they currently own. The value not invested in the company was invested in a low risk
government security and all investments were sold at the end of six months. Since the
financial information is adapted from a real company the profitability of the investment
was based on the price of the investment six months from the date of the information
presented. Effort was based on their answers during the distraction task (a series of
investment questions with right and wrong answers) and the time they spent on the
investment decision. Subjects received a maximum of 5 entries and a minimum of 1 for
participating. Table 2 presents information related to the lottery.
28

Table 2 – Information Used to Determine Lottery Entries
Investment Decision 1 (amount of
stock to purchase or
sell)
Investment Decision 2 (amount of
stock to purchase
or sell)
Number of Investment Questions Answered Correctly
Total Time Spent on
the Complete
Task (minutes)
Time Spent Making
Investment Decision 1 (minutes)
#of Additional
Entries Beyond the Guaranteed
Entry Average 95.45 48.18 7.7 0:24 0:07 2.56 Median 200 100 8 0:23 0:05 3 Min -400 -400 3 0:07 0:00 1 Max 400 400 10 1:03 0:48 4 Ranking of Investment Decision Choices and Number of Subjects Choosing Each Choice
Investment
Options
Final Profitability
Rank
# of subjects choosing option for
Decision 1
# of subjects choosing option for
Decision 2 Sell 400 9 8 12 Sell 300 8 3 5 Sell 200 7 10 10 Sell 100 6 4 4 Hold 1 17 23 Buy 100 2 9 9 Buy 200 3 32 24 Buy 300 4 11 9 Buy 400 5 16 14
The most profitable investment decision would be to hold the current position, least profitable would be to sell all 400 shares.
3.3 The Message Board
The message board used in this experiment is adapted from messages actually
posted on a company’s message board on Yahoo!® Finance website (Yahoo, Inc,
http://finance.yahoo.com). Messages in the positive group were matched with the
messages in the negative group to create a relative balance in the degree of positive
and negative. While the normal message board would require a user to click on a
message to read it and have the ability to read thousands of messages posted since
1997, for experimental purposes this message board was a sample list of eight postings
that was presented in a date order on the screen. While I could not force a subject to
29

30
actually read the messages I did eliminated the need to click on messages because this
study is not concerned with information search strategy, just whether the postings can
influence decisions. In an attempt to encourage the participants to read the messages
they were not able to continue to the next screen until one minute had expired.
3.4 Measurement and Design
Table 3 illustrates the measurement and design of the analysis and indicates the
independent variables, dependent variables, control variables. Table 3 also indicates
the tests that were used for each of the hypotheses. Table 4 describes the components
of the variables and how each is operationalized.

Table 3 - Design and Measurement Hypothesis Independent Variables Dependent
Variables Covariates Test
H1: Subjects given positive or negative message board postings will change their investment in the company more than those that do not receive any postings
Information type (positive or negative message board present or not)
Absolute Change in investment decision
Information characteristics, Source characteristics, Expertise
Regression Equation (1) β1 > 0 (assuming interaction β3 is not significant)
H2a: Subjects with positive (negative) attitudes will increase/buy (decrease/sell) their current investment
Attitude Score
Investment Decision
Information characteristics, Source characteristics, Expertise
Regression Equation (2) β1 > 0 (assuming interaction β3 is not significant)
H2b: Subjects that receive positive postings will have a more positive attitude towards the investment than those that receive negative postings
Information type (positive versus negative message boards only)
Attitude Score
Information characteristics, Source characteristics, Expertise
Regression Equation (3) β1 > 0 (assuming interaction β3 is not significant)
H3: As investing experience increases the positive association of message board postings and amount of change in subjects investment in the company decreases
Investment experience X Information type (positive or negative message board present or not)
Absolute Change in investment decision
Information characteristics, Source characteristics
Regression Equation (1) β3 < 0
31

Table 4 – Regression Variables
Variable Type Components Measurement/Manipulation Presences of positive or negative message board postings MB
Independent Variable Dummy variable equal to one (zero) if the positive or negative message board postings are present
Subjects were randomly placed into one of the four groups
Type of message board MB+
Independent Variable Dummy variable equal to one (zero) if the message board is positive (negative)
Subjects were randomly placed into one of four groups
Perceived attitude toward the investment Att
Independent Variable
Attitude Score Subjects answered a series of semantic differential type questions that was used to create an attitude score.7
Perceived attitude toward the investment Att
Dependent Variable Attitude Score Subjects answered a series of semantic differential type questions that was used to create an attitude score.
Investing experience EXP
Independent Variable Years investing, self report of level of experience
Subjects were asked the number of years of investing experience and their experience level.8
Table continued on next page
7 Semantic differential and attitude score is discussed in more detail within the text 8 Years investing experience and self reported level of experience were combined to create EXP (Cronbach Alpha = .817). Level of experience was on a 7 point scale, 1=none and 7 = High. To add years investing experience, actual reported years were placed into seven categories: 0 years = 1, 1-2 years = 2, 3-4 years = 3, 5-6 years = 4, 7-8 years = 5, 9-10 years = 6 and greater than 10 years = 7. This allowed for EXP to range from 2 (no investing experience) to 14 (high investing experience).
32

Table 4 continued Variable Type Components Measurement/Manipulation Source Characteristics Cred
Control Variable Credibility Subjects were asked their perception of source credibility on a 7-point semantic differential type scale9
Information Characteristics IChar
Control Variable Plausibility, Believability, Vividness10
Subjects were asked their perception of information plausibility, believability, and vividness on a 7-point semantic differential type scale11
Investment decision InvestDec
Dependent Variable The amount the subjected decides to invest or sell in company
Subjects were told that they have a current investment in the company of 100 shares and that they can either increase, decrease or hold their current investment in increments of 100 shares
Absolute Change in investment decision
hgabsInvestC
Dependent Variable Amount of change between initial investment and second investment decision stated in absolute value
The investment decision was made before and after presentation of the message board postings. Change in investment decision is the comparison of the two decisions.12
9 The endpoints were credible/non-credible. A score of 1 is the perception that the source is very credible. A score of 4 is neutral on credibility. A score of 7 is the perception that the source is very non-credible 10 A factor analysis was conducted to verify the three items (plausibility, believability and vividness) loaded on one factor. The factor analysis resulted in one factor Eignvalue 1.869, explaining 62.285% of variance 11 The endpoints are plausible/implausible, believable/non-believable, and vivid/vague. 12 Example if subject decides to buy 200 shares in the first investment decision, but after reviewing the message boards decides to buy 300 shares instead the change in investment is a positive 100 shares.
33
33

I hypothesize that subjects will have a greater absolute value of change between their
investment decisions when positive or negative message boards are presented than
when there are none (H1), and that investing experience decreases this positive
association (H3). Further positive attitudes toward the investment lead to buying more
of the stock and negative attitudes toward the investment lead to selling the stock (H2a)
and these attitudes are influenced by message board tone (H2b). To test H1 and H3, I
estimate Equation 1, to test H2a I estimate Equation 2, and to test H2b I estimate
Equation 3.
Equation 1:
absInvestChg=α + β1iMB+ β2iEXP+ β3iMB* EXP+ β4 iIChar+ B5iCred
Equation 2:
InvestDec =α + β1iAtt + β2iIChar+ β3iCred + β4 iEXP + β5iAtt * EXP
Equation 3:
Att =α + β1iMB+ + β2iEXP + β3iMB+ * EXP + β4 iIChar + B5iCred
hgabsInvestC is the absolute value of the change between subjects investment decision
one and investment decision two. MB is a dummy variable equal to one (zero) if the
positive or negative message board postings are present (absent). H1 is supported if
the coefficient on MB is significantly positive. EXP is a score that combines the
subjects self reported years of investing and self reported investing experience level.
H3 is supported if the coefficient on the interaction term MB* EXP is negative.
InvestDec is the number of shares that the subject decides to buy or share in
investment decision two. is the attitude score. Attitude is a complex variable, but
has been used in many studies. One of the most popular ways of measuring attitude in
Att
34

recent research has been by using the semantic differential (Eagly and Chaiken 1993;
Oskamp and Schultz 2005). Osgood, Suci, and Tanenbaum (1957) created and studied
this scale, which consist of a series of individual 7-point bipolar adjective scales. The
rater is asked to rate the attitude object by selecting one of the 7 points between the two
adjectives. Figure 5 shows an example of a semantic differential scale. Osgood, et al
(1957) found three dimensions that the adjective scales loaded on through factor
analysis. These dimensions: evaluation, potency, and activity have been consistently
found in numerous other studies (Eagly and Chaiken 1993). Attitude was determined to
be most consistent with the evaluation dimension and recommended by Osgood (1965)
as the prime indicator of attitude toward the object. The evaluative dimension involves
such adjectives as good-bad, fair-unfair, pleasant-unpleasant. An attitude score can
then be determined by summing the adjectives scales for those within the evaluation
dimension. In this study, the subject was given a series of adjective pairs to rate
based on the attitude object, the investment. Some of the adjectives were presented in
reverse format so that the “negative” adjective came first instead of the “positive”
adjective always coming first. The analysis consists of a factor analysis to find the
adjective pairs that load on the evaluation dimension (the adjectives that load the same
as good-bad) and those adjective scores are then summed to form the attitude score.
Results of the factor analysis are presented in table 5. H2a is supported if in Equation 2
the coefficient on Att is significantly positive. MB+ is a dummy variable equal to one
(zero) if the message board postings are positive (negative). H2b is supported if in
Equation 3 the coefficient on MB+ is significantly positive.
35

Figure 5 -- Example of a Semantic Differential Scale
Use the scales below to report your perception of the company
Good Bad 1 2 3 4 5 6 7 Favorable Unfavorable 1 2 3 4 5 6 7 Negative Positive 1 2 3 4 5 6 7
Table 5 -- Factor Analysis to Determine Adjectives that load on the Evaluative Dimension (with Good/Bad) for Use in the Attitude Score Calculation Factor Loadings From Principal-Components Analysis with Varimax Rotation: Communalities, Eigenvalues, and Percentage of Variance (N = 110) Factor loading Adjective 1 2 Communality Good/Bad* 0.814 -0.238 0.719 Positive/Negative* 0.858 0.092 0.440 Wise/Unwise* 0.914 -0.039 0.837 Cheap/Expensive 0.378 0.709 0.646 Smart/Stupid* 0.889 0.116 0.804 Interesting/Uninteresting 0.357 -0.632 0.527 Superior/Inferior* 0.871 -0.045 0.761 Appealing/NotAppealing* 0.850 0.005 0.723 Acceptable/Unacceptable* 0.898 0.065 0.811 Favorable/Unfavorable* 0.842 0.001 0.709 Sensible/Foolish* 0.878 0.154 0.795 Eigenvalues 7.064 1.012 % of variance 64.221 9.2 *Used in the creation of the attitude score Cronbach’s Alpha = .959
The regression equations also include a few control variables (previously
discussed) that have been found to influence investor decisions and/or attitudes. IChar
is the information characteristics (plausibility, believability and vividness) and is Cred
36

the perceived credibility of the source of the information. The control variables were
measured by assessing the subject’s perceptions of the information and source using
semantic differential type scales. The lower the score (i.e 1 instead of 7) the more
plausible (believable, vivid, credible) the subject perceives the information or source13.
13 In the actual experiment the end points were reversed for some of the semantic differential type scales (i.e the endpoint of 1 was labeled not plausible and 7 was labeled plausible). Before analysis all scales were coded with the lower score meaning more plausible (believable, vivid, credible).
37

CHAPTER 4 RESULTS
4.1 Descriptive Statistics
Table 6 provides the descriptive statistics for my regression variables. The
average amount of absolute investment change overall was 130.91 (ranging from 0 to
800) and the average second investment decision was to purchase 48.18 more shares
of the stock (the option was to purchase up to 400 more shares). The average attitude
score was 42.75 on a scale of 9 (negative) to 63 (positive). The average experience
score (combination of years investing and perceived investment experience) was 6.15,
on a scale of 2 (no experience) to 14 (high experience). The information content
characteristics averaged 9.75 on a scale of 3 (plausible, believable, vivid) to 21
(implausible, unbelievable, vague) and the information source was perceived on
average to have a 3.59 credibility score (1 = credible, 7 = non credible).
Table 6 -- Descriptive Statistics for Variables Listed by message board group and overall Regression Variables
N Minimum Maximum Mean
Std. Deviation
Absolute Investment Change absInvestC hgControl Group (did not receive
any message board postings) 24 0 800 125.00 206.94
Negative Message Board Group 26 0 800 230.77 220.49 Positive Message Board Group 31 0 400 70.97 100.64 Mixed Message Board Group 29 0 400 110.34 144.78 Overall 110 0 800 130.91 178.55
Presence of Positive or Negative Message Board Postings MB
Control Group 24 0 0 0.00 0.00 Negative Message Board Group 26 1 1 1.00 0.00 Positive Message Board Group 31 1 1 1.00 0.00 Mixed Message Board Group 29 1 1 1.00 0.00 Overall 110 0 1 0.78 0.42 Table continued on next page
38

Table 6 continued
N Minimum Maximum Mean Std.
Deviation Creditability Cred
Control Group 24 1 5 2.83 0.92 Negative Message Board Group 26 1 6 4.00 1.39 Positive Message Board Group 31 1 6 3.39 1.33 Mixed Message Board Group 29 2 7 4.07 1.53 Overall 110 1 7 3.59 1.40
Investing Experience EXP
Control Group 24 2 13 6.83 3.34 Negative Message Board Group 26 2 12 5.69 3.53 Positive Message Board Group 31 2 12 4.97 2.68 Mixed Message Board Group 29 2 14 7.28 4.17 Overall 110 2 14 6.15 3.54
Information Characteristics IChar
Control Group 24 4 12 8.38 2.00 Negative Message Board Group 26 6 16 9.65 2.06 Positive Message Board Group 31 3 16 10.19 2.93 Mixed Message Board Group 29 4 19 10.52 3.05 Overall 110 3 19 9.75 2.68
Attitude Att
Control Group 24 31 54 45.42 6.86 Negative Message Board Group 26 9 57 38.77 11.64 Positive Message Board Group 31 15 63 46.68 9.03 Mixed Message Board Group 29 9 52 39.90 10.14 Overall 110 9 63 42.75 10.09
Message Board Type (positive or negative) MB+
Control Group 0 Negative Message Board Group 26 0 0 0.00 0.00 Positive Message Board Group 31 1 1 1.00 0.00 Mixed Message Board Group 0 Overall 57 0 1 0.54 0.50
Table continued on next page
39
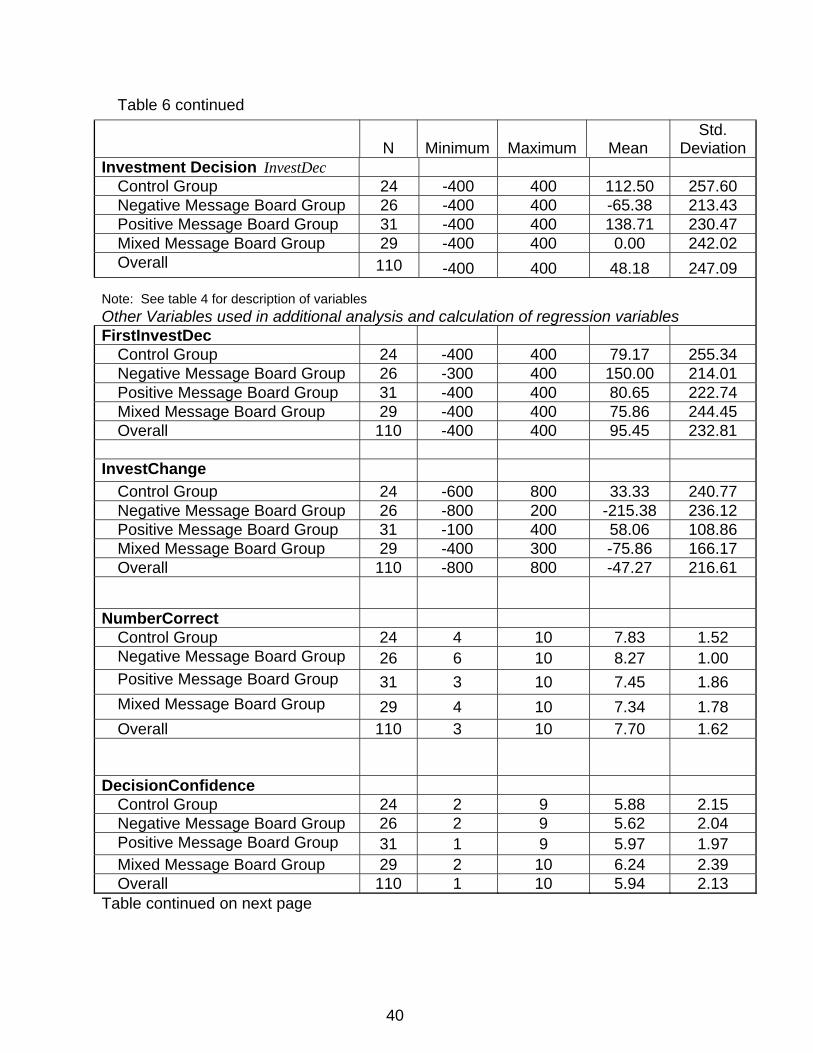
Table 6 continued
N Minimum Maximum Mean Std.
Deviation Investment Decision InvestDec
Control Group 24 -400 400 112.50 257.60 Negative Message Board Group 26 -400 400 -65.38 213.43 Positive Message Board Group 31 -400 400 138.71 230.47 Mixed Message Board Group 29 -400 400 0.00 242.02 Overall 110 -400 400 48.18 247.09
Note: See table 4 for description of variables Other Variables used in additional analysis and calculation of regression variables FirstInvestDec
Control Group 24 -400 400 79.17 255.34 Negative Message Board Group 26 -300 400 150.00 214.01 Positive Message Board Group 31 -400 400 80.65 222.74 Mixed Message Board Group 29 -400 400 75.86 244.45 Overall 110 -400 400 95.45 232.81
InvestChange
Control Group 24 -600 800 33.33 240.77 Negative Message Board Group 26 -800 200 -215.38 236.12 Positive Message Board Group 31 -100 400 58.06 108.86 Mixed Message Board Group 29 -400 300 -75.86 166.17 Overall 110 -800 800 -47.27 216.61
NumberCorrect
Control Group 24 4 10 7.83 1.52 Negative Message Board Group 26 6 10 8.27 1.00 Positive Message Board Group 31 3 10 7.45 1.86 Mixed Message Board Group 29 4 10 7.34 1.78 Overall 110 3 10 7.70 1.62
DecisionConfidence
Control Group 24 2 9 5.88 2.15 Negative Message Board Group 26 2 9 5.62 2.04 Positive Message Board Group 31 1 9 5.97 1.97 Mixed Message Board Group 29 2 10 6.24 2.39 Overall 110 1 10 5.94 2.13
Table continued on next page
40
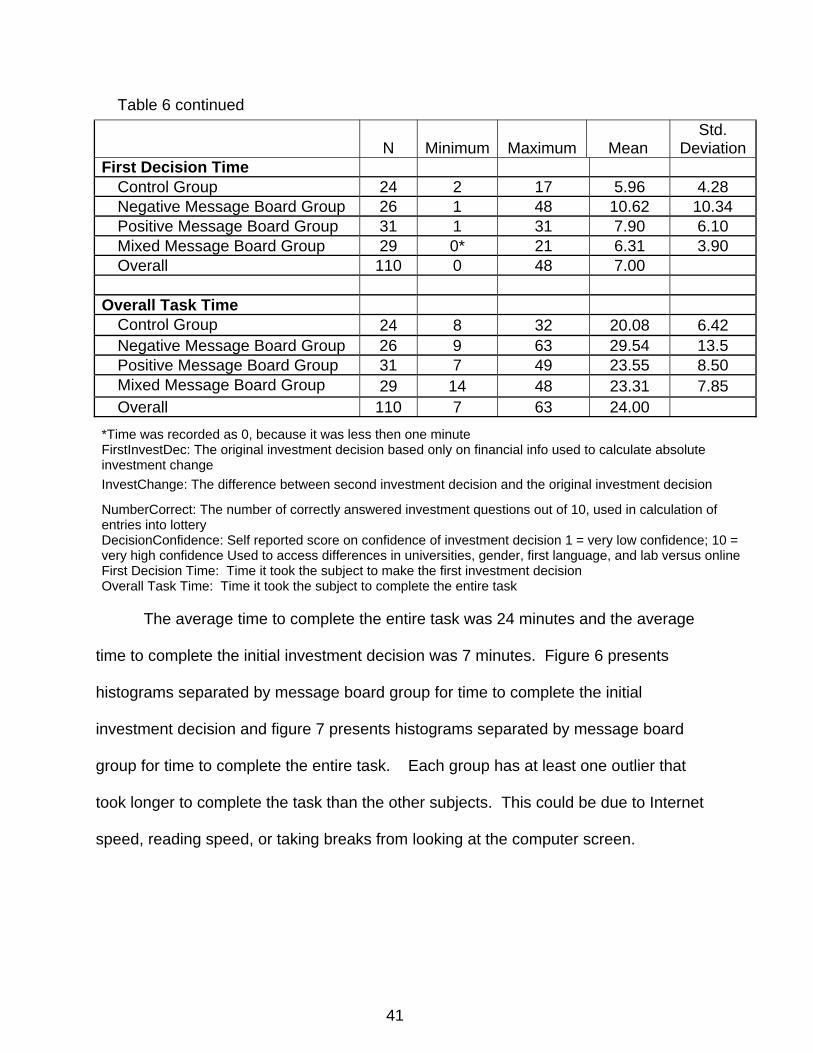
Table 6 continued
N Minimum Maximum Mean Std.
Deviation First Decision Time
Control Group 24 2 17 5.96 4.28 Negative Message Board Group 26 1 48 10.62 10.34 Positive Message Board Group 31 1 31 7.90 6.10 Mixed Message Board Group 29 0* 21 6.31 3.90 Overall 110 0 48 7.00
Overall Task Time Control Group 24 8 32 20.08 6.42 Negative Message Board Group 26 9 63 29.54 13.5 Positive Message Board Group 31 7 49 23.55 8.50 Mixed Message Board Group 29 14 48 23.31 7.85 Overall 110 7 63 24.00
*Time was recorded as 0, because it was less then one minute FirstInvestDec: The original investment decision based only on financial info used to calculate absolute investment change InvestChange: The difference between second investment decision and the original investment decision
NumberCorrect: The number of correctly answered investment questions out of 10, used in calculation of entries into lottery DecisionConfidence: Self reported score on confidence of investment decision 1 = very low confidence; 10 = very high confidence Used to access differences in universities, gender, first language, and lab versus online First Decision Time: Time it took the subject to make the first investment decision Overall Task Time: Time it took the subject to complete the entire task
The average time to complete the entire task was 24 minutes and the average
time to complete the initial investment decision was 7 minutes. Figure 6 presents
histograms separated by message board group for time to complete the initial
investment decision and figure 7 presents histograms separated by message board
group for time to complete the entire task. Each group has at least one outlier that
took longer to complete the task than the other subjects. This could be due to Internet
speed, reading speed, or taking breaks from looking at the computer screen.
41

Figure 6 -- Time Taken to Make First Investment Decision Separated by message board group
Control mixed
negative positive0
5
10
15
Cou
nt
10 20 30 40
DecTime
0
5
10
15
Cou
nt
10 20 30 40
DecTime
42

Figure 7 -- Time to Complete Entire Task Separated by message board group
Control mixed
negative positive
2
4
6
8
Cou
nt
10 20 30 40 50 60
TotalTime
2
4
6
8
Cou
nt
10 20 30 40 50 60
TotalTime
4.2 Results for Hypotheses Test
4.2.1 Message Board Effects and Investing Experience (H1 and H3) H1 predicts that subjects will have a greater absolute value change between their
investment decisions when positive or negative message boards are presented than
when there are none. MB (a dummy variable) is used to indicate the presence of
43

message board postings. Thus H1 is supported if MB is positively associated with the
absolute investment change. Table 7 presents the results from estimating regression
Equation 1. While it is positive, the coefficient on MB is not significant (β1 = .69.036, p =
.499, two-tailed) and does not support H1.
H3 predicts that investing experience decreases the positive association between
message boards and absolute value change in the investment decisions. To test H3, I
examine the coefficient on the interaction term MB*EXP. As shown in table 7, the
coefficient is negative, but not significant (β3 = -1.258, p = .930).
Table 7 – Equation 1 Results absInvestChg=α + β1iMB+ β2iEXP+ β3iMB* EXP+ β4 iIChar+ B5iCred
Coefficient t-statistic p-value α 310.195 2.586 0.012 MB 69.036 0.679 0.499 EXP 1.794 0.153 0.878 MB*Exp -1.258 -0.088 0.930 Ichar -19.435 -1.898 0.062 Cred -12.240 -0.628 0.532 F-test 1.501 0.200 Adjusted r-squared 0.030
4.2.2 Attitude (H2a and H2b) H2a predicts that positive perceived attitudes toward the investment lead to
buying more of the stock and negative perceived attitudes toward the investment lead to
selling the stock. Regression Equation 2 is used to test this hypothesis and results are
presented in table 8. Specifically H2a is supported if Attitude is positively associated
with the investment decision (positive attitude/increased investment, negative
44

attitude/decreased investment). As predicted, the coefficient on Attitude is significantly
positive (β1=14.780. p<.001) consistent with H2a.
Table 8 – Equation 2 Results InvestDec =α + β1iAtt + β2iIChar+ β3iCred + β4 iEXP + β5iAtt * EXP
Coefficient t-statistic p-value α -657.902 -3.703 0.000 Attitude 14.78 3.930 0.000 Ichar 3.189 0.382 0.703 Cred 13.018 0.793 0.430 EXP -10.947 -0.504 0.616 Att*Exp 0.247 0.478 0.634 F-test 15.195 0.000 Adjusted R-squared 0.394
H2b predicts that attitudes are influenced by message board tone. Regression
Equation 3 is presented in table 9 and is used to test H2b. Specifically, H2b is
supported if those that received a positive message board have a positive perceived
attitude about the investment and those that received a negative message board have a
negative perceived attitude about the investment. As shown in table 9, the coefficient
on MB+ is significantly positive (β1 = 15.680, p=.006) supporting H2b.
Table 9 – Equation 3 Results
Att =α + β1iMB+ + β2iEXP + β3iMB+ * EXP + β4 iIChar + B5iCred
Coefficient t-statistic p-value α 43.641 6.279 0.000 MB+ 15.68 2.850 0.006 EXP 0.129 0.223 0.825 MB+*Exp -1.261 -1.395 0.169 Ichar -1.127 -1.771 0.083 Cred 1.318 1.107 0.273 F-test 2.992 0.019 Adjusted r-squared 0.151
45

Overall, the results indicate that message boards influence the perceived attitude
towards an investment and perceived attitude has an impact on investment decisions.
The absolute amount of investment change is not significantly affected by the
presences of a message board. Further, it does not appear that investment experience
plays a role14. Additional post hoc analysis, discussed below, is done to separate the
positive and negative message boards to look at effects on investment decision.
4.3 Additional Analysis
4.3.1 Analysis of the Impact of Message Boards on Investment Decisions
Table 10 describes the amount of investment change in the four groups. The
average change in investment was found to be different across groups, F(3,95) =
11.532, p = 0.000. The Dunnett’s test was used to compare the control group (no
message board group) with the three message board groups, only the negative
message board group was significantly different (mean difference = -248.72, p < 0.05
level). The Tukey multiple comparisons performed at a 0.05 significance level found
that the negative message board group was significantly different from all other groups
and the positive and mixed groups were significantly different from each other.
The results indicate for this particular stock the negative postings had influence
on the investor subjects, but the positive postings did not. This is contrary to Securities
Exchange Commission (SEC) beliefs, the pump and dump model, and what has been
found with spam email. The explanation for this could be the difference in the price of
the stock. The stock in this study was originally purchased at $17.37 and the current
trading price was listed at $23.76. The spam studies and most of the pump and dump
14 Seven subjects scored below 50% on the investment quiz. Removal of the subjects did not change the significance of the hypothesis testing.
46
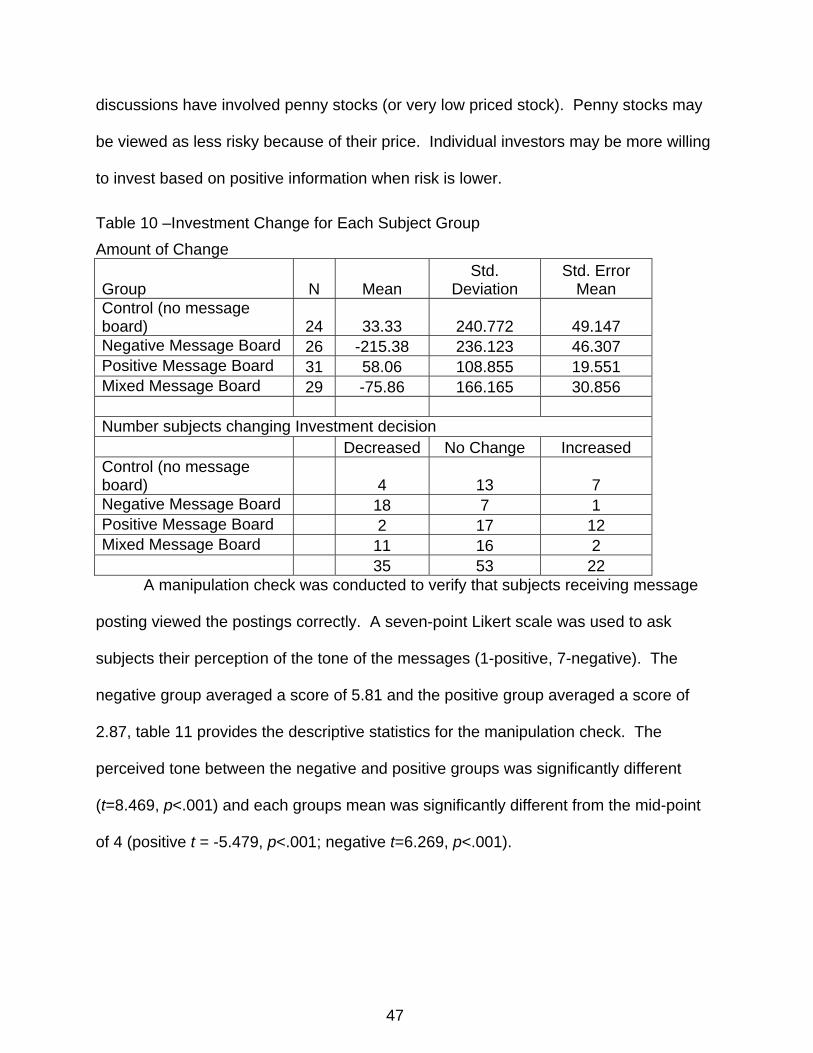
discussions have involved penny stocks (or very low priced stock). Penny stocks may
be viewed as less risky because of their price. Individual investors may be more willing
to invest based on positive information when risk is lower.
Table 10 –Investment Change for Each Subject Group Amount of Change
Group N Mean Std.
Deviation Std. Error
Mean Control (no message board) 24 33.33 240.772 49.147 Negative Message Board 26 -215.38 236.123 46.307 Positive Message Board 31 58.06 108.855 19.551 Mixed Message Board 29 -75.86 166.165 30.856 Number subjects changing Investment decision Decreased No Change Increased Control (no message board) 4 13 7 Negative Message Board 18 7 1 Positive Message Board 2 17 12 Mixed Message Board 11 16 2 35 53 22
A manipulation check was conducted to verify that subjects receiving message
posting viewed the postings correctly. A seven-point Likert scale was used to ask
subjects their perception of the tone of the messages (1-positive, 7-negative). The
negative group averaged a score of 5.81 and the positive group averaged a score of
2.87, table 11 provides the descriptive statistics for the manipulation check. The
perceived tone between the negative and positive groups was significantly different
(t=8.469, p<.001) and each groups mean was significantly different from the mid-point
of 4 (positive t = -5.479, p<.001; negative t=6.269, p<.001).
47

Table 11 – Perception of Tone of Messages Received Positive Tone / Negative Tone (1 = positive, 7 = negative)
Group Mean N Std.
Deviation Median Mixed Message Board 4.621 29 1.42463 5 Negative Message Board 5.808 26 1.47022 6 Positive Message Board 2.871 31 1.14723 3 Total 4.349 86 1.80044 4
4.3.2 Additional Analysis of Experience Previous literature has found that experienced investors are better at using
financial information to make investment decisions. To better understand experience in
this study additional analysis was conducted.15 Experience for the additional analysis
only considered the reported number of years investing. Thirty-one percent of the
subjects in this study had zero years of experience and 60% had three or fewer years of
experience. There were no significant differences between the two experience levels
on the means of the individual regression variables (except those related to
experience). Table 12 presents a retest of the hypotheses using the experience split.16
Regression Equation 2 is used to test the hypothesis that positive perceived attitudes
toward the investment lead to buying more of the stock and negative perceived attitudes
toward the investment lead to selling the stock. Initial results support this hypothesis
since the coefficient on Attitude is significantly positive. For the experience level split,
the coefficient on Attitude is only significantly positive (β1=18.92. p<.05) for the
experienced level subset. H2b predicts that perceived attitudes are influenced by
15 Using the number investment questions answered correctly an investment knowledge variable was created. Additional analysis was done on investment knowledge in place of experience. No significant differences were found. 16 Due to limited sample sizes experience levels were limited to no experience and some experience. Other combinations of groups caused limitations of interpreting results.
48

message board tone. Regression Equation 3 is used to test the hypothesis that
perceived attitudes are influenced by message board tone. Initial results support this
hypothesis since the coefficient on MB+ is significantly positive. Again, for the
experience level split, the coefficient on Attitude is only significantly positive (β1=30.621.
p<.05) for the experienced level subset. Interestingly, it appears that those with
experience had more perceived attitude influence from the message boards than those
without any experience. While this is contrary to expectations this could be due to a
sample size issue or because the no-experience group did not understand the
information in the message board postings. If the subject did not understand what the
message was presenting, the information may not have had any affect of the subjects
perceived attitude toward the investment.
Table 13 presents the amount of investment change for the four message board
groups split into the two experience levels. The average change in investment was
found to be different across groups for both experience levels [no experience F(3,30) =
4.896, p < 0.05; experience F(3,72) = 6.974, p < 0.05]. The Tukey multiple comparisons
was performed as a post hoc analysis to see which groups had the significant
differences. For the no experience level the negative message board group was found
only to be significantly different at a 0.05 level from the positive message board group.
For the experience level the negative message board group was found to be
significantly different at the 0.05 level from both the positive message board group and
the control group.
49

Table 12 -- Moderating Effects of Experience on Regression Equations Results of Equation 1 for each experience level No Experience (n= 28) Experience (n = 53) α 289.238 389.146* MB 85.204 5.444 EXP -11.235 -5.872 MB*Exp 2.212 5.415 Ichar -15.225 -20.256 Cred -17.058 -11.68 Adjusted r-squared -0.088 -0.008 F-test 0.562 0.920 Results of Equation 2 for each experience level No Experience (n= 34) Experience (n = 76) α -582.031 -814.257* Att 10.757 18.92* Ichar 18.835 -0.293 Cred -12.029 19.518 EXP -63.515 6.198 Att*Exp 1.814 -0.192 Adjusted r-squared 0.351 0.383 F-test 4.570* 10.313*
Results of Equation 3 for each experience level No Experience (n= 22) Experience (n = 35) α 58.853* 48.216* MB+ -13.034 30.621* EXP -12.968 0.831 MB+*Exp 12.206 -3.287* Ichar -1.722 -1.234 Cred 6.394* -1.166 Adjusted r-squared 0.437 0.289 F-test 4.26* 3.764* *Significant at the 0.05 level (two-tailed)
50

Table 13 --Investment Change by Experience Level Means and Standard Deviations for Message Board Groups by experience level
Experience Level N Mean Std.
Deviation No Experience
Control Group 6 0.000 126.491 Negative Group 10 -200.000 253.859 Positive Group 12 75.000 128.806 Mixed Group 6 -133.333 150.555
Total 34 -55.882 207.717 Experience
Control Group 18 44.444 270.560 Negative Group 16 -225.000 232.379 Positive Group 19 47.368 96.427 Mixed Group 23 -60.870 169.864
Total 76 -43.421 221.712 4.3.3 Additional Analysis of Information Characteristics and Source Variables Additional analysis was conducted on information characteristics variables and
the source variables. Table 14 presents this additional analysis. Previous literature
suggests that the perceived vividness, plausibility, and believability of a message
impacts the influence of the message and/or the attitude the individual has about the
object. As seen in table 14, the control group viewed the information as significantly
more vivid and believable than those that received the additional message board
postings. Additionally, the information characteristic variable (combination of plausible,
believable and vivid) is significantly lower (t = -2.227, p = 0.031) for the control group
than the negative message board group meaning that those in the control group overall
viewed the information as more plausible, believable and vivid. This suggests that the
lower vividness, plausibility and believability of the negative message did not impact the
influence of the message and/or the attitude at least in the direction expected. Despite
the information being viewed as less plausible, believable and vivid for the negative
51

group, the negative group still had significantly more investment change (t = 3.686, p =
0.001) and a significantly higher attitude change (t=3.954, p =0.000). While information
may be irrelevant, the presence and the emphasizing of negative information may have
caused influential effects on the processing of the information (Tversky and Kahneman
1974; Elliott 2006; Taylor and Fiske 1978; Taylor and Thompson 1982)
Previous literature also suggests that the credibility of the source of the
information impacts the influence of the information. As shown in table 10, the control
group viewed the source of the information at significantly more credible than those in
the message board group (t = -3.124, p = 0.002). Further, despite the significant
investment change that occurred for those in the negative group, they viewed the
source of the information as significantly less credible than those in the control group (t=
-3.48, p = 0.001). This suggests that despite viewing the information as less credible
the information still caused an investment decision change.
Table 14 -- Information and Source Characteristics Independent Samples T-test between Control group and message board groups Control Group Message Board Group t-statistic p-value Mean Std Deviation Mean Std Deviation Plausible 2.542 0.721 2.942 1.099 -1.682 0.095 Believable 2.542 0.833 3.093 1.091 -2.293 0.024 Vivid 3.292 1.042 4.105 1.338 -2.751 0.007 Credibility 2.833 0.917 3.802 1.437 -3.124 0.002 Expert 3.167 1.129 4.140 1.512 -2.928 0.004 Trustworthy 3.083 1.018 3.849 1.251 -2.751 0.007 Similar 3.333 0.963 3.942 1.277 -2.165 0.033 Information Characteristics 8.375 1.996 10.140 2.732 -2.948 0.004
Plausible – Perceived plausibility of information content (1 = plausible, 7 = implausible) Believable – Perceived believability of information content (1 = believable, 7 = unbelievable) Vivid – Perceived vividness of information content (1 = vivid, 7 = vague) Credibility – Perceived credibility of source of information (1 = credible, 2 = non-credible) Expert – Perceived expertise of source of information (1 = expert, 7 = non expert) Trustworthy – Perceived trustworthiness of source of information (1 = trustworthy, 7 = untrustworthy) Similar – Perceived similarity of source of information (1 = similar to self, 7 = dissimilar to self) IChar – Combination of Plausible, Believable, Vivid
52

4.3.4 Additional Variable Analysis
Further analysis was also conducted to check for differences between
universities, gender, first language, and lab versus online. No significant differences
were found on the primary hypotheses. Table 15 describes significant differences for
other variables. The university attended only had significant differences in the
experience variable. Gender and language both had significant differences in the
number of investment questions answered correctly and the experience variable (further
analysis suggest that this is a result of the perception question on investment
experience rather than actual number of years investing). Gender also had significant
differences in decision confidence. There were no significant differences between the
lab group and the online group.
53

Table 15 -- Additional Variable Analysis – Significant Differences
English First
Language (n=90) English Not First Language (n=20)
Mean Std
Deviation Mean Std.
Deviation t-statistic p-value
NumberCorrect 7.878 1.585 6.900 1.553 2.504 0.014 Investing Experience 6.567 3.629 4.300 2.430 2.659 0.009
ExperiencePerception* 4.656 1.938 6.000 1.214 -2.969 0.004 YearsInvesting 4.728 6.477 2.025 2.831 1.823 0.071
Male (n=67) Female (n=43)
Mean Std.
Deviation Mean Std.
Deviation t-statistic p-value
NumberCorrect 8.075 1.511 7.116 1.621 3.155 0.002 Investing Experience 7.119 3.484 4.651 3.116 3.776 0.000
ExperiencePerception 4.313 1.917 5.814 1.468 -4.374 0.000 YearsInvesting 4.672 4.247 3.558 8.140 0.940 0.350
DecisionConfidence 6.418 1.900 5.186 2.260 3.079 0.003 Means and Standard Deviations for University Attended and Experience Variables Investing Experience ExperiencePerc YearsInvesting M SD M SD M SD University 1 (n= 12) 9.250 3.545 3.417 1.929 7.750 5.328 University 2 (n= 44) 5.636 3.156 5.227 1.626 3.295 3.592 University 3 (n=9) 3.889 3.333 5.889 1.965 1.444 3.283 University 4 (n=10) 5.000 2.708 5.400 1.578 2.600 2.875 University 5 (n=29) 6.034 3.510 4.828 2.001 3.448 3.924 University 6 (n=6) 9.667 2.875 3.500 1.871 14.833 17.725 6.155 3.543 4.900 1.896 4.236 6.062 One-Way Analysis of Variance of University Attended on Experience Variables Variable and Source df SS MS F p-value Exp
Between groups 5 260.753 52.151 4.897 0.000 Within groups 104 1107.620 10.650
ExperiencePerception Between groups 5 975.817 195.163 6.700 0.000 Within groups 104 3029.537 29.130
YearsInvesting Between groups 5 54.329 10.866 3.348 0.008 Within groups 104 337.571 3.246 *ExperiencePerception is the self reported experience level of 1 (none) to 7(high)
54

CHAPTER 5 CONCLUSIONS
In this study I investigate Internet stock message boards and their influence on
investor decisions. I look at both the message board’s impact directly on the investment
decision and its impact on attitude towards the investment. I also investigate the role
experience plays in the relationship.
It was hypothesized that message boards influence non-professional investor’s
investment decisions. In this study, I found that only negative postings influence this
particular investment decision. Future studies should look further in the differences
between positive and negative posting in relation to stock price. The Securities
Exchange Commission (SEC) has initiated investigations based on individuals
manipulating an increase in stock prices through postings on message boards; this may
be a more serious case for lower priced stock. Lower priced stock may appear to be
less risky, so non-professional investor’s may be more willing to invest based on
positive information. This study provides evidences that, at least for similarly priced
stocks, negative message board postings may be a concern. Negative messages may
be a result of short sellers trying to drive the stock price down or individuals upset with
the company. Corporations are concerned about the reputation affects of message
boards (Carson and Felton 2004) and evidence from this study show that negative
postings can cause subjects to decrease their investment. The negative messages
highlight the negative details that can have unintentional effects on information
processing despite the relevance of the information (Taylor and Fiske 1978; Taylor and
Thompson 1982; Elliott 2006)
55

It was additionally hypothesized that experience would reduce the influence of
the messages on investors’ decisions. In this study, this was not found and it appears
that those with some experience were influenced more than those without any
experience. While this is contrary to expectations based on other research, it may be
the result of those with some investing experience having a better understanding of the
information in the message boards and how it relates to the investment decision. With
the initial investment of 400 shares already experiencing a gain, the information in the
message boards may have highlighted details that the experienced investor processed
as an opportunity to not risk losing that gain. To investigate this, a future study should
look at an investment decision based on an investment currently experiencing a loss.
It would be beneficial for future research on investing experience and information
influence. It may be more beneficial to compare higher levels of investing experience
with lower levels rather than comparing some experience with no experience. The
number of experienced investors limited this study. It may also be more appropriate to
suggest that investment expertise or knowledge would reduce the influence rather than
experience. Carson and Felton (2004) cite cases where analyst admit to looking at
message boards. There may be a more serious problem if unknowingly postings
influence expert investors. This study had a weak knowledge measure with an
investment quiz, but the results were not any different than with using the experience
variable.
I find that attitude towards the investment is an important variable of
consideration in investment decisions. A positive perceived attitude was related to
increasing the amount of investment in the company and a negative perceived attitude
56

was related to decreasing the amount of investment in the company. It was further
found that the messages impacted this perceived attitude towards the investment. It
has been suggested in previous research that attitude can be weighed as a valid
information piece in decision making (Oskamp and Schultz 2005). This could be the
reason that despite claiming lower credibility of the information source in the negative
group, the information was still used to decrease the investment decision.
Additional research should also be conducted on other investment information
sources such as investment blogs. In investment blogs the source is usually known, but
it is not always a credible source and the blogs are often written with the agenda to
persuade the reader. New Internet investment information sources are constantly
appearing, understanding the influences these sources have is important for regulation
and investor education.
Additionally, future studies should investigate perceived risk of an investment and
the individual’s threshold for risk. The perceived risk of the investment may interact with
influence that the negative or positive message may have. If the investment is
perceived risky, positive messages may have no influence on the investment decision,
but an equally negative message may have strong influence on the investment decision.
As with most experimental research there are limitations to this study. I only
looked at one stock and only provided limited information to make the stock investment
decision. There is a possibility that it was due to the lack of reliable information that
caused subjects to use the message boards. Though, despite the lack of additional
information only the negative group was influenced by non-credible information. This
provides evidence that it was the messages that influenced rather than lack of credible
57

information. To continue the investigation on the influence of stock message boards,
there should be additional studies done to investigate the differences of message board
influence based on stock prices.
Another limitation was the price of the stock in this experiment. The initial
investment that the subject was told about included a large gain (an increase of $6.39 in
stock price from the initial investment 13 months earlier). This gain could play a role in
the negative group deciding to decrease their investment after reading negative
information.
There were further limitations based on the sample. Investment experience
overall was low and there was not a significant number of participants that had more
than three years of investing experience in each of the message board groups to
conduct further analysis based on experience.
Despite various limitations this study does add to the message board and
accounting literature. While general beliefs would be that information would have
influence, this study finds that only negative message boards caused investment
change. This leads to the need for more research to better understand these
influences. This is also important so that investors can better understand the information
they use to make decisions, information providers can better understand what
information investors need, regulators can help protect investors, and corporations can
know how much time and effort they need to place in monitoring their message boards.
58

APPENDIX EXPERIMENTAL MATERIALS
59

The attached experimental materials are hard copy versions of what was presented in computer format for the actual experiment. The materials attached are for the message board group (both the negative and positive postings are included here, but a subject only received one set or a mixed set). The only difference between what is presented here and what the control group received was there was no message postings.
60

Initial Story You currently have an investment of 400 shares purchased at $17.37 thirteen months ago in QuickGames, Inc. QuickGames is the world's largest online gaming service, providing more than five million subscribers access to over 60,000 games. The company offers a variety of subscription plans, starting at $5.99 a month. Based on the subscription plan users are allowed to download games to play on their computer, cell phones and various MP3 players. QuickGames offers personalized game recommendations to its members and has more than one billion game ratings. QuickGames also allows members to share and recommend games to one another through its Tell-a-Friend feature. QuickGames recently released their second quarter financial results and you have decided to review your investment. Just before announcing their financial results the stock price at the end of the day was $23.76. On the next screen is QuickGames second quarter financial results will be presented for your inspection. You will then be asked to make an investment decision in relation to QuickGames. The number of entries that you will have in the lottery drawing for the $75 gift cards will be based on your performance and effort compared to other participants. The maximum number of entries is 5 and the minimum is 1.
61

Financial Results PRESS RELEASE QuickGames Announces Q2 2006 Financial Results Monday July 24, 4:05 pm ET Subscribers - 5.2 million Revenue - $239.4 million GAAP Net Income - $16.8 million LOS GATOS, Calif., July 24 /PRNewswire-FirstCall/ -- QuickGames, Inc. (Nasdaq: QCKM - News) today reported results for the second quarter ended June 30, 2006. Second-Quarter 2006 Financial Highlights Revenue for the second quarter of 2006 was $239.4 million, representing 46 percent year-over-year growth from $164.0 million for the second quarter of 2005, and 7 percent sequential growth from $224.1 million for the first quarter of 2006. GAAP net income for the second quarter of 2006 was $16.8 million, or $0.24 per diluted share, compared to GAAP net income of $5.7 million, or $0.09 per share, for the second quarter of 2005 and GAAP net income of $4.4 million, or $0.07 per diluted share, for the first quarter of 2006. GAAP net income for 2006 is a fully taxed number while 2005 was not. On a pretax17 basis, the second quarter profit was an all-time record. Non-GAAP net income was $18.7 million, or $0.27 per diluted share, for the second quarter of 2006, compared to non-GAAP net income of $9.1 million, or $0.14 per share, for the second quarter of 2005 and non-GAAP net income of $6.4 million, or $0.10 per diluted share, for the first quarter of 2006. Non-GAAP net income equals net income on a GAAP basis before stock-based compensation expense, net of taxes. Gross margin18 for the second quarter of 2006 was 37.1 percent, compared to 28.2 percent for the second quarter of 2005 and 33.8 percent for the first quarter of 2006. Free cash flow19 for the second quarter of 2006 was positive $5.5 million, compared to positive $1.8 million in the second quarter of 2005 and positive $11.7 million for the first quarter of 2006.
17 Pretax income is defined as income before income taxes as shown on the Company's Statement of Operations, which line item includes stock-based compensation expense. 18 Gross margin is defined as revenue less cost of subscription and fulfillment expense. The Company had previously recorded fulfillment expense as an operating expense. 19 Free cash flow is defined as cash provided by operating activities less cash used in investing activities excluding purchases and sales of short- term investments.
62

Cash provided by operating activities for the second quarter of 2006 was $46.3 million, compared to $36.5 million for the second quarter of 2005 and $57.6 million for the first quarter of 2006. Subscriber acquisition cost20 for the second quarter of 2006 was $43.95 per gross subscriber addition, compared to $38.13 for the same period of 2005 and $38.47 for the first quarter of 2006. Churn21 for the second quarter of 2006 was 4.3 percent, compared to 4.7 percent for the second quarter of 2005 and 4.1 percent for the first quarter of 2006. Churn includes free subscribers as well as paying subscribers who elect not to renew their monthly subscription service during the quarter. Subscribers. QuickGames ended the second quarter of 2006 with approximately 5,169,000 total subscribers, representing 62 percent year-over-year growth from 3,196,000 total subscribers at the end of the second quarter of 2005 and 6 percent sequential growth from 4,866,000 subscribers at the end of the first quarter of 2006. Net subscriber additions in the quarter were 303,000, compared to 178,000 for the same period of 2005 and 687,000 for the first quarter of 2006. During the quarter QuickGames acquired 1,070,000 gross subscriber additions, representing 51 percent year-over-year growth from 707,000 gross subscriber additions in the second quarter of 2005 and 22 percent quarter-over-quarter decline from 1,377,000 gross subscriber additions in the first quarter of 2006. Of the 5,169,000 total subscribers at quarter end, 97 percent, or 5,017,000, were paid subscribers. The other 3 percent, or 152,000, were free subscribers. Paid subscribers represented 97 percent of total subscribers at the end of the second quarter of 2005 and the first quarter of 2006. Business Outlook The Company's performance expectations for the third and fourth quarters of 2006 and full-year 2006 are as follows: Third-Quarter 2006 -- Ending subscribers of 5.5 million to 5.7 million -- Revenue of $249 million to $254 million -- GAAP net income of $5 million to $10 million 20 Subscriber acquisition cost is defined as the total marketing expense, which includes stock-based compensation for marketing personnel, on the Company's Statement of Operations divided by total gross subscriber additions during the quarter. 21 Churn is defined as customer cancellations in the quarter divided by the sum of beginning subscribers and gross subscriber additions, divided by three months.
63
Fourth-Quarter 2006 -- Ending subscribers of at least 6.3 million -- Revenue of $267 million to $272 million -- GAAP net income of $3.8 million to $8.8 million Full-Year 2006 -- Ending subscribers of at least 6.3 million -- Revenue of at least $980 million -- GAAP net income of $30 million to $35 million Use of Non-GAAP Measures Management believes that non-GAAP net income is a useful measure of operating performance because it excludes the non-cash impact of stock option accounting, and, where specified, excludes the benefit of the realized tax assets. In addition, management believes that free cash flow is a useful measure of liquidity because it excludes the non-operational cash flows from purchases and sales of short-term investments and cash flows from financing activities. However, these non-GAAP measures should be considered in addition to, not as a substitute for or superior to, net income and net cash provided by operating activities, or other financial measures prepared in accordance with GAAP. A reconciliation to the GAAP equivalents of these non-GAAP measures is contained in tabular form on the attached unaudited financial statements. Forward-Looking Statements This press release contains certain forward-looking statements within the meaning of the federal securities laws, including statements regarding our subscriber growth, revenue and GAAP net income for the fourth quarter of 2006 as well as subscriber growth, revenue, and GAAP net income for the full-year 2006. The forward-looking statements in this release are subject to risks and uncertainties that could cause actual results and events to differ, including, without limitation: impacts arising out of competition, our ability to manage our growth, in particular, managing our subscriber acquisition cost as well as the mix between revenue sharing titles and titles not subject to revenue sharing that are delivered to our subscribers; our ability to attract new subscribers and retain existing subscribers; changes in pricing, availability and effectiveness related to our advertising; fluctuations in consumer usage of our service, customer spending on games and related products; disruption in service on our website or with our computer systems; deterioration of the U.S. economy or conditions specific to online commerce or the gaming entertainment industry; increases in the costs of acquiring games; and, widespread consumer adoption of different modes of playing electronic games. A detailed discussion of these and other risks and uncertainties that could cause actual results and events to differ materially from such forward-looking statements is included in our filings with the Securities and Exchange Commission, including our Annual Report on Form 10-K filed with the Securities and Exchange Commission on March 16, 2006. We undertake no obligation to update forward-looking statements to reflect events or circumstances occurring after the date of this press release.
64

Investment Decision You currently have the opportunity to make an investment decision. You can either purchase up to 400 more shares of QuickGames or sell some or all your shares of QuickGames. Money not invested (and proceeds from any sell) will be placed in a six month low risk government security. All investments will be sold at the end of six months. After reviewing the materials what is your investment decision? Sell 400 Sell 300 Sell 200 Sell 100 Hold Buy 100 Buy 200 Buy 300 Buy 400 Shares Shares Shares Shares Shares Shares Shares Shares Shares
65

Initial perception and attitude questions INSTRUCTIONS On the next few screens contain a series of questions that will ask you about your perception of different elements related to the information that you received and the decision that you made. You will be given an item to focus on and will be asked to give your perception of that item based on a 7-point scale. The example below explains how to use the scales. Example: What is your perception of the information presented as whole? Helpful Unhelpful 1 2 3 4 5 6 7 The respondent in this example selected 3. This means that the person perceived the message to be more helpful than unhelpful, but not extremely helpful which would have been represented by selecting 1. Neutral would have been represented by selecting 4.
66

What is your perception of the investment? Good Bad 1 2 3 4 5 6 7 Positive Negative 1 2 3 4 5 6 7 Wise Unwise 1 2 3 4 5 6 7 Expensive Cheap 1 2 3 4 5 6 7 Smart Stupid 1 2 3 4 5 6 7 Interesting Uninteresting 1 2 3 4 5 6 7 Appealing Not Appealing 1 2 3 4 5 6 7 Superior Inferior 1 2 3 4 5 6 7 Acceptable Unacceptable 1 2 3 4 5 6 7 Favorable Unfavorable 1 2 3 4 5 6 7 Sensible Foolish 1 2 3 4 5 6 7
67

What is your perception of the content of the information provided as a whole? Plausible Implausible 1 2 3 4 5 6 7 Believable Unbelievable 1 2 3 4 5 6 7 Vivid Vague (Dull) 1 2 3 4 5 6 7 What is your perception of the source of the information provided as a whole? Credible Non-credible 1 2 3 4 5 6 7 Expert Non-expert 1 2 3 4 5 6 7 Trustworthy Untrustworthy 1 2 3 4 5 6 7 Similar to self Dissimilar to self 1 2 3 4 5 6 7
68

Distraction Task Below are some general investing questions to assess your investing skill level.
1. All of the following are advantages to the purchase of common stock EXCEPT: a. It can provide an income stream b. There is good marketability c. There can be tax advantages for long-term purchases d. The return is guaranteed by the issuing company
2. If you buy a company’s stock a. You own a part of the company b. You have lent money to the company c. You are liable for the company’s debts d. The company will return your original investment to you with interest e. Don’t know
3. To minimize investment risks, your best strategy is: a. only invest in well-established companies that pay annual dividends b. invest in bonds or real estate c. keep your money in the bank or invested in a CD (certificate of deposit) d. diversify your portfolio to include stocks, bonds, mutual funds, real estate
and cash 4. Over the past 70 years, the type of investment that has earned the most money,
or the highest rate of return, for investors has been a. Stocks b. Corporate bonds c. Savings accounts d. Don’t know
5. When a company wants to issue stock in itself, it has an IPO. What is an IPO? a. Investment Profit Operation b. A dividend c. A meeting with the government d. Initial Public Offering
6. Which of the following increases the value of my money in stocks? a. Increase in price per share b. Dividends c. Stock splits d. All of the above
7. In terms of investing, bonds are: a. loans that investors make to companies b. investments that provide monthly income to investors c. a business promise with your broker d. the stock of a new company
8. A mutual fund is: a. an investment instrument for married couples b. any tax-exempt investment c. a paycheck deduction that goes to your retirement savings d. a pooled group of investment instruments
69

9. Which of the following organizations insures you against your losses in the stock market?
a. FDIC (Federal Deposit Insurance Corporation) b. NASD (National Association of Securities Dealers) c. SEC (Securities and Exchange Commission) d. SIPC (Securities Investor Protection Corporation) e. None of the above
10. What is short-selling? a. Buying shares in the morning and selling them before the close of
business on the same day b. Borrowing shares, selling them and buying them back for less money after
the price has fallen c. Buying a small quantity of shares d. Continuously selling shares after holding them for short periods of time
70

Message Board Case Before implementing your investment decision you found an Internet message board discussing QuickGames. Presented on the next screen are relevant postings dated immediately following QuickGames second quarter financial results release. Please review these postings. The computer will require you to spend at least 1 minute reviewing the next screen before it allows you to continue.
71

Postings (Negative) Spin...Spin...Spin (negative) 24-Jul-06 05:29 pm Posted by: InvestorMike As subscribers go up they make less money. 2% margins are not worth getting excited about. This will be as good as it gets, sell now and find something with a better future. strong report but guidance was weak (neutral) 24-Jul-06 05:55 pm Posted by: InterestedStreetGuru Analysts had lots of questions during the conference call as to why the guidance was weak given this Q was strong; their answers could have been better. The numbers weren't that bad; Still lots of growth yr/yr, but in this market if there is even a whiff of bad news, everyone fires first and asks questions later. It may just need to come down to how much of a gamble are you willing to take subs # came in below expectations (negative) 24-Jul-06 05:51 pm Posted by: GamerInvestor42 QCKG report wasn’t horrible, but not great. The negative reaction may be a little overdone, but there were some below expectations numbers on the acquisition cost per subscriber and the net added subscribers. Not devastating, but in this market, everyone is going to assume the worse. This will cause the stock to decline. QuickGames beats by $0.06; guides below consensus (23.76 ) : Reports Q2 (Jun) GAAP earnings of $0.24 per share, $0.06 better than the Reuters Estimates consensus of $0.18; revenues rose 46% year/year to $239.35 mln vs the $241.7 mln consensus. NFLX reports Q2 net subscriber additions of 303k vs 350.8k street expectation. Co issues downside guidance for Q3, sees Q3 revs of $249-254 mln vs. $257.49 mln consensus; sees GAAP net income of $5 million to $10 million. Co sees Q4 revs of $267-272 mln vs $283.1 mln consensus; sees GAAP net income of $3.8 million to $8.8 million. Co issues downside guidance for FY06, sees FY06 revs of at least $980 mln vs. $1.01 bln consensus and prior guidance of at least $990 mln; sees GAAP net income of $30 mln to $35 mln.
72

Bad Performance (negative) 24-Jul-06 07:59 pm Posted by: Cali_Investor Gross margin up only 3% from 34% to 37%. Free cash flows down 6.2 million Company issues downside guidance for subscribers and earnings. Rolling out lower priced plans in order to compete is leading to horrible performance. Management is having difficulty delivering promise of balancing growth and earnings. Revenues and margins only slightly climbed this qtr, and it is costing increasingly more to sign up the next customer. Subscriber acquisition cost up $5.48 per gross subscriber addition. As a result, seasonally slow Q2 gross adds equaled 78% of Q1's, versus 75% in 2005 and 76% in 2004. Not much improvement, especially when you compare it to the growth in the mobile phone game downloads from cell providers; up 15% in number of subscribers and revenues up 63% over same time last year. PC sales increased in the US by 6.7% and video game sales were up 25% in June. QCKG turned in a lousy performance compared to consumer spending in related areas. This supposedly growth company is actually beginning to deteriorate. Come and gone (negative) 24-Jul-06 08:27pm Posted by: Fill-the-Gaps The time has come and gone for QuickGames. They had a good run, but growth is slowing, guidance is weakening, and competition is getting stronger. They missed some key expectations and the stock is going to be punished for it. Sell as quickly as possible. This does not take a rocket scientist! (negative) 24-Jul-06 09:19 pm Posted by: Fill-the-Gaps With increasing cost to obtain a new subscriber, year over year growth prospects slowing down, and new forms of competition coming from all over, I'd wager a month's pension that in 5yrs there will be nothing left.
73

Reasons for cautious investing (negative) 24-Jul-06 10:24 pm Posted by: PlayOnTheStreet You need to be a little nervous about investing in the stock when you take these reasons into consideration Threat of Competition: There are a lot of different players in the market. Not only is there the console market that QCKG is not in, cell phone providers provide their own games for customers, and it won’t be long before if there is any value in it apple will be provide its own downloadable games for IPOD/MP3 players. Plus there are plenty of fun simple computer games available for free. Threat of High CAC (customer acquisition cost): This has been a growing concern. During the conference call management did express concern on this issue, but didn’t have a really good answer considering it appears that adding one more customer cost more than the previous customer. As more subscribers exist, the website slows and customers complain. To keep service levels up they have to add to their technology which keeps cost up. Threat of low quality Downloads: Here’s why I think this is entirely worrisome. First, there is a mass movement in American households to create home theater experiences that include major gaming systems. Just ask any Tweeter/Circuit City/Best Buy sales person and they’ll tell you wide-screen plasmas, surround sound systems, and XBOX 360s are (and have been) selling steadily. The graphics are something that downloadable games cannot match. Even today’s downloaded music sacrifices quality (compared to CD’s). I think today’s prices are a poor value play for a so called a growth company that isn’t hitting all its numbers. Sell now and take what profit you can. Future looks dull (negative) 24-Jul-06 11:51pm Posted by: ForwardLooker Quickgames has horrible potential. There is no value in their services. While it may only be $5.99 a month to download games, the games are sub par as compared to the new console games. You get what you pay for. An x-box 360 game may cost $60, but the quality is far superior. People want quality, just look at the increase in subscriber acquisition cost and the decrease in gross margin from the 1st qtr.
74

Postings (Positive) Spin...Spin...Spin (positive) 24-Jul-06 05:29 pm Posted by: InvestorMike Subscriptions are up, now it is time for QCKG to make money off of them. 2% margins are good, but there is potential for more. Things can only get better, buy now QCKG has a good future. subs # came in below expectations (positive) 24-Jul-06 05:51 pm Posted by: GamerInvestor42 QCKG report was overall pretty good; There may be some negative reaction because there were some below expectations numbers on the acquisition cost per subscriber and the net added subscribers. But the rest wasn’t’ that bad, price will dip initially, but will rebound and go up in a few days. QuickGames beats by $0.06; guides below consensus (23.76 ) : Reports Q2 (Jun) GAAP earnings of $0.24 per share, $0.06 better than the Reuters Estimates consensus of $0.18; revenues rose 46% year/year to $239.35 mln vs the $241.7 mln consensus. NFLX reports Q2 net subscriber additions of 303k vs 350.8k street expectation. Co issues downside guidance for Q3, sees Q3 revs of $249-254 mln vs. $257.49 mln consensus; sees GAAP net income of $5 million to $10 million. Co sees Q4 revs of $267-272 mln vs $283.1 mln consensus; sees GAAP net income of $3.8 million to $8.8 million. Co issues downside guidance for FY06, sees FY06 revs of at least $980 mln vs. $1.01 bln consensus and prior guidance of at least $990 mln; sees GAAP net income of $30 mln to $35 mln. strong report but guidance was weak (neutral) 24-Jul-06 05:55 pm Posted by: InterestedStreetGuru Analysts had lots of questions during the conference call as to why the guidance was weak given this Q was strong; their answers could have been better. The numbers weren't that bad; Still lots of growth yr/yr, but in this market if there is even a whiff of bad news, everyone fires first and asks questions later. It may just need to come down to how much of a gamble are you willing to take
75

Incredible Performance (positive) 24-Jul-06 07:59 pm Posted by: Cali_Investor Gross margin up AGAIN from 34% to 37%. Net margin up from 2% to 10% (11% excluding stock-based compensation). Subscriber and earnings guidance intact, even as lower-priced plans roll out. That means a stronger competitive moat than ever, with no hit to profitability. Management continues to deliver on its longstanding promise of balancing growth and earnings. As both revenue and margins continued to climb this quarter, much higher-than-expected income led management to invest more heavily in growth, which means higher incremental subscriber acquisition costs (it costs more to sign up the millionth sub than the first or the 500,000th). As a result, seasonally slow Q2 gross adds equaled 78% of Q1's, versus 75% in 2005 and 76% in 2004. Not much improvement, until you look at how badly $3 gas and rising interest rates have squeezed other consumer entertainment services -- satellite radio gross additions down 19% for the first time in industry history, 2nd quarter IPOD sales down 10% for the first time in Apple's history. QCKG turned in a spectacular performance in a lousy quarter for consumer spending. This ideal growth company has actually become a value play. Come and going (positive) 24-Jul-06 08:27pm Posted by: Fill-the-Gaps The time is now for Quickgames. They have been doing good, but growth is about to really take off. Not much guidance, but they are ready to deal with new competition. They hit some key expectations and the stock is going to be rewarded for it. Buy as quickly as possible. This does not take a rocket scientist! (positive) 24-Jul-06 09:19 pm Posted by: Fill-the-Gaps With a boatload of cash, positive year over year growth prospects, and a competitive market'first-mover'advantage, I'd wager a month's pension this is an easy 5 year double.
76

Reasons for cautious investing (positive) 24-Jul-06 10:24 pm Posted by: PlayOnTheStreet I think nervousness about this stock can be attributed to these factors. Threat of Competition: The market is still untapped (5 million users out of potentially more than 100 million game players). Competitors will arise – but that will only propel the market further. QuickGames is the current leader in a brand new and rapidly growing space. And, management continues to execute in a way that demonstrates they intend to expand their lead Threat of High CAC: This has been played to death. But the conference call gave clear indication that management has carefully measured the amount of $/Customer they are willing to spend (based on the contribution margin provided over the lifetime of the customer). And they won’t spend more. The fact that the CAC increased is not a factor – what is more important was the message between the lines. Management has the capability to easily measure, track and manage the specific contribution of each customer to the bottom line. This extremely powerful, and a nice side benefit of QuickGames recurring income, web based, highly scalable business model. I think today’s prices provide a great value play – in a growth company hitting all its numbers. As a long term investment – QCKG is extremely well positioned right now. Future looks bright (positive) 24-Jul-06 11:51pm Posted by: ForwardLooker Quickgames has good potential. The value for the services is great. Where X-box 360 games cost approx. $60 to buy, QCKG offers a variety of games for download starting at only $5.99 a month. People are seeing this value, just look at the yr over yr subscriber growth and revenue.
77

2nd investment Decision (there will be the opportunity to review financial info again) For your performance you are given another chance to make your investment decision. Your decision at this time will be the one that counts for your performance. Before making your decision, you may review the same quarterly information as before by clicking on this link. You currently have the opportunity to make an investment decision. You can either purchase up to 400 more shares of QuickGames or sell some or all your shares of QuickGames. Money not invested (and proceeds from the sell) will be placed in a six month low risk government security. All investments will be sold at the end of six months. What is your investment decision: Sell 400 Sell 300 Sell 200 Sell100 Hold Buy 100 Buy 200 Buy 300 Buy 400 Shares Shares Shares Shares Shares Shares Shares Shares Shares
78

Perception, attitude and Wrap up questions (message board related questions for message board group only). The question order may be changed and some questions end points flipped INSTRUCTIONS On the next few screens you will be asked a series of questions about your perception of different elements related to the information that you received and the decision that you made. You will be given an item to focus on and will give your perception of that item based on a 7-point scale. The example below explains how to use the scales. Example: What is your perception of the information presented as whole? Helpful Unhelpful 1 2 3 4 5 6 7 The respondent in this example selected 3. This means that the person perceived the message to be more helpful than unhelpful, but not extremely helpful which would have been represented by selecting 1. Neutral would have been represented by selecting 4.
79

Questions: What is your perception of the investment? Good Bad 1 2 3 4 5 6 7 Positive Negative 1 2 3 4 5 6 7 Wise Unwise 1 2 3 4 5 6 7 Expensive Cheap 1 2 3 4 5 6 7 Smart Stupid 1 2 3 4 5 6 7 Interesting Uninteresting 1 2 3 4 5 6 7 Appealing Not Appealing 1 2 3 4 5 6 7 Superior Inferior 1 2 3 4 5 6 7 Acceptable Unacceptable 1 2 3 4 5 6 7 Favorable Unfavorable 1 2 3 4 5 6 7 Sensible Foolish 1 2 3 4 5 6 7
80

What is your perception of the content of the information presented as a whole? Plausible Implausible 1 2 3 4 5 6 7 Believable Unbelievable 1 2 3 4 5 6 7 Vivid Vague (Dull) 1 2 3 4 5 6 7 What is your perception of the message board information as a whole? Positive Tone Negative tone 1 2 3 4 5 6 7 What is your perception of the source of the information as a whole? Credible Non-credible 1 2 3 4 5 6 7 Expert Non-expert 1 2 3 4 5 6 7 Trustworthy Untrustworthy 1 2 3 4 5 6 7 Similar to self Dissimilar to self 1 2 3 4 5 6 7
81

Demographic Questions: Next you will be asked a series of wrap-up questions. 1. What is your level of investing experience? High None 1 2 3 4 5 6 7 2. How confident are you in your final investment decision Very low confidence Very high confidence
1 2 3 4 5 6 7 8 9 10
3. How often do you use the Internet for investment information
a. Very often b. Often c. Occasionally d. Rarely e. Never
4. Internet stock message boards are a great source of reliable investment information a. Strongly Agree b. Agree c. Neutral d. Disagree e. Strongly Disagree
5. What is your gender? ___M ___F 6. How many years have you been investing?
82

7. Is English your first language? ___________ (yes or no) 8. If not what is your first language? ______________ 9. Company Websites are a great source of reliable investment information
a. Strongly Agree b. Agree c. Neutral d. Disagree e. Strongly Disagree
10. What was your undergraduate major and minor?
_____________________________ 11. If you have a master’s degree, what was its emphasis?
_________________________ 12. Internet stock message boards are a great way to get scammed
a. Strongly Agree b. Agree c. Neutral d. Disagree e. Strongly Disagree
13. How many accounting courses have you completed?
a. 0 b. 1 c. 2 d. 3 e. 4 or more
14. How many finance courses have you completed? a. 0 b. 1 c. 2 d. 3 e. 4 or more
15. I primarily shell short. a. Strongly Agree b. Agree c. Disagree d. Strongly Disagree e. I do not know what selling short means
83

16. I primarily do online trading
a. Strongly Agree b. Agree c. Disagree d. Strongly Disagree e. I do not do any trading
17. What information did you use to arrive at your investment decision?
18. Consider only the following four investments and rank them in terms of your
preference for investing your next $5,000, from your most preferred (1) to least preferred (4) (on the actual instrument, it is clearer that a ranking is being performed)
a. There is a slight chance (1 in 5) of some loss of principle, but the return is around 12 percent. ________
b. A speculative investment (3 in 5 chances of some loss of principal), but could possibly yield a 30 percent return. ______
c. There is a somewhat higher chance (2 in 5) of some loss of principal, but the return is around 16 percent. __________
d. The principal is assured and offers a guaranteed return of approximately 8 percent annually. _________
84

REFERENCES
Antweiler, W., and M. Z. Frank. 2004a. Does talk matter? Evidence from a broad cross
section of stocks. Working paper, University of British Columbia, 31.
———. 2004b. Is all that talk just noise? The information content of Internet stock message boards. The Journal of Finance LIX (3):1259-1294.
Ashbaugh, H., K. M. Johnstone, and T. D. Warfield. 1999. Corporate reporting on the Internet. Accounting Horizons 13 (3):241-257.
Bell, B. A. 2006. Dealing with false Internet rumors: A corporate primer. wallstreetlawyer.com 1998 [cited 4/20/2006]. Available from http://library.findlaw.com/1999/Aug/1/130891.html.
Bloomfield, R., and R. Libby. 1996. Market reactions to differentially available information in the laboratory. Journal of Accounting Research 34 (Autumn):183-207.
Bloomfield, R., R. Libby, and M. Nelson. 2003. Do investors over-rely on old elements of the earnings time series? Contemporary Accounting Research 20 (Spring):1-31.
Bohme, R., and T. Holz. 2006. The effect of stock spam on financial markets. In Workshop on the Economics of Information Security. Univ. of Cambridge, UK.
Bonner, S., and B. Lewis. 1990. Determinants of auditor expertise. Journal of Accounting Research 28 (Supplement):1-20.
Borgida, E., and R. E. Nisbett. 1977. The differential impact of abstract vs. concrete information on decisions. Journal of Applied Social Psychology 7:258-271.
Bouwman, M. J. 1982. The use of accounting information expert versus novice behavior. In Decision Making an Interdisciplinary Inquiry, edited by G. R. Ungson and D. N. Braunstein. Boston: Kent Publishing Company, 134-167.
———. 1984. Expert vs novice decision making in accounting: A summary. Accounting, Organizations and Society 9 (3/4):325-327.
Bouwman, M. J., P. A. Frishkoff, and P. Frishkoff. 1987. How do financial analysts make decisions? A process model of the investment screening decisions. Accounting, Organizations and Society 12 (1):1-29.
Breckler, S. J. 1984. Empirical validation of affect, behavior, and cognition as distinct components of attitude. Journal of Personality and Social Psychology 47:1191-1205.
85

Burns, J. A. J. 2002. Battling the unknown: Online "cybersmears" by anonymous employees. Employee relations law journal 28 (2):47-71.
Carson, J., and J. Felton. 2004. New technology issues for corporate governance: Internet message boards. In International Corporate Governance, edited by J. C. F. Lufkin: Euromoney Books, 184-194.
Cast, W. 2005. Going South. Chicago: Dearborn Trade Publishing.
Crawford, A. P. 1999. When those nasty rumors start breeding on the Web, you've got to move fast. Public Relations Quarterly 44 (4):43-45.
Das, S. R., and M. Y. Chen. 2001. Yahoo! for Amazon: Opinion extraction from small talk on the Web. Working paper, Santa Clara University, 45.
Das, S. R., A. Martinez-Jerez, and P. Tufano. 2005. eInformation: A clinical study of investor discussion and sentiment. Financial Management 34 (3):103-137.
Debreceny, R., and G. L. Gray. 2001. The production and use of semantically rich accounting reports on the Internet: XML and XBRL. International Journal of Accounting Information Systems (2):47-74.
Debreceny, R., G. L. Gray, and A. Rahman. 2002. The determinants of Internet financial reporting. Journal of Accounting and Public Policy:371-394.
Department of Justice. 2006. Long Island Man Arrested for Internet “Pump and Dump” Stock Scheme Involving False Claims Designed to Prey on Public Concern about Terrorism and “Bird Flu” Virus. [cited 4/20/2006]. Available from: http://newyork.fbi.gov/dojpressrel/pressrel06/ny040606a.htm.
DiFonzo, N., and P. Bordia. 1997. Rumor and prediction: Making sense (but losing dollars) in the stock market. Organizational Behavior and Human Decision Processes 71 (3):329-353.
Dull, R. B., A. W. Graham, and A. A. Baldwin. 2003. Web-based financial statements: hypertext links to footnotes and their effect on decisions. International Journal of Accounting Information Systems (4):185-203.
Eagly, A. H., and S. Chaiken. 1993. The Psychology of Attitudes. Belmont: Wadsworth Group/Thomson Learning.
Eagly, A. H., A. Mladinic, and S. Otto. 1994. Cognitive and affective bases of attitudes toward social groups and social policies. Journal of Experimental Social Psychology 30:113-137.
Elliott, B., W. 2006. Are investors influenced by pro forma emphasis and reconciliations in earnings announcements? The Accounting Review 81 (1):113-133.
86

Elliott, B., W., F. Hodge, and K. E. Jackson. 2006. The association between non-professional investors' information choices and their portfolio returns: The importance of investing experience. Working paper, University of Illinois at Urban-Champaign, 38.
Elliott, W. B., F. Hodge, J. Kennedy, and M. Pronk. 2007. Are M.B.A. students a good proxy for nonprofessional investors? Accounting Review 82 (1):139-168.
Epstein, M., and M. Pava. 1994. Individual investors' perceptions on the summary annual report: A survey approach. Journal of Applied Business Research:60-67.
Ettredge, M., V. J. Richardson, and S. Scholz. 2002. Dissemination of information for investors at corporate Web sites. Journal of Accounting and Public Policy:357-369.
Felton, J., and J. Kim. 2002. Warnings from the Enron Message Board. Journal of Investing 11 (2):29-53.
Frederickson, J., and J. Miller. 2004. The effects of pro forma earnings disclosures on analysts' and nonprofessional investors' equity valuation judgments. The Accounting Review 79 (3):667-686.
Frieder, L. L., and J. Zittrain. 2007. Spam works: Evidence from stock touts and corresponding market activity. In Berkman Center Research Publication: Purdue University, 42.
Gu, B., P. Konana, A. Liu, B. Rajagopalan, and J. Ghosh. 2006. Predictive value of stock message board sentiments. In McCombs Research Paper Series. Austin: Univerisy of Texas, 36.
Haddock, G., and T. Huskinson. 2004. Individual differences in attitude structure. In Contemporary Perspectives on the Psychology of Attitudes, edited by G. Haddock and G. R. Maio. New York: Psychology Press, 35-56.
Hawkins, D., and B. Hawkins. 1986. The Effectiveness of the Annual Report as a Communication Vehicle. Morristown, NJ: Financial Executives Research Foundation.
Hodge, F. 2001. Hyperlinking unaudited information to audited financial statements: effects on investor judgments. The Accounting Review 76 (4):675-691.
———. 2003. Investors' perceptions of earnings quality, auditor independence, and usefulness of audited financial information. Accounting Horizons (Supplement):37-48.
87

Hodge, F., J. Kennedy, and L. Maines. 2004. Does search facilitating technology improve the transparency of financial reporting ? The Accounting Review 79 (3):687-704.
Hodge, F., and M. Pronk. 2005. The impact of expertise and investment familiarity on investors' use of online financial report information. Working paper, University of Washington, 38.
———. 2006. The impact of expertise and investment familiarity on investors' use of online financial report information. Working paper, University of Washington, 38.
Huskinson, T., and G. Haddock. 2004. Individual differences in attitude structure: Variance in the chronic reliance on affective and cognitive information. Journal of Experimental Social Psychology 40:82-90.
Joyce, E., and G. Biddle. 1981. Are auditors' judgments sufficiently regressive. Journal of Accounting Research 19 (2):323-349.
Kadous, K., L. Koonce, and K. L. Towry. 2005. Quantification and persuasion in managerial judgment. Contemporary Accounting Research 22 (3):643-686.
Kesmodel, D., and J. R. Wilke. 2007. Whole Foods is hot, Wild Oats a Dud -- So said 'Rahodeb'; Then again, Yahoo poster was a Whole Foods staffer, the CEO to be precise The Wall Street Journal July 12, 2007.
Kimmel, A. J. 2004a. Rumors and Rumor Control. Mahwah: Lawrence Erlbaum Associates.
———. 2004b. Rumors and the financial marketplace. The Journal of Behavioral Finance 5 (3):134-141.
Koenig, F. 1985. Rumor in the Marketplace. Dover: Auburn House Publishing.
Kraus, S. J. 1995. Attitudes and the prediction of behavior: A meta-analysis of the empirical literature. Personality and Social Psychology Bulletin 21:58-75.
Langevoort, D. C. 2002. Taming the animal spirits of the stock markets: A behavioral approach to securities regulation. Northwestern University Law Review:135-188.
Leinweber, D. J., and A. N. Madhavan. 2001. Three hundred years of stock market manipulations. The Journal of Investing (Summer):1-10.
Libby, R. 1995. The role of knowledge and memory in audit judgment. In Judgment and Decision-Making Research in Accounting and Auditing, edited by R. Ashton and A. H. Ashton. Cambridge: Cambridge University Press, 176-206.
Libby, R., R. Bloomfield, and M. Nelson. 2002. Experimental research in financial accounting. Accounting, Organizations and Society 23 (7):625-640.
88

Libby, R., and J. Luft. 1993. Determinates of judgment performance in accounting settings: Ability, knowledge, motivation, and environment. Accounting, Organizations and Society 18 (5):425-450.
Maines, L., and L. S. McDaniel. 2000. Effects of comprehensive-income characteristics on nonprofessional investors' judgments: The role of financial-statement presentation format. The Accounting Review (April):179-207.
Marston, C., and A. Polei. 2004. Corporate reporting on the Internet by German companies. International Journal of Accounting Information Systems (5):285-311.
McGuire, W. J. 1985. Attitudes and attitude change. In The Handbook of Social Psychology, edited by G. Lindzey and E. Aronson. New York: Random House, 233-346.
Morrison, J., and D. Vogel. 1998. The impacts of presentation visuals on persuasion. Information & Management (33):125-135.
Nisbett, R. E., and L. Ross. 1980. Human Inference: Strategies and Shortcomings of Social Judgment. Englewood Cliffs: Prentice-Hall.
NYSE. 2000. Shareownership 2000. New York: NYSE.
Osgood, C. E. 1965. Cross cultural comparability of attitude measurement via multi-lingual semantic differentials. In Recent Studies in Social Psychology, edited by S. Steiner and M. Fishbein. New York: Holt, Rinehart & Winston.
Osgood, C. E., G. J. Suci, and P. H. Tannenbaum. 1957. The Measurement of Meaning. Urbana: University of Illinois Press.
Oskamp, S., and P. W. Schultz. 2005. Attitudes and Opinions. Third ed. Mahwah: Lawrence Erlbaum Associates.
Perloff, R. M. 1993. The Dynamics of Persuasion. Edited by J. Bryant. Hillsdale: Lawrence Erlbaum Associates.
Rose, J. M. 2001. The effects of multimedia-induced affective states on recall and decision-making by individual investors. International Journal of Accounting Information Systems (2):22-40.
Rose, J. M., F. D. Roberts, and A. M. Rose. 2004. Affective responses to financial data and multimedia: The effects of information load and cognitive load. International Journal of Accounting Information Systems (5):5-24.
Rosnow, R. L. 2001. Rumor and gossip in interpersonal interaction and beyond: A social exchange perspective. In Behaving Badly, edited by R. M. Kowalski. Washington, DC: American Psychological Association, 203-232.
89

Scannell, K. 2007. SEC opens informal inquiry of Whole Foods CEO postings. The Wall Street Journal, July 14, 2007.
Schwarz, N., and G. L. Clore. 1988. How do I feel about it? The informative function of affective states. In Affect, Cognition, and Social Behavior: New Evidence and Integrative Attempts, edited by K. Fiedler and J. Forgas. Toronto: Hogrefe, 44-62.
Taylor, S. E., and S. T. Fiske. 1978. Salience attention and top of the head phenomena. Advances in Social Psychology 11:249-288.
Taylor, S. E., and S. C. Thompson. 1982. Stalking the elusive "vividness" effect. Psychological Review 89 (2):155-181.
Trafimow, D., and P. Sheeran. 2004. A theory about the translation of cognition into affect and behavior. In Contemporary Perspectives on the Psychology of Attitudes, edited by G. Haddock and G. R. Maio. New York: Psychology Press, 57-75.
Tversky, A., and D. Kahneman. 1974. Judgment under uncertainty: Heuristics and biases. Science:1124-1131.
Verplanken, B., G. Hofstee, and H. J. W. Janssen. 1998. Accessibility of affective versus cognitive components of attitudes. European Journal of Social Psychology 28:23-35.
Wysocki, P. D. 1999a. Cheap talk on the Web: The determinants of postings on stock message boards. Working paper, MIT, 34.
———. 2006. Investor relations and stock message boards. MIT 1999b [cited 4/21/2006 2006]. Available from http://mit.edu/wysockip/www/535/webchat.pdf.
———. 2000. Private information, earnings announcements and trading volume. Working paper, MIT, 29.
Yahoo upgrades finance portal. 2006. Red Herring, April 4, 2006.
Zhang, Y. C., and P. E. Swanson. 2007a. Investors’ hold sentiment conveys a buy side signal– Evidence from Internet stock message boards Arlington. Working paper, University of Texas at Arlington, 32.
———. 2007b. Issues in creating a sentiment measurement based on Internet stock message boards. Working paper, University of Texas at Arlington, 38.
90