Embed Size (px)
Citation preview

1
Olam International Limited
Investment in Greenfield Oil Palm Plantations in Gabon
15th November 2010 | Singapore
2
Recap: In our 2009 corporate strategy, we articulated the intent of scaling up our W. Africa Palm presence
Goal
sStr
ateg
ic t
hru
sts
• Increase Intrinsic Value by 3-4x over the next two 3-year cycles• Pursue profitable growth & improve margin structure by selective participation in attractive value chain adjacencies (upstream & mid-stream)• Maintain financial and strategic flexibility for a wide range of economic scenarios (developing minimalist, balanced & unconstrained plans)• Be widely recognised as a responsible and sustainable value creator
Enab
lers
Excellence in execution Capital efficacyM&A effectiveness People & Values• Institutionalise Program Management
capabilities• Acquire capabilities in upstream plantation/
farm management & midstream VA processing• Complexity management• Scalable IT, Risk, Control & Compliance systems
• Continue to grow global talent pool• Deepen entrepreneurial culture• Continue to embed stretch and
ambition• Create ownership culture• Build empowered teams
• Actively build M&A pipeline and develop prioritisation
• Deepen due diligence capabilities• Institutionalise best-in-class
integration practices
• Strengthen capital structure and build financial flexibility
• Continuously improve overhead and capital productivity
Downsize/exit/ prune
unattractive activities
Build onlatent assets
Optimise and extract
full valuefrom core
Invest to achieve
integrated value chain leadership
Selectively expand into
attractive value chain
adjacencies
To be the leading global supply chain manager and processor of agri-commodities by:• Serving growers and customers globally • Pursuing select scalable & attractive niches in upstream (plantations/farming) and mid-stream (value added processing)• Capitalising on our emerging markets expertiseV
isio
n
Our governing objective is to maximise long term intrinsic value for our continuing shareholdersPursue 3 key drivers: 1) Open up Capital Spreads (ROE-KE, ROIC-WACC); 2) Increase the Rate of Profitable Growth; and 3) Sustain duration of growth
Coffee, Edible Nuts, W. Africa Palm
Cocoa, Sugar, Rice, Dairy, Spices &
Dehydrates, Grains & Rubber
Cotton, Sesame, Pulses, Timber
Select product origins and profit centres
Packaged Foods Business (PFB) in W. Africa,
Commodity Financial Services (CFS), Agri-
Inputs (fertiliser)
•Pursuing select scalable & attractive niches in upstream (plantations/farming)
W. Africa Palm
On strategy, on plan

3
Our participation to date has validated our strategy to expand our presence in palm plantations
• In-line with 2009 corporate strategy, Olam is stepping up its participation in West Africa palm
• Olam entered into the SIFCA JV in 2007; improved performance has increased our confidence to invest in large scale palm plantations in West Africa
- Yields can be improved through best plantation management practices – improvement of >30%
- Labour can be trained to improve productivity
- It is possible to achieve efficiencies in estate and milling costs
• Olam is confident of assembling a capable team to develop Palm greenfield in Gabon

4
We are now further expanding our upstream Palm presence: Highlights of Gabon investment
Government commitment to support
Palm
Investment and returns
• Securing land bank of 300K Ha provides profitable scaling opportunities
• Income Tax holiday for 16 years from FY11
• Exemption from VAT/duties on machinery and inputs; further VAT exemption on gas, oil and fertilisers
• Total investment of ~US$236M to be largely spent over first seven years; Olam’s equity share is 70% or ~US$83M
• To be financed on 1-1.5:1 Debt/Equity ratio
• EBITDA of US$100-120M ; EBITDA margin ~50-60% at peak productivity
• Equity IRR: 24 - 29%; Avg. ROE: 35-40%
• 70/30 Joint venture between Olam and Republic of Gabon to commit 300K Ha land bank for RSPO compliant palm plantation; 50K Ha to be developed in Phase 1
• Planting to start in early 2012 with targeted completion by 2016
• Expected FFB yields of up to 26MT/Ha
• Duty free CPO exports to EU; regional West Africa trade
Investment overview

5
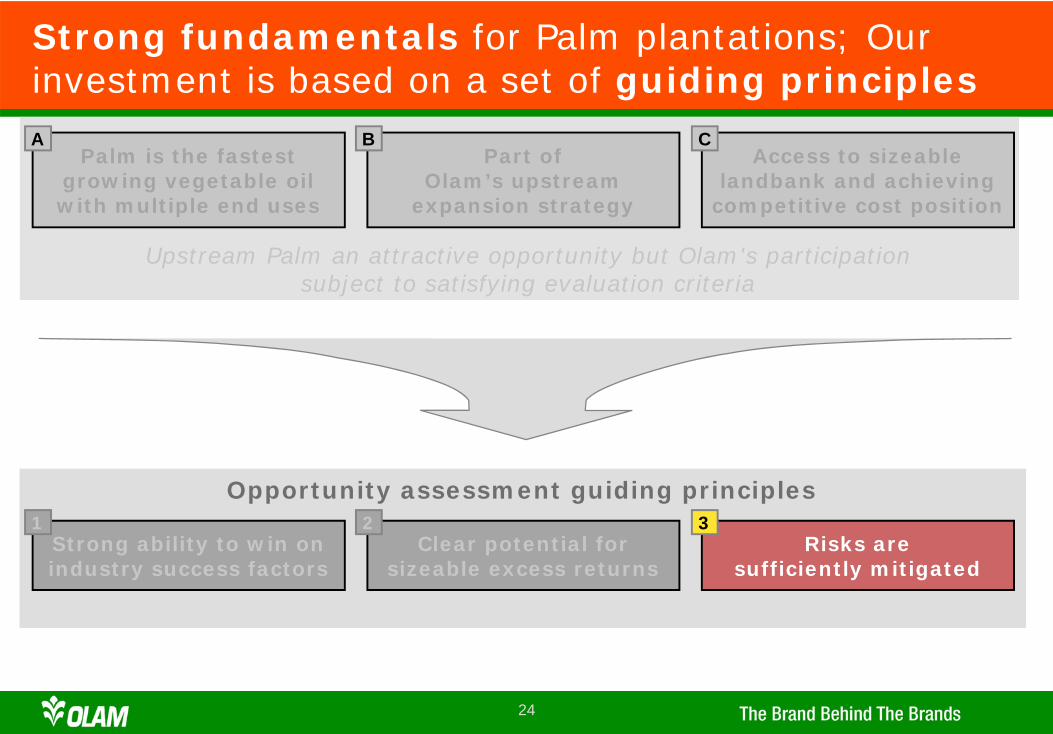
Strong fundamentals for Palm plantations; Our investment is based on a set of guiding principles
Strong ability to win on industry success factors
Clear potential forsizeable excess returns
Risks aresufficiently mitigated
Opportunity assessment guiding principles
Part of Olam’s upstream
expansion strategy
Palm is the fastest growing vegetable oil with multiple end uses
Access to sizeable land bank and achieving
competitive cost position
Upstream Palm an attractive opportunity but Olam's participation subject to satisfying evaluation criteria
A B C
1 2 3

6
Demand: Plenty of headroom for demand growthdriven by increasing need for food and biofuels
High growth to continue as Palm is still viewed favourably...
...as an edible oil in developing and industrial/biofuel in developed mkts
~4% (1.8M MT) of total CPO end use was for biodiesel in 2009
Consumptionfor food
Industrialand biofuel
Feed, seed,waste
Stocks
Note: *Low case = 83M MT; High case = 123M MT
A

7
0
20
40
60
80
100
2020 basecase demand
Stocks
Biodiesel(13 MT)
Industrial(14M MT)
Food(60M MT)
100
2020 growthas usual
ROW (11M MT)
76
CPO supply and demand (M MT)
Malaysia(25M MT)
Indonesia(40M MT)
Factors that can bridge the gap
• Established origins:-Malaysia: Improved yields due to replanting
-Indonesia: New planting in Kalimantan, improved yields due to replanting
• Development of new origins-Africa: Gabon, Nigeria, Cameroon, Liberia, DRC, etc.
-LATAM: Brazil, Columbia, Venezuela-SE Asia: Thailand, PNG, other Indochina
Supply: SE Asia has room to grow as lead supplier, but the industry will need new growing areas
gap
~US$20B in investment required to fill the gap
1
2
5.6% 2010-20 CAGR
3.6% 2010-20 CAGR
Olam now has access to scalable prime land with suitable agro-
climatic conditions
A

8
Price: CPO prices forecast to remain strong within the long-term avg. price range of US$700–900/MT
B
Avg analyst CPO price forecast (long-term)
Avg analyst CPO price forecast (near-term)
Actual avg. historic
Max:743
Min:680Min:
577
Max:850
Max:1,198
Min:512
Min:749
Max:950
Min:716
Max:950 Max:
897Max:770
Min:715
Min:740
Note: World bank price forecasts as a Aug ’10; Historical max and min based on monthly averages
Source: Industry reports
Current CPO price:US$1,120
Forecast avg long term price range

9
0
20
40
60
80
100%
2007
99%
2009
74%
6%
20%
2010Actual
60%
19%
6%
15%
2015EPrevious
40%
15%
10%
35%
1%
0
20
40
60
80
100%
2007
99%
2009
74%
6%
20%
2010Actual
60%
19%
6%
15%
2015ERevised
30%
20%
6%
44%
1%
Supply Chain/VAS Upstream Mid/downstream CFS
Olam PBT breakdown by value chain
Significant inroads made in entering more profitable parts of the value chain
B

10
Upstream portfolio mostly contributing assets; palm one of the two gestating crops
Gestating
Coffee in Laos
Palm in Gabon
Currently contributing
Dairy in Uruguay
Peanuts & soybeans in Argentina
Almonds in Australia & the US
Rice in Nigeria & Mozambique
Timber in Gabon and Mozambique
Cotton in IVC and Mozambique
Palm in IVC (SIFCA)
Balanced between immediate cash flow and long term contributors
Rubber in IVC, Ghana & Nigeria (SIFCA)
B

11
Strong fundamentals for Palm plantations; Our investment is based on a set of guiding principles
Strong ability to win on industry success factors
Clear potential forsizeable excess returns
Risks aresufficiently mitigated
Opportunity assessment guiding principles
Part ofOlam’s upstream
expansion strategy
Palm is the fastest growing vegetable oil with multiple end uses
Access to sizeable landbank and achieving
competitive cost position
Upstream Palm an attractive opportunity but Olam's participation subject to satisfying evaluation criteria
A B C
1 2 3

12
• Land availability and favourable agro –climatic conditions
• Access to 300K Ha of sizable, contiguous land in favourable agro climatic conditions for growing Palm
• Expected yields of up to 26 MT/Ha FFB
Investment opportunity satisfies key success factors
Comments
* Expert assessment on land suitability and climate
Criteria
Key s
ucc
ess
fact
ors
1
• Licensing and local community support
• No licensing or community issues envisaged; small holder program planned after phase I
• Labour availability at comparablerates
• Availability of labour due to long existing tradition in upstream industries
• Labour costs likely to face fewer inflationary pressures than SE Asia
• Environmental sustainability
• RSPO certification would provide superior market access
• Cost competitiveness and market access
• Project and operating costs are comparable to SE Asia• Proximity to growing EU and African markets
• Plantation management expertise
• Assembling experienced team; support from experts• Existing internal expertise in upstream
2
3
4
5
6

13
Olam’s 300K Ha bank of suitable land in Gabon offers an increasingly rare opportunity
Source: Industry reports
Limited areas where Palm can be grown
Equator6-8ºN
6-8ºS
Major producersMinor / potential producers
1
Large greenfield land tracts increasingly difficult to find
Forest moratorium to stymie palm “Indonesia's plans to halt forest clearing will
slow the aggressive expansion of plantations.. leading to higher cost”
Reuters (Aug 2010)
2
Demand for palm oil fuels land-grabbing“Since 2006, 632 communities [in
Indonesia] have clashed with palm oil operators - lack of community consult-ation, required as part of a project's EIA”
Reuters (6 Jul 2010)
Palm oil in [some West African countries]:“Govt is very supportive...but investors have
not been able to overcome local issues”Palm expert (Sep 2010)
Gabon located
directly on the equator

14
SE Asia facing labour shortages and wage inflation; Gabon relatively less affected
3
Wage rates in West Africa are comparable and relatively stable;
sufficient labour available
Note: *Average change in consumer price index, 2000-2010 used as proxy for wage inflation Source: Industry reports
Malaysia palm oil reliant on imported labour, but foreign workers now
getting better pay at home
Labour woes hit palm oil“Malaysia, the world’s No. 2 palm oil producer, will miss its output target of 18.1 million tonnes because of a shortage of foreign labour even as yields recover…”
The Star Online (4 Mar 2010)
Labour shortage to hit Malaysia’s palm output “MPOB Chairman Sabri Ahmad said Indonesian plantation workers make better pay at home …while employers in Malaysia have trouble hiring…”
Reuters (3 Mar 2010)

15
230-250250-300
~300
~520~560
Dep & amort
FreightTaxes
Interest
~530
Overheads
0
200
400
US$ 600
Indonesia Malaysia Gabon
Total costs including tax and freight(US$ / MT)
Cash costs
Note: Indonesia imposes an export tax of 1.5% if CPO prices reach US$700/MT, 3% if US$751-800 and scaling up to a maximum of 25% at US$1,250Source: Industry reports
Total costs will be competitive with established origins
4

16
Fertilizer & upkeep and labour costs are the biggest cost drivers
•Gabon’s cost comparability driven by:
-Productivity: Yields up to 26MT FFB per hectare
-Wage: Current differential with Indonesia to be offset by inflation
-Fertilizer: Access through own sources at competitive prices
-Overheads: G&A cost synergies with other businesses
-Concessions: VAT and import duty waivers
-Depreciation & amortization: Land at no cost
-Taxes: Tax holiday for 16 years
-Freight: US$30 to Europe
4
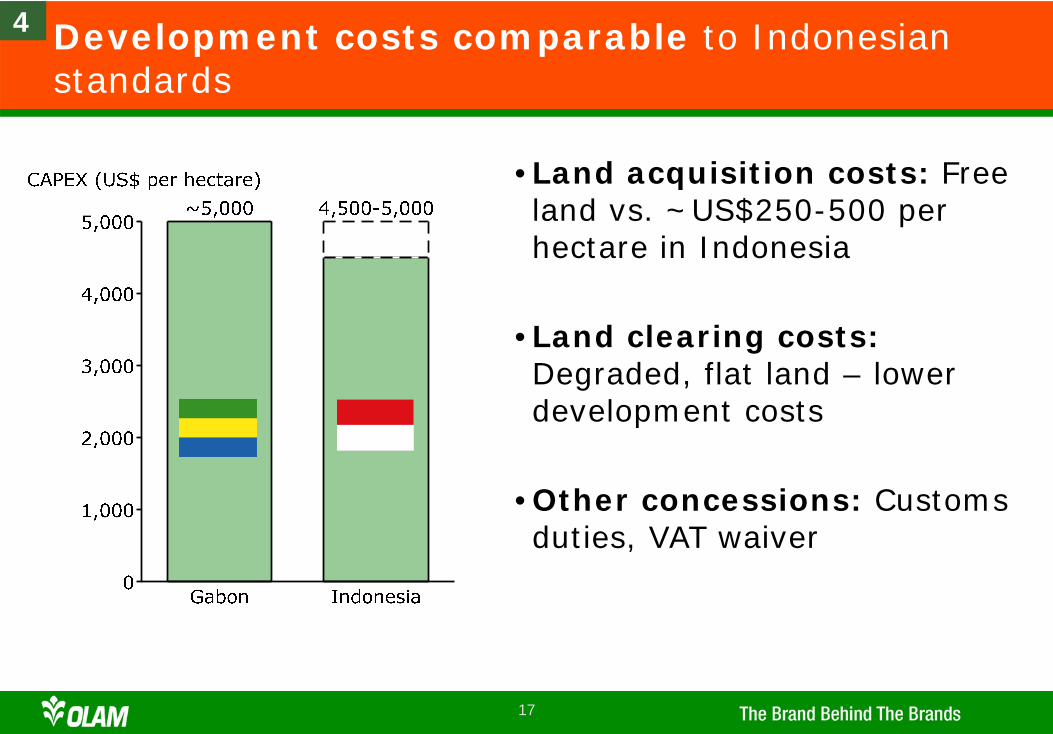
17
Development costs comparable to Indonesian standards
•Land acquisition costs: Free land vs. ~US$250-500 per hectare in Indonesia
•Land clearing costs:Degraded, flat land – lower development costs
•Other concessions: Customs duties, VAT waiver
4

18
0
2
4
6
2000
2.2
2010
3.1
2020
5.0
West African palm oil consumption(M MT)
Rising GDP will drive West African demand growth, making it a sizable opportunity
Edible oil consumption for food trends along with GDP growth
~2M MT in additional demand for palm oil by 2020
Source: Industry reports
Cons.PPP
2020 GDP per capita will increase nearly 2x, leaving considerable headroom for growth
Current production
4

19
Low case
• 85% of EU palm imports are from Malaysia/Indo, but increased demand from India and China will put pressure on supply
• Palm is likely to be covered by EU mandate given MPOB report showing emissions savings far greater than the required 35%
• Even without the mandate, EU is still a large and growing market
• 75% of imports are CPO; zero custom duty for imports from Gabon vs. 4%
• RSPO certification increasingly important; Gabon plantation will meet requirements
EU market will easily absorb Olam’s supply; biofuel mandates would provide even further upside
Note: *Feed, waste and otherSource: Industry reports
9.8%
12.4% High case
Base case
“[The EU trade official] found our study compelling and told us that the mandate should cover palm by the middle of 2011.”
Senior Fellow, MPOB
4

20
0
20
40
60
80
100%
Total production
Certified
Not certified
45
RSPO certified
NBPOL
7 OthersSukajadi Sawit
WilmarMusim Mas
London SumatraSIPEFCargill
3 OthersFelda
United PlantationsKL Kepong
Wilmar
IOI Group
Sime Darby
3Worldwide CPO production (M MT)
RSPO certification would provide superior market access
Only 7% of palm oil RSPO certified, making it a competitive advantage
Gabon plantation is well positioned to be fully RSPO compliant
Indonesia
Malaysia
PNG
“Structural increase in demand for sustainable palm oil”
Major food players switching to RSPO only palm:
•Land not to be cleared until environmental impact & high conversion value assessments are complete
-Initial assessment looks positive, as plantation is entirely located on degraded land
•In addition, Olam’s mill will be compliant given the methane capture and effluent treatment to be installed
Gabon likely to be 100% RSPO certified
5

21
Strong fundamentals for Palm plantations; our investment is based on a set of guiding principles
Strong ability to win on industry success factors
Clear potential forsizeable excess returns
Risks aresufficiently mitigated
Opportunity assessment guiding principles
Part ofOlam’s upstream
expansion strategy
Palm is the fastest growing vegetable oil with multiple end uses
Access to sizeable landbank and achieving
competitive cost position
Upstream Palm an attractive opportunity but Olam's participation subject to satisfying evaluation criteria
A B C
1 2 3

22
Total development costs of ~US$236M; Olam equity investment of ~US$83M
GabonGovt Equity
OlamEquity
Debt
236
Note: Assumes a debt-equity ratio of 1:1; If the ratio is 1.5:1, then Olam’s equity contribution would be US$66M

23
650(600)
715(665)
800(750)
900(850)
Revenues (US$M) 168 186 210 238
EBITDA (US$M) 78 97 120 148
EBITDA Margin (%) 46% 52% 57% 62%
Equity IRR (%) 19% 24% 29% 36%
ROE (%) 36% 48% 64% 82%
CPO prices (US$/MT)*
Project expected to be highly profitable, providing superior and sizeable excess returns
* X/(Y); where X is CPO price assumption until 2020 and (Y) is after 2020Note: Metrics are at peak productivity – years FY24 to 28
24
Strong fundamentals for Palm plantations; Our investment is based on a set of guiding principles
Strong ability to win on industry success factors
Clear potential forsizeable excess returns
Risks aresufficiently mitigated
Opportunity assessment guiding principles
Part ofOlam’s upstream
expansion strategy
Palm is the fastest growing vegetable oil with multiple end uses
Access to sizeable landbank and achieving
competitive cost position
Upstream Palm an attractive opportunity but Olam's participation subject to satisfying evaluation criteria
A B C
1 2 3

25
Key risks can be mitigated
Risks Comments/mitigation step
Labour availability and quality
• Availability of skilled local labour due to presence of upstream industries eg. forestry
• Local labour to be trained and added in a phased manner; if need be, labour from neighbouring countries can be recruited
4
Risk to yields • Expected yield of up to 26 FFB MT per hectare in line with experts’ assessment
• Potential for further upside from water conservation projects and plantation management best practices
1
Regulatory risk: Exclusion of Palm from EU bio-diesel mandates
• Palm cheapest source of edible oil• Sufficient demand as a food and oleochemicals source if
substitutes get diverted to bio-diesel• West Africa a growing market for edible oils
3
Cost over-runs and delays
• Assumptions built bottom up
• 5% increase in total project costs impacts IRR by -1.5%
• 5% increase in cash cost of production impacts IRR by -1%
2

26
Thank you

27
Thank you