Embed Size (px)
Citation preview

investment
newsletter
july
2011

5400
5600
5800
18100
18350
18600
18850
19100
S&
P N
ifty
BS
E S
en
sex
BSE Sensex S&P Nifty
July 2011-Review
Concerns over the sovereign debt of Western European nations continued to linger and pressured global markets in July
2011. In addition, rigid negotiating positions of the two political parties in the USA (to reduce deficits - Republicans favor
cutting expenditure, Democrat raising taxes) worried investors that a consensus to handle the situation in the medium
term would be more difficult to achieve. The RBI’s move to hike interest rates by another 50 bps (the market was
expecting 25 bps) without giving any indication that they were near the end further caused investors to move to the
sidelines. Consequently, the BSE Sensex & Nifty dropped 3.4% & 2.9%, respectively over the month. Results were largely
in line with reduced investor expectations though a few companies did disappoint. Of the close to 1400 companies that
have reported so far, profit growth has been a healthy 19% (12% ex Energy)..
The sectoral performance is shown below::
1.53
1.18
1.07
0.36
-0.45
-1.40
-2.75
-2.91
-4.34
-4.44
-5.98
-6.54
-6.94
BSE CD
BSE FMCG
BSE Realty
BSE-HC
BSE AUTO
BSE Teck
BSE PSU
BSE Bankex
BSE IT
BSE Oil & Gas
BSE Pow er Index
BSE CG
BSE METAL
Monthly Equity Roundup – July 2011

Foreign institutional investors
(FIIs) bought equities worth
$1,807 million. So far in 2011,
FIIs brought equities worth
$2,439million. Insurance
companies sold equities worth
$167 million, while domestic
mutual funds sold equities
worth $122 million over the
month. In the first seven
months of 2011, insurance
companies and mutual funds
bought equities worth $2,322
million and $748 million,
respectively.
Global Markets
The world markets remained mixed over the month of July due to debt worries in the U.S. and Europe. Several countries
in Europe like Greece, Ireland and Spain are under debt burden. As a result, rating agencies like Moody’s and S&P
downgraded sovereign ratings of these countries. In U.S. however, worries over probable debt default overshadowed the
positive data from initial jobless claims and pending home sales reports. In the emerging market, China continued with its
monetary policy tightening measures and raised interest rates by 25 bps. However, hopes of a near-term relaxation in the
monetary policy emerged due to slackening rate of economic growth after the Chinese manufacturing activity showed
signs of slowing down.
Economy Update Industrial Growth surged by 5.6% during May 2011 over previous year
The Index of Industrial Production for the month of May 2011 stood at 165.3, about 5.6% higher than the May 2010 level
based on the new 2004-05 series. The growth rate of 1.4%, 5.6% and 10.3% in mining, manufacturing and electricity
sector were the major drivers. The cumulative growth for the period April-May 2011-12 stood at 5.7% over the
corresponding period of the previous year.
WPI inflation rose by 0.9% from May 2011
Despite rate hike, inflation remained at an elevated level. The provisional Wholesale Price Index (WPI) numbers for the
month June 2011 rose by 0.9% to 153 from 151.7 in the previous month. The increase in prices of manufactured goods,
fuel and primary articles led to the rise in WPI inflation. However, the provisional annual rate of inflation, based on monthly
WPI, stood at 9.44% for the month of June 2011 compared to 10.25% in the month of June 2010.
Outlook
The growth cycle in the developed world had been over-extended through the extensive use of leverage. While, the
corporate sector has used the last few years to clean up their balance sheets – consumers and governments are still
carrying excessive debt. Prospects for income growth are also limited given low competitiveness of economies, limited
availability of jobs. All this will mean belt tightening and this will keep economic growth in those countries under check.
Developing countries which exported to these economies would also be impacted as a result. This will result in a lower
level of global economic growth and hence lower corporate profitability. Higher economic uncertainty will also lead to a
decline in Price earnings ratio.
On the positive side, this slow down will also result in a fall in commodity prices. India has been suffering for the past
several months (we are an importer of commodities) and this fall will provide relief to our economy. Inflation would also
reduce and this would allow the RBI to stop its cycle of interest rate hikes and instead consider when to start cutting
rates. Investment opportunities for capital would also reduce and it would be easier for us to attract capital to invest in
the roll out of physical infrastructure (power, roads, ports, railways) which would aid in reducing the inefficiencies in the
economy while still earning a reasonable return for investors.
(1000)
0
1000
2000
Rs
. in
Cro
res
Institutional Flows in Equities
FIIs Domestic MFs

8.20%
8.30%
8.40%
8.50%
Yield
10-year Benchmark Yield
8.45%
Source :CCIL, Bharti-AXA Life Insurance
Fixed Income Overview
Particulars July-11 June-11 July-10 Exchange Rate (Rs./$) 45.16 44.72 46.46
WPI Inflation (In %) 9.44 9.06 9.98
10 Yr Gilt Yield (In %) 8.45 8.33 7.80
5 Yr Gilt Yield (In %) 8.50 8.30 7.70
5 Yr Corporate Bond Yield (In %) 10.26 9.60 10.01
Source: Bloomberg, Bharti AXA Life Insurance
Monthly debt market roundup
Bond yields remained steady most of the month in July. Investors remained anxious over the debt crisis in the U.S. and
Europe. But after the rate hike on 26 July 2011, bond yield increased significantly. The yield on the 10-year benchmark
security increased 13 bps to 8.45% over the month after witnessing a decline of 8 bps in June, 2011.
RBI in its first quarter mid-term monetary policy meeting hiked key policy rates for the eleventh time since March 2010 to
tame inflation amid uncertain international oil prices, underperformance of monsoon and large fiscal deficit. It increased
the repo rate by 50 bps to 8%. Consequently, reverse repo rate came 100 bps below the repo rate at 7% and marginal
standing facility came 100 bps above the repo rate at 9%. The continuous hike in repo rates has moderated the growth
rate. But since signs of sharp or broad-based deceleration was not noticed RBI maintained its GDP growth rate forecast at
around 8% for the current fiscal. However, due to rise in fuel and fertilizer prices, RBI still sees upside risk to inflation. It
has accordingly revised upward the WPI inflation target for March 2012 from the earlier 6% to 7%. RBI also anticipates
difficulties in achieving the fiscal deficit target of 4.6% for FY12 in absence of any adjustment in the prices of fuel, which
increased after the Budget announcement.
Monthly Debt Roundup – July 2011

Inflation remains a drag in the overall economic growth. The latest monthly provisional inflation numbers released by the
government reflects rise in prices of food and primary articles. As a result, WPI inflation increased to 9.44% in June 2011
from 9.06% in May 2011. However, on a weekly basis inflation numbers moderated. Food and primary articles inflation
rate dropped from 7.78% and 11.84% for the week ended 18 June 2011 to 7.33% and 10.49% for the week ended 16 July
2011. Similarly, non-food articles and fuel & power inflation rate declined from 17.91% and 12.98% to 16.05% and
12.12%, respectively over the same comparable period. Despite the drop in weekly inflation rates, concern still remains. In
the recent past, actual inflation numbers breached the provisional inflation numbers many times. For instance, in April
2011, the actual inflation number was revised to 9.74% from the provisional inflation number of 8.66% released earlier.
This apart, Index of Industrial Production (IIP) grew at its slowest pace in nine months at 5.6% in May 2011 based on the
new 2004-05 series. Poor output in the mining and manufacturing sector pulled down the overall IIP growth rate.
In July 2011, redemption of 9.39% GS 2011 paper helped ease liquidity compared to the month of June 2011. This
redemption released Rs. 38,737.2 crores into the system and enabled the banks to borrow dated securities worth Rs.
63,000 crores. This apart, RBI decided to issue Cash Management Bills (CMBs) to meet temporary cash requirements
instead of expanding its borrowing program for the first half of FY12. However, given the risk of achieving the fiscal deficit
target, we believe schedule government borrowings will increase in the second half of FY12. Auction of CMBs could also
put pressure on short-term rates in the near term.
8.00%
8.20%
8.40%
8.60%
8.80%
9.00%
1 2 3 4 5 6 7 9 15
Yield Curve
YTM
8.90%
Source: CCIL, Bharti AXA Life Insurance
Investors around the world remained anxious over the debt crisis in Europe and the U.S. In Europe, Moody’s downgraded
Ireland's credit rating from Baa3 to Ba1 and threatened to cut Spain’s Aa2 rating. Likewise, S&P downgraded Greece
rating to CC from CCC after Euro zone leaders announced the second bailout package worth $157 billion. In the U.S., the
recent deal to raise the debt limits however, provided some relief.
Corporate Bond:
The hike in the key policy rates affected the corporate bond market. The rate for the short term corporate bonds
increased but the rates for medium to long-term corporate bonds declined over the month. Similarly, spread between the
AAA rated corporate bonds and the G-sec contracted 28 bps for the medium to long-term papers (6 to 8 years) but
increased 29 bps for the short-term ones (3 to 6 month).
Outlook
In August, liquidity is likely to ease as redemption of treasury bills will help release about Rs. 72,899 crores into the
system. The Government along with RBI has rescheduled an auction of dated securities worth Rs. 10,000 crores from
23 September 2011 to 19 August 2011. This will increase the auction amount of dated securities from the earlier Rs.
35,000 crores to Rs. 45,000 crores. In addition, RBI will auction treasury bills worth Rs. 50,000 crores. Apart from
this, investors will closely watch the IIP numbers for June 2011 as well as the WPI inflation number for July 2011.
These numbers will be released in the second week of August 2011.

Fund Benchmark
3 Months -2.89 -4.57
6 Months 0.61 -0.38
1 year 1.77 0.83
Since Inception 10.76 10.82
Benchmark: CNX 100
*Inception Date- 24 Aug 2006, <1yr ABS & >=1yr CAGR
5.84
5.73
5.66
5.26
4.58
3.97
3.60
3.05
2.68
2.66
1.87
1.85
1.80
1.61
1.54
1.44
1.43
1.36
1.31
1.23
1.18
1.14
31.53
7.68
100.00
DR REDDYS LAB LTD
BAJAJ AUTO LTD
ONGC
Cash And Current Assets
Grand Total
TATA MOTORS LTD
M&M LTD
AXIS BANK LTD
SUN PHARMACEUTICALS INDUSTRIES
STERLITE INDUSTRIES INDIA LTD
GAIL INDIA LTD
Others
HDFC LTD
RELIANCE INDUSTRIES LTD
HDFC BANK LTD
LARSEN & TOUBRO LTD
BHARTI AIRTEL LTD
BHEL
SBI
TCS LTD
CADILA HEALTHCARE LTD
TATA STEEL LTD
INFOSYS TECHNOLOGIES LTD
Grow Money
67398.32
ICICI BANK LTD
ITC LTD
Equity
92%
Cash
8%
21.03
11.02
9.84
9.44
7.78
6.89
6.81
5.97
3.93
1.90
7.70
0 5 10 15 20 25
Banking & Financials
Oil & Gas
IT
FMCG
Pharmaceuticals
Engineering & Capital
Goods
Metal & Mining
Auto & Auto
Ancillaries
Telecommunication
Power
Others
Fund Performance Fund PerformanceAsset Class % To Fund
Assets Under Management (in Rs. Lakhs)
Equity portfolio % To FundSector Allocation % To Fund

Fund Benchmark
3 Months -2.70 -4.14
6 Months 0.55 -0.01
1 year 0.96 -1.14
Since Inception 27.10 29.99
Benchmark: CNX500
*Inception Date- 10 Dec 2008, <1yr ABS & >=1yr CAGR
4.82
4.75
4.62
4.35
3.75
3.18
2.94
2.47
2.36
2.33
1.97
1.86
1.64
1.52
1.52
1.39
1.39
1.38
1.27
1.24
1.20
1.20
38.59
8.22
100.00
M&M LTD
ONGC
ICICI BANK LTD
Growth Opportunities Pension
1127.52
RELIANCE INDUSTRIES LTD
INFOSYS TECHNOLOGIES LTD
CADILA HEALTHCARE LTD
Others
HDFC LTD
ITC LTD
HDFC BANK LTD
LARSEN & TOUBRO LTD
BHARTI AIRTEL LTD
HINDALCO INDUSTRIES LTD
SBI
TCS LTD
AXIS BANK LTD
TATA STEEL LTD
SUN PHARMACEUTICALS INDUSTRIES
Cash And Current Assets
Grand Total
HINDUSTAN UNILEVER LTD
TATA MOTORS LTD
DR REDDYS LAB LTD
BAJAJ AUTO LTD
HINDUSTAN ZINC LTD
Equity
92%
Cash
8%
18.43
10.88
9.74
8.19
8.18
7.17
6.93
6.72
3.50
2.64
9.40
0 5 10 15 20
Banking &
Financials
Oil & Gas
FMCG
IT
Metal & Mining
Pharmaceuticals
Engineering &
Capital Goods
Auto & Auto
Ancillaries
Telecommunication
Power
Others
Fund Performance Fund PerformanceAsset Class % To Fund
Assets Under Management (in Rs. Lakhs)
Equity portfolio % To FundSector Allocation % To Fund

Fund Benchmark
3 Months -2.81 -4.57
6 Months -0.04 -0.38
1 year 0.92 0.83
Since Inception -2.31 -3.48
Benchmark: CNX 100
*Inception Date- 03 Jan 2008, <1yr ABS & >=1yr CAGR
5.91
5.87
5.25
5.00
4.98
3.82
3.39
3.00
2.70
2.61
2.08
1.82
1.75
1.67
1.62
1.58
1.58
1.46
1.46
1.29
1.28
1.25
31.54
7.09
100.00
CADILA HEALTHCARE LTD
DR REDDYS LAB LTD
ITC LTD
Grow Money Pension
16725.30
INFOSYS TECHNOLOGIES LTD
ICICI BANK LTD
GAIL INDIA LTD
Others
HDFC LTD
RELIANCE INDUSTRIES LTD
HDFC BANK LTD
LARSEN & TOUBRO LTD
BHARTI AIRTEL LTD
HINDALCO INDUSTRIES LTD
SBI
TCS LTD
M&M LTD
BAJAJ AUTO LTD
TATA STEEL LTD
Cash And Current Assets
Grand Total
TATA MOTORS LTD
ONGC
AXIS BANK LTD
SUN PHARMACEUTICALS INDUSTRIES
BHEL
Equity
93%
Cash
7%
21.38
10.37
9.60
8.92
8.32
7.33
6.90
6.82
3.65
2.16
7.45
0 5 10 15 20 25
Banking & Financials
Oil & Gas
IT
FMCG
Pharmaceuticals
Metal & Mining
Engineering & Capital
Goods
Auto & Auto Ancillaries
Telecommunication
Power
Others
Fund Performance Fund PerformanceAsset Class % To Fund
Assets Under Management (in Rs. Lakhs)
Equity portfolio % To FundSector Allocation % To Fund

Fund Benchmark
3 Months -3.37 -4.57
6 Months -0.37 -0.38
1 year 1.15 0.83
Since Inception 5.46 5.89
Benchmark: CNX 100
*Inception Date- 22 Dec 2009, <1yr ABS & >=1yr CAGR
5.87
5.51
4.76
4.51
4.20
3.64
3.53
3.19
2.69
2.51
1.97
1.69
1.65
1.60
1.58
1.53
1.45
1.44
1.43
1.30
1.28
1.27
32.03
9.36
100.00
DR REDDYS LAB LTD
TATA STEEL LTD
ONGC
Cash And Current Assets
Grand Total
BAJAJ AUTO LTD
HINDALCO INDUSTRIES LTD
CADILA HEALTHCARE LTD
M&M LTD
SUN PHARMACEUTICALS INDUSTRIES
GAIL INDIA LTD
Others
SBI
HDFC BANK LTD
ITC LTD
BHARTI AIRTEL LTD
LARSEN & TOUBRO LTD
HINDUSTAN UNILEVER LTD
HDFC LTD
TCS LTD
TATA MOTORS LTD
AXIS BANK LTD
RELIANCE INDUSTRIES LTD
Grow Money Pension Plus
4679.93
ICICI BANK LTD
INFOSYS TECHNOLOGIES LTD
Equity
91%
Cash
9%
21.94
10.46
8.81
8.05
7.70
7.41
6.42
6.24
4.00
1.74
7.85
0 10 20 30
Banking & Financials
Oil & Gas
IT
FMCG
Pharmaceuticals
Metal & Mining
Auto & Auto
Ancillaries
Engineering &
Capital Goods
Telecommunication
Power
Others
Fund Performance Fund PerformanceAsset Class % To fund
Assets Under Management (in Rs. Lakhs)
Sector Allocation % To Fund
Equity portfolio % To Fund

Fund Benchmark
3 Months -2.99 -4.14
6 Months 0.19 -0.01
1 year 0.81 -1.14
Since Inception 29.53 29.99
Benchmark: CNX500
*Inception Date- 10 Dec 2008, <1yr ABS & >=1yr CAGR
5.03
4.73
4.43
4.01
3.69
3.31
3.19
2.64
2.26
2.06
1.90
1.89
1.55
1.52
1.46
1.44
1.42
1.35
1.30
1.19
1.14
1.13
38.20
9.14
100.00
AXIS BANK LTD
CADILA HEALTHCARE LTD
INFOSYS TECHNOLOGIES LTD
Growth Opportunities Fund
5762.92
ICICI BANK LTD
RELIANCE INDUSTRIES LTD
HINDALCO INDUSTRIES LTD
Others
HDFC LTD
ITC LTD
HDFC BANK LTD
BHARTI AIRTEL LTD
LARSEN & TOUBRO LTD
HINDUSTAN ZINC LTD
SBI
TCS LTD
M&M LTD
ONGC
TATA STEEL LTD
Cash And Current Assets
Grand Total
SUN PHARMACEUTICALS INDUSTRIES
TATA MOTORS LTD
HINDUSTAN UNILEVER LTD
DR REDDYS LAB LTD
BAJAJ AUTO LTD
Equity
91%
Cash
9%
19.00
11.23
8.78
7.95
7.57
7.06
6.69
6.37
3.93
2.71
9.56
0 5 10 15 20
Banking & Financials
Oil & Gas
FMCG
Metal & Mining
IT
Pharmaceuticals
Engineering & Capital
Goods
Auto & Auto
Ancillaries
Telecommunication
Power
Others
Fund Performance Fund PerformanceAsset Class % To fund
Assets Under Management (in Rs. Lakhs)
Equity portfolio % To FundSector Allocation % To Fund

Fund Benchmark
3 Months -2.88 -4.14
6 Months -0.04 -0.01
1 year 1.13 -1.14
Since Inception 4.52 1.66
Benchmark: CNX500
*Inception Date- 29 Dec 2009, <1yr ABS & >=1yr CAGR
5.01
4.69
4.68
4.11
3.91
3.36
3.24
2.95
2.44
2.06
1.86
1.77
1.60
1.51
1.49
1.46
1.43
1.38
1.27
1.22
1.18
1.01
36.81
9.57
100.00
HINDUSTAN UNILEVER LTD
ONGC
TATA STEEL LTD
Cash And Current Assets
Grand Total
AXIS BANK LTD
DR REDDYS LAB LTD
M&M LTD
GRASIM INDUSTRIES LTD
HINDALCO INDUSTRIES LTD
HINDUSTAN ZINC LTD
Others
SBI
ITC LTD
BHARTI AIRTEL LTD
HDFC BANK LTD
LARSEN & TOUBRO LTD
COAL INDIA LTD
HDFC LTD
TCS LTD
TATA MOTORS LTD
CADILA HEALTHCARE LTD
RELIANCE INDUSTRIES LTD
Growth Opportunities Plus Fund
7100.61
INFOSYS TECHNOLOGIES LTD
ICICI BANK LTD
Equity
90%
Cash
10%
18.89
11.28
9.10
8.28
7.77
6.50
6.25
6.02
4.55
2.50
9.29
0 5 10 15 20
Banking &
Financials
Oil & Gas
FMCG
IT
Metal & Mining
Pharmaceuticals
Auto & Auto
Ancillaries
Engineering &
Capital Goods
Telecommunication
Power
Others
Fund Performance Fund PerformanceAsset Class % To fund
Assets Under Management (in Rs. Lakhs)
Equity portfolio % To Fund
Sector Allocation % To Fund

Fund Benchmark
3 Months -3.25 -4.57
6 Months -0.50 -0.38
1 year 1.04 0.83
Since Inception 6.02 4.44
Benchmark: CNX 100
*Inception Date- 14 Dec 2009, <1yr ABS & >=1yr CAGR
5.80
5.32
5.10
5.02
4.17
4.10
3.82
3.54
3.17
2.41
2.12
1.71
1.62
1.57
1.52
1.49
1.46
1.44
1.39
1.26
1.11
1.03
29.36
10.50
100.00
AXIS BANK LTD
TATA STEEL LTD
DR REDDYS LAB LTD
Cash And Current Assets
Grand Total
HINDALCO INDUSTRIES LTD
ONGC
GRASIM INDUSTRIES LTD
HINDUSTAN UNILEVER LTD
COAL INDIA LTD
SUN PHARMACEUTICALS INDUSTRIES
Others
SBI
RELIANCE INDUSTRIES LTD
LARSEN & TOUBRO LTD
HDFC BANK LTD
BHARTI AIRTEL LTD
BAJAJ AUTO LTD
HDFC LTD
TCS LTD
TATA MOTORS LTD
M&M LTD
ITC LTD
Grow Money Plus
5940.73
ICICI BANK LTD
INFOSYS TECHNOLOGIES LTD
Equity
90%
Cash
10%
22.32
10.31
8.81
8.61
7.82
6.47
5.97
5.83
4.20
2.00
7.17
0 5 10 15 20 25
Banking & Financials
Oil & Gas
FMCG
IT
Metal & Mining
Engineering &
Capital Goods
Pharmaceuticals
Auto & Auto
Ancillaries
Telecommunication
Cement
Others
Fund Performance Fund PerformanceAsset Class % To Fund
Assets Under Management (in Rs. Lakhs)
Equity portfolio % To FundSector Allocation % To Fund

Fund Benchmark
3 Months -2.81 -4.14
6 Months 0.34 -0.01
1 year 1.35 -1.14
Since Inception 7.49 2.24
Benchmark: CNX500
*Inception Date- 25 Jan 2010, <1yr ABS & >=1yr CAGR
4.76
4.69
4.68
4.07
3.57
3.52
3.32
2.76
2.24
2.16
2.06
1.90
1.59
1.53
1.49
1.35
1.27
1.26
1.26
1.26
1.21
1.13
38.12
8.79
100.00
TATA MOTORS LTD
ONGC
CADILA HEALTHCARE LTD
Cash And Current Assets
Grand Total
AXIS BANK LTD
HINDALCO INDUSTRIES LTD
BAJAJ AUTO LTD
HINDUSTAN UNILEVER LTD
M&M LTD
COAL INDIA LTD
Others
SBI
ITC LTD
LARSEN & TOUBRO LTD
HDFC BANK LTD
BHARTI AIRTEL LTD
GAIL INDIA LTD
HDFC LTD
TCS LTD
DR REDDYS LAB LTD
TATA STEEL LTD
INFOSYS TECHNOLOGIES LTD
Growth Opportunities Pension Plus Fund
6190.33
RELIANCE INDUSTRIES LTD
ICICI BANK LTD
Equity
91%
Cash
9%
18.29
11.60
9.17
7.98
7.96
7.91
6.82
6.54
3.86
2.20
8.89
0 5 10 15 20
Banking & Financials
Oil & Gas
FMCG
IT
Metal & Mining
Pharmaceuticals
Auto & Auto
Ancillaries
Engineering &
Capital Goods
Telecommunication
Chemicals &
Fertilisers
Others
Fund Performance Fund PerformanceAsset Class % To Fund
Assets Under Management (in Rs. Lakhs)
Equity portfolio % To FundSector Allocation % To Fund

Fund Benchmark
3 Months -4.38 -4.57
6 Months -2.72 -0.38
1 year -7.84 0.83
Since Inception -4.39 2.23
Benchmark: CNX 100
*Inception Date- 18 Jan 2010, <1yr ABS & >=1yr CAGR
6.35
6.14
5.59
5.29
4.61
4.08
4.04
3.76
2.83
2.57
2.04
1.98
1.58
1.57
1.52
1.43
1.43
1.42
1.32
1.23
1.22
1.21
29.59
7.18
100.00
AXIS BANK LTD
M&M LTD
INFOSYS TECHNOLOGIES LTD
Build India Pension Fund
2687.46
RELIANCE INDUSTRIES LTD
ICICI BANK LTD
HINDUSTAN UNILEVER LTD
Others
HDFC LTD
ITC LTD
HDFC BANK LTD
LARSEN & TOUBRO LTD
BHARTI AIRTEL LTD
BAJAJ AUTO LTD
TCS LTD
SBI
TATA STEEL LTD
TATA MOTORS LTD
ONGC
Cash And Current Assets
Grand Total
HINDALCO INDUSTRIES LTD
COAL INDIA LTD
DR REDDYS LAB LTD
STERLITE INDUSTRIES INDIA LTD
GAIL INDIA LTD
Equity
92%
Cash
8%
22.09
12.03
9.37
8.60
8.21
7.52
6.15
4.64
3.58
3.44
6.67
0 5 10 15 20 25
Banking & Financials
Oil & Gas
IT
FMCG
Engineering & Capital
Goods
Metal & Mining
Auto & Auto
Ancillaries
Telecommunication
Pharmaceuticals
Power
Others
Fund Performance Fund PerformanceAsset Class % To Fund
Assets Under Management (in Rs. Lakhs)
Equity portfolio % To FundSector Allocation % To Fund

Fund Benchmark
3 Months -4.09 -4.57
6 Months -2.51 -0.38
1 year -7.09 0.83
Since Inception 0.39 8.98
Benchmark: CNX 100
*Inception Date- 15 Feb 2010, <1yr ABS & >=1yr CAGR
6.35
5.71
5.41
5.22
4.76
4.53
4.00
3.55
2.77
2.54
2.12
1.97
1.66
1.61
1.45
1.41
1.40
1.32
1.32
1.27
1.26
1.19
30.41
6.75
100.00
TATA STEEL LTD
AXIS BANK LTD
INFOSYS TECHNOLOGIES LTD
Build India Fund
2353.75
RELIANCE INDUSTRIES LTD
ICICI BANK LTD
GAIL INDIA LTD
Others
HDFC LTD
ITC LTD
HDFC BANK LTD
BHARTI AIRTEL LTD
LARSEN & TOUBRO LTD
HINDUSTAN UNILEVER LTD
TCS LTD
SBI
COAL INDIA LTD
ONGC
TATA MOTORS LTD
Cash And Current Assets
Grand Total
HINDALCO INDUSTRIES LTD
M&M LTD
DR REDDYS LAB LTD
POWER FIN CORP
STERLITE INDUSTRIES INDIA LTD
Equity
91%
Cash
9%
21.76
12.56
9.07
8.67
7.49
7.47
5.57
5.17
3.36
3.29
6.11
0 5 10 15 20 25
Banking & Financials
Oil & Gas
IT
FMCG
Metal & Mining
Engineering & Capital
Goods
Auto & Auto
Ancillaries
Telecommunication
Pharmaceuticals
Power
Others
Fund Performance Fund PerformanceAsset Class % To Fund
Assets Under Management (in Rs. Lakhs)
Equity portfolio % To FundSector Allocation % To Fund

Fund Benchmark
3 Months -0.41 -1.16
6 Months 2.23 1.75
1 year 3.90 3.32
Since Inception 8.83 8.17
Benchmark: CNX 100=45%, Crisil Composite Bond Fund Index=55%
*Inception Date- 21 Aug 2006, <1yr ABS & >=1yr CAGR
3.15
2.92
2.76
2.43
2.42
2.30
1.66
1.39
1.35
1.20
18.67
40.25
6.22
7.59% GOI 2016 3.32
3.28
3.12
3.01
3.00
2.55
8.30% HDFC 23/06/2015 1.75
1.66
Others 27.91
3.91
Grand Total 59.75
Cash And Current Assets
0.00% AXISBANK 09/01/2012
8.20% NHB 30/08/2013
364 D TB 04/05/2012
0.00% ICICI BK 12/01/2012
0.00% ORIENTAL BK 13/02/2012
2.00% TATA MOTORS 31/03/2013
RELIANCE INDUSTRIES LTD
Grand Total
Save and Grow
5942.71
INFOSYS TECHNOLOGIES LTD
ICICI BANK LTD
HDFC BANK LTD
TCS LTD
BHARTI AIRTEL LTD
Others
0.00% AXISBANK 24/02/2012
ITC LTD
LARSEN & TOUBRO LTD
HDFC LTD
SBI
Debt
56%
Equity
40%
Cash
4%
Fund Performance Fund PerformanceAsset Class ( % To Fund)
Assets Under Management (in Rs. Lakhs)
Debt portfolio % To Fund
Debt Ratings Profile
Debt Maturity Profile (%To Fund)
AAA & Eq
39%
AA+ & Eq
1%AA
2%
P1+ & Eq
38%
Sovereign
20%
11.46
4.88
4.17
3.45
3.45
3.23
2.32
2.25
1.90
1.20
1.96
0 5 10 15
Banking & Financials
IT
Oil & Gas
Metal & Mining
FMCG
Engineering & Capital …
Pharmaceuticals
Auto & Auto …
Power
Telecommunication
Others
Sector Allocation % To Fund
Equity portfolio % To Fund
30.03
15.647.57
2.60
0.00
20.00
40.00
0-1 Yrs 1-3 Yrs 3-5 Yrs >5 Yrs

Fund Benchmark
3 Months -2.45 -3.33
6 Months 1.07 0.39
1 year 3.72 1.73
Since Inception 5.42 4.60
Benchmark: CNX 100=80%, Crisil Composite Bond Fund Index=20%
*Inception Date- 14 Dec 2009, <1yr ABS & >=1yr CAGR
6.33
4.91
3.51
3.38
3.36
3.24
2.94
2.59
2.55
2.42
36.01
71.23
5.55
7.02% GOI 2016 5.00
4.57
4.43
2.94
1.86
1.09
0.01
3.31
28.77
0.00% AXISBANK 24/01/2012
6.49% GOI 2015
BHARTI AIRTEL LTD
ONGC
Others
Grand Total
8.25% BRITANNIA 22/03/2013
TCS LTD
HDFC LTD
COAL INDIA LTD
TATA MOTORS LTD
SBI
Invest and Grow Money Pension
26.38
ICICI BANK LTD
LARSEN & TOUBRO LTD
HDFC BANK LTD
0.00% UNION BK 28/11/2011
0.00% SBH 04/01/2012
Cash And Current Assets
8.48% IDFC 28/09/2013
9.25% DR REDDYS 24/03/2014
Grand Total
Debt
26%
Equity
71%
Cash
3%
Fund Performance Fund PerformanceAsset Class ( % To fund)
Assets Under Management (in Rs. Lakhs)
Debt portfolio % To Fund
Debt Ratings Profile
Debt Maturity Profile (% To Fund)
AAA & Eq
29%
P1+ & Eq
34%
Sovereign
37%
21.41
7.52
7.29
6.75
6.70
6.69
4.47
2.55
2.51
2.01
3.33
0 5 10 15 20 25
Banking & Financials
Oil & Gas
Metal & Mining
Engineering & …
IT
Auto & Auto …
Pharmaceuticals
Telecommunication
FMCG
Power
Others
Sector Allocation % To Fund
Equity portfolio % To Fund
8.607.42
4.43 5.00
0.00
5.00
10.00
0-1 Yrs 1-3 Yrs 3-5 Yrs >5 Yrs

Fund Benchmark
3 Months -0.43 -1.16
6 Months 2.36 1.75
1 year 3.94 3.32
Since Inception 5.43 1.59
Benchmark: CNX 100=45%, Crisil Composite Bond Fund Index=55%
*Inception Date- 03 Jan 2008, <1yr ABS & >=1yr CAGR
2.89
2.81
2.48
2.48
2.34
2.06
1.93
1.54
1.52
1.10
18.84
39.98
5.35
0.00% AXISBANK 24/02/2012 4.25
3.99
7.59% GOI 2016 2.84
2.82
8.48% IDFC 28/09/2013 2.45
2.33
0.00% AXISBANK 23/01/2012 2.09
7.02% GOI 2016 1.97
Others 26.69
5.24
Grand Total 60.02
8.40% LIC HOUSING 18/08/2013
11.45% RELIANCE 25/11/2013
7.45% LIC HOUSING 02/11/2011
AXIS BANK LTD
Others
0.00% AXISBANK 09/01/2012
ICICI BANK LTD
Save and Grow Money Pension
1598.99
INFOSYS TECHNOLOGIES LTD
HDFC BANK LTD
RELIANCE INDUSTRIES LTD
Grand Total
ITC LTD
LARSEN & TOUBRO LTD
HDFC LTD
SBI
BHARTI AIRTEL LTD
Cash And Current Assets
Debt
55%
Equity
40%
Cash
5%
Fund Performance Fund PerformanceAsset Class ( % To Fund)
Assets Under Management (in Rs. Lakhs)
Debt portfolio % To Fund
Debt Ratings Profile
Debt Maturity Profile (% To Fund)
AAA & Eq
47%
AA+ & Eq
1%
P1+ & Eq
33%
Sovereign
19%
11.48
4.75
4.37
3.28
3.21
3.11
2.89
1.73
1.67
1.52
1.98
0 2 4 6 8 10 12
Banking & Financials
IT
Oil & Gas
FMCG
Metal & Mining
Engineering & …
Auto & Auto …
Power
Pharmaceuticals
Telecommunication
Others
Equity portfolio % To Fund
24.9917.69
7.704.41
0.00
10.00
20.00
30.00
0-1 Yrs 1-3 Yrs 3-5 Yrs >5 Yrs
Sector Allocation % To Fund

Fund Benchmark
3 Months -0.40 --
6 Months 0.14 --
1 year -- --
Since Inception -8.45 --
*Inception Date- 11 Oct 2010, <1yr ABS & >=1yr CAGR
2.78
1.89
1.28
1.18
0.86
0.68
0.61
0.45
0.37
0.37
3.17
13.63
7.80% GOI 2020 27.26
0.00% ICICI BK 05/01/2012 13.90
7.11
0.00% ICICI BK 13/12/2011 6.48
6.36
0.00% PNB 16/01/2012 5.38
3.31
0.00% UNION BK 31/01/2012 2.27
2.18
Others 7.91
4.19
Grand Total 86.37
Grand Total
STERLITE INDUSTRIES INDIA LTD
MARUTI UDYOG LTD
ONGC
BHARAT PETROLEUM CORP LTD
JINDAL STEEL & POWER LTD
0.00% CENTRAL BK 08/11/2011
RECL
True Wealth Fund
4453.55
HDFC BANK LTD
HINDALCO INDUSTRIES LTD
HERO HONDA MOTORS LTD
Cash And Current Assets
0.00% CANARA BK 30/11/2011
0.00% CANARA BK 27/12/2011
0.00% UNION BK 28/11/2011
NTPC LTD
Others
Debt
82%
Equity
14%
Cash
4%
Fund Performance Fund PerformanceAsset Class ( % To Fund)
Assets Under Management (in Rs. Lakhs)
Debt portfolio % To Fund
Debt Ratings Profile
Debt Maturity Profile (% To Fund)
AAA & Eq
2%
P1+ & Eq
65%
Sovereign
33%
3.55
2.79
2.48
2.06
1.26
0.57
0.32
0.21
0.19
0.12
0.07
0 1 2 3 4
Metal & Mining
Banking & Financials
Auto & Auto …
Power
Oil & Gas
Pharmaceuticals
IT
Real Estate
FMCG
Infrastructure
Others
Sector Allocation % To Fund
Equity portfolio % To Fund
54.91
27.26
0.00
20.00
40.00
60.00
0-1 Yrs 1-3 Yrs 3-5 Yrs >5 Yrs

Fund Benchmark
3 Months 0.89 0.39
6 Months 2.94 2.72
1 year 5.54 4.45
Since Inception 5.45 5.09
Benchmark: CNX 100=20%, Crisil Composite Bond Fund Index=80%
*Inception Date- 14 Dec 2009, <1yr ABS & >=1yr CAGR
1.40
1.20
1.07
0.94
0.94
0.63
0.59
0.51
0.38
0.36
6.14
14.17
14.16
8.18
7.07
6.18
5.62
4.92
4.21
4.17
3.96
23.64
3.73
Grand Total 85.83
HDFC LTD
SBI
TCS LTD
BHARTI AIRTEL LTD
HDFC BANK LTD
Protect and Grow Money Pension
59.56
INFOSYS TECHNOLOGIES LTD
ICICI BANK LTD
LARSEN & TOUBRO LTD
Cash And Current Assets
AXIS BANK LTD
ONGC
Others
Grand Total
0.00% UNION BK 28/11/2011
0.00% ORIENTAL BK 13/02/2012
6.49% GOI 2015
7.45% LIC HOUSING 02/11/2012
0.00% AXISBANK 23/01/2012
0.00% AXISBANK 24/02/2012
0.00% AXISBANK 24/01/2012
6.07% GOI 2014
Others
8.25% BRITANNIA 22/03/2013
Debt
82%
Equity
14%
Cash
4%
Fund Performance Fund PerformanceAsset Class ( % To Fund)
Assets Under Management (in Rs. Lakhs)
Debt Ratings Profile
Debt Maturity Profile (% to Fund)
AAA & Eq
27%
AA+ & Eq
1%
P1+ & Eq
56%
Sovereign
16%
4.48
2.26
1.51
1.17
1.15
0.85
0.71
0.59
0.55
0.51
0.39
0 1 2 3 4 5
Banking & Financials
IT
Engineering & …
Metal & Mining
Auto & Auto …
Pharmaceuticals
Oil & Gas
Power
FMCG
Telecommunication
Others
Sector Allocation % To Fund
Equity portfolio % To Fund
48.53
22.528.68
2.37
0.00
20.00
40.00
60.00
0-1 Yrs 1-3 Yrs 3-5 Yrs >5 Yrs
Debt portfolio % To Fund

Fund Benchmark
3 Months 1.85 1.63
6 Months 3.64 3.49
1 year 5.55 5.35
Since Inception 7.04 6.00
Benchmark: Crisil Composite Bond Fund Index
*Inception Date- 05 Sep 2006, <1yr ABS & >=1yr CAGR
8.43
7.93
7.02
6.31
5.89
4.97
7.59% GOI 2016 4.82
3.93
3.67
7.02% GOI 2016 2.99
2.92
2.87
2.61
2.57
2.45
2.14
2.08
7.45% LIC HOUSING 02/11/2011 1.98
8.75% BAJAJ AUTO FIN 26/07/2013 1.85
8.40% LIC HOUSING 18/08/2013 1.84
8.70% POWER FIN CORP 14/05/2015 1.54
10.40% RPTL 18/07/2021 1.27
Others 16.27
1.63
100.00
0.00% ORIENTAL BK 13/02/2012
Steady Money
3736.67
0.00% AXISBANK 24/02/2012
0.00% AXISBANK 24/01/2012
6.49% GOI 2015
364 D TB 04/05/2012
0.00% ICICI BK 12/01/2012
8.20% NHB 30/08/2013
7.45% LIC HOUSING 02/11/2012
2.00% TATA MOTORS 31/03/2013
0.00% BOI 02/02/2012
8.48% IDFC 28/09/2013
0.00% AXISBANK 09/01/2012
8.30% HDFC 23/06/2015
Cash And Current Assets
Grand Total
10.31% IDBI BANK 09/08/2012
8.25% BRITANNIA 22/03/2013
Debt
98%
Cash
2%
48.54
29.40
14.73
5.70
0.00
10.00
20.00
30.00
40.00
50.00
60.00
0-1 Yrs 1-3 Yrs 3-5 Yrs >5 Yrs
Fund Performance Fund PerformanceAsset Class ( % To Fund)
Assets Under Management (in Rs. Lakhs)
Debt portfolio % To FundDebt Ratings Profile
Debt Maturity Profile (% To Fund)
AAA & Eq
37%
AA+
& Eq
4%AA
1%
P1+ & Eq
37%
Sovereign
21%

Fund Benchmark
3 Months 0.66 -2.59
6 Months 2.14 -2.32
1 year 4.26 -4.45
Since Inception 0.92 -8.52
Benchmark: 15 Year G-Sec Yield
*Inception Date- 19 May 2009, <1yr ABS & >=1yr CAGR
6.35% GOI 2024 40.75
8.20% GOI 2024 A 15.82
7.95% GOI 2025 12.47
7.35% GOI 2024 10.09
8.03% GOI 2024 9.04
8.20% GOI 2023 4.87
8.20% GOI 2024 2.03
8.01% GOI 2023 1.64
6.90% GOI 2026 0.01
Cash And Current Assets 3.27
Grand Total 100.00
Build n Protect Series 1
1191.56Debt
97%
Cash
3%
96.73
0.00
25.00
50.00
75.00
100.00
0-1 Yrs 1-3 Yrs 3-5 Yrs >5 Yrs
Fund Performance Fund PerformanceAsset Class ( % To Fund)
Debt portfolio % To FundDebt Ratings Profile
Debt Maturity Profile (%To Fund)
100%
Sovereign
Assets Under Management (in Rs. Lakhs)

Fund Benchmark
3 Months 1.85 1.95
6 Months 3.63 3.91
1 year 6.66 7.37
Since Inception 5.12 5.34
Benchmark: Crisil Liquid Fund Index
*Inception Date- 08 Jul 2009, <1yr ABS & >=1yr CAGR
14.04
11.63
11.52
10.37
0.00% CANARA BK 30/11/2011 8.64
91 D TB 16/09/2011 8.20
0.00% KOTAK MAH PRIME 08/11/2011 7.75
0.00% CANARA BK 27/12/2011 6.39
0.00% ORIENTAL BK 13/02/2012 5.11
0.00% AXISBANK 24/02/2012 4.80
0.00% BOI 02/02/2012 4.17
91 D TB 02/09/2011 2.35
0.00% ICICI BK 13/12/2011 2.29
364 D TB 02/12/2011 0.69
0.00% AXISBANK 24/01/2012 0.50
0.34
Cash And Current Assets 1.20
Grand Total 100.00
10.31% IDBI BANK 09/08/2012
0.00% ICICI BK 05/01/2012
0.00% UNION BK 28/11/2011
Safe Money Fund
422.30
91 D TB 23/09/2011
91 D TB 21/10/2011
Debt
99%
Cash
1%
98.46
0.340.00
25.00
50.00
75.00
100.00
0-1 Yrs 1-3 Yrs
Fund Performance Fund PerformanceAsset Class ( % To Fund)
Assets Under Management (in Rs. Lakhs)
Debt portfolio % To FundDebt Ratings Profile
Debt Maturity Profile (% To Fund)
Sovereign
38%
P1+ Eq
62%
98.46
0.340.00
25.00
50.00
75.00
100.00
0-1 Yrs 1-3 Yrs
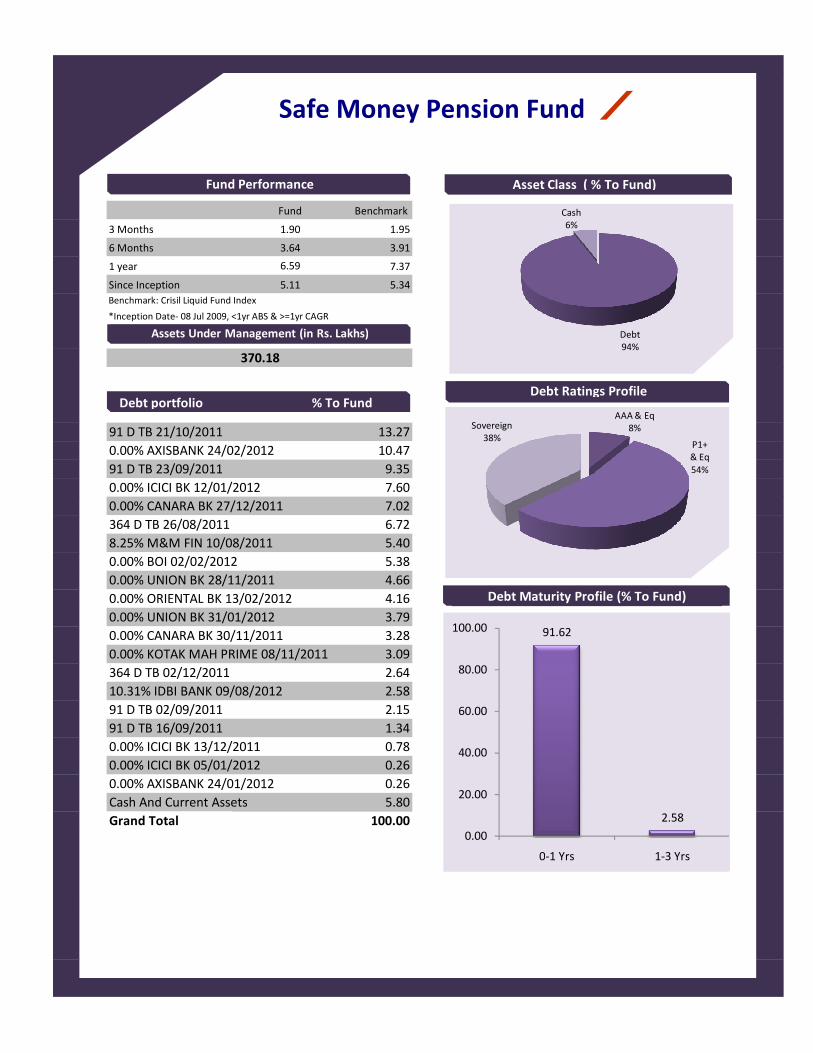
Fund Benchmark
3 Months 1.90 1.95
6 Months 3.64 3.91
1 year 6.59 7.37
Since Inception 5.11 5.34
Benchmark: Crisil Liquid Fund Index
*Inception Date- 08 Jul 2009, <1yr ABS & >=1yr CAGR
13.27
10.47
9.35
0.00% ICICI BK 12/01/2012 7.60
0.00% CANARA BK 27/12/2011 7.02
364 D TB 26/08/2011 6.72
8.25% M&M FIN 10/08/2011 5.40
0.00% BOI 02/02/2012 5.38
0.00% UNION BK 28/11/2011 4.66
0.00% ORIENTAL BK 13/02/2012 4.16
0.00% UNION BK 31/01/2012 3.79
0.00% CANARA BK 30/11/2011 3.28
0.00% KOTAK MAH PRIME 08/11/2011 3.09
364 D TB 02/12/2011 2.64
10.31% IDBI BANK 09/08/2012 2.58
91 D TB 02/09/2011 2.15
91 D TB 16/09/2011 1.34
0.00% ICICI BK 13/12/2011 0.78
0.00% ICICI BK 05/01/2012 0.26
0.00% AXISBANK 24/01/2012 0.26
Cash And Current Assets 5.80
Grand Total 100.00
91 D TB 23/09/2011
Safe Money Pension Fund
370.18
91 D TB 21/10/2011
0.00% AXISBANK 24/02/2012
Debt
94%
Cash
6%
91.62
2.58
0.00
20.00
40.00
60.00
80.00
100.00
0-1 Yrs 1-3 Yrs
Fund Performance Fund PerformanceAsset Class ( % To Fund)
Debt portfolio % To FundDebt Ratings Profile
Debt Maturity Profile (% To Fund)
AAA & Eq
8%
P1+
& Eq
54%
Sovereign
38%
Assets Under Management (in Rs. Lakhs)

Fund Benchmark
3 Months 2.00 1.63
6 Months 3.83 3.49
1 year 5.69 5.35
Since Inception 6.17 5.74
Benchmark: Crisil Composite Bond Fund Index
*Inception Date- 03 Jan 2008, <1yr ABS & >=1yr CAGR
11.56
8.04
6.07
7.59% GOI 2016 6.02
5.32
7.02% GOI 2016 5.11
4.61
3.52
3.43
364 D TB 04/05/2012 3.25
3.19
6.49% GOI 2015 2.94
2.92
2.00% TATA MOTORS 31/03/2013 2.87
2.75
8.70% POWER FIN CORP 14/05/2015 2.63
2.25
8.75% BAJAJ AUTO FIN 26/07/2013 2.04
1.87
11.45% RELIANCE 25/11/2013 1.83
1.80
0.00% ICICI BK 12/01/2012 1.63
14.37
-0.01
Grand Total 100.00
10.90% REC 30/09/2013
8.20% NHB 30/08/2013
Steady Money Pension
1449.02
0.00% ORIENTAL BK 13/02/2012
0.00% AXISBANK 24/02/2012
0.00% AXISBANK 24/01/2012
Cash And Current Assets
10.40% RPTL 18/07/2
9.10% KOTAK MAH PRIME 08/11/2011
0.00% UNION BK 28/11/2011
8.68% PGC 07/12/2013
0.00% BOI 02/02/2012
7.45% LIC HOUSING 02/11/2011
6.07% GOI 2014
8.35% HDFC 19/07/2015
Others
Debt
100%
46.43
29.83
15.07
8.68
0.00
5.00
10.00
15.00
20.00
25.00
30.00
35.00
40.00
45.00
50.00
0-1 Yrs 1-3 Yrs 3-5 Yrs >5 Yrs
Fund Performance Fund PerformanceAsset Class ( % To Fund)
Debt portfolio % To FundDebt Ratings Profile
Debt Maturity Profile (% To Fund)
AAA & Eq
40%
AA+ & Eq
3%AA
3%
P1+ & Eq
33%
Sovereign
21%
Assets Under Management (in Rs. Lakhs)

Fund Benchmark
3 Months 0.54 -2.59
6 Months 2.32 -2.32
1 year 4.58 -4.45
Since Inception 3.54 -4.06
Benchmark: 15 Year G-Sec Yield
*Inception Date- 09 Apr 2010, <1yr ABS & >=1yr CAGR
6.90% GOI 2026 58.32
8.00% GOI 2026 28.39
13.29
100.00Grand Total
Cash And Current Assets
Build n Protect Fund Series 2
112.75Debt
87%
Cash
13%
86.71
0.00
30.00
60.00
90.00
0-1 Yrs 1-3 Yrs 3-5 Yrs >5 Yrs
Fund Performance Fund PerformanceAsset Class ( % To Fund)
Assets Under Management (in Rs. Lakhs)
Debt portfolio % To FundDebt Ratings Profile
Debt Maturity Profile (%To Fund)
100%
Sovereign

Disclaimers: 1.This newsletter only gives an overview of the economy and should not be construed as financial advice. Policyholder
should speak to his Financial Advisor and use his/her own discretion and judgement while investing in financial markets and shall be
responsible for his/her decision. 2. Insurance is the subject matter of the solicitation. 3. The information contained herein is as on 31st July 2011. 4. Past performance of the funds, as shown above, is not indicative of future performance or returns. 5. Grow
Money Fund, Save n Grow Money Fund, Steady Money Fund, Growth Opportunities Fund, Grow Money Pension Fund, Save n Grow Money
Pension Fund, Steady Money Pension Fund, Growth Opportunities Pension Fund, Build n Protect Fund Series 1, Safe Money Fund, Safe
Money Pension Fund, Grow Money Plus, Invest n Grow Money Plus, Protect & Grow Money Pension, Grow Money Pension Plus, Growth Opportunities Plus, Growth Opportunities Pension Plus Fund, Build India Pension, Build India Fund, Build n Protect Fund Series 2 and
True Wealth Fund are only the names of the funds and do not indicate its expected future returns or performance.
Bharti AXA Life Insurance Company Limited. (Regd. No. 130), Regd. Address: 6th Floor, Unit- 601 & 602,
Raheja Titanium, Off Western Express Highway, Goregaon (East), Mumbai- 400 063.
Toll free: 1800 102 4444
SMS SERVICE to 56677 (We will be in touch within 24 hours to address your query),
Email: [email protected], www.bharti-axalife.com
Compliance No.: Comp-Aug-2011-1630