Embed Size (px)
Citation preview

1 Letter from CEO
2 Global Macro Outlook
By Michael Hasenstab, Ph.D. Chief Investment Officer Templeton Global Macro
7 Global Equity Outlook
By Edward D. Perks, CFA Chief Investment Officer Franklin Templeton Equity
12 Long-Term Capital Markets Outlook By Rick Frisbie
Head of Franklin Templeton Solutions Franklin Templeton Investments
14 More Investment Insights Online
WHAT’S INSIDE

Gregory E. Johnson
Chairman of the Board, Chief Executive Officer
Franklin Resources, Inc.
With thirty years of investment management experience, I have come to know rapid evolution and change are
constants. It’s a dynamic time in our industry and the financial markets in general, and I see many reasons for
continued optimism. It’s times like these when professional, active management matters most.
The pages that follow spotlight our highest level views from the senior leaders of three key areas central to many
investors’ portfolio decisions: the global macro environment, global equities and multi-strategy solutions.
Michael Hasenstab, Ph.D. – As CIO of Templeton Global Macro, Michael leads a team of economists,
trained in some of the leading universities in the world, who integrate global macroeconomic analysis with
in-depth country research to identify long-term imbalances that translate to investment opportunities.
Michael and his team manage Templeton global bond strategies, including unconstrained fixed income,
currency and global macro.
Ed Perks, CFA – Ed recently assumed an expanded role, overseeing our well-established equity teams
that include Franklin Equity Group, Templeton Global Equity Group, Templeton Emerging Markets Group,
Franklin Mutual Series and Franklin U.S. Value. Our equity teams continue to manage their own bottom-up
research. By sharing perspectives across teams embedded in several key equity markets, they can
strengthen their overall convictions.
Rick Frisbie – Rick heads Franklin Templeton (FT) Solutions, our group dedicated to multi-strategy
solutions. Every year, FT Solutions reviews the data and themes driving capital markets in order to build
asset return expectations for different asset classes for the next five to 10 years. The team incorporates
these expectations into their long-term portfolio positioning process.
The diversity of our perspectives, honed over nearly seven decades, enables us to say, “Gain from Our Perspective.”
While we can’t predict what the markets hold for 2016, we do hope the insights we’ve prepared will be valuable to
you as an investor to help you make important decisions about your portfolio to navigate the changing market
dynamics.
On behalf of the firm’s more than 9,000 employees around the world, I’d like to thank you for the trust you place in us
and extend my very best wishes for a happy and prosperous 2016.
Greg Johnson
January 2016
2016 INVESTMENT OUTLOOK | 1
Rising Interest Rates from the Fed and Additional Quantitative Easing from the BOJ and ECB Overall, we remain confident in the
economic outlook for the United States and
continue to expect rising interest rates from
the US Federal Reserve (Fed). Labor
conditions in the United States have been
strong while wages and earnings have
increased, which we believe will continue to
drive consumption. In our assessment,
global financial markets are poised to
benefit from the US economic expansion.
We also anticipate significant divergences
in monetary policies around the world in
2016; we expect the Fed to tighten policy
while the Bank of Japan (BOJ) and
European Central Bank (ECB) continue to
expand monetary accommodation through
quantitative easing (QE). The BOJ has
indicated that its QE program will likely
Global Macro Outlook
Global Growth Remains on Trend and Deflation Risks Remain Low Despite downward revisions to 2016 global growth projections by the International
Monetary Fund (IMF), we do not anticipate a global recession or global deflation.
Global growth remains on trend while the major economies remain relatively healthy;
our growth projections for 2016 are 2%–3% for the United States, above 1% for the
eurozone, around 1% for Japan and between 6% and 7% for China.
We believe that fears of global deflation are unwarranted. Markets have, in our view,
overestimated the extent to which lower headline inflation reflects structurally weaker
global demand. We believe that supply factors are the main driver behind falling
energy and commodity prices, which in turn have pushed headline inflation lower.
These are short-term effects, and their disinflationary impact should wane as
commodity prices stabilize. The belief that inflation has become structurally lower has
made some investors complacent on taking interest-rate risk, in what we believe is a
dangerous part of the yield cycle. When commodity price base effects on inflation roll
off in the first half of 2016, we expect US inflation to get back to the Fed’s target.
Underlying inflation in the United States has not been adequately priced into bond
yields in recent months, in our assessment, and we are wary of the lack of inflation
being priced into bond yields across the globe.
Although headline inflation has declined globally, underlying core inflation trends have
remained resilient. While we do not necessarily expect sharp inflation increases in the
United States, we could see inflation at or above the Fed’s stated target as the oil-
price impact falls away. Any normalization of inflation pricing in global bond yields and
in US Treasuries would drive yields higher.
— Continued
2016 OUTLOOK: “At the start of 2016, we are encouraged by the vast set of fundamentally
attractive valuations across the global bond and currency markets. We expect continued
depreciation of the euro and yen, rising US Treasury yields, and currency appreciation in
select emerging markets.”
continue into
2017, and the
ECB has
indicated it will
likely continue
QE through
March 2017. In
our assessment,
both the BOJ
and ECB need
to continue
these current expansionary policies, which
should continue to depreciate the yen and
euro against the US dollar. In the eurozone,
QE has been driving the euro weaker to
stimulate export-driven economic growth
and lift inflation toward the ECB’s target; in
Japan, QE has become explicit debt
financing for the government and a
cornerstone of “Abenomics.”
2 | 2016 INVESTMENT OUTLOOK
Michael Hasenstab, Ph.D.
Chief Investment Officer
Templeton Global Macro
2016 INVESTMENT OUTLOOK | 3
GLOBAL MACRO OUTLOOK
— Continued
China’s Economy Remains Resilient Despite its Moderation in Growth During the first week of the year, China’s
stock markets declined sharply, causing
widespread panic in investment markets
across the globe. While we understand this
may be unsettling to global investors, our
long-term analysis of the economic
situation in China leads us to believe that
the panic is unwarranted. On the whole,
our view remains that underlying conditions
in the Chinese economy are fundamentally
more stable than markets have recently
indicated. We believe that China’s
policymakers have both the tools and the
financial firepower to counter the recent
slowdown and keep growth on track at 6%–
7%, which in turn is sufficient to support
global growth.
The People’s Bank of China (PBOC) has
once again intervened to devalue the yuan,
and once again some commentators are
interpreting the devaluation as a signal that
policymakers remain deeply concerned
about the growth slowdown.
While some observers feel the Chinese
authorities may seek to engineer a
substantial depreciation to boost growth
through exports, leading to currency wars
that may disrupt global growth and the
global financial system, our view is
different.
We would note that before the depreciation
in August 2015, China’s currency had
appreciated by over 12% on a real effective
basis in the preceding 12 months.
Furthermore, China had experienced some
“hot money” outflows during the first half of
the year, which also clearly influenced
policymakers’ actions. Although the
renminbi has experienced a modest
depreciation, we do not feel the move is a
precursor to a larger uncontrolled
weakening, as feared by markets.
As we maintained in our Global Macro Shifts
deep-dive analysis of China, we do not
share the markets’ pessimisms over the
trajectory of China’s growth. We view the
recent moderation of growth in China as an
inevitable normalization for an economy of
its size; its nominal level of gross domestic
product (GDP) is now five times the size of
what it was 10 years ago. Thus a lower rate
of growth still represents a massive level of
global aggregate demand.
In our assessment, the quality of growth in
China has improved in recent years.
Increasing labor costs and interest rates
have put downward pressure on profits;
however, higher wages boost consumption,
which has increasingly become the anchor
of Chinese growth; we estimate that
consumption is close to 60% of GDP and
rising. Additionally, new interest-rate
liberalization policies can redirect capital to
the whole economy, particularly the private
sector, which we expect to be the future
driver of growth.
The private sector in China now contributes
more to job growth than the state-owned
sector, which has not been the case for the
past 30 years. China’s rapid urbanization
process will also necessitate development.
Plans for infrastructure investment are
underway as the railways sector is set to
expand along with demands for broader
water purification and environmental related
projects. Such projects could somewhat
offset the negative drags on growth from the
contractions in manufacturing and the
excess capacity in the real estate sector.
Furthermore, property prices appear to have
bottomed out due to earlier easing
measures.
Overall, based on our analysis, we believe
China will remain on course, with GDP
growth decelerating moderately toward the
6% mark over the next few years1 while the
economy shifts toward consumption,
services and higher value-added
manufacturing.
1. There is no assurance that any estimate or forecast will be realized.
This has important implications for the
global economy:
• We believe 6%+ growth in China will
support global growth.
• Together with the new round of
infrastructure investment, this will provide
some support to commodity markets.
Note, however, that China’s rebalancing
from investment to consumption will also
reduce demand for most industrial
metals. On balance, therefore, our China
outlook should be consistent with broadly
stable commodity prices in the next few
years.
• China’s rebalancing also has a
differential impact on trade flows: We
should see more trade with advanced
economies producing finished and
industrial goods, and relatively less with
commodity producers.
• Finally, sustained wage growth implies
that China should gradually export a
more inflationary impulse to the rest of
the world, reinforcing our view that,
starting with the United States, the
outlook remains for higher inflation rates
and higher interest rates.
In sum, China’s economy is in a crucial
stage of rebalancing, but we believe it is
not at risk of collapsing. Some of the
traditional engines of growth
(manufacturing, real estate and local
government spending) have stalled or
contracted but new engines of growth (the
service sector and a new generation of
private sector companies) are taking over.
Although we may continue to experience
volatility in the near term, we remain
optimistic about China’s outlook as it
searches for its new equilibrium.
GLOBAL MACRO OUTLOOK
— Continued
Chart 1: Emerging Markets: Real Effective Exchange Rate Valuation
Change between 2014 and August 2015
Source: International Monetary Fund, 2015 External Sector Report, individual economy assessments prepared by IMF staff and completed on 26/6/15 and published on 27/7/15.
The real effective exchange rate (REER) is a demand-based indicator of competitiveness. It is the nominal effective exchange rate (a measure of the value of a currency against a
weighted average of several foreign currencies) divided by a price deflator or index of costs.
-25
-20
-15
-10
-5
0
5
10
15
20
25
Tur
key
Hun
gary
Sou
th A
fric
a
Rus
sia
Bra
zil
Per
u
Indi
a
Rom
ania
Chi
na
Tha
iland
Phi
lippi
nes
Pol
and
Sou
th K
orea
Chi
le
Sin
gapo
re
Indo
nesi
a
Mex
ico
Col
ombi
a
Mal
aysi
a
REER Valuation in 2014 Latest REER Valuation in 2015
OVERVALUATION
UNDERVALUATION
4 | 2016 INVESTMENT OUTLOOK
We Don’t Expect Solvency Issues in Many Emerging Markets Emerging markets were often regarded as
being in near-crisis condition during the
second half of 2015. We believe concerns
of a systemic crisis have been exaggerated,
as there are significant differences across
the asset class. Most commodity exporters,
and emerging markets with poor macro
fundamentals, remain vulnerable. Other
emerging countries, however, have solid
policies and better underlying fundamentals
that have not been recognized by market
valuations. We believe investors should not
view the emerging-markets asset class as
a whole but should instead selectively
distinguish between individual economies.
Over the last decade, several emerging-
market countries have increased their
external reserve cushions, brought their
current accounts into surplus or close to
balance, improved their fiscal accounts and
reduced US-dollar liabilities—for example,
today, countries like Malaysia and Mexico
rely primarily on domestic sources of
financing. Thus currency depreciations
have not triggered solvency crises as in
the past. In fact, depreciations have
reduced vulnerabilities by boosting export
competitiveness and supporting growth.
Additionally, some countries have more
external assets than liabilities, so currency
depreciation actually lowers their debt-to-
GDP ratio. In our assessment, several
specific emerging-market currencies are
fundamentally undervalued and are
poised to appreciate over the medium to
longer term.
GLOBAL MACRO OUTLOOK
— Continued
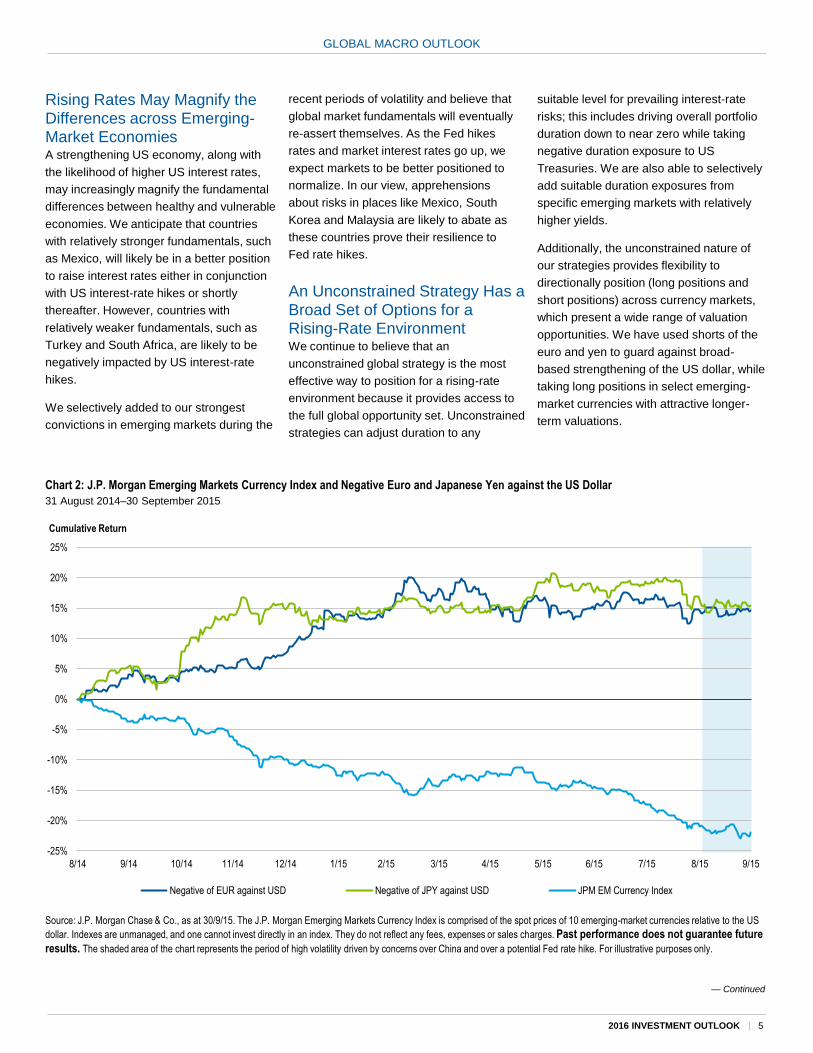
Chart 2: J.P. Morgan Emerging Markets Currency Index and Negative Euro and Japanese Yen against the US Dollar
31 August 2014–30 September 2015
Source: J.P. Morgan Chase & Co., as at 30/9/15. The J.P. Morgan Emerging Markets Currency Index is comprised of the spot prices of 10 emerging-market currencies relative to the US
dollar. Indexes are unmanaged, and one cannot invest directly in an index. They do not reflect any fees, expenses or sales charges. Past performance does not guarantee future
results. The shaded area of the chart represents the period of high volatility driven by concerns over China and over a potential Fed rate hike. For illustrative purposes only.
-25%
-20%
-15%
-10%
-5%
0%
5%
10%
15%
20%
25%
8/14 9/14 10/14 11/14 12/14 1/15 2/15 3/15 4/15 5/15 6/15 7/15 8/15 9/15
Cumulative Return
Negative of EUR against USD Negative of JPY against USD JPM EM Currency Index
2016 INVESTMENT OUTLOOK | 5
recent periods of volatility and believe that
global market fundamentals will eventually
re-assert themselves. As the Fed hikes
rates and market interest rates go up, we
expect markets to be better positioned to
normalize. In our view, apprehensions
about risks in places like Mexico, South
Korea and Malaysia are likely to abate as
these countries prove their resilience to
Fed rate hikes.
An Unconstrained Strategy Has a Broad Set of Options for a Rising-Rate Environment We continue to believe that an
unconstrained global strategy is the most
effective way to position for a rising-rate
environment because it provides access to
the full global opportunity set. Unconstrained
strategies can adjust duration to any
Rising Rates May Magnify the Differences across Emerging-Market Economies A strengthening US economy, along with
the likelihood of higher US interest rates,
may increasingly magnify the fundamental
differences between healthy and vulnerable
economies. We anticipate that countries
with relatively stronger fundamentals, such
as Mexico, will likely be in a better position
to raise interest rates either in conjunction
with US interest-rate hikes or shortly
thereafter. However, countries with
relatively weaker fundamentals, such as
Turkey and South Africa, are likely to be
negatively impacted by US interest-rate
hikes.
We selectively added to our strongest
convictions in emerging markets during the
suitable level for prevailing interest-rate
risks; this includes driving overall portfolio
duration down to near zero while taking
negative duration exposure to US
Treasuries. We are also able to selectively
add suitable duration exposures from
specific emerging markets with relatively
higher yields.
Additionally, the unconstrained nature of
our strategies provides flexibility to
directionally position (long positions and
short positions) across currency markets,
which present a wide range of valuation
opportunities. We have used shorts of the
euro and yen to guard against broad-
based strengthening of the US dollar, while
taking long positions in select emerging-
market currencies with attractive longer-
term valuations.

GLOBAL MACRO OUTLOOK
6 | 2016 INVESTMENT OUTLOOK
investment convictions and added to those
types of positions as prices became
cheaper during the periods of heightened
volatility.
At the start of 2016, we are encouraged by
the vast set of fundamentally attractive
valuations across the global bond and
currency markets. Currently we favor
currencies in countries where inflation is
picking up and growth remains healthy,
yet the local currency remains
fundamentally undervalued. Looking
ahead, we expect continued depreciation
of the euro and yen, rising US Treasury
yields, and currency appreciation in select
emerging markets.
We Are Positioned for Rising US Treasury Yields and Currency Appreciation in Select Emerging Markets On the whole, we have continued to
position our strategies for rising rates by
maintaining low portfolio duration and
aiming at a negative correlation with US
Treasury returns. We have also continued
to actively seek select duration exposures
that can offer positive real yields without
taking undue interest-rate risk, favoring
countries that have solid underlying
fundamentals and prudent fiscal, monetary
and financial policies. When investing
globally, several investment opportunities
may take time to materialize, which may
require weathering short-term volatility as
the longer-term investing theses develop.
During 2015, we shifted out of markets
that we were previously contrarian on (that
were once distressed but have now
recovered and become consensus) in
order to re-allocate to positions that have
fundamentally attractive valuations for the
medium-term ahead. We also maintained
our exposures to several of our strongest
TEAM OVERVIEW
Dr. Hasenstab and his team
manage Templeton’s global
bond strategies, including
unconstrained fixed income,
currency and global macro. This
economic team, trained in some
of the leading universities in the
world, integrates global
macroeconomic analysis with
in-depth country research to help
identify long-term imbalances
that translate to investment
opportunities.
During 2015, we shifted out of markets that we
were previously contrarian on (that were once
distressed but have now recovered and become
consensus) in order to re-allocate to positions
that have fundamentally attractive valuations for
the medium-term ahead.
“
”

Global Equity Outlook
— Continued
Edward D. Perks, CFA
Chief Investment Officer
Franklin Templeton Equity
2016 OUTLOOK: “With a generally healthy backdrop, a robust opportunity set and a focus on
the long term, we remain constructive on the prospects for active equity management across a
wide range of sectors and regions as we enter 2016.”
2016 INVESTMENT OUTLOOK | 7
Prospects for a “Sweet ’16” During much of 2015, global equity markets
labored under the weight of sputtering
growth in developed economies, slumping
emerging markets, and collapsing prices for
a wide range of commodities and natural
resources that had far-reaching
consequences. Although extraordinary
monetary policy measures from key central
banks have been employed in efforts to
stimulate economic growth over the last
several years, these measures proved
somewhat less effective in meeting 2015
growth targets in economies that comprise
a substantial amount of global GDP,
including the United States, the eurozone,
the United Kingdom and Japan. This
challenging backdrop occurred amid
uncertainties surrounding economic growth
in China and the country’s transition from
an investment-led economy to one driven
more by domestic consumption. Finally,
involving China: sharp volatility in Chinese equity markets, additional downward
movement in the foreign exchange value of the Chinese yuan, and renewed
concerns about the decelerating pace of Chinese economic growth. In addition,
financial markets in the first week of trading in 2016 were somewhat unnerved by
geopolitical tensions between Saudi Arabia and Iran, reports of nuclear military
tests taking place in North Korea, and additional incremental weakness in global
energy prices. While we take each of these factors into thorough consideration
while formulating our investment views, we feel comfortable that—provided there is
not substantial escalation in geopolitical tensions—markets will eventually look
beyond these short-term headlines and return their primary focus to the merits and
fundamentals of individual securities. Indeed, overreaction by financial markets to
short-term negative news headlines oftentimes creates attractive investment
opportunities for disciplined long-term investors.
We remain generally constructive on the prospects for global equity performance
potential due to a host of factors such as further declines in unemployment in key
regions, an improving wage outlook for a broader segment of the global economy
and the resiliency of corporate profitability, the latter of which continues to enable
tremendous flexibility in capital allocation.
Navigating Shifts in Central Bank and Government Policies While many market participants view the recent Fed decision to raise interest rates
as a so-called “lift-off,” we prefer to view it as a process of normalization. The
implementation of the zero interest rate policy (ZIRP) back in December 2008 was
markets
remained fixated
on the timing of
the Fed’s “lift-off”
in raising interest
rates and the
potential market
implications that
may exist for the
duration of the
current business
cycle.
Succumbing to the pressure of these
headwinds, global equity markets generally
stalled out in 2015.
Shifting our gaze to this year, the first week
of calendar 2016 trading brought with it
another wave of incremental financial
markets volatility. A host of global macro-
economic factors increased investors’
anxiety, including a combination of issues
GLOBAL EQUITY OUTLOOK
— Continued
8 | 2016 INVESTMENT OUTLOOK
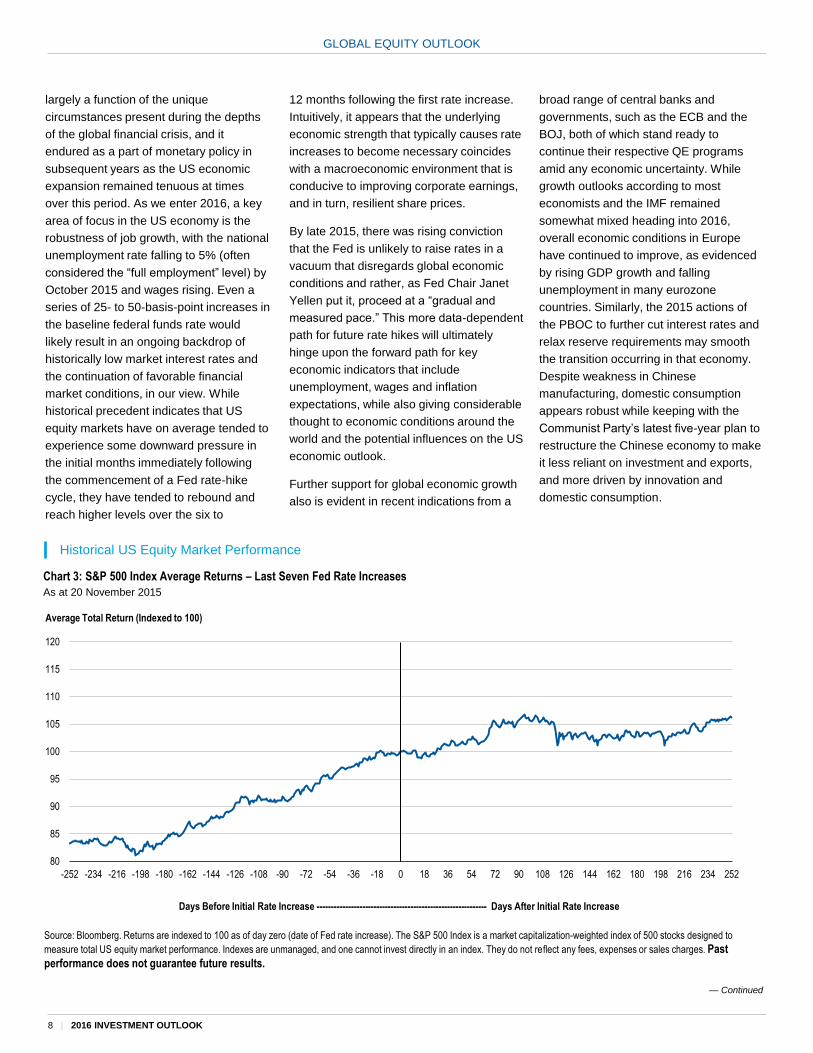
Chart 3: S&P 500 Index Average Returns – Last Seven Fed Rate Increases
As at 20 November 2015
Source: Bloomberg. Returns are indexed to 100 as of day zero (date of Fed rate increase). The S&P 500 Index is a market capitalization-weighted index of 500 stocks designed to
measure total US equity market performance. Indexes are unmanaged, and one cannot invest directly in an index. They do not reflect any fees, expenses or sales charges. Past
performance does not guarantee future results.
80
85
90
95
100
105
110
115
120
-252 -234 -216 -198 -180 -162 -144 -126 -108 -90 -72 -54 -36 -18 0 18 36 54 72 90 108 126 144 162 180 198 216 234 252
Average Total Return (Indexed to 100)
Days Before Initial Rate Increase ------------------------------------------------------------ Days After Initial Rate Increase
Historical US Equity Market Performance
12 months following the first rate increase.
Intuitively, it appears that the underlying
economic strength that typically causes rate
increases to become necessary coincides
with a macroeconomic environment that is
conducive to improving corporate earnings,
and in turn, resilient share prices.
By late 2015, there was rising conviction
that the Fed is unlikely to raise rates in a
vacuum that disregards global economic
conditions and rather, as Fed Chair Janet
Yellen put it, proceed at a “gradual and
measured pace.” This more data-dependent
path for future rate hikes will ultimately
hinge upon the forward path for key
economic indicators that include
unemployment, wages and inflation
expectations, while also giving considerable
thought to economic conditions around the
world and the potential influences on the US
economic outlook.
Further support for global economic growth
also is evident in recent indications from a
broad range of central banks and
governments, such as the ECB and the
BOJ, both of which stand ready to
continue their respective QE programs
amid any economic uncertainty. While
growth outlooks according to most
economists and the IMF remained
somewhat mixed heading into 2016,
overall economic conditions in Europe
have continued to improve, as evidenced
by rising GDP growth and falling
unemployment in many eurozone
countries. Similarly, the 2015 actions of
the PBOC to further cut interest rates and
relax reserve requirements may smooth
the transition occurring in that economy.
Despite weakness in Chinese
manufacturing, domestic consumption
appears robust while keeping with the
Communist Party’s latest five-year plan to
restructure the Chinese economy to make
it less reliant on investment and exports,
and more driven by innovation and
domestic consumption.
largely a function of the unique
circumstances present during the depths
of the global financial crisis, and it
endured as a part of monetary policy in
subsequent years as the US economic
expansion remained tenuous at times
over this period. As we enter 2016, a key
area of focus in the US economy is the
robustness of job growth, with the national
unemployment rate falling to 5% (often
considered the “full employment” level) by
October 2015 and wages rising. Even a
series of 25- to 50-basis-point increases in
the baseline federal funds rate would
likely result in an ongoing backdrop of
historically low market interest rates and
the continuation of favorable financial
market conditions, in our view. While
historical precedent indicates that US
equity markets have on average tended to
experience some downward pressure in
the initial months immediately following
the commencement of a Fed rate-hike
cycle, they have tended to rebound and
reach higher levels over the six to
GLOBAL EQUITY OUTLOOK
— Continued
2016 INVESTMENT OUTLOOK | 9
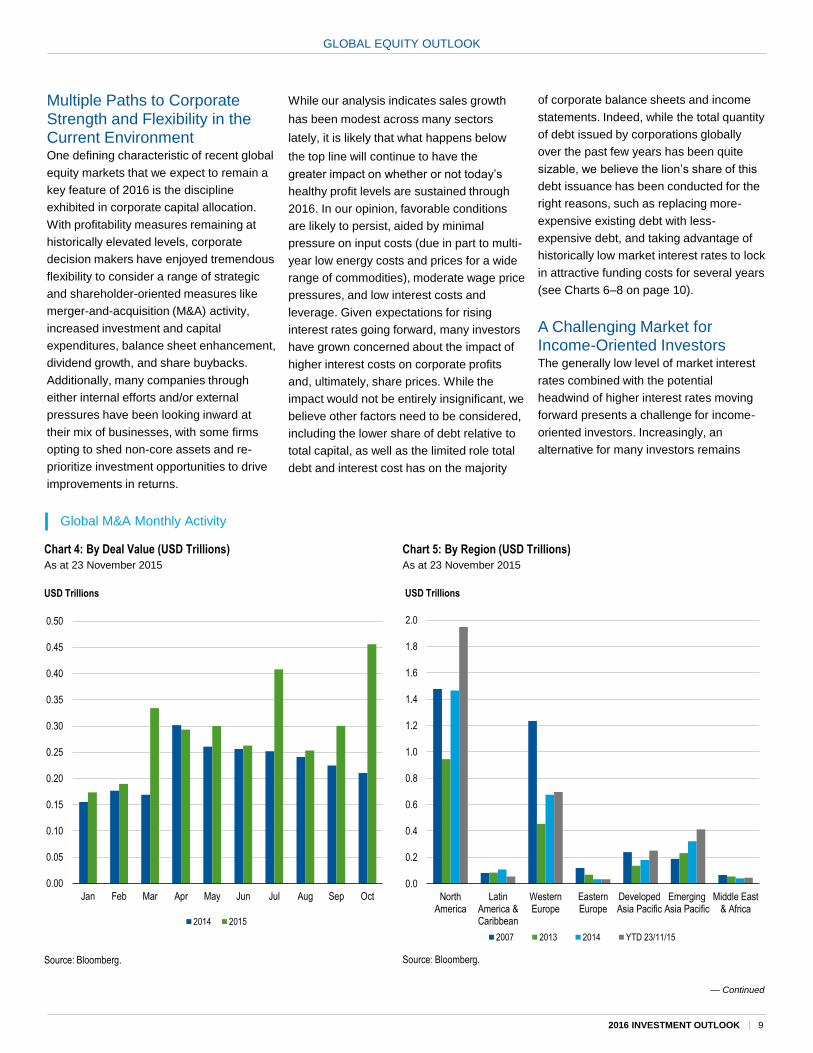
Chart 4: By Deal Value (USD Trillions)
As at 23 November 2015
Source: Bloomberg.
Global M&A Monthly Activity
0.00
0.05
0.10
0.15
0.20
0.25
0.30
0.35
0.40
0.45
0.50
Jan Feb Mar Apr May Jun Jul Aug Sep Oct
2014 2015
USD Trillions
Chart 5: By Region (USD Trillions)
As at 23 November 2015
Source: Bloomberg.
0.0
0.2
0.4
0.6
0.8
1.0
1.2
1.4
1.6
1.8
2.0
NorthAmerica
LatinAmerica &Caribbean
WesternEurope
EasternEurope
DevelopedAsia Pacific
EmergingAsia Pacific
Middle East& Africa
2007 2013 2014 YTD 23/11/15
USD Trillions
Multiple Paths to Corporate Strength and Flexibility in the Current Environment One defining characteristic of recent global
equity markets that we expect to remain a
key feature of 2016 is the discipline
exhibited in corporate capital allocation.
With profitability measures remaining at
historically elevated levels, corporate
decision makers have enjoyed tremendous
flexibility to consider a range of strategic
and shareholder-oriented measures like
merger-and-acquisition (M&A) activity,
increased investment and capital
expenditures, balance sheet enhancement,
dividend growth, and share buybacks.
Additionally, many companies through
either internal efforts and/or external
pressures have been looking inward at
their mix of businesses, with some firms
opting to shed non-core assets and re-
prioritize investment opportunities to drive
improvements in returns.
While our analysis indicates sales growth
has been modest across many sectors
lately, it is likely that what happens below
the top line will continue to have the
greater impact on whether or not today’s
healthy profit levels are sustained through
2016. In our opinion, favorable conditions
are likely to persist, aided by minimal
pressure on input costs (due in part to multi-
year low energy costs and prices for a wide
range of commodities), moderate wage price
pressures, and low interest costs and
leverage. Given expectations for rising
interest rates going forward, many investors
have grown concerned about the impact of
higher interest costs on corporate profits
and, ultimately, share prices. While the
impact would not be entirely insignificant, we
believe other factors need to be considered,
including the lower share of debt relative to
total capital, as well as the limited role total
debt and interest cost has on the majority
of corporate balance sheets and income
statements. Indeed, while the total quantity
of debt issued by corporations globally
over the past few years has been quite
sizable, we believe the lion’s share of this
debt issuance has been conducted for the
right reasons, such as replacing more-
expensive existing debt with less-
expensive debt, and taking advantage of
historically low market interest rates to lock
in attractive funding costs for several years
(see Charts 6–8 on page 10).
A Challenging Market for Income-Oriented Investors The generally low level of market interest
rates combined with the potential
headwind of higher interest rates moving
forward presents a challenge for income-
oriented investors. Increasingly, an
alternative for many investors remains
GLOBAL EQUITY OUTLOOK
— Continued
Chart 6: MSCI All Country World Index
January 1997–October 2015
Source: FactSet. The MSCI All Country (AC) World Index is a free float-adjusted, market capitalization-weighted index that
is designed to measure the equity market performance of global developed and emerging markets. Indexes are unmanaged,
and one cannot invest directly in an index. They do not reflect any fees, expenses or sales charges. LTM = last 12 months,
which means each of the data points includes the last 12 months of data to eliminate any short-term swings.
Total Debt to Total Capital
Chart 7: MSCI All Country World ex-Financials Index
31 December 1996–20 November 2015
Source: FactSet. The MSCI AC World ex-Financials Index is a free float-adjusted, market capitalization-weighted index
that is designed to measure the equity market performance of global developed and emerging markets excluding financials.
Indexes are unmanaged, and one cannot invest directly in an index. They do not reflect any fees, expenses or sales
charges.
Net Debt/Shareholders Equity
Chart 8: MSCI All Country World Index
31 March 1997–30 September 2015
Source: FactSet. Indexes are unmanaged, and one cannot invest directly in an index. They do not reflect any fees,
expenses or sales charges.
Earnings Before Interest, Taxes, Depreciation and Amortization
(EBITDA)/Interest Expense
56%
58%
60%
62%
64%
66%
68%
1997 2000 2003 2006 2009 2012 2015
MSCI AC World – Total Debt/Total Capital – LTM
MSCI AC World %
3
4
5
6
7
8
9
31/3/97 24/7/99 15/11/01 9/3/04 2/7/06 24/10/08 16/2/11 10/6/13
EBITDA/Interest Expense
30/9/15
Ratio of EBITDA to Interest Expense
dividend-paying equities, which may offer
the combination of current yield and
potential for future dividend growth. The
overall level of dividends paid declined
somewhat during the global financial
crisis, after which many companies
returned their focus to growing dividend
payouts, a trend that remained as a
dominant feature of equity markets
through 2015. With the potential for
interest-rate hikes going forward, many
investors have expressed concerns about
the sensitivity, or correlation, of dividend
payers to long duration fixed income
assets. While we recognize high dividend-
payout-ratio companies that have
exhibited limited growth in earnings and
dividends may be prone to such pressure,
our fundamental analysis attempts to
evaluate the whole picture—from
competitive positioning and growth
potential to balance sheet strength and the
ability to generate rising free cash flow. It
is our belief that equities with these
characteristics may offer investors
attractive performance potential in 2016
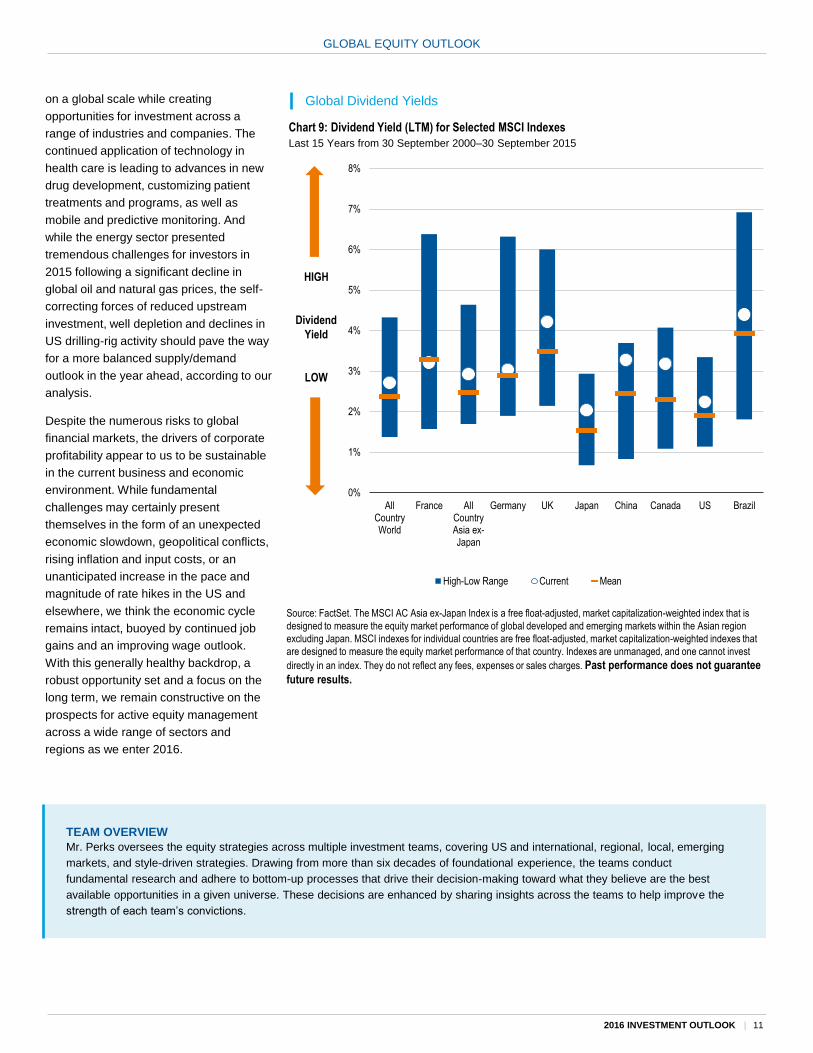
and beyond (see Chart 9 on page 11).
Fundamental Research, Selectivity and Optimism in 2016 While fundamental analysis and bottom-up
stockpicking remain the primary focus for
many of our investment teams, sector-
specific insights from our seasoned team
of analysts across the globe sharpen our
views on the year ahead. Despite the
uncertainty surrounding the pace of global
economic growth and the duration of the
current economic expansion, numerous
secular growth themes remain, offering
investors multiple opportunities. The rising
fortunes of the middle class on a global
scale brings with it greater access to
goods and services for a rapidly
expanding segment of the population,
particularly in the major emerging
economies of China and India. With
advanced technology, the proliferation of
smartphones is enabling mobile computing
40%
50%
60%
70%
80%
90%
100%
110%
31/12/96 29/12/00 31/12/04 31/12/08 31/12/12
Net Debt / Shareholders' Equity
20/11/15
10 | 2016 INVESTMENT OUTLOOK
GLOBAL EQUITY OUTLOOK
Chart 9: Dividend Yield (LTM) for Selected MSCI Indexes
Last 15 Years from 30 September 2000–30 September 2015
Global Dividend Yields on a global scale while creating
opportunities for investment across a
range of industries and companies. The
continued application of technology in
health care is leading to advances in new
drug development, customizing patient
treatments and programs, as well as
mobile and predictive monitoring. And
while the energy sector presented
tremendous challenges for investors in
2015 following a significant decline in
global oil and natural gas prices, the self-
correcting forces of reduced upstream
investment, well depletion and declines in
US drilling-rig activity should pave the way
for a more balanced supply/demand
outlook in the year ahead, according to our
analysis.
Despite the numerous risks to global
financial markets, the drivers of corporate
profitability appear to us to be sustainable
in the current business and economic
environment. While fundamental
challenges may certainly present
themselves in the form of an unexpected
economic slowdown, geopolitical conflicts,
rising inflation and input costs, or an
unanticipated increase in the pace and
magnitude of rate hikes in the US and
elsewhere, we think the economic cycle
remains intact, buoyed by continued job
gains and an improving wage outlook.
With this generally healthy backdrop, a
robust opportunity set and a focus on the
long term, we remain constructive on the
prospects for active equity management
across a wide range of sectors and
regions as we enter 2016.
0%
1%
2%
3%
4%
5%
6%
7%
8%
AllCountryWorld
France AllCountryAsia ex-Japan
Germany UK Japan China Canada US Brazil
High-Low Range Current Mean
HIGH
Dividend
Yield
LOW
Source: FactSet. The MSCI AC Asia ex-Japan Index is a free float-adjusted, market capitalization-weighted index that is
designed to measure the equity market performance of global developed and emerging markets within the Asian region
excluding Japan. MSCI indexes for individual countries are free float-adjusted, market capitalization-weighted indexes that
are designed to measure the equity market performance of that country. Indexes are unmanaged, and one cannot invest
directly in an index. They do not reflect any fees, expenses or sales charges. Past performance does not guarantee
future results.
2016 INVESTMENT OUTLOOK | 11
TEAM OVERVIEW
Mr. Perks oversees the equity strategies across multiple investment teams, covering US and international, regional, local, emerging
markets, and style-driven strategies. Drawing from more than six decades of foundational experience, the teams conduct
fundamental research and adhere to bottom-up processes that drive their decision-making toward what they believe are the best
available opportunities in a given universe. These decisions are enhanced by sharing insights across the teams to help improve the
strength of each team’s convictions.

Long-Term Capital Market Expectations Every year, Franklin Templeton Solutions
reviews the data and themes driving capital
markets in order to build asset return
expectations for different asset classes for
the next five to 10 years. Our long-term
forecasts are based on our assessment of
current valuation measures, economic
growth and inflation prospects, as well as
historical risk premiums.
Slow Global Growth Since the 2007–2008 global financial crisis,
we have witnessed a weaker recovery by
historical standards even with supportive
central banks across the globe. We believe
underlying structural changes have been
driving down real growth globally. Debt
deleveraging is one of the main culprits.
While it was already underway in the United
States and Europe, China is just joining the
Long-Term Capital Markets Outlook
Furthermore, an aging population in major developed and emerging countries is an
even stronger factor depressing the growth outlook. Starting in 2016, the working-
age population will decline in advanced economies, while the share of the
population over 65 years of age will skyrocket.4 We think that this demographic
change is a powerful force to reckon with. Japan is an important example of what
Europe and the rest of the developed world face in the future. The United States
may look better positioned in terms of this demographic crisis, but a stronger US
dollar not only adds to emerging-market woes but also impacts US economic
growth adversely.
Subdued Global Inflation Expectations In broad terms, we regard inflation as currently low in both developed- and
emerging-market economies. Given the slow growth expectation and low threat of
any supply shocks (like the oil embargo in the 1970s), it is hard to see inflation
accelerating to unexpected levels in the next five years. During the past few
decades, we saw a savings glut in China and Germany providing excess capital
that has held down interest rates and inflation. Going forward, the movement of a
large share of the population into the lower-consumption/higher-saving period of
their lives is likely to add to the excess savings while keeping interest rates low and
inflation moderate. Central banks have reacted to these economic forces and
implemented QE. They also had to keep QE in effect longer than they initially
expected to boost inflation closer to their desired target levels.
— Continued
Rick Frisbie
Head of Franklin Templeton Solutions
Franklin Templeton Investments
LONG-TERM OUTLOOK: “We note that underlying structural changes have been driving down
real growth globally and that it is hard for us to see inflation accelerating to unexpected levels
in the next five years. Our assessment of current valuation measures, as well as economic
growth and inflation prospects, leave us bullish in terms of opportunities in global equities,
systematic beta2 and oil, and bearish on global government bonds.”
trend, which
may take years
to unfold.
According to the
IMF, China has
replaced the
United States as
the top
contributor to
global growth,3
and therefore the drag on global growth as
a result of China’s deleveraging assumes a
proportionately larger impact. A
continuation of the slowdown in China and
the economy’s realignment toward
consumption and services is particularly
bad news for countries that export oil and
metals, in our view.
2. Systematic beta is a source of potential returns that is persistent, investable and liquid, and can be implemented systematically.
3. Source: International Monetary Fund, World Economic Outlook, October 2015. © 2015 By International Monetary Fund. All Rights Reserved.
4. Source: United Nations World Population Prospects, 2015 Revision.
12 | 2016 INVESTMENT OUTLOOK
LONG-TERM CAPITAL MARKETS OUTLOOK
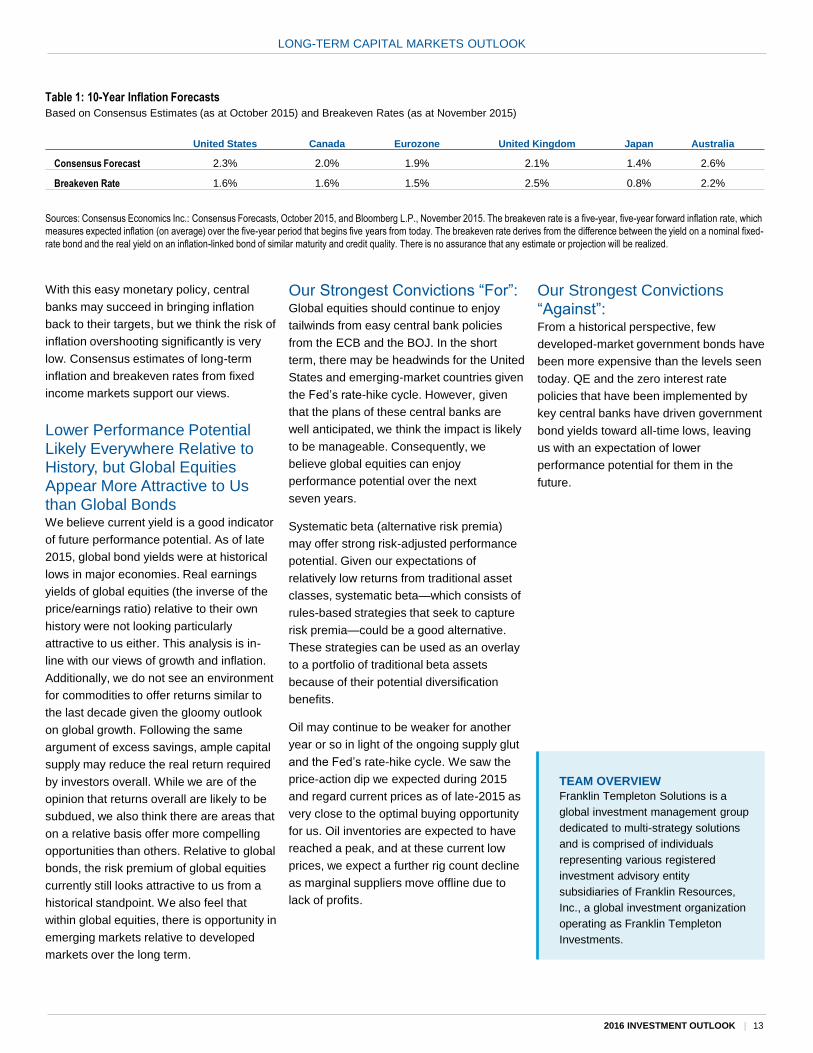
Table 1: 10-Year Inflation Forecasts
Based on Consensus Estimates (as at October 2015) and Breakeven Rates (as at November 2015)
Sources: Consensus Economics Inc.: Consensus Forecasts, October 2015, and Bloomberg L.P., November 2015. The breakeven rate is a five-year, five-year forward inflation rate, which
measures expected inflation (on average) over the five-year period that begins five years from today. The breakeven rate derives from the difference between the yield on a nominal fixed-
rate bond and the real yield on an inflation-linked bond of similar maturity and credit quality. There is no assurance that any estimate or projection will be realized.
With this easy monetary policy, central
banks may succeed in bringing inflation
back to their targets, but we think the risk of
inflation overshooting significantly is very
low. Consensus estimates of long-term
inflation and breakeven rates from fixed
income markets support our views.
Lower Performance Potential Likely Everywhere Relative to History, but Global Equities Appear More Attractive to Us than Global Bonds We believe current yield is a good indicator
of future performance potential. As of late
2015, global bond yields were at historical
lows in major economies. Real earnings
yields of global equities (the inverse of the
price/earnings ratio) relative to their own
history were not looking particularly
attractive to us either. This analysis is in-
line with our views of growth and inflation.
Additionally, we do not see an environment
for commodities to offer returns similar to
the last decade given the gloomy outlook
on global growth. Following the same
argument of excess savings, ample capital
supply may reduce the real return required
by investors overall. While we are of the
opinion that returns overall are likely to be
subdued, we also think there are areas that
on a relative basis offer more compelling
opportunities than others. Relative to global
bonds, the risk premium of global equities
currently still looks attractive to us from a
historical standpoint. We also feel that
within global equities, there is opportunity in
emerging markets relative to developed
markets over the long term.
Our Strongest Convictions “For”: Global equities should continue to enjoy
tailwinds from easy central bank policies
from the ECB and the BOJ. In the short
term, there may be headwinds for the United
States and emerging-market countries given
the Fed’s rate-hike cycle. However, given
that the plans of these central banks are
well anticipated, we think the impact is likely
to be manageable. Consequently, we
believe global equities can enjoy
performance potential over the next
seven years.
Systematic beta (alternative risk premia)
may offer strong risk-adjusted performance
potential. Given our expectations of
relatively low returns from traditional asset
classes, systematic beta—which consists of
rules-based strategies that seek to capture
risk premia—could be a good alternative.
These strategies can be used as an overlay
to a portfolio of traditional beta assets
because of their potential diversification
benefits.
Oil may continue to be weaker for another
year or so in light of the ongoing supply glut
and the Fed’s rate-hike cycle. We saw the
price-action dip we expected during 2015
and regard current prices as of late-2015 as
very close to the optimal buying opportunity
for us. Oil inventories are expected to have
reached a peak, and at these current low
prices, we expect a further rig count decline
as marginal suppliers move offline due to
lack of profits.
Our Strongest Convictions “Against”: From a historical perspective, few
developed-market government bonds have
been more expensive than the levels seen
today. QE and the zero interest rate
policies that have been implemented by
key central banks have driven government
bond yields toward all-time lows, leaving
us with an expectation of lower
performance potential for them in the
future.
United States Canada Eurozone United Kingdom Japan Australia
Consensus Forecast 2.3% 2.0% 1.9% 2.1% 1.4% 2.6%
Breakeven Rate 1.6% 1.6% 1.5% 2.5% 0.8% 2.2%
TEAM OVERVIEW
Franklin Templeton Solutions is a
global investment management group
dedicated to multi-strategy solutions
and is comprised of individuals
representing various registered
investment advisory entity
subsidiaries of Franklin Resources,
Inc., a global investment organization
operating as Franklin Templeton
Investments.
2016 INVESTMENT OUTLOOK | 13
Visit our website to learn more about how our multiple world-class investment teams view the
complex, interconnected global financial markets they invest in. The portfolio managers listed
below describe what they foresee as investment opportunities and challenges in 2016.
MORE INVESTMENT
INSIGHTS ONLINE
FIXED INCOME
US Municipal Bond Investing: Sheila Amoroso & Rafael Costas
Franklin Templeton Fixed Income Group
Multi-Sector Fixed Income
Investing: Christopher J. Molumphy, CFA
Franklin Templeton Fixed Income Group
US Growth Investing: Grant Bowers &
Matthew J. Moberg, CPA
Franklin Equity Group
US Growth Investing:
Serena Perin Vinton, CFA
Franklin Equity Group
EQUITY
Emerging-Market Investing:
Mark Mobius, Ph.D.
Templeton Emerging Markets Group
Global Equity Investing:
Stephen H. Dover, CFA
Franklin Local Asset Management
Global Value Investing: Norman J. Boersma, CFA &
Cindy L. Sweeting, CFA
Templeton Global Equity Group
Global Value Investing:
Peter A. Langerman
Franklin Mutual Series
MULTI ASSETS
Investing in Multi Asset Portfolios: Thomas A. Nelson, CFA &
Brooks Ritchey
Franklin Templeton Solutions
ALTERNATIVES
Hedge Fund Strategy Investing: David C. Saunders &
Robert Christian
K2 Advisors
Natural Resources Investing:
Frederick G. Fromm, CFA
Franklin Equity Group
Real Estate and
Infrastructure Investing:
Wilson Magee
Franklin Real Asset Advisors
14 | 2016 INVESTMENT OUTLOOK
WHAT ARE THE RISKS?
All investments involve risks, including possible loss of principal.
Currency rates may fluctuate significantly over short periods of
time, and can reduce returns. Derivatives, including currency
management strategies, involve costs and can create economic
leverage in a portfolio which may result in significant volatility
and cause it to participate in losses (as well as enable gains) on
an amount that exceeds its initial investment. A portfolio may not
achieve the anticipated benefits, and may realize losses when a
counterparty fails to perform as promised. The markets for
particular securities or types of securities are or may become
relatively illiquid. Reduced liquidity will have an adverse impact
on the security’s value and on the ability to sell such securities in
response to a specific market event. Foreign securities involve
special risks, including currency fluctuations and economic and
political uncertainties. Investments in emerging markets involve
heightened risks related to the same factors, in addition to those
associated with these markets’ smaller size and lesser liquidity.
Investments in lower-rated bonds include higher risk of default
and loss of principal. Bond prices generally move in the opposite
direction of interest rates. As the prices of bonds in an
investment portfolio adjust to a rise in interest rates, the value of
the portfolio may decline. Changes in the financial strength of a
bond issuer or in a bond’s credit rating may affect its value.
Stock prices fluctuate, sometimes rapidly and dramatically, due
to factors affecting individual companies, particular industries or
sectors, or general market conditions. Because some systematic
beta strategy signals are built using historical market events,
systematic beta strategies can be subject to model risk, whereby
the strategies perform differently than the model would expect for
various reasons, including but not limited to market and
economic conditions. In other words, the future performance and
correlations of systematic beta strategies may differ, potentially
significantly, from historical performance and correlations.
IMPORTANT LEGAL INFORMATION
This material is intended to be of general interest only and should
not be construed as individual investment advice or a
recommendation or solicitation to buy, sell or hold any security or
to adopt any investment strategy. It does not constitute legal or
tax advice.
The views expressed are those of the investment manager and
the comments, opinions and analyses are rendered as of the
publication date and may change without notice. The information
provided in this material is not intended as a complete analysis of
every material fact regarding any country, region or market. All
investments involve risks, including possible loss of
principal.
Data from third party sources may have been used in the
preparation of this material and Franklin Templeton Investments
(“FTI”) has not independently verified, validated or audited such
data. FTI accepts no liability whatsoever for any loss arising from
use of this information and reliance upon the comments, opinions
and analyses in the material is at the sole discretion of the user.
Products, services and information may not be available in all
jurisdictions and are offered outside the U.S. by other FTI
affiliates and/or their distributors as local laws and regulation
permits. Please consult your own professional adviser for further
information on availability of products and services in your
jurisdiction.
Issued in the U.S. by Franklin Templeton Distributors, Inc., One
Franklin Parkway, San Mateo, California 94403-1906, (800) DIAL
BEN/342-5236, franklintempleton.com - Franklin Templeton
Distributors, Inc. is the principal distributor of Franklin Templeton
Investments’ U.S. registered products, which are available only in
jurisdictions where an offer or solicitation of such products is
permitted under applicable laws and regulation.
2016 INVESTMENT OUTLOOK | 15

Australia: Issued by Franklin Templeton Investments Australia
Limited (ABN 87 006 972 247) (Australian Financial Services
License Holder No. 225328), Level 19, 101 Collins Street,
Melbourne, Victoria, 3000. Austria/Germany: Issued by Franklin
Templeton Investment Services GmbH, Mainzer Landstraße 16,
D-60325 Frankfurt am Main, Germany. Authorized in Germany
by IHK Frankfurt M., Reg. no. D-F-125-TMX1-08. Canada:
Issued by Franklin Templeton Investments Corp., 5000 Yonge
Street, Suite 900 Toronto, ON, M2N 0A7, Fax: (416) 364-1163,
(800) 387-0830, www.franklintempleton.ca. Dubai: Issued by
Franklin Templeton Investments (ME) Limited, authorized and
regulated by the Dubai Financial Services Authority. Dubai office:
Franklin Templeton Investments, The Gate, East Wing, Level 2,
Dubai International Financial Centre, P.O. Box 506613, Dubai,
U.A.E., Tel.: +9714-4284100 Fax: +9714-4284140. France:
Issued by Franklin Templeton France S.A., 20 rue de la Paix,
75002 Paris, France. Hong Kong: Issued by Franklin Templeton
Investments (Asia) Limited, 17/F, Chater House, 8 Connaught
Road Central, Hong Kong. Italy: Issued by Franklin Templeton
Italia Sim S.p.A., Corso Italia, 1 – Milan, 20122, Italy. Japan:
Issued by Franklin Templeton Investments Japan Limited.
Korea: Issued by Franklin Templeton Investment Trust
Management Co., Ltd., 3rd fl., CCMM Building, 12 Youido-Dong,
Youngdungpo-Gu, Seoul, Korea 150-968. Luxembourg/
Benelux: Issued by Franklin Templeton International Services,
S.à r.l. – Supervised by the Commission de Surveillance du
Secteur Financier - 8A, rue Albert Borschette, L-1246
Luxembourg - Tel: +352-46 66 67-1 - Fax: +352-46 66 76.
Malaysia: Issued by Franklin Templeton Asset Management
(Malaysia) Sdn. Bhd. & Franklin Templeton GSC Asset
Management Sdn. Bhd. Nordic regions: Issued by Franklin
Templeton Investment Management Limited (FTIML), Swedish
Branch, Blasieholmsgatan 5, Se-111 48 Stockholm, Sweden.
FTIML is authorized and regulated in the United Kingdom by the
Financial Conduct Authority and is authorized to conduct certain
investment services in Denmark, Sweden, Norway & Finland.
Poland: Issued by Templeton Asset Management (Poland) TFI
S.A., Rondo ONZ 1; 00-124 Warsaw. Romania: Issued by the
Bucharest branch of Franklin Templeton Investment
Management Limited, 78-80 Buzesti Street, Premium Point, 7th-
8th Floor, 011017 Bucharest 1, Romania. Registered with CNVM
under no. PJM05SSAM/400001/ 14.09.2009, and authorized and
regulated in the UK by the Financial Conduct Authority.
Singapore: Issued by Templeton Asset Management Ltd.
Registration No. (UEN) 199205211E, 7 Temasek Boulevard,
#38-03 Suntec Tower One, 038987, Singapore. Spain: Issued by
the branch of Franklin Templeton Investment Management,
Professional of the Financial Sector under the Supervision of
CNMV, José Ortega y Gasset 29, Madrid. South Africa: Issued
by Franklin Templeton Investments SA (PTY) Ltd which is an
authorized Financial Services Provider. Tel: +27 (11) 341 2300
Fax: +27 (11) 341 2301. Switzerland & Liechtenstein: Issued
by Franklin Templeton Switzerland Ltd, Stockerstrasse 38, CH-
8002 Zurich. UK: Issued by Franklin Templeton Investment
Management Limited (FTIML), registered office: Cannon Place,
78 Cannon Street, London, EC4N 6HL. Authorized and regulated
in the United Kingdom by the Financial Conduct Authority.
Offshore Americas: In the U.S., this publication is made
available only to financial intermediaries by Templeton/Franklin
Investment Services, 100 Fountain Parkway, St. Petersburg,
Florida 33716. Tel: (800) 239-3894 (USA Toll-Free), (877) 389-
0076 (Canada Toll-Free), and Fax: (727) 299-8736. Investments
are not FDIC insured; may lose value; and are not bank
guaranteed. Distribution outside the U.S. may be made by
Templeton Global Advisors Limited or other sub-distributors,
intermediaries, dealers or professional investors that have been
engaged by Templeton Global Advisors Limited to distribute
shares of Franklin Templeton funds in certain jurisdictions. This is
not an offer to sell or a solicitation of an offer to purchase
securities in any jurisdiction where it would be illegal to do so.
CFA® and Chartered Financial Analyst® are trademarks owned by CFA Institute.
MSCI makes no warranties and shall have no liability with respect to any MSCI data reproduced herein. No further redistribution or use is permitted. This report is not
prepared or endorsed by MSCI.
See www.franklintempletondatasources.com for additional data provider information.
16 | 2016 INVESTMENT OUTLOOK


Copyright © 2016 Franklin Templeton Investments. All rights reserved. IBS YEOS 01/16
Please visit www.franklinresources.com to be
directed to your local Franklin Templeton website.