Embed Size (px)
Citation preview
9TH PACIFIC RIM REAL ESTATE SOCIETY ANNUAL CONFERENCE Brisbane, Queensland, Australia
20 - 22 January 2003
INVESTMENT CHARACTERISTICS OF
THE MALAYSIAN REISDENTIAL PROPERTY SECTOR
Ting Kien Hwa Department of Estate Management
Faculty of Architecture, Planning & Surveying University of Technology MARA
40450 Shah Alam, Selangor Malaysia
Telephone : 03 - 5544 4217, Fax : 03 – 5544 4353, e-mail : [email protected]
Keywords : Risk-return analysis, risk-adjusted performance, Malaysian House Price Index, Investment options

2
INVESTMENT CHARACTERISTICS OF
THE MALAYSIAN RESIDENTIAL PROPERTY SECTOR
By
Ting Kien Hwa Department of Estate Management
Faculty of Architecture, Planning & Surveying, University Technology MARA, 40450 Shah Alam, Selangor
Malaysia
Abstract This paper examines the performance of Malaysian residential property sectors between 1989 - 2001, focusing on risk-return, comparison of residential risk-adjusted performance with equity investments and identification of risk reduction benefits through portfolio diversification.
1.0 Introduction A potential investor before making an investment decision for a particular type of
investment would like to know its past performance and related risk-return
characteristics. Similarly, an investor who has made an investment would like to know
how the investment has performed in comparison with similar assets and with different
types of investment options. In this regard a comparative performance analysis of
investment options is necessary.
Residential property investment is a popular form of investments among Malaysians
apart from fixed deposits (FD), unit trusts and equities. The launching of the Malaysian
House Price Index (MHPI) in February 1997, provides an opportunity to measure the
investment performance of residential properties in Malaysia.
Prior to the publication of the MHPI, there is difficulty in measuring and comparing the
performance of residential properties. The heterogeneous nature of residential
properties has prevented direct comparison of performance even with the same type of
property in the same locality.
3
2.0 House Price Indices in Malaysia
House price indices are relatively new in Malaysia. Interests in setting-up house price
indices arise after the sharp real property asset inflation in 1995. Factors that have
fuelled the investment and speculative demand is the availability of easy credit, low
interest rate for housing loans and the increasing wealth per capita as evidenced by
higher deposits in financial institutions, savings in provident funds and stock market
investment.
Among the effort to come out with house price indices is the Maybank-RAM Property
Index. It is an index based on the average actual transaction values of three types of
houses in housing estates in Kuala Lumpur, Petaling Jaya and Shah Alam; covering
single storey terrace house, double storey terrace and semi-detached houses.
The overall Maybank-RAM Property Index is computed using the aggregated value of
houses in each district weighted by the district’s share of the total housing stock. The
base of the index is the second quarter of 1992. This index was not continued after
being launched.
The Malaysian House Price Index is a national house price index initially prepared and
published by the National Institute of Valuation (INSPEN). Thereafter with the
establishment of the National Property Information Centre (NAPIC) the index is now
produced by NAPIC.
The MHPI used the Passche method of index construction. Technical details on the
construction of the index can be referred to in “The Malaysian House Price Index : A
Technical Summary” published by the National Institute of Valuation (INSPEN).
The objective of the MHPI is to monitor the movement of house prices in Malaysia. The
MHPI can be used to monitor the trend of house prices and as a barometer for
measuring the general performance of the residential property market. The MHPI has
more than 60 sub-indices apart from the national and state house price indices. The
composition of the MHPI is shown in Table 1.
4
Table 1 : Composition of the Malaysian House Price Index TYPE OF INDICES
Sub-indices/Composition
National indices
Malaysian House Price Index Malaysian Terrace House Price Index Malaysian Semi-detached House Price Index Malaysian Detached House Price Index Malaysian High-rise Unit Price Index
State Indices
One index each for the Federal Territory of Kuala Lumpur and the 13 states in Malaysia. Kuala Lumpur, Selangor, Johor and Penang have four other sub-indices based on housing types i.e. terrace, semi-detached, detached and high-rise residential units. The rest of the states have three other sub-indices based on terrace, semi-detached and detached houses.
Regional Indices
Klang Valley House Price Index Penang Island House Price Index Johor Bahru House Price Index Seremban-Sepang House Price Index Ipoh-Kinta House Price Index
Apart from price indices, the MHPI also contains related data and information on
various aspects of the residential property sector :
(a) the total number of residential property transactions based on states,
(b) the total number of residential property transactions based on price range,
(c) the total number of residential property transactions based on year for
each state,
(d) the value of property transactions,
(e) the value per transaction,
(f) descriptive statistics (i.e. lowest, highest and mean of prices) on each type
of housing types by districts/mukim in each state.
5
3.0 Objectives of Study This study examines the performance of the Malaysian residential property sectors
between 1989 - 2001 focusing on :
(a) risk-return;
(b) comparison between the risk-adjusted performance of residential property, FD
and equity investments;
(c) investigate the diversification benefits of incorporating residential properties in
investment portfolios.
4.0 Data Sources Data on annual capital values of the residential property sector is represented by the
Malaysian House Price Index Series which is published by the National Property
Information Centre. Capital values of residential properties are obtained from the
various MHPI Reports for the study period from 1989 to 2001. The beginning period for
the year 1989 is chosen as the earliest period the Malaysian House Price Index is
available is from 1988.
The year-end closing values of the Kuala Lumpur Composite Index (KLCI) are used as
a proxy for the performance of the Kuala Lumpur Stock Exchange. Annual data of the
KLCI are obtained from the Investors Digest, a publication of the Kuala Lumpur Stock
Exchange.
5.0 Risk-return analysis Different investment options (e.g. government securities, property, FD etc.) exhibit
different risk-return characteristics. Investments that have high liquidity e.g. shares
would exhibit a high risk-high return profile. On the other hand, safe investments e.g.
cash and FD would have a low risk - low return profile.
The most desirable investment choice is an investment which has high return and low
risk profile. Thus investments located on the “high return/low risk” quadrant of a risk-
return diagram would be the ideal investment choice while the least desirable is the
“low return/high risk” quadrant.
6
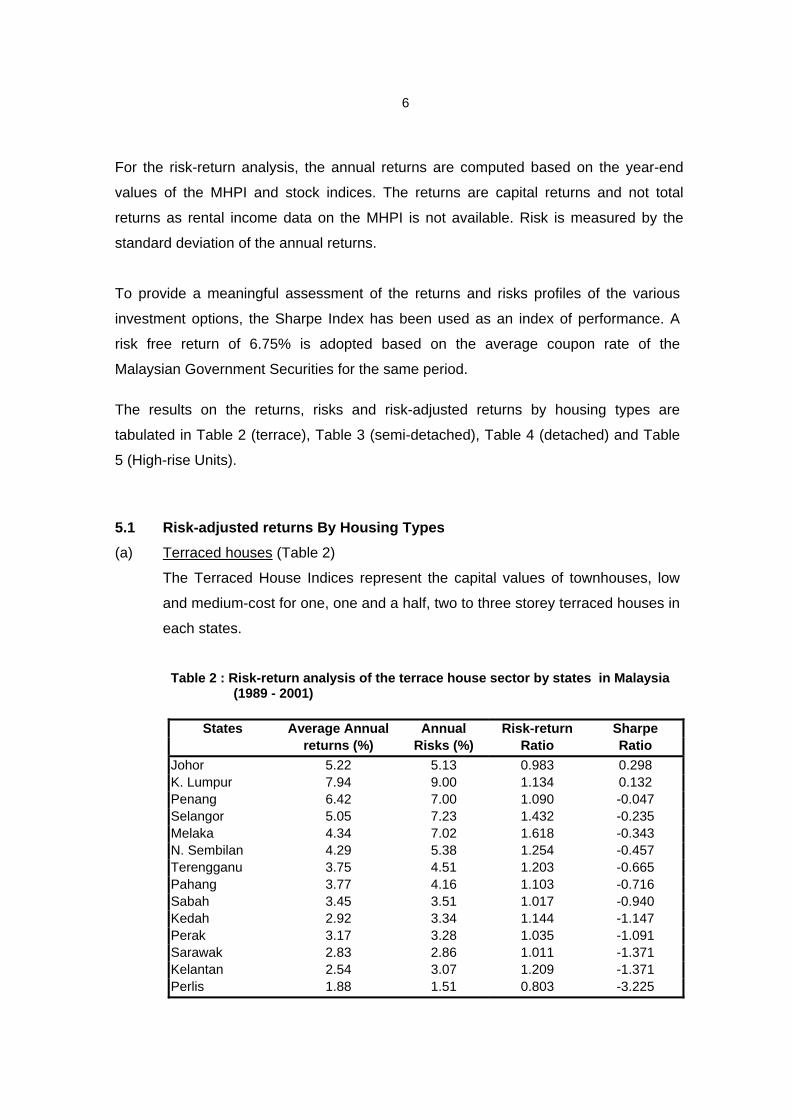
For the risk-return analysis, the annual returns are computed based on the year-end
values of the MHPI and stock indices. The returns are capital returns and not total
returns as rental income data on the MHPI is not available. Risk is measured by the
standard deviation of the annual returns.
To provide a meaningful assessment of the returns and risks profiles of the various
investment options, the Sharpe Index has been used as an index of performance. A
risk free return of 6.75% is adopted based on the average coupon rate of the
Malaysian Government Securities for the same period. The results on the returns, risks and risk-adjusted returns by housing types are
tabulated in Table 2 (terrace), Table 3 (semi-detached), Table 4 (detached) and Table
5 (High-rise Units).
5.1 Risk-adjusted returns By Housing Types (a) Terraced houses (Table 2)
The Terraced House Indices represent the capital values of townhouses, low
and medium-cost for one, one and a half, two to three storey terraced houses in
each states.
Table 2 : Risk-return analysis of the terrace house sector by states in Malaysia (1989 - 2001)
States Average Annual Annual Risk-return Sharpe
returns (%) Risks (%) Ratio Ratio Johor 5.22 5.13 0.983 0.298 K. Lumpur 7.94 9.00 1.134 0.132 Penang 6.42 7.00 1.090 -0.047 Selangor 5.05 7.23 1.432 -0.235 Melaka 4.34 7.02 1.618 -0.343 N. Sembilan 4.29 5.38 1.254 -0.457 Terengganu 3.75 4.51 1.203 -0.665 Pahang 3.77 4.16 1.103 -0.716 Sabah 3.45 3.51 1.017 -0.940 Kedah 2.92 3.34 1.144 -1.147 Perak 3.17 3.28 1.035 -1.091 Sarawak 2.83 2.86 1.011 -1.371 Kelantan 2.54 3.07 1.209 -1.371 Perlis 1.88 1.51 0.803 -3.225

7
On a risk-adjusted basis, Kuala Lumpur ranked number one followed by
Penang and Selangor. The worst performing state is Perlis. Kuala Lumpur has
the highest return volatility (9.00%) whilst Perlis has the least volatility in return
(1.51%).
The results are expected for the three states as these states are the most
urbanised states in Malaysia and there is always high demand for landed
properties. Being urban centres of population and employment, there is always
high demand for terrace houses in these states. Figure 1 shows the risk-return
diagram of the terrace house sector by states.
(b) Semi-detached Houses (Table 3)
The Semi-Detached House Price Indices represent the capital values of one
storey, one and a half storey and two to three storey semi-detached houses in
each states.
Table 3 : Risk-return analysis of the semi-detached house sector by states in Malaysia (1989 – 2001)
States Average Annual Annual Risk-return Sharpe
returns (%) Risks (%) ratio Ratio K. Lumpur 11.37 17.02 1.497 0.2714 N. Sembilan 6.47 10.09 1.560 -0.0278 Penang 6.57 6.23 0.948 -0.0289 Selangor 6.07 15.39 2.535 -0.0442 Melaka 4.79 7.02 1.466 -0.2792 Terengganu 4.44 6.59 1.484 -0.3505 Pahang 3.40 7.37 2.168 -0.4545 Johor 4.25 5.38 1.266 -0.4647 Sabah 4.14 4.91 1.186 -0.5316 Perak 3.08 3.65 1.185 -1.0055 Kedah 2.23 4.47 2.004 -1.0112
NA - Incomplete house price series for the respective states for the study period.
8
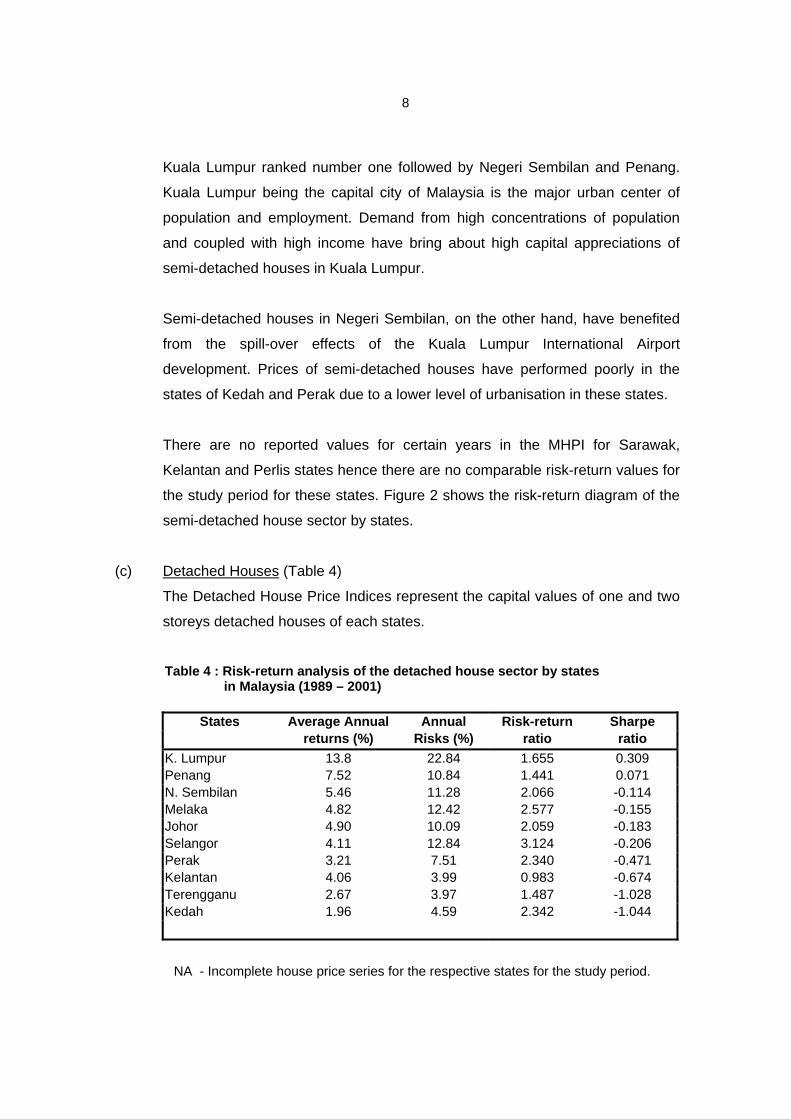
Kuala Lumpur ranked number one followed by Negeri Sembilan and Penang.
Kuala Lumpur being the capital city of Malaysia is the major urban center of
population and employment. Demand from high concentrations of population
and coupled with high income have bring about high capital appreciations of
semi-detached houses in Kuala Lumpur.
Semi-detached houses in Negeri Sembilan, on the other hand, have benefited
from the spill-over effects of the Kuala Lumpur International Airport
development. Prices of semi-detached houses have performed poorly in the
states of Kedah and Perak due to a lower level of urbanisation in these states.
There are no reported values for certain years in the MHPI for Sarawak,
Kelantan and Perlis states hence there are no comparable risk-return values for
the study period for these states. Figure 2 shows the risk-return diagram of the
semi-detached house sector by states.
(c) Detached Houses (Table 4)
The Detached House Price Indices represent the capital values of one and two
storeys detached houses of each states.
Table 4 : Risk-return analysis of the detached house sector by states in Malaysia (1989 – 2001)
States Average Annual Annual Risk-return Sharpe
returns (%) Risks (%) ratio ratio K. Lumpur 13.8 22.84 1.655 0.309 Penang 7.52 10.84 1.441 0.071 N. Sembilan 5.46 11.28 2.066 -0.114 Melaka 4.82 12.42 2.577 -0.155 Johor 4.90 10.09 2.059 -0.183 Selangor 4.11 12.84 3.124 -0.206 Perak 3.21 7.51 2.340 -0.471 Kelantan 4.06 3.99 0.983 -0.674 Terengganu 2.67 3.97 1.487 -1.028 Kedah 1.96 4.59 2.342 -1.044
NA - Incomplete house price series for the respective states for the study period.
9
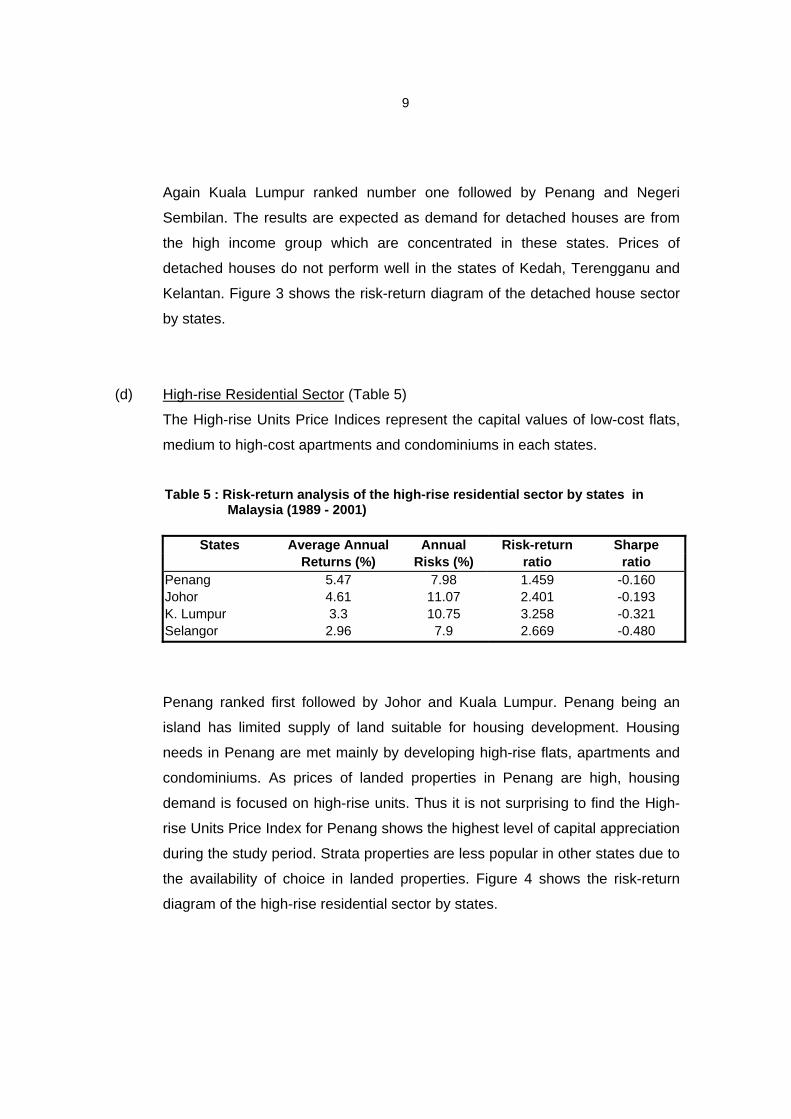
Again Kuala Lumpur ranked number one followed by Penang and Negeri
Sembilan. The results are expected as demand for detached houses are from
the high income group which are concentrated in these states. Prices of
detached houses do not perform well in the states of Kedah, Terengganu and
Kelantan. Figure 3 shows the risk-return diagram of the detached house sector
by states.
(d) High-rise Residential Sector (Table 5)
The High-rise Units Price Indices represent the capital values of low-cost flats,
medium to high-cost apartments and condominiums in each states.
Table 5 : Risk-return analysis of the high-rise residential sector by states in Malaysia (1989 - 2001)
States Average Annual Annual Risk-return Sharpe
Returns (%) Risks (%) ratio ratio Penang 5.47 7.98 1.459 -0.160 Johor 4.61 11.07 2.401 -0.193 K. Lumpur 3.3 10.75 3.258 -0.321 Selangor 2.96 7.9 2.669 -0.480
Penang ranked first followed by Johor and Kuala Lumpur. Penang being an
island has limited supply of land suitable for housing development. Housing
needs in Penang are met mainly by developing high-rise flats, apartments and
condominiums. As prices of landed properties in Penang are high, housing
demand is focused on high-rise units. Thus it is not surprising to find the High-
rise Units Price Index for Penang shows the highest level of capital appreciation
during the study period. Strata properties are less popular in other states due to
the availability of choice in landed properties. Figure 4 shows the risk-return
diagram of the high-rise residential sector by states.
10
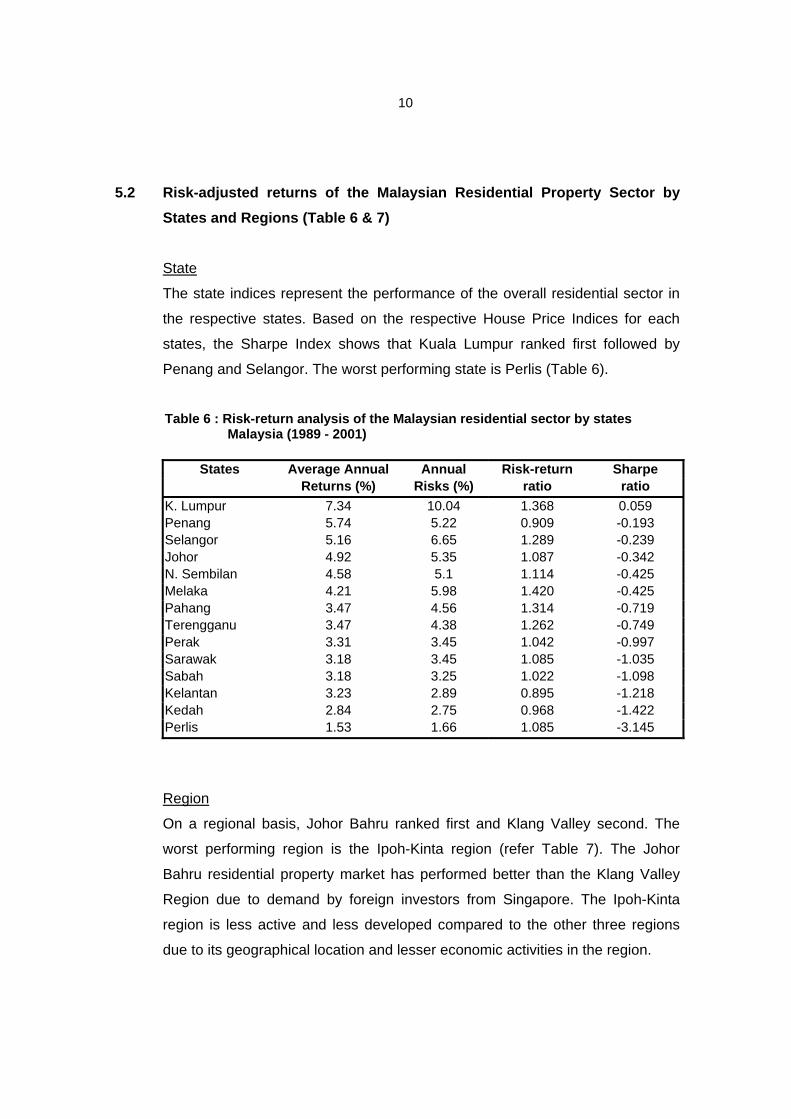
5.2 Risk-adjusted returns of the Malaysian Residential Property Sector by States and Regions (Table 6 & 7)
State
The state indices represent the performance of the overall residential sector in
the respective states. Based on the respective House Price Indices for each
states, the Sharpe Index shows that Kuala Lumpur ranked first followed by
Penang and Selangor. The worst performing state is Perlis (Table 6).
Table 6 : Risk-return analysis of the Malaysian residential sector by states Malaysia (1989 - 2001)
States Average Annual Annual Risk-return Sharpe
Returns (%) Risks (%) ratio ratio K. Lumpur 7.34 10.04 1.368 0.059 Penang 5.74 5.22 0.909 -0.193 Selangor 5.16 6.65 1.289 -0.239 Johor 4.92 5.35 1.087 -0.342 N. Sembilan 4.58 5.1 1.114 -0.425 Melaka 4.21 5.98 1.420 -0.425 Pahang 3.47 4.56 1.314 -0.719 Terengganu 3.47 4.38 1.262 -0.749 Perak 3.31 3.45 1.042 -0.997 Sarawak 3.18 3.45 1.085 -1.035 Sabah 3.18 3.25 1.022 -1.098 Kelantan 3.23 2.89 0.895 -1.218 Kedah 2.84 2.75 0.968 -1.422 Perlis 1.53 1.66 1.085 -3.145
Region
On a regional basis, Johor Bahru ranked first and Klang Valley second. The
worst performing region is the Ipoh-Kinta region (refer Table 7). The Johor
Bahru residential property market has performed better than the Klang Valley
Region due to demand by foreign investors from Singapore. The Ipoh-Kinta
region is less active and less developed compared to the other three regions
due to its geographical location and lesser economic activities in the region.
11
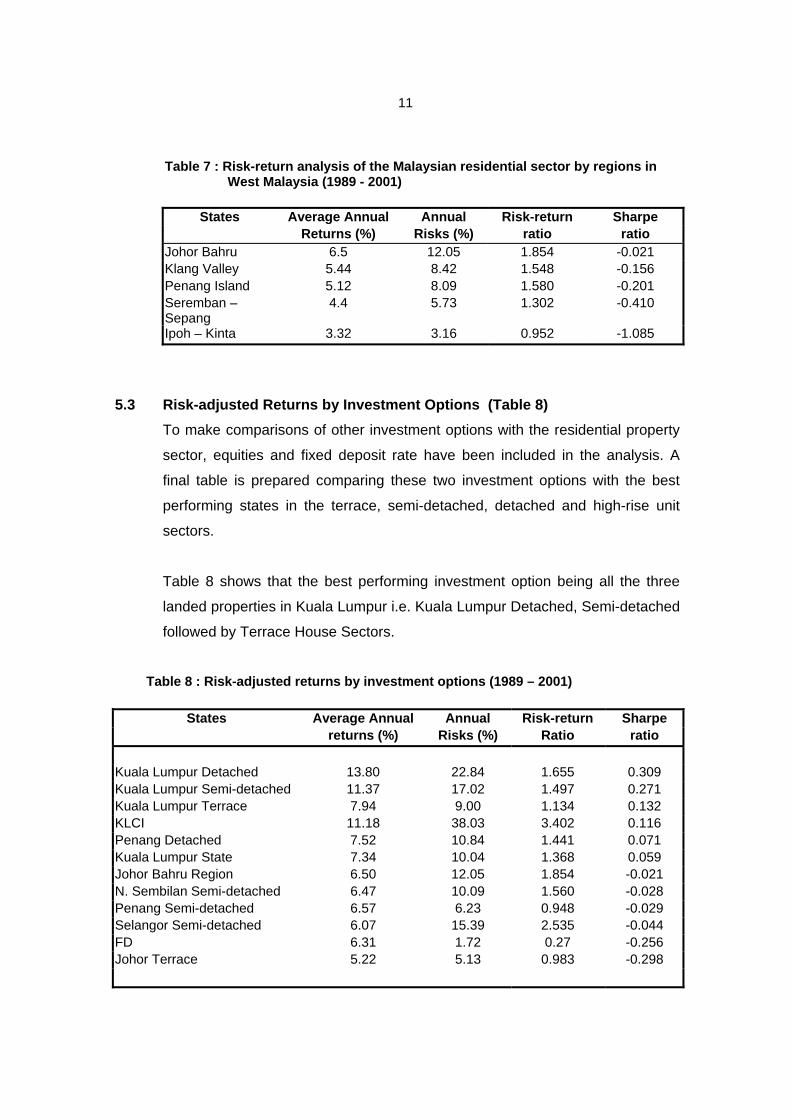
Table 7 : Risk-return analysis of the Malaysian residential sector by regions in West Malaysia (1989 - 2001)
States Average Annual Annual Risk-return Sharpe
Returns (%) Risks (%) ratio ratio Johor Bahru 6.5 12.05 1.854 -0.021 Klang Valley 5.44 8.42 1.548 -0.156 Penang Island 5.12 8.09 1.580 -0.201 Seremban – Sepang
4.4 5.73 1.302 -0.410
Ipoh – Kinta 3.32 3.16 0.952 -1.085
5.3 Risk-adjusted Returns by Investment Options (Table 8) To make comparisons of other investment options with the residential property
sector, equities and fixed deposit rate have been included in the analysis. A
final table is prepared comparing these two investment options with the best
performing states in the terrace, semi-detached, detached and high-rise unit
sectors.
Table 8 shows that the best performing investment option being all the three
landed properties in Kuala Lumpur i.e. Kuala Lumpur Detached, Semi-detached
followed by Terrace House Sectors.
Table 8 : Risk-adjusted returns by investment options (1989 – 2001)
States Average Annual Annual Risk-return Sharpe
returns (%) Risks (%) Ratio ratio Kuala Lumpur Detached 13.80 22.84 1.655 0.309 Kuala Lumpur Semi-detached 11.37 17.02 1.497 0.271 Kuala Lumpur Terrace 7.94 9.00 1.134 0.132 KLCI 11.18 38.03 3.402 0.116 Penang Detached 7.52 10.84 1.441 0.071 Kuala Lumpur State 7.34 10.04 1.368 0.059 Johor Bahru Region 6.50 12.05 1.854 -0.021 N. Sembilan Semi-detached 6.47 10.09 1.560 -0.028 Penang Semi-detached 6.57 6.23 0.948 -0.029 Selangor Semi-detached 6.07 15.39 2.535 -0.044 FD 6.31 1.72 0.27 -0.256 Johor Terrace 5.22 5.13 0.983 -0.298
12
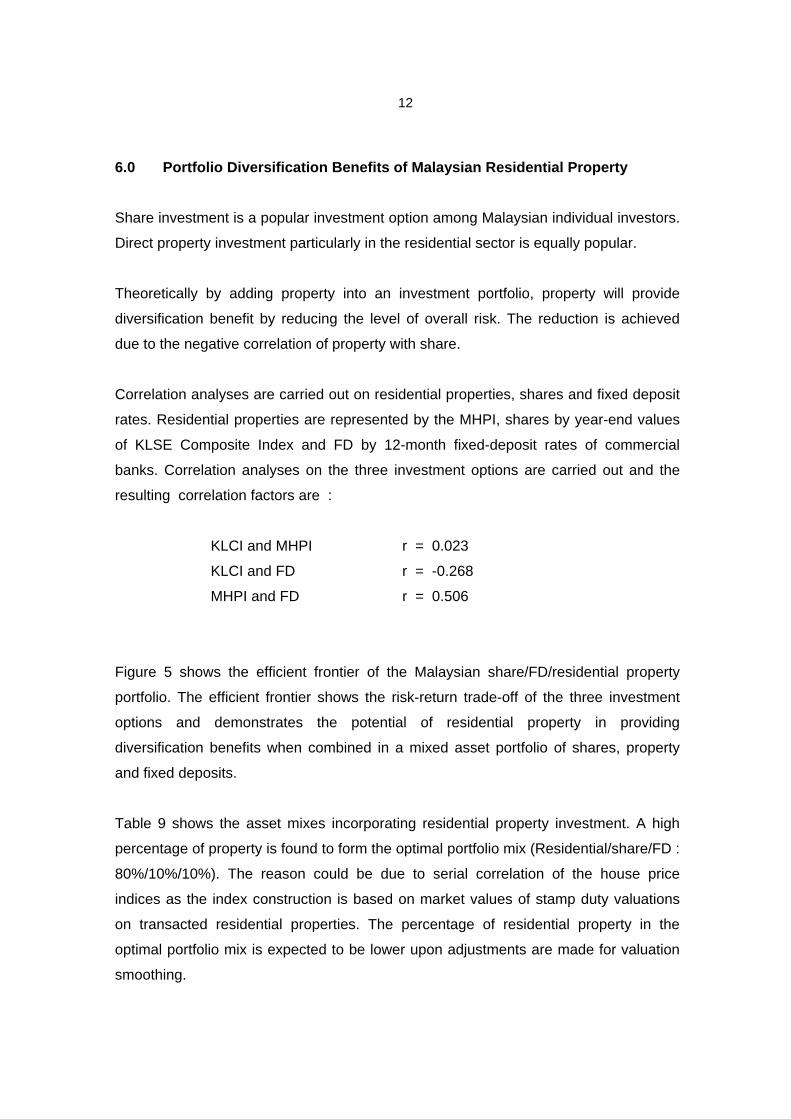
6.0 Portfolio Diversification Benefits of Malaysian Residential Property
Share investment is a popular investment option among Malaysian individual investors.
Direct property investment particularly in the residential sector is equally popular.
Theoretically by adding property into an investment portfolio, property will provide
diversification benefit by reducing the level of overall risk. The reduction is achieved
due to the negative correlation of property with share.
Correlation analyses are carried out on residential properties, shares and fixed deposit
rates. Residential properties are represented by the MHPI, shares by year-end values
of KLSE Composite Index and FD by 12-month fixed-deposit rates of commercial
banks. Correlation analyses on the three investment options are carried out and the
resulting correlation factors are :
KLCI and MHPI r = 0.023
KLCI and FD r = -0.268
MHPI and FD r = 0.506
Figure 5 shows the efficient frontier of the Malaysian share/FD/residential property
portfolio. The efficient frontier shows the risk-return trade-off of the three investment
options and demonstrates the potential of residential property in providing
diversification benefits when combined in a mixed asset portfolio of shares, property
and fixed deposits.
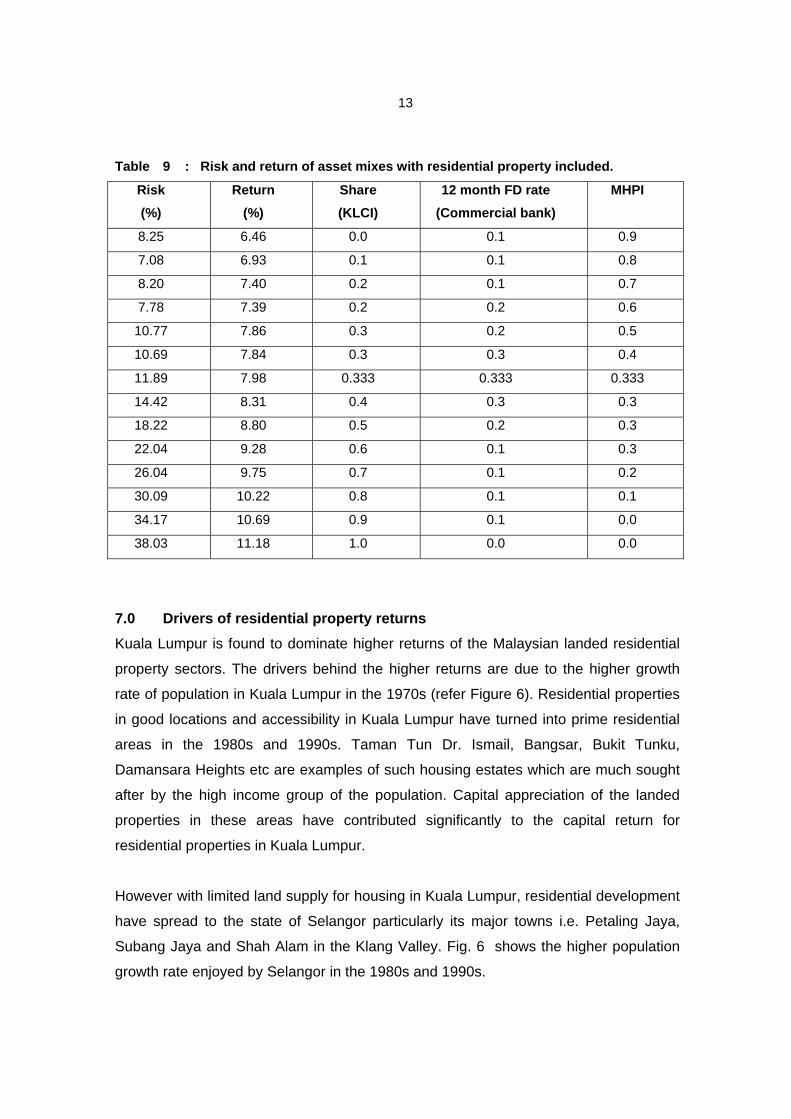
Table 9 shows the asset mixes incorporating residential property investment. A high
percentage of property is found to form the optimal portfolio mix (Residential/share/FD :
80%/10%/10%). The reason could be due to serial correlation of the house price
indices as the index construction is based on market values of stamp duty valuations
on transacted residential properties. The percentage of residential property in the
optimal portfolio mix is expected to be lower upon adjustments are made for valuation
smoothing.
13
Table 9 : Risk and return of asset mixes with residential property included.
Risk (%)
Return (%)
Share (KLCI)
12 month FD rate (Commercial bank)
MHPI
8.25 6.46 0.0 0.1 0.9
7.08 6.93 0.1 0.1 0.8
8.20 7.40 0.2 0.1 0.7
7.78 7.39 0.2 0.2 0.6
10.77 7.86 0.3 0.2 0.5
10.69 7.84 0.3 0.3 0.4
11.89 7.98 0.333 0.333 0.333
14.42 8.31 0.4 0.3 0.3
18.22 8.80 0.5 0.2 0.3
22.04 9.28 0.6 0.1 0.3
26.04 9.75 0.7 0.1 0.2
30.09 10.22 0.8 0.1 0.1
34.17 10.69 0.9 0.1 0.0
38.03 11.18 1.0 0.0 0.0
7.0 Drivers of residential property returns Kuala Lumpur is found to dominate higher returns of the Malaysian landed residential
property sectors. The drivers behind the higher returns are due to the higher growth
rate of population in Kuala Lumpur in the 1970s (refer Figure 6). Residential properties
in good locations and accessibility in Kuala Lumpur have turned into prime residential
areas in the 1980s and 1990s. Taman Tun Dr. Ismail, Bangsar, Bukit Tunku,
Damansara Heights etc are examples of such housing estates which are much sought
after by the high income group of the population. Capital appreciation of the landed
properties in these areas have contributed significantly to the capital return for
residential properties in Kuala Lumpur.
However with limited land supply for housing in Kuala Lumpur, residential development
have spread to the state of Selangor particularly its major towns i.e. Petaling Jaya,
Subang Jaya and Shah Alam in the Klang Valley. Fig. 6 shows the higher population
growth rate enjoyed by Selangor in the 1980s and 1990s.
14
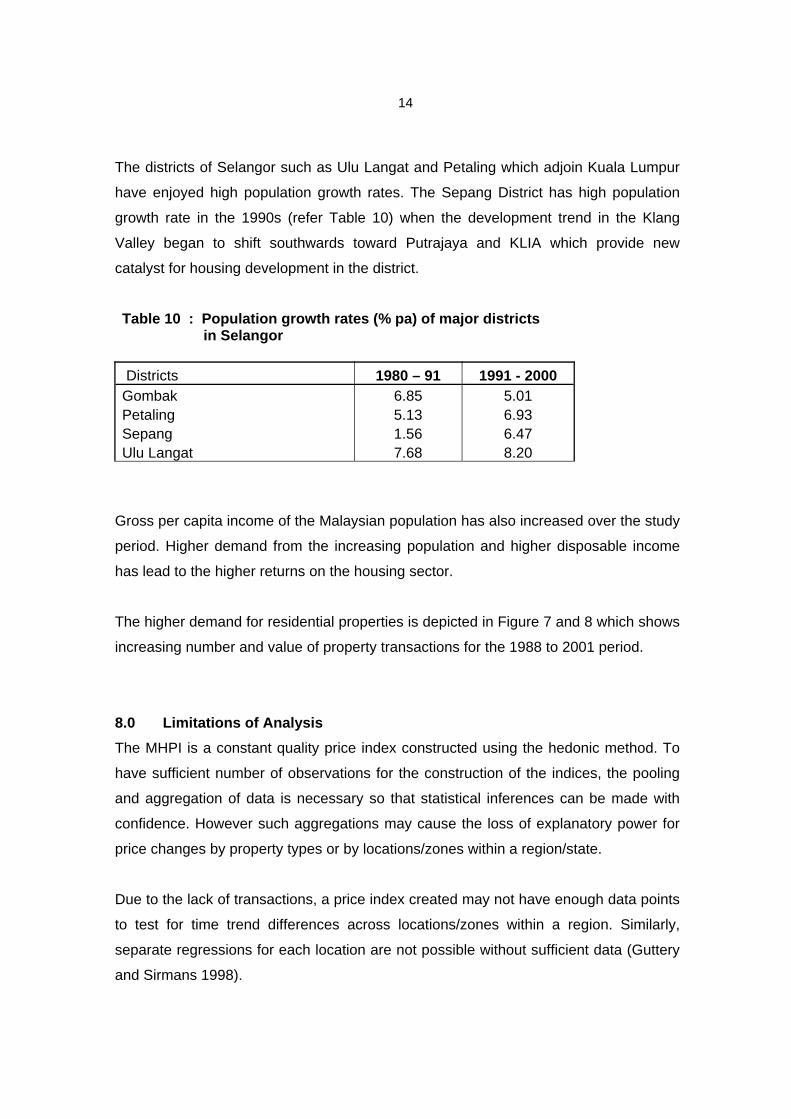
The districts of Selangor such as Ulu Langat and Petaling which adjoin Kuala Lumpur
have enjoyed high population growth rates. The Sepang District has high population
growth rate in the 1990s (refer Table 10) when the development trend in the Klang
Valley began to shift southwards toward Putrajaya and KLIA which provide new
catalyst for housing development in the district.
Table 10 : Population growth rates (% pa) of major districts in Selangor Districts 1980 – 91 1991 - 2000 Gombak 6.85 5.01 Petaling 5.13 6.93 Sepang 1.56 6.47 Ulu Langat 7.68 8.20
Gross per capita income of the Malaysian population has also increased over the study
period. Higher demand from the increasing population and higher disposable income
has lead to the higher returns on the housing sector.
The higher demand for residential properties is depicted in Figure 7 and 8 which shows
increasing number and value of property transactions for the 1988 to 2001 period.
8.0 Limitations of Analysis The MHPI is a constant quality price index constructed using the hedonic method. To
have sufficient number of observations for the construction of the indices, the pooling
and aggregation of data is necessary so that statistical inferences can be made with
confidence. However such aggregations may cause the loss of explanatory power for
price changes by property types or by locations/zones within a region/state.
Due to the lack of transactions, a price index created may not have enough data points
to test for time trend differences across locations/zones within a region. Similarly,
separate regressions for each location are not possible without sufficient data (Guttery
and Sirmans 1998).

15
The lack of transaction data possibly explains why there is no 1997 index values for the
Perlis and Kelantan Semi-detached House Indices and the Pahang, Perlis, Sabah and
Sarawak Detached House Indices.
The regional indices provide an useful indicator on price trends of residential properties
in regional growth centres. The indices could be made more useful if a series of sub-
indices based on property types are produced which could provide further insight on
regional residential price movements. Maps should be used to indicate the boundaries
of the regions.
The study period (1989 - 2001) coincide with a full property cycle, thus the
performance analyses provide insight into the risk-return characteristics of the various
residential property sectors in Malaysia.
It would be ideal to include Government Securities/Bonds into the study. However,
there is a difficulty to establish the Government bond capital returns despite the
existence of a RAM-Quant Shop Malaysian Government Securities Index. The Index is
an accumulation index and the fact that the Malaysian Government Securities are long-
term bonds of varying terms, different years of issue and varying interest rates makes it
a difficulty to establish a new bond capital series that would allow risks and returns to
be analysed and compared.
Currently there is no commercial property indices being developed in Malaysia. The
lack of such property performance measures hampers any analysis that compares the
performance of the residential sector with commercial property sectors. However the
National Property Information Centre (NAPIC) is currently in the process of coming out
with more performance indices.
The analyses of the performance analysis have been constrained by the lack of a
higher frequency Malaysian House Price Index (i.e. semi-annual or quarterly data).
Semi-annual data are available only from the January-June 1997 period. The results of
the analyses could have been biased with a higher volatility on risks and returns due to
the use of annual data.
16
9.0 Conclusions In terms of housing type, the results show that detached houses provide higher capital
appreciation compared to other forms of housing. But the high returns are associated
with high risks. Thus although detached houses provide the highest returns but it has
higher variability in its return. In another words, investors in detached houses may
enjoy higher capital gains during housing booms but they will suffer from higher drop in
their house prices compared to other forms of housing during the recession period.
The best states to invest in residential properties are in Kuala Lumpur, Penang and
Johor. In terms of regions, investors would perform well by investing in Johor Bahru
followed by Klang Valley and Penang Island.
On an inter-asset comparison basis, the best risk-adjusted performance comes from
detached and semi-detached houses in Kuala Lumpur which has outperformed shares
represented by the KLCI.
For individual investors, the better direct residential property performance over shares
clearly identifies the residential property sector as a comparatively attractive
investment option.
In conclusion, Malaysian residential properties in selected states and by types have
perform well and individual investors could enjoy considerable risk reduction by
incorporating residential properties in their investment portfolios.
17
References Bounds, Michael, Wayne Dwyer and Girija Mallik (1999) The Sydney Olympics and Movements in the Price of Residential Property International Real Estate Society Conference 1999 Kuala Lumpur Collett, Alan P (2000) Prospects for investment in the private rented sector Journal of Property Investment & Finance 18 : 4 507 - 516 Crook, A D H, Hughes, J and Kemp, P A (1998) Housing investment trusts and returns from residential lettings Journal of Property Research 15 : 3 229 - 248 Guttery, R. S. and C. F. Sirman (1998) Aggregation Bias in Price Indices for Multi-family Rental Properties Journal of Real Estate Research, 15:3, 309 - 325 Hutchison, Norman E (1994) Housing as an investment? A Comparison of Returns from Housing with Other Types of Investment Journal of Property Finance 5 : 2 47 - 61 Mansfield, J R (1999) Practical difficulties associated with constructing a residential investment portfolio Property Management 17 : 4 321 - 335 Mansfield, J R (2000) Investment potential within the private rented sector Property Management 18 : 1 34 - 45 National Institute of Valuation (1996) “The Malaysian House Price Index : A Technical Summary” Valuation & Property Services Department, Kuala Lumpur National Property Information Centre (1997) Malaysian House Price Indices Oluwaye, Jacob and David Higgins (1998) The Residential Property Price – An Overview The Valuer & Land Economist, May, 174 – 178
C:MHPI/Perform1 2C:PRRES/Brisbane