Embed Size (px)
Citation preview

Investment Process Presentation
Student Managed Fund
Arnone-Lerer Social Responsibility Fund
Undergraduate Students

Business CycleDan UrbanowiczAndrew Kolb

Business Cycle Analysis• Define Stages of the Business Cycle• Identify Current Stage• Identify Industries that Historically
Perform Well• Monitor Economy for Change in Stage

Define Stages of Business Cycle
• 5-Stage Overall Cycle• Stages Last 6-18 Months• Based Upon Various Govt. Economic
Data• All Data Signals Transition; “Not Timing
Market”
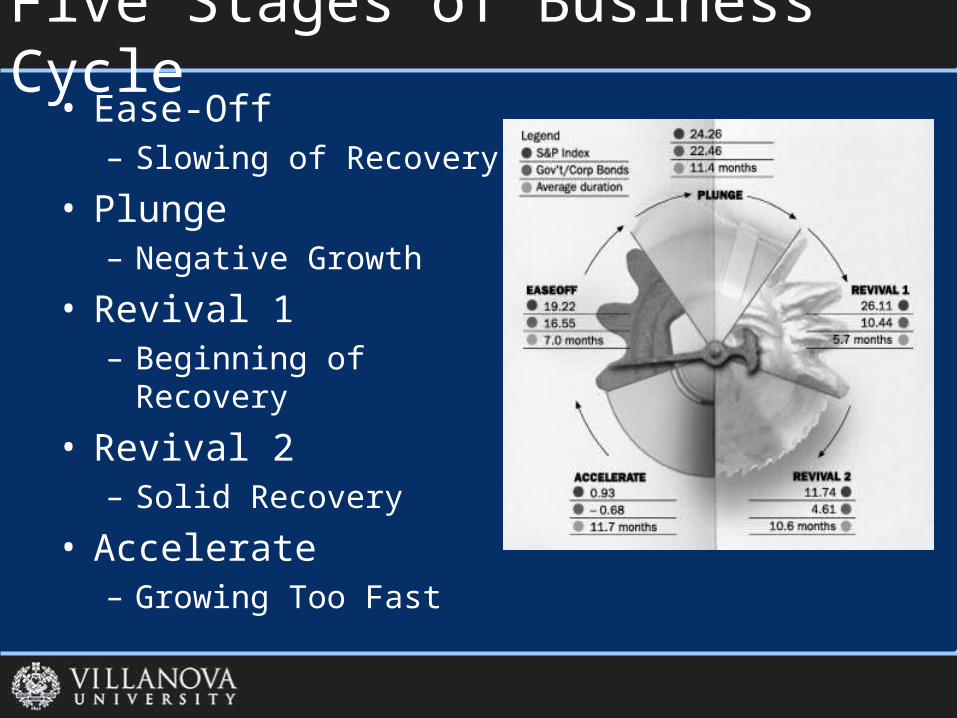
Five Stages of Business Cycle• Ease-Off
– Slowing of Recovery
• Plunge– Negative Growth
• Revival 1– Beginning of Recovery
• Revival 2– Solid Recovery
• Accelerate– Growing Too Fast

Identify Current Stage (Stats.)• Money Supply• Consumer Price Index (CPI)• Producer Price Index (PPI)• Components of GDP• Unemployment Claims• Industrial Production• Non-Farm Payrolls• Weekly Hours Worked• Housing Starts

Where We Are…• Ease-Off: period where Fed is tightening to
control inflationary pressures by slowing growth of economy– Traditional Indicators:
• Industrial Production growth rate declines• Initial Unemployment Claims increase• Non-Farm Payrolls growth rate declines
– Additional Indicators:• Weekly Hours Worked decline• Housing Starts decline• GDP Growth rate declines• PPI & CPI growth increasing slightly• Monetary Base growth rate declines

Ease-Off - Outperformers• Biotechnology• Tobacco• Health Care Equip/
Supp• Pharmaceuticals• Airlines• Food & Staples
Retailing• Software• Commercial Banks
• Health Care Providers
• IT Services• Electric Utilities• Computer &
Peripherals• Aerospace &
Defense• Construction/
Engineer• Gas Utilities

Monitor Economy• Attend Weekly QInsight Conference
Calls• Monitor Govt. Statistics for Change in
Stage– Peak in Federal Funds Rate– Increase in Monetary Base – Bias of Fed from Tightening to Stimulating

Social Responsibility Drew RobinsonKristin DiFabioJen Ziomek

Value & Integrity Superior to Profit
• Assimilation of intellectual and moral perspective in every area of academic study and life
• As a University, continue the rich tradition of Catholic Social Teaching and the guidance it provides
• Consideration for stakeholders and not just stockholders

Why Invest in Soc. Res. Company
• To answer the question of whether social screening carries an inherent financial “cost”
• Avoid investments in companies that we believe are detrimental to society
• Reward companies for being leaders among their peers in the corporate world
• Prove that a comparable return on investments can be achieved

Steps to Investing1.) Evaluated the Catholic Bishop’s
Statement
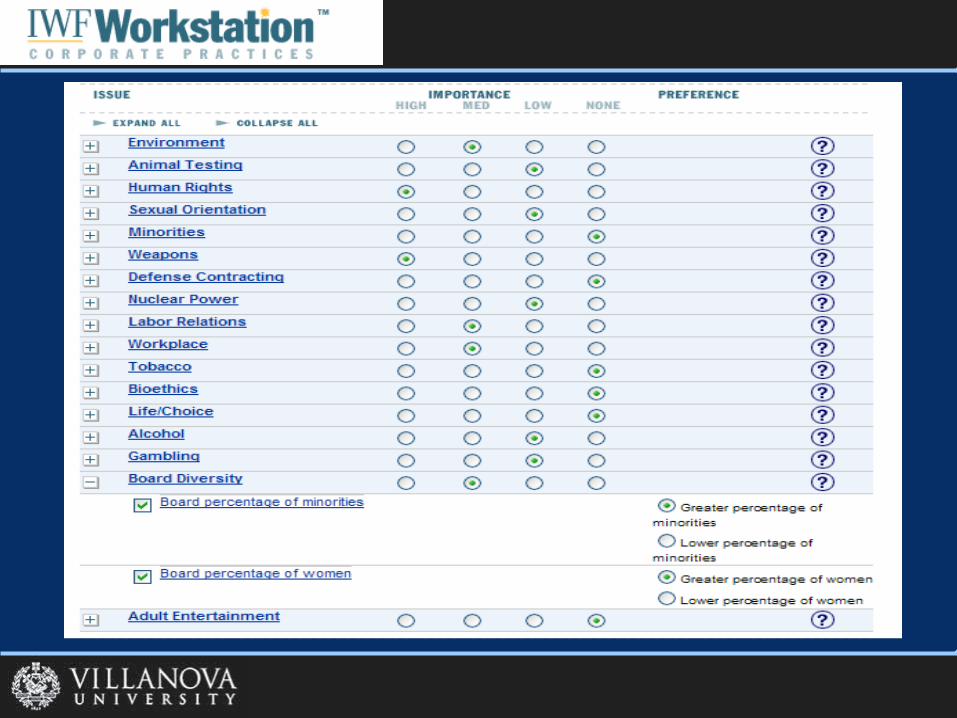
2.) Chose and ranked our criteria based on past
evaluations and our own additions
3.) Ran IWFinancial for Social Responsibility
rankings

Catholics Bishop’s Statement• Comprehensive set of policies
• Faithful, competent and socially responsible stewardship
• Draws the values, directions and criteria from:– Gospel– Universal church teaching– Conference statements

Summary of Rankings
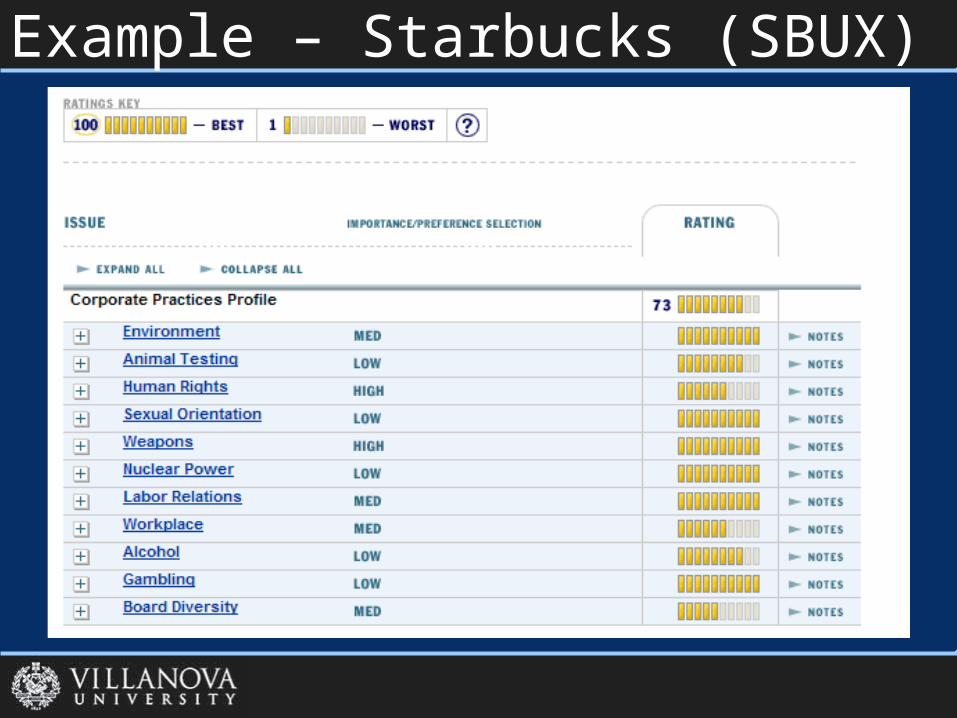
Example – Starbucks (SBUX)

Security AnalysisColin DarrettaDenis Craig

Security Selection• Securities with Strong Fundamentals• Securities with Managed Debt• Securities with Strong Valuation
Characteristics• Two Separate Round of Analysis

Round 1 – Fundamental Analysis
• Input Templates Created• Balance Sheets, Income Statements,
Cash Flow Statements Scoured for Data• The data was then formulated and
output into information that would indicate the fundamental strength or weakness of company

Round 1 – Output Summary
BBB-Bond Rating
0.963119273 Year Average
0.978900999Dec03
0.971151693Dec04
0.939305117J un05
Altman Z-Score
4.81%% Over/Undervalued:
FairValue Assessment:
22.1987315Implied Stock Price:
21.13Current Stock Price:
27.74841438Implied P/E:
26.4125Current P/E:
Price to Earnings
XYZTicker Symbol:
XYZ Corp.Company Name:
5.68Down2.0191.6721.938Times Interest Earned
0.51Down0.3960.4270.384LT Debt/Total Assets
Debt Management Ratios
0.56Up0.7481.0860.947Quick Ratio
0.99Up0.7481.0860.947Current Ratio
Liquidity Ratios
34.96Up24.66%24.52%25.77%Gross Profit Margin
2.8Down2.15%0.94%1.32%Return On Assets
14.07Down7.36%3.39%4.78%Return On Equity
Profitability Ratios
2.76Up3.4253.5923.612Equity Multiplier
0.36Down0.4390.4400.426Total Asset Turnover
8.29Down4.89%2.14%3.11%Net Profit Margin
DuPont Ratios
Industry
3 Yr. TrendDec03Dec04J un05
Analysis SummaryAnalysis Summary

Fundamental Analysis• Securities were eliminated through
Round 1 for various reasons:– P/E ratios that were considerably higher
than industry averages– Low Bond Ratings– DuPont Ratios that demonstrated
weakness• Negative Trends• Significantly below Industry Averages
– Unhealthy Altman Z-Scores• Manufacturing – Below 1.81• Non-Manufacturing – Below 1.10

Round 2 – Security Valuation• The refined pool of securities was then
further examined• Individual valuations were performed
on each of the securities– We were looking for where value was
derived from (operating vs. non-operating)– Present Value of Future Cash-Flows to the
Firm– Book Value of Debt and Preferred Stock– Market Value of Equity – Per Share

Round 2 – Output Summary
Valuation Summary for: XYZ, Corporation
% of Firm's Total Value
Present Value of FCFF in High Growth = 315.1065704 0.014760463
Present Value of Terminal Value of Firm = 21002.65493 0.983822449
Value of Operating Assets of the Firm = 21317.7615 0.998582913
Value of Cash, Marketable Securities, & Non Operating Assets = 30.252 0.001417087
Value of Firm = 21348.0135 1
Book Value of Outstanding Debt = 6.071
Book Value of Preferred Stock = 0
Market Value of Equity = 21341.9425
Market Value of Equity/Share = 1330.04752

Security Valuation• Over-Valued Securities eliminated
based on:– Low Present Values of FCFF– Low Terminal Value of Firm (Discounted to
PV)– Unusual Balance of Firm Value between
operating and non-operating assets
Final Security Selection• The stocks that passed both rounds
were then re-examined in comparison with one another and ranked
• Securities made it into the portfolio process by demonstrating strong fundamentals and relatively undervalued pricing

PSMP Portfolio AnalysisKristin DiFabio
PMSP Software• Portfolio Optimizer • Uses a Lower Partial Moment Heuristic
to determine portfolio allocations• Used industry returns as a basis for
analysis• Began with 50 companies• Used the Nawrocki LPM Heuristic to find
a set of optimal portfolios
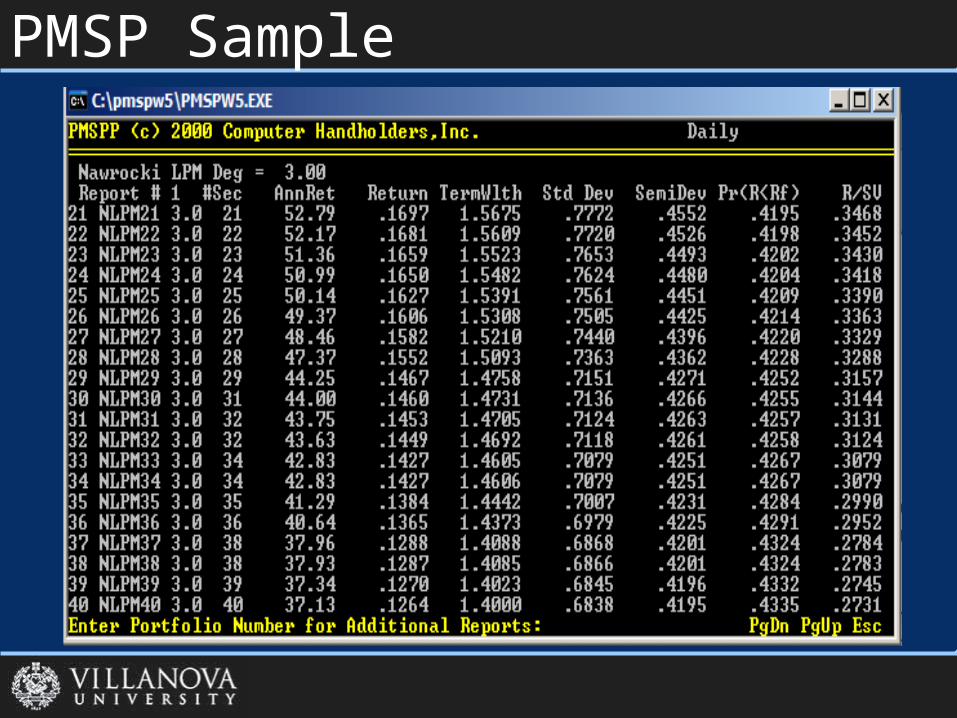
PMSP Sample

PMSP Software (cont.)• Once we selected our optimal portfolio,
we determined which stock’s allocations were out of compliance with our investment guidelines
• We adjusted these allocations through several iterations until coming up with our optimal portfolio

Summary• Investment Value $116,630
– Biotech 10.0%– Construction 5.0%– Finance 18.4%– Healthcare 24.9%– Restaurants 12.5%– Software 12.5%– Utilities 16.7%

PortfolioCompany Ticker
Weight, % Price, $ Shares $
Applera ABI 5.00 24.84 234.76 5,831.50
Invitrogen IVGN 5.00 63.39 91.99 5,831.50
KB Homes KBH 5.00 64.74 90.08 5,831.50
Countrywide CFC 5.00 31.09 187.57 5,831.50
American Express AXP 5.00 49.50 117.81 5,831.50
Bank of America BAC 2.10 43.60 56.18 2,449.23
Sky Financial SKYF 2.10 27.90 87.79 2,449.23
PNC PNC 2.10 59.96 40.85 2,449.23
Mercantile MRBK 2.10 56.10 43.66 2,449.23
Baxter BAX 4.17 37.33 130.28 4,863.47
St. Jude Medical STJ 4.16 48.42 100.20 4,851.81
Medtronic MDT 4.16 55.96 86.70 4,851.81

Portfolio (cont.)Company Ticker
Weight, % Price, $ Shares $
Covance CVD 4.16 47.88 101.33 4,851.81
Pharmaceutical Product Dvlpmt PPDI 4.16 57.10 84.97 4,851.81
Quest Diagnostics DGX 4.16 47.44 102.27 4,851.81
McDonald's Corp MCD 3.66 32.31 132.12 4,268.66
Applebee's International Inc APPB 3.27 22.28 171.18 3,813.80
Starbucks Corp SBUX 3.16 28.20 130.69 3,685.51
Jack In The Box Inc JBX 2.41 29.86 94.13 2,810.78
Adobe ADBE 4.16 32.49 149.33 4,851.81
Microsoft MSFT 4.16 25.85 187.69 4,851.81
Sybase SY 4.16 22.45 216.12 4,851.81
Edison International EIX 4.16 43.56 111.38 4,851.81
Entergy Corp. ETR 4.16 68.37 70.96 4,851.81
Sempra SRE 4.16 43.61 111.25 4,851.81
AGL Resources ATG 4.17 34.67 140.28 4,863.47
Total 100.00 116,630

Technical AnalysisRyan Doyle

Goals• Action on current positions • Enhance entry and exit points• Appropriate profit targets and stop
losses• Find significant technical changes to
current holdings• Document and analyze past
recommendations for accuracy to determine value of technical analysis

Group Structure• 6 analyst monitoring approximately 7-
10 securities each• Spreadsheet includes data such as RSI,
projected profit/loss targets, alerts, and recommended actions
• PowerPoint presentation is designed to propose recommendations to changes in portfolio to be discussed and voted on in class

Methodology• Long term support and resistant trends• RSI analysis to determine if security is
overbought or oversold• Chart moving averages • Project relevant profit targets and stop
losses based on these trends• Recommend action based purely on chart• Report to class any charts of significance
and vote on action after discussing fundamentals

Methodology (cont.)
• Profit Target at 28.5• RSI is still very high while ABI trades at the top
of the channel• Example of recommendation to reduce holdings

Entry and ExitSonic• Recommendation: Buy
Comcast• Recommendation: Sell

Technical Analysis SpreadsheetArnone-Lerer SRI Fund Action
Analyst Company Name Ticker Current Price Avg Cost/Share Shares Gain/Loss RSI Profit Target (E) % Profit Alert Stop Loss (E) % Loss Alert StrategyRecommended Action
Colin Darretta Adobe Systems Inc ADBE 35.56 32.87 145 8% 61.06 40 21.69% Hold 28 -14.82% Hold Hold 1Dennis Craig AGL Resources Inc ATG 34.02 34.99 174 -3% 51 39.83 13.83% Hold 33.45 -4.40% Hold Hold 3James Keller American Express Co AXP 51.26 49.26 116 4% 67.33 53.48 8.57% Hold 47.2 -4.18% Hold Hold 3Dennis Craig Applebees International Inc APPB 22.91 22.4 167 2% 47.45 27.5 22.77% Hold 20 -10.71% Hold Hold 3Ryan Doyle Applera Corp-Applied Biosystems Group ABI 27.48 24.89 114 10% 76.53 28.5 14.50% Hold 24.88 -0.04% Hold Hold 1Kevin Silvestri Bank of America Corp BAC 46.18 45.38 130 2% 71.33 47 3.57% Hold 44 -3.04% Hold Hold 3Ryan Doyle Baxter International BAX 38.82 36.62 130 6% 57.93 44 20.15% Hold 35.5 -3.06% Hold Hold 4Kevin Silvestri Countrywide Financial Corp CFC 34.89 30.65 186 14% 66.41 38 23.98% Hold 34 10.93% Hold Hold 3Ryan Doyle Covance Inc CVD 49.9 48.13 99 4% 45.87 58.9 22.38% Hold 44 -8.58% Hold Hold 4Dennis Craig Dean Foods Co DF 38.84 34.89 57 11% 65.25 41 17.51% Hold 35.25 1.03% Hold Hold 3
Dan Urbanowicz Edison International EIX 46.21 43.57 136 6% 55.80 55 26.23% Hold 40.5 -7.05% Hold Hold 4Colin Darretta Entergy Corp ETR 71.05 68.34 69 4% 47.89 84 22.91% Hold 65 -4.89% Hold Hold 3Ryan Doyle Invitrogen Corp IVGN 66.98 63.54 90 5% 35.36 90 41.64% Hold 55 -13.44% Hold Hold 4

Example of Successful Analysis
Price of SKYF with Sell Recommendation
28.6
28.8
29
29.2
29.4
29.6
29.8
11/21
/200
5
11/23
/200
5
11/25
/200
5
11/27
/200
5
11/29
/200
5
12/1/
2005
12/3/
2005
12/5/
2005
Current Price of SKYF

Summary• Provide technical analysis of all current
holdings and recommended securities• Provide an additional point of view for
class discussion• Provide statistical performance report
on recommendations based on technical analysis

ComplianceChris Auffenberg

George Coleman Fund• 50% International Investment
– Maximum initial investment in one country limited to 25% of total international investment
– Rebalance investment to 25% when it reaches 30%
• 50% Domestic Investment– Maximum initial investment limited per
sector to 20% of total domestic investment– Rebalance investment back to 20% when it
reaches 25%

George Coleman Fund
International InvestmentsISHARES INC MSCIAUSTRIA FUND
ISHARES INC MSCIAUSTRL IDX
ISHARES INC MSCISPAIN IND
ISHARES INC MSCI UKINDEX
ISHARES INC MSCIJAPAN INDX
ISHARES INC MSCISWITZRLND
ISHARES INC MSCIBRAZIL FR
ISHARES INC MSCI SOKOREA

George Coleman Fund
Domestic InvestmentsVANGUARD SECTOR INDEXFUNDS VNGRD CN STP VP
ISHARES TR INDEX FUNDDJUS HLTHCR SCT
ISHARES TR INDEX FUNDDJUS FNL SERVICE CP
SELECT SECTOR SPDR TRENERGY
SELECT SECTOR SPDR TRFINANCIAL
ISHARES TR INDEX FUNDDJUS RLESTT IDX
ISHARES TR INDEX FUNDNSDQ BIOTECH FUND
SELECT SECTOR SPDR TRTECHNOLOGY

Arnone-Lerer SRI Fund• Individual Securities
– Maximum initial investment of 5% of total value
– Rebalancing back to 5% when security reaches 7%
• Industries– Maximum initial investment of 12.5% in
companies in same industry – Rebalancing back to 12.5% when industry
reaches 17.5% of total portfolio value

Arnone-Lerer SRI Fund
Allocation By IndustryRestaurants
Packaged Foods
Healthcare Equipment
Healthcare Providers
Biotechnology
Money Center Banks
Regional Banks
Consumer Finance
Systems Software
Electric Utilities
Gas Utilities
Cash

George Coleman FundGraduate Students

Coleman Domestic ETF Tom Whitley

Ease-Off Outperformers
• Health Care Equip/Supp• Biotechnology• Health Care Dist/Service• Drug Retail• Electric Utilities• Restaurants• Homebuilding• Consumer Finance• System Software
• Food Distributors• Agricultural Products• Broadcasting/Cable TV• Gas Utilities• Banks, Regional, & Div.• Movies & Entertainment• Life/Health Insurance• Computer Hardware• General Merchandise
• Ease-Off industry groups that historically outperform the S&P 500 Index on a risk/return basis:

Industries to Look At• Financial• Real Estate• Energy• Utilities• Materials/Construction• Healthcare/Biotech• Technology• Consumer Staples

Financial Industry• Looking for:
– Commercial Banks: have underperformed investment banks recently, expect trend to change
– Low insurance exposure: because of hurricanes, we want to avoid most insurance
– Diversification among financial industry sectors

Real Estate Industry• Looking for:
– Investment in large, diversified REITS• Office vs. Shopping vs. Residential
– Diversification into other real estate securities

Energy Industry• Looking for:
– Exposure to industry leaders (oil and natural gas)
– Diversification into other aspects of the energy industry (drilling, equipment, etc.)
Utilities Industry• Looking for:
– Investment in large utility companies– Broad exposure to industry

Healthcare/Biotech Industries
• Looking for:– Funds that offer exposure across both
healthcare and biotech companies– Investment in multiple sectors (medical
devices, pharmaceuticals, etc.)

Technology Industry• Looking for:
– Diverse set of companies (hardware, internet, wireless, etc.)
– Funds with little overlap (common in technology ETFs)

Consumer Staples• Looking for:
– Broadly diversified fund that has exposure to multiple sectors where consumers purchase goods

Chosen ETFs• iShares Dow Jones US Financial Services (IYG)• Select Sector SPDR (XLF)
– Large bank exposures (>67%)– Little insurance exposure (with exception of AIG)
• iShares Dow Jones US Real Estate (IYR)– Large, diverse REITS– Invest in both REITS and Real Estate Operating Companies
(REOCs)
• Energy Select Sector SPDR (XLE)– Highly diversified, yet large exposure to industry leaders
(Exxon, Chevron, ConcoPhilips)
• iShares Dow Jones US Utility (IDU)– 50% of holding in 8 to 10 largest utility companies♦ Sold 12/12

Chosen ETFs (cont.)• iShares Dow Jones US Healthcare (IYH)• iShares NASDAQ BioTech Index Fund (IBB)
– Healthcare and Biotech exposure through both ETFs– Investments in devices, pharmaceuticals, therapies, etc.
• Select Sector SPDR – Technology (XLK)• iShares Goldman Sachs Semiconductor (IGW)
– No overlap in top 10 holdings (>50%)– Investments in industry leaders (Microsoft, Intel, Motorola,
etc.)
• Vanguard Consumer Staples VIPERs– Very broad exposure (P&G, Pepsi, Wal-Mart, Kimberly-Clark,
etc.)

Coleman International ETF Celine Nguyen
Matt Ravis

Economic Factors• Real GDP growth trend• Inflation• Currency/Exchange rate trend• Unemployment

Performance• Top 3 Holdings performance• Historic Performance of Fund
– 3 month return– Year to Date return– 1 year return vs. Pacific/Asia ex-Japan (EPP)– 3 year return vs. Pacific/Asia ex-Japan (EPP)– 5 year return vs. Pacific/Asia ex-Japan (EPP)
• Rank in comparison to their regions

MSCI South Korea Index Fund • The iShares MSCI South Korea Index Fund
seeks to provide investment results that correspond generally to the price and yield performance of publicly traded securities in the aggregate in the South Korean market,
as measured by the MSCI Korea Index. •Total Net Assets $819,578,000•Shares Outstanding 22,200,000•Beta 1.25•Price $42.85

Economic Factors• Consistent GDP growth rate• Contained inflation• Unemployment below 4% for past 4
years• Recovered well from Asian Currency
Crisis of 1998• Invested majority in Semiconductors
and Banks

Revival 1
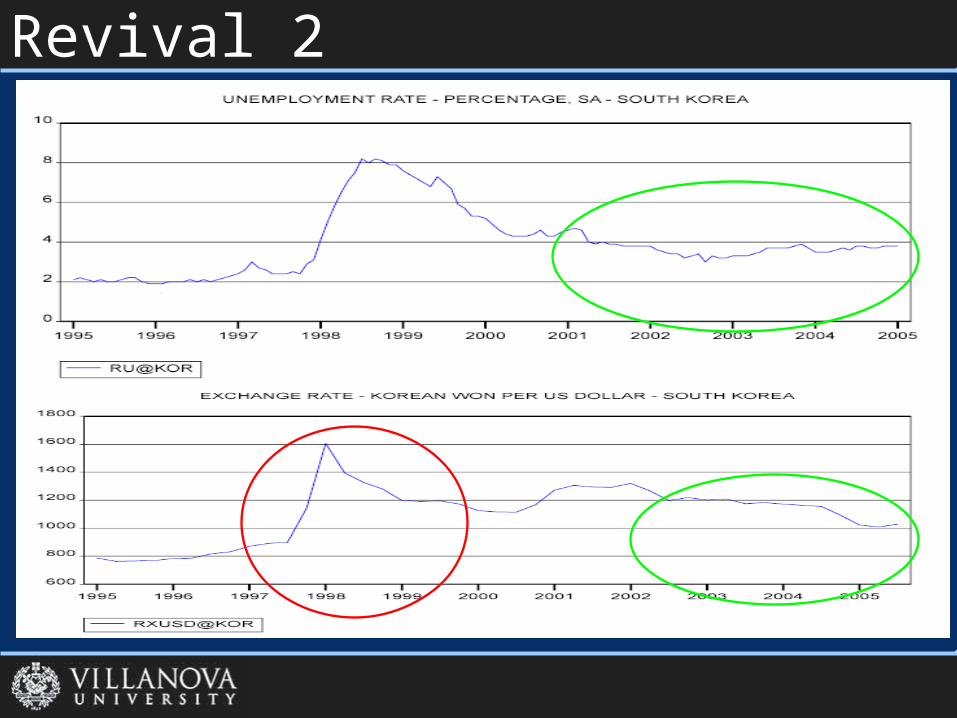
Revival 2

Historic Performance
Return since Jan
1, 2005 to Inception
3 Yr Return
(EPP)* 3 Yr
Return
5 Yr Return
(EPP)*5 Yr
Return
EWY 35.77% 32.34% 16.38% 28.33% 1.89%
*EPP refers to the iShares MSCI Pacific/Asia ex-Japan Index

MSCI South Korea Index Fund

South Korea - Top 3 Holdings

Relative Performance3 Mo Return
YTD Return
1 Yr Return
3 Yr Return
Singapore 4.25% 10.72% 19.29% 24.14%
Index 4.36% 9.69% 17.42% 23.23%
Taiwan (4.67%) (2.92) 9.94% 16.21%
Index (4.13%) (2.12%) 10.91% 17.27%
South Korea 21.38% 34.15% 55.37% 29.66%
Index 21.97% 36.07% 57.84% 32.36%
Malaysia 6.21% 4.11% 11.32% 15.11%
Index 6.48% 4.63% 12.02% 16.23%
S&P/TOP IX 150 Index Fund (ITF)
19.90% 12.09% 26.01% 17.20%
Index 19.16% 13.85% 27.19% 17.67%

Current Holdings• Austria• Australia• Brazil• Japan• Netherlands• Singapore• South Korea• Spain• Switzerland• United Kingdom

Currency Exposure of iSharesRobert Brooks

Currency Exposures• Euro• British Pound• Swiss Franc• Japanese Yen• South Korean Won• Australian Dollar• Brazilian Real
USD = Local Equity Return + Currency ReturnUSD = Local Equity Return + Currency Return

Currency Exposure• iSHARES traded in USD, and invested in
Foreign Equity Markets (some ADRs).
• International ETFs expose US investors to both local equity returns and foreign currency risks.
• Changes in Exchange Rates have a direct impact on fund performance.
• Added diversification beyond pure equity returns.

Impact of Strong or Weak USD•A weakening USD adds to the
returns of an investor– A weaker USD implies a stronger foreign currency,
thus enhancing fund returns
•A strengthening USD subtracts from the returns of an investor– Equity holdings denominated in the foreign
currency are now worth less in USD terms

Expectations for 1st Quarter• Fed will raise rates to 4.5% to 4.75%
– Rates will peak in February or March– Once rates peak the USD may begin to weaken– Would assist plunge returns for domestic market
• European Central Bank already has raised rates– The move by the ECB to raise interest rates will give the Euro a boost
• United States is expected to confront Japan over weakness of the Yen– With pressure from the US to strengthen currency, and– US rates peaking– The Yen should appreciate against the USD

Implications for ETF’s• A Weakening U.S. dollar &
strengthening Euro and Yen will give the international ETFs an added bounce
• The US Dollar hit a two-year high vs the Euro on Nov. 16 at $1.16

Portfolio Style AnalysisWilliam Elder
Portfolio Risk/Return Analysis• In addition to portfolio selection, we
used the Portfolio Management Software Package (PMSP) to measure portfolio returns on a risk adjusted basis.
• To this end, we examined factors such as standard deviation, return-to-variance, return-to-semivariance, and return-to-lower partial moment(s).

Modern Portfolio Theory Statistics• The annual return of the Arnone-Lerer fund has
been commendable compared to the various benchmarks listed here, particularly the Domini Index, and has excelled on a risk-adjusted basis.
• The annual return of the Coleman fund has lagged behind many of the established benchmarks for the fund, but has been positive by all measures on a risk-adjusted basis.
• Please refer to the MPT Statistics handout for detailed information.

Portfolio Style Analysis• As part of our portfolio management process,
it is to the SMF class’ advantage to know the general style composition of our portfolio.
• To this end, a modified Markowitz Optimization program was used to perform Sharpe Style analysis on the portfolio.
• This program is able to look at the returns on various benchmarks and the fund itself to determine our style composition.

Arnone-Lerer Fund Style
• The parfait chart is based on a 250 day (50 week) moving average of the Arnone-Lerer fund’s position
• The pink region represents the large cash position for the summer after stop-loss levels were met.
• The fund operates mainly as Small Cap Value (orange region) and Large Cap Growth (blue region)
Arnone-Lerer Style Analysis Parfait Chart (250 day moving average)
0%
20%
40%
60%
80%
100%
50 51 52 53 54 55 56 57 58 59 60 61 62 63 64 65 66 67 68 69 70 71 72 73 74 75 76 77 78 79 80 81 82 83 84 85 86 87 88 89
Nth Week End Since Initial Investment
30 Day T-Bill
Nikkei
Large ValueRussell
Large GrowthRussell
Small ValueRussell
Small GrowthRussell
MSCI EAFE
MSCI Europe
MSCI Pacific Ex-Japan

George Coleman Fund Style
• The parfait chart is based on a 100 day (20 week) moving average of the G. Coleman fund’s position
• The fund operates mainly as Large Cap Value (blue-gray region) and European (light purple region)
•Recent investments in Japan & Emerging Markets will slowly arise due to moving average component.
George Coleman Style Analysis Parfait Chart (100 day moving average)
0%
20%
40%
60%
80%
100%
20 21 22 23 24 25 26 27 28 29 30 31 32 33 34 35 36 37 38 39 40 41 42 43 44 45
Nth Week End Since Initial Investment
30 Day T-Bill
Nikkei
Large Value Russell
Large GrowthRussell
Small Value Russell
Small GrowthRussell
MSCI EAFE
MSCI EmergingMarkets
MSCI Europe
MSCI Pacific Ex-Japan

Fund PerformanceAdam JamesJohn Strzalka

Financial PerformanceVillanova Student Managed Fund Performance Results:
Composite Performance, March 1, 2004 through December 12, 2005
YearTotal Return
(%)Benchmark Return
(%)*Number of Portfolios
Composite Dispersion
(%)Total Assets at End of Period
Percentage of Assets
Total Assets (%)
3/2004 - 3/2005 7.84 4.83* 1 5.98 $105,950.89 100 100
3/2005 - 12/12/2005 10.92 8.50 2 8.44 $203,433.08 100 100
The Villanova Student Managed Fund (SMF) has prepared and presented this report in compliance with the Global Investment Performance Standards (GIPS)
Notes:1. The Villanova SMF is currently a balanced portfolio, split 75/25 amongst domestic and international equities. The SMF is an investment group affiliated with the Villanova University Endowment.2. The benchmark: 75 percent Standard and Poors 500; 25 percent iShares MSCI EAFE Index Fund (EFA). *The 3/04-3/05 benchmark is based on 100 percent Standard and Poors 500.3. Valuations are computed in USD.4. The dispersion of annual returns is measured by the standard deviation across asset-weighted portfolio returns represented within the Composite for the full year5. Performance results are presented before management and custodial fees but after all trading commissions. 6. This composite was created in March, 2004 and modified in March 2005. No alteration of composites as presented here has occurred because of changes in personnel or other reasons at any other time.7. Past performance is not indicative of future results

Arnone-Lerer Fund
3/05 - 12/12/05 3/04 - 3/05
Gain/Loss $17,382.70 $7,700.89
Initial Investment $105,950.89 $98,250.00
Return 16.41% 7.84%
25.53% Return Since Inception• Key Transactions
– QLogic- loss -$1321.75– Renal Care Group- gain $1254.79– Toro Co- gain $1115.71– UGI Corp- gain $1703.59– Valero Energy- gain $1184.75– Winnebago Industries- gain $1193.65– Western Gas Resources- gain $1440.75

George Coleman Fund 3/05 - 12/12/05
Gain/Loss $4,174.02
Initial Investment $76,942.86
Return 5.42%
•Initial Investments 3/4/05: European, Asian, Mexican, Biotech, Financial, Consumer Goods, Real Estate ETFs
•Fund went unmanaged throughout the summer months, relying on stop-losses.

Questions


![S]TUDENT [N]URSING [O]RGANIZATION](https://img.pdfslide.net/doc/110x75/61a58cc8a996447b9e324b1b/student-nursing-organization.jpg)


