Embed Size (px)
Citation preview

1
INVESTMENT MANAGER REPORT
ResultsQuest for Growth continued its strong start to the year in the second quarter: return on equity, taking into account the capital reduction of 0.40 euros per share paid out on 30 June 2021, was 16% in the first half year. This achievement was due to profits in listed as well as unlisted participations. Net profit in the first half year of 2021 was 24.6 million euros (1.47 euros per ordinary share), compared to a loss of 2.6 million euros (-0.15 euros per ordinary share) during the first half year of 2020.
Quest for Growth’s share price increased by 17.2% during the first six months of 2021. Including the above-mentioned pay out, the performance of the share was approximately 23.5%. The discount of the price in relation to the net asset value decreased to 25.3%, from 28.9% on 31 December 2020.
Market environmentEuropean stock markets rose steadily during the first half of the year. The European stock market index STOXX Europe 600 Net Return rose by 15.2% in the first half of 2021, Small caps (STOXX Europe Small 200 Net Return) yielded an identical return. The increase was broadly based across all sectors. In particular the more cyclical sectors and those focussed on ‘value’, such as the automobile industry, banks and raw materials rose significantly. Defensive sectors such as real estate and insurance rose less strongly in relative terms. Only the utilities sector failed to make any progress.
Investments in listed companiesDespite the sector trends which weren’t very favourable, the portfolio of listed shares achieved a sound result with an estimated performance of about 18%. Pharmagest and the Swiss company Gurit each dropped 17% and were the portfolio’s biggest declines in the first half of the year. Positive highlights were Steico (+86%), Accell (+75%) and CEWE (+43%). Accell profited from the strong growth in the market for bicycles and increased its revenue by 17% last year. Steico, too, saw its sales rise by 10% in the crisis year of 2020, and expects even stronger growth in 2021. CEWE surprised the market with an increase in operating profit of almost 40%, while analysts had expected a stable to lower result.
LPKF, one of the more volatile technology shares in the portfolio, was fully sold in January. Since its purchase in May of last year, the share has risen by approximately 40%, more than twice as much as the increase in the stock market indices during the same period. Partial profit-taking also took place on shares such as Nexus, Pharmagest, Steico and LEM. Melexis was purchased on the basis of price weakness, after the placement of shares by the majority shareholder.
Investments in unlisted companiesQuest for Growth made a new investment of 1.5 million euros in REIN4CED, a company located in Leuven. This is a co-investment with the Capricorn Sustainable Chemistry Fund, a venture capital fund in which Quest for Growth also invests. Quest for Growth also made follow-up investments in NGData and Scaled Access co-investments with Capricorn ICT Arkiv.
Veracyte Inc. and the shareholders of HalioDx, a Quest for Growth portfolio company, have negotiated an agreement for Veracyte to acquire 100% of the shares of HalioDx. On the final completion of the acquisition, Veracyte would have paid around 260 million euros in total to the HalioDx shareholders, subject to customary adjustments. To take into account the risks associated with the necessary approvals, Quest for Growth applies a discount to the acquisition price when calculating the net asset value. As a result of this transaction, the net asset value of Quest for Growth increased by approximately 5.6 million euros or 0.33 euro per share. Further adjustments will be made when the transaction is finalised.
Investments in venture capital fundsThe Capricorn Health-tech Fund made a follow-up investment in Mainstay Medical. In February, Diagenode was acquired by the American Hologic for 130 million euros. Together with other positive trends in Capricorn Health-tech Fund, this had a positive impact on the results of Quest for Growth amounting to more than 1 million euros. As a result of the sale of Diagenode, Capricorn Health-tech Fund made a capital reduction, with Quest for Growth receiving around 1.6 million euros.Capricorn ICT Arkiv made several follow-up investments in current portfolio companies. In April of this year, the milestone payment from Noona Healthcare related to the exit in 2018 was also received.
The Capricorn Sustainable Chemistry Fund made two new investments in the first quarter of 2021: Trillium Renewable Chemicals and REIN4CED. Trillium Renewable Chemicals develops technology to convert renewable raw materials, such as sugar or glycerol, into chemical products that are used to make many well-known consumer and industrial goods. REIN4CED, an innovative Belgian company with a production unit in Leuven, produces impact-resistant, lightweight bicycle frames for brands which, besides top performances, also want to offer their customers more safety and durability.
Black Bear Carbon (“BBC”), the Dutch technology supplier for upcycling rubber from discarded tyres into recovered Carbon Black and renewable petrochemicals, has successfully finalised an initial funding of 7.5 million euros.
Quest for Growth has committed to invest some 7.6 million euros in the Capricorn Fusion China Fund. The fund focuses on investments in companies which establish a link between the European and Chinese markets. The fund is looking for, on the one hand, innovative European companies which see a clear role for the Chinese market in their development (in sourcing, supply, production or commercialization). On the other hand, the fund will also invest in Chinese companies who want to enter the European market. The interim closing increased the fund’s capital from 12,925,000 euros to 30,300,000 euros.
Prospects Equity market valuations remain on the high side, combined with high growth expectations in the short term. After payment of the capital reduction for a total value of 6.7 million euros, a cash amount of approximately 6% of the net asset value remains. The portfolio of unlisted investments will be further expanded, while the strategy which was adjusted several years ago starts to deliver positive results.
EVOLUTION SHARE PRICE AND NET ASSET VALUE
-20%
-10%
0%
10%
20%
30%
40%
50%
60%
VALUATION QUEST FOR GROWTHStock Price Net asset value/share30/06/2021 30/06/2021 31/03/2021 31/12/2020
7.62 EUR 10.20 EUR 9.88 EUR 9.14 EURNumber of shares 16,774,226 16,774,226 16,774,226
Discount of the share price versus Net Asset Value: 25.32% Source: Estimate by Capricorn Partners NV
PERFORMANCE PER SHARE IN QUOTED PORTFOLIO SINCE 31/12/2020
-30-20-100102030405060708090100
STEI
CO S
E
ACCE
LL G
ROU
P
CEW
E ST
IFTU
NG
& C
O K
GAA
PSI S
OFT
WAR
E AG
UM
ICO
RE
WO
LTER
S KL
UW
ER
NEX
US
AG
JEN
SEN
-GRO
UP
NV
B&C
SPEA
KERS
SPA
FRES
ENIU
S SE
& C
O K
GAA
QfG
quo
ted
(e)
NED
AP N
.V.
ROCH
E HO
LDIN
G A
G-G
ENU
SSCH
EIN
STO
XX E
urop
e Sm
all 2
00 N
R
STO
XX E
urop
e 60
0 N
R
SAP
SE
LEM
HO
LDIN
G S
A-RE
G
DATR
ON
AG
MAY
R-M
ELN
HOF
KART
ON
AG
MEL
EXIS
NV
TECH
NO
TRAN
S SE
TKH
GRO
UP
NV-
DUTC
H CE
RT
FIN
ANCI
ERE
DE T
UBI
ZE
KERR
Y G
ROU
P PL
C-A
ABO
WIN
D AG
STRA
TEC
SE
PHAR
MAG
EST
INTE
RACT
IVE
GU
RIT
HOLD
ING
AG-
BR
%
The enclosed information constitutes regulated information as defined in the Royal Decree of 14 November 2007 regarding the duties of issuers of financial instruments which have been admitted for trading on a regulated market
SCHEDULE FOR PUBLICATION:
29 July 2021 / 5.40 PMpress release available at
www.questforgrowth.com
QUEST FOR GROWTH SEMI-ANNUAL REPORT JANUARY – JUNE 2021
PRESS RELEASE / Regulated information

2
Company Sector / MarketNumber of
shares
Changesince
31/12/2020 Currency Share priceValuation
in €
in % ofNet Asset
Value
Software & Services
CEWE STIFTUNG Deutsche Börse (Xetra) 62,251 -7,381 € 130.6000 8,129,981 4.75%
PSI SOFTWARE Deutsche Börse (Xetra) 131,283 -12,500 € 33.6000 4,411,109 2.58%
SAP Deutsche Börse (Xetra) 28,200 2,000 € 118.8400 3,351,288 1.96%
WOLTERS KLUWER Euronext Amsterdam 54,000 0 € 84.7200 4,574,880 2.67%
Technology Hardware
B&C SPEAKERS Borsa Italiana 165,004 0 € 12.0500 1,988,298 1.16%
LEM HOLDING SWX Swiss Exchange 1,796 -425 CHF 1.940.0000 3,173,260 1.85%
NEDAP Euronext Amsterdam 93,148 -8,950 € 58.1000 5,411,899 3.16%
TKH GROUP Euronext Amsterdam 160,070 0 € 42.5400 6,809,378 3.98%
Semiconductors
MELEXIS Euronext Brussels 36,289 6,000 € 87.5500 3,177,102 1.86%
Healthcare Equipment & Services
FRESENIUS Deutsche Börse (Xetra) 86,000 0 € 43.9950 3,783,570 2.21%
NEXUS Deutsche Börse (Xetra) 56,609 -22,155 € 62.8000 3,555,045 2.08%
PHARMAGEST INTERACTIVE Euronext Paris 47,952 -1,000 € 92.9000 4,454,741 2.60%
STRATEC Deutsche Börse (Xetra) 32,495 -1,000 € 117.8000 3,827,911 2.24%
Pharma & Biotech
ROCHE Euronext Brussels 14,500 0 CHF 348.5500 4,602,892 2.69%
TUBIZE Euronext Brussels 61,588 3,000 € 85.3000 5,253,456 3.07%
Electrical & Engineering
ABO WIND Deutsche Börse (Xetra) 105,715 -4,285 € 45.7000 4,831,176 2.82%
ACCELL GROUP Euronext Amsterdam 105,000 20,000 € 45.3000 4,756,500 2.78%
DATRON Deutsche Börse (Xetra) 119,000 0 € 9.9500 1,184,050 0.69%
JENSEN GROUP Euronext Brussels 152,876 0 € 29.6000 4,525,130 2.64%
TECHNOTRANS Deutsche Börse (Xetra) 122,354 -16,392 € 27.3000 3,340,264 1.95%
Materials
GURIT SWX Swiss Exchange 2,031 -300 CHF 2.020.0000 3,736,448 2.18%
KERRY GROUP Euronext Dublin 39,000 6,500 € 117.8000 4,594,200 2.68%
MAYR-MELNHOF KARTON Deutsche Börse (Xetra) 15,000 0 € 179.6000 2,694,000 1.57%
STEICO Deutsche Börse (Xetra) 75,022 -46,470 € 110.6000 8,297,433 4.85%
UMICORE Euronext Brussels 65,000 -15,000 € 51.5000 3,347,500 1.96%
107,811,510 62.99%
Shares quoted companies
Co-investments Capricorn FundsChange since
31/12/2020 Currency Valuation in €in % of
Net Asset Value
C-LECTA Materials € 5,166,929 3.02%
ECLECTICIQ Software & Services € 2,000,000 1.17%
NGDATA Software & Services 234,556 € 1,430,094 0.84%
PROLUPIN Materials € 2,048,544 1.20%
REIN4CED Materials 1,499,997 € 1,499,997 0.88%
SCALED ACCESS Software & Services € 368,699 0.22%
SENSOLUS Software & Services € 690,939 0.40%
13,205,201 7.71%
Company Sector / MarketChange since
31/12/2020 Currency Valuation in €in % of
Net Asset Value
HALIODX Pharma & Biotech € 8,580,344 5.01%
MIRACOR Healthcare Equipment & Services € 2,849,932 1.67%
11,430,277 6.68%
Shares unquoted companies
FINANCIAL ASSETS BREAKDOWN AT 30 JUNE 2021

3
Investments in Venture Funds
Amounts receivable Companies
Change since 31/12/2020 Currency
Last Valuation
Date Valuation in €
in % of Net Asset
Value
CAPRICORN PARTNERS
CAPRICORN CLEANTECH FUND € 30/06/2021 1,510,931 0,88%
CAPRICORN DIGITAL GROWTH FUND € 30/06/2021 3,099,272 1,81%
CAPRICORN FUSION CHINA FUND 1,893,750 € 30/06/2021 1,622,300 0,95%
CAPRICORN HEALTH-TECH FUND -1,650,000 € 30/06/2021 7,078,813 4,14%
CAPRICORN ICT ARKIV € 30/06/2021 5,048,322 2,95%
CAPRICORN SUSTAINABLE CHEMISTRY FUND 2,000,000 € 30/06/2021 8,550,976 5,00%
THIRD PARTY FUNDS
CARLYLE EUROPE TECHNOLOGY PARTNERS II -8,432 € 31/03/2021 65,642 0,04%
LIFE SCIENCES PARTNERS III € 31/03/2021 325,000 0,19%
LIFE SCIENCES PARTNERS IV € 31/03/2021 917,000 0,54%
28,218,256 16,49%
Total Financial Assets - Shares € 160,665,243 93,87%
Change in valuation in unquoted companies and venture funds € 0 0,00%
Total Financial Assets – Shares after depreciation € 160,665,243 93,87%
COMPANYFace value in
currencyChange since 31/12/2020
Last Valuation
Date Valuation in €
in % of Net Asset
Value
LOAN NOTES
SCALED ACCESS 458.000 358.000 € 458,000 0.27%
458,000 0.27%
Total Financial Assets - Amounts receivable € 458,000 0.27%
Total Financial Assets € 161,665,243 94.13%
Cash € 9,462,312 5.53%
Other Net Assets € 578,573 0.34%
Quest for Growth - Ordinary shares € - 0.00%
Total Net Asset Value € 171,164,128 100.00%

4
CHF6.76%
EUR93.22%
USD0.02%
PORTFOLIO DISTRIBUTION BY CURRENCY
Belgium31.3%
Germany33.9%
Netherlands15.4%
United Kingdom0.0%
France8.1%
Ireland2.9%
Switzerland7.1%
Italy1.2%
PORTFOLIO DISTRIBUTION BY COUNTRY
Software & Services14.8%
Technology Hardware
10.2%
Semiconductors1.9%
Health Care Equipment &
Services10.8%
Pharma & Biotech10.8%
Electrical & Engineering
10.9%
Materials18.3%
Funds &
Diversified Companies
16.5%
Cash & other net assets5.9%
PORTFOLIO DISTRIBUTION
BY SECTOR
TOTAL SHAREHOLDERS RETURN (SINCE 30/06/2011)
QUEST FOR GROWTH RESULTS FROM 1 JANUARY 2011 UNTIL 30 JUNE 2021
-20,000,000
-
20,000,000
40,000,000
60,000,000
80,000,000
100,000,000
120,000,000
140,000,000
2010 2011 2012 2013 2014 2015 2016 2017 2018 2019 2020 2021
17.2 %
17.4 %
-12.1 %
34.5 %
7.9 %
-0.3 %
20.3% 12.43%
-18.35%
14.02%
16,09%
16.09%
€ 0
€ 20,000,000
€ 40,000,000
€ 60,000,000
€ 80,000,000
€ 100,000,000
€ 120,000,000
€ 140,000,000
€ 160,000,000
€ 180,000,000
Cash +Other net assets
Quoted portfolio Unquoted portfolio Venture funds Market cap
5.87%
16.45%
14.66%62.99%
PORTFOLIO COMPOSITION AND MARKET CAPITALISATION AT 30 JUNE 2021
Source: Bloomberg
5
ADDED VALUE PER SEGMENT PER SHARE
ADDED VALUE PER SHARE(January – June 2021)
ADDED VALUE PER SECTOR PER SHARE
PROFILEQUEST FOR GROWTH, is a privak/pricaf, a public alternative investment fund (AIF) with fixed capital under Belgian law, managed by Capricorn Partners NV. The diversified portfolio of Quest for Growth is for the most part invested in growth companies listed on European stock exchanges, in European unquoted companies and in venture capital funds. Quest for Growth focuses on innovative companies in areas such as digital technologies (ICT), technologies for the healthca-re sector (Health‐tech) and clean technology (Cleantech). Quest for Growth has been listed on Euronext Brussels since 23 September 1998.
8,00
8,50
9,00
9,50
10,00
10,50
11,00
NAV 3
1/12
/202
0
Tech
nolo
gy H
ardw
are
Phar
ma
& B
iote
ch
Fund
s &
Div
ersi
fied
Com
pani
es
Sof
twar
e &
Ser
vice
s
Elec
tric
al &
Engi
neer
ing
Oth
er s
ecto
rs
Sem
icon
duct
ors
Mat
eria
ls
Hea
lth
Car
eEq
uipm
ent
& S
ervi
ces
Dep
reci
atio
nun
quot
ed c
ompa
nies
and
vent
ure
capi
tal…
Cur
renc
y he
dgin
g
Fina
ncia
l pro
fits
&lo
sses Expe
nses
Cap
ital
dec
reas
e
NAV 3
0/06
/202
1
NAV /
Sha
re
GAINS ANDLOSSESPORTFOLIO HEDGE
8,00
8,50
9,00
9,50
10,00
10,50
11,00
NAV 3
1/12
/202
0
Quo
ted
com
pani
es
Unq
uote
d co
mpa
nies
Fund
s
Not
ass
igne
d
Fina
ncia
l pro
fits
&lo
sses Expe
nses
Cap
ital
dec
reas
e
NAV 3
0/06
/202
1
NAV /
Sha
re

6
SUPPLEMENTARY INFORMATION
Closed-end private equity funds, submitted to the Royal Decree of 10 July 2016 on alternative institutions for collective investment in unquoted and growth companies,are an investment instrument designed to offer individual investors a suitable framework in which to invest in unquoted and growth undertakings.
The privak is under the supervision of the Financial Services and Market Authority (FSMA) and is subject to specific investment rules and obligations as regards the distribution of divide
Investment rules• 25% or more of the portfolio must be invested in unquoted companies;• 70% or more of the portfolio (qualified investments) must be invested in
• unquoted companies;• quoted growth companies with a market capitalisation of less than 1.5
billion euros;• other alternative investment funds with an investment policy similar to that
of the private equity fund.
A private equity fund may not invest more than 20% of its portfolio in a single undertaking.
QUEST FOR GROWTH NVprivak, public alternative investment fund with fixed capital pursuant to Belgian law
Lei 19 box 3 - B-3000 Leuven
Telephone: +32 (0) 16 28 41 28
[email protected] www.questforgrowth.com
Board of directors Mr Antoon De Proft, chairman and independent director
Mr Michel Akkermans, director
Mr René Avonts, director
Mr Philippe de Vicq de Cumptich, director and executive officer
Mr Jos Clijsters, director
Dr Jos B. Peeters, director
Ms Liesbet Peeters, director
Prof. Regine Slagmulder, independent director
Mr Paul Van Dun, independent director
Ms Lieve Verplancke, independent director
Audit committee Prof. Regine Slagmulder, chairman
Mr René Avonts
Mr Paul Van Dun
Ms Lieve Verplancke
Executive officers Mr Philippe de Vicq de Cumptich, director
Mr Yves Vaneerdewegh, member of the Executive Committee of Capricorn Partners
Management company Capricorn Partners NV, Lei 19 box 1, B-3000 Leuven
Statutory auditor Mr Philippe de Vicq de Cumptich, director Mr Yves Vaneerdewegh, member of the Executive Committee of Capricorn Partners
Depository bank BELFIUS BANK BELGIË, Pachecolaan 44, B-1000 Brussels
Incorporation 9 June 1998
Official listing 23 September 1998 on Euronext Brussels
Security number ISIN: BE0003730448
Stock price Bloomberg: QFG BB Equity
Reuters: QUFG,BR
Telekurs: 950524
Company reports published quarterly, the next quarterly report will be published on 28 Octobre 2021
Estimated net asset value published every first Thursday of the month on the website www.questforgrowth.com

CONDENSED INTERIM FINANCIAL STATEMENTS30 JUNE 2021
Statutory auditor’s report on review of condensed interim financial information for the period ended 30 June 2021
IntroductionWe have reviewed the accompanying condensed interim financial information, consisting of the condensed balance sheet of Quest for Growth NV, Privak as of 30 June 2021 and the related condensed statement of profit or loss, the condensed statement of changes in equity, the condensed statement of cash flows for the six-month period then ended, as well as the explanatory notes to the condensed interim financial information (the “Interim Financial Information”). The board of directors is responsible for the preparation and presentation of the Interim Financial Information in accordance with IAS 34, as adopted by the European Union. Our responsibility is to express a conclusion on this Interim Financial Information based on our review.
Scope of review We conducted our review in accordance with International Standard on Review Engagements 2410, “Review of interim financial information performed by the independent auditor of the entity”. A review of interim financial information consists of making inquiries, primarily of persons responsible for financial and accounting matters, and applying analytical and other review procedures. A review is substantially less in scope than an audit
conducted in accordance with International Standards on Auditing and, consequently, does not enable us to obtain assurance that we would become aware of all significant matters that might be identified in an audit. Accordingly, we do not express an audit opinion.
ConclusionBased on our review, nothing has come to our attention that causes us to believe that the Interim Financial Information is not prepared, in all material respects, in accordance with IAS 34 as adopted by the European Union.
Sint-Stevens-Woluwe, 29 July 2021
The statutory auditorPwC Bedrijfsrevisoren BVRepresented by
Gregory JoosPartner
Regine Slagmulder Philippe de Vicq de Cumptich Yves VaneerdeweghDirector – Chairman Director – Effective leader Effective leaderof the Audit Committee
MANAGEMENT RESPONSIBILITY
STATEMENTThe condensed interim financial statements have been prepared in accordance with the International Accounting Standard 34 (“IAS 34”) Interim Financial Reporting, as approved by the European Commission.
The condensed interim financial statements should be read in conjunction with the financial statements for the year ended 31 December 2020 as they provide an update of previously reported information. If necessary, additional information is given in the condensed interim financial statements.
The Board of Directors approved the condensed interim financial statements for issue on 27 July 2021.
The undersigned state that to the best of their knowledge:
a. The condensed interim financial statements give a true and fair view of the financial position, profit or loss, changes in equity and cash flows of Quest for Growth NV, taken as a whole as at and for the six months period ended 30 June 2021; and
b. The interim management report includes a fair review of important events that have occurred during the six-month period ended 30 June 2021, and their impact on the condensed interim financial statements for such period, a description of the principal risks and uncertainties they face and the future prospects.
Leuven, 27 July 2021
LIMITED REVISION
7
SIGNIFICANT EVENTS AND TRANSACTIONS FOR THE 6 MONTHS PERIOD ENDED 30 JUNE 2021
ResultsQuest for Growth continued its strong start to the year in the second quarter: return on equity, taking into account the capital reduction of 0.40 euros per share paid out on 30 June 2021, was 16% in the first half year. This achievement was due to profits in listed as well as unlisted participations. Net profit in the first half year of 2021 was 24.6 million euros (1.47 euros per ordinary share), compared to a loss of 2.6 million euros (-0.15 euros per ordinary share) during the first half year of 2020.
Quest for Growth’s share price increased by 17.2% during the first six months of 2021. Including the above-mentioned pay out, the performance of the share was approximately 23.5%. The discount of the price in relation to the net asset value decreased to 25.3%, from 28.9% on 31 December 2020.
Market environmentEuropean stock markets rose steadily during the first half of the year. The European stock market index STOXX Europe 600 Net Return rose by 15.2% in the first half of 2021, Small caps (STOXX Europe Small 200 Net Return) yielded an identical return. The increase was broadly based across all sectors. In particular the more cyclical sectors and those focussed on ‘value’, such as the automobile industry, banks and raw materials rose significantly. Defensive sectors such as real estate and insurance rose less strongly in relative terms. Only the utilities sector failed to make any progress.
Investments in listed companiesDespite the sector trends which weren’t very favourable, the portfolio of listed shares achieved a sound result with an estimated performance of about 18%. Pharmagest and the Swiss company Gurit each dropped 17% and were the portfolio’s biggest declines in the first half of the year. Positive highlights were Steico (+86%), Accell (+75%) and CEWE (+43%). Accell profited from the strong growth in the market for bicycles and increased its revenue by 17% last year. Steico, too, saw its sales rise by 10% in the crisis year of 2020, and expects even stronger growth in 2021. CEWE surprised the market with an increase in operating profit of almost 40%, while analysts had expected a stable to lower result.
LPKF, one of the more volatile technology shares in the portfolio, was fully sold in January. Since its purchase in May of last year, the share has risen by approximately 40%, more than twice as much as the increase in the stock market indices during the same period. Partial profit-taking also took place on shares such as Nexus, Pharmagest, Steico and LEM. Melexis was purchased on the basis of price weakness, after the placement of shares by the majority shareholder.
Investments in unlisted companiesQuest for Growth made a new investment of 1.5 million euros in REIN4CED, a company located in Leuven. This is a co-investment with the Capricorn Sustainable Chemistry Fund, a venture capital fund in which Quest for Growth also invests. Quest for Growth also made follow-up investments in NGData and Scaled Access co-investments with Capricorn ICT Arkiv.
Veracyte Inc. and the shareholders of HalioDx, a Quest for Growth portfolio company, have negotiated an agreement for Veracyte to acquire 100% of the shares of HalioDx. On the final completion of the acquisition, Veracyte would have paid around 260 million euros in total to the HalioDx shareholders, subject to customary adjustments. To take into account the risks associated with the necessary approvals, Quest for Growth applies a discount to the acquisition price when calculating the net asset value. As a result of this transaction, the net asset value of Quest for Growth increased by approximately 5.6 million euros or 0.33 euro per share. Further adjustments will be made when the transaction is finalised.
Investments in venture capital fundsThe Capricorn Health-tech Fund made a follow-up investment in Mainstay Medical. In February, Diagenode was acquired by the American Hologic for 130 million euros. Together with other positive trends in Capricorn Health-tech Fund, this had a positive impact on the results of Quest for Growth amounting to more than 1 million euros. As a result of the sale of Diagenode, Capricorn Health-tech Fund made a capital reduction, with Quest for Growth receiving around 1.6 million euros.Capricorn ICT Arkiv made several follow-up investments in current portfolio companies. In April of this year, the milestone payment from Noona Healthcare related to the exit in 2018 was also received.
The Capricorn Sustainable Chemistry Fund made two new investments in the first quarter of 2021: Trillium Renewable Chemicals and REIN4CED. Trillium Renewable Chemicals develops technology to convert renewable raw materials, such as sugar or glycerol, into chemical products that are used to make many well-known consumer and industrial goods. REIN4CED, an innovative Belgian company with a production unit in Leuven, produces impact-resistant, lightweight bicycle frames for brands which, besides top performances, also want to offer their customers more safety and durability.
Black Bear Carbon (“BBC”), the Dutch technology supplier for upcycling rubber from discarded tyres into recovered Carbon Black and renewable petrochemicals, has successfully finalised an initial funding of 7.5 million euros.
Quest for Growth has committed to invest some 7.6 million euros in the Capricorn Fusion China Fund. The fund focuses on investments in companies which establish a link between the European and Chinese markets. The fund is looking for, on the one hand, innovative European companies which see a clear role for the Chinese market in their development (in sourcing, supply, production or commercialization). On the other hand, the fund will also invest in Chinese companies who want to enter the European market. The interim closing increased the fund’s capital from 12,925,000 euros to 30,300,000 euros.
Prospects Equity market valuations remain on the high side, combined with high growth expectations in the short term. After payment of the capital reduction for a total value of 6.7 million euros, a cash amount of approximately 6% of the net asset value remains. The portfolio of unlisted investments will be further expanded, while the strategy which was adjusted several years ago starts to deliver positive results.
8

9
BALANCE SHEET
CONDENSED INTERIM FINANCIAL STATEMENTS
In EUR Situation at30 June
202131 December
2020
ASSETS Notes
Cash and cash equivalents 7.g 9,462,312 7,581,758
Short term debt securities 7.f 0 2,699,977
Trade and other receivables 15 198,200 192,002
Dividends receivable 7.f 429,005 328,430
Financial assets
Financial assets at FVTPL – equity securities 6d 160,665,243 142,401,510
Financial assets at FVTPL – debt securities 6d 458,000 100,000
Other current assets 16,298 7,210
Total assets 171,229,057 153,310,887
LIABILITIES AND EQUITY
Share capital 11 138,629,636 145,339,326
Unavailable reserves 7,929,733
Accumulated result 0 -9,154,588
Net result for the period 24,604,759 17,084,320
Total equity attributable to shareholders 171,164,128 153,269,059
Balances due to brokers and other payables 23,101
Current tax payable 12 9 9
Other liabilities 41,821 41,819
Total liabilities 64,931 41,828
Total equity and liabilities 171,229,057 153,310,887

10
CONDENSED STATEMENT OF PROFIT OR LOSS
In EURFor the
period ended30 June
202130 June
2020
Notes
Net realised gains / (losses) on financial assets 9 2,511,558 -2,857,319
Net unrealised gains / (losses) on financial assets 9 22,160,870 806,596
Dividends income 1,323,897 540,755
Interest income 10 -3,489 -2,649
Net realised foreign exchange gain / (loss) -74,445 -31,961
Net unrealised foreign exchange gain / (loss) -19,019 36,170
Total revenues 25,899,372 -1,508,409
Other operating income / (loss) 59,194 13,283
Other operating income / (profit) 0 0
Total operating revenues 25,958,565 -1,495,126
Fee Management Company 13 -712,120 -728,292
Custodian fees -24,331 -18,813
Director’s fees -54,665 -75,955
Levy on investment funds -141,774 -125,971
Other operating expenses -199,486 -63,898
Total operating expenses -1,132,376 -1,012,929
Profit from operating activities 24,826,189 -2,508,054
Net finance expenses -4,602 -1,197
Profit / (Loss) before income taxes 24,821,587 -2,509,251
Withholding tax expenses -216,828 -83,459
Other incomes taxes 0 0
Profit / (Loss) for the period 24,604,759 -2,592,710
Earnings per share
Basic & diluted average number of shares outstanding 12 16,774,226 16,774,226
Basic & diluted EPS for ordinary shares 1.47 -0.15
Basic & diluted EPS for A and B shares 1.47 -0.15

11
CONDENSED INTERIM FINANCIAL STATEMENTS
In EUR Notes Share CapitalUnvailable
reservesRetained
profit/loss Total Equity
Balance at 1 January 2021 11 145,339,326 0 7,929,733 153,269,059
Dividend distribution 12 7,929,733 -7,929,733 0
Capital reduction 11 -6,709,690 -6,709,690
Profit 12 24,604,759 24,604,759
Balance at 30 June 2021 11 145,339,326 7,929,733 24,604,759 171,164,128
Balance at 1 January 2020 145,339,326 -9,154,587 136,184,739
Dividends
Issue of ordinary shares, after deduction of costs of capital increase
Profit -2,592,710 -2,592,710
Balance at 30 June 2020 145,339,326 -11,747,298 133,592,028
CONDENSED STATEMENT OF CHANGES IN EQUITY
In EURFor the
period ended30 June
202130 June
2020
Cash flows from operating activities Notes
Proceeds from sale of Financial Assets - equity securities 16,726,114 30,225,446
Proceeds from sale of Financial Assets – debt securities 2,703,906 3,030,719
Acquisition of Financial Assets - equity securities -10,322,682 -29,082,766
Acquisition of Financial Assets - debt securities -358,000 0
Net receipts / (payments) from derivative activities -73,544 0
Cash movements from receivables 53,996 112,952
Dividends received 1,006,176 400,436
Interests received 10 141 232
Interests paid 10 -3,630 -2,881
Operating expenses paid -1,142,565 -1,023,075
Income taxes paid 0
Net cash from operating activities 8,589,912 3,661,072
Proceeds from capital increase / Benefits capital reduction 11 -6,709,689 0
Dividends paid in cash to holders of preference shares 0 0
Dividends paid in cash to holders of ordinary shares 0 0
Withholding tax on dividends paid to shareholders 0 0
Net cash from financing activities -6,709,689 0
Net increase / (decrease) in cash and cash equivalents 1,880,223 3,661,072
Cash and cash equivalents at the beginning of the year 7,581,758 8,878,626
Effect of exchange rate on cash and cash equivalents 331 -108,949
Cash and cash equivalents at the end of the period 9,462,312 12,430,750
CONDENSED STATEMENT OF CASH FLOWS

12
CONDENSED INTERIM FINANCIAL STATEMENTS
1. Reporting entityQuest for Growth NV PRIVAK (the “Company”) is a public investment company with fixed capital under Belgian law, with registered office at Lei 19, PO Box 3, 3000 Leuven and with company number 0463.541.422.
The AIFM Directive, the AIFM Law and the Royal Decree mainly determine the legal status of the public privak.
The Company is a closed end investment company primarily involved in investing in a highly diversified portfolio of equity securities issued by companies listed on European stock exchanges, unlisted companies and unlisted investment companies, with the objective of providing shareholders with above-average returns over the medium to long term.
The Company is managed by Capricorn Partners (the “Management Company”).
Quest for Growth is listed on Euronext Brussels.
2. Basis of preparationThe condensed interim Financial Statements for the period ended 30 June 2021 have been prepared in accordance with IAS 34 - Interim Financial Reporting,
They do not include all of the information required for a complete set of IFRS financial statements, However, selected explanatory notes are included to explain events and transactions that are significant to an understanding of the changes in the Company’s financial position and performance since the last annual financial statements,
The accounting rules that have been applied and the preparation of the interim financial information are consistent with the rules that were used for the preparation of the financial statements as at 31 December 2020, with the exception of the introduction of new standards and interpretations in force from 1 January. The description can be found under heading 16 - New standards applied and not yet applied.
They were authorised for issue by the company’s board of directors on 27 July 2021.
3. Foreign currenciesThe financial statements are presented in euros, which is the company’s functional currency.
Following exchange rates were used for translation into euros:
30 June 2021
31 December 2020
30 June 2020
31 December 2019
USD 1.1884 1.2271 1.1198 1.1234
GBP 0.85805 0.89903 0.91243 0.8508
CHF 1.0980 1.0802 1.0651 1.0854
NOK 10.1717 10.4703 10.912 9.8638
SEK 10.1110 10.0343 10.4948 10.4468
4. Use of judgements and estimatesIn preparing these financial statements, management has made judgements, estimates and assumptions that affect the application of accounting policies and reported amounts of assets, liabilities, income and expenses.
The actual results may differ from these estimates.
a. Judgements
Qualification as an investment entityIFRS 10 lays down a compulsory exemption for companies that meet the definition of an investment entity from having to measure both its subsidiaries and its interests in associates and joint ventures at fair value with accounting of changes in value through profit or loss. An investment entity is defined as an entity that: (1) obtains funds from one or more investors for the purpose of providing
those investor(s) with investment management services;(2) commits to its investor(s) that its business purpose is to invest funds
solely for returns from capital appreciation, investment income, or both, and
(3) measures and evaluates the performance of substantially all of its investments on a fair value basis.
In assessing whether it fulfils this definition, an entity must look into whether it possesses the following typical features for an investment entity:
(1) it has more than one investment; (2) it has more than one investor; (3) it has investors that are not related parties of the entity; and (4) it has ownership interests in the form of equity or similar interests. Quest for Growth possesses both the essential and the typical features and meets therefore the definition of an investment entity. Quest for Growth is a public investment company with close-ended capital for investment in unlisted companies and growth companies (called a “PRIVAK” (Dutch) or “PRICAF” (French)), regulated by the AIFM Directive, the AIFM Act and the public PRIVAKs/PRICAFs legislation (Royal Decree of 10 July 2016). The Issuer’s diversified portfolio comprises for the most part investments in growth undertakings listed at stock exchanges, unlisted companies and venture capital funds. Quest for Growth is listed on Euronext Brussels and has a diversified range of shareholders. Quest for Growth’s objects are collective investment in permitted financial instruments issued by unlisted companies and growth companies in order to thereby realise capital gains that are paid in the form of dividends to its shareholders. Quest for Growth measures all holdings at fair value with changes in value accounted through the income statement.
b. Estimates and assumptionsManagement makes estimates and assumptions concerning the future. The resulting accounting estimates will, by definition, seldom equal the related actual results. The estimates and assumptions that have a significant risk of causing a material adjustment are outlined below. Estimates and underlying assumptions are reviewed on an ongoing basis. Revisions to estimates are recognized prospectively.
NOTES TO THE CONDENSED INTERIM FINANCIAL STATEMENTS

13
Fair value of derivative financial instrumentsThe Company may, from time to time, hold financial derivative instruments that are not quoted in active markets, such as over-the-counter derivatives. Fair values of such instruments are determined by using valuation techniques. Valuation techniques (for example, models) used to determine fair values, are validated and periodically reviewed.
Fair value of private equity portfolioThe private equity portfolio includes direct investments through equity, investment related investment loans and investments in other funds managed by the management company or in third party funds. These investments are stated at fair value on a case-by-case basis.
Fair value is estimated in compliance with the International Private Equity and Venture Capital Association (IPEV) Guidelines. These guidelines include valuation methods and techniques generally recognised as standard within the industry. The Company primarily uses price of recent transaction, earnings multiples and scenario analysis to estimate the fair value of an investment.
Although management uses its best judgement in estimation the fair value of investments, there are inherent limitations to every valuation methodology. Changes in assumptions could affect the reported fair value of financial instruments.
Valuation models use observable data, to the extent practicable. The determination of what constitutes “observable” requires significant judgement by the Company. The Company considers observable data to be market data that are readily available, regularly distributed or updated, reliable and verifiable and provided by independent sources that are actively involved in the relevant market.
5. Financial risk management
Quest for Growth is exposed to a number of financial risks. The company’s major risk factors during the last six months of the financial year do not diverge from those described on pages 96 to 100 of the annual report and the financial statements for the 2020 financial year.
However, these are not the only risks that the Company may be exposed to. Other risks that Quest for Growth may run can also have a negative impact on the Company’s activities.
Quest for Growth is a fixed capital investment company and, unlike variable capital investment funds, does not have to buy back shares.No liquidity problems can arise in the short term.
Quest for Growth does invest in listed shares with limited liquidity and has entered into commitments with regard to a number of venture capital funds and non-listed companies. These investment commitments must be fully paid in, in accordance with the investments made by the companies duringthe investment period and thereafter. Quest for Growth has no authority or decision-making rights on this.
The table below provides an overview of the outstanding commitments on 30 June 2021 and 31 December 2020.
CurrencyCommitment in €
30/06/2021Commitment in €
31/12/2020
Capricorn Digital Growth Fund € 11,250,000 11,250,000
Capricorn Fusion China Fund € 5,681,250 0
Capricorn Health-tech Company € 1,800,000 1,800,000
Capricorn ICT ARKIV € 2,046,925 2,046,925
Capricorn Sustainable Chemistry Fund € 11,000,000 13,000,000
Carlyle Europe Technology Partners II € 653,148 653,148
NGDATA € 0 102,056
Sensolus € 75,414 75,414
Total 32,506,737 28,927,543

14
6. Fair value of financial instruments
a. Valuation modelsFair value is the price that would be received to sell an asset or that would be paid to transfer a liability in an orderly transaction between market participants at a measurement date.
Financial assets and liabilities measured at fair value
The fair value of financial assets and liabilities traded in active markets (such as listed securities and publicly traded derivatives) are based on quoted market prices at the close of trading at the measurement date. An active market is a market in which transactions for the asset or liability take place with sufficient frequency and volume to provide pricing information on an ongoing basis. The Company uses the close price for both financial assets and financial liabilities, If a significant movement in fair value occurs subsequent to the close of trading at the end of the reporting date, valuation techniques will be applied to determine the fair value.
The fair value of financial assets and liabilities that are not traded in an active market are determined by using valuation techniques. The Company may use internally developed models, which are based on valuation methods and techniques generally recognised as standard within the industry (IPEV). Valuation models are used primarily to value unlisted equity, debt securities and other debt instruments for which markets were or have been inactive during the financial year. Some of the inputs to these models may not be market observable and are therefore estimated based on assumptions.
Valuation techniques used include the use of comparable recent arm’s length transactions, reference to other instruments that are substantially the same, option-pricing models and other valuation techniques commonly used by market participants making the maximum use of market inputs and relying as little as possible on entity-specific inputs.
The output of a model is always an estimate or approximation of a value that cannot be determined with certainty, and valuation techniques employed may not fully reflect all factors relevant to the positions the Company holds. Valuations are therefore adjusted, where appropriate, to allow for additional factors including model risk, liquidity risk and counterparty risk.
Other financial assets and liabilities
The carrying value less impairment provision of other financial assets and liabilities are assumed to approximate their fair values.
b. Fair value hierarchyThe company recognises transfers between levels of the fair value hierarchy as at the beginning of the reporting period.
The fair value hierarchy has the following levels:
Level 1 inputs are quoted prices (unadjusted) in active markets for identical assets or liabilities that the entity can access at the measurement date;
Level 2 inputs are inputs other than quoted prices included within Level 1 that are observable for the asset or liability, either directly or indirectly; and
Level 3 inputs that are unobservable, This category includes all instruments for which the valuation techniques includes inputs not based on observable data and whose unobservable inputs have significant effect on the instruments’ valuation.
The level in the fair value hierarchy within which the fair value measurement is categorised in its entirety is determined on the basis of the lowest level input that is significant to the fair value measurement in its entirety. For this purpose, the significance of an input is assessed against the fair value measurement in its entirety. If a fair value measurement uses observable inputs that require significant adjustment based on unobservable inputs, that measurement is a Level 3 measurement. Assessing the significance of a particular input to the fair value measurement in its entirety requires judgement, considering factors specific to the asset or liability.
The determination of what constitutes ‘observable’ requires significant judgement by the company. The Company considers observable data to be that market data that is readily available regularly distributed or updated, reliable and verifiable, not proprietary, and provided by independent sources that are actively involved in the relevant market.
Investments whose values are based on quoted market prices in active markets, and are therefore classified within Level 1, include active listed equities and exchange traded derivatives. The company does not adjust the quoted price for these instruments.
Financial instruments that trade in markets that are not considered to be active but are valued based on quoted market prices, dealer quotations or alternative pricing sources supported by observable inputs are classified within Level 2. These include listed equities and over-the-counter derivatives. As Level 2 investments include positions that are not traded in active markets and/or are subject to transfer restrictions, valuations may be adjusted to reflect illiquidity and/or non-transferability, which are generally based on available market information.
Investments classified within Level 3 have significant unobservable inputs, as they trade infrequently. Level 3 instruments include private equity and corporate debt securities. As observable prices are not available for these securities, the Company has used valuation techniques to derive the fair value.

15
c. Valuation FrameworkThe company has established a control framework for the measurement of fair values. The management company that is responsible for developing the company’s valuation processes and procedures oversees the valuation process. The management company reports to board of directors of the company.
The valuations and calculations are carried out by the management company at a frequency, which is appropriate to the specific character of the company. In practise, the management company reassesses the valuations of the non-quoted investments of the company at least once every quarter. The valuation could be reassessed in between valuation dates in case material events occur in the underlying investment.
The valuation is the responsibility of the valuation expert and the executive committee of the management company. The valuation role is functionally independent from the portfolio management activities and the valuation expert, though present in the team meetings is not a member of the investment committees. Other measures ensure that conflicts of interest are mitigated and that undue influence upon the employees is prevented. The valuation shall be performed with all due skill, care and diligence. The valuation expert has an experience in auditing or determining the valuation of financial instruments.
For the valuation of the unquoted investments, the valuation expert receives input of the dedicated investment managers on the fundamentals and the
prospects of the non-quoted investments. He/she attends the meetings of the investment teams. Valuation proposals can be discussed in the respective investment team meetings of the funds. The main responsibility of the valuation expert is to make sure that all valuations are done in accordance with the valuation rules of the company and that the assumptions at the basis of the valuation are sufficiently documented. He/she will also make sure that all factors that could be relevant in determining the value of the unquoted investments are taken into account in the assessment.
The valuation proposals are discussed at a quarterly valuation meeting that takes place close to the end of each quarter. Are present in this quarterly valuation meeting: the valuation expert, the members of the executive committee of Capricorn Partners and all Capricorn investment managers overseeing active non-quoted investments of the company. In the valuation meeting, the proposed valuations of an investment manager are discussed with all members present and the valuations may be amended to obtain a final valuation proposal.
The final valuation proposals are submitted for approval to the executive committee of Capricorn Partners. The ultimate responsibility for the approval of the valuations resides legally and contractually with the board of Quest for Growth. Changes in valuation rules will be submitted to and need approval of the board of directors.
d. Fair value hierarchy – Financial instruments measured at fair valueThe following table analyses financial instruments measured at fair value at the reporting date by the level in fair value hierarchy into which the fair value measurement is categorised. The amounts are based on the values recognised in the statement of financial position.
30 June 2021 Level 1 Level 1 Level 3 Total
Financial assets at fair value through profit or loss
Equity securities, listed 107,811,510 0 0 107,811,510
Debt securities 0 0 458,000 458,000
Equity securities, unlisted 0 0 25,093,477 25,093,477
Venture Funds 0 0 28,128,256 28,128,733
Total 107,811,510 0 53,311,733 161,123,244
Derivative financial instruments
Listed equity index options 0 0 0 0
Foreign currency forward contracts 0 0 19,601 19,601
Total 0 0 19,601 19,601
31 December 2020 Level 1 Level 1 Level 3 Total
Financial assets at fair value through profit or loss
Equity securities, listed 101,758,264 0 0 101,758,264
Debt securities 0 0 100,000 100,000
Equity securities, unlisted 0 0 15,546,277 15,546,277
Venture Funds 0 0 25,096,969 25,096,969
Total 101,758,264 0 40,743,246 142,501,510
Derivative financial instruments
Listed equity index options 0 0 0 0
Foreign currency forward contracts 0 0 0 0
Total 0 0 0 0
16
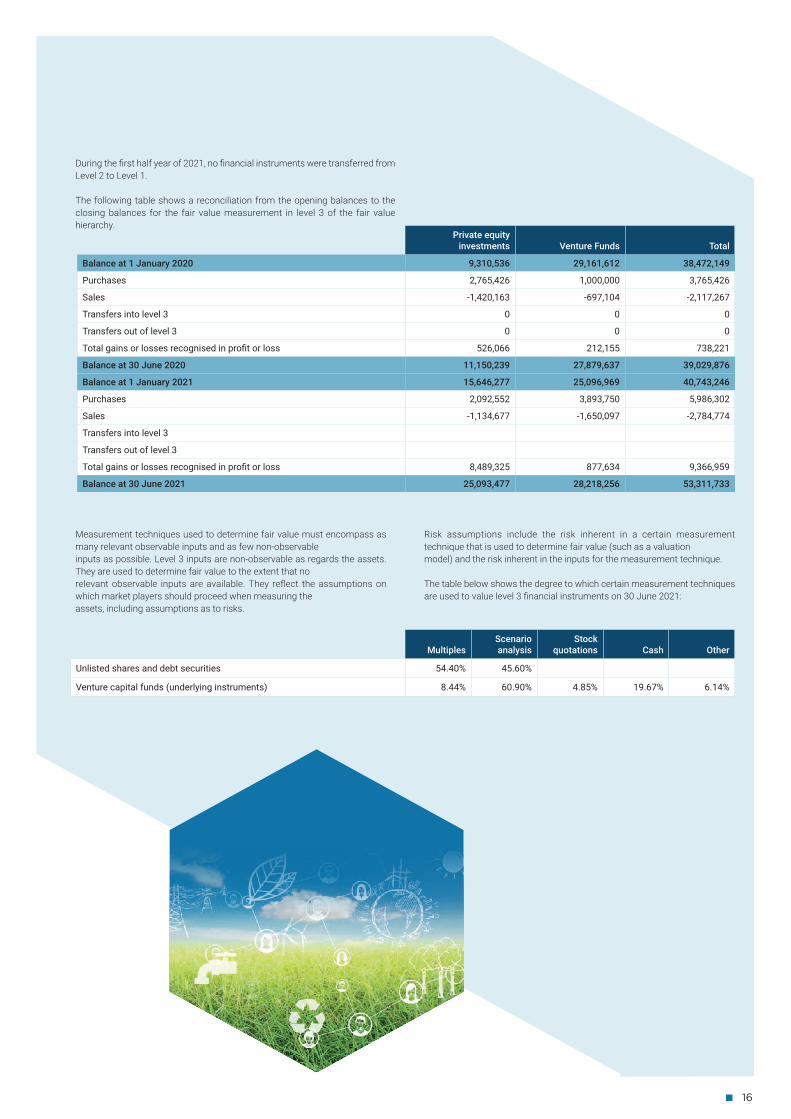
Measurement techniques used to determine fair value must encompass as many relevant observable inputs and as few non-observableinputs as possible. Level 3 inputs are non-observable as regards the assets. They are used to determine fair value to the extent that norelevant observable inputs are available. They reflect the assumptions on which market players should proceed when measuring theassets, including assumptions as to risks.
Risk assumptions include the risk inherent in a certain measurement technique that is used to determine fair value (such as a valuationmodel) and the risk inherent in the inputs for the measurement technique.
The table below shows the degree to which certain measurement techniques are used to value level 3 financial instruments on 30 June 2021:
During the first half year of 2021, no financial instruments were transferred from Level 2 to Level 1.
The following table shows a reconciliation from the opening balances to the closing balances for the fair value measurement in level 3 of the fair value hierarchy.
Private equity investments Venture Funds Total
Balance at 1 January 2020 9,310,536 29,161,612 38,472,149
Purchases 2,765,426 1,000,000 3,765,426
Sales -1,420,163 -697,104 -2,117,267
Transfers into level 3 0 0 0
Transfers out of level 3 0 0 0
Total gains or losses recognised in profit or loss 526,066 212,155 738,221
Balance at 30 June 2020 11,150,239 27,879,637 39,029,876
Balance at 1 January 2021 15,646,277 25,096,969 40,743,246
Purchases 2,092,552 3,893,750 5,986,302
Sales -1,134,677 -1,650,097 -2,784,774
Transfers into level 3
Transfers out of level 3
Total gains or losses recognised in profit or loss 8,489,325 877,634 9,366,959
Balance at 30 June 2021 25,093,477 28,218,256 53,311,733
MultiplesScenario analysis
Stock quotations Cash Other
Unlisted shares and debt securities 54.40% 45.60%
Venture capital funds (underlying instruments) 8.44% 60.90% 4.85% 19.67% 6.14%

17
e. Sensitivity analysis of financial instruments at fair value through profit and loss
The valuation of investments in non-quoted equity securities and venture capital funds depends on a number of market related factors.
The following market-related factors may be applied to the measurement methods.
MultiplesThe multiples used are preferably equity/earnings (company value/turnover) for companies with a sustainable turnover flow and equity/EBITDA (company value/profit for financial burdens, taxes and depreciation/amortisation) for companies with a sustainable EBITDA flow. The valuation is done on the basis of the most recent available information over 12 months, for instance the figures for the last four quarters or the figures for the last financial year.
The multiple is determined based on the median for comparable companies (“peer group”). The peer group is composed based on criteria such as: similar activities or industry, size, geographical spread. The peer group preferably encompasses a minimum of three and a maximum of ten companies. FactSet is used as the source of these data.
The market-based multiple of the peer group of quoted companies is corrected with differences between the peer group and the company to be valued (“discount” or “premium”). In this regard, account is taken of the difference in liquidity of the valued shares to be valued compared to that of quoted shares. Other grounds for correcting multiples might be: size, growth, diversity, nature of activities, differences between markets, competitive positioning, services performed by the company, recent transactions selling or financing comparable companies, exceptional or non-recurring expected decline in results, etc. Not applying premiums would have a negative impact of EUR 607,840 on the valuations as at 30 June 2021.
Scenario analysisIn applying the probability-weighted model, account is taken of industry-specific information and available studies.
For the valuation of investments in unlisted shares in the venture capital funds managed by Capricorn, as at 30 June 2021, 23 participations were valued on the basis of scenario analysis and 3 participations were valued using the multiple method. Additionally, for the valuation of Quest for Growth’s direct investments in unlisted companies, 7 participations were valued on the basis of scenario analysis and 4 participations were valued using the multiples method.
If the parameters in a scenario analysis undergo a 10% change, this means an increase (or decrease) in the value of the venture capital funds by an amount of 1,718,537 euros. For Quest for Growth’s direct investments in unlisted companies with a scenario analysis this would mean an increase (or decrease) of 1,713,371 euros.
If the peer group multiple were to increase or decrease by 1 in the individual participations of the venture capital funds valued on the basis of multiples, this would result in a total increase of 1,135,631 euros or decrease of 1,132,613 euros. For Quest for Growth’s direct investments in unlisted companies valued on the basis of multiples, an increase (or decrease) of the multiple of 1 in the individual participations would represent a total increase (or decrease) of 896,649 euros.
The quoted share portfolio is to a significant extent sensitive to fluctuations on the stock markets. The portfolio’s betas, which measure the portfolio’s sensitivity relative to the market, is 1.05 over 3 years. The betas have been calculated with Factset for the quoted share portfolio excluding cash against the STOXX Europe 600 index as at 30 June 2021. Taking account of these betas, calculated on the basis of historical data for the portfolio, a rise or fall of 10.5% can be expected upon a rise or fall of 10% in the STOXX Europe 600 index. Changes in the portfolio’s composition and changes in the volatility of shares in the portfolio or of the market can give rise to fluctuations beyond the above range.
The graph below provides an overview of the betas of the listed shares in the portfolio over 3 years:
0,00%
0,50%
1,00%
1,50%
2,00%
2,50%
1,20
%
0,97
%
0,93
%
0,95
%
0,54
% 0,77
%
0,56
%
1,38
%
0,92
%
0,53
%
0,65
%
1,07
%
0,87
% 1,04
%
1,16
%
1,45
%
1,38
%
2,00
%
1,59
%
1,31
%
0,67
%
0,53
%
1,86
%
1,14
%
BETA

7. Operating segments
The Company has three reportable segments: Investments in quoted companies, investments in unquoted companies and investments in venture capital funds. Segment information is prepared on the same basis as that is used for the preparation of the Fund’s financial statements
The different segments are described on page 108 of the annual report and the financial statements for the 2020 financial year.
The table below gives an overview of the assets per segment:
Notes30 June
202130 December
2020
Investments in quoted companies 107,811,510 101,758,264
Investments in unquoted companies 25,093,477 15,646,277
Investments in venture funds venture 28,218,256 25,096,969
TOTAL 161,123,243 142,501,510
CONDENSED INTERIM STATEMENT OF PROFIT OR LOSS
PER SEGMENT
Notes30 June
202130 December
2020
In EUR Notes
Net realised gains / (losses) on financial assets 3,622,447 -6,844,739
Net unrealised gains / (losses) on financial assets 14,236,485 455,209
Dividends income 1,323,897 540,755
Segment revenue from investments in quoted companies 19,182,829 -5,848,775
Net realised gains / (losses) on financial assets -1,119,224 3,030,480
Net unrealised gains / (losses) on financial assets 7,046,751 139,232
Dividends income 0 0
Segment revenue from investments in unquoted companies 5,927,527 3,169,712
Net realised gains / (losses) on financial assets 8,335 956,940
Net unrealised gains / (losses) on financial assets 877,634 212,155
Dividends income 0 0
Segment revenue from investments in venture funds 885,969 1,169,095
Interest income -3,489 -2,649
Net realised foreign exchange gain / (loss) -74,445 -31,961
Net unrealised foreign exchange gain / (loss) -19,019 36,170
Total revenues from investments -1,508,409
Other operating income / (loss) 59,194 13,283
Total operating revenues 25,958,565 -1,495,126
Total operating expenses -1,132,376 -1,012,929
Profit from operating activities 24,826,289 -2,508,054
Net finance expense -4,602 -1,197
Profit / (Loss) before income taxes 24,821,587 -2,509,251
Withholding tax expenses -216,828 -83,459
Other incomes taxes 0 0
Profit / (Loss) for the period 24,604,759 -2,592,710
18

30 June 2021 30 June 2020
Ordinary shares
Class A shares
Class B shares
Ordinary shares
Class A shares
Class B shares
Basic and diluted average number of shares outstanding 16,773,226 750 250 16,773,226 750 250
Profit / (loss): 24,603,292 1,100 367 -2,592,555 -116 -39
Profit / (loss) basic and diluted earn-ings per share: 1,47 1,47 1,47 -0,15 -0,15 -0,15
(*) average weighted number of shares outstanding for the period
The holders of the different share classes have different rights in the event of dividend distribution and liquidation of the company (see point 12 below)
8. Earnings per share
9. Net gain from financial instruments at fair value through profit and loss
The realised gain from financial instruments at fair value through profit or loss represents the difference between the carrying amount of a financial instrument at the beginning of the reporting period, or the transaction price if it was purchased in the current period, and its sale or settlement price.
The unrealised gain represents the difference between the carrying amount of a financial instrument at the beginning of the period, or the transaction price if it was purchased in the current reporting period, and its carrying amount at the end of the period.
30 June 2021 30 June 2020
Net gain (loss) from financial instruments designated as at fair value through profit and loss
Shares 24,668,498 -2,050,723
Debt securities 3,930 0
Derivative financial instruments -93,144 0
24,579,283 2,050,723
Net gain (loss) from financial instruments designated as at fair value through profit and loss
Realised 2,438,014 -2,857,319
Unrealised 22,141,269 806,594
24,579,283 2,050,723
19

20
11. Equity / capital reduction
30 June 2021
31 December 2020
Authorised, issued an fully paid
Ordinary shares 16,773,226 16,773,226
Class A shares 750 750
Class B shares 250 250
Share capital 139,749,0291 € 146,458,719
Cost of capital increase € 1,119,393 € 1,119,393
Share capital after deduction costs capital increase 138,629,636 € 145,339,326
1 Statutory
The Extraordinary General Meeting of Quest for Growth held on 14 April 2021, resolved to distribute EUR 6,709,690.40 to the shareholders in the form of a capital reduction. As a result, capital will be reduced from EUR 146,458,719.56 to EUR 139,749,029.16, without the cancellation of shares.
Considering that no withholding tax is owed, the dividend will amount to EUR 0.40 per share, gross or net. This corresponds to 6.15% of the share price on 31 December 2020 or 5.39% of the closing share price on 13 April 2021.
The dividend distribution took place on the following dates:
Ex-coupon date1 28 June 2021
DRegistration date (record date)2 29 June 2021
Payment (value date) 30 June 20211 Date from which trading on the stock exchange occurs without entitlement to the forthcoming distribution2 Date on which the positions are closed in order to identify the shareholders with rights
10. Interest income (loss)
30 June 2021 30 June 2020
Interest income on financial instruments not measured at fair value
Short term debt securities 140 230
Cash and cash equivalents -3,629 -2,881

21
12. Dividend
GeneralQuest for Growth is structured as privak, a public alternative undertaking for collective investment with fixed capital, and is subject to specific investment rules. Section 35 of the Royal Decree of 10 July 2016 provides that privaks/pricafs must pay out at least 80% of the net earnings for the year, less amounts corresponding to net reductions in the investment institution’s liabilities during the year. However, Quest for Growth’s articles of association provide that the company must distribute at least 90% of its income after deduction of pay, commissions and expenses.
The General Assembly decides, on the proposal of the Board of Directors, on the use of the balance, taking into account the statutory provisions on profit distribution. For example, the articles of association provide that the holders of the shares A and the shares B receive a preference dividend. This preference dividend is paid for the part exceeding the net profit1 that is necessary to paythe shareholders an amount that is equal to the nominal amount of 6% on an annual basis, calculated on the basis of the equity as expressed on the balance sheet after deduction of the dividend paid in the course of the financial year, and if necessary to be increased by an amount equal to the amount the company would have missed out on due to deductions for profit sharing paid in the same year by funds managed by Capricorn Partners NV in which it is a shareholder.
Twenty percent (20%) of the excess amount will be paid to the holders of A and B shares as a preference dividend. The remaining eighty percent (80%) will be divided equally among all shareholders.
In the event of a capital increase in the course of the year, the newly contributed capital will be taken into account for the calculation on a pro rata temporis basis.
SpecificDespite a positive result of 16,741,026 euros in the financial year 2019, no dividend could be paid to the shareholders because the company still had a loss carried forward of 9,154,587 euros after the result was recognised.
An amount of 9,154,587 euros was used of the profit for the financial year 2020 to clear the losses carried forward. In accordance with the provisions on profit appropriation, as set out in the Royal Decree of 10 July 2016 on the alternative institutions for collective investment in unlisted companies and growth businesses (“Privak KB”), the balance of 7,929,733 euros had to be included in an unavailable reserve. After all, the Privak RD provides as follows: “The positive balance of the fluctuations in the fair value of the assets shall be recognised in an unavailable reserve.”
13.
As compensation for the shareholders, the board of directors proposed to convene an extraordinary general meeting to decide on the payment of 6,709,690.40 euros or 0.40 euros gross per share in the form of a capital reduction. (see point 11 above).
The profit for the first half of 2021 amounts to 24,604,759 euros, of which 22,141,269 euros are net unrealised gain/(losses) on financial instruments. On 30 June 2021, the balance of unrealised gains/(losses) amounted to 28,881,508 euros.
In accordance with the provisions of Article 35 of the Royal Decree of 10 July 2016, an unavailable reserve must be created up to the amount of any positive balance of the changes in the fair value of the assets and the profit cannot / may not (provisionally) be paid out. If the unrealised gains on financial instruments were to be realised before the year-end, based on the figures of the first half year, a dividend of 21,522,488 euros could be paid to holders of ordinary shares ((153,269,059*6%*16,773,226/16,774,2 26) + 80%*15,408,616 *16,773,226/16,774,226). The holders of preference shares will then receive 3,083,006 euros ((153,269,059*6%*1,000/16,774,226) + 80%*15,408,616*1,000/16,774,226 + 20%*15,408,616).
Related parties and key contacts
Parties are considered to be related if one party has the ability to control the other party or exercise significant influence over the other party in making financial or operational decisions.
(a) Management feeThe Company is managed by Capricorn Partners (the ‘Management Company’), an alternative investment fund manager incorporated in Belgium.
Under the terms of the new management agreement dated 1 April 2017, whereby the Company appointed Capricorn Partners as Management Company to manage Quest for Growth, the management company’s fee is set at 1% of the Company’s share capital, increased by a flat-rate reimbursement for research costs. In 2020, that management agreement has been adjusted and the fixed fee for research costs will no longer be charged. The fee in 2020 amounted to 1,464,587 euros per year.
The total management fee received by Capricorn Partners for services rendered for the six-month period ended 30 June 2021 was € 712,120. For the same period ended 30 June 2020 the total management fee paid was € 728,292.
14. Subsequent events
The board of directors has no knowledge of events occurring after the balancesheet date that might have an effect on the result for the half year.
1 Net profit is defined as the dividend for the financial year.
22
15. Compulsory disclosures under the Royal Decree of 10 July 2016 on alternative funds for collective investment in unlisted companies and growth undertakings
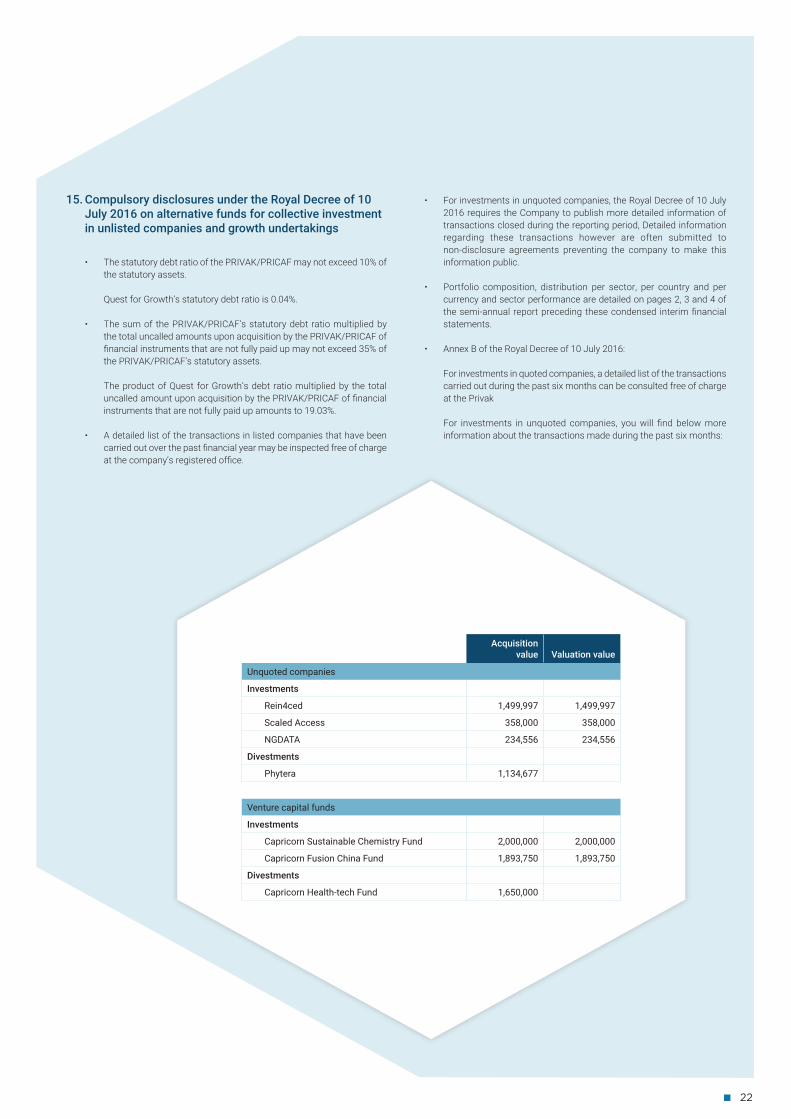
• The statutory debt ratio of the PRIVAK/PRICAF may not exceed 10% of the statutory assets.
Quest for Growth’s statutory debt ratio is 0.04%.
• The sum of the PRIVAK/PRICAF’s statutory debt ratio multiplied by the total uncalled amounts upon acquisition by the PRIVAK/PRICAF of financial instruments that are not fully paid up may not exceed 35% of the PRIVAK/PRICAF’s statutory assets.
The product of Quest for Growth’s debt ratio multiplied by the total uncalled amount upon acquisition by the PRIVAK/PRICAF of financial instruments that are not fully paid up amounts to 19.03%.
• A detailed list of the transactions in listed companies that have been carried out over the past financial year may be inspected free of charge at the company’s registered office.
• For investments in unquoted companies, the Royal Decree of 10 July 2016 requires the Company to publish more detailed information of transactions closed during the reporting period, Detailed information regarding these transactions however are often submitted to non-disclosure agreements preventing the company to make this information public.
• Portfolio composition, distribution per sector, per country and per currency and sector performance are detailed on pages 2, 3 and 4 of the semi-annual report preceding these condensed interim financial statements.
• Annex B of the Royal Decree of 10 July 2016:
For investments in quoted companies, a detailed list of the transactions carried out during the past six months can be consulted free of charge at the Privak
For investments in unquoted companies, you will find below more information about the transactions made during the past six months:
Acquisition value Valuation value
Unquoted companies
Investments
Rein4ced 1,499,997 1,499,997
Scaled Access 358,000 358,000
NGDATA 234,556 234,556
Divestments
Phytera 1,134,677
Venture capital funds
Investments
Capricorn Sustainable Chemistry Fund 2,000,000 2,000,000
Capricorn Fusion China Fund 1,893,750 1,893,750
Divestments
Capricorn Health-tech Fund 1,650,000

23
16. New standards applied and not yet applied
The accounting rules applied for the condensed interim financial statements are consistent with those used in the preparation of the financial statements for the year ending 31 December 2020, with the exception of the adoption of new standards and interpretations effective as of 1 January 2021 .
The following amendments to existing standards will apply for the first time from 2021:
• IFRS 9, IAS 39 and IFRS 7, IFRS 4 and IFRS 16 – Amendments - fase 2 - interest rate benchmark reform
• Amendments to IFRS 16 Leases: Rental concessions related to COVID-19 (applicable for financial years from 1 June 2020)
These amendments have no effect on the results, reporting or financial statements of Quest for Growth:
The following standards and amendments to standards have been published but are not yet mandatory for the first time for the financial year beginning 1 January 2021 and have been endorsed by the EU:
• Amendment to IFRS 4 Insurance contracts – postponement of IFRS 9 (applicable for financial years from 1 January 2023)
The following standards and amendments to standards have been published but are not yet mandatory for the first time for the financial year beginning 1 January 2021 and have not yet been endorsed by the EU:
• Annual improvements 2018–2020 (applicable for financial years from 1 January 2022)
• Amendments to IAS 1, Explanation of fundamentals of financial reporting (from 1 January 2023)
• Amendments to IAS 1, Presentation of financial statements: classification of liabilities as current or non-current (from 1 January 2023)
• Amendments to IFRS 3 Business combinations (from 1 January 2022)• Amendments to IAS 8, Accounting policies, changes in accounting
estimates and errors: Definition of estimates (from 1 January 2023)• Amendments to IAS 12, Income taxes: Deferred taxes on assets and
liabilities arising from a single transaction (from 1 January 2023)• Amendments to IAS 16 Tangible fixed assets: income obtained before its
intended use (from 1 January 2022)• IFRS 17 Insurance contracts (from 1 January 2023)• Amendments to IAS 37 Provisions, Contingent Liabilities and Contingent
Assets: loss-making contracts – cost to fulfill the contract (from 1 January 2022)
Quest for Growth has not previously adopted any standard, interpretation or amendment that has been issued but not yet in force.