Embed Size (px)
Citation preview
GAP Alpha Consulting, Inc.Investment Strategy
Management TeamRob Breakiron Casey LoopMatt Kemp Lauren Gebbie
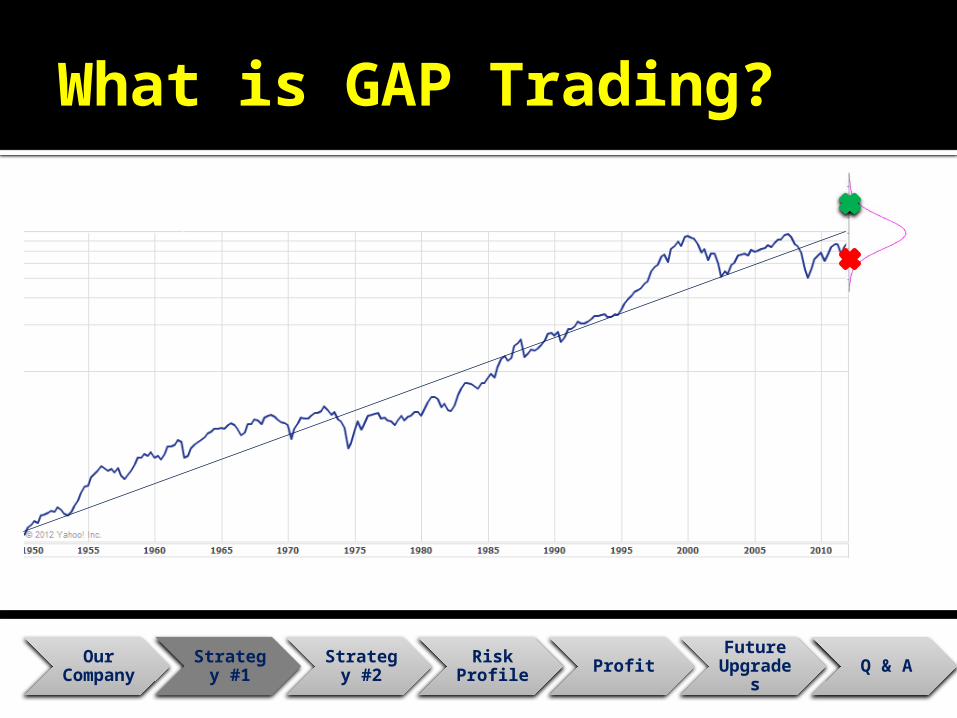
What is GAP Trading?
Our Company
Strategy #1
Strategy #2
Risk Profile Profit Future
Upgrades Q & A
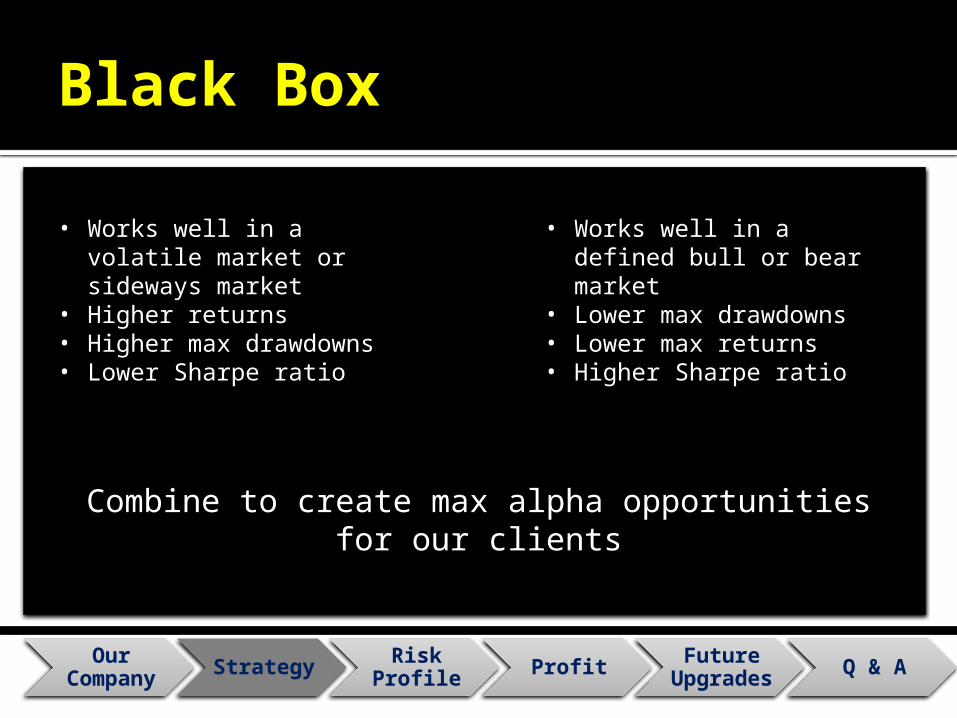
Black Box
Our Company Strategy Risk
Profile Profit Future Upgrades Q & A
• Works well in a defined bull or bear market
• Lower max drawdowns• Lower max returns• Higher Sharpe ratio
• Works well in a volatile market or sideways market
• Higher returns• Higher max drawdowns• Lower Sharpe ratio
Mean Reversion
Modified TRIX
Combine to create max alpha opportunities for our clients
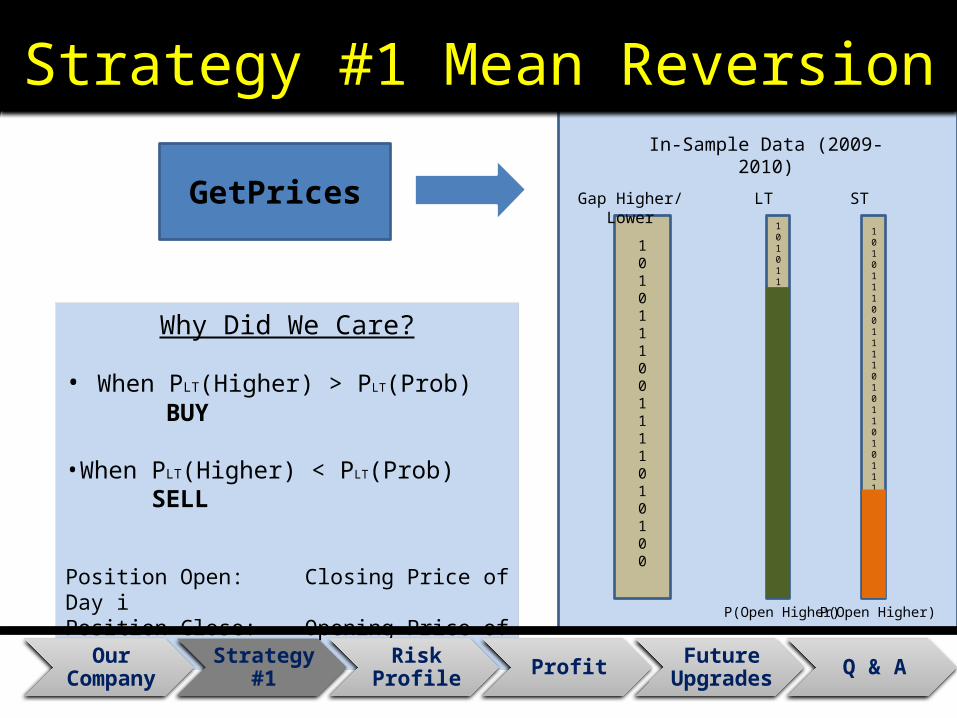
GetPrices
In-Sample Data (2009-2010)
Gap Higher/ Lower
1010111001111010100
101011100111101011010111001111010
LT
P(Open Higher)
101011100111101011010111001111010
ST
P(Open Higher)
Why Did We Care?
• When PLT(Higher) > PLT(Prob) BUY
•When PLT(Higher) < PLT(Prob) SELL
Position Open: Closing Price of Day iPosition Close: Opening Price of Day i+1
Our Company
Strategy #1
Risk Profile Profit Future
Upgrades Q & A
Strategy #1 Mean Reversion
Our Company
Strategy #1
Strategy #2
Risk Profile Profit Future
Upgrades Q & A
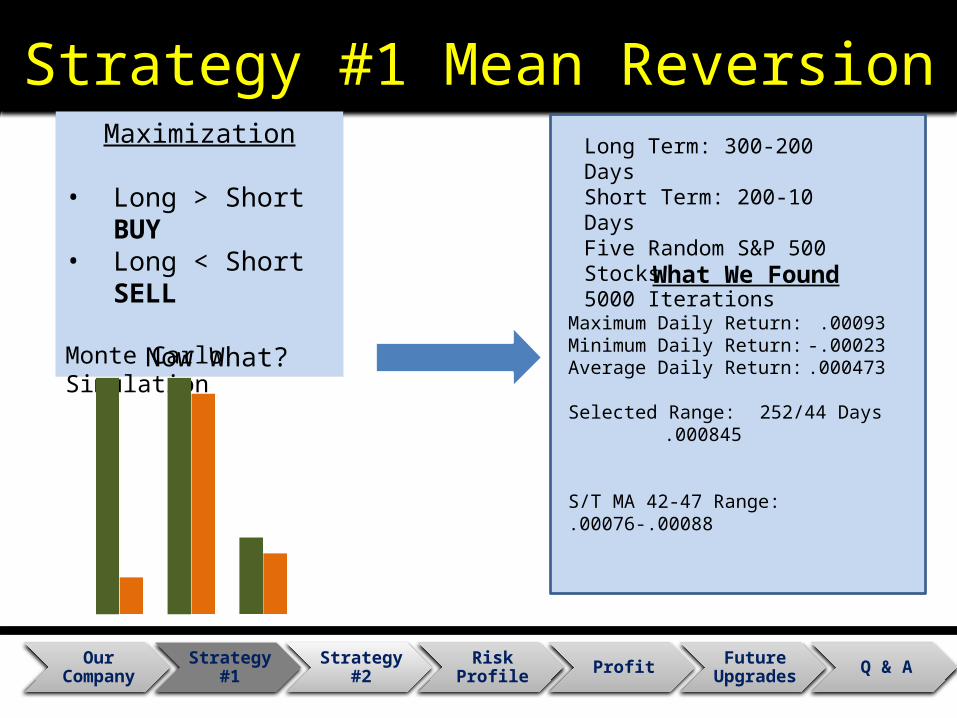
Maximization
• Long > Short BUY• Long < Short SELL
Now What?
Monte Carlo Simulation
What We Found
Long Term: 300-200 DaysShort Term: 200-10 DaysFive Random S&P 500 Stocks5000 Iterations
Maximum Daily Return: .00093Minimum Daily Return: -.00023Average Daily Return: .000473
Selected Range: 252/44 Days.000845
S/T MA 42-47 Range: .00076-.00088
Strategy #1 Mean Reversion

Our Company
Strategy #1
Strategy #2
Risk Profile Profits Future
Upgrades Q & A
TRIX: The 1-period % ROC for a triple smoothed EMA1. Single-Smoothed EMA = X-period EMA of the opening price2. Double-Smoothed EMA = X-period EMA of Single-Smoothed EMA3. Triple-Smoothed EMA = X-period EMA of Double-Smoothed EMA4. TRIX = 1-period percent change in Triple-Smoothed EMA
Divergence: Bullish and bearish divergences form when the security and the indicator do not confirm one anotherwww.stockcharts.com
Strategy #2 Modified TRIX

Our Company
Strategy #1
Strategy #2
Risk Profile Profit Future
Upgrades Q & A
Strategy #2 Modified TRIXModifications• Signal threshold• MA period • S&P market divergence
check• Earnings check
Trading• Trade signal ran across all
500 S&P ~10% signal• Works in defined market
directions & stocks• Leading indicator
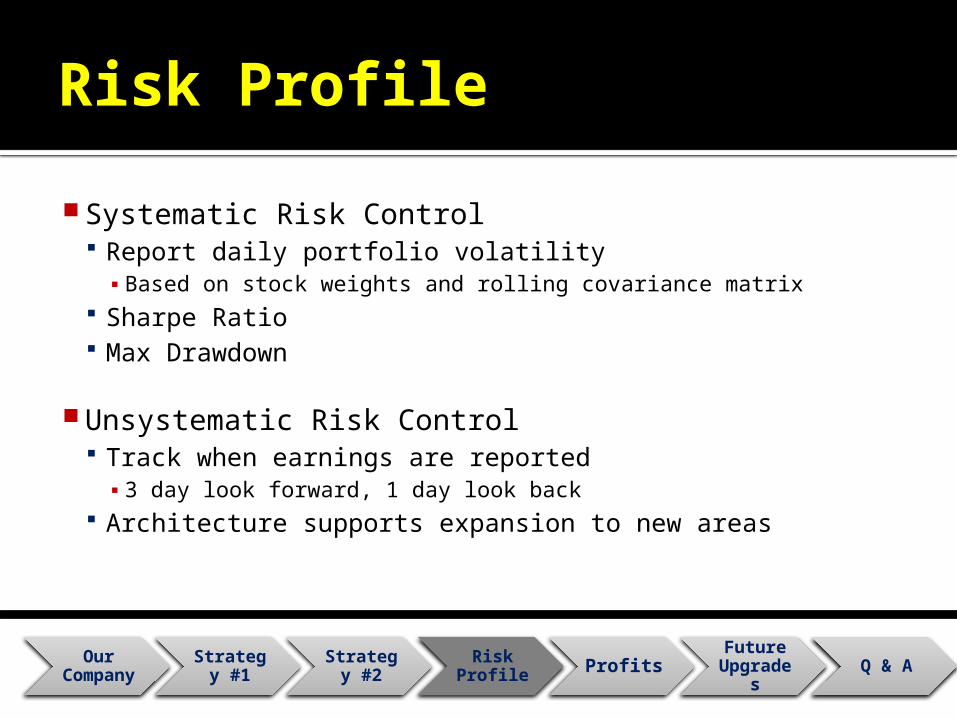
Risk Profile
Systematic Risk Control Report daily portfolio volatility▪ Based on stock weights and rolling covariance matrix
Sharpe Ratio Max Drawdown
Unsystematic Risk Control Track when earnings are reported▪ 3 day look forward, 1 day look back
Architecture supports expansion to new areas
Our Company
Strategy #1
Strategy #2
Risk Profile Profits Future
Upgrades Q & A
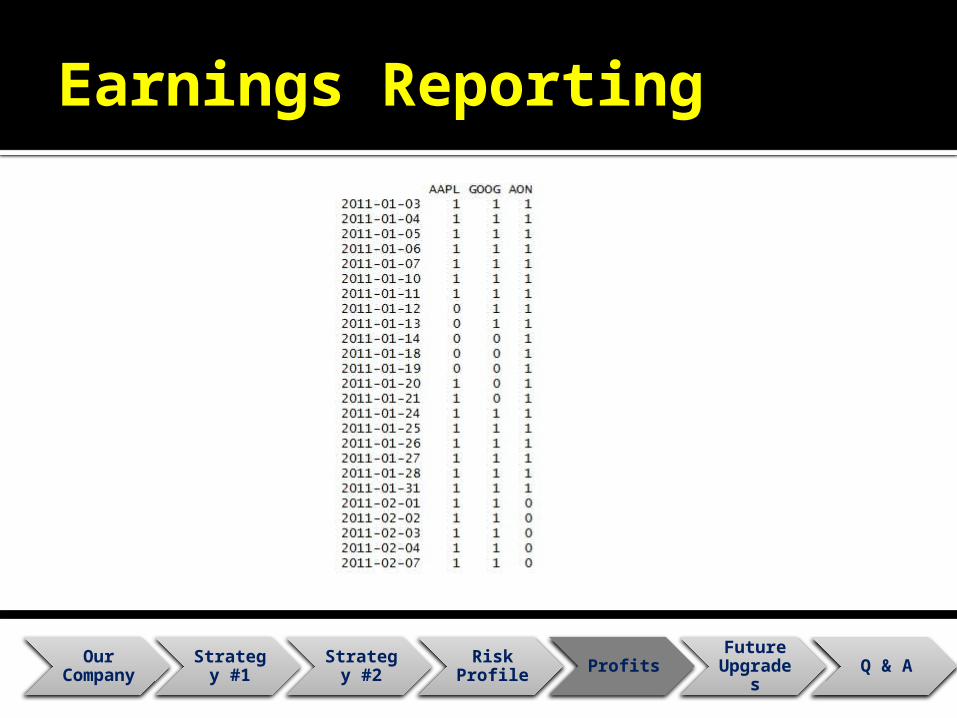
Earnings Reporting
Our Company
Strategy #1
Strategy #2
Risk Profile Profits Future
Upgrades Q & A
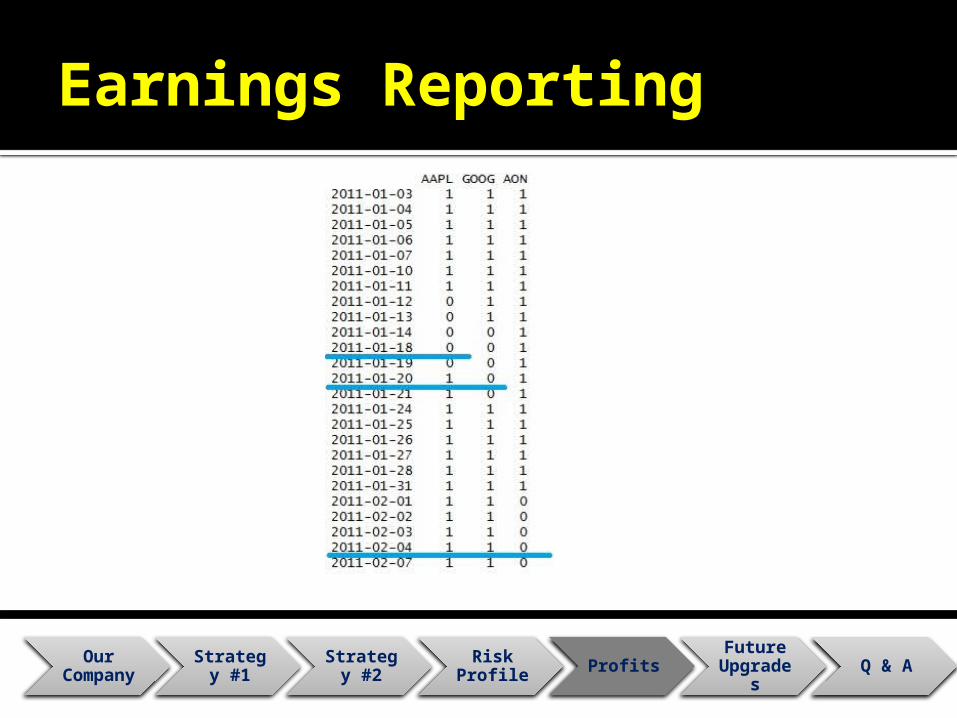
Earnings Reporting
Our Company
Strategy #1
Strategy #2
Risk Profile Profits Future
Upgrades Q & A

Apple Earnings
Our Company
Strategy #1
Strategy #2
Risk Profile Profits Future
Upgrades Q & A

Aon Earnings
Our Company
Strategy #1
Strategy #2
Risk Profile Profits Future
Upgrades Q & A
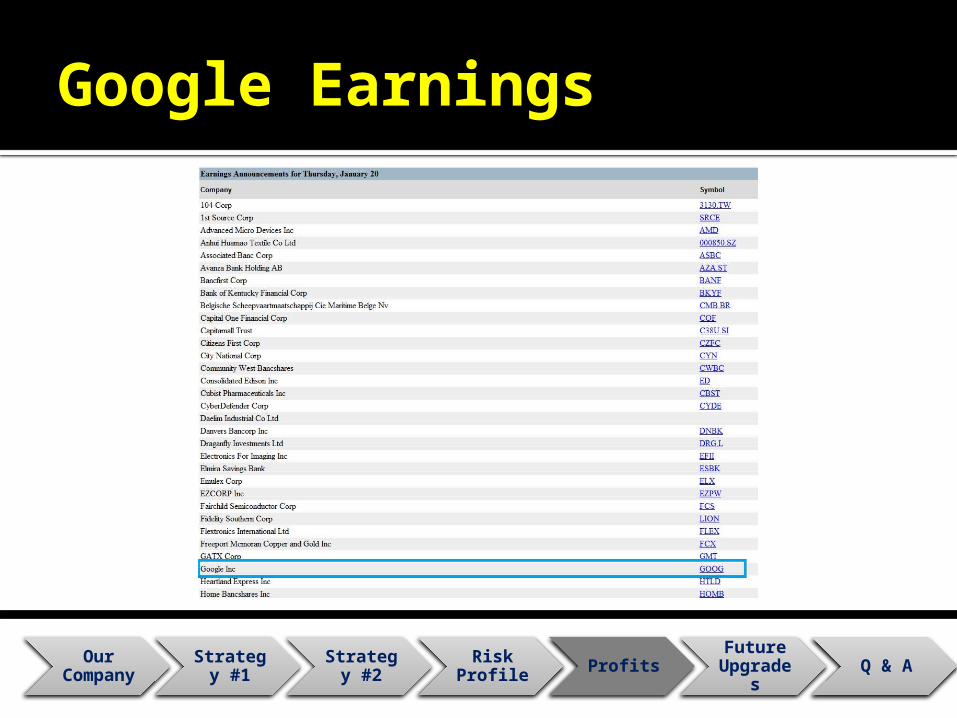
Google Earnings
Our Company
Strategy #1
Strategy #2
Risk Profile Profits Future
Upgrades Q & A

Future Enhancements
Sector distinctions Correlated earnings identification Additional strategies
Integrate a synthetic pairs trade Option mispricing
Our Company
Strategy #1
Strategy #2
Risk Profile Profits Future
Upgrades Q & A

Q $ A
Our Company
Strategy #1
Strategy #2
Risk Profile Profits Future
Upgrades Q & A
Questions?