Embed Size (px)
Citation preview

FORTUM Investor / Analyst material
May 2016

Disclaimer
This presentation does not constitute an invitation to underwrite, subscribe for,
or otherwise acquire or dispose of any Fortum shares.
Past performance is no guide to future performance, and persons needing
advice should consult an independent financial adviser.
2

Content
3
Fortum today pages 4 – 17
European and Nordic power markets pages 18 – 27
Fortum’s nuclear fleet pages 28 – 31
Russia pages 32 – 34
Fortum’s investment programme page 34
Historical achieved prices page 35
Interim report Q1 2016 pages 36 – 46
IR contacts pages 47
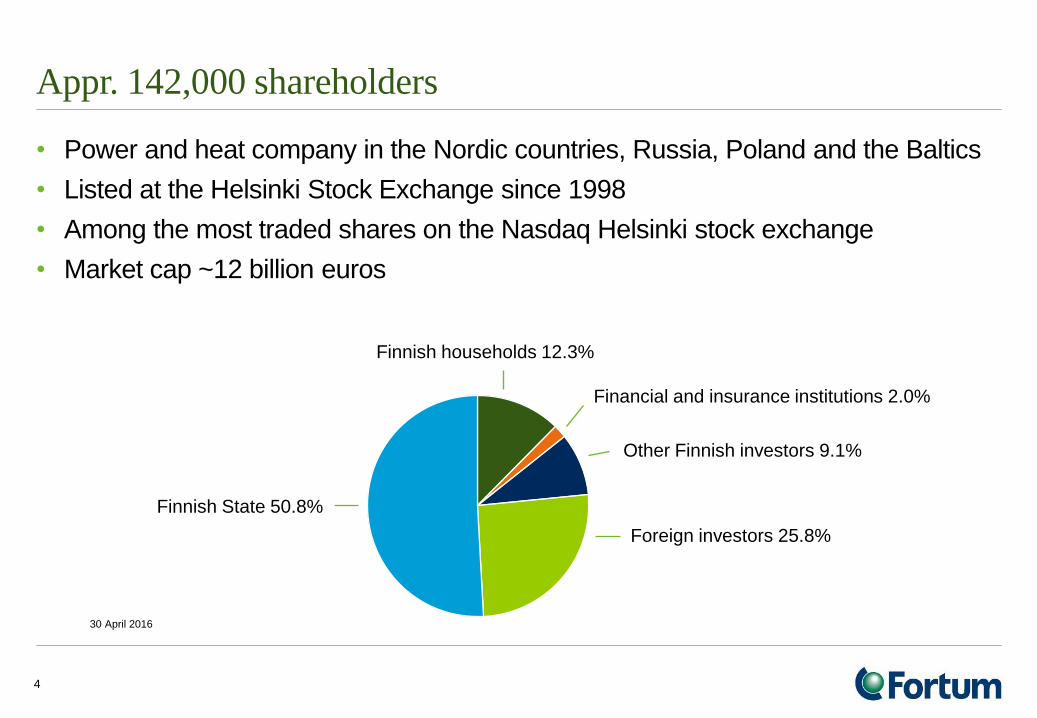
Appr. 142,000 shareholders
• Power and heat company in the Nordic countries, Russia, Poland and the Baltics
• Listed at the Helsinki Stock Exchange since 1998
• Among the most traded shares on the Nasdaq Helsinki stock exchange
• Market cap ~12 billion euros
4
30 April 2016
Foreign investors 25.8%
Finnish State 50.8%
Other Finnish investors 9.1%
Finnish households 12.3%
Financial and insurance institutions 2.0%

Capital returns: 2015 EUR 1.10 per share ~ EUR 1 billion
• Fortum’s dividend policy is based on the following preconditions:
– The dividend policy ensures that shareholders receive a fair remuneration for their entrusted capital,
supported by the company’s long-term strategy that aims at increasing earnings per share and thereby
the dividend.
– When proposing the dividend, the Board of Directors looks at a range of factors, including the macro
environment, balance sheet strength as well as future investment plans.
5
Fortum's target is to pay a stable,
sustainable and over time increasing
dividend of 50-80% of earnings per share
excluding one-off items
Fortum has since 1998 annually paid dividends
in total ~12,625 MEUR
2011
50% 2012
63%
2013
81%
2014
37%
1.0 1.0 1.1 1.1
1.3
5 year dividend per share (EUR) history
1.1
2015
24%
0.2

Fortum – Forerunner in clean energy
6
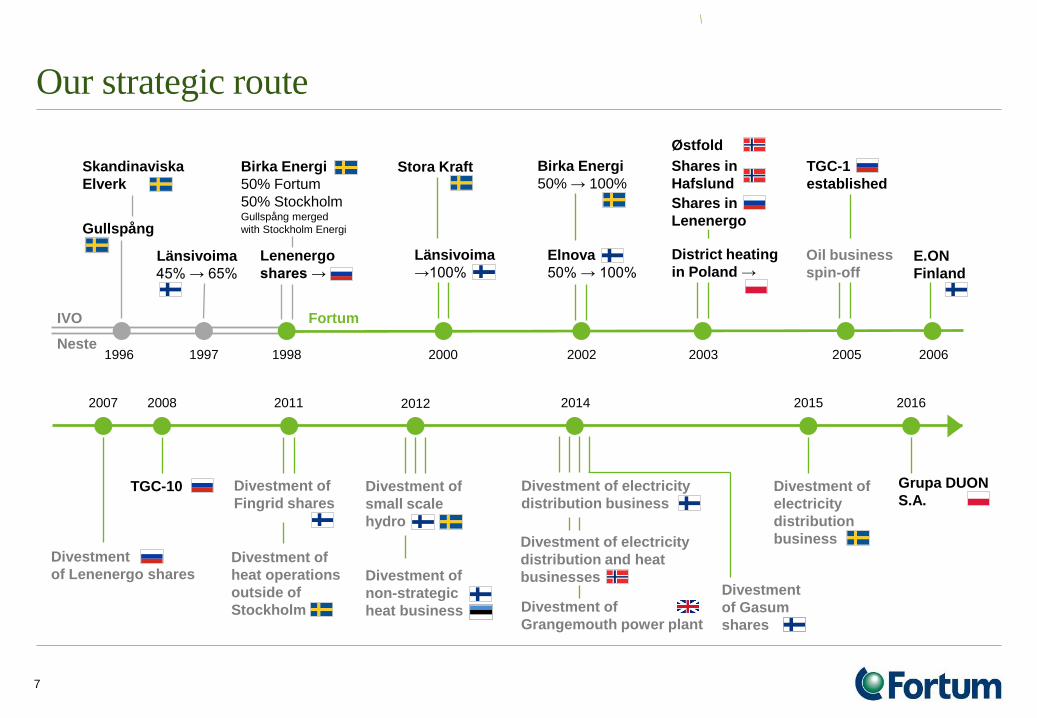
Our strategic route
7
Birka Energi
50% → 100%
Gullspång
Neste
Divestment of
non-strategic
heat business
2007
Skandinaviska
Elverk
Länsivoima
45% → 65%
Birka Energi
50% Fortum
50% Stockholm Gullspång merged
with Stockholm Energi
TGC-10 Divestment of
Fingrid shares
Divestment of
heat operations
outside of
Stockholm
Divestment
of Lenenergo shares
1996
IVO Fortum
Divestment of
small scale
hydro
2012 2008 2015
1997
Lenenergo
shares →
Stora Kraft
Länsivoima
→100%
2000
Elnova
50% → 100%
Østfold
Shares in
Lenenergo
Shares in
Hafslund
District heating
in Poland →
2003
Oil business
spin-off
TGC-1
established
2005
2011
1998 2002 2006
E.ON
Finland
Divestment of
electricity
distribution
business Divestment of electricity
distribution and heat
businesses
Divestment of electricity
distribution business
Divestment of
Grangemouth power plant
2014
Divestment
of Gasum
shares
2016
Grupa DUON
S.A.

Our current geographical presence
8
Nordic countries
Power generation 48.8 TWh
Heat sales 3.1 TWh
Electricity customers 1.3 million
Power
generation
Electricity
sales
Heat
OAO Fortum
Power generation 25.7 TWh
Heat sales 25.4 TWh
Russia
Poland Power generation 0.7 TWh
Heat sales 3.4 TWh
Baltic countries Power generation 0.7 TWh
Heat sales 1.2 TWh
India Power generation 26 GWh
Key figures 2015 Sales EUR 3.5 bn
Comparable operating profit EUR 0.8 bn
Balance sheet EUR 23 bn
Personnel 7,800

9
Fortum mid-sized European power generation player; major producer in global heat
1) Veolia incl. Dalkia International and EDF incl. Dalkia's activities in France
Source: Company information, Fortum analyses, 2014 figures pro forma
Largest global producers, 2014 TWh
Largest producers in Europe and Russia, 2014 TWh
Power generation Heat production
Electricity customers in EU, 2014 Millions
Customers
EnBW
E.ON/Uniper
Gazprom
DEI
EuroSibEnergo Iberdrola
Fortum
Vattenfall
CEZ
RWE
T Plus
DTEK
PGE
Rosenergoatom
NNEGC Energoat.
Enel EDF
0 100 200 300 400 500 600
ENGIE
Statkraft
Inter RAO UES
RusHydro
EDP
Gas Natural Fenosa
PGE
ENGIE
E.ON
DEI
CEZ
Enel
Centrica
EDP
Iberdrola
SSE EnBW
Fortum
EDF
RWE
Tauron
Hafslund
Dong Energy
0 20 40 10 30
Vattenfall
TGC-2
KDHC
Quadra
Tatenergo
Minskenergo
DTEK
Dong Energy Enel
Lukoil
0 20 40 60 80 100 120 140
T Plus
Vattenfall
PGNiG
Inter RAO UES
1) EDF
RusHydro
1 ) Veolia
Gazprom
Fortum Värme
Beijing DH
EuroSibEnergo
Fortum Sibgenco

Biggest nuclear and hydro generators in Europe and Russia
10
1) Formerly GDF SUEZ
Source: Company information, Fortum analyses, 2013 figures pro forma
0
50
100
150
200
250
300
350
400
450
500
550
600
ED
F
Ro
sen
erg
oa
tom
Ru
sH
ydro
NN
EG
C E
ne
rgo
ato
m
En
el
E.O
N
Va
tten
fall
Eu
roS
ibE
ne
rgo
EN
GIE
Sta
tkra
ft
Fo
rtum
Ibe
rdro
la
RW
E
CE
Z
En
BW
Axpo
Ve
rbu
nd
ED
P
Hid
roe
lectr
ica
Ukrh
ydro
ene
rgo
Ce
ntr
ica
Gazpro
m
Alp
iq
EP
S,
Se
rbia
No
rsk H
ydro
E-C
O E
ne
rgi
Ga
s N
atu
ral F
en
osa
Agder
Energ
i
BK
K
Lyse
Ene
rgi
DE
I
SS
E
Inte
r R
AO
UE
S
PG
E
DT
EK
IES
Other
Nuclear
Hydro
TWh
Total generation
1)
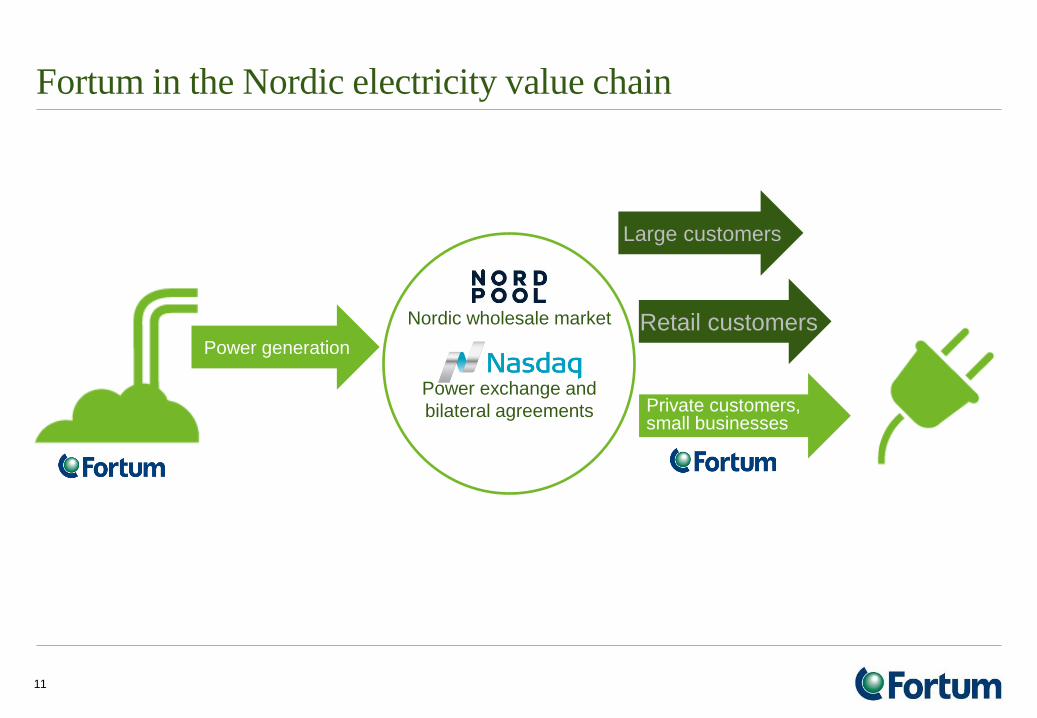
Fortum in the Nordic electricity value chain
11
Power generation
Nordic wholesale market
Power exchange and
bilateral agreements
Large customers
Retail customers
Private customers, small businesses

Fortum's power and heat production by source
12
Natural gas 32%
Hydro power
33%
Coal 4%
Biomass 1%
Total generation 75.9 TWh
(Generation capacity 13,692 MW)
Nuclear power 30%
Fortum's power generation
in 2015
Total production 32.2 TWh
(Production capacity 16,611 MW)
Fortum's heat production
in 2015
Waste 1%
Heat pumps, electricity 1%
Biomass 6%
Natural gas
75%
Coal 15%
Oil 1% Peat 1%

Fortum's European power and heat production
13
Hydro power
50%
Coal 2%
Nuclear power 45%
Biomass 2%
European generation 50.2TWh
(Generation capacity 8,774 MW)
Fortum's European
power generation in 2015
Other 1%
Biomass
31%
Fortum's European
heat production in 2015
Peat 4% Oil 1%
Waste 6%
Natural gas 8%
Heat pumps, electricity 4%
Coal 45%
European production 6.4 TWh
(Production capacity 3,915 MW)
Others 1%

MW Finland
Wind 0.4
Hydro 1 535
Nuclear 1 465
CHP 438
Other thermal 377
3 815
Generation capacity
in Finland
14
Fortum’s Nordic generation capacity
389
4 623
Other thermal
Hydro
Nuclear
CHP *
3 004
Wind 30
Nordic capacity 8 484
438
Nordic MW
Price areas MW
SE2
Hydro 1 550
Wind 30
SE3*
Hydro 1 538
Nuclear 1 539
Sweden*
4 669
Generation capacity
in Sweden
Other thermal 12
31 December 2015
*) In addition associated company Fortum Värme; CHP capacity 639 MW
SE1
SE2
SE3
SE4
*)

Fortum a forerunner in sustainability
We are highly committed to sustainability. Our purpose is to create energy
that improves life for present and future generations.
We provide sustainable solutions for society while delivering excellent value
to our shareholders. We want to act responsibly, both in the short term and
long term.
Fortum is listed in several sustainability indexes:
• Nordic Climate Disclosure Leadership Index (CDLI)
• STOXX® Global ESG Leaders indices
• oekom
• OMX GES Sustainability Finland Index
• ECPI® Indices
15
Emissions-free production is Fortum’s strategic choice

0
200
400
600
800
1 000
1 200
DE
I
RW
E
Dra
x
SS
E
CE
Z
Vattenfa
ll
ED
P
E.O
N
A2A
Enel
Gas N
atu
ral F
enosa
EnB
W
EN
GIE
Do
ng
En
erg
y
Iberd
rola
Fort
um
tota
l
PV
O
ED
F
Verb
und
Fort
um
EU
Sta
tkra
ft
39
g CO2/kWh electricity, 2014
2015
64% of Fortum's total power generation CO2-free
97% of Fortum’s power generation in the EU CO2-free
Average 313 g/kWh
177
Fortum's carbon exposure among the lowest in Europe
16
Note: Only European generation except “Fortum total“ which includes Russia.
Fortum’s specific emissions of the power generation in 2015 in the EU were 21 g/kWh and in total 166 g/kWh.
Source: PWC, Novembre 2015, Changement climatique et Électricité, Fortum

Fortum’s renewables investment is already ramping up
Hydro, MW
Maintenance/upgrade ~10 Annually
Wind, MW Power Year
Blaiken, Sweden 12 2016
Uljanovsk, Russia 35 2017
Solberg, Sweden 75 2018
Solar, India, MW
Bhadla 70 Conts.
starting
Paragada 100 Planning
phase
Bio, MW Power Heat Year
Kivenlahti, Finland,
Pellet conversion 80 2016
Zabrze, Poland, waste/ coal
CHP 75 145 2018
Associated companies,
MW
Värtan, Sweden, bio-CHP
(50% share) 130 280 2016
Naantali, Finland, bio-CHP
(49.5% share) 142 244 2017
Kaunas, Lithuania, waste-CHP
(49% share) 24 71 2019
Total: ~ 520 MW power and ~ 520 MW heat capacity (Fortum’s share)

Market coupling milestones - cross-border power flows optimised by power exchanges
• Market coupling between NL, BE and FR since 2006
• Germany – Nord Pool coupling started 11/2009
• Market coupling for Central Western Europe (DE, FR, NL, BE) since 11/2010 with a continued coupling with Nord Pool. NorNed (NO-NL) and BritNed (UK-NL) included in 2011
• Nord Pool price area for Estonia in 2010, Lithuania in 2012 and Latvia in 2013. Poland coupled with Nord Pool since 2010
• Czech, Slovakia and Hungary coupled together since 2012. Romania joined in 2014
• A common day-ahead market coupling for the whole north-western Europe (incl. Spain & Portugal) was started in 2014. Italy and Slovenia joined in 2015
• Flow-based cross-border capacity allocation for further trade optimisation taken into use in May 2015 for the CWE region
• CEE (Central Eastern Europe) market coupling region due to join latest in 2018. Switzerland waiting for agreement with the EU
• In addition to day-ahead coupling, European-wide intraday market coupling is due to be implemented in autumn 2017
• Balancing market integration under development as well, based on both regional projects and the drafted European Network Code on Electricity Balancing
18
2009
2015
2012-2014
2010-
2013
2017-2018
2014

Current transmission capacity from Nordic area is over 6,000 MW
19
• Theoretical maximum in transmission capacity ~40 TWh
per annum, but restrictions especially between DK & DE
• Net export from the Nordic area to Continental Europe
and Baltics during year 2015 was 19 TWh
• During 2014 the net export was 13 TWh
• Approximately 25 TWh of net export is now reachable
Countries Transmission capacity MW
From Nordics To Nordics
Denmark - Germany 2,225 2,100
Sweden - Germany 615 615
Sweden - Poland 600 600
Sweden - Lithuania 700 700
Norway - Netherlands 723 723
Finland - Estonia 1,000 1,016
Finland - Russia 320 1,300
Total 6,183 7,054
723
2,225 615 600
1,000
320
700

Nordic, Baltic, Continental and UK markets are integrating – interconnection capacity will double by 2023
20
Two 1,400 MW NO-UK links as EU
Projects of Common Interest: NSL
to England agreed to be ready in
2021, NorthConnect to Scotland still
requiring Norwegian permission
1,400 MW NordLink as first direct
NO-DE link to be built by end-2019
700 MW COBRAcable from DK to
NL due to be ready by 2019
Jutland – DE capacity planned to
grow by 860 MW by 2020, with
further 500 MW increase by 2022 Svenska Kraftnät and 50Hertz
signed 11/2015 a cooperation
agreement to build 700 MW Hansa
PowerBridge DC link between
Sweden and Germany by 2025
The Northern Seas Offshore Grid and the Baltic
Energy Market Integration Plan are included as
priority electricity corridors in EU’s Infrastructure
Guidelines, approved in April 2013
New interconnections will
double the export capacity
to over 12,000 MW by 2023
LitPol Link (500 MW in operation
since 12/2015) with another 500
MW by 2020. It has opened a new
transmission route from the Nordic
market to the Continent
EU’s European Energy Programme
for Recovery co-financed 700 MW
NordBalt (operation started 2/2016)
New internal Nordic grid
investments provide for increased
available capacity for export to the
Continent and Baltics
EU’s Connecting Europe Facility
co-financing 3rd EE-LV transmission
line, due to be ready by 2020
New 400 MW Zealand – DE
Kriegers Flak connection by 2019
New 1,400 MW DK-UK Viking Link
not yet decided, but planned to be
built by end-2022
New interconnectors
New Nordic lines
Existing interconnectors
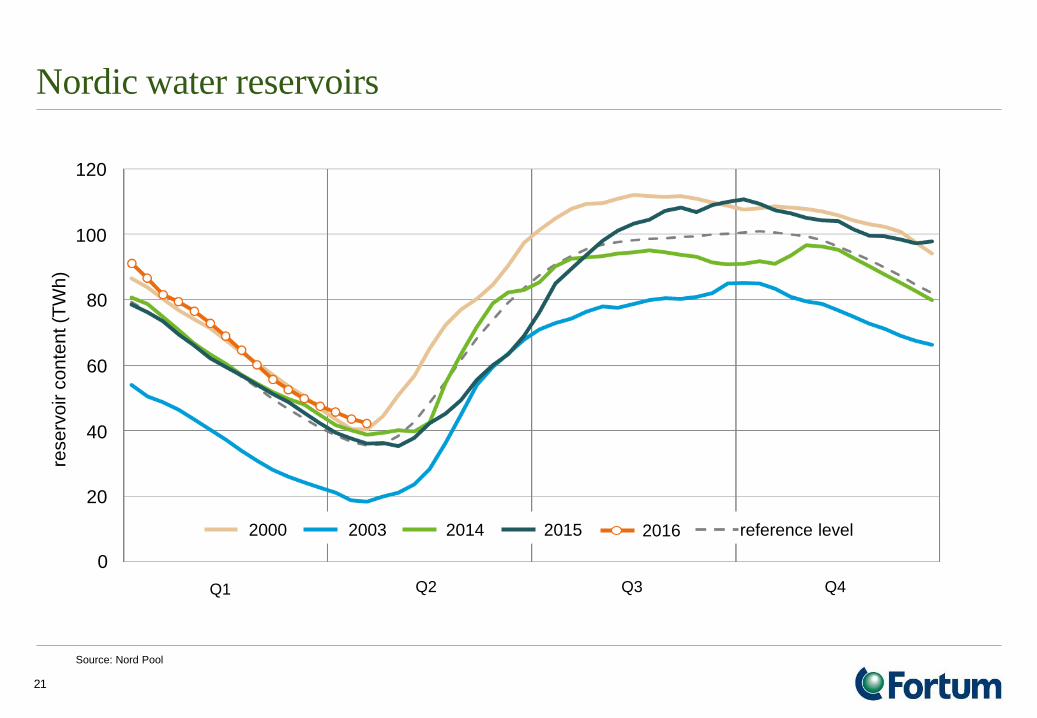
Nordic water reservoirs
21
Source: Nord Pool
Q1 Q2 Q3 Q4
20
40
60
80
100
120
rese
rvo
ir c
on
ten
t (T
Wh)
0
2000 2003 2015 2014 reference level 2016

Nordic year forwards
22
Source: Nasdaq Commodities
0
10
20
30
40
50
60
70
€/MWh 2 May 2016
Year15 Year17 Year19 Year10 Year11 Year12 Year13 Year14 Year16 Year18 Year20
2014
Q1
2008
Q2 Q3 Q4 Q1
2009
Q2 Q3 Q4 Q1
2010
Q2 Q3 Q4 Q1
2011
Q2 Q3 Q4 Q1
2012
Q2 Q3 Q4 Q1
2013
Q2 Q3 Q4 Q1 Q2 Q3 Q4
2015
Q1 Q2 Q3 Q4
2016
Q1 Q2

Wholesale price for electricity
23
Source: Nord Pool, Nasdaq Commodities
0
10
20
30
40
50
60
70
80
90
100
110
EUR/MWh Nord Pool System Price Forwards
2 May 2016
1995 1997 1999 2001 2003 2005 2007 2009 2011 2013 2015 2017 2019 2021 2023 2025

Wholesale prices for electricity
24
Source: Nord Pool, Nasdaq Commodities, Bloomberg Finance LP, ATS, NP “Market Council”, Fortum * Including weighted average capacity price
German
Nordic
Russian*
Spot prices Forward prices EUR/MWh
10
20
30
40
50
60
70
80
90
100
0 2009 2010 2011 2012 2013 2014 2015 2016 2017
2 May 2016
0
30
60
90
120
150
US
D /
bb
l
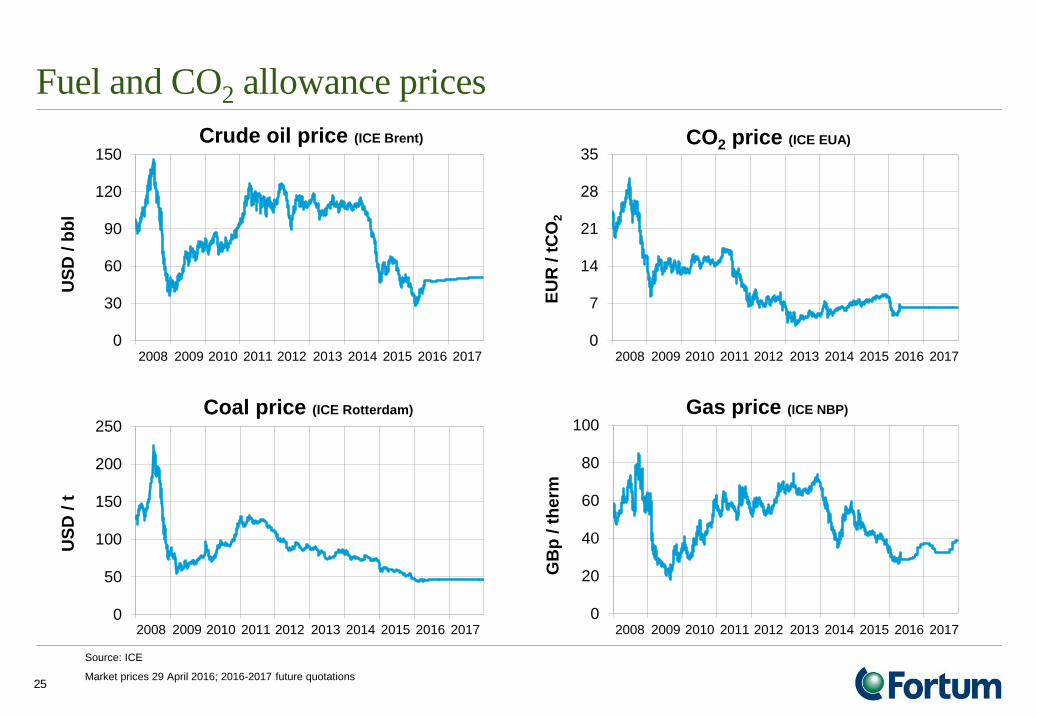
Crude oil price (ICE Brent)
2008 2009 20122010 2011 20142013 2015 2016 20170
7
14
21
28
35
EU
R /
tC
O2
CO2 price (ICE EUA)
2008 2009 20122010 2011 20142013 2015 2016 2017
0
50
100
150
200
250
US
D /
t
Coal price (ICE Rotterdam)
2008 2009 20122010 2011 20142013 2015 2016 20170
20
40
60
80
100
GB
p /
th
erm
Gas price (ICE NBP)
2008 2009 20122010 2011 20142013 2015 2016 2017
25
Source: ICE
Market prices 29 April 2016; 2016-2017 future quotations
Fuel and CO2 allowance prices

Nordic power generation – dominated by hydro, but fossil needed
26
Source: ENTSO-E preliminary data 2015
23
77
TWh %
32
229
35
6
19
8
58
9
1 0.2
*) Normal annual Nordic hydro generation
200 TWh, variation +/- 40 TWh.
Total Nordic generation
397 TWh in 2015
Net export in 2015: 16 TWh 0
20
40
60
80
100
120
140
160
Denmark Norway Sweden Finland
Fossil fuels
Nuclear
Biomass
Solar
Wind
Hydro *
TWh/a
Hydro
Nuclear
31,200
-
16,184
9,076
3,263
2,752
Net generating capacity as of 31 Dec 2015, MW
7
-

Wholesale electricity price too low to attract investments
27
NOTE: The presented figures are calculated based on data from recent public reports and do not represent Fortum’s view. Average achieved price (€/MWh) for the production
type depends on availability and flexibility. There are large variations in the cost of hydro, wind and solar depending on location and conditions.
0
10
20
30
40
50
60
70
80
90
100
110
Source: Nord Pool, Nasdaq Commodities
EUR/MWh
Futures
2 May 2016
1995 2015 2026
Commodity prices are forward prices as of September 2015, extended with inflation
EUR/MWh
Average levelised costs of new electricity generation
Solar PV In Spain
Coal condensing
Gas Onshore wind
Nuclear Large hydro
Offshore wind

Overview of Fortum’s nuclear fleet
28
LOVIISA OLKILUOTO OSKARSHAMN FORSMARK
Commercial operation started
Unit 1: 1977
Unit 2: 1981
Unit 1: 1978
Unit 2: 1980
Unit 3: (Under construction)
Unit 1: 1972
Unit 2: 1974 (out of oper.)
Unit 3: 1985
Unit 1: 1980
Unit 2: 1981
Unit 3: 1985
Generation Capacity
Fortum’s share
Unit 1: 498 MW
Unit 2: 500 MW
Total: 997 MW
Unit 1: 880 MW
Unit 2: 880 MW
(Unit 3: 1,600 MW)
Total: 1,760 MW (3,360)
27% 468 MW
Unit 1: 473 MW
Unit 2: 638 MW
Unit 3: 1,400 MW
Total: 1,873 MW
43% 812 MW
Unit 1: 984 MW
Unit 2: 1,120 MW
Unit 3: 1,167 MW
Total: 3,271 MW
22% 727 MW
Yearly production
Fortum’s share of
production
8 TWh
8 TWh
14 TWh
4 TWh
12 TWh
5 TWh
26 TWh
6 TWh
Share of Fortum’s
Nordic production 18% 9% 12% 13%
Majority owner
Fortum’s share
Fortum
Pohjolan Voima
26.6%
Uniper
43.4%
Vattenfall
22.2%
Operated by Fortum Teollisuuden Voima (TVO)
OKG Aktiebolag Forsmarks Kraftgrupp
Responsibilities Loviisa: Fortum is the owner, licensee and operator with all the responsibilities specified in the Nuclear Energy Act, Nuclear Liability Act, and other relevant nuclear legislation
Other units: Fortum is solely an owner with none of the responsibilities assigned to the licensee in the nuclear legislation. Other responsibilities are specified in the
Companies Act and the Articles of Association and are mostly financial.

Olkiluoto
Loviisa Forsmark
Oskarshamn
Fortum's nuclear power in the Nordics
29
• Finnish units world class in availability
• Overview of production and consumption:
www.fortum.com/investors - energy related links
Source: Fortum
Load factor (%) 2005 2006 2007 2008 2009 2010 2011 2012 2013 2014 2015
Oskarshamn 1 80 51 63 85 68 77 72 1 12 74 60
Oskarshamn 2 90 78 76 86 75 90 77 81 33 0 0
Oskarshamn 3 85 95 88 70 17 31 68 69 77 75 79
Forsmark 1 85 76 81 88 88 93 79 88 87 94 79
Forsmark 2 94 72 85 79 64 38 94 82 89 89 91
Forsmark 3 95 92 88 69 86 81 85 93 88 83 58
Loviisa 1 95 93 94 86 96 93 94 84 92 92 93
Loviisa 2 95 88 96 93 95 89 94 91 93 89 92
Olkiluoto 1 98 94 97 94 97 92 95 90 97 94 96
Olkiluoto 2 94 97 94 97 95 95 91 96 93 97 89

Variety of technologies and ages
30
Planned capacity increase:
• Forsmark 1, potential capacity increase of total ~110 MW in 2017-2020.
Closing of the units:
• OKG AB's Extraordinary shareholders' meeting decided on 14 October 2015 on the closure of Oskarshamn nuclear power plant units
1 and 2 in Sweden. Unit 1 will be taken out of operation and transferred into service mode after the applied environmental permit has
been received, approximately during 2017– 2019. Unit 2 has been out of operation since June 2013 due to an extensive safety
modernisation, and it will not be put back into operation. The closing process for both units is estimated to take several years.
PWR = (Pressurized Water Reactor) The most common reactor type in the world (e.g. all French units, most US units). Also the Loviisa units are PWRs, but based on Russian design. High pressure
prevents water from boiling n the reactor. The steam rotating the turbine is generated in separate steam generators.
BWR = (Boiling Water Reactor) Similar to the PWR in many ways, but the steam is generated directly in the reactor. Popular reactor type e.g. in Sweden, the US and Japan.
1) Generation refers to technical resemblence based on KSU classification and not to reactor design generations. All reactors are of Generation II except Olkiluoto-3 (EPR) which is of Generation III.
Unit MWe
(Net)
Share
(%)
Share
(MWe)
Commercial
operation
Age Type/
Generation 1)
Supplier
Loviisa 1
Loviisa 2
498
500
100,0
100,0
498
500
1977-05-09
1981-01-05
38
35
PWR / 1
PWR / 1
AEE (Atomenergoexport)
AEE (Atomenergoexport)
Olkiluoto 1
Olkiluoto 2
Olkiluoto 3
880
880
(1,600)
26,6
26,6
25,0
234
234
(400)
1979-10-10
1982-07-10
(end of 2018)
37
35
BWR / 3
BWR / 3
PWR / 3
Asea-Atom / Stal-Laval
Asea-Atom / Stal-Laval
Areva / Siemens
Oskarshamn 1
Oskarshamn 2
Oskarshamn 3
473
638
1,400
43,4
43,4
43,4
205
277
607
1972-02-06
1975-01-01
1985-08-15
43
41
30
BWR / 1
BWR / 2
BWR / 4
Asea-Atom / Stal-Laval
Asea-Atom / Stal-Laval
Asea-Atom / Stal-Laval
Forsmark 1
Forsmark 2
Forsmark 3
984
1,120
1,167
23,4
23,4
20,1
230
262
236
1980-12-10
1981-07-07
1985-08-18
35
34
30
BWR / 3
BWR / 3
BWR / 4
Asea-Atom / Stal-Laval
Asea-Atom / Stal-Laval
Asea-Atom / Stal-Laval
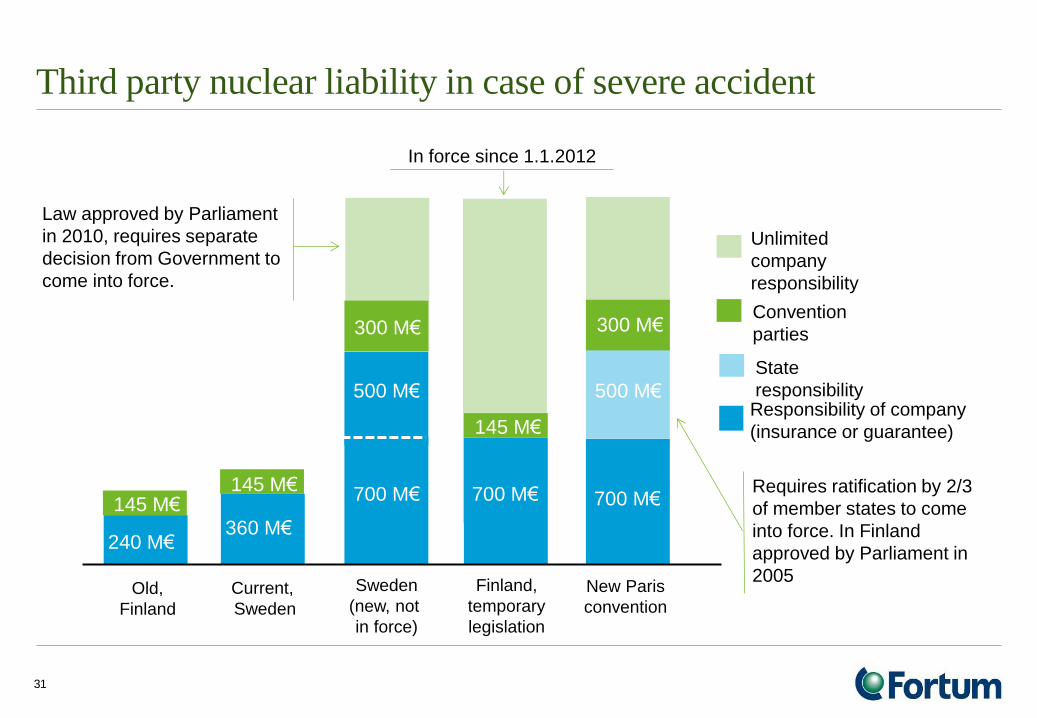
Third party nuclear liability in case of severe accident
31
Sweden
(new, not
in force)
Finland,
temporary
legislation
Current,
Sweden
700 M€
200 M€ 360 M€
500 M€ Responsibility of company
(insurance or guarantee)
Unlimited
company
responsibility
Convention
parties 300 M€
State
responsibility
300 M€
500 M€
700 M€
New Paris
convention
700 M€
145 M€
145 M€
Old,
Finland
240 M€
145 M€
In force since 1.1.2012
Law approved by Parliament
in 2010, requires separate
decision from Government to
come into force.
Requires ratification by 2/3
of member states to come
into force. In Finland
approved by Parliament in
2005
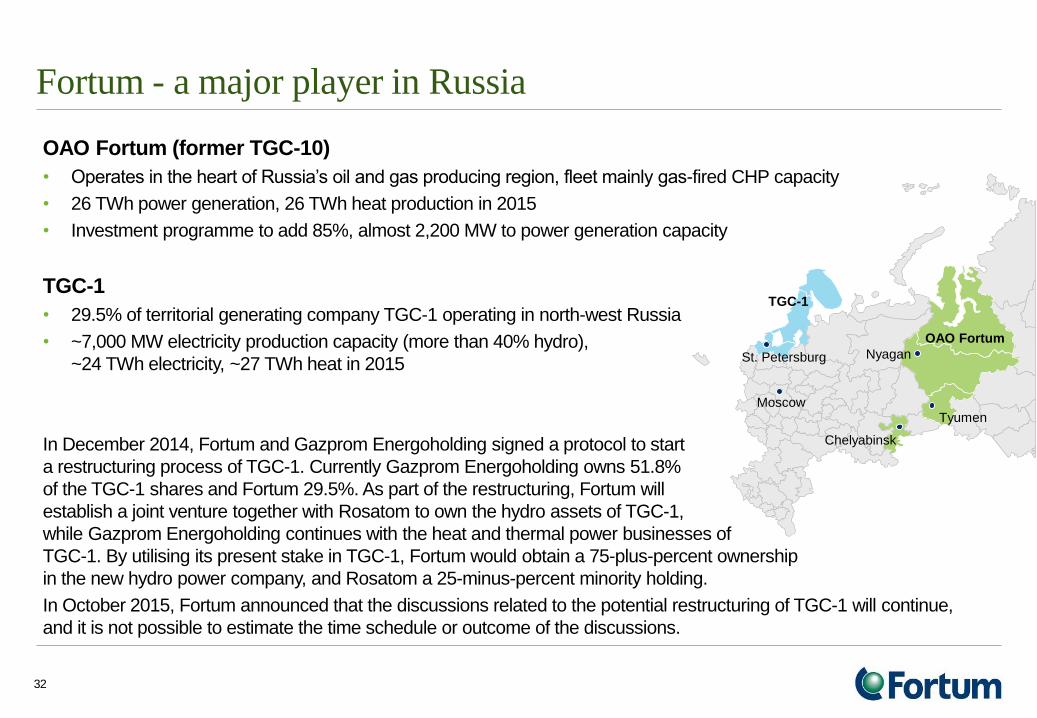
Fortum - a major player in Russia
OAO Fortum (former TGC-10)
• Operates in the heart of Russia’s oil and gas producing region, fleet mainly gas-fired CHP capacity
• 26 TWh power generation, 26 TWh heat production in 2015
• Investment programme to add 85%, almost 2,200 MW to power generation capacity
TGC-1
• 29.5% of territorial generating company TGC-1 operating in north-west Russia
• ~7,000 MW electricity production capacity (more than 40% hydro),
~24 TWh electricity, ~27 TWh heat in 2015
In December 2014, Fortum and Gazprom Energoholding signed a protocol to start
a restructuring process of TGC-1. Currently Gazprom Energoholding owns 51.8%
of the TGC-1 shares and Fortum 29.5%. As part of the restructuring, Fortum will
establish a joint venture together with Rosatom to own the hydro assets of TGC-1,
while Gazprom Energoholding continues with the heat and thermal power businesses of
TGC-1. By utilising its present stake in TGC-1, Fortum would obtain a 75-plus-percent ownership
in the new hydro power company, and Rosatom a 25-minus-percent minority holding.
In October 2015, Fortum announced that the discussions related to the potential restructuring of TGC-1 will continue,
and it is not possible to estimate the time schedule or outcome of the discussions.
32
OAO Fortum
Tyumen
Chelyabinsk
Nyagan
TGC-1
St. Petersburg
Moscow
0
200
400
600
800
1 000
1 200
1 400
RU
B /
MW
h
0
5
10
15
20
25
30
35
40
€/
MW
h
2009 2010 2011 2012 2013 2014 2015 2016
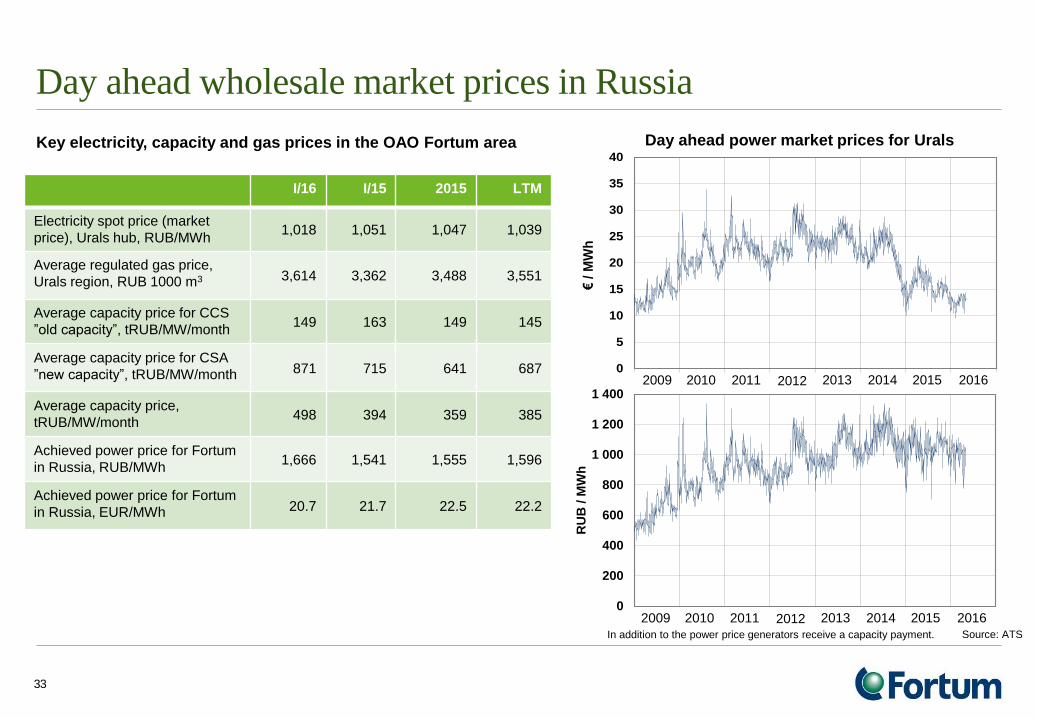
In addition to the power price generators receive a capacity payment. Source: ATS
Day ahead power market prices for Urals
2009 2010 2011 2012 2013 2014 2015 2016
Day ahead wholesale market prices in Russia
Key electricity, capacity and gas prices in the OAO Fortum area
I/16 I/15 2015 LTM
Electricity spot price (market
price), Urals hub, RUB/MWh 1,018 1,051 1,047 1,039
Average regulated gas price,
Urals region, RUB 1000 m3 3,614 3,362 3,488 3,551
Average capacity price for CCS
”old capacity”, tRUB/MW/month 149 163 149 145
Average capacity price for CSA
”new capacity”, tRUB/MW/month 871 715 641 687
Average capacity price,
tRUB/MW/month 498 394 359 385
Achieved power price for Fortum
in Russia, RUB/MWh 1,666 1,541 1,555 1,596
Achieved power price for Fortum
in Russia, EUR/MWh 20.7 21.7 22.5 22.2
33

85% increase in power generation capacity in Russia through the investment programme
Year Supply
starts
Power plant Fuel type Existing
capacity
2,333 MW
New
investments
2,388 MW
Production type Total
capacity
5,173 MW
< 2011 Tyumen CHP-2 Gas 755 CHP/Condensing 755
Chelyabinsk CHP-2 Gas, coal 320 CHP/Condensing 320
Argayash CHP Gas, coal 195 CHP/Condensing 195
Chelyabinsk CHP-1 Gas, coal 149 CHP/Condensing 149
2011 Feb/2011 Tyumen CHP-1 Gas 472 209 CHP/Condensing 681
June/2011 Chelyabinsk CHP-3 Gas 360 216 CHP/Condensing 576
Oct/2011 Tobolsk CHP* Gas 452 213 CHP/Condensing 665*
2013 April/2013 Nyagan 1 GRES Gas 418 Condensing 418
Dec/2013 Nyagan 2 GRES Gas 418 Condensing 418
2015 Jan/2015 Nyagan 3 GRES Gas 418 Condensing 418
Dec/2015 Chelyabinsk GRES Gas 82 248 CHP/Condensing 330
March/2016 Chelyabinsk GRES Gas 248 CHP/Condensing 248
2,333 MW 2,175 MW 4,508 MW
34
*Tobolsk power plant was sold in Q1/2016

Hedging improves stability and predictability
35
2009 onwards thermal and import from Russia excluded

Interim Report January-March 2016 Fortum Corporation
28 April 2016
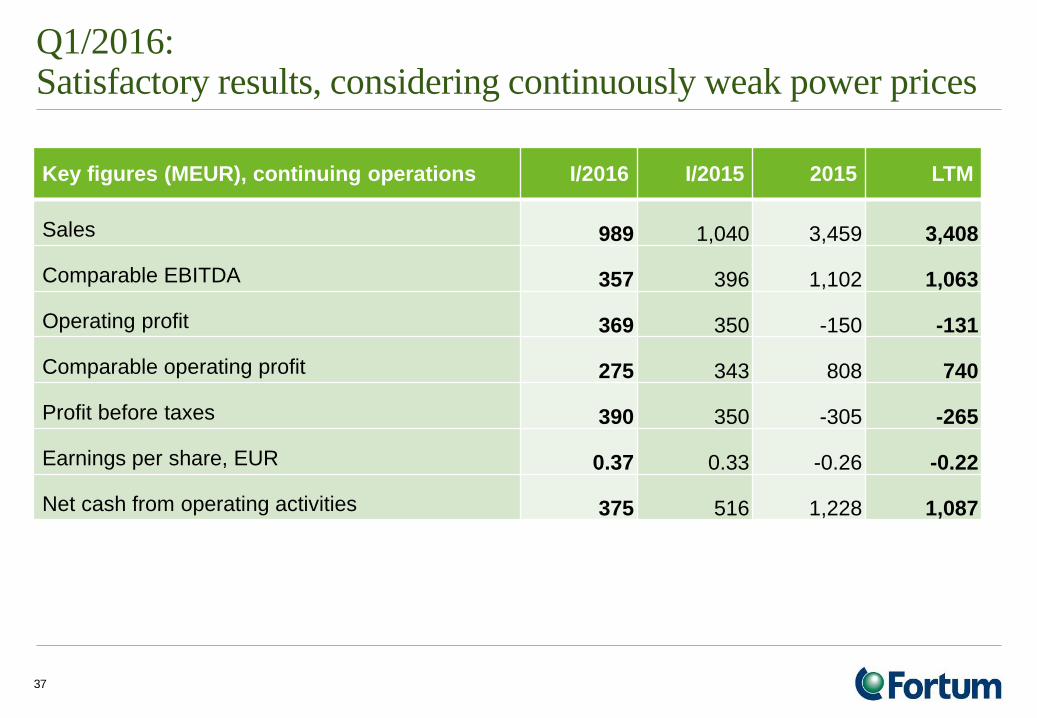
Q1/2016: Satisfactory results, considering continuously weak power prices
37
Key figures (MEUR), continuing operations I/2016 I/2015 2015 LTM
Sales 989 1,040 3,459 3,408
Comparable EBITDA 357 396 1,102 1,063
Operating profit 369 350 -150 -131
Comparable operating profit 275 343 808 740
Profit before taxes 390 350 -305 -265
Earnings per share, EUR 0.37 0.33 -0.26 -0.22
Net cash from operating activities 375 516 1,228 1,087

Summary of the first quarter of 2016
– The key factor currently influencing Fortum’s business performance is the low wholesale price of
electricity
– Highest ever first quarter hydro volumes 6.6 TWh • Nordic hydrological conditions were close to normal at the end of the first quarter of 2016, as the snow level was
below historical average
– The availability in nuclear was very good; utilisation rates were high in all our nuclear power plants
both in Finland and Sweden, 99% in average
– The multi-year investment programme in Russia was completed
– Continuing optimisation of our current fleet we sold the 665-MW Tobolsk CHP plant in Russia
– Fortum acquired the Polish electricity and gas sales company Grupa DUON S.A.
– We launched our new vision, strategic cornerstones as well as updated our financial targets. In
addition, we reorganised our business structure; and our new Executive Management Team has
been in place as of 1 April
38

Market conditions in the first quarter of 2016
39
Nordic countries
− Power consumption in the Nordic countries was higher than in Q1/2015 and
totalled 117 (110) TWh
− The average system spot price was EUR 24.0 (28.1) per MWh
• Higher hydro power production and a lower marginal cost of coal condense
− The average area price in Finland was EUR 30.4 (32.1) per MWh and in
Sweden (SE3 ) EUR 24.1 (28.6) per MWh
• Finnish prices were somewhat higher during the beginning of the quarter, but
decreased as a result of the opening of the Sweden-Lithuania power cable and
mild weather during the latter part of the quarter
Russia
− Power consumption in Fortum’s operating area in Russia was marginally
higher than in Q1/2015 and totalled 212 (211) TWh
− Electricity spot price (in RUB) in the Urals hub decreased by 3% compared to
Q1/2015
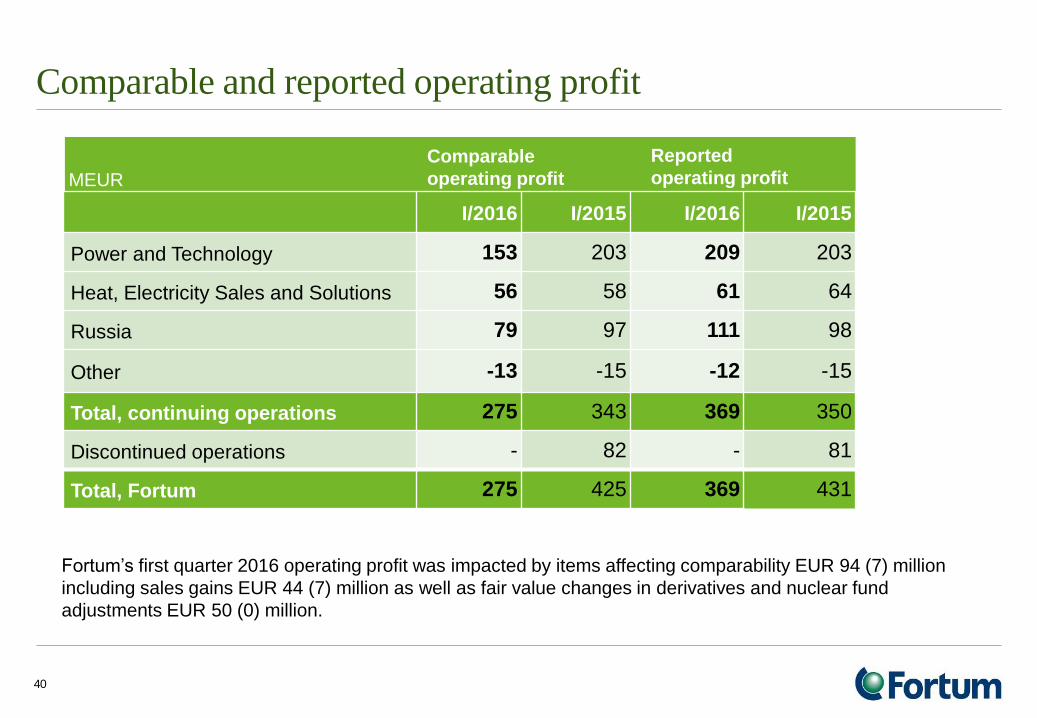
Comparable and reported operating profit
I/2016 I/2015 I/2016 I/2015
Power and Technology 153 203 209 203
Heat, Electricity Sales and Solutions 56 58 61 64
Russia 79 97 111 98
Other -13 -15 -12 -15
Total, continuing operations 275 343 369 350
Discontinued operations - 82 - 81
Total, Fortum 275 425 369 431
40
Comparable
operating profit
Reported
operating profit MEUR
Fortum’s first quarter 2016 operating profit was impacted by items affecting comparability EUR 94 (7) million
including sales gains EUR 44 (7) million as well as fair value changes in derivatives and nuclear fund
adjustments EUR 50 (0) million.
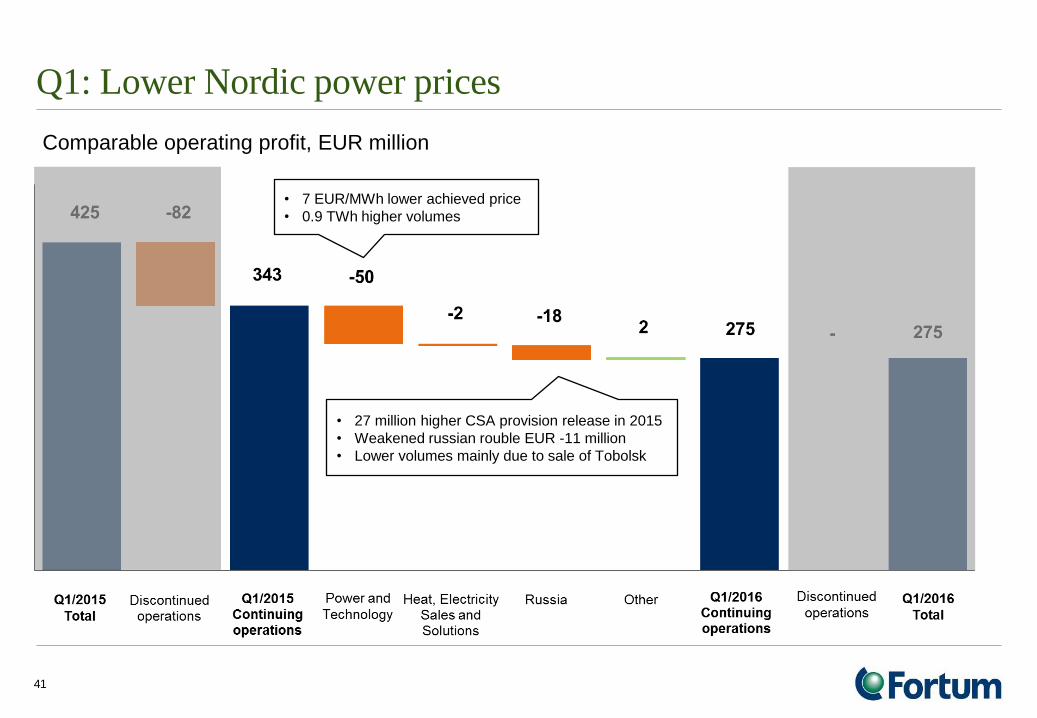
Q1: Lower Nordic power prices
41
Comparable operating profit, EUR million
• 7 EUR/MWh lower achieved price
• 0.9 TWh higher volumes
• 27 million higher CSA provision release in 2015
• Weakened russian rouble EUR -11 million
• Lower volumes mainly due to sale of Tobolsk

Income statement
MEUR I/2016 I/2015 2015 LTM
Sales 989 1,040 3,459 3,408
Other income and expenses -714 -697 -2,651 -2,668
Comparable operating profit 275 343 808 740
Items affecting comparability 94 7 -958 -871
Operating profit 369 350 -150 -131
Share of profit of associates and jv’s 67 58 20 29
Financial expenses, net -47 -57 -175 -165
Profit before taxes 390 350 -305 -265
Income tax expense -59 -55 78 74
Net profit, continuing operations 331 295 -228 -192
Net profit, discontinued operations - 63 4,369 4,306
Net profit, Fortum total 331 358 4,142 4,115
EPS, basic (EUR), continuing operations 0.37 0.33 -0.26 -0.22
EPS, basic (EUR), discontinued operations - 0.07 4.92 -
EPS, basic (EUR), Fortum Total 0.37 0.40 4.66 4.63
42
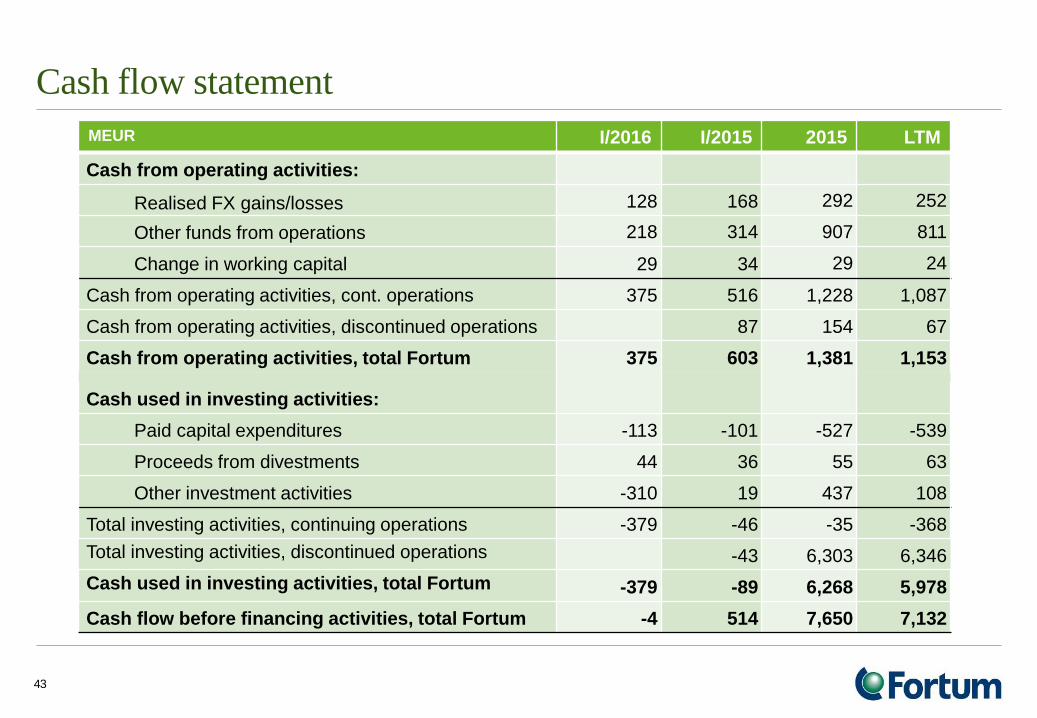
Cash flow statement
MEUR I/2016 I/2015 2015 LTM
Cash from operating activities:
Realised FX gains/losses 128 168 292 252
Other funds from operations 218 314 907 811
Change in working capital 29 34 29 24
Cash from operating activities, cont. operations 375 516 1,228 1,087
Cash from operating activities, discontinued operations 87 154 67
Cash from operating activities, total Fortum 375 603 1,381 1,153
Cash used in investing activities:
Paid capital expenditures -113 -101 -527 -539
Proceeds from divestments 44 36 55 63
Other investment activities -310 19 437 108
Total investing activities, continuing operations -379 -46 -35 -368
Total investing activities, discontinued operations
-43 6,303 6,346
Cash used in investing activities, total Fortum
-379 -89 6,268 5,978
Cash flow before financing activities, total Fortum -4 514 7,650 7,132
43

Debt portfolio and average interest rate at the balance sheet date March 31, 2016
1) In addition Fortum has received EUR 202 million based on Credit Support Annex agreements with several counterparties. This amount has been booked as a short term liability.
• Total interest-bearing debt
EUR 6,070 million
– Average interest 3.5%
(2015: 3.7%)
– Portfolio mainly in EUR and
SEK with average interest cost
2.4% (2015: 2.6%)
– EUR 677 million (2015: 641)
swapped to RUB, average
interest cost including cost for
hedging 12.7%
(2015: 12.8%)
0
250
500
750
1000
1250
1500
2016 2017 2018 2019 2020 2021 2022 2023 2024 2025 2026+
Bonds Financial institutions Other long-term debt Other short-term debt
Maturity profile
1)
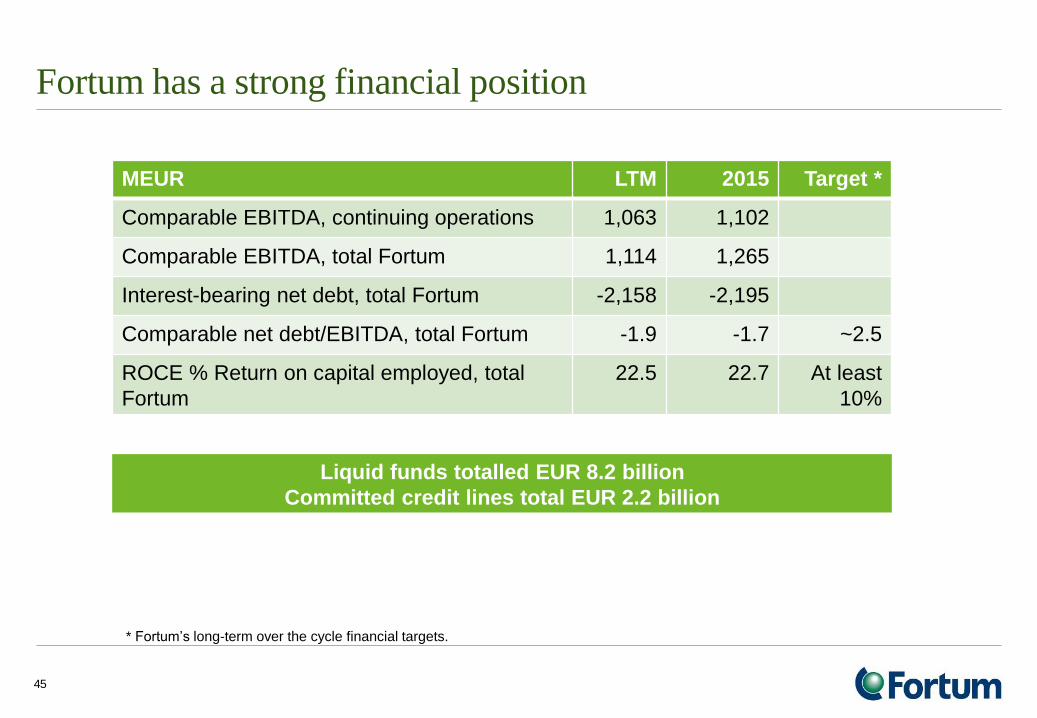
Fortum has a strong financial position
MEUR LTM 2015 Target *
Comparable EBITDA, continuing operations 1,063 1,102
Comparable EBITDA, total Fortum 1,114 1,265
Interest-bearing net debt, total Fortum -2,158 -2,195
Comparable net debt/EBITDA, total Fortum -1.9 -1.7 ~2.5
ROCE % Return on capital employed, total
Fortum
22.5 22.7 At least
10%
45
Liquid funds totalled EUR 8.2 billion
Committed credit lines total EUR 2.2 billion
* Fortum’s long-term over the cycle financial targets.

Outlook
46
Nordic markets
• Fortum continues to expect that the annual electricity demand growth will be
approximately 0.5% on average in the coming years
• Electricity is expected to continue to gain share of total energy consumption
Russia
• The targeted operating profit (EBIT) level of RUB 18.2 billion in the Russia
segment is targeted to be reached during 2017-2018
Annual capex estimate, excluding potential acquisitions
• 2016 approximately EUR 650 million (maintenance capex approximately
EUR 300-350 million)
Hedging
• Rest of 2016 approx. 60% hedge ratio at approx. EUR 30/MWh
• 2017 approx. 30% hedge ratio at approx. EUR 28/MWh
Taxation
• Effective tax rate for 2016 for the Group 19-21%

Fortum Investor Relations and Financial Communications For more information, please visit www.fortum.com/investors
Follow us on:
www.slideshare.net/FortumCorporation/
www.twitter.com/Fortum www.linkedin.com/company/fortum
Fortum ForEnergy blog at
http://fortumforenergyblog.wordpress.com www.youtube.com/user/fortum
Sophie Jolly Vice President
+358 (0)10 453 2552
Rauno Tiihonen
Manager
+358 (0)10 453 6150
Marja Mäkinen Manager (SRI)
+358 (0)10 452 3338
Måns Holmberg Manager (Financial
Communications & Private investors)
+358 (0)10 452 1111
Next events:
Q2/2016 results on 20 July 2016
47
Meeting requests:
Arja-Tuula Tiainen Executive Assistant
+358 (0)10 453 4487