Embed Size (px)
Citation preview

Investor and Analyst Presentation
Q2 2017

1. This presentation may contain certain forward-looking statements, including assumptions, opinions
and views of the Company or cited from third party sources. Various known and unknown risks,
uncertainties and other factors could cause the actual results, financial position, development or
performance of the Company to differ materially from the estimations expressed or implied herein.
2. The Company does not guarantee that the assumptions underlying such forward-looking statements
are free from errors nor does the Company accept any responsibility for the future accuracy of the
opinions expressed in this presentation or the actual occurrence of the forecast development.
3. No representation or warranty (express or implied) is made as to, and no reliance should be placed
on, any information, including projections, estimates, targets and opinions, contained herein, and no
liability whatsoever is accepted as to any errors, omissions or misstatements contained herein, and,
accordingly, none of the Company or any of its parent or subsidiary undertakings or any of such
person‘s officers, directors or employees accepts any liability whatsoever arising directly or indirectly
from the use of this document.
Disclaimer
2 Q2 2017 Earnings

Agenda
3
1. Introduction
2. Strategic objectives
3. Q2 2017 highlights
4. Outlook
5. Backup
Q2 2017 Earnings

Pharmaceutical packaging solutions made out of glass and plastics
Primary packaging products and medical devices for storage, dosage and safe administration
of drugs as well as packaging for the cosmetics industry
A leading international manufacturer for the global pharma and
healthcare industry
4 Q2 2017 Earnings

33
24
26
15 2
Strong business foundations, efficient and lean organisation
with a strong track record
5
Plastics & Devices
Andreas Schütte
REVENUE SPLIT BY SECTOR
Pharma & Healthcare: 83%
Cosmetics: 12%
Others: 5%
5
12
83
1. According to IMS Health definition of emerging markets for FY 2016. For further details see note 8 of consolidated financial
statements within FY 2016 annual report
Primary Packaging Glass
Uwe Röhrhoff
Revenues
2016
EUR 610.6m
adj. EBITDA
2016
EUR 124.7m
Margin
2016
20.4%
Revenues
2016
EUR 765.4m
adj. EBITDA
2016
EUR 204.0m
Margin
2016
26.6%
Solid financial profile
Leading market positions in
attractive niche markets
Revenues
FY 2016
EUR 1,375.5m
adj. EBITDA
FY 2016
EUR 307.8m
Strong Cash Flow generation
and lower capital intensity
Adj. EPS after non-controlling interests in
FY 2016
(excl LSR)
EUR 4.07
#1 in Europe for plastic
packaging and
inhalation
#1 in the US for
prescription and
injectables
#2 in Europe for
diabetes, pens
and syringes
Strong emerging market
presence in South America,
India and China for plastic
packaging, pens, moulded
glass, ampoules, vials and
cartridges
REVENUE SPLIT BY REGIONS
Europe (ex. GER): 33%
Germany: 24%
Americas: 26%
Emerging markets1: 15%
Other regions: 2%
Well invested assets &
factories, solid customer
basis
36 plants in
14 countries
Delivering to
97 countries over 5
continents
Over
1500
customers
Supplying all
Top 10 Pharma customers
Focus on Pharma and
Cosmetics
Stable and balanced customer
basis
Homogenous business
portfolio with clear
strategic focus
Largest customer make up for less than 7% of
total revenues
Greater revenue
diversification post LSR
disposal
Q2 2017 Earnings

Leading market positions in attractive niche markets
6
DIVISION PLASTICS & DEVICES PRIMARY
PACKAGING GLASS
PRODUCT Plastic
Packaging1 Inhalation
(DPI)2 Diabetes
Diagnostics3 Pens Syringe
Systems
MG Pharma
(Type I)
Ampoules, Vials,
Cartridges
EUROPE #1 #1 #2 #2 #2 #2 #3
NORTH
AMERICA #1 #1 #2 #1 #1
EMERGING
MARKETS
#1 (South America
and India)
#1 (South
America)
#2 (India)
#1 (China)
1. North America: plastic vials for oral prescription drugs
2. DPI = Dry Powder Inhaler (World market)
3. Lancets and lancing devices
Q2 2017 Earnings

We provide solutions across all key product categories
7
DIVISION PLASTICS & DEVICES PRIMARY PACKAGING GLASS
PRODUCT Plastic
Packaging Inhalation
(DPI)2 Diabetes
Diagnostics3 Pens Syringe
Systems
MG Pharma
(Type I)
OTC Liquids and Syrups (Type II &
III)
TG Injectables
Gerresheimer
Schott
Becton Dickinson1
Nipro1
Ompi
Jabil Circuit (Nypro)1
Consort Medical1
West Pharma1
Nemera
Berry Plastics1
Facet
Ypsomed1
Desjonquères
Rocco Bormioli
Duran
Corning1
1. Public company // 2. DPI = Dry Powder Inhaler (World market) // 3. Lancets and lancing devices
Source: Company estimates
Q2 2017 Earnings
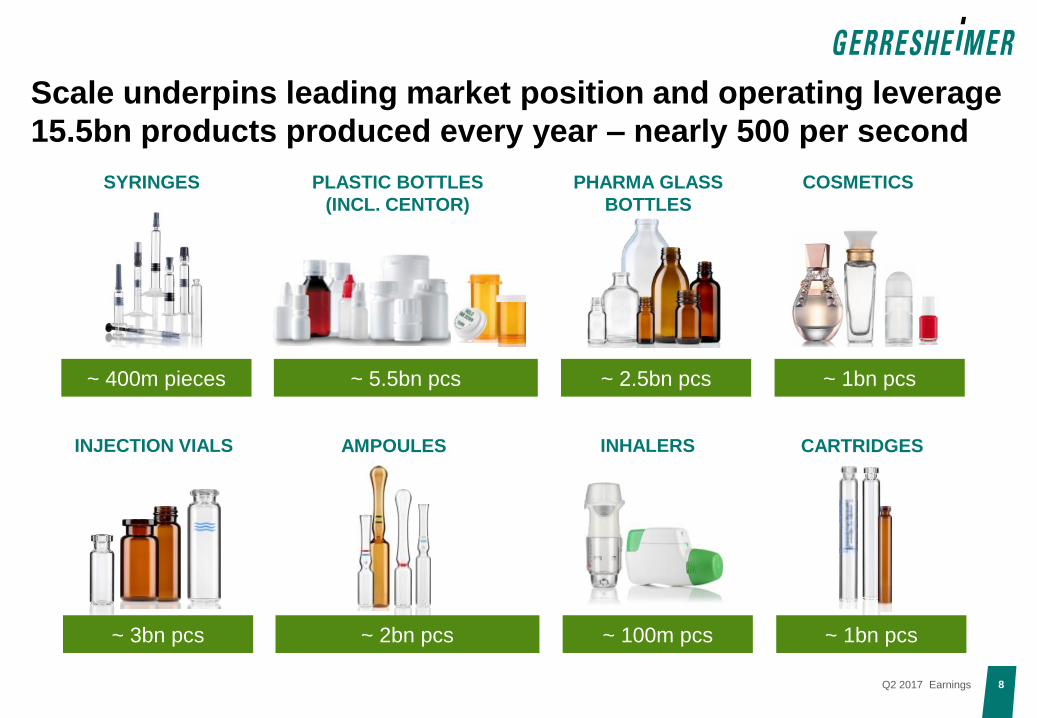
Scale underpins leading market position and operating leverage
15.5bn products produced every year – nearly 500 per second
INHALERS AMPOULES
8
CARTRIDGES INJECTION VIALS
~ 400m pieces
PLASTIC BOTTLES
(INCL. CENTOR)
PHARMA GLASS
BOTTLES
COSMETICS SYRINGES
~ 5.5bn pcs ~ 2.5bn pcs ~ 1bn pcs
~ 3bn pcs ~ 2bn pcs ~ 100m pcs ~ 1bn pcs
Q2 2017 Earnings

MIX PRODUCTIVITY AND
EFFICIENCY
Working on 3 main levers to protect and build margins
9
Mix management
Higher value products
Direct impact on operational
leverage
Increase contribution margin
through higher volumes
Increasing productivity
Labour
Machines
Higher yields
Driving manufacturing efficiencies
VOLUME GROWTH
PRICING
COST INFLATION
Cost inflation mainly through personal costs
Pass through clauses as mitigating actions
Pricing as a function of volumes
Q2 2017 Earnings

207
308
2011 2016
Organic expansion and
M&A are both pillars of our
growth strategy
Solid revenues increase
over the past 5 years
despite annual
fluctuations, outpaced by
superior profitability and
earnings growth
Combination of organic growth,
productivity gain, accretive M&A
and portfolio improvements deliver
superior earnings growth
Relentless focus on
driving profitable growth
whilst keeping patient
safety and innovation as a
priority
11.5%
5.4%
1.9%
6.2% 7,2%
2012 2013 2014 2015 2016
Ability to deliver solid earnings growth due to our robust
business model despite fluctuations in revenues growth
10
2.39
4.07
2011 2016
Revenues growth ex. LSR1 % yoy
Adj. EBITDA ex. LSR1 (EUR m)
Adj. EPS1,2 ex. LSR (EUR )
CAGR 2011-2016 6.4% CAGR 2011-2016 8.3% CAGR 2011-2016 11.2%
1. As reported
2. After non-controlling interests
Q2 2017 Earnings

Agenda
11
1. Introduction
2. Strategic objectives
3. Q2 2017 highlights
4. Outlook
5. Backup
Q2 2017 Earnings

Long term growth drivers such as globalization and population
increase underpinned by megatrends in pharma and healthcare
12
Seizing opportunity to participate in any market trends
GENERICS
HEALTHCARE
SYSTEMS
PHAMERGING
MARKETS
SELF MEDICATION
RISE OF CHRONIC
DISEASES
NEW MEDICINES
MARKET ENTRIES
INCREASING REGULATORY
REQUIREMENTS
Q2 2017 Earnings

Targeted market approach
13
Large pharma companies
Generics producers
Small and medium Specialty and Biotech
companies
Zero defects requirements
Productivity and supply chain reliability
Reliable support across the globe
Global capacities and production network
Largest range of product solutions
Technical and regulatory expertise
Segmenting
Customer
Landscape
QUALITY
MARKET
ACCESS
AGILITY
Understanding
specific clients
requirements
Continuing to
synchronise our
strategy to meet
the needs of our
customers
Q2 2017 Earnings

Addressing specialty pharma market opportunity
14
Elite & Valor RTU Vials & cartridges
Glass product portfolio systematically upgraded
New value proposition for Biotech & new organisation
Syringes product range continuously enhanced
Gx Baked-on
RTF® syringes Metal-free glass
syringes
Tamper evident closures
/ Needle shields
Plastic COP
syringes Safety devices
Growing niche market
Emergence of new actors requiring
packaging and regulation expertise
Gx solutions set up in H1 2017
Spanning across all divisions with a
product and business development focus
Q2 2017 Earnings

Agenda
15
1. Introduction
2. Strategic objectives
3. Q2 2017 highlights
4. Outlook
5. Backup
Q2 2017 Earnings

Soft performance in Q2 2017, as previously communicated
16
Continuing to expect improved revenues and earnings contribution in H2 2017
Q2 revenues down 2.2% year-on-year at EUR 339.5m Revenues decrease in line with Q1 business trends, albeit at a softer pace
Down 3.7% organic
Adj. EBITDA margin of 22.3% in Q2 2017 against 23.2% in Q2 2016
Margin in Plastics & Devices maintained at a high level
Significant improvement of margin in Primary Packaging Glass versus Q1 2017, but cycling high
comparables versus Q2 2017
Better indication of demand going forward, based on current order book
Expecting to return to growth in H2 2017
Q4 2017 anticipated as the strongest quarter in terms of revenues and profitability contributions
Q2 2017 Earnings

Demand fluctuations & shifts into H2 as main drivers behind
revenues decrease in Q2 2017
17
347,3 339,5
193,2 185,8 154,3 153,7
Q2 16 Q2 17 Q2 16 Q2 17 Q2 16 Q2 17
Evolution of Revenues and Adj. EBITDA margin in Q2 17 vs Q2 16
% EBITDA Margin 27.0% 22.7% 20.4% 27.0% 23.2% 22.3%
Group P&D PPG
Systems & Devices sales continued to be affected
by lower customer demand and postponements
into H2
Tooling revenues down year-on-year
Top line growth for Plastic Packaging
Lower tooling revenues and pricing mechanisms
support margin stability year-on-year
P&D Q2 2017 REVIEW
Weaker demand in the US
Modest organic growth posted outside the US
Profitability impacted by reduced production output
and lower utilization year-on-year, on the back of
strong Q2 2016 comparable.
PPG Q2 2017 REVIEW
Q2 2017 Earnings

Improved visibility for remainder of the year
18
Group quarterly
revenues trends
2017/2016
Q1 2017
-2,2%
-5,4%
Q2 2017
Q3 2017
Q4 2017
Moving into
positive territory
Revenues shifts in Devices from H1 into H2
Strong tooling pipeline to drive higher sales
Primary packaging with solid developments
IDENTIFIED DRIVERS H2 2017 P&D
Normalizing of US demand to drive sales growth
in H2
Europe and cosmetics with further solid
developments
Favourable comparables vs H2 2016 (furnace
repair Tettau)
IDENTIFIED DRIVERS H2 2017 PPG
Q2 2017 Earnings

Agenda
19
1. Introduction
2. Strategic objectives
3. Q2 2017 highlights
4. Outlook
5. Backup
Q2 2017 Earnings

1. FXN growth: At const. FX rates, based on FY 2016 reported numbers - Average budgeted exchange rate assumption for FY 2017: EUR 1.00 = USD 1.10
2. Organic growth: Adjusted for exchange rate effects, acquisitions and divestments 3. Excluding LSR
The short and longer term view: Driving earnings and cash
growth, while top line targets remain ambitious
20
2017 GUIDANCE REPORTED FY 2016 EXPECTED FY 2017 PRECISION POST Q2
Revenues EUR 1,375.5m ~ EUR 1.43bn (FXN1 - plus/minus EUR 25m)
Starting at lower end of the range ~ EUR 1.4bn (FXN1)
Adj. EBITDA EUR 307.8m ~ EUR 320m (FXN1 - plus/minus EUR 10m) ~ EUR 320m (FXN1)
Adj. EPS (after non-controlling interests) EUR 4.073 EUR 4.20 – EUR 4.55 ~ EUR 4.25
Capex (% sales, FXN) 1 8.2%3 ~8% (FXN1)
OTHER OBJECTIVES FY 2018 REPORTED FY 2016 EXPECTED FY 2018 (FXN1) PRECISION POST Q2
Organic2 sales growth CAGR 2017-2018 2.9% (vs FY 2015) 4% to 5%
Adj. EBITDA margin 22.4% ~ 23%
Capex (% sales, FXN) 8.2%3 ~ 8%
Avg NWC (% sales, FXN) 15.8%3 16%
Op. CF margin (% sales, FXN) 14.3% ~13%
MID TO LONG TERM GOALS REPORTED FY 2016 EXPECTED MID TO LONG TERM PRECISION POST Q2
Leverage 2.6x ~2.5x
ROCE 12.6% >12%
Dividend policy (as % of adj. NI ex non-controlling interests)
24.9% 20% to 30%
Q2 2017 Earnings

Clear focus on execution for the mid and long term
21
Ongoing strict monitoring of order book, product ramp up and contract execution
Dedicated management of operations to balance key drivers of margin performance
Continuing to lay important ground work to support growth strategy in the long term
Long-term mega trends unchanged, contributing to shape business and growth environment
for the future
Q2 2017 Earnings

Backup Q2 2017
Q2 2017 Earnings

P&D margins maintained at a high level, PPG margins impacted
by lower production output during the quarter
23
Revenues by division
EUR M Q2 2017 Q2 2016 GROWTH IN %
Organic
Growth in %
Total Group 339.5 347.3 -2.2 -3.7
- Of which P&D 185.8 193.2 -3.8 -5.9
- Of which PPG 153.7 154.3 -0.4 -1.1
Q2 2017 Q2 2016
EUR M MARGIN IN % EUR M MARGIN IN %
Total Group 75.8 22.3 80.7 23.2
- Of which P&D 50.2 27.0 52.2 27.0
- Of which PPG 31.4 20.4 35.0 22.7
Adjusted EBITDA by division
Q2 2017 Earnings

EUR M MAY 31, 2017 NOV 30, 2016 CHANGE IN %
Total assets 2,289.3 2,374.3 -3.6%
Equity 752.0 763.3 -1.5%
Equity ratio 32.9% 32.1% +80bps
Net working capital 230.4 200.3 + 15.0%
NWC in % of LTM revenues2 17.1% 14.6% +250bps
Average NWC in % of LTM revenues2,3 16.4% 15.8% -60bps
Increase in net debt reflects dividend and interest payments,
leverage at 2.7x
24
1. As reported, that is including LSR for Q2 2016
2. Excluding LSR for all periods
3. In percentage of FXN revenues
EUR M H1 2017 H1 2016 CHANGE IN %
Operating Cash Flow2 68.6 87.0 -21.2%
Operating CF in % of revenues2,3 10.7% 12.9% -220bps
Capex in % of revenues2,3 5.5% 5.1% +40bps
EUR M MAY 31, 2017 NOV 30, 2016 CHANGE IN %
Net debt 812.6 788.2 +3.1%
Leverage 2.7x 2.6x +0.1x
Q2 2017 Earnings

Backup FY 2016
Q2 2017 Earnings

FY 2016 increase driven by Plastics & Devices; balanced organic
growth profile across both divisions
26
Revenues by division
EUR M FY 2016 FY 2015 GROWTH IN %
ORGANIC
GROWTH1,2 IN %
Total Group 1,375.5 1,282.9 7.2 2.9
- Of which P&D 765.4 645.3 18.6 3.0
- Of which PPG 610.6 651.0 -6.2 2.7
1. Organic growth: At const. FX rates and adjusted for acquisitions, divestments and optimization of business portfolio
2. Average budgeted exchange rate assumption for FY 2016 was: EUR 1.00 = USD 1.12
EUR M Q4 2016 Q4 2015 GROWTH IN % ORGANIC
GROWTH1,2 IN %
Total Group 357.6 350.8 2.0 4.7
- Of which P&D 199.4 186.1 7.2 7.2
- Of which PPG 158.3 167.3 -5.3 1.9
Q2 2017 Earnings

Strong margin expansion at Group level, driven by Plastics and
Devices and continued productivity improvements
27
FY 2016 FY 2015
EUR M MARGIN IN % EUR M MARGIN IN %
Total Group 307.8 22.4 262.6 20.5
- Of which P&D 204.0 26.6 141.6 21.9
- Of which PPG 124.7 20.4 143.7 22.1
Adjusted EBITDA by division
Q4 2016 Q4 2015
EUR M MARGIN IN % EUR M MARGIN IN %
Total Group 82.5 23.1 81.9 23.3
- Of which P&D 55.3 27.7 48.2 25.9
- Of which PPG 31.6 19.9 40.5 24.2
Q2 2017 Earnings

Net financial debt reduction achieved, Group’s leverage target
almost reached a year ahead
28
878 788
2,9
2.6
2,0 2,2 2,4 2,6 2,8 3,0 3,2 3,4 3,6 3,8 4,0
0 10 20 30 40 50 60 70 80 90 100 110 120 130 140 150 160 170 180 190 200 210 220 230 240 250 260 270 280 290 300 310 320 330 340 350 360 370 380 390 400 410 420 430 440 450 460 470 480 490 500 510 520 530 540 550 560 570 580 590 600 610 620 630 640 650 660 670 680 690 700 710 720 730 740 750 760 770 780 790 800 810 820 830 840 850 860 870 880 890 900
FY 2015 FY 2016
Net Debt(2)
Leverage (x)(1)
Net Debt decreased by EUR 89.3m as a result of improved
adj. EBITDA and increased cash generation
Leverage ratio decreased from 2.9x to 2.6x
Well on track to reach leverage target profile of 2.5x
IN EUR M FY 2016 FY 2015
Drawn portion of RCF 162.7 232.8
Bonded Loans (Schuldschein) 425.0 425.0
Bonds 300.0 300.0
Local borrowings and leasing 18.9 13.4
Cash and cash equivalents 118.4 93.7
Total net financial debt 788.2 877.5
Bonded loans (Schuldschein): fixed/variable interest rates,
currently between 0.75% and 2.04%;
(maturity in 2020, 2022 and 2025)
Bond: Fixed annual coupon of 5.0% (matures in May 2018)
Revolving bank debt: total capacity EUR 450m;
variable interest rate
Net debt and financial leverage1 Net debt summary
1. Leverage: The relation of net financial debt to adjusted EBITDA of the preceding twelve months, according to the current credit
facility agreement
2. Net Debt defined as: Short and long term debt minus cash and cash equivalent
Q2 2017 Earnings

GXI Key Data
29
in EUR per share 2008 2009 2010 2011 2012 2013 2014 2015 2016
Adjusted EPS after
non-controlling
interests
1.83 1.34 1.95 2.44 2.621 3.08 2.89 3.41 4.072
Cash flow from
operating activities per
share
5.26 3.74 5.09 4.13 5.53 4.67 5.04 6.49 5.52
Dividend 0.40 – 0.50 0.60 0.65 0.70 0.75 0.85 1.05
Dividend yield 1.5% – 1.8% 1.9% 1.7% 1.4% 1.7% 1.2% 1.5%
Payout ratio 22% – 26% 25% 25%1 23% 26% 25% 25%
Share price high 38.20 27.05 29.85 36.62 41.34 50.14 56.42 76.32 76.86
Share price low 23.99 13.24 22.09 28.30 31.00 37.60 42.31 41.99 57.10
Share price at FY end 27.10 23.05 28.20 31.17 39.41 49.67 44.44 73.90 68.85
Book value per share 15.26 15.29 16.86 17.59 17.14 17.94 19.25 22.23 24.31
P/E ratio3 14.81 17.20 14.46 12.77 15.041 16.13 15.38 21.67 16.31
Market cap in EUR m 851 724 886 979 1,238 1,560 1,395 2,321 2,162
MDAX weighting year
end 11.48%4 1.33% 1.24% 1.40% 1.47% 1.33% 1.01% 1.42% 1.33%
Number of shares in
million 31.4 31.4 31.4 31.4 31.4 31.4 31.4 31.4 31.4
1. Retrospective restatement due to the early adoption of IAS 19 (amended in 2011) from December 1, 2012
2. Excluding LSR
3. Based on adj. EPS after non-controlling interests
4. SDAX weighting at year end
Q2 2017 Earnings

30
Overview of Abbreviations and Definitions
Abbreviations and Definitions
Adj. EBITDA Earnings before income taxes, net finance expense, amortization of fair value adjustments, depreciation and amortization, impairment losses, restructuring
expenses and one-off income and expenses
Adjusted EPS Adjusted net income divided by 31.4m shares
Adjusted net income Consolidated net income before non-cash amortization of fair value adjustments, restructuring expenses, impairment losses, one-off income and
expenses (including non-cash expenses) and the related tax effects.
CAGR Compound Annual Growth Rate
Capex Investments in tangible and intangible assets
EBIT Earnings before interest and taxes
EBITA Earnings before interests, taxes and amortization
EBITDA Earnings before interests, taxes and depreciation and amortization
FXN "Foreign currency neutral" - based on budgeted FX-rates
Leverage The relation of net financial debt to adjusted EBITDA of the preceding twelve months, according to the current credit facility agreement.
Net debt Short and long term debt minus cash and cash equivalents
Net finance expense Interest income and expenses and related to the net financial debt of the Gerresheimer Group. It also includes net interest expenses for pension provisions
together with exchange rate effects from financing activities and from related derivative hedges.
Net working capital
(NWC)
Inventories plus trade receivables minus trade payables plus/minus prepayments
Op. CF margin Adjusted EBITDA plus/minus the change in net working capital, minus capex and in relation to revenues
Operating cash Flow Adjusted EBITDA plus/minus change in net working capital, minus capex
P/E Ratio Company's share price divided by the adj. EPS after non-controlling interests
RCF Revolving credit facility
ROCE Adjusted EBITA divided by capital employed (total assets minus investments, investments accounted for using the equity method and other loans, minus
cash and cash equivalents, minus pensions (without pension provisions), deferred tax liabilities, and income tax liabilities, minus prepayments received,
trade payables, and other non- interest bearing liabilities)
yoy year-on-year
Q2 2017 Earnings

Financial calendar and contact details
31
FINANCIAL CALENDAR
October 11, 2017 Interim Report 3rd Quarter 2017
CONTACT DETAILS
Name Corporate Investor Relations
Phone +49 211 6181 257
Fax +49 211 6181 121
E-mail [email protected]
IR website https://www.gerresheimer.com/en/investor-
relations
Q2 2017 Earnings

Our Vision
Gerresheimer will become the leading global partner
for enabling solutions that improve health and well-being.
Our success is driven by the passion of our people.