Embed Size (px)
Citation preview
Investor Briefing New York City, Palace Hotel
Copyright © OpenText Corporation. All rights reserved.
Mark J. BarrenecheaOpenText President & CEO
September 6th, 2012
Safe Harbor Statement
Certain statements in this presentation constitute forward-looking statements or forward-looking information within the meaning of applicable securities laws (“forward-looking statements”). Such forward-looking statements involve known and unknown risks, uncertainties and other factors that may cause the actual results, performance or achievements of Open Text, or developments in Open Text’s business or in its industry, to differ materially from the anticipated results, performance, achievements or developments expressed or implied by such forward-looking statements. The historical increases in the Company's revenues and earnings do not assure the revenues and earnings will not decrease in the future. Forward-looking statements include all disclosure regarding possible events, conditions or results of operations that is based on assumptions about future economic conditions and courses of operations that is based on assumptions about future economic conditions and courses of action. Forward-looking statements may also include any statement relating to future events, conditions or circumstances. Open Text cautions you not to place undue reliance upon any such forward-looking statements, which speak only as of the date they are made. Forward-looking statements relate to, among other things, changes in the EIM market; the market focus of Open Text, Open Text’s revenue mix and margin targets; Open Text’s operations priorities; and Open Text’s strategy for its products and solutions. The risks and uncertainties that may affect forward-looking statements include, among others, the completion and integration of acquisitions, the possibility of technical, logistical or planning issues in connection with deployments, the continuous commitment of Open Text's customers, demand for Open Text's products and other risks detailed from time to time in Open Text's filings with the Securities and Exchange Commission and Canadian provincial securities regulators, including Open Text's Annual Report on Form 10-K for the year ended June 30, 2012. Forward-looking statements are based on management’s current plans, estimates, projections, beliefs and opinions, and the Company does not undertake any obligation to update forward-looking statements should assumptions related to these plans, estimates, projections, beliefs and opinions change.
2
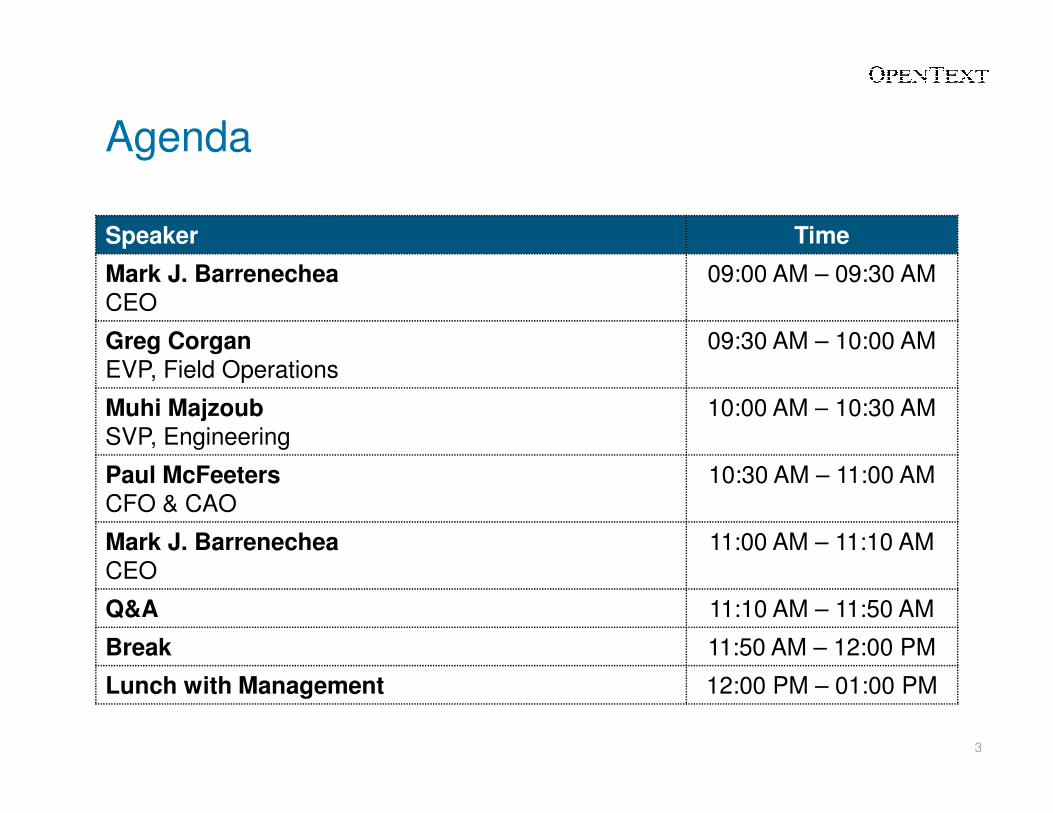
Agenda
Speaker Time
Mark J. BarrenecheaCEO
09:00 AM – 09:30 AM
Greg Corgan
EVP, Field Operations09:30 AM – 10:00 AM
Muhi Majzoub 10:00 AM – 10:30 AM
3
Muhi Majzoub SVP, Engineering
10:00 AM – 10:30 AM
Paul McFeeters
CFO & CAO10:30 AM – 11:00 AM
Mark J. Barrenechea
CEO11:00 AM – 11:10 AM
Q&A 11:10 AM – 11:50 AM
Break 11:50 AM – 12:00 PM
Lunch with Management 12:00 PM – 01:00 PM
What You Will Hear Today
� Expanded Market Opportunity - EIM
� Growth Plans: Revenue, License, Earnings
� Expanded Management Team
� Innovation Strategy� Innovation Strategy
� Fiscal 2013 target model
4
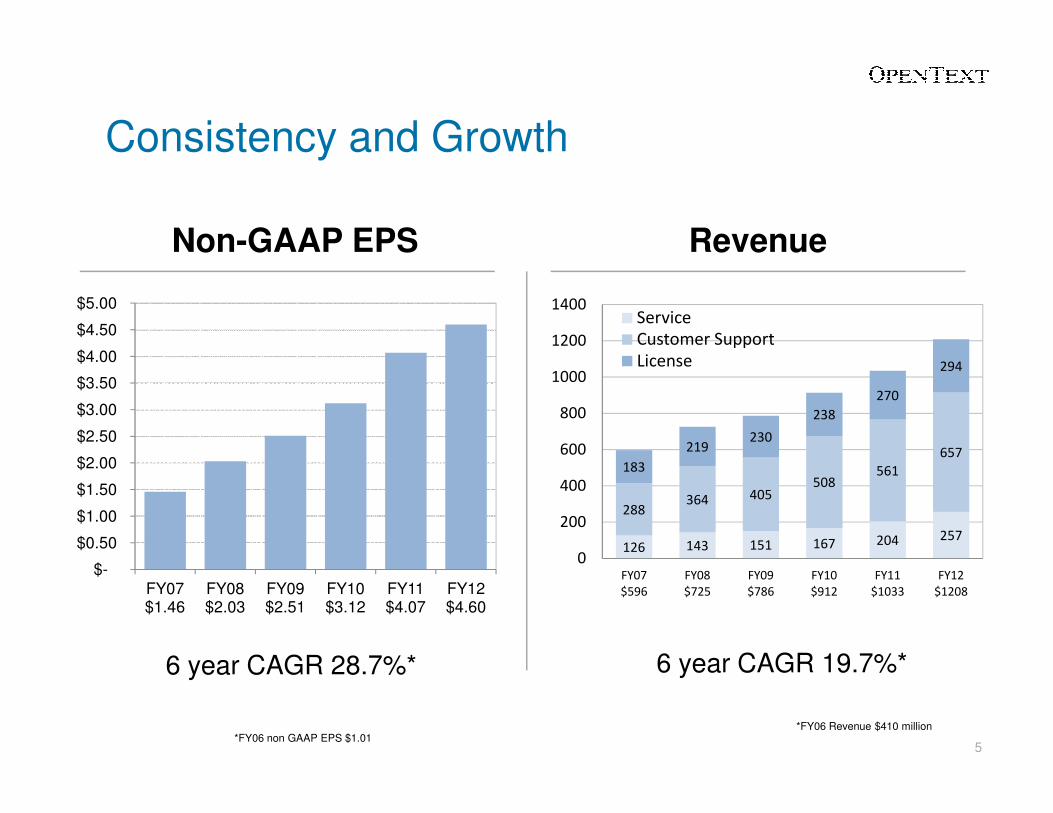
Consistency and Growth
238
270
294
800
1000
1200
1400Service
Customer Support
License
Non-GAAP EPS Revenue
$3.00
$3.50
$4.00
$4.50
$5.00
5
126 143 151 167 204 257
288364 405
508561
657183
219230
238
0
200
400
600
800
FY07
$596
FY08
$725
FY09
$786
FY10
$912
FY11
$1033
FY12
$1208
6 year CAGR 28.7%* 6 year CAGR 19.7%*
$-
$0.50
$1.00
$1.50
$2.00
$2.50
$3.00
FY07 $1.46
FY08$2.03
FY09$2.51
FY10$3.12
FY11$4.07
FY12$4.60
*FY06 Revenue $410 million*FY06 non GAAP EPS $1.01
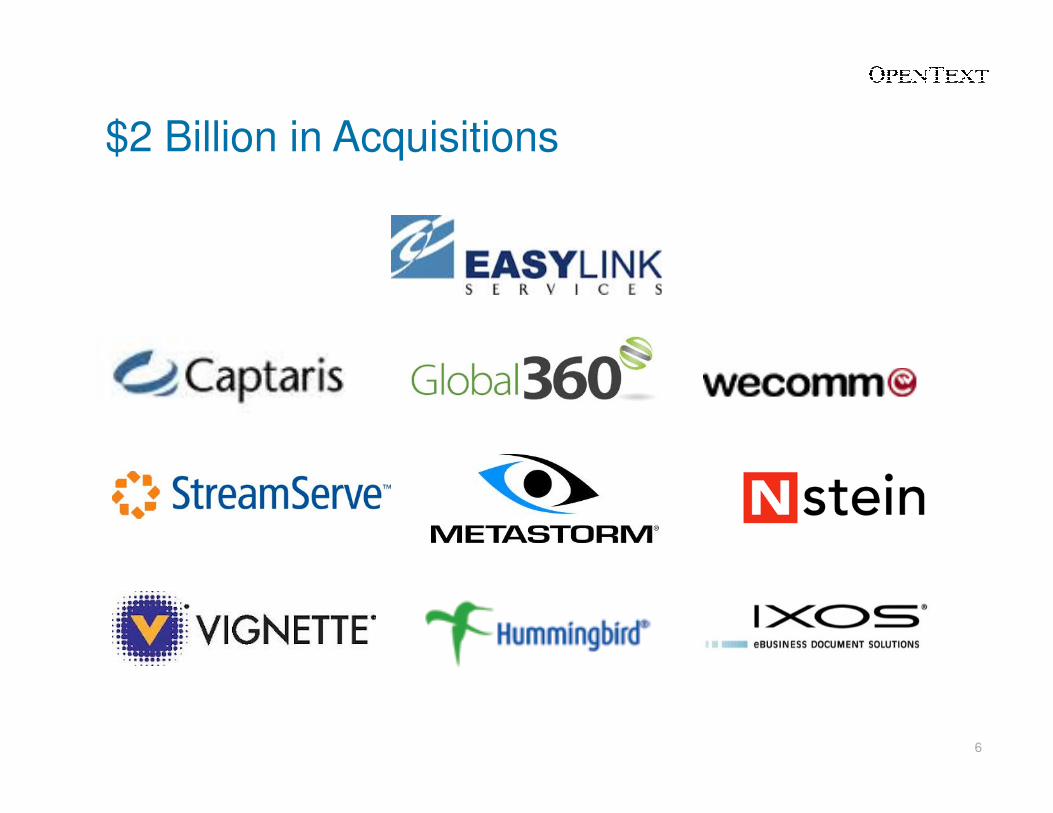
$2 Billion in Acquisitions
6
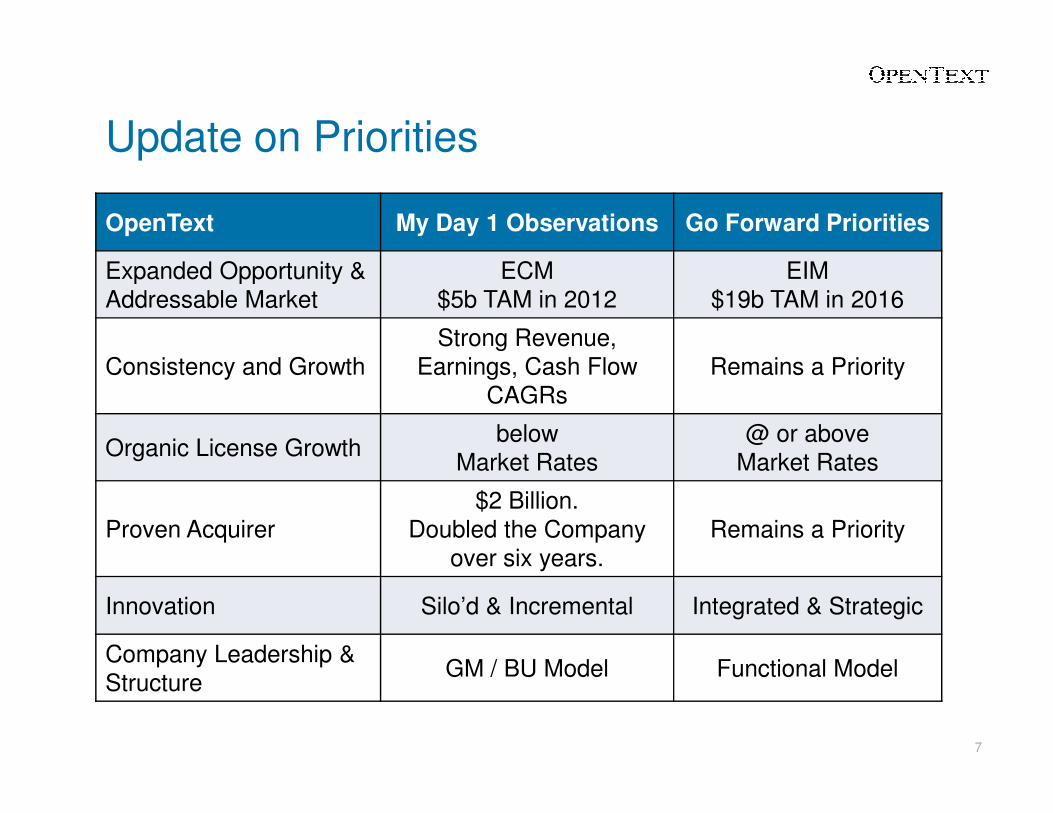
OpenText My Day 1 Observations Go Forward Priorities
Expanded Opportunity &Addressable Market
ECM$5b TAM in 2012
EIM$19b TAM in 2016
Consistency and GrowthStrong Revenue,
Earnings, Cash Flow CAGRs
Remains a Priority
Update on Priorities
7
CAGRs
Organic License Growthbelow
Market Rates@ or above
Market Rates
Proven Acquirer$2 Billion.
Doubled the Company over six years.
Remains a Priority
Innovation Silo’d & Incremental Integrated & Strategic
Company Leadership & Structure
GM / BU Model Functional Model
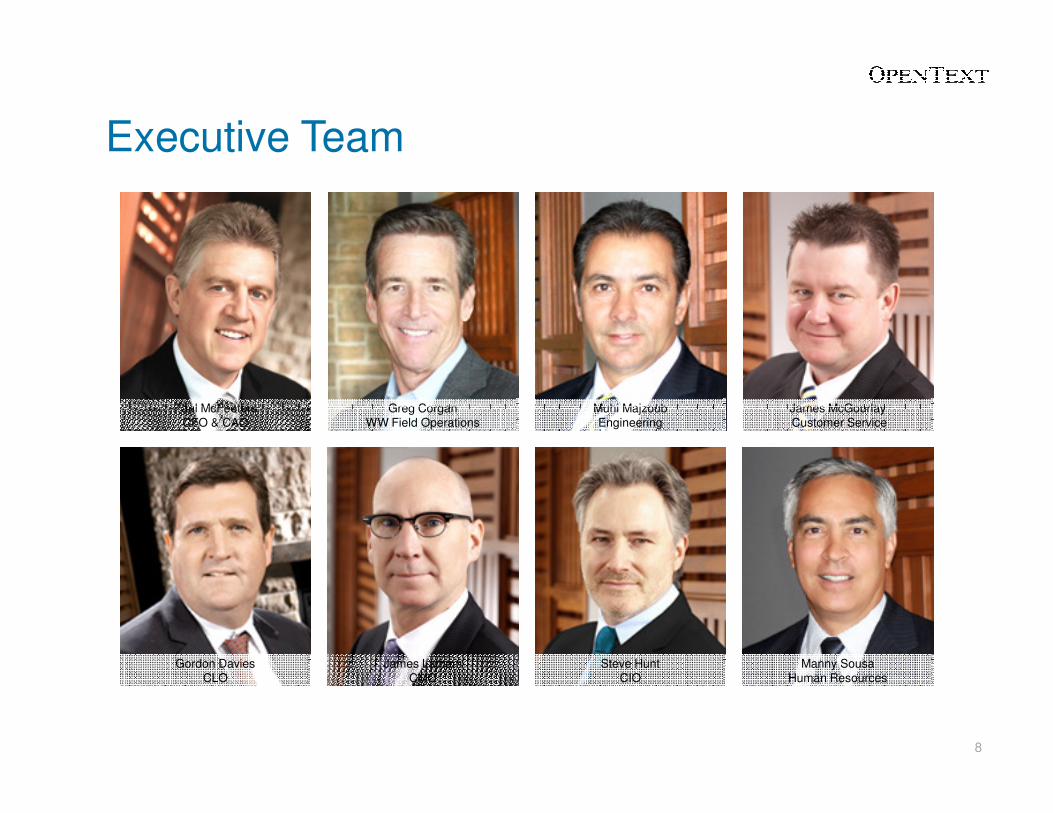
Executive Team
Paul McFeeters Greg Corgan Muhi Majzoub James McGourlay
8
Paul McFeetersCFO & CAO
Gordon DaviesCLO
Greg CorganWW Field Operations
Muhi MajzoubEngineering
James LathamCMO
James McGourlayCustomer Service
Manny SousaHuman Resources
Steve HuntCIO
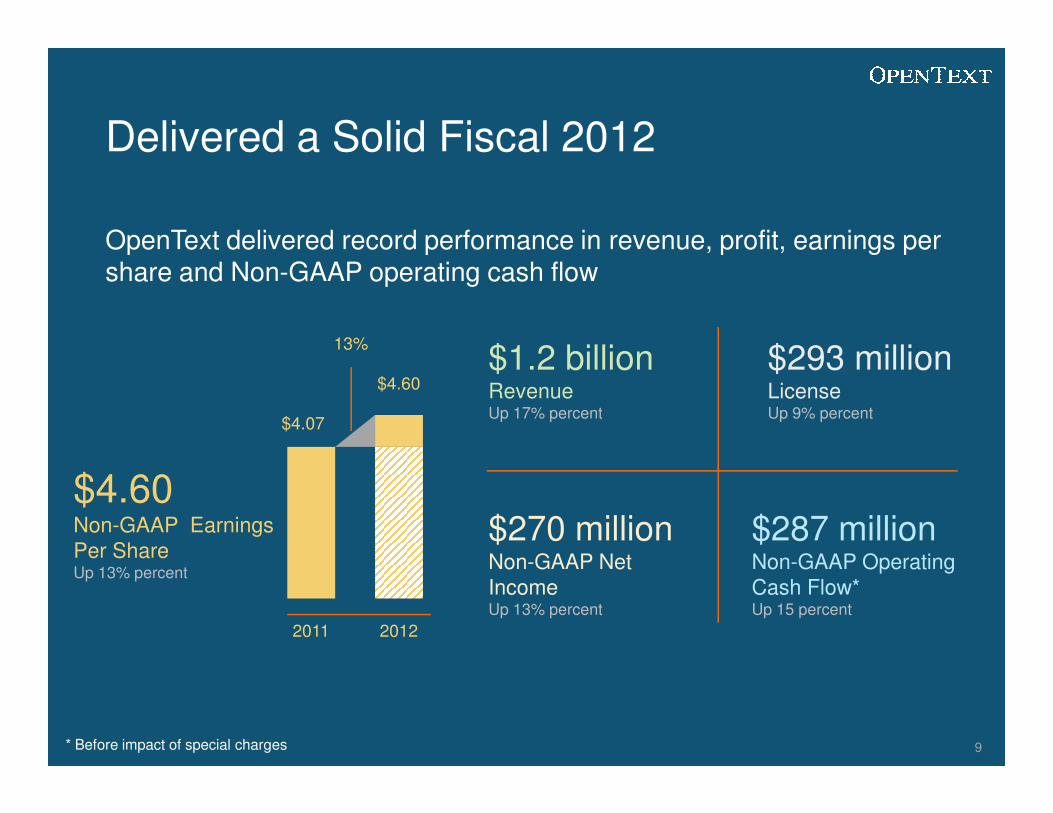
Delivered a Solid Fiscal 2012
OpenText delivered record performance in revenue, profit, earnings per share and Non-GAAP operating cash flow
$1.2 billionRevenueUp 17% percent
$293 millionLicenseUp 9% percent
$4.60
13%
9
$4.60Non-GAAP Earnings Per ShareUp 13% percent
Up 17% percent Up 9% percent
$270 millionNon-GAAP Net IncomeUp 13% percent
$287 millionNon-GAAP OperatingCash Flow*Up 15 percent
$4.07
2011 2012
* Before impact of special charges
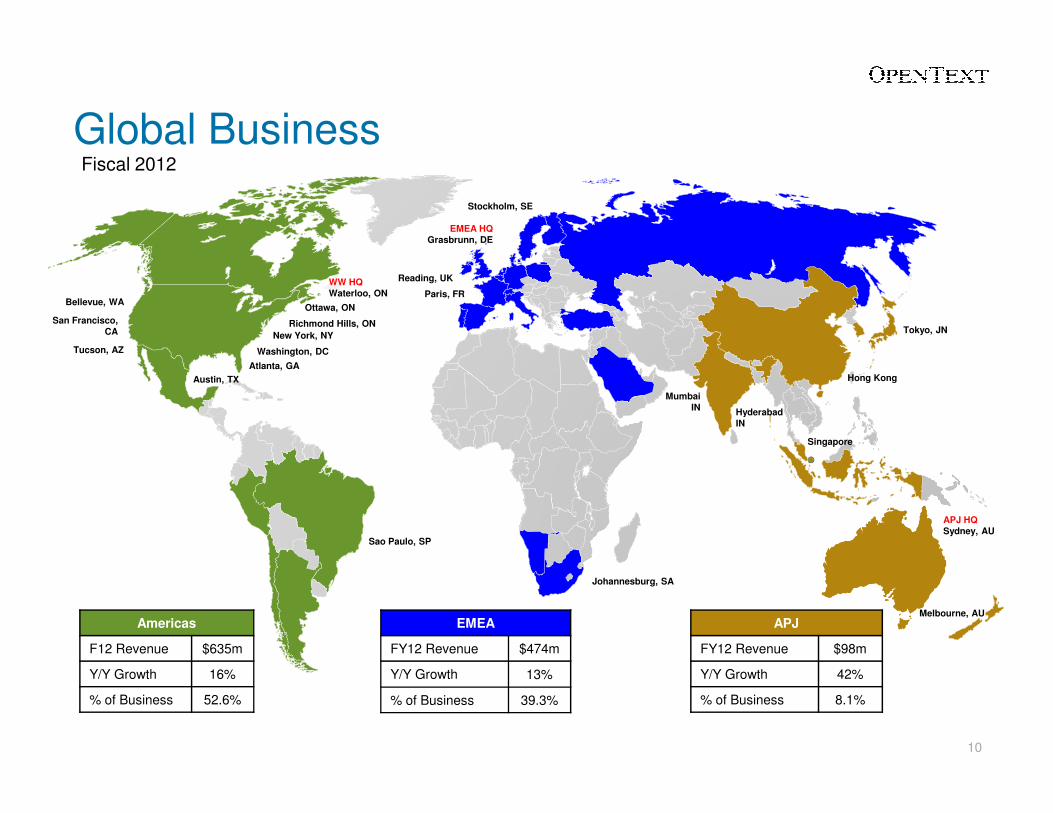
Global BusinessFiscal 2012
WW HQ
Waterloo, ON
New York, NY
Washington, DC
Atlanta, GA
San Francisco,
CA
Austin, TX
Tucson, AZ
Bellevue, WA
Reading, UK
Paris, FR
EMEA HQ
Grasbrunn, DE
Ottawa, ON
Stockholm, SE
Richmond Hills, ONTokyo, JN
Hyderabad
Mumbai
IN
Hong Kong
10
Americas
F12 Revenue $635m
Y/Y Growth 16%
% of Business 52.6%
EMEA
FY12 Revenue $474m
Y/Y Growth 13%
% of Business 39.3%
APJ
FY12 Revenue $98m
Y/Y Growth 42%
% of Business 8.1%
Sao Paulo, SP
Johannesburg, SA
APJ HQ
Sydney, AU
Singapore
Melbourne, AU
Hyderabad
IN
IN
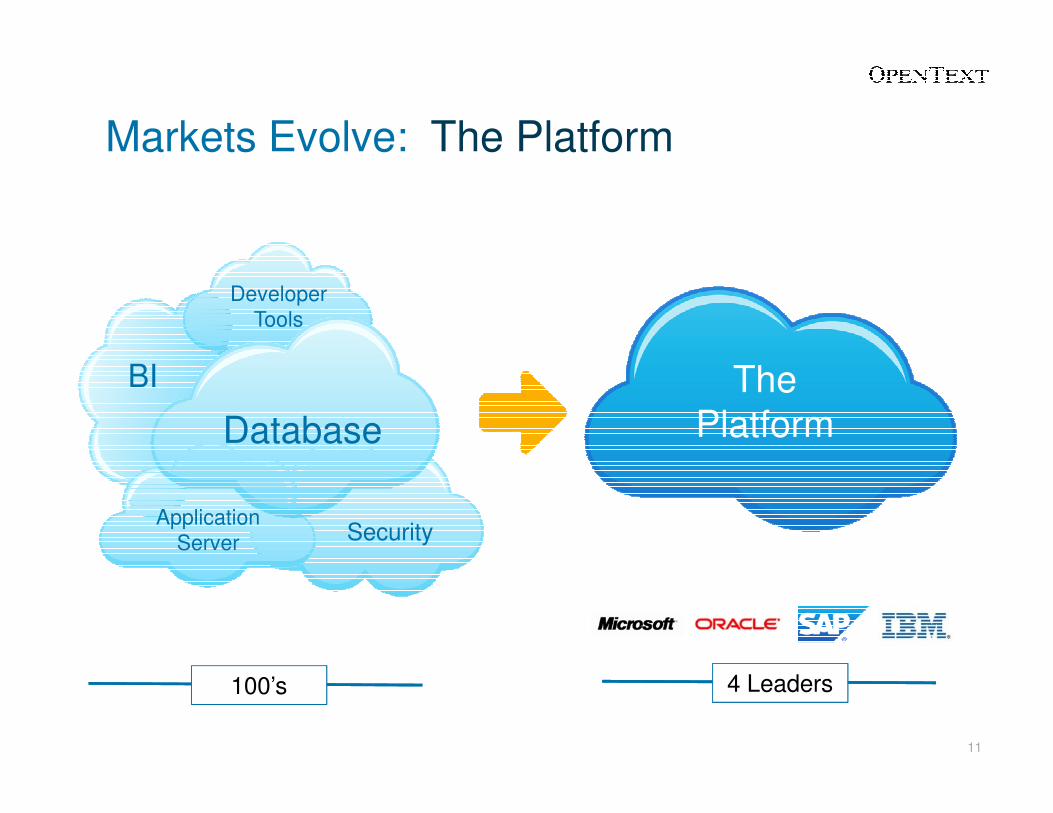
Markets Evolve: The Platform
The Platform
BI
DeveloperTools
4 Leaders100’s
11
PlatformDatabase
ApplicationServer Security
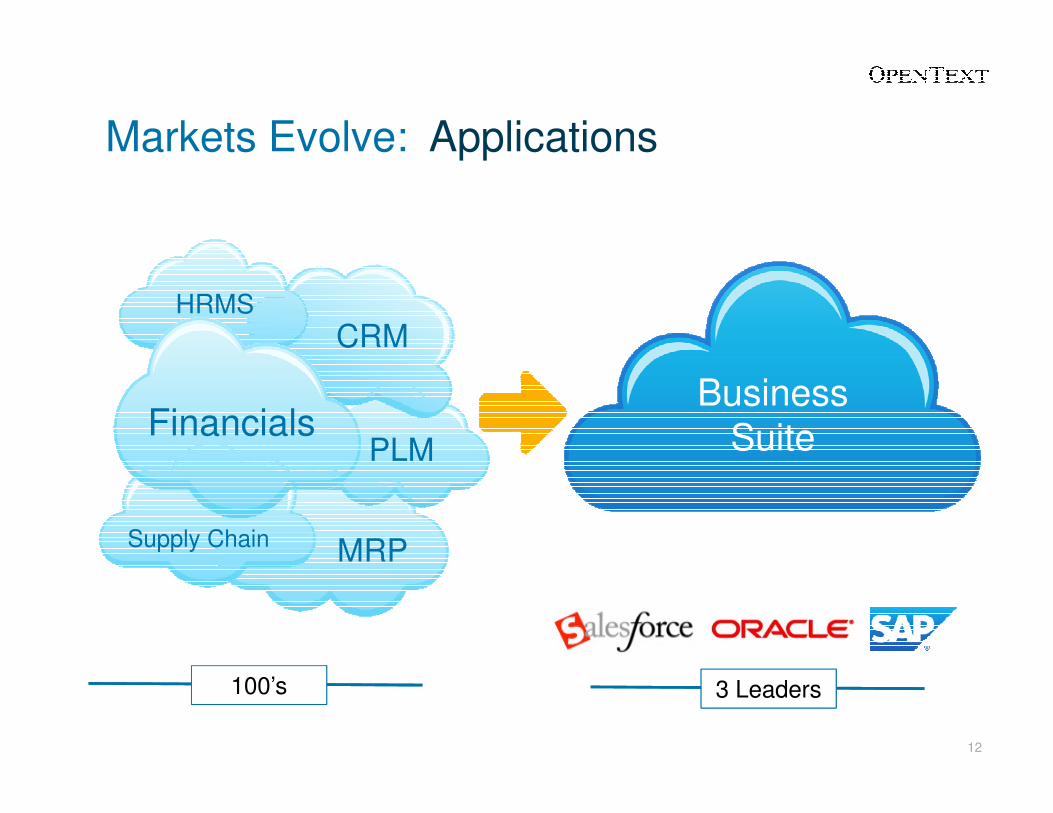
Markets Evolve: Applications
BusinessFinancials
CRMHRMS
3 Leaders100’s
12
BusinessSuiteFinancials
Supply Chain MRP
PLM
EDI
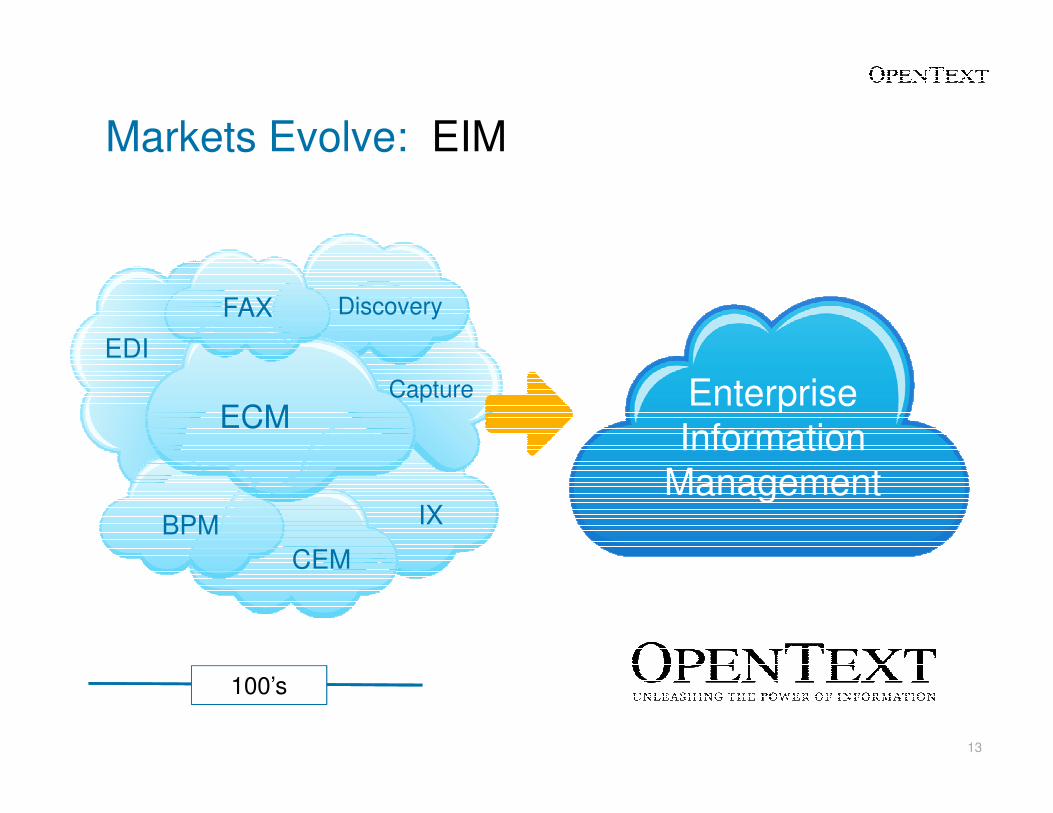
Markets Evolve: EIM
Enterprise
Discovery
ECM
FAX
Capture
100’s
13
EnterpriseInformation
Management
ECM
IXBPM
CEM
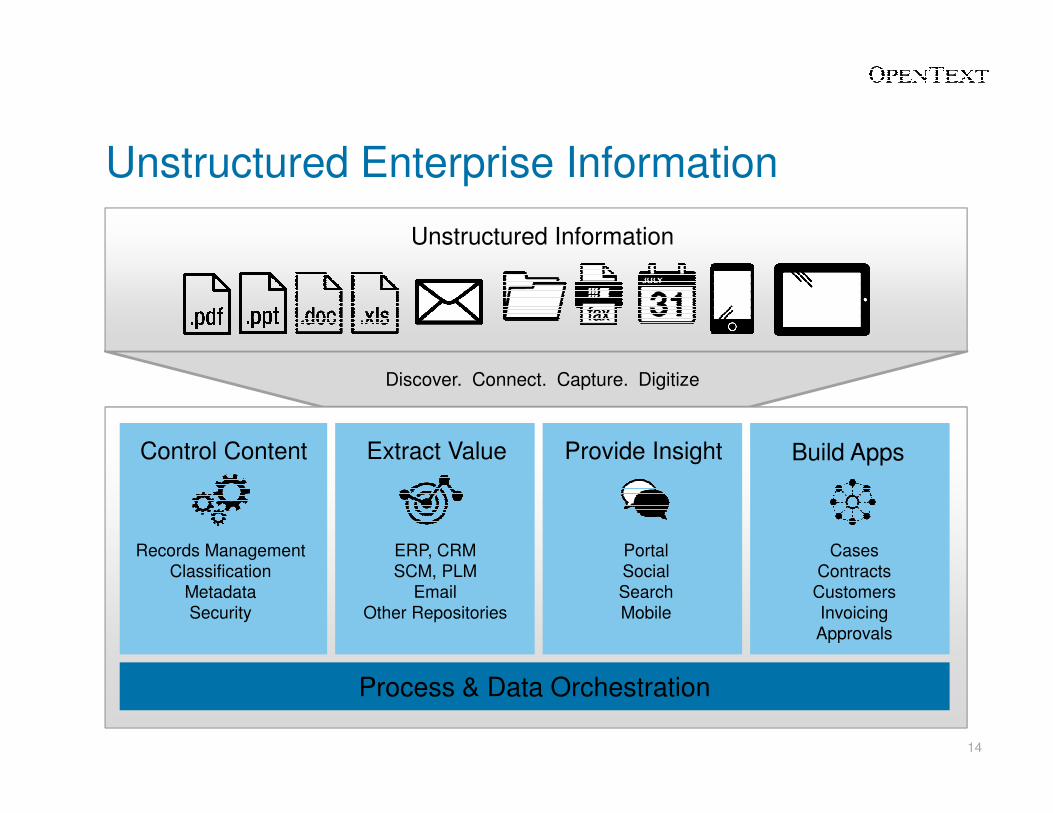
Unstructured Information
Discover. Connect. Capture. Digitize
Unstructured Enterprise Information
14
Control Content Extract Value Provide Insight Build Apps
Process & Data Orchestration
Records ManagementClassification
MetadataSecurity
ERP, CRMSCM, PLM
EmailOther Repositories
PortalSocialSearchMobile
CasesContractsCustomersInvoicingApprovals
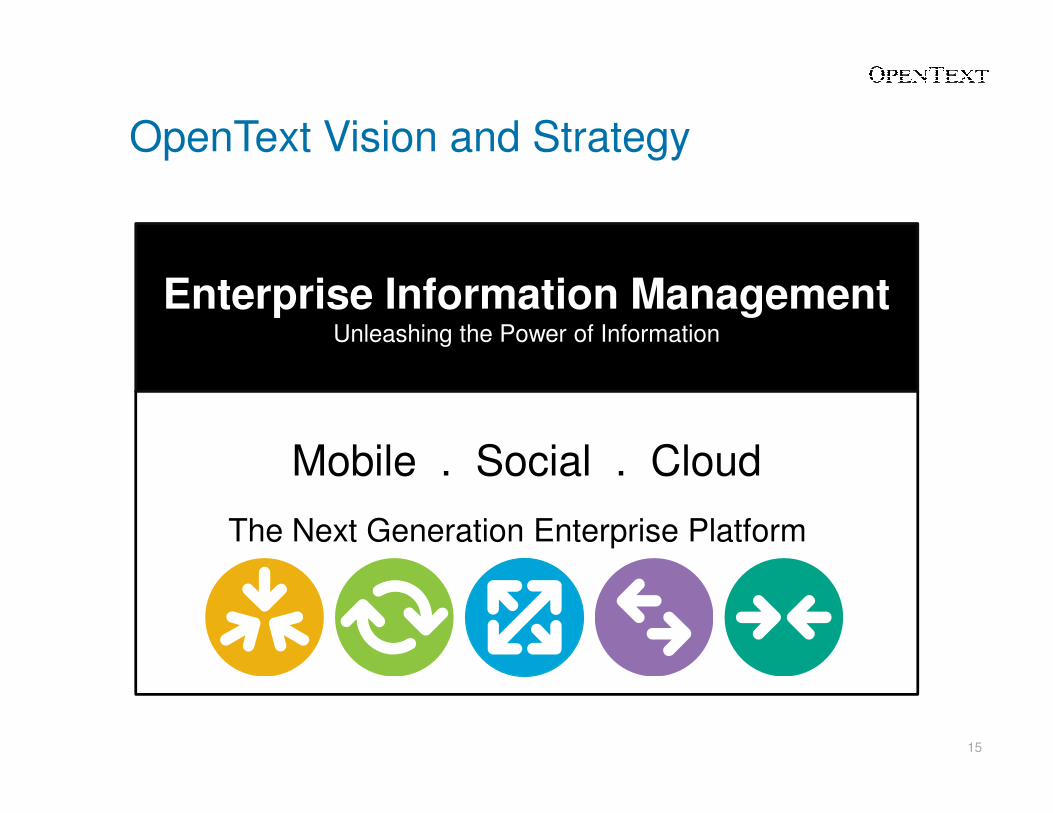
Enterprise Information ManagementUnleashing the Power of Information
OpenText Vision and Strategy
Mobile . Social . Cloud
15
The Next Generation Enterprise Platform
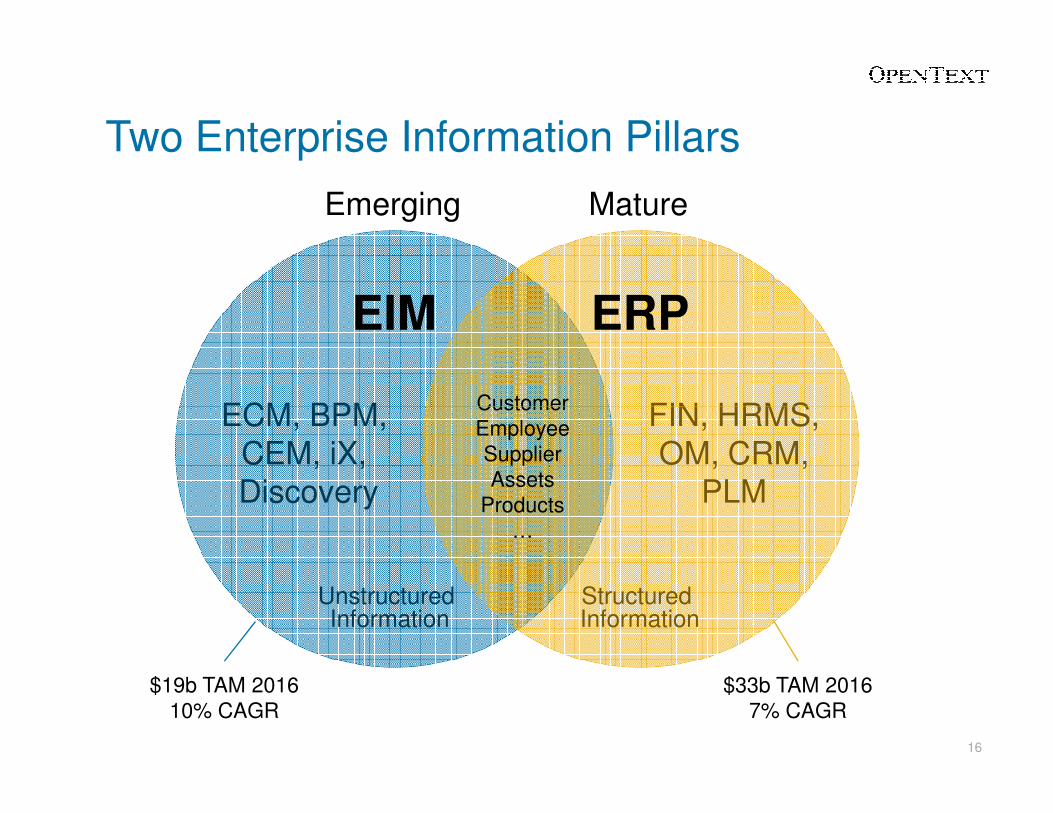
Two Enterprise Information Pillars
EIM ERP
CustomerECM, BPM, FIN, HRMS,
Emerging Mature
16
CustomerEmployeeSupplierAssets
Products…
Unstructured Information
Structured Information
ECM, BPM, CEM, iX, Discovery
FIN, HRMS, OM, CRM,
PLM
$19b TAM 201610% CAGR
$33b TAM 20167% CAGR
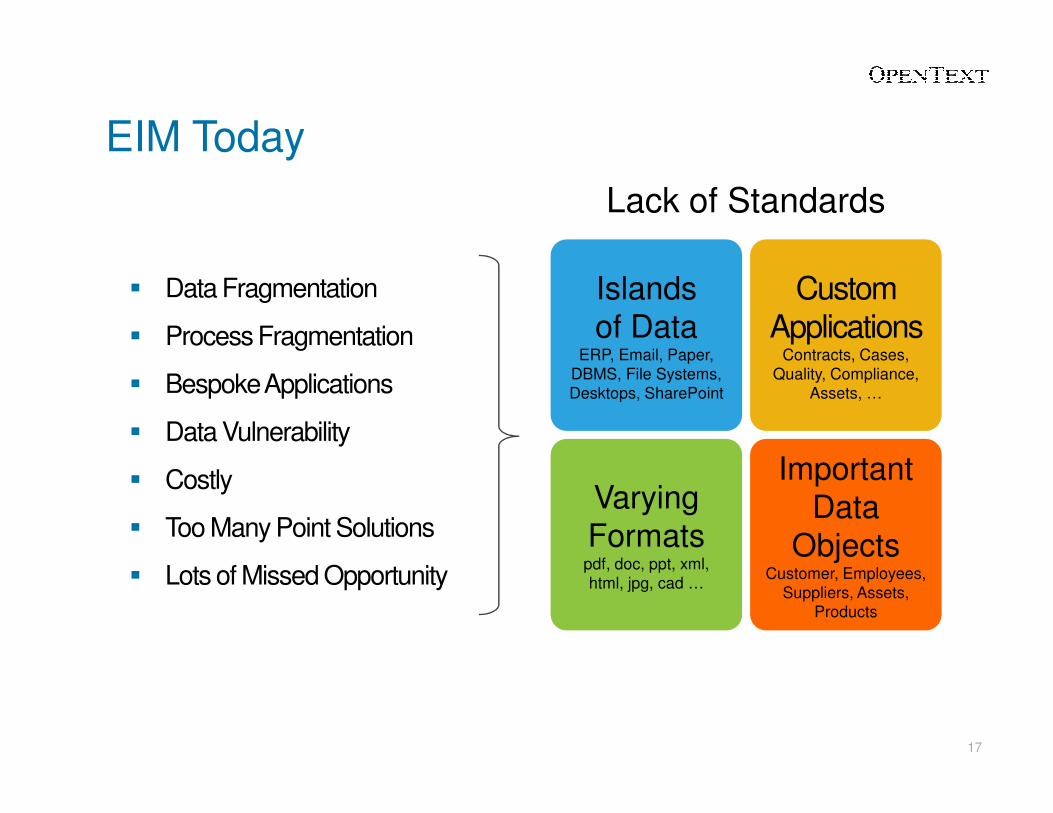
EIM Today
Lack of Standards
Islands of Data
ERP, Email, Paper, DBMS, File Systems, Desktops, SharePoint
Custom Applications
Contracts, Cases, Quality, Compliance,
Assets, …
� Data Fragmentation
� Process Fragmentation
� Bespoke Applications
17
Varying Formatspdf, doc, ppt, xml, html, jpg, cad …
Important Data
ObjectsCustomer, Employees,
Suppliers, Assets, Products
� Data Vulnerability
� Costly
� Too Many Point Solutions
� Lots of Missed Opportunity
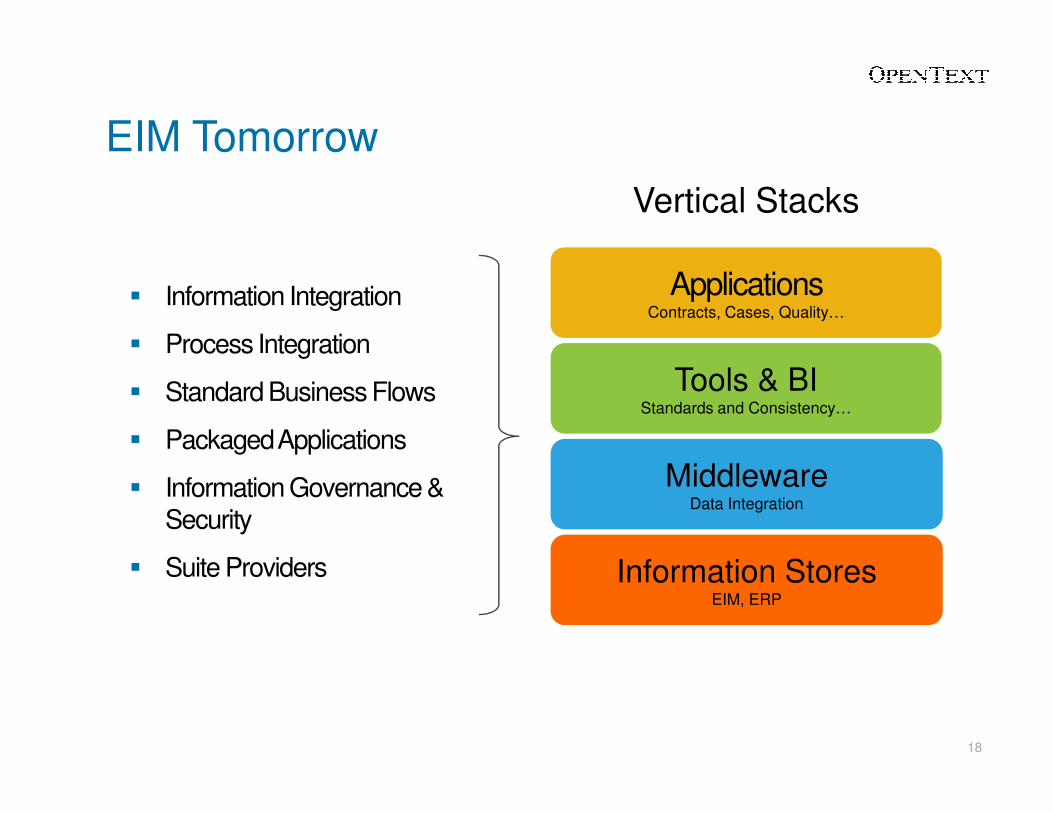
EIM Tomorrow
Vertical Stacks
ApplicationsContracts, Cases, Quality…
Tools & BIStandards and Consistency…
� Information Integration
� Process Integration
� Standard Business Flows
18
MiddlewareData Integration
Standards and Consistency…
Information StoresEIM, ERP
� Packaged Applications
� Information Governance & Security
� Suite Providers
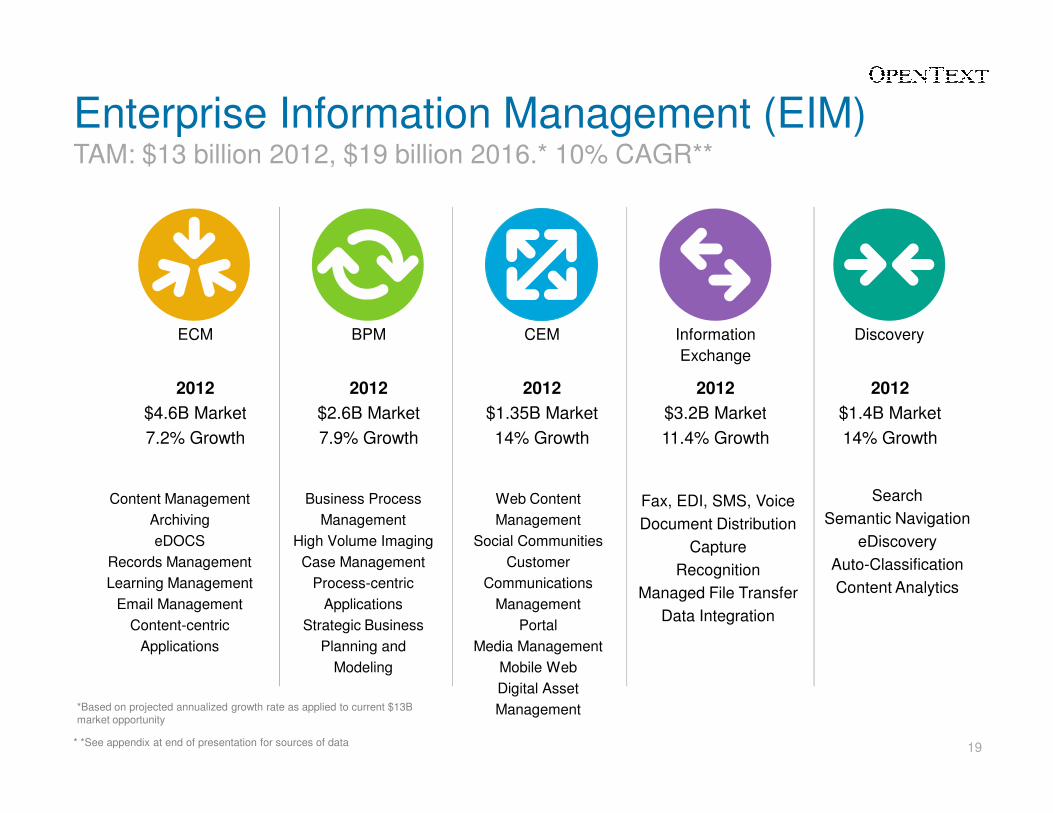
Enterprise Information Management (EIM)TAM: $13 billion 2012, $19 billion 2016.* 10% CAGR**
Customer win:
Emergency Medicine
Physicians Information
Exchange
DiscoveryCEMBPMECM
2012
$4.6B Market
2012
$2.6B Market
2012
$1.35B Market
2012
$3.2B Market
2012
$1.4B Market
19
$4.6B Market
7.2% Growth
$2.6B Market
7.9% Growth
$1.35B Market
14% Growth
$3.2B Market
11.4% Growth
$1.4B Market
14% Growth
Search
Semantic Navigation
eDiscovery
Auto-Classification
Content Analytics
Fax, EDI, SMS, Voice
Document Distribution
Capture
Recognition
Managed File Transfer
Data Integration
Business Process
Management
High Volume Imaging
Case Management
Process-centric
Applications
Strategic Business
Planning and
Modeling
Content Management
Archiving
eDOCS
Records Management
Learning Management
Email Management
Content-centric
Applications
Web Content
Management
Social Communities
Customer
Communications
Management
Portal
Media Management
Mobile Web
Digital Asset
Management
* *See appendix at end of presentation for sources of data
*Based on projected annualized growth rate as applied to current $13B market opportunity
Information Reference Records Management,
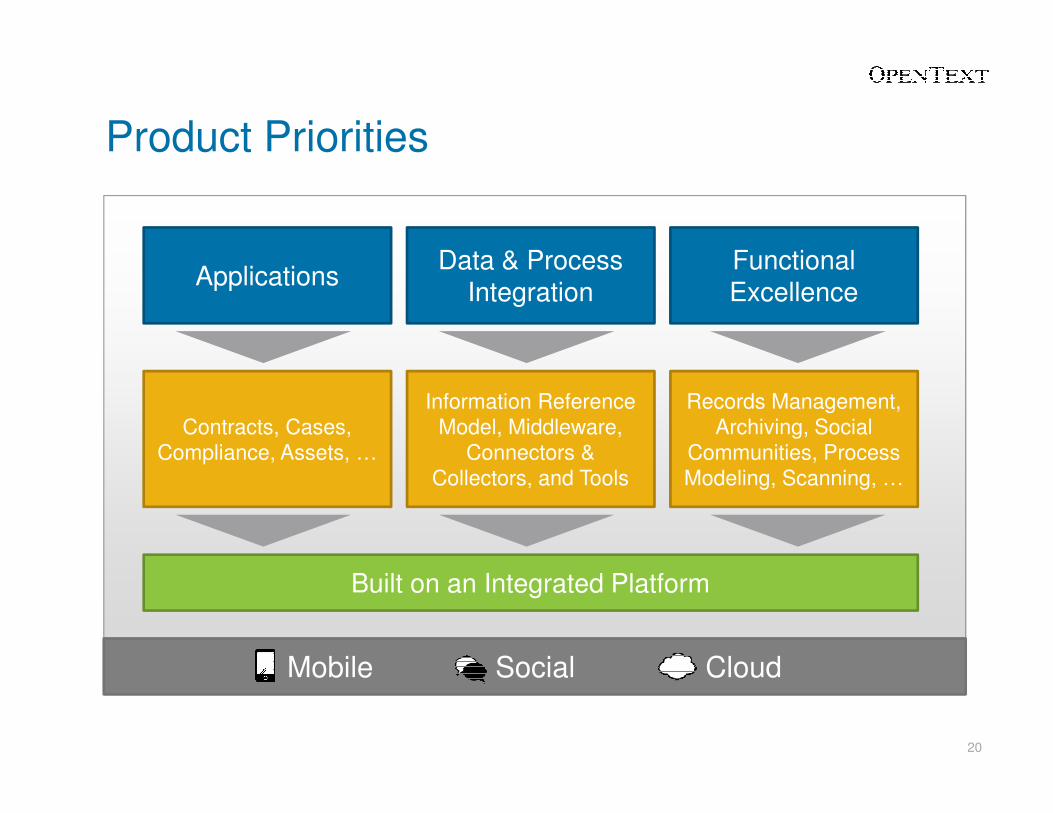
Product Priorities
ApplicationsData & Process
IntegrationFunctional Excellence
Contracts, Cases, Compliance, Assets, …
Information Reference Model, Middleware,
Connectors & Collectors, and Tools
Records Management, Archiving, Social
Communities, Process Modeling, Scanning, …
20
Mobile Social Cloud
Built on an Integrated Platform
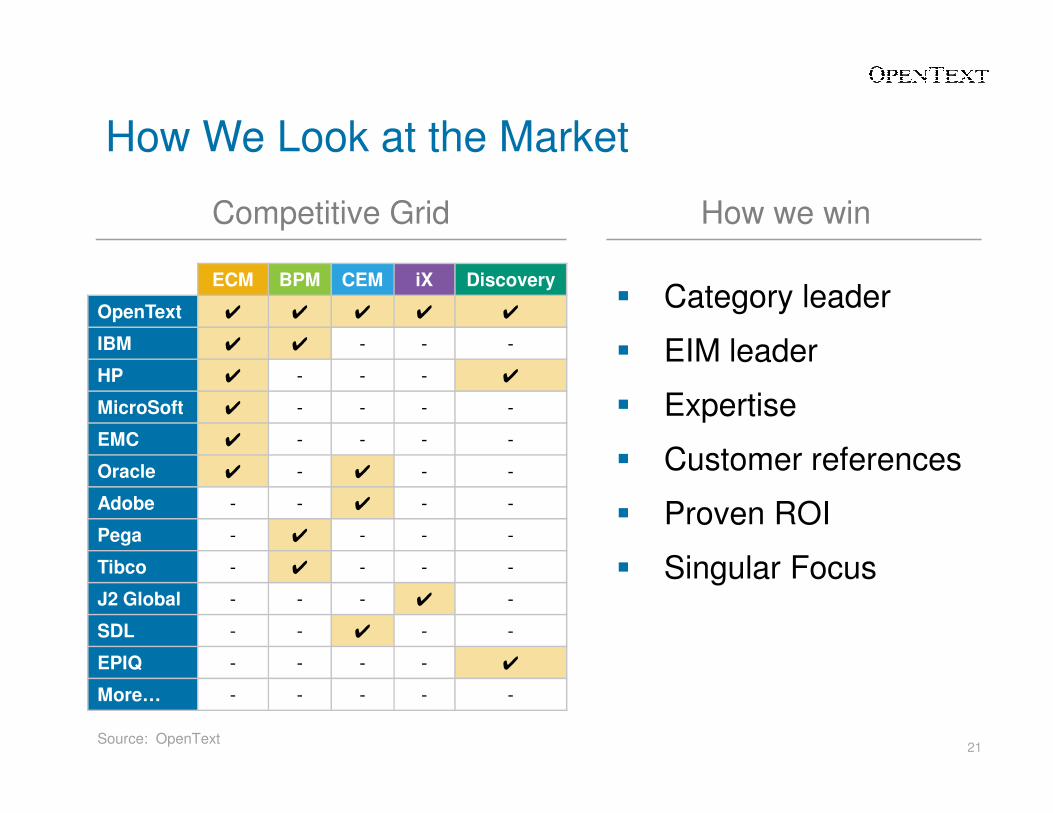
How We Look at the Market
� Category leader
� EIM leader
� Expertise
ECM BPM CEM iX Discovery
OpenText ✔ ✔ ✔ ✔ ✔
IBM ✔ ✔ - - -
HP ✔ - - - ✔
MicroSoft ✔ - - - -
Competitive Grid How we win
21
� Expertise
� Customer references
� Proven ROI
� Singular Focus
MicroSoft ✔ - - - -
EMC ✔ - - - -
Oracle ✔ - ✔ - -
Adobe - - ✔ - -
Pega - ✔ - - -
Tibco - ✔ - - -
J2 Global - - - ✔ -
SDL - - ✔ - -
EPIQ - - - - ✔
More… - - - - -
Source: OpenText
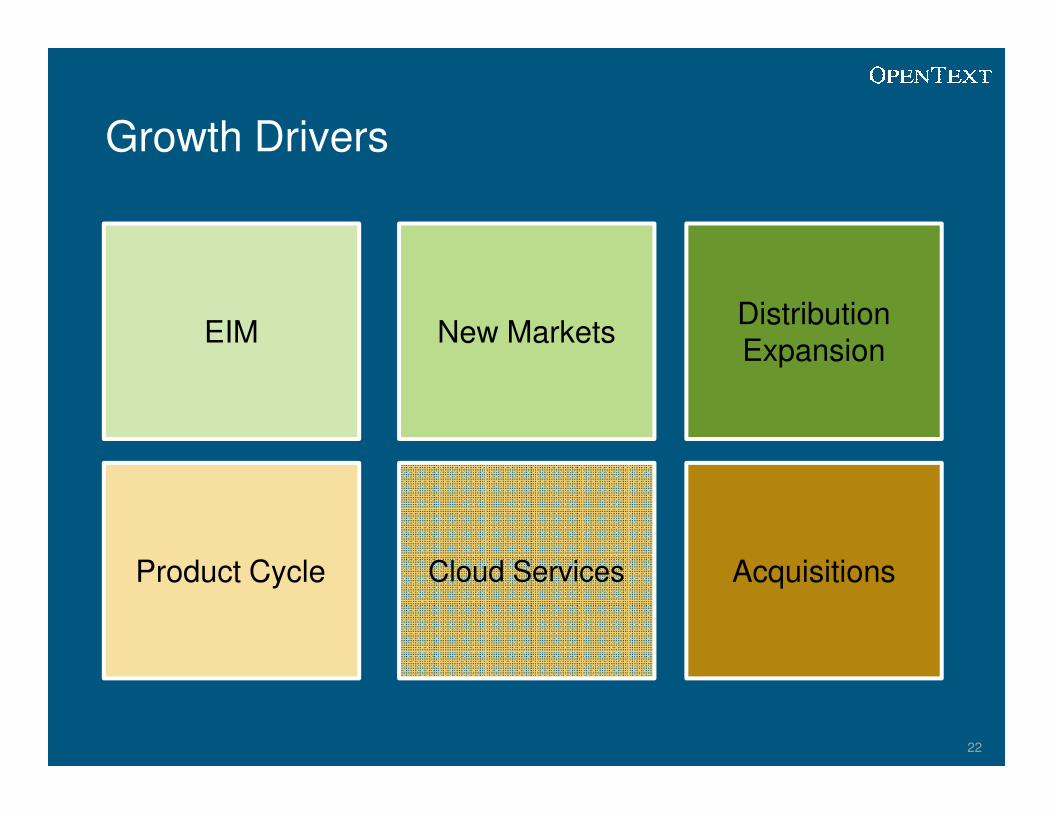
Growth Drivers
EIM New MarketsDistribution Expansion
22
Product Cycle Cloud Services Acquisitions

Unleashing the Power of InformationUnleashing the Power of Information
Investor Briefing New York City, Palace Hotel
Copyright © OpenText Corporation. All rights reserved.
Mark J. BarrenecheaOpenText President & CEO
Wrap Up
September 6th, 2012
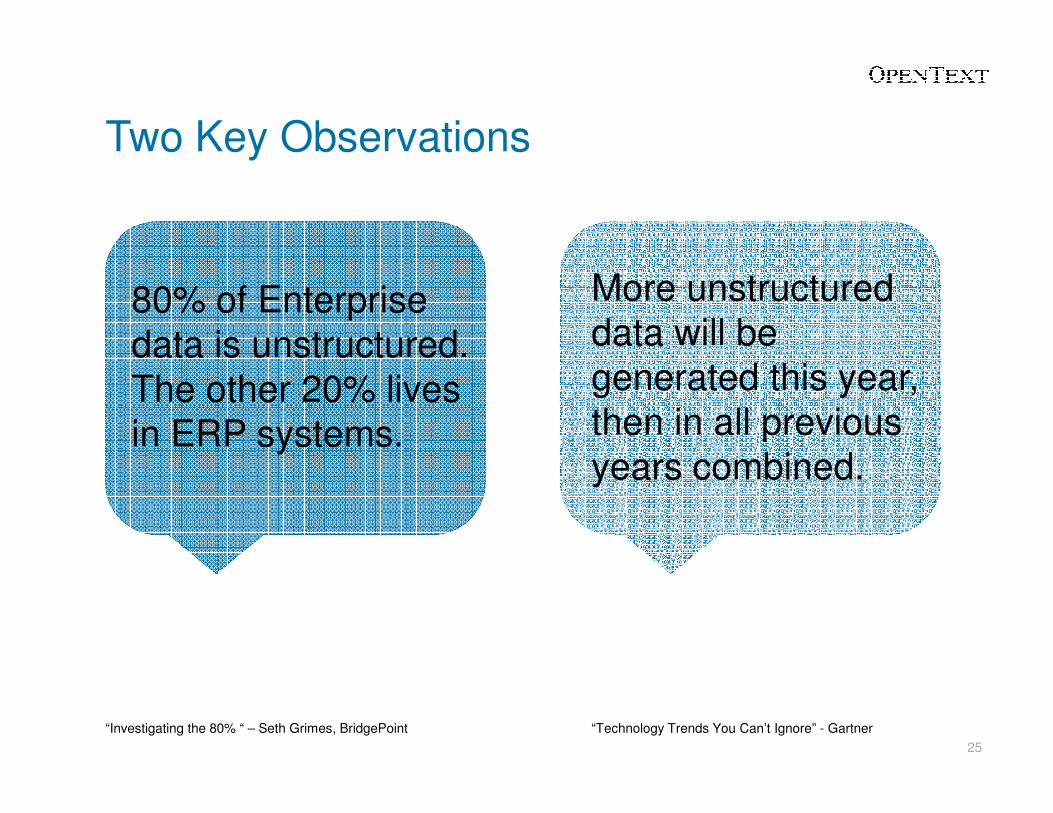
Two Key Observations
80% of Enterprise data is unstructured.The other 20% lives
More unstructured data will be generated this year, then in all previous
25
The other 20% lives in ERP systems. then in all previous
years combined.
“Technology Trends You Can’t Ignore” - Gartner“Investigating the 80% “ – Seth Grimes, BridgePoint
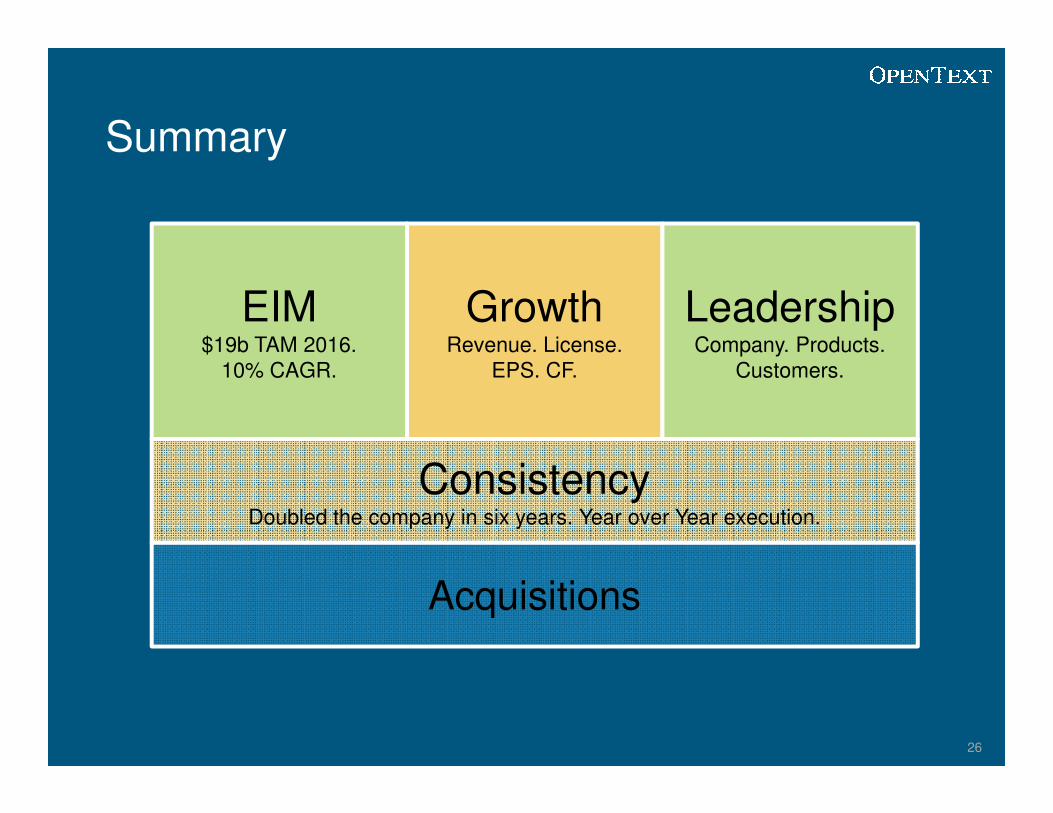
Summary
EIM$19b TAM 2016.
10% CAGR.
GrowthRevenue. License.
EPS. CF.
LeadershipCompany. Products.
Customers.
26
ConsistencyDoubled the company in six years. Year over Year execution.
Acquisitions
Unleashing the Power of InformationUnleashing the Power of Information
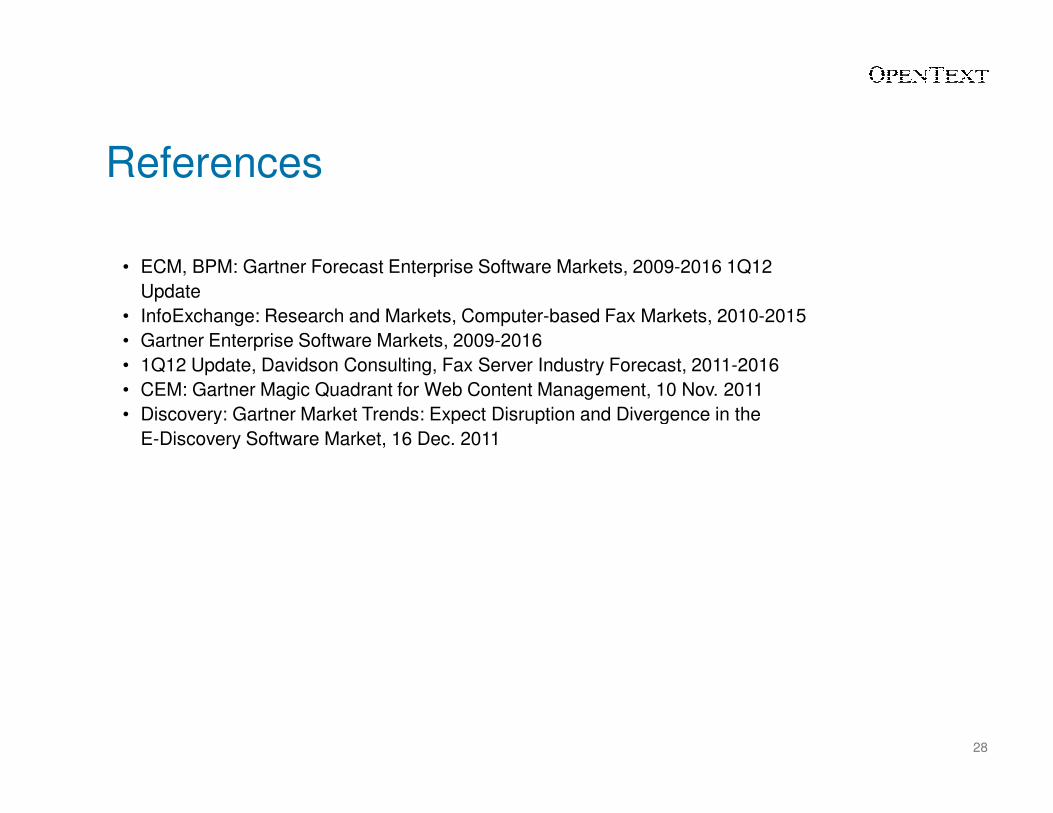
References
• ECM, BPM: Gartner Forecast Enterprise Software Markets, 2009-2016 1Q12
Update
• InfoExchange: Research and Markets, Computer-based Fax Markets, 2010-2015
• Gartner Enterprise Software Markets, 2009-2016
• 1Q12 Update, Davidson Consulting, Fax Server Industry Forecast, 2011-2016
• CEM: Gartner Magic Quadrant for Web Content Management, 10 Nov. 2011
• Discovery: Gartner Market Trends: Expect Disruption and Divergence in the
28
• Discovery: Gartner Market Trends: Expect Disruption and Divergence in the
E-Discovery Software Market, 16 Dec. 2011