Embed Size (px)
Citation preview

INVESTOR FACT BOOK2018 DATA SUPPLEMENT
INVESTOR.CPR.CA

Our precision railroading model transformed how our entire company
operates and allows us to deliver industry-leading service. It’s a culture
of excellence that we adhere to everywhere, every day.
Today, this commitment to precision has us uniquely positioned to
leverage our low cost base and best-in-class service to grow with our
customers. By remaining disciplined, we will drive long-term sustainable,
profitable growth for our customers and shareholders, alike.
TABLE OF CONTENTS
CP at a Glance 4
Book of Business 6
Performance Highlights 8
Financials 10
Operating Metrics 13
Revenue Metrics 14
Non-GAAP Measures 16
FOUNDED IN PRECISION, BUILT FOR GROWTH

INV
ESTO
R FA
CT
BOO
K –
2018
DAT
A S
UPP
LEM
ENT
4
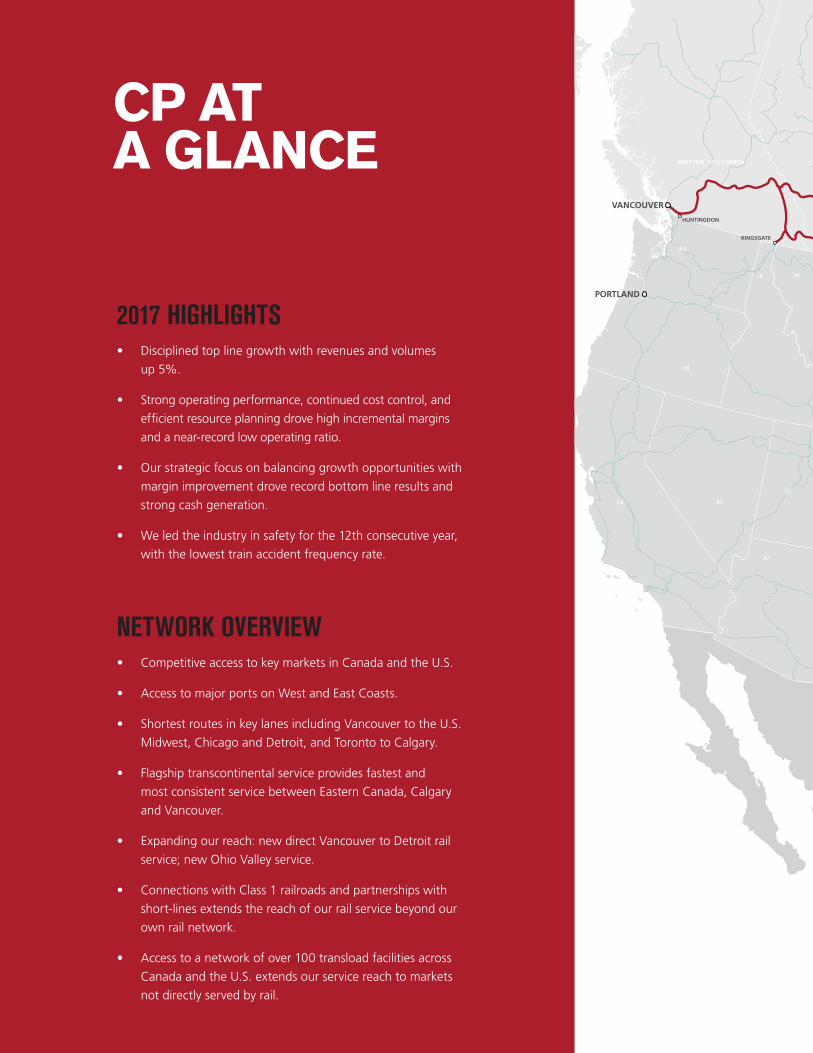
2017 HIGHLIGHTS• Disciplined top line growth with revenues and volumes
up 5%.
• Strong operating performance, continued cost control, and
efficient resource planning drove high incremental margins
and a near-record low operating ratio.
• Our strategic focus on balancing growth opportunities with
margin improvement drove record bottom line results and
strong cash generation.
• We led the industry in safety for the 12th consecutive year,
with the lowest train accident frequency rate.
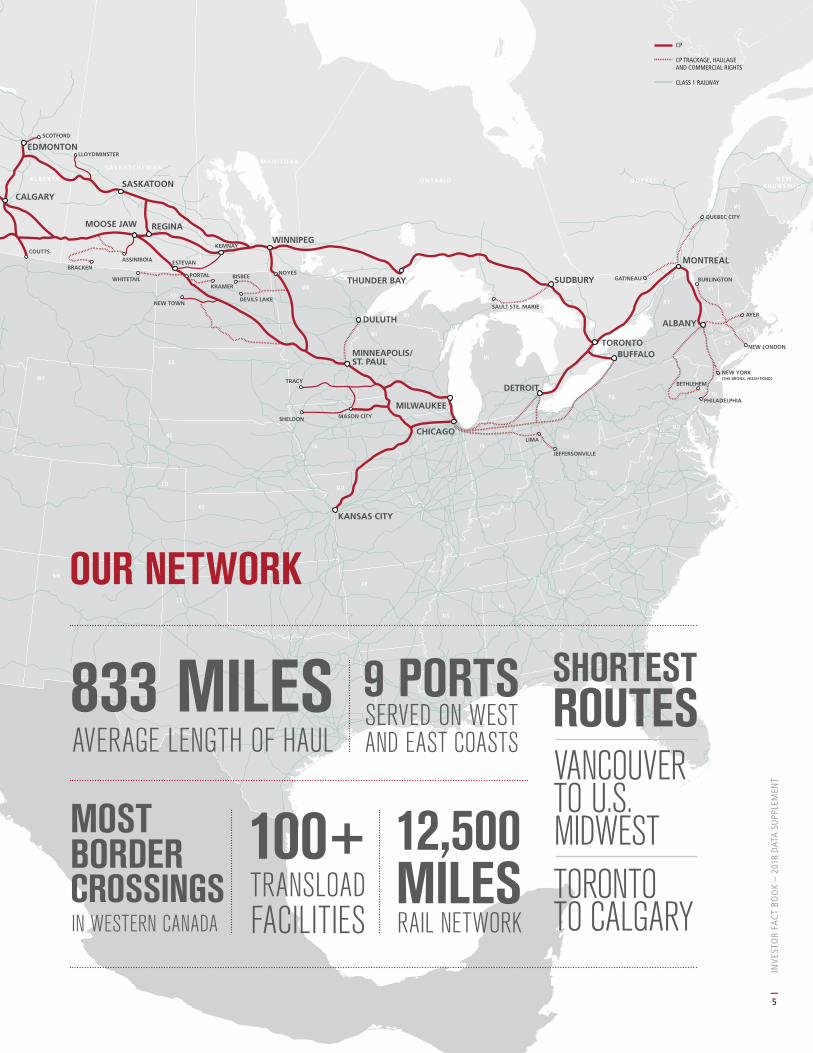
NETWORK OVERVIEW• Competitive access to key markets in Canada and the U.S.
• Access to major ports on West and East Coasts.
• Shortest routes in key lanes including Vancouver to the U.S.
Midwest, Chicago and Detroit, and Toronto to Calgary.
• Flagship transcontinental service provides fastest and
most consistent service between Eastern Canada, Calgary
and Vancouver.
• Expanding our reach: new direct Vancouver to Detroit rail
service; new Ohio Valley service.
• Connections with Class 1 railroads and partnerships with
short-lines extends the reach of our rail service beyond our
own rail network.
• Access to a network of over 100 transload facilities across
Canada and the U.S. extends our service reach to markets
not directly served by rail.
SUDBURY
TORONTO BUFFALO
ALBANY
DETROIT
THUNDER BAY
WINNIPEG
NEW YORK(THE BRONX, FRESH POND)
PHILADELPHIA
BETHLEHEM
MILWAUKEE
CHICAGO
KANSAS CITY
DULUTH
MINNEAPOLIS/ST. PAUL
SASKATOON
REGINA
LLOYDMINSTER
ESTEVAN
MOOSE JAW
WHITETAIL
NEW TOWN
KRAMER
BISBEE
DEVILS LAKE
TRACY
KEMNAY
EDMONTON
CALGARY
COUTTS
BRACKENASSINIBOIA
KINGSGATE
HUNTINGDON
VANCOUVER
PORTLAND
MONTREAL
NEW LONDON
AYER
BURLINGTON
QUEBEC CITY
GATINEAU
SAULT STE. MARIE
MASON CITY
LIMA
JEFFERSONVILLE
SHELDON
SCOTFORD
PORTAL NOYES
B R I T I S H C O L U M B I A
WA
I D M T
W Y
N E
O R
N V
U T
C A
C O
K S
M O
N DM N
I A
M I
I L I N
O H
K Y
W V
VA
D EM D
N J
T N
PA
N Y
C T
R IM A
N H
V T
M E
W I
S D
A L B E RTA
S A S K AT C H E WA N M A N I T O B A
O N TA R I O Q U E B E C N E WB R U N S W I C K
N O VA S C O T I A
M I
O K
T X
N M
A Z
A R
L A
N C
S C
G A
F L
A L
M S
CP
CP TRACKAGE, HAULAGE AND COMMERCIAL RIGHTS
CLASS 1 RAILWAY
CP AT A GLANCE
INV
ESTO
R FA
CT
BOO
K –
2018
DAT
A S
UPP
LEM
ENT
5
SUDBURY
TORONTO BUFFALO
ALBANY
DETROIT
THUNDER BAY
WINNIPEG
NEW YORK(THE BRONX, FRESH POND)
PHILADELPHIA
BETHLEHEM
MILWAUKEE
CHICAGO
KANSAS CITY
DULUTH
MINNEAPOLIS/ST. PAUL
SASKATOON
REGINA
LLOYDMINSTER
ESTEVAN
MOOSE JAW
WHITETAIL
NEW TOWN
KRAMER
BISBEE
DEVILS LAKE
TRACY
KEMNAY
EDMONTON
CALGARY
COUTTS
BRACKENASSINIBOIA
KINGSGATE
HUNTINGDON
VANCOUVER
PORTLAND
MONTREAL
NEW LONDON
AYER
BURLINGTON
QUEBEC CITY
GATINEAU
SAULT STE. MARIE
MASON CITY
LIMA
JEFFERSONVILLE
SHELDON
SCOTFORD
PORTAL NOYES
B R I T I S H C O L U M B I A
WA
I D M T
W Y
N E
O R
N V
U T
C A
C O
K S
M O
N DM N
I A
M I
I L I N
O H
K Y
W V
VA
D EM D
N J
T N
PA
N Y
C T
R IM A
N H
V T
M E
W I
S D
A L B E RTA
S A S K AT C H E WA N M A N I T O B A
O N TA R I O Q U E B E C N E WB R U N S W I C K
N O VA S C O T I A
M I
O K
T X
N M
A Z
A R
L A
N C
S C
G A
F L
A L
M S
CP
CP TRACKAGE, HAULAGE AND COMMERCIAL RIGHTS
CLASS 1 RAILWAY
OUR NETWORK
833 MILESAVERAGE LENGTH OF HAUL
9 PORTSSERVED ON WEST AND EAST COASTS
MOST BORDER CROSSINGSIN WESTERN CANADA
100+TRANSLOAD FACILITIES
SHORTEST ROUTESVANCOUVER TO U.S. MIDWEST
TORONTO TO CALGARY
12,500MILESRAIL NETWORK

INV
ESTO
R FA
CT
BOO
K –
2018
DAT
A S
UPP
LEM
ENT
6
20
18 D
ATA
SU
PP
LE
ME
NT
32% ASIA
5% EUROPE
17% WITHIN CANADA
1% MEXICO
16% WITHIN U.S.
DIVERSIFIEDBOOK OF BUSINESS
LINES OF BUSINESS
BULK
INTE
RMOD
AL
GRAIN INTERMODALCOAL POTASH &FERTILIZER
Canadian Grain 66% Regulated 46% Non-regulated 20%
U.S. Grain 34% Domestic 22% Export 12%
Domestic 59% Canada 51% Cross-border 7% U.S. 1%
International 41% Port of Vancouver 28% Port of Montreal 10% Other 3%
Canadian Coal 91% Export 87% Domestic 4%
U.S. Coal 9%
Potash 63% Export 34% Domestic 29%
Fertilizers 28% Wet Fertilizers 14% Dry Fertilizers 14%
Sulphur 9%
37%GLOBAL
30%CROSS-BORDER
33%DOMESTIC
GEOGRAPHICAL DISTRIBUTION% OF 2017 FREIGHT REVENUE
22% CANADA TO U.S.
7% U.S. TO CANADA

INV
ESTO
R FA
CT
BOO
K –
2018
DAT
A S
UPP
LEM
ENT
7
4.10
2.78
AUTOMOTIVE
Finished Vehicles 95% Origin Canada 59% Origin U.S. 24% Imports 7% Origin Mexico 5%
Machinery 2%
Parts & Others 3%
BUSINESS MIX% OF 2017 FREIGHT REVENUE
MER
CHAN
DISE
2017 AVERAGE LENGTH OF HAUL (MILES)
2017 FREIGHT REVENUE PER RTM (CENTS)
ENERGY, CHEMICAL & PLASTICS
Biofuels 20%
Chemicals 21%
Crude 17%
Petroleum Products 17%
LPG 14%
Plastics 11%
METALS, MINERALS& CONSUMER PRODUCTS
Frac Sand 31%
Other Aggregates 26%
Steel 26%
Consumer Products 13%
Mines & Metals 4%
1,664
5.62
2.61
6.27
4.21
5.92
22.15
6.44
1,052
842
700
623
909
771
602
484
Grain
Coal
Potash
Fertilizers & Sulphur
Energy, Chemicals & Plastics
Metals, Minerals & Consumer Products
Automotive
Forest Products
Intermodal
Grain
Coal
Potash
Fertilizers & Sulphur
Energy, Chemicals & Plastics
Metals, Minerals & Consumer Products
Automotive
Forest Products
Intermodal
833 = Corporate Average
4.47 = Corporate Average
21%INTERMODAL
35%MERCHANDISE
44%BULK
Intermodal 21%
Merchandise 35% Energy, Chemicals & Plastics 14% Metals, Minerals & Consumer Products 12% Automotive 5% Forest Products 4%
Bulk 44%
Grain 24% Coal 10% Potash 6% Fertilizers & Sulphur 4%
FOREST PRODUCTS
Pulp & Paper 54%
Lumber & Panel 42%
Other 4%

INV
ESTO
R FA
CT
BOO
K –
2018
DAT
A S
UPP
LEM
ENT
8
PE
RF
OR
MA
NC
E H
IGH
LIG
HT
S
PERFORMANCE HIGHLIGHTS$ in millions, except per share data, ratios, or unless otherwise indicated
2012 2013 2014 2015 2016 2017
FINANCIAL HIGHLIGHTS
Total revenues $ 5,695 $ 6,133 $ 6,620 $ 6,712 $ 6,232 $ 6,554
Operating income(1) 886 1,338 2,202 2,618 2,411 2,519
Adjusted operating income (1)(2) 1,246 1,762 2,198 2,550 2,411 2,468
Operating ratio (1) 84.4% 78.2% 66.7% 61.0% 61.3% 61.6%
Adjusted operating ratio (1)(2) 78.1% 71.3% 66.7% 62.0% 61.3% 62.4%
Net income 484 875 1,476 1,352 1,599 2,405
Adjusted income (2) 753 1,132 1,482 1,625 1,549 1,666
Diluted earnings per share (“EPS”) 2.79 4.96 8.46 8.40 10.63 16.44
Adjusted diluted EPS (2) 4.34 6.42 8.50 10.10 10.29 11.39
Free cash (2) 316 774 969 1,381 1,007 874
Return on invested capital (“ROIC”) (2) 7.3% 10.1% 14.4% 12.9% 14.4% 20.5%
Adjusted ROIC (2) 9.8% 12.2% 14.5% 15.2% 14.0% 14.7%
Adjusted net debt to adjusted EBITDA ratio (2) 2.9 2.1 2.2 2.8 2.9 2.6
STATISTICAL HIGHLIGHTS(3)
Revenue ton-miles (“RTMs”) (millions) 135,032 144,249 149,849 145,257 135,952 142,540
Carloads (thousands) 2,669 2,688 2,684 2,628 2,525 2,634
Gross ton-miles (millions) 254,354 267,629 272,862 263,344 242,694 252,195
Fuel efficiency (U.S. gallons of locomotive fuel consumed /1,000 GTMs)
1.149 1.060 1.035 0.999 0.980 0.980
Average train weight – excluding local traffic (tons) 6,709 7,573 8,076 8,314 8,614 8,806
Average train length – excluding local traffic (feet) 5,981 6,530 6,682 6,935 7,217 7,214
Average terminal dwell (hours) 7.5 7.1 8.7 7.2 6.7 6.6
Average train speed (mph) 18.0 18.4 18.0 21.4 23.5 22.6
Total employees (end of period) 15,713 14,506 14,255 12,817 11,653 12,163
Total workforce (end of period) 16,907 14,977 14,385 12,899 11,698 12,242
SAFETY INDICATORS(3)
FRA personal injuries per 200,000 employee hours 1.55 1.71 1.67 1.84 1.67 1.65
FRA train accidents per million train miles 1.69 1.80 1.26 1.41 1.12 0.99
(1) Comparative figures were restated to reflect the adoption of the new accounting standard for presentation of net periodic benefit recovery. For a full description and reconciliation of the restatement see Exhibit 99.1 of the Form 8-K dated February 16, 2018 on investor.cpr.ca.
(2) These measures have no standardized meanings prescribed by accounting principles generally accepted in the United States of America (“GAAP”) and, therefore, may not be comparable to similar measures presented by other companies. These measures are defined and reconciled in Non-GAAP Measures on page 16.
(3) Certain statistical highlights and safety indicators figures have been updated to reflect new information or have been revised to conform with current presentation.
INV
ESTO
R FA
CT
BOO
K –
2018
DAT
A S
UPP
LEM
ENT
9
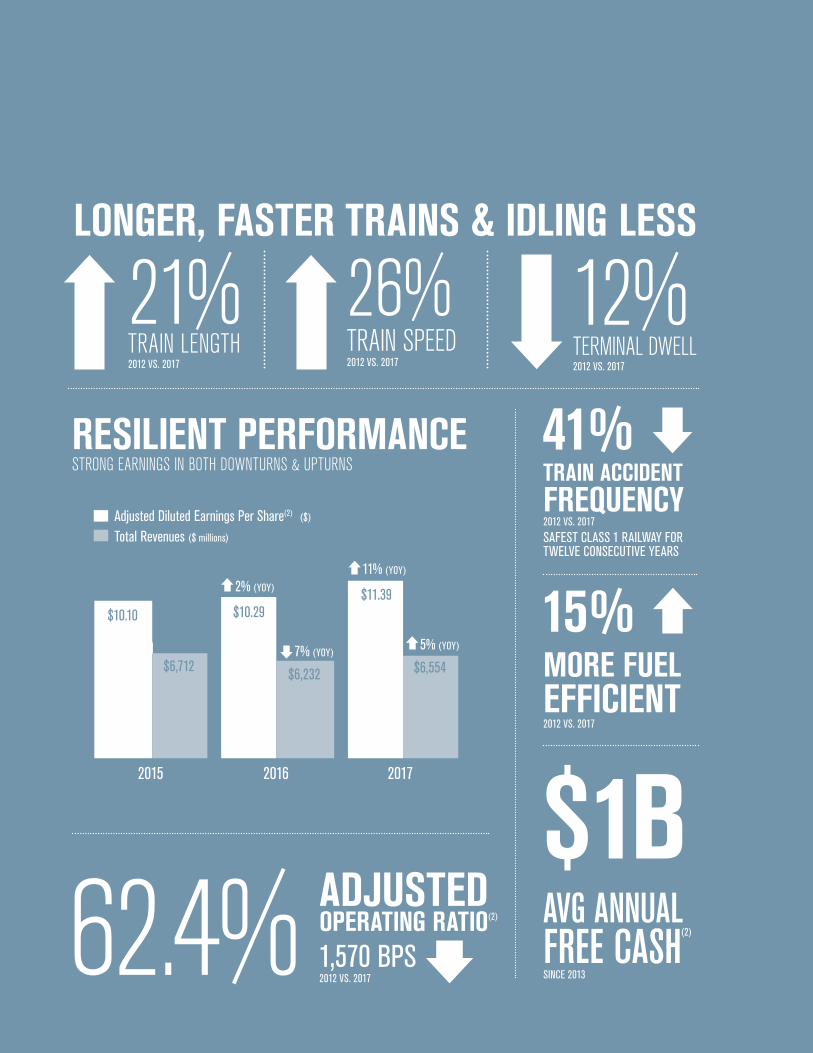
62.4% ADJUSTED OPERATING RATIO(2)
1,570 BPS2012 VS. 2017
$1BAVG ANNUAL FREE CASH(2)
SINCE 2013
21%TRAIN LENGTH2012 VS. 2017
26%TRAIN SPEED2012 VS. 2017
12%TERMINAL DWELL2012 VS. 2017
LONGER, FASTER TRAINS & IDLING LESS
41%TRAIN ACCIDENT FREQUENCY2012 VS. 2017
SAFEST CLASS 1 RAILWAY FOR TWELVE CONSECUTIVE YEARS
15%MORE FUEL EFFICIENT2012 VS. 2017
RESILIENT PERFORMANCESTRONG EARNINGS IN BOTH DOWNTURNS & UPTURNS
2015 2016 2017
Adjusted Diluted Earnings Per Share(2) ($)
Total Revenues ($ millions)
$10.29
$11.39
11% (YOY)
$10.29
2% (YOY)
$10.10
$6,554
5% (YOY)
$6,232
7% (YOY)$6,712
INV
ESTO
R FA
CT
BOO
K –
2018
DAT
A S
UPP
LEM
ENT
10
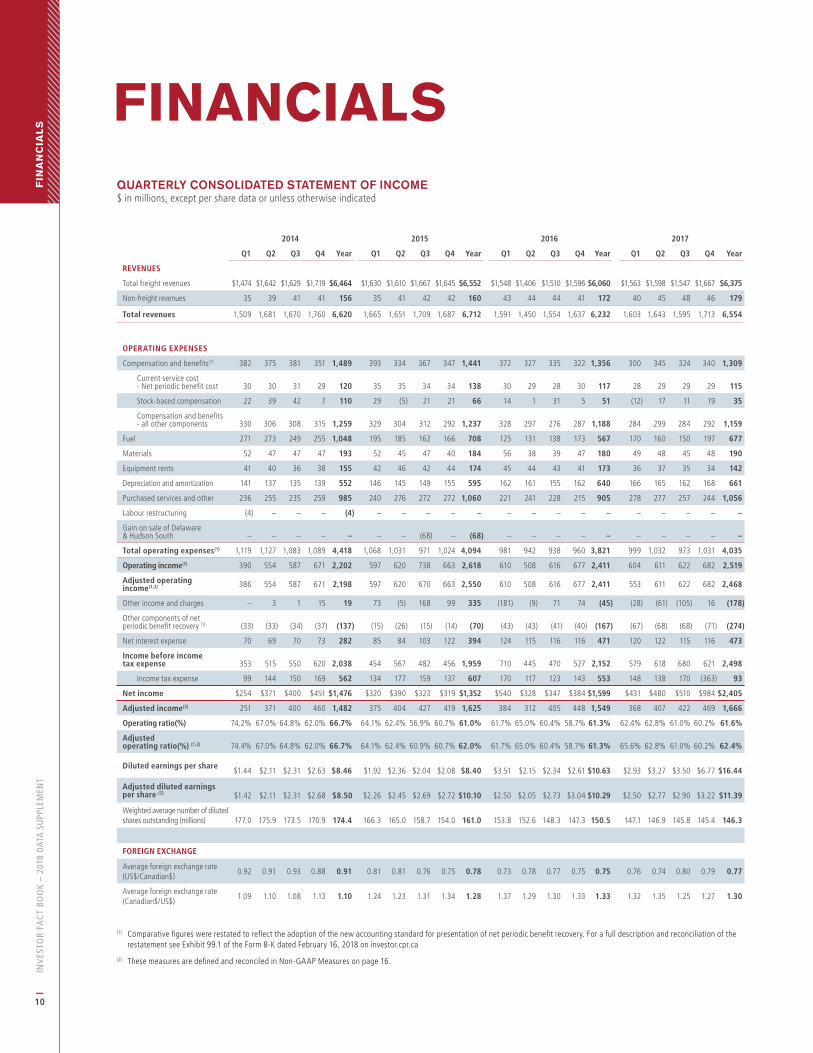
QUARTERLY CONSOLIDATED STATEMENT OF INCOME$ in millions, except per share data or unless otherwise indicated
2014 2015 2016 2017
Q1 Q2 Q3 Q4 Year Q1 Q2 Q3 Q4 Year Q1 Q2 Q3 Q4 Year Q1 Q2 Q3 Q4 Year
REVENUES
Total freight revenues $1,474 $1,642 $1,629 $1,719 $6,464 $1,630 $1,610 $1,667 $1,645 $6,552 $1,548 $1,406 $1,510 $1,596 $6,060 $1,563 $1,598 $1,547 $1,667 $6,375
Non-freight revenues 35 39 41 41 156 35 41 42 42 160 43 44 44 41 172 40 45 48 46 179
Total revenues 1,509 1,681 1,670 1,760 6,620 1,665 1,651 1,709 1,687 6,712 1,591 1,450 1,554 1,637 6,232 1,603 1,643 1,595 1,713 6,554
OPERATING EXPENSES
Compensation and benefits(1) 382 375 381 351 1,489 393 334 367 347 1,441 372 327 335 322 1,356 300 345 324 340 1,309
Current service cost - Net periodic benefit cost 30 30 31 29 120 35 35 34 34 138 30 29 28 30 117 28 29 29 29 115
Stock-based compensation 22 39 42 7 110 29 (5) 21 21 66 14 1 31 5 51 (12) 17 11 19 35
Compensation and benefits - all other components 330 306 308 315 1,259 329 304 312 292 1,237 328 297 276 287 1,188 284 299 284 292 1,159
Fuel 271 273 249 255 1,048 195 185 162 166 708 125 131 138 173 567 170 160 150 197 677
Materials 52 47 47 47 193 52 45 47 40 184 56 38 39 47 180 49 48 45 48 190
Equipment rents 41 40 36 38 155 42 46 42 44 174 45 44 43 41 173 36 37 35 34 142
Depreciation and amortization 141 137 135 139 552 146 145 149 155 595 162 161 155 162 640 166 165 162 168 661
Purchased services and other 236 255 235 259 985 240 276 272 272 1,060 221 241 228 215 905 278 277 257 244 1,056
Labour restructuring (4) – – – (4) – – – – – – – – – – – – – – –
Gain on sale of Delaware & Hudson South – – – – – – – (68) – (68) – – – – – – – – – –
Total operating expenses(1) 1,119 1,127 1,083 1,089 4,418 1,068 1,031 971 1,024 4,094 981 942 938 960 3,821 999 1,032 973 1,031 4,035
Operating income(1) 390 554 587 671 2,202 597 620 738 663 2,618 610 508 616 677 2,411 604 611 622 682 2,519
Adjusted operating income(1,2) 386 554 587 671 2,198 597 620 670 663 2,550 610 508 616 677 2,411 553 611 622 682 2,468
Other income and charges – 3 1 15 19 73 (5) 168 99 335 (181) (9) 71 74 (45) (28) (61) (105) 16 (178)
Other components of net periodic benefit recovery (1) (33) (33) (34) (37) (137) (15) (26) (15) (14) (70) (43) (43) (41) (40) (167) (67) (68) (68) (71) (274)
Net interest expense 70 69 70 73 282 85 84 103 122 394 124 115 116 116 471 120 122 115 116 473
Income before income tax expense 353 515 550 620 2,038 454 567 482 456 1,959 710 445 470 527 2,152 579 618 680 621 2,498
Income tax expense 99 144 150 169 562 134 177 159 137 607 170 117 123 143 553 148 138 170 (363) 93
Net income $254 $371 $400 $451 $1,476 $320 $390 $323 $319 $1,352 $540 $328 $347 $384 $1,599 $431 $480 $510 $984 $2,405
Adjusted income(2) 251 371 400 460 1,482 375 404 427 419 1,625 384 312 405 448 1,549 368 407 422 469 1,666
Operating ratio(%) 74.2% 67.0% 64.8% 62.0% 66.7% 64.1% 62.4% 56.9% 60.7% 61.0% 61.7% 65.0% 60.4% 58.7% 61.3% 62.4% 62.8% 61.0% 60.2% 61.6%
Adjusted operating ratio(%) (1,2) 74.4% 67.0% 64.8% 62.0% 66.7% 64.1% 62.4% 60.9% 60.7% 62.0% 61.7% 65.0% 60.4% 58.7% 61.3% 65.6% 62.8% 61.0% 60.2% 62.4%
Diluted earnings per share $1.44 $2.11 $2.31 $2.63 $8.46 $1.92 $2.36 $2.04 $2.08 $8.40 $3.51 $2.15 $2.34 $2.61
$10.63 $2.93 $3.27 $3.50 $6.77 $16.44
Adjusted diluted earnings per share (2) $1.42 $2.11 $2.31 $2.68 $8.50 $2.26 $2.45 $2.69 $2.72
$10.10 $2.50 $2.05 $2.73 $3.04
$10.29 $2.50 $2.77 $2.90 $3.22 $11.39
Weighted average number of diluted shares outstanding (millions) 177.0 175.9 173.5 170.9 174.4 166.3 165.0 158.7 154.0 161.0 153.8 152.6 148.3 147.3 150.5 147.1 146.9 145.8 145.4 146.3
FOREIGN EXCHANGE
Average foreign exchange rate (US$/Canadian$)
0.92 0.91 0.93 0.88 0.91 0.81 0.81 0.76 0.75 0.78 0.73 0.78 0.77 0.75 0.75 0.76 0.74 0.80 0.79 0.77
Average foreign exchange rate (Canadian$/US$)
1.09 1.10 1.08 1.13 1.10 1.24 1.23 1.31 1.34 1.28 1.37 1.29 1.30 1.33 1.33 1.32 1.35 1.25 1.27 1.30
(1) Comparative figures were restated to reflect the adoption of the new accounting standard for presentation of net periodic benefit recovery. For a full description and reconciliation of the restatement see Exhibit 99.1 of the Form 8-K dated February 16, 2018 on investor.cpr.ca
(2) These measures are defined and reconciled in Non-GAAP Measures on page 16.
FIN
AN
CIA
LS
FINANCIALSHIGH-LIGHTS
INV
ESTO
R FA
CT
BOO
K –
2018
DAT
A S
UPP
LEM
ENT
11
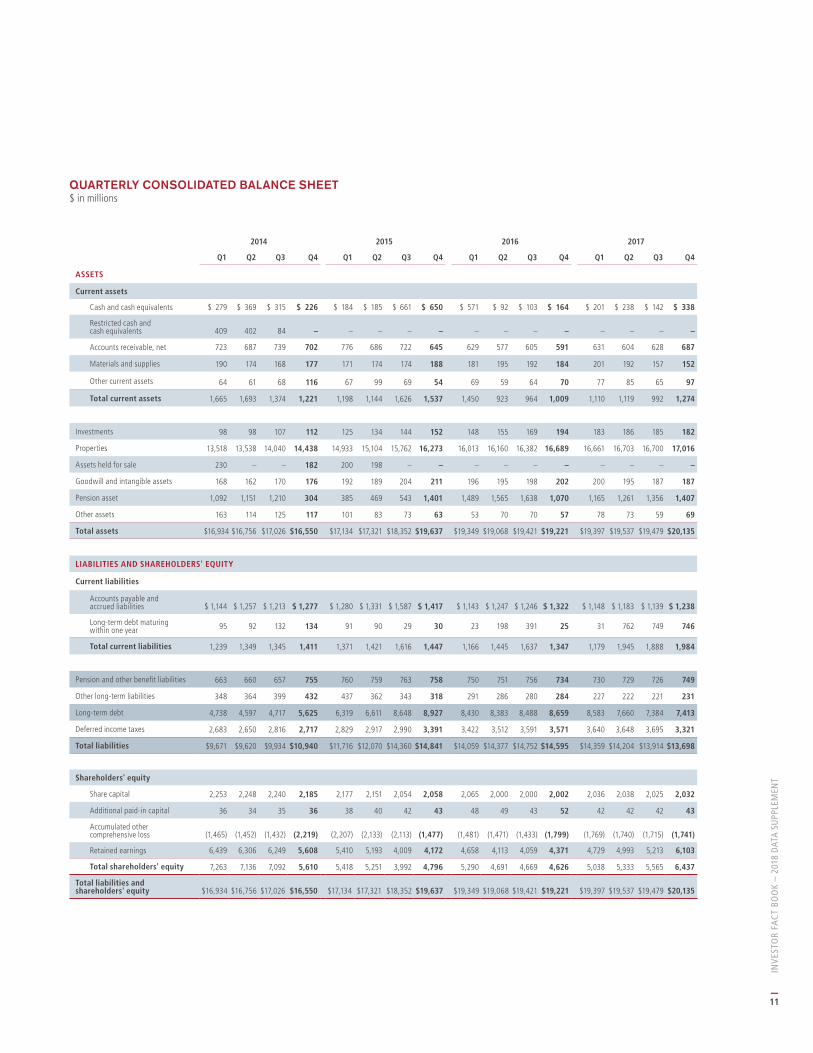
QUARTERLY CONSOLIDATED BALANCE SHEET$ in millions
2014 2015 2016 2017
Q1 Q2 Q3 Q4 Q1 Q2 Q3 Q4 Q1 Q2 Q3 Q4 Q1 Q2 Q3 Q4
ASSETS
Current assets
Cash and cash equivalents $ 279 $ 369 $ 315 $ 226 $ 184 $ 185 $ 661 $ 650 $ 571 $ 92 $ 103 $ 164 $ 201 $ 238 $ 142 $ 338
Restricted cash and cash equivalents 409 402 84 – – – – – – – – – – – – –
Accounts receivable, net 723 687 739 702 776 686 722 645 629 577 605 591 631 604 628 687
Materials and supplies 190 174 168 177 171 174 174 188 181 195 192 184 201 192 157 152
Other current assets 64 61 68 116 67 99 69 54 69 59 64 70 77 85 65 97
Total current assets 1,665 1,693 1,374 1,221 1,198 1,144 1,626 1,537 1,450 923 964 1,009 1,110 1,119 992 1,274
Investments 98 98 107 112 125 134 144 152 148 155 169 194 183 186 185 182
Properties 13,518 13,538 14,040 14,438 14,933 15,104 15,762 16,273 16,013 16,160 16,382 16,689 16,661 16,703 16,700 17,016
Assets held for sale 230 – – 182 200 198 – – – – – – – – – –
Goodwill and intangible assets 168 162 170 176 192 189 204 211 196 195 198 202 200 195 187 187
Pension asset 1,092 1,151 1,210 304 385 469 543 1,401 1,489 1,565 1,638 1,070 1,165 1,261 1,356 1,407
Other assets 163 114 125 117 101 83 73 63 53 70 70 57 78 73 59 69
Total assets $16,934 $16,756 $17,026 $16,550 $17,134 $17,321 $18,352 $19,637 $19,349 $19,068 $19,421 $19,221 $19,397 $19,537 $19,479 $20,135
LIABILITIES AND SHAREHOLDERS' EQUITY
Current liabilities
Accounts payable and accrued liabilities $ 1,144 $ 1,257 $ 1,213 $ 1,277 $ 1,280 $ 1,331 $ 1,587 $ 1,417 $ 1,143 $ 1,247 $ 1,246 $ 1,322 $ 1,148 $ 1,183 $ 1,139 $ 1,238
Long-term debt maturing within one year 95 92 132 134 91 90 29 30 23 198 391 25 31 762 749 746
Total current liabilities 1,239 1,349 1,345 1,411 1,371 1,421 1,616 1,447 1,166 1,445 1,637 1,347 1,179 1,945 1,888 1,984
Pension and other benefit liabilities 663 660 657 755 760 759 763 758 750 751 756 734 730 729 726 749
Other long-term liabilities 348 364 399 432 437 362 343 318 291 286 280 284 227 222 221 231
Long-term debt 4,738 4,597 4,717 5,625 6,319 6,611 8,648 8,927 8,430 8,383 8,488 8,659 8,583 7,660 7,384 7,413
Deferred income taxes 2,683 2,650 2,816 2,717 2,829 2,917 2,990 3,391 3,422 3,512 3,591 3,571 3,640 3,648 3,695 3,321
Total liabilities $9,671 $9,620 $9,934 $10,940 $11,716 $12,070 $14,360 $14,841 $14,059 $14,377 $14,752 $14,595 $14,359 $14,204 $13,914 $13,698
Shareholders' equity
Share capital 2,253 2,248 2,240 2,185 2,177 2,151 2,054 2,058 2,065 2,000 2,000 2,002 2,036 2,038 2,025 2,032
Additional paid-in capital 36 34 35 36 38 40 42 43 48 49 43 52 42 42 42 43
Accumulated other comprehensive loss (1,465) (1,452) (1,432) (2,219) (2,207) (2,133) (2,113) (1,477) (1,481) (1,471) (1,433) (1,799) (1,769) (1,740) (1,715) (1,741)
Retained earnings 6,439 6,306 6,249 5,608 5,410 5,193 4,009 4,172 4,658 4,113 4,059 4,371 4,729 4,993 5,213 6,103
Total shareholders' equity 7,263 7,136 7,092 5,610 5,418 5,251 3,992 4,796 5,290 4,691 4,669 4,626 5,038 5,333 5,565 6,437
Total liabilities and shareholders' equity $16,934 $16,756 $17,026 $16,550 $17,134 $17,321 $18,352 $19,637 $19,349 $19,068 $19,421 $19,221 $19,397 $19,537 $19,479 $20,135
INV
ESTO
R FA
CT
BOO
K –
2018
DAT
A S
UPP
LEM
ENT
12
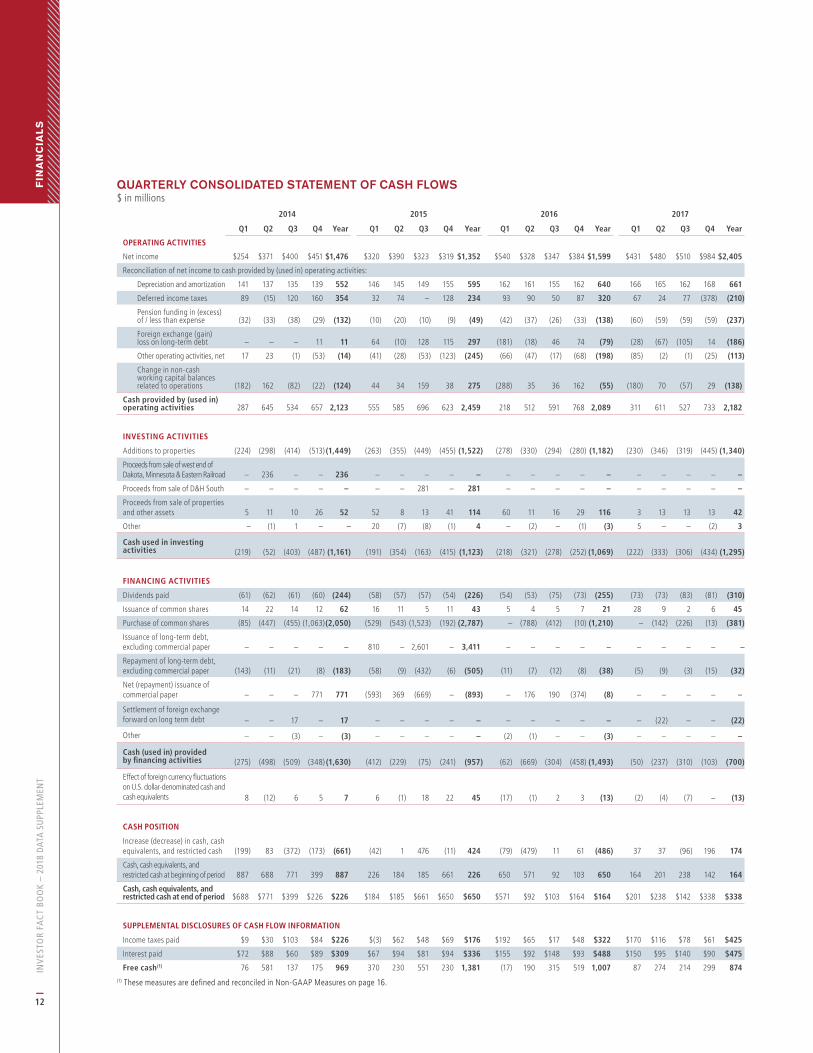
QUARTERLY CONSOLIDATED STATEMENT OF CASH FLOWS$ in millions
2014 2015 2016 2017
Q1 Q2 Q3 Q4 Year Q1 Q2 Q3 Q4 Year Q1 Q2 Q3 Q4 Year Q1 Q2 Q3 Q4 Year
OPERATING ACTIVITIES
Net income $254 $371 $400 $451 $1,476 $320 $390 $323 $319 $1,352 $540 $328 $347 $384 $1,599 $431 $480 $510 $984 $2,405
Reconciliation of net income to cash provided by (used in) operating activities:
Depreciation and amortization 141 137 135 139 552 146 145 149 155 595 162 161 155 162 640 166 165 162 168 661
Deferred income taxes 89 (15) 120 160 354 32 74 – 128 234 93 90 50 87 320 67 24 77 (378) (210)
Pension funding in (excess) of / less than expense (32) (33) (38) (29) (132) (10) (20) (10) (9) (49) (42) (37) (26) (33) (138) (60) (59) (59) (59) (237)
Foreign exchange (gain) loss on long-term debt – – – 11 11 64 (10) 128 115 297 (181) (18) 46 74 (79) (28) (67) (105) 14 (186)
Other operating activities, net 17 23 (1) (53) (14) (41) (28) (53) (123) (245) (66) (47) (17) (68) (198) (85) (2) (1) (25) (113)
Change in non-cash working capital balances related to operations (182) 162 (82) (22) (124) 44 34 159 38 275 (288) 35 36 162 (55) (180) 70 (57) 29 (138)
Cash provided by (used in) operating activities 287 645 534 657 2,123 555 585 696 623 2,459 218 512 591 768 2,089 311 611 527 733 2,182
INVESTING ACTIVITIES
Additions to properties (224) (298) (414) (513) (1,449) (263) (355) (449) (455) (1,522) (278) (330) (294) (280) (1,182) (230) (346) (319) (445) (1,340)
Proceeds from sale of west end of Dakota, Minnesota & Eastern Railroad – 236 – – 236 – – – – – – – – – – – – – – –
Proceeds from sale of D&H South – – – – – – – 281 – 281 – – – – – – – – – –
Proceeds from sale of properties and other assets 5 11 10 26 52 52 8 13 41 114 60 11 16 29 116 3 13 13 13 42
Other – (1) 1 – – 20 (7) (8) (1) 4 – (2) – (1) (3) 5 – – (2) 3
Cash used in investing activities (219) (52) (403) (487) (1,161) (191) (354) (163) (415) (1,123) (218) (321) (278) (252)
(1,069) (222) (333) (306) (434) (1,295)
FINANCING ACTIVITIES
Dividends paid (61) (62) (61) (60) (244) (58) (57) (57) (54) (226) (54) (53) (75) (73) (255) (73) (73) (83) (81) (310)
Issuance of common shares 14 22 14 12 62 16 11 5 11 43 5 4 5 7 21 28 9 2 6 45
Purchase of common shares (85) (447) (455) (1,063)(2,050) (529) (543) (1,523) (192) (2,787) – (788) (412) (10) (1,210) – (142) (226) (13) (381)
Issuance of long-term debt, excluding commercial paper – – – – – 810 – 2,601 – 3,411 – – – – – – – – – –
Repayment of long-term debt, excluding commercial paper (143) (11) (21) (8) (183) (58) (9) (432) (6) (505) (11) (7) (12) (8) (38) (5) (9) (3) (15) (32)
Net (repayment) issuance of commercial paper – – – 771 771 (593) 369 (669) – (893) – 176 190 (374) (8) – – – – –
Settlement of foreign exchange forward on long term debt – – 17 – 17 – – – – – – – – – – – (22) – – (22)
Other – – (3) – (3) – – – – – (2) (1) – – (3) – – – – –
Cash (used in) provided by financing activities (275) (498) (509) (348)
(1,630) (412) (229) (75) (241) (957) (62) (669) (304) (458) (1,493) (50) (237) (310) (103) (700)
Effect of foreign currency fluctuations on U.S. dollar-denominated cash and cash equivalents 8 (12) 6 5 7 6 (1) 18 22 45 (17) (1) 2 3 (13) (2) (4) (7) – (13)
CASH POSITION
Increase (decrease) in cash, cash equivalents, and restricted cash (199) 83 (372) (173) (661) (42) 1 476 (11) 424 (79) (479) 11 61 (486) 37 37 (96) 196 174
Cash, cash equivalents, and restricted cash at beginning of period 887 688 771 399 887 226 184 185 661 226 650 571 92 103 650 164 201 238 142 164
Cash, cash equivalents, and restricted cash at end of period $688 $771 $399 $226 $226 $184 $185 $661 $650 $650 $571 $92 $103 $164 $164 $201 $238 $142 $338 $338
SUPPLEMENTAL DISCLOSURES OF CASH FLOW INFORMATION
Income taxes paid $9 $30 $103 $84 $226 $(3) $62 $48 $69 $176 $192 $65 $17 $48 $322 $170 $116 $78 $61 $425
Interest paid $72 $88 $60 $89 $309 $67 $94 $81 $94 $336 $155 $92 $148 $93 $488 $150 $95 $140 $90 $475
Free cash(1) 76 581 137 175 969 370 230 551 230 1,381 (17) 190 315 519 1,007 87 274 214 299 874 (1) These measures are defined and reconciled in Non-GAAP Measures on page 16.
FIN
AN
CIA
LS

INV
ESTO
R FA
CT
BOO
K –
2018
DAT
A S
UPP
LEM
ENT
13
QUARTERLY STATISTICAL DATA
2014(1) 2015(1) 2016(1) 2017(1)
Q1 Q2 Q3 Q4 Year Q1 Q2 Q3 Q4 Year Q1 Q2 Q3 Q4 Year Q1 Q2 Q3 Q4 Year
OPERATIONS PERFORMANCE
Gross ton-miles ("GTMs") (millions) 62,097 70,756 68,800 71,209 272,862 65,355 66,598 65,273 66,117 263,344 62,219 57,945 60,297 62,233 242,694 60,827 63,757 62,311 65,296 252,195
Train miles (thousands) 8,770 9,297 8,977 9,208 36,252 8,540 8,705 8,427 8,390 34,064 7,930 7,391 7,305 7,748 30,373 7,511 7,830 7,444 7,845 30,632
Average train weight - excluding local traffic (tons)
7,625 8,149 8,234 8,278 8,076 8,183 8,253 8,322 8,505 8,314 8,480 8,513 8,891 8,588 8,614 8,647 8,695 8,990 8,897 8,806
Average train length - excluding local traffic (feet) 6,276 6,789 6,827 6,819 6,682 6,773 6,989 6,944 7,036 6,935 7,103 7,271 7,411 7,100 7,217 7,143 7,138 7,301 7,276 7,214
Average terminal dwell (hours) 10.3 8.6 8.1 8.1 8.7 8.9 6.7 6.6 6.6 7.2 6.9 6.5 7.0 6.4 6.7 7.1 5.8 6.6 6.9 6.6
Average train speed (mph) 16.1 18.0 18.6 19.3 18.0 19.5 21.7 22.2 22.8 21.4 23.4 24.1 23.9 22.9 23.5 22.3 23.3 23.1 21.9 22.6
Fuel efficiency (U.S. gallons of locomotive fuel consumed /1,000 GTMs) 1.115 1.004 1.000 1.031 1.035 1.049 0.998 0.955 0.996 0.999 1.002 0.979 0.940 0.996 0.980 1.012 0.979 0.944 0.984 0.980
U.S. gallons of locomotive fuel consumed (millions) 68.3 70.3 68.0 72.7 279.3 68.0 65.8 62.1 65.8 261.7 62.0 56.3 56.3 61.6 236.2 61.0 61.9 58.4 63.9 245.3
Average fuel price (U.S. dollars per U.S. gallon) 3.63 3.53 3.39 3.11 3.41 2.32 2.30 2.00 1.91 2.13 1.48 1.82 1.88 2.01 1.80 2.11 2.02 2.08 2.43 2.16
EMPLOYEES
Total employees (average) 14,374 14,851 14,705 14,485 14,604 14,364 14,195 13,709 13,163 13,858 12,434 12,341 11,750 11,803 12,082 11,648 12,173 12,149 12,165 12,034
Total employees (end of period) 14,670 14,756 14,658 14,255 14,255 14,259 14,071 13,530 12,817 12,817 12,443 11,988 11,773 11,653 11,653 11,794 12,184 12,135 12,163 12,163
Workforce (end of period) 14,680 14,882 14,793 14,385 14,385 14,342 14,128 13,601 12,899 12,899 12,508 12,033 11,827 11,698 11,698 11,829 12,239 12,219 12,242 12,242
SAFETY
FRA personal injuries per 200,000 employee-hours
1.60 1.74 1.57 1.78 1.67 2.09 1.43 1.87 1.99 1.84 1.45 1.36 1.87 2.02 1.67 1.85 1.53 1.58 1.66 1.65
FRA train accidents per million train miles
1.12 1.15 1.62 1.18 1.26 1.48 1.45 1.29 1.41 1.41 0.93 0.74 1.63 1.19 1.12 0.85 1.18 0.99 0.94 0.99
(1) Certain statistical highlights and safety indicators figures have been updated to reflect new information or have been revised to conform with current presentation.
OPERATING METRICS
INV
ESTO
R FA
CT
BOO
K –
2018
DAT
A S
UPP
LEM
ENT
14
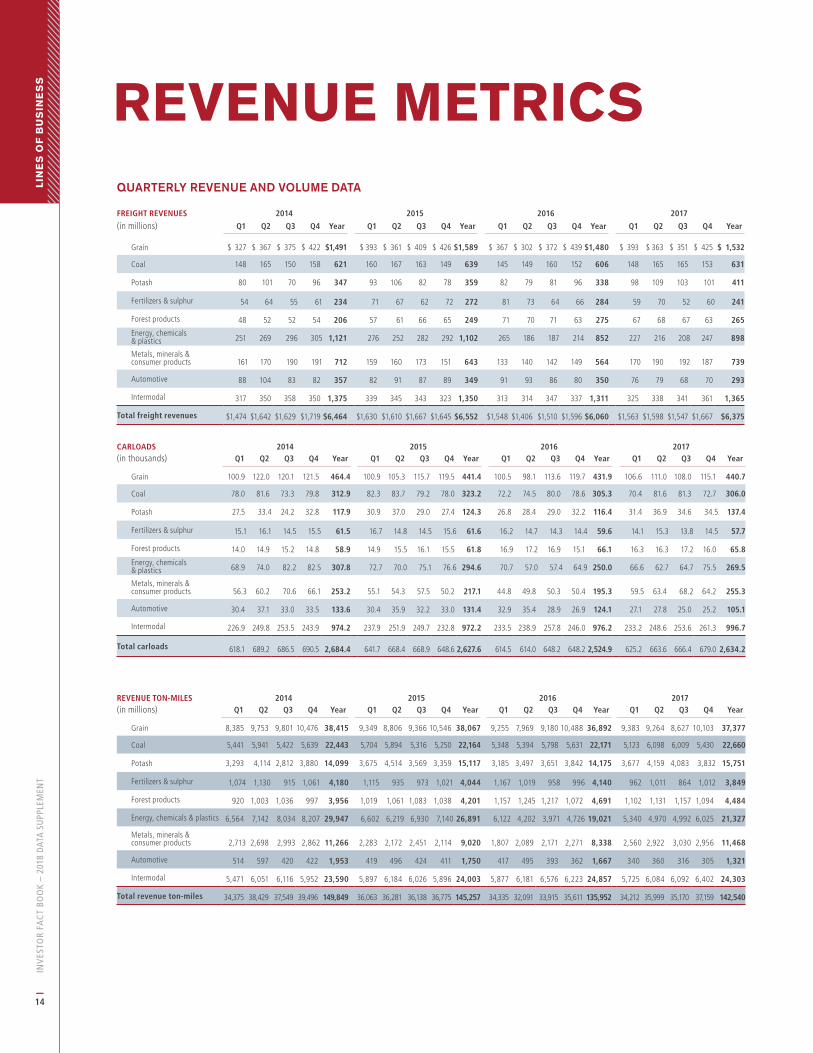
QUARTERLY REVENUE AND VOLUME DATA
FREIGHT REVENUES 2014 2015 2016 2017
(in millions) Q1 Q2 Q3 Q4 Year Q1 Q2 Q3 Q4 Year Q1 Q2 Q3 Q4 Year Q1 Q2 Q3 Q4 Year
Grain $ 327 $ 367 $ 375 $ 422 $1,491 $ 393 $ 361 $ 409 $ 426
$1,589 $ 367 $ 302 $ 372 $ 439
$1,480 $ 393 $ 363 $ 351 $ 425 $ 1,532
Coal 148 165 150 158 621 160 167 163 149 639 145 149 160 152 606 148 165 165 153 631
Potash 80 101 70 96 347 93 106 82 78 359 82 79 81 96 338 98 109 103 101 411
Fertilizers & sulphur 54 64 55 61 234 71 67 62 72 272 81 73 64 66 284 59 70 52 60 241
Forest products 48 52 52 54 206 57 61 66 65 249 71 70 71 63 275 67 68 67 63 265
Energy, chemicals & plastics 251 269 296 305 1,121 276 252 282 292 1,102 265 186 187 214 852 227 216 208 247 898
Metals, minerals & consumer products 161 170 190 191 712 159 160 173 151 643 133 140 142 149 564 170 190 192 187 739
Automotive 88 104 83 82 357 82 91 87 89 349 91 93 86 80 350 76 79 68 70 293
Intermodal 317 350 358 350 1,375 339 345 343 323 1,350 313 314 347 337 1,311 325 338 341 361 1,365
Total freight revenues $1,474 $1,642 $1,629 $1,719 $6,464 $1,630 $1,610 $1,667 $1,645 $6,552 $1,548 $1,406 $1,510 $1,596 $6,060 $1,563 $1,598 $1,547 $1,667 $6,375
CARLOADS 2014 2015 2016 2017(in thousands) Q1 Q2 Q3 Q4 Year Q1 Q2 Q3 Q4 Year Q1 Q2 Q3 Q4 Year Q1 Q2 Q3 Q4 Year
Grain 100.9 122.0 120.1 121.5 464.4 100.9 105.3 115.7 119.5 441.4 100.5 98.1 113.6 119.7 431.9 106.6 111.0 108.0 115.1 440.7
Coal 78.0 81.6 73.3 79.8 312.9 82.3 83.7 79.2 78.0 323.2 72.2 74.5 80.0 78.6 305.3 70.4 81.6 81.3 72.7 306.0
Potash 27.5 33.4 24.2 32.8 117.9 30.9 37.0 29.0 27.4 124.3 26.8 28.4 29.0 32.2 116.4 31.4 36.9 34.6 34.5 137.4
Fertilizers & sulphur 15.1 16.1 14.5 15.5 61.5 16.7 14.8 14.5 15.6 61.6 16.2 14.7 14.3 14.4 59.6 14.1 15.3 13.8 14.5 57.7
Forest products 14.0 14.9 15.2 14.8 58.9 14.9 15.5 16.1 15.5 61.8 16.9 17.2 16.9 15.1 66.1 16.3 16.3 17.2 16.0 65.8
Energy, chemicals & plastics 68.9 74.0 82.2 82.5 307.8 72.7 70.0 75.1 76.6 294.6 70.7 57.0 57.4 64.9 250.0 66.6 62.7 64.7 75.5 269.5
Metals, minerals & consumer products 56.3 60.2 70.6 66.1 253.2 55.1 54.3 57.5 50.2 217.1 44.8 49.8 50.3 50.4 195.3 59.5 63.4 68.2 64.2 255.3
Automotive 30.4 37.1 33.0 33.5 133.6 30.4 35.9 32.2 33.0 131.4 32.9 35.4 28.9 26.9 124.1 27.1 27.8 25.0 25.2 105.1
Intermodal 226.9 249.8 253.5 243.9 974.2 237.9 251.9 249.7 232.8 972.2 233.5 238.9 257.8 246.0 976.2 233.2 248.6 253.6 261.3 996.7
Total carloads 618.1 689.2 686.5 690.5 2,684.4 641.7 668.4 668.9 648.6
2,627.6 614.5 614.0 648.2 648.2
2,524.9 625.2 663.6 666.4 679.0
2,634.2
REVENUE TON-MILES 2014 2015 2016 2017(in millions) Q1 Q2 Q3 Q4 Year Q1 Q2 Q3 Q4 Year Q1 Q2 Q3 Q4 Year Q1 Q2 Q3 Q4 Year
Grain 8,385 9,753 9,801 10,476 38,415 9,349 8,806 9,366 10,546 38,067 9,255 7,969 9,180 10,488 36,892 9,383 9,264 8,627 10,103 37,377
Coal 5,441 5,941 5,422 5,639 22,443 5,704 5,894 5,316 5,250 22,164 5,348 5,394 5,798 5,631 22,171 5,123 6,098 6,009 5,430 22,660
Potash 3,293 4,114 2,812 3,880 14,099 3,675 4,514 3,569 3,359 15,117 3,185 3,497 3,651 3,842 14,175 3,677 4,159 4,083 3,832 15,751
Fertilizers & sulphur 1,074 1,130 915 1,061 4,180 1,115 935 973 1,021 4,044 1,167 1,019 958 996 4,140 962 1,011 864 1,012 3,849
Forest products 920 1,003 1,036 997 3,956 1,019 1,061 1,083 1,038 4,201 1,157 1,245 1,217 1,072 4,691 1,102 1,131 1,157 1,094 4,484
Energy, chemicals & plastics 6,564 7,142 8,034 8,207 29,947 6,602 6,219 6,930 7,140 26,891 6,122 4,202 3,971 4,726 19,021 5,340 4,970 4,992 6,025 21,327
Metals, minerals & consumer products 2,713 2,698 2,993 2,862 11,266 2,283 2,172 2,451 2,114 9,020 1,807 2,089 2,171 2,271 8,338 2,560 2,922 3,030 2,956 11,468
Automotive 514 597 420 422 1,953 419 496 424 411 1,750 417 495 393 362 1,667 340 360 316 305 1,321
Intermodal 5,471 6,051 6,116 5,952 23,590 5,897 6,184 6,026 5,896 24,003 5,877 6,181 6,576 6,223 24,857 5,725 6,084 6,092 6,402 24,303
Total revenue ton-miles 34,375 38,429 37,549 39,496 149,849 36,063 36,281 36,138 36,775 145,257 34,335 32,091 33,915 35,611 135,952 34,212 35,999 35,170 37,159 142,540
REVENUE METRICSL
INE
S O
F B
US
INE
SS

INV
ESTO
R FA
CT
BOO
K –
2018
DAT
A S
UPP
LEM
ENT
15
FREIGHT REVENUE PER CARLOAD 2014 2015 2016 2017(in dollars) Q1 Q2 Q3 Q4 Year Q1 Q2 Q3 Q4 Year Q1 Q2 Q3 Q4 Year Q1 Q2 Q3 Q4 Year
Grain $3,238 $3,014 $3,122 $3,477 $3,212 $3,893 $3,433 $3,537 $3,560
$3,600 $3,658 $3,081 $3,272 $3,659
$3,426
$3,688 $3,273 $3,251 $3,690 $3,477
Coal 1,897 2,027 2,040 1,979 1,985 1,939 1,996 2,057 1,920 1,978 2,001 2,001 2,007 1,932 1,984 2,096 2,030 2,021 2,106 2,061
Potash 2,902 3,046 2,917 2,915 2,941 3,028 2,854 2,816 2,849 2,887 3,064 2,800 2,782 2,973 2,904 3,130 2,946 2,978 2,916 2,988
Fertilizers & sulphur 3,533 3,925 3,835 3,834 3,801 4,268 4,508 4,265 4,604 4,410 4,993 4,981 4,476 4,593 4,769 4,217 4,527 3,814 4,118 4,178
Forest products 3,400 3,502 3,426 3,641 3,493 3,857 3,902 4,113 4,227 4,026 4,216 4,055 4,211 4,158 4,157 4,128 4,182 3,870 3,974 4,036
Energy, chemicals & plastics 3,633 3,649 3,596 3,692 3,643 3,801 3,609 3,749 3,788 3,739 3,753 3,264 3,254 3,302 3,410 3,412 3,431 3,227 3,271 3,333
Metals, minerals & consumer products 2,869 2,810 2,697 2,895 2,814 2,878 2,946 3,026 3,005 2,963 2,977 2,800 2,821 2,964 2,888 2,851 3,011 2,806 2,911 2,894
Automotive 2,913 2,798 2,519 2,455 2,670 2,692 2,541 2,719 2,698 2,659 2,754 2,629 2,985 3,006 2,825 2,792 2,831 2,737 2,776 2,785
Intermodal 1,396 1,403 1,409 1,437 1,411 1,426 1,369 1,374 1,387 1,388 1,338 1,316 1,345 1,368 1,342 1,391 1,362 1,343 1,384 1,370
Total freight revenue per carload $2,385 $2,383 $2,372 $2,489 $2,408 $2,541 $2,409 $2,493 $2,534 $2,493 $2,520 $2,291 $2,328 $2,462
$2,400 $2,499 $2,409 $2,321 $2,455 $2,420
FREIGHT REVENUE PER RTM 2014 2015 2016 2017(in cents) Q1 Q2 Q3 Q4 Year Q1 Q2 Q3 Q4 Year Q1 Q2 Q3 Q4 Year Q1 Q2 Q3 Q4 Year
Grain 3.90 3.77 3.83 4.03 3.88 4.20 4.10 4.37 4.04 4.17 3.97 3.79 4.05 4.17 4.01 4.19 3.92 4.07 4.21 4.10
Coal 2.72 2.79 2.76 2.80 2.77 2.80 2.83 3.07 2.85 2.88 2.70 2.76 2.77 2.70 2.73 2.88 2.72 2.73 2.82 2.78
Potash 2.41 2.46 2.51 2.46 2.46 2.54 2.34 2.29 2.32 2.37 2.58 2.27 2.21 2.49 2.38 2.67 2.61 2.53 2.62 2.61
Fertilizers & sulphur 4.98 5.61 6.06 5.70 5.59 6.40 7.12 6.38 7.00 6.71 6.93 7.16 6.68 6.68 6.87 6.17 6.87 6.08 5.91 6.27
Forest products 5.18 5.20 5.01 5.42 5.20 5.64 5.73 6.07 6.24 5.92 6.17 5.59 5.86 5.86 5.86 6.11 6.01 5.78 5.79 5.92
Energy, chemicals & plastics 3.81 3.78 3.67 3.73 3.74 4.19 4.06 4.06 4.08 4.10 4.33 4.43 4.71 4.53 4.48 4.25 4.33 4.18 4.10 4.21
Metals, minerals & consumer products 5.95 6.27 6.36 6.69 6.32 6.94 7.37 7.08 7.15 7.13 7.38 6.68 6.53 6.59 6.77 6.63 6.52 6.32 6.32 6.44
Automotive 17.23 17.37 19.74 19.26 18.26 19.49 18.37 20.64 21.71 19.97 21.75 18.79 21.91 22.31 21.02 22.29 21.82 21.62 22.91 22.15
Intermodal 5.79 5.79 5.84 5.89 5.83 5.75 5.58 5.69 5.48 5.62 5.32 5.09 5.27 5.41 5.27 5.66 5.56 5.59 5.65 5.62
Total freight revenue per RTM 4.29 4.27 4.34 4.35 4.31 4.52 4.44 4.61 4.47 4.51 4.51 4.38 4.45 4.48 4.46 4.57 4.44 4.40 4.49 4.47
INV
ESTO
R FA
CT
BOO
K –
2018
DAT
A S
UPP
LEM
ENT
16
The Company presents non-GAAP measures
and cash flow information to provide a basis for
evaluating underlying earnings and liquidity trends
in the Company’s business that can be compared
with the results of operations in prior periods. In
addition, these non-GAAP measures facilitate a
multi-period assessment of long-term profitability,
allowing management and other external users of
the Company’s consolidated financial information
to compare profitability on a long-term basis,
including assessing future profitability, with that
of the Company’s peers.
These non-GAAP measures have no standardized
meaning and are not defined by GAAP and,
therefore may not be comparable to similar
measures presented by other companies. The
presentation of non-GAAP measures is not
intended to be considered in isolation from, as
a substitute for, or as superior to the financial
information presented in accordance with GAAP.
A D J U S T E D P E R F O R M A N C E M E A S U R E S
The Company uses Adjusted income, Adjusted
diluted earnings per share, Adjusted operating
income, and Adjusted operating ratio to evaluate
the Company’s operating performance and
for planning and forecasting future business
operations and future profitability. These non-
GAAP measures provide meaningful supplemental
information regarding operating results because
they exclude certain significant items that are not
considered indicative of future financial trends
either by nature or amount. As a result, these
items are excluded for management assessment of
operational performance, allocation of resources
and preparation of annual budgets. These
significant items may include, but are not limited
to, restructuring and asset impairment charges,
individually significant gains and losses from sales
of assets, and certain items outside the control
of management. These items may not be non-
recurring. However, excluding these significant
items from GAAP results allows for a consistent
understanding of the Company’s consolidated
financial performance when performing a
multi-period assessment including assessing the
likelihood of future results. Accordingly, these
non-GAAP financial measures may provide insight
to investors and other external users of the
Company’s consolidated financial information.
In 2012, there were six significant items included
in Net income as follows:
• during the course of the year, advisory fees
of $27 million ($20 million after current tax)
related to shareholder matters as follows:
� in the first quarter, advisory fees of $14
million ($10 million after current tax) related
to shareholder matters that unfavourably
impacted Diluted EPS by 6 cents; and
� in the second quarter, advisory fees of $13
million ($10 million after current tax) related
to shareholder matters that unfavourably
impacted Diluted EPS by 6 cents;
• in the second quarter, a deferred income tax
expense of $11 million as a result of the change
in the province of Ontario’s corporate income
tax rate that unfavourably impacted Diluted EPS
by 6 cents;
• in the second quarter, a charge of $42 million
($29 million after current tax) with respect
to compensation and other management
transition costs that unfavourably impacted
Diluted EPS by 17 cents;
• in the fourth quarter, an asset impairment
charge of $185 million ($111 million after
deferred tax) with respect to the option to
NON-GAAP MEASURES
NO
N-G
AA
P M
EA
SU
RE
S
INV
ESTO
R FA
CT
BOO
K –
2018
DAT
A S
UPP
LEM
ENT
17
build into the Powder River Basin and another
investment that unfavourably impacted Diluted
EPS by 64 cents;
• in the fourth quarter, an asset impairment charge
of $80 million ($59 million after deferred tax)
related to a certain series of locomotives that
unfavourably impacted Diluted EPS by 34 cents;
and
• in the fourth quarter, a labour restructuring
charge of $53 million ($39 million after current
tax) as part of a restructuring initiative that
unfavourably impacted Diluted EPS by 22 cents.
In 2013, there were five significant items included
in Net income as follows:
• in the first quarter, a recovery of U.S. $9 million
(U.S. $6 million after current tax) related to
settlement of certain management transition
amounts, which had been subject to legal
proceedings, that favourably impacted Diluted
EPS by 3 cents;
• in the third quarter, a deferred income tax
expense of $7 million as a result of the change
in the province of British Columbia’s corporate
income tax rate that unfavourably impacted
Diluted EPS by 4 cents;
• in the fourth quarter, an asset impairment
charge and accruals for future costs totalling
$435 million ($257 million after deferred tax)
relating to the sale of DM&E West, which
closed in the second quarter of 2014 and
unfavourably impacted Diluted EPS by $1.46;
• in the fourth quarter, management transition
costs related to the retirement of the
Company’s CFO and the appointment of the
new CFO of $5 million ($4 million after current
tax) that unfavourably impacted Diluted EPS by
2 cents; and
• in the fourth quarter, a recovery of $7 million
($5 million after current tax) of the Company’s
2012 labour restructuring initiative due to
favourable experience gains that favourably
impacted Diluted EPS by 3 cents.
In 2014, there were two significant items included
in Net income as follows:
• in the first quarter, a recovery of $4 million
($3 million after current tax) was recorded
for the Company’s 2012 labour restructuring
initiative due to favourable experience gains,
recorded in Compensation and benefits that
favourably impacted Diluted EPS by 1 cent; and
• in the fourth quarter, a net non-cash loss of
$12 million ($9 million after deferred tax) due to
FX translation on the Company’s U.S. dollar-
denominated debt that unfavourably impacted
Diluted EPS by 5 cents.
In 2015, there were four significant items included
in Net income as follows:
• in the second quarter, a deferred income tax
expense of $23 million as a result of the change
in the Alberta provincial corporate income tax
rate that unfavourably impacted Diluted EPS by
14 cents;
• in the third quarter, a $68 million gain
($42 million after current tax) related to the sale
of D&H South that favourably impacted Diluted
EPS by 26 cents;
• in the third quarter, a $47 million charge
($35 million after deferred tax) related to the early
redemption premium on notes that unfavourably
impacted Diluted EPS by 22 cents; and
• during the course of the year, a net non-cash
loss of $297 million ($257 million after deferred
tax) due to FX translation of the Company’s U.S.
dollar-denominated debt as follows:
� in the first quarter, a $64 million loss
($55 million after deferred tax) that

INV
ESTO
R FA
CT
BOO
K –
2018
DAT
A S
UPP
LEM
ENT
18
unfavourably impacted Diluted EPS by 34 cents;
� in the second quarter, a $10 million gain
($9 million after deferred tax) that favourably
impacted Diluted EPS by 5 cents;
� in the third quarter, a $128 million loss
($111 million after deferred tax) that unfavourably
impacted Diluted EPS by 69 cents; and
� in the fourth quarter, a $115 million loss
($100 million after deferred tax) that
unfavourably impacted Diluted EPS by 64 cents.
In 2016, there were two significant items included
in Net income as follows:
• in the third quarter, a $25 million expense
($18 million after current tax) related to a legal
settlement that unfavourably impacted Diluted
EPS by 12 cents; and
• during the course of the year, a net non-cash
gain of $79 million ($68 million after deferred
tax) due to FX translation of the Company’s U.S.
dollar-denominated debt as follows:
� in the first quarter, a $181 million gain
($156 million after deferred tax) that
favourably impacted Diluted EPS by $1.01;
� in the second quarter, an $18 million gain
($16 million after deferred tax) that favourably
impacted Diluted EPS by 10 cents;
� in the third quarter, a $46 million loss
($40 million after deferred tax) that unfavourably
impacted Diluted EPS by 27 cents; and
� in the fourth quarter, a $74 million loss
($64 million after deferred tax) that
unfavourably impacted Diluted EPS by 43 cents.
In 2017, there were five significant items included
in Net income as follows:
• in the first quarter, a management transition
recovery of $51 million related to the retirement
of Mr. E. Hunter Harrison as CEO of CP
($39 million after deferred tax) that favourably
impacted Diluted EPS by 27 cents;
• in the second quarter, a charge on hedge roll
and de-designation of $13 million ($10 million
after deferred tax) that unfavourably impacted
Diluted EPS by 7 cents;
• in the second quarter, an insurance recovery
of a legal settlement of $10 million ($7 million
after current tax) that favourably impacted
Diluted EPS by 5 cents;
• during the course of the year, a net deferred tax
recovery of $541 million as a result of changes
in income tax rates as follows:
� in the second quarter, a deferred tax recovery
of $17 million as a result of the change in the
Saskatchewan provincial corporate income
tax rate that favourably impacted Diluted EPS
by 12 cents;
� in the third quarter, a deferred tax expense of
$3 million as a result of the change in the Illinois
state corporate income tax rate change that
unfavourably impacted Diluted EPS by 2 cents;
and
� in the fourth quarter, a deferred tax recovery
of $527 million, primarily due to the U.S. tax
reform, that favourably impacted Diluted EPS
by $3.63;
• during the course of the year, a net non-cash
gain of $186 million ($162 million after deferred
tax) due to FX translation of the Company’s U.S.
dollar-denominated debt as follows:
� in the first quarter, a $28 million gain
($24 million after deferred tax) that
favourably impacted Diluted EPS by 16 cents.
� in the second quarter, a $67 million gain
($59 million after deferred tax) that favourably
impacted Diluted EPS by 40 cents;
� in the third quarter, a $105 million gain ($91
million after deferred tax) that favourably
impacted Diluted EPS by 62 cents; and
� in the fourth quarter, a $14 million loss
($12 million after deferred tax) that
unfavourably impacted Diluted EPS by 8 cents.
NO
N-G
AA
P M
EA
SU
RE
S

INV
ESTO
R FA
CT
BOO
K –
2018
DAT
A S
UPP
LEM
ENT
19
R E C O N C I L I AT I O N O F G A A P P E R F O R M A N C E
M E A S U R E S T O N O N - G A A P P E R F O R M A N C E M E A S U R E S
The following tables reconcile the most directly
comparable measures presented in accordance
with GAAP to the non-GAAP measures:
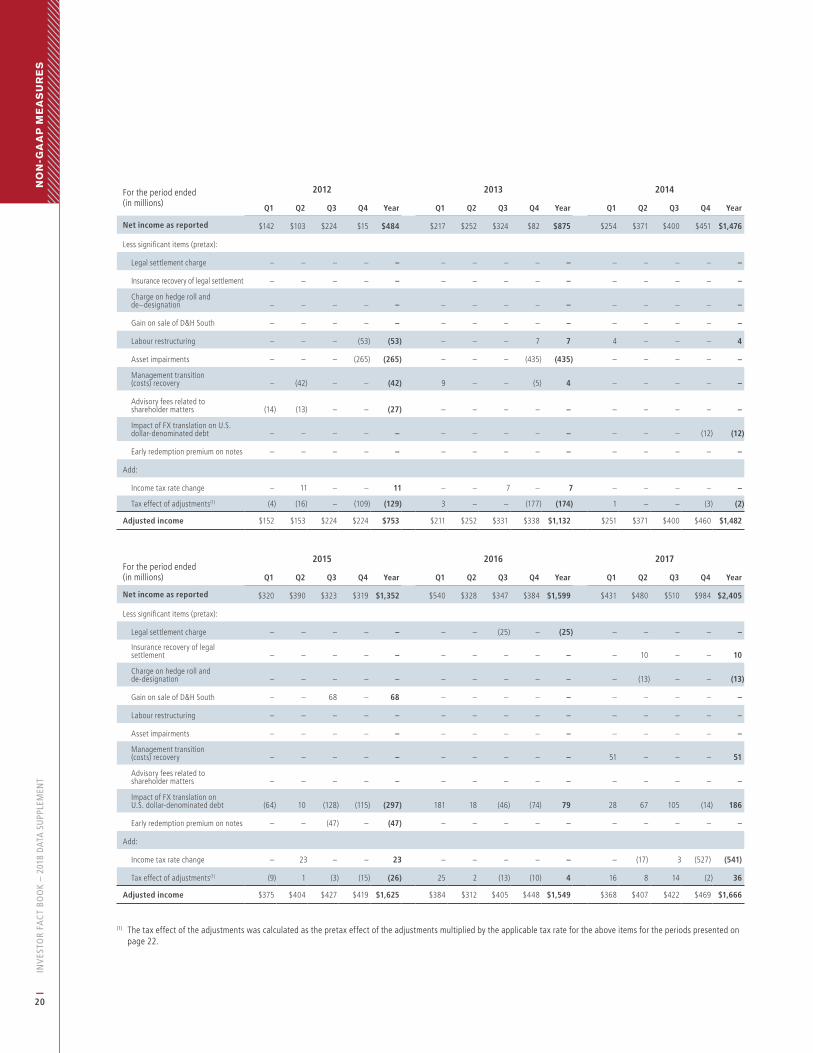
Adjusted income is calculated as Net income reported on a GAAP basis less significant items.
For the year ended December 31(in millions) 2012 2013 2014 2015 2016 2017
Net income as reported $ 484 $ 875 $ 1,476 $ 1,352 $ 1,599 $ 2,405
Less significant items (pretax):
Legal settlement charge – – – – (25) –
Insurance recovery of legal settlement – – – – – 10
Charge on hedge roll and de-designation – – – – – (13)
Gain on sale of D&H South – – – 68 – –
Labour restructuring (53) 7 4 – – –
Asset impairments (265) (435) – – – –
Management transition (costs) recovery (42) 4 – – – 51
Advisory fees related to shareholder matters (27) – – – – –
Impact of FX translation on U.S. dollar- denominated debt
– – (12) (297) 79 186
Early redemption premium on notes – – – (47) – –
Add:
Income tax rate change 11 7 – 23 – (541)
Tax effect of adjustments(1) (129) (174) (2) (26) 4 36
Adjusted income $ 753 $ 1,132 $ 1,482 $ 1,625 $ 1,549 $ 1,666
(1) The tax effect of the adjustments was calculated as the pretax effect of the adjustments multiplied by the applicable tax rate for the above items for the periods presented on page 22.
INV
ESTO
R FA
CT
BOO
K –
2018
DAT
A S
UPP
LEM
ENT
20
For the period ended(in millions)
2012 2013 2014
Q1 Q2 Q3 Q4 Year Q1 Q2 Q3 Q4 Year Q1 Q2 Q3 Q4 Year
Net income as reported $142 $103 $224 $15 $484 $217 $252 $324 $82 $875 $254 $371 $400 $451 $1,476
Less significant items (pretax):
Legal settlement charge – – – – – – – – – – – – – – –
Insurance recovery of legal settlement – – – – – – – – – – – – – – –
Charge on hedge roll and de–designation – – – – – – – – – – – – – – –
Gain on sale of D&H South – – – – – – – – – – – – – – –
Labour restructuring – – – (53) (53) – – – 7 7 4 – – – 4
Asset impairments – – – (265) (265) – – – (435) (435) – – – – –
Management transition (costs) recovery – (42) – – (42) 9 – – (5) 4 – – – – –
Advisory fees related to shareholder matters (14) (13) – – (27) – – – – – – – – – –
Impact of FX translation on U.S. dollar-denominated debt – – – – – – – – – – – – – (12) (12)
Early redemption premium on notes – – – – – – – – – – – – – – –
Add:
Income tax rate change – 11 – – 11 – – 7 – 7 – – – – –
Tax effect of adjustments(1) (4) (16) – (109) (129) 3 – – (177) (174) 1 – – (3) (2)
Adjusted income $152 $153 $224 $224 $753 $211 $252 $331 $338 $1,132 $251 $371 $400 $460 $1,482
For the period ended(in millions)
2015 2016 2017
Q1 Q2 Q3 Q4 Year Q1 Q2 Q3 Q4 Year Q1 Q2 Q3 Q4 Year
Net income as reported $320 $390 $323 $319 $1,352 $540 $328 $347 $384 $1,599 $431 $480 $510 $984 $2,405
Less significant items (pretax):
Legal settlement charge – – – – – – – (25) – (25) – – – – –
Insurance recovery of legal settlement – – – – – – – – – – – 10 – – 10
Charge on hedge roll and de-designation – – – – – – – – – – – (13) – – (13)
Gain on sale of D&H South – – 68 – 68 – – – – – – – – – –
Labour restructuring – – – – – – – – – – – – – – –
Asset impairments – – – – – – – – – – – – – – –
Management transition (costs) recovery – – – – – – – – – – 51 – – – 51
Advisory fees related to shareholder matters – – – – – – – – – – – – – – –
Impact of FX translation on U.S. dollar-denominated debt (64) 10 (128) (115) (297) 181 18 (46) (74) 79 28 67 105 (14) 186
Early redemption premium on notes – – (47) – (47) – – – – – – – – – –
Add:
Income tax rate change – 23 – – 23 – – – – – – (17) 3 (527) (541)
Tax effect of adjustments(1) (9) 1 (3) (15) (26) 25 2 (13) (10) 4 16 8 14 (2) 36
Adjusted income $375 $404 $427 $419 $1,625 $384 $312 $405 $448 $1,549 $368 $407 $422 $469 $1,666
(1) The tax effect of the adjustments was calculated as the pretax effect of the adjustments multiplied by the applicable tax rate for the above items for the periods presented on page 22.
NO
N-G
AA
P M
EA
SU
RE
S
INV
ESTO
R FA
CT
BOO
K –
2018
DAT
A S
UPP
LEM
ENT
21
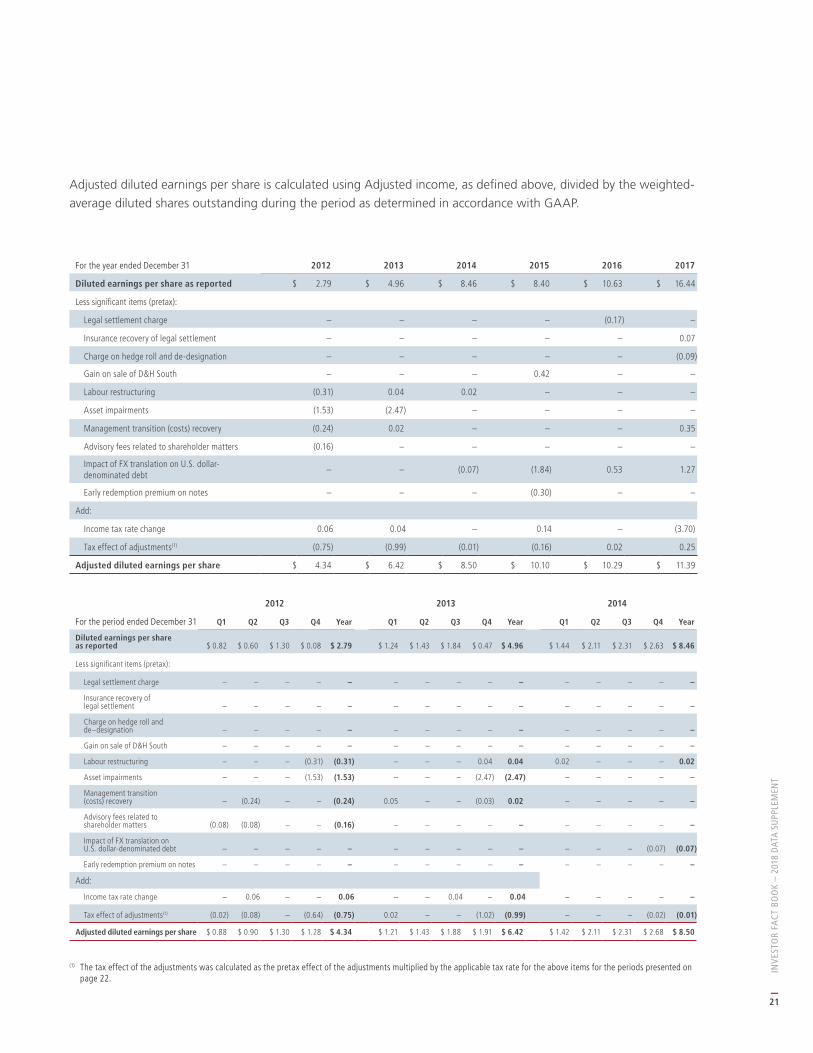
Adjusted diluted earnings per share is calculated using Adjusted income, as defined above, divided by the weighted-
average diluted shares outstanding during the period as determined in accordance with GAAP.
For the year ended December 31 2012 2013 2014 2015 2016 2017
Diluted earnings per share as reported $ 2.79 $ 4.96 $ 8.46 $ 8.40 $ 10.63 $ 16.44
Less significant items (pretax):
Legal settlement charge – – – – (0.17) –
Insurance recovery of legal settlement – – – – – 0.07
Charge on hedge roll and de-designation – – – – – (0.09)
Gain on sale of D&H South – – – 0.42 – –
Labour restructuring (0.31) 0.04 0.02 – – –
Asset impairments (1.53) (2.47) – – – –
Management transition (costs) recovery (0.24) 0.02 – – – 0.35
Advisory fees related to shareholder matters (0.16) – – – – –
Impact of FX translation on U.S. dollar- denominated debt
– – (0.07) (1.84) 0.53 1.27
Early redemption premium on notes – – – (0.30) – –
Add:
Income tax rate change 0.06 0.04 – 0.14 – (3.70)
Tax effect of adjustments(1) (0.75) (0.99) (0.01) (0.16) 0.02 0.25
Adjusted diluted earnings per share $ 4.34 $ 6.42 $ 8.50 $ 10.10 $ 10.29 $ 11.39
For the period ended December 31
2012 2013 2014
Q1 Q2 Q3 Q4 Year Q1 Q2 Q3 Q4 Year Q1 Q2 Q3 Q4 Year
Diluted earnings per share as reported $ 0.82 $ 0.60 $ 1.30 $ 0.08 $ 2.79 $ 1.24 $ 1.43 $ 1.84 $ 0.47 $ 4.96 $ 1.44 $ 2.11 $ 2.31 $ 2.63 $ 8.46
Less significant items (pretax):
Legal settlement charge – – – – – – – – – – – – – – –
Insurance recovery of legal settlement – – – – – – – – – – – – – – –
Charge on hedge roll and de–designation – – – – – – – – – – – – – – –
Gain on sale of D&H South – – – – – – – – – – – – – – –
Labour restructuring – – – (0.31) (0.31) – – – 0.04 0.04 0.02 – – – 0.02
Asset impairments – – – (1.53) (1.53) – – – (2.47) (2.47) – – – – –
Management transition (costs) recovery – (0.24) – – (0.24) 0.05 – – (0.03) 0.02 – – – – –
Advisory fees related to shareholder matters (0.08) (0.08) – – (0.16) – – – – – – – – – –
Impact of FX translation on U.S. dollar-denominated debt – – – – – – – – – – – – – (0.07) (0.07)
Early redemption premium on notes – – – – – – – – – – – – – – –
Add:
Income tax rate change – 0.06 – – 0.06 – – 0.04 – 0.04 – – – – –
Tax effect of adjustments(1) (0.02) (0.08) – (0.64) (0.75) 0.02 – – (1.02) (0.99) – – – (0.02) (0.01)
Adjusted diluted earnings per share $ 0.88 $ 0.90 $ 1.30 $ 1.28 $ 4.34 $ 1.21 $ 1.43 $ 1.88 $ 1.91 $ 6.42 $ 1.42 $ 2.11 $ 2.31 $ 2.68 $ 8.50
(1) The tax effect of the adjustments was calculated as the pretax effect of the adjustments multiplied by the applicable tax rate for the above items for the periods presented on page 22.

INV
ESTO
R FA
CT
BOO
K –
2018
DAT
A S
UPP
LEM
ENT
22
For the period ended
2015 2016 2017
Q1 Q2 Q3 Q4 Year Q1 Q2 Q3 Q4 Year Q1 Q2 Q3 Q4 Year
Diluted earnings per share as reported $1.92 $2.36 $2.04 $2.08 $8.40 $3.51 $2.15 $2.34 $2.61 $10.63 $2.93 $3.27 $3.50 $6.77 $16.44
Less significant items (pretax):
Legal settlement charge – – – – – – – (0.17) – (0.17) – – – – –
Insurance recovery of legal settlement – – – – – – – – – – – 0.06 – – 0.07
Charge on hedge roll and de-designation – – – – – – – – – – – (0.09) – – (0.09)
Gain on sale of D&H South – – 0.42 – 0.42 – – – – – – – – – –
Labour restructuring – – – – – – – – – – – – – – –
Asset impairments – – – – – – – – – – – – – – –
Management transition (costs) recovery – – – – – – – – – – 0.35 – – – 0.35
Advisory fees related to shareholder matters – – – – – – – – – – – – – – –
Impact of FX translation on U.S. dollar–denominated debt (0.39) 0.06 (0.81) (0.74) (1.84) 1.17 0.12 (0.31) (0.50) 0.53 0.19 0.46 0.72 (0.09) 1.27
Early redemption premium on notes – – (0.30) – (0.30) – – – – – – – – – –
Add:
Income tax rate change – 0.14 – – 0.14 – – – – – – (0.12) 0.02 (3.63) (3.70)
Tax effect of adjustments(1) (0.05) 0.01 (0.04) (0.10) (0.16) 0.16 0.02 (0.09) (0.07) 0.02 0.11 0.05 0.10 (0.01) 0.25
Adjusted diluted earnings per share $2.26 $2.45 $2.69 $2.72 $10.10 $2.50 $2.05 $2.73 $3.04 $10.29 $2.50 $2.77 $2.90 $3.22 $11.39
(1) The tax effect of the adjustments was calculated as the pretax effect of the adjustments multiplied by the applicable tax rate for the above items for the periods presented on page 22.
A P P L I C A B L E TA X R AT E S – S I G N I F I C A N T I T E M S A D J U S T E D I N N O N - G A A P M E A S U R E S
The applicable tax rates presented below reflect the taxable jurisdictions and nature, being on account of capital or
income, of the significant items for the periods presented.
For the period ended
2012 2013 2014
Q1 Q2 Q3 Q4 Year Q1 Q2 Q3 Q4 Year Q1 Q2 Q3 Q4 Year
Applicable tax rate 26.09% 30.43% N/A 34.32% 33.47% 37.98% N/A N/A 40.92% 40.98% 26.31% N/A N/A 26.31% 26.31%
For the period ended
2015 2016 2017
Q1 Q2 Q3 Q4 Year Q1 Q2 Q3 Q4 Year Q1 Q2 Q3 Q4 Year
Applicable tax rate 13.15% 12.72% 3.07% 13.24% 9.29% 13.32% 13.32% 18.03% 13.32% 7.17% 19.88% 12.41% 13.28% 13.28% 15.27%
NO
N-G
AA
P M
EA
SU
RE
S

INV
ESTO
R FA
CT
BOO
K –
2018
DAT
A S
UPP
LEM
ENT
23
Adjusted operating income is calculated as Operating income reported on a GAAP basis less significant items.
For the year ended December 31(in millions) 2012 2013 2014 2015 2016 2017
Operating income(1) $ 886 $ 1,338 $ 2,202 $ 2,618 $ 2,411 $ 2,519
Less significant items:
Gain on sale of D&H South – – – 68 – –
Labour restructuring (53) 7 4 – – –
Asset impairments (265) (435) – – – –
Management transition (costs) recovery (42) 4 – – – 51
Adjusted operating income(1) $ 1,246 $ 1,762 $ 2,198 $ 2,550 $ 2,411 $ 2,468
For the period ended(in millions)
2012 2013 2014Q1 Q2 Q3 Q4 Year Q1 Q2 Q3 Q4 Year Q1 Q2 Q3 Q4 Year
Operating income(1) $ 258 $ 224 $ 360 $ 44 $ 886 $ 354 $ 403 $ 500 $ 81 $ 1,338 $ 390 $ 554 $ 587 $ 671 $ 2,202
Less significant items:
Management transition (costs) recovery – (42) – – (42) 9 – – (5) 4 – – – – –
Asset impairments – – – (265) (265) – – – (435) (435) – – – – –
Labour restructuring – – – (53) (53) – – – 7 7 4 – – – 4
Adjusted operating income(1) $ 258 $ 266 $ 360 $ 362 $ 1,246 $ 345 $ 403 $ 500 $ 514 $ 1,762 $ 386 $ 554 $587 $ 671 $ 2,198
For the period ended(in millions)
2015 2016 2017Q1 Q2 Q3 Q4 Year Q1 Q2 Q3 Q4 Year Q1 Q2 Q3 Q4 Year
Operating income(1) $ 597 $ 620 $ 738 $ 663 $ 2,618 $ 610 $ 508 $ 616 $ 677 $ 2,411 $ 604 $ 611 $ 622 $ 682 $ 2,519
Less significant items:
Management transition (costs) recovery – – – – – – – – – – 51 – – – 51
Gain on sale of D&H South – – 68 – 68 – – – – – – – – – –
Adjusted operating income(1) $ 597 $ 620 $ 670 $ 663 $ 2,550 $ 610 $ 508 $ 616 $ 677 $ 2,411 $ 553 $ 611 $ 622 $ 682 $ 2,468
(1) Comparative figures were restated to reflect the adoption of the new accounting standard for presentation of net periodic benefit recovery. For a full description and reconciliation of the restatement see Exhibit 99.1 of the 8-K dated February 16, 2018 on investor.cpr.ca.
INV
ESTO
R FA
CT
BOO
K –
2018
DAT
A S
UPP
LEM
ENT
24
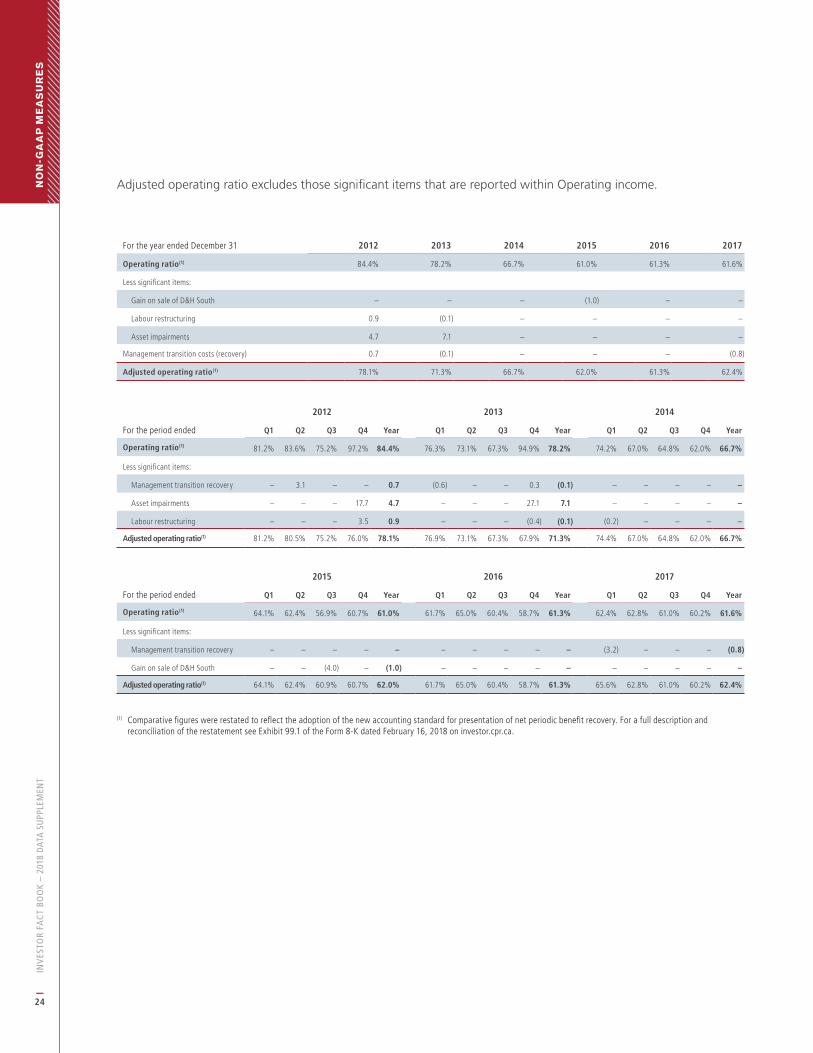
Adjusted operating ratio excludes those significant items that are reported within Operating income.
For the year ended December 31 2012 2013 2014 2015 2016 2017
Operating ratio(1) 84.4% 78.2% 66.7% 61.0% 61.3% 61.6%
Less significant items:
Gain on sale of D&H South – – – (1.0) – –
Labour restructuring 0.9 (0.1) – – – –
Asset impairments 4.7 7.1 – – – –
Management transition costs (recovery) 0.7 (0.1) – – – (0.8)
Adjusted operating ratio(1) 78.1% 71.3% 66.7% 62.0% 61.3% 62.4%
For the period ended
2012 2013 2014
Q1 Q2 Q3 Q4 Year Q1 Q2 Q3 Q4 Year Q1 Q2 Q3 Q4 Year
Operating ratio(1) 81.2% 83.6% 75.2% 97.2% 84.4% 76.3% 73.1% 67.3% 94.9% 78.2% 74.2% 67.0% 64.8% 62.0% 66.7%
Less significant items:
Management transition recovery – 3.1 – – 0.7 (0.6) – – 0.3 (0.1) – – – – –
Asset impairments – – – 17.7 4.7 – – – 27.1 7.1 – – – – –
Labour restructuring – – – 3.5 0.9 – – – (0.4) (0.1) (0.2) – – – –
Adjusted operating ratio(1) 81.2% 80.5% 75.2% 76.0% 78.1% 76.9% 73.1% 67.3% 67.9% 71.3% 74.4% 67.0% 64.8% 62.0% 66.7%
For the period ended
2015 2016 2017
Q1 Q2 Q3 Q4 Year Q1 Q2 Q3 Q4 Year Q1 Q2 Q3 Q4 Year
Operating ratio(1) 64.1% 62.4% 56.9% 60.7% 61.0% 61.7% 65.0% 60.4% 58.7% 61.3% 62.4% 62.8% 61.0% 60.2% 61.6%
Less significant items:
Management transition recovery – – – – – – – – – – (3.2) – – – (0.8)
Gain on sale of D&H South – – (4.0) – (1.0) – – – – – – – – – –
Adjusted operating ratio(1) 64.1% 62.4% 60.9% 60.7% 62.0% 61.7% 65.0% 60.4% 58.7% 61.3% 65.6% 62.8% 61.0% 60.2% 62.4%
(1) Comparative figures were restated to reflect the adoption of the new accounting standard for presentation of net periodic benefit recovery. For a full description and reconciliation of the restatement see Exhibit 99.1 of the Form 8-K dated February 16, 2018 on investor.cpr.ca.
NO
N-G
AA
P M
EA
SU
RE
S
INV
ESTO
R FA
CT
BOO
K –
2018
DAT
A S
UPP
LEM
ENT
25
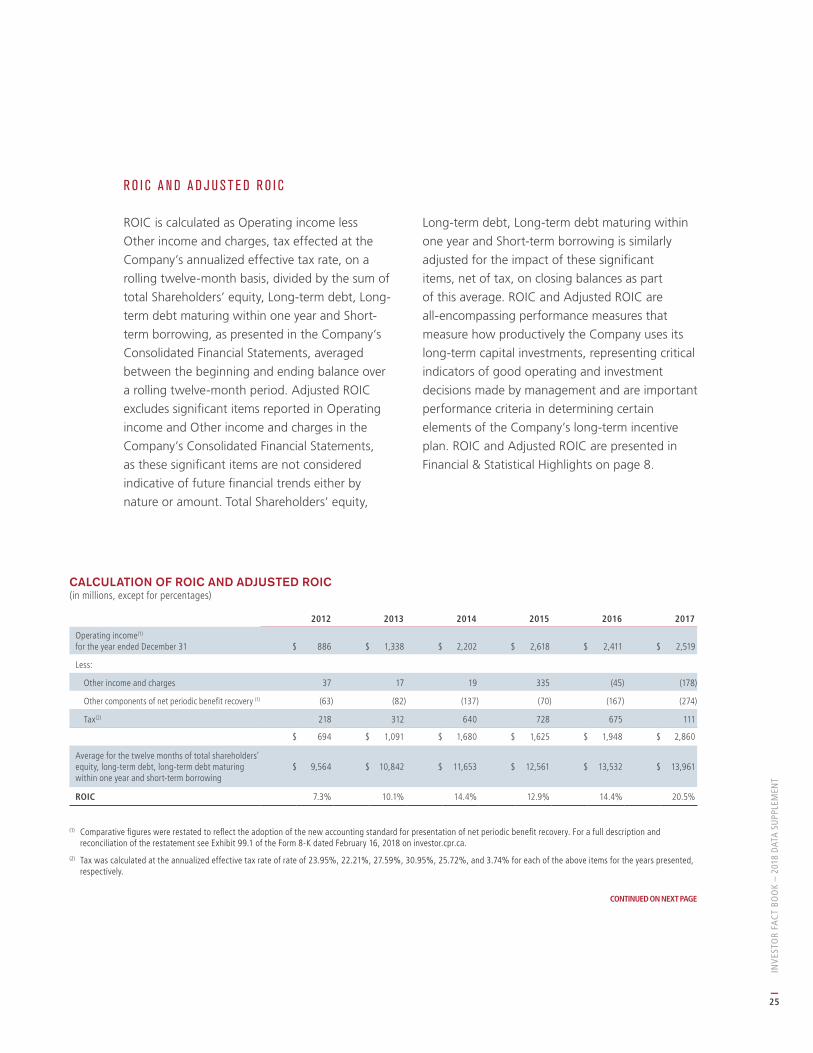
R O I C A N D A D J U S T E D R O I C
ROIC is calculated as Operating income less
Other income and charges, tax effected at the
Company’s annualized effective tax rate, on a
rolling twelve-month basis, divided by the sum of
total Shareholders’ equity, Long-term debt, Long-
term debt maturing within one year and Short-
term borrowing, as presented in the Company’s
Consolidated Financial Statements, averaged
between the beginning and ending balance over
a rolling twelve-month period. Adjusted ROIC
excludes significant items reported in Operating
income and Other income and charges in the
Company’s Consolidated Financial Statements,
as these significant items are not considered
indicative of future financial trends either by
nature or amount. Total Shareholders’ equity,
Long-term debt, Long-term debt maturing within
one year and Short-term borrowing is similarly
adjusted for the impact of these significant
items, net of tax, on closing balances as part
of this average. ROIC and Adjusted ROIC are
all-encompassing performance measures that
measure how productively the Company uses its
long-term capital investments, representing critical
indicators of good operating and investment
decisions made by management and are important
performance criteria in determining certain
elements of the Company’s long-term incentive
plan. ROIC and Adjusted ROIC are presented in
Financial & Statistical Highlights on page 8.
CALCULATION OF ROIC AND ADJUSTED ROIC(in millions, except for percentages)
2012 2013 2014 2015 2016 2017
Operating income(1) for the year ended December 31 $ 886 $ 1,338 $ 2,202 $ 2,618 $ 2,411 $ 2,519
Less:
Other income and charges 37 17 19 335 (45) (178)
Other components of net periodic benefit recovery (1) (63) (82) (137) (70) (167) (274)
Tax(2) 218 312 640 728 675 111
$ 694 $ 1,091 $ 1,680 $ 1,625 $ 1,948 $ 2,860
Average for the twelve months of total shareholders’ equity, long-term debt, long-term debt maturing within one year and short-term borrowing
$ 9,564 $ 10,842 $ 11,653 $ 12,561 $ 13,532 $ 13,961
ROIC 7.3% 10.1% 14.4% 12.9% 14.4% 20.5%
(1) Comparative figures were restated to reflect the adoption of the new accounting standard for presentation of net periodic benefit recovery. For a full description and reconciliation of the restatement see Exhibit 99.1 of the Form 8-K dated February 16, 2018 on investor.cpr.ca.
(2) Tax was calculated at the annualized effective tax rate of rate of 23.95%, 22.21%, 27.59%, 30.95%, 25.72%, and 3.74% for each of the above items for the years presented, respectively.
CONTINUED ON NEXT PAGE

INV
ESTO
R FA
CT
BOO
K –
2018
DAT
A S
UPP
LEM
ENT
26
CALCULATION OF ROIC AND ADJUSTED ROIC (CONTINUED)
(in millions, except for percentages)
2012 2013 2014 2015 2016 2017
Adjusted operating income(1) for the year ended December 31 $ 1,246 $ 1,762 $ 2,198 $ 2,550 $ 2,411 $ 2,468
Less:
Other income and charges 37 17 19 335 (45) (178)
Other components of net periodic benefit recovery (1) (63) (82) (137) (70) (167) (274)
Add significant items (pretax):
Legal settlement charge – – – – 25 –
Insurance recovery of legal settlement – – – – – (10)
Charge on hedge roll and de-designation – – – – – 13
Advisory fees related to shareholder matters 27 – – – – –
Impact of FX translation on U.S. dollar- denominated debt
– – 12 297 (79) (186)
Early redemption premium on notes – – – 47 – –
Less:
Tax(2) 344 491 642 716 673 724
$ 955 $ 1,336 $ 1,686 $ 1,913 $ 1,896 $ 2,013
Average for the twelve months of total shareholders’ equity, long-term debt, long-term debt maturing within one year and short-term borrowing
$ 9,564 $ 10,842 $ 11,653 $ 12,561 $ 13,532 $ 13,961
Add:
Impact of periodic significant items net of tax on the above average
135 129 (2) 8 9 (289)
Adjusted average for the twelve months of total shareholders’ equity, long-term debt, long-term debt maturing within one year and short-term borrowing
$ 9,699 $ 10,971 $ 11,651 $ 12,569 $ 13,541 $ 13,672
Adjusted ROIC(3) 9.8% 12.2% 14.5% 15.2% 14.0% 14.7%
(1) Comparative figures were restated to reflect the adoption of the new accounting standard for presentation of net periodic benefit recovery. For a full description and reconciliation of the restatement see Exhibit 99.1 of the Form 8-K dated February 16, 2018 on investor.cpr.ca.
(2) Tax was calculated at the adjusted annualized effective tax rate of 26.49%, 26.88%, 27.58%, 27.25%, 26.20%, and 26.42% for each of the above items for the years presented, respectively.
(3) The definition of Adjusted ROIC has been revised to exclude the impact of periodic significant items net of tax on closing total Shareholders’ equity, Long-term debt, Long-term debt maturing within one year and Short-term borrowing as part of the average calculation. As a result of this change, Adjusted ROIC decreased by 0.2% in 2012 and 0.1% in 2013. The change did not have a significant impact on other comparative periods.
NO
N-G
AA
P M
EA
SU
RE
S
INV
ESTO
R FA
CT
BOO
K –
2018
DAT
A S
UPP
LEM
ENT
27
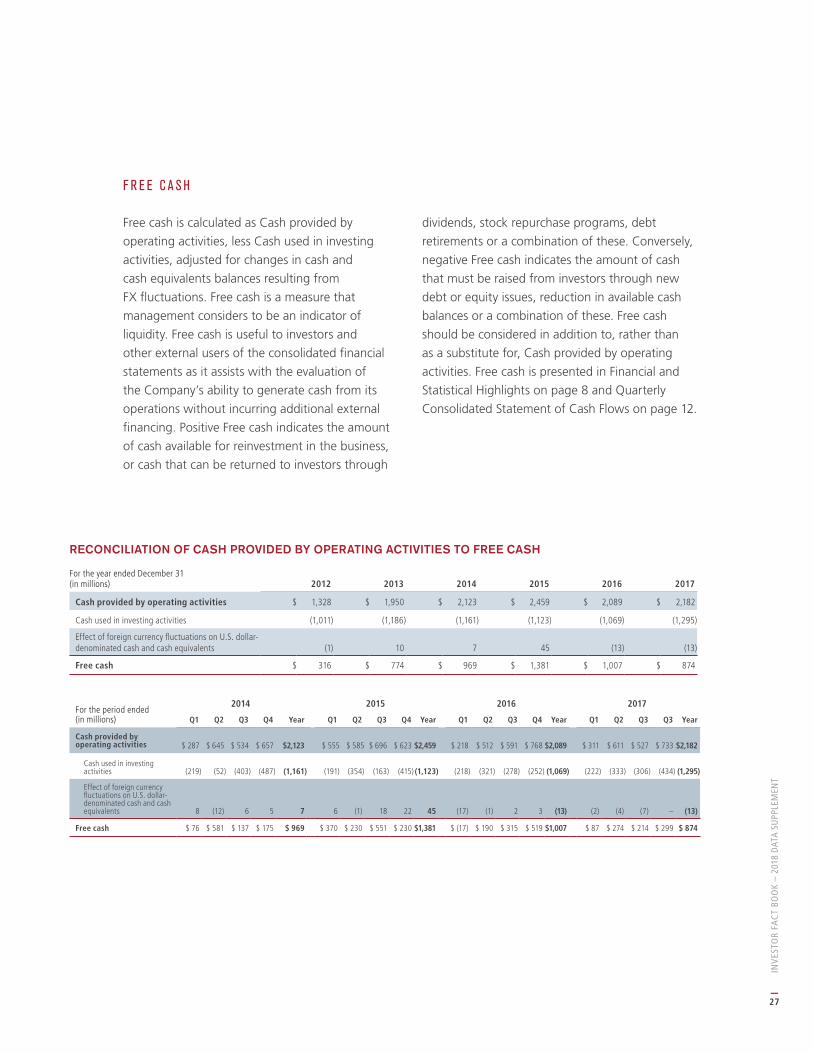
F R E E C A S H
Free cash is calculated as Cash provided by
operating activities, less Cash used in investing
activities, adjusted for changes in cash and
cash equivalents balances resulting from
FX fluctuations. Free cash is a measure that
management considers to be an indicator of
liquidity. Free cash is useful to investors and
other external users of the consolidated financial
statements as it assists with the evaluation of
the Company’s ability to generate cash from its
operations without incurring additional external
financing. Positive Free cash indicates the amount
of cash available for reinvestment in the business,
or cash that can be returned to investors through
dividends, stock repurchase programs, debt
retirements or a combination of these. Conversely,
negative Free cash indicates the amount of cash
that must be raised from investors through new
debt or equity issues, reduction in available cash
balances or a combination of these. Free cash
should be considered in addition to, rather than
as a substitute for, Cash provided by operating
activities. Free cash is presented in Financial and
Statistical Highlights on page 8 and Quarterly
Consolidated Statement of Cash Flows on page 12.
RECONCILIATION OF CASH PROVIDED BY OPERATING ACTIVITIES TO FREE CASH
For the year ended December 31 (in millions) 2012 2013 2014 2015 2016 2017
Cash provided by operating activities $ 1,328 $ 1,950 $ 2,123 $ 2,459 $ 2,089 $ 2,182
Cash used in investing activities (1,011) (1,186) (1,161) (1,123) (1,069) (1,295)
Effect of foreign currency fluctuations on U.S. dollar-denominated cash and cash equivalents (1) 10 7 45 (13) (13)
Free cash $ 316 $ 774 $ 969 $ 1,381 $ 1,007 $ 874
For the period ended (in millions)
2014 2015 2016 2017
Q1 Q2 Q3 Q4 Year Q1 Q2 Q3 Q4 Year Q1 Q2 Q3 Q4 Year Q1 Q2 Q3 Q3 Year
Cash provided by operating activities $ 287 $ 645 $ 534 $ 657 $2,123 $ 555 $ 585 $ 696 $ 623 $2,459 $ 218 $ 512 $ 591 $ 768
$2,089 $ 311 $ 611 $ 527 $ 733
$2,182
Cash used in investing activities (219) (52) (403) (487) (1,161) (191) (354) (163) (415)
(1,123) (218) (321) (278) (252) (1,069) (222) (333) (306) (434) (1,295)
Effect of foreign currency fluctuations on U.S. dollar- denominated cash and cash equivalents 8 (12) 6 5 7 6 (1) 18 22 45 (17) (1) 2 3 (13) (2) (4) (7) – (13)
Free cash $ 76 $ 581 $ 137 $ 175 $ 969 $ 370 $ 230 $ 551 $ 230 $1,381 $ (17) $ 190 $ 315 $ 519 $1,007 $ 87 $ 274 $ 214 $ 299 $ 874
INV
ESTO
R FA
CT
BOO
K –
2018
DAT
A S
UPP
LEM
ENT
28
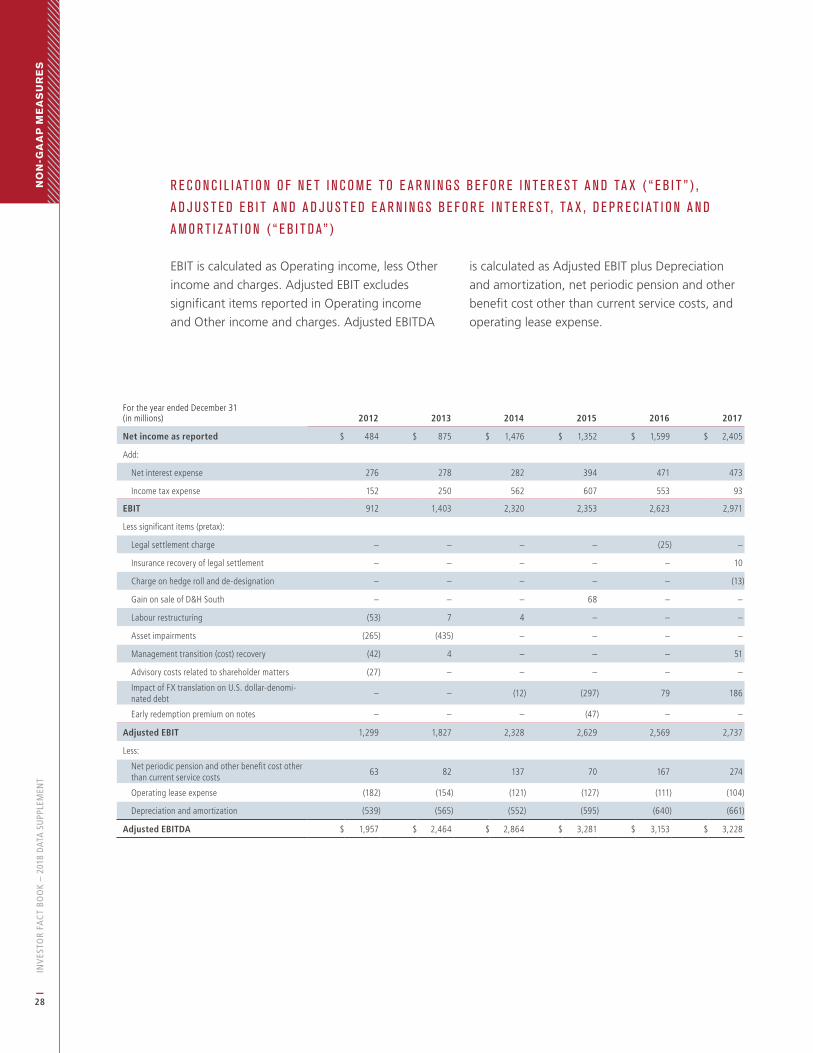
R E C O N C I L I AT I O N O F N E T I N C O M E T O E A R N I N G S B E F O R E I N T E R E S T A N D TA X ( “ E B I T ” ) ,
A D J U S T E D E B I T A N D A D J U S T E D E A R N I N G S B E F O R E I N T E R E S T , TA X , D E P R E C I AT I O N A N D
A M O R T I Z AT I O N ( “ E B I T D A” )
EBIT is calculated as Operating income, less Other
income and charges. Adjusted EBIT excludes
significant items reported in Operating income
and Other income and charges. Adjusted EBITDA
is calculated as Adjusted EBIT plus Depreciation
and amortization, net periodic pension and other
benefit cost other than current service costs, and
operating lease expense.
For the year ended December 31(in millions) 2012 2013 2014 2015 2016 2017
Net income as reported $ 484 $ 875 $ 1,476 $ 1,352 $ 1,599 $ 2,405
Add:
Net interest expense 276 278 282 394 471 473
Income tax expense 152 250 562 607 553 93
EBIT 912 1,403 2,320 2,353 2,623 2,971
Less significant items (pretax):
Legal settlement charge – – – – (25) –
Insurance recovery of legal settlement – – – – – 10
Charge on hedge roll and de-designation – – – – – (13)
Gain on sale of D&H South – – – 68 – –
Labour restructuring (53) 7 4 – – –
Asset impairments (265) (435) – – – –
Management transition (cost) recovery (42) 4 – – – 51
Advisory costs related to shareholder matters (27) – – – – –
Impact of FX translation on U.S. dollar-denomi-nated debt
– – (12) (297) 79 186
Early redemption premium on notes – – – (47) – –
Adjusted EBIT 1,299 1,827 2,328 2,629 2,569 2,737
Less:
Net periodic pension and other benefit cost other than current service costs
63 82 137 70 167 274
Operating lease expense (182) (154) (121) (127) (111) (104)
Depreciation and amortization (539) (565) (552) (595) (640) (661)
Adjusted EBITDA $ 1,957 $ 2,464 $ 2,864 $ 3,281 $ 3,153 $ 3,228
NO
N-G
AA
P M
EA
SU
RE
S

INV
ESTO
R FA
CT
BOO
K –
2018
DAT
A S
UPP
LEM
ENT
29
A D J U S T E D N E T D E B T T O A D J U S T E D E B I T D A R AT I O
Adjusted net debt is defined as Long-term
debt, Long-term debt maturing within one year
and Short-term borrowing as reported on the
Company’s Consolidated Balance Sheets adjusted
for pension plans deficit, the net present value
of operating leases, which is discounted by the
Company’s effective interest rate for each of the
years presented, and Cash and cash equivalents.
Adjusted net debt to Adjusted EBITDA ratio
is calculated as Adjusted net debt divided by
Adjusted EBITDA. The Adjusted net debt to
Adjusted EBITDA ratio is a key credit measure
used to assess the Company’s financial capacity.
The ratio provides information on the Company’s
ability to service its debt and other long-term
obligations. Adjusted net debt to Adjusted EBITDA
ratio is presented in Financial and Statistical
Highlights on page 8.
RECONCILIATION OF LONG-TERM DEBT TO ADJUSTED NET DEBT
(in millions) 2012 2013 2014 2015 2016 2017
Long-term debt including long-term debt maturing within one year as at December 31 $ 4,651 $ 4,839 $ 5,759 $ 8,957 $ 8,684 $ 8,159
Less:
Pension plans deficit(1) (884) (227) (288) (295) (273) (278)
Net present value of operating leases(2) (515) (518) (447) (439) (361) (281)
Cash and cash equivalents 333 476 226 650 164 338
Adjusted net debt as at December 31 $ 5,717 $ 5,108 $ 6,268 $ 9,041 $ 9,154 $ 8,380
(1) Pension plans deficit is the total funded status of the Pension plans in deficit only.
(2) Operating leases were discounted at the Company’s effective interest rate for each of the years presented.
CALCULATION OF ADJUSTED NET DEBT TO ADJUSTED EBITDA RATIO
(in millions, except for ratios) 2012 2013 2014 2015 2016 2017
Adjusted net debt as at December 31 $ 5,717 $ 5,108 $ 6,268 $ 9,041 $ 9,154 $ 8,380
Adjusted EBITDA for the year ended December 31 1,957 2,464 2,864 3,281 3,153 3,228
Adjusted net debt to Adjusted EBITDA ratio 2.9 2.1 2.2 2.8 2.9 2.6
INV
ESTO
R FA
CT
BOO
K –
2018
DAT
A S
UPP
LEM
ENT
30
SHAREHOLDER ADMINISTRATION
Computershare Investor Services Inc., with transfer facilities in Montreal, Toronto, Calgary and Vancouver, serves
as transfer agent and registrar for the Common Shares in Canada. Computershare Trust Company NA serves as
co-transfer agent and co-registrar for the Common Shares in Canton, MA, Jersey City, NJ and Louisville, KY.
For information concerning dividends, lost share certificates, estate transfers or for change in share registration or
address, please contact the transfer agent and registrar by telephone at 1-877-427-7245 toll-free North America or
international 1-514-982-7555, visit their website at www.investorcentre.com/cp or write to:
Computershare Investor Services Inc.
100 University Avenue
8th Floor, North Tower
Toronto, Ontario
M5J 2Y1 Canada
CP INVESTOR RELATIONS
Maeghan Albiston Assistant Vice-President, Investor Relations
Andrew Elford Director, Investor Relations
Telephone: 403-319-3591
Email: [email protected]
Website: investor.cpr.ca
Mailing Address Canadian Pacific Investor Relations
7550 Ogden Dale Road S.E.
Calgary, Alberta
T2C 4X9 Canada
20
18 D
ATA
SU
PP
LE
ME
NT

INV
ESTO
R FA
CT
BOO
K –
2018
DAT
A S
UPP
LEM
ENT
31

INVESTOR.CPR.CA


![Investor Presentation March 2021 [Fact Book 2020]](https://img.pdfslide.net/doc/110x75/617f368323695b358e7526ef/investor-presentation-march-2021-fact-book-2020.jpg)