Embed Size (px)
Citation preview

Investor Forum
March, 2010
Presentation outline
Overview of Hinduja Group
CV Market Outlook
AL’s Performance
Strategies / Plans
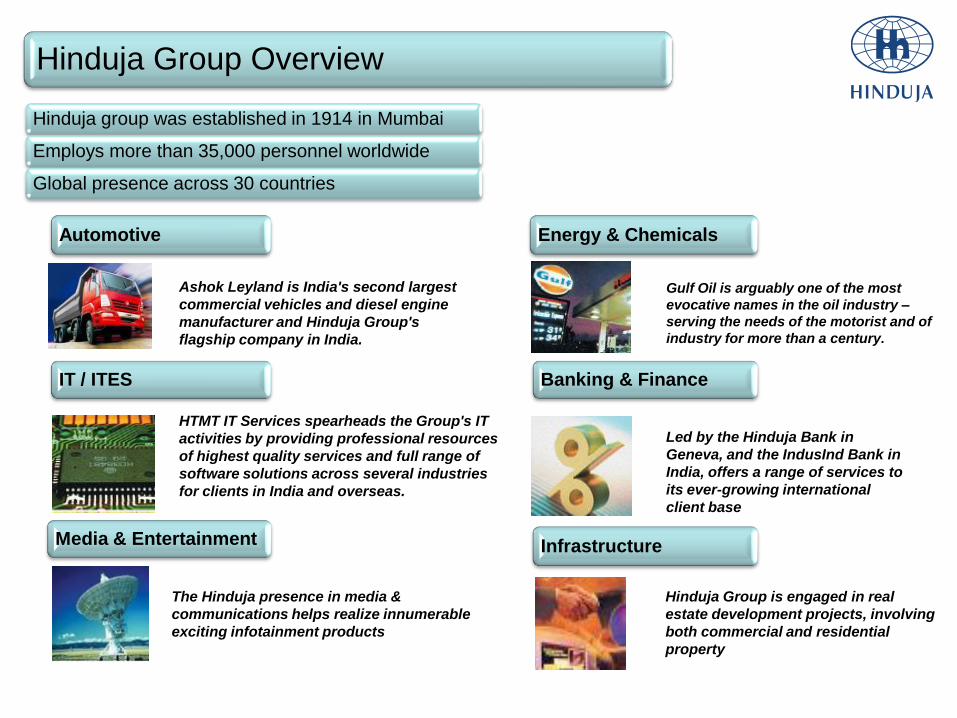
`Hinduja Group Overview
Led by the Hinduja Bank in
Geneva, and the IndusInd Bank in
India, offers a range of services to
its ever-growing international
client base
Gulf Oil is arguably one of the most
evocative names in the oil industry –
serving the needs of the motorist and of
industry for more than a century.
HTMT IT Services spearheads the Group's IT
activities by providing professional resources
of highest quality services and full range of
software solutions across several industries
for clients in India and overseas.
The Hinduja presence in media &
communications helps realize innumerable
exciting infotainment products
Hinduja Group is engaged in real
estate development projects, involving
both commercial and residential
property
Ashok Leyland is India's second largest
commercial vehicles and diesel engine
manufacturer and Hinduja Group's
flagship company in India.
Automotive
IT / ITES Banking & Finance
Infrastructure
Hinduja group was established in 1914 in Mumbai
Employs more than 35,000 personnel worldwide
Global presence across 30 countries
Media & Entertainment
Energy & Chemicals
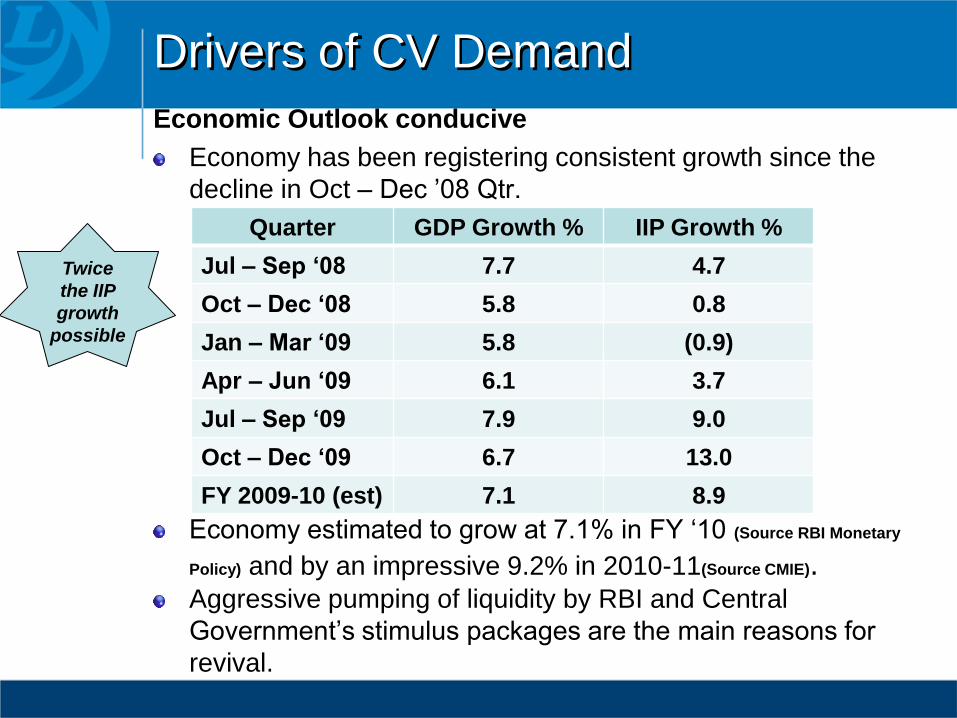
Drivers of CV Demand
Economic Outlook conducive
Economy has been registering consistent growth since the
decline in Oct – Dec ’08 Qtr.
Economy estimated to grow at 7.1% in FY ‘10 (Source RBI Monetary
Policy) and by an impressive 9.2% in 2010-11(Source CMIE).Aggressive pumping of liquidity by RBI and Central
Government’s stimulus packages are the main reasons for
revival.
Quarter GDP Growth % IIP Growth %
Jul – Sep ‘08 7.7 4.7
Oct – Dec ‘08 5.8 0.8
Jan – Mar ‘09 5.8 (0.9)
Apr – Jun ‘09 6.1 3.7
Jul – Sep ‘09 7.9 9.0
Oct – Dec ‘09 6.7 13.0
FY 2009-10 (est) 7.1 8.9
Twice
the IIP
growth
possible
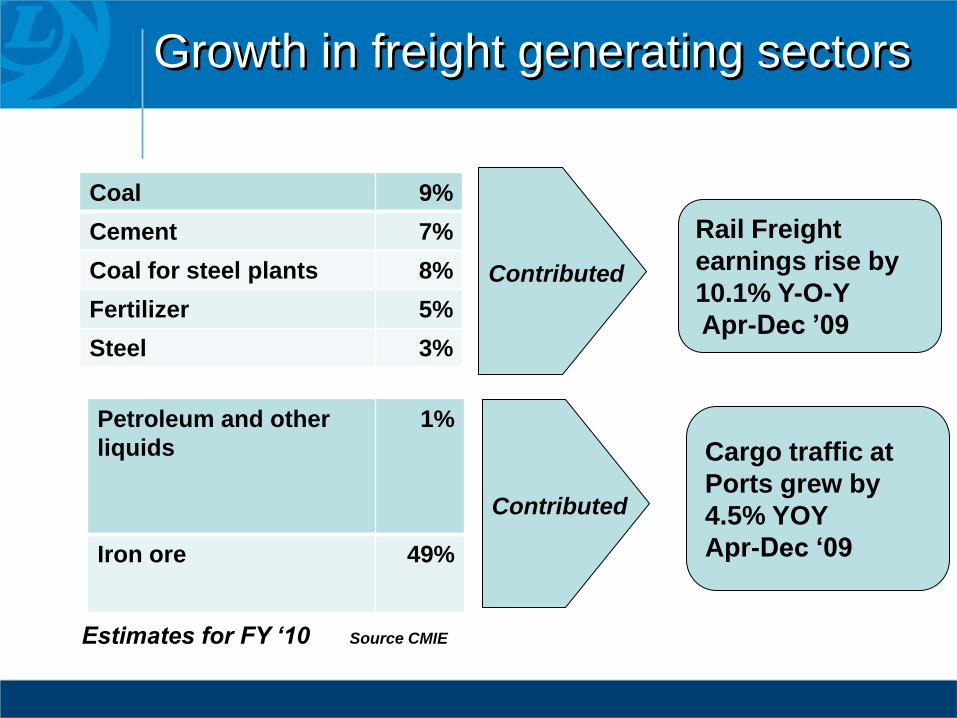
Growth in freight generating sectors
Coal 9%
Cement 7%
Coal for steel plants 8%
Fertilizer 5%
Steel 3%
Rail Freight
earnings rise by
10.1% Y-O-Y
Apr-Dec ’09
Contributed
Petroleum and other
liquids
1%
Iron ore 49%
Cargo traffic at
Ports grew by
4.5% YOY
Apr-Dec ‘09
Contributed
Estimates for FY ‘10 Source CMIE
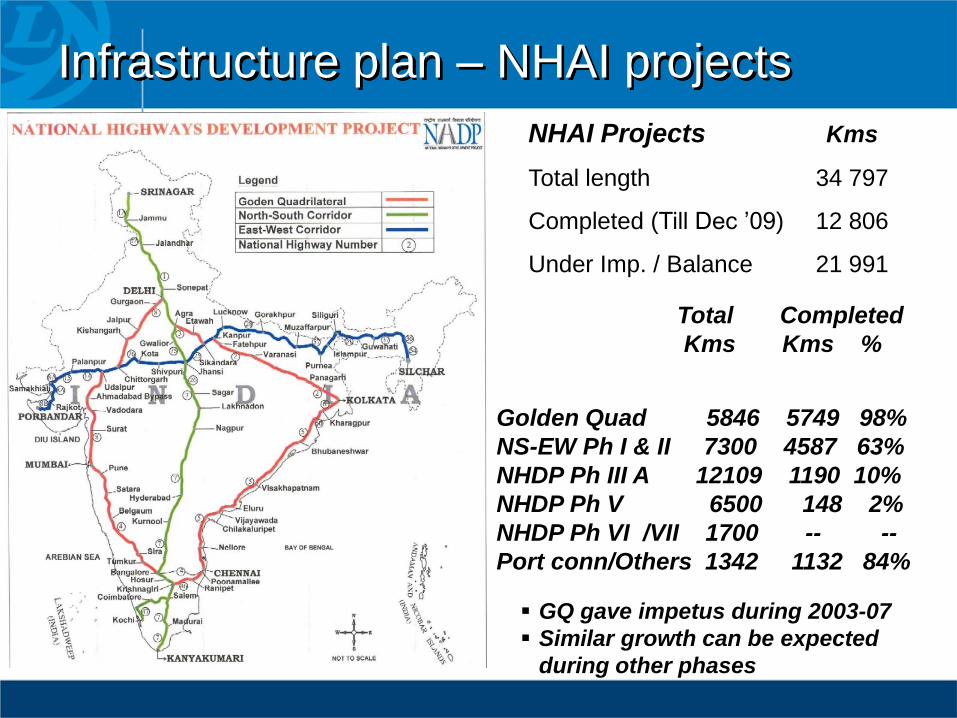
Infrastructure plan – NHAI projects
NHAI Projects Kms
Total length 34 797
Completed (Till Dec ’09) 12 806
Under Imp. / Balance 21 991
Golden Quad 5846 5749 98%
NS-EW Ph I & II 7300 4587 63%
NHDP Ph III A 12109 1190 10%
NHDP Ph V 6500 148 2%
NHDP Ph VI /VII 1700 -- --
Port conn/Others 1342 1132 84%
Total Completed
Kms Kms %
GQ gave impetus during 2003-07
Similar growth can be expected
during other phases
Infrastructure plan – NHAI projects
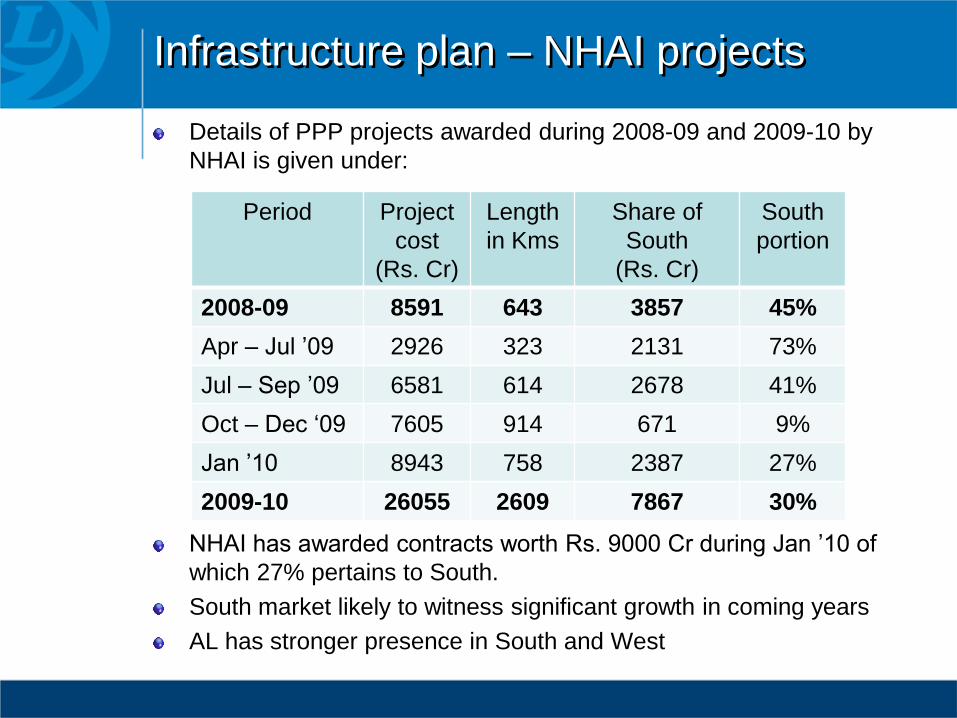
Details of PPP projects awarded during 2008-09 and 2009-10 by
NHAI is given under:
NHAI has awarded contracts worth Rs. 9000 Cr during Jan ’10 of
which 27% pertains to South.
South market likely to witness significant growth in coming years
AL has stronger presence in South and West
Period Project
cost
(Rs. Cr)
Length
in Kms
Share of
South
(Rs. Cr)
South
portion
2008-09 8591 643 3857 45%
Apr – Jul ’09 2926 323 2131 73%
Jul – Sep ’09 6581 614 2678 41%
Oct – Dec ‘09 7605 914 671 9%
Jan ’10 8943 758 2387 27%
2009-10 26055 2609 7867 30%
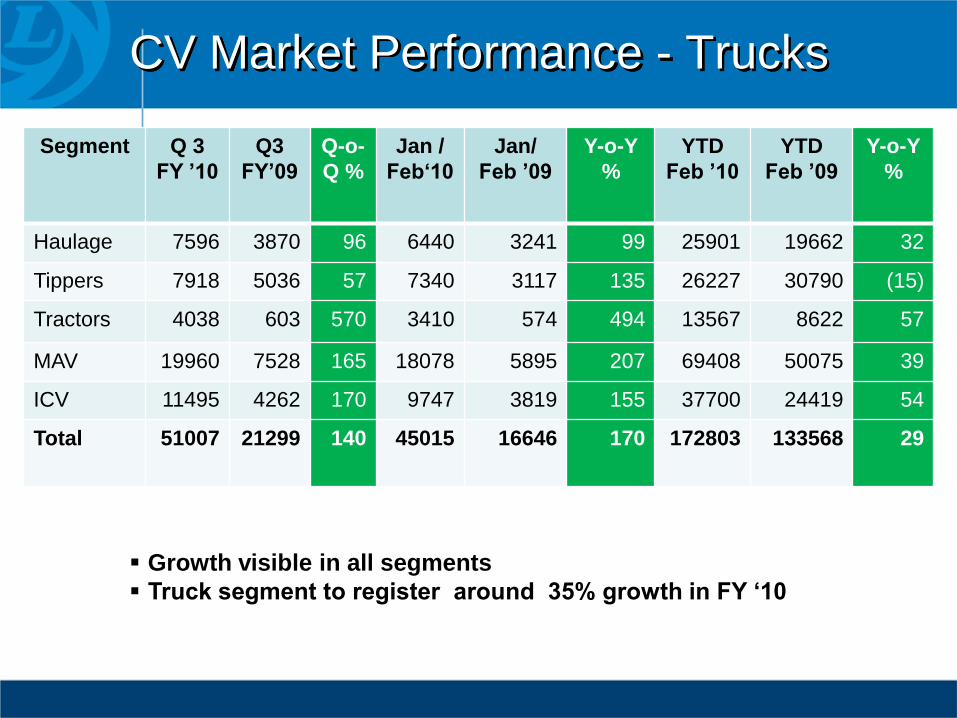
CV Market Performance - Trucks
Growth visible in all segments
Truck segment to register around 35% growth in FY ‘10
Segment Q 3
FY ’10
Q3
FY’09
Q-o-
Q %
Jan /
Feb‘10
Jan/
Feb ’09
Y-o-Y
%
YTD
Feb ’10
YTD
Feb ’09
Y-o-Y
%
Haulage 7596 3870 96 6440 3241 99 25901 19662 32
Tippers 7918 5036 57 7340 3117 135 26227 30790 (15)
Tractors 4038 603 570 3410 574 494 13567 8622 57
MAV 19960 7528 165 18078 5895 207 69408 50075 39
ICV 11495 4262 170 9747 3819 155 37700 24419 54
Total 51007 21299 140 45015 16646 170 172803 133568 29
CV Market Performance – Trucks contd…
Growth registered over Dec ‘09 in all segments
During Jan ’10, Tippers registered growth of
7% over Dec ‘09
Established players adding fleet; Good sign of
robust demand expected in near future for
MAV and Tractor segment in all regions
Positive sentiments, increased road building
activity and growth in IIP has enabled this
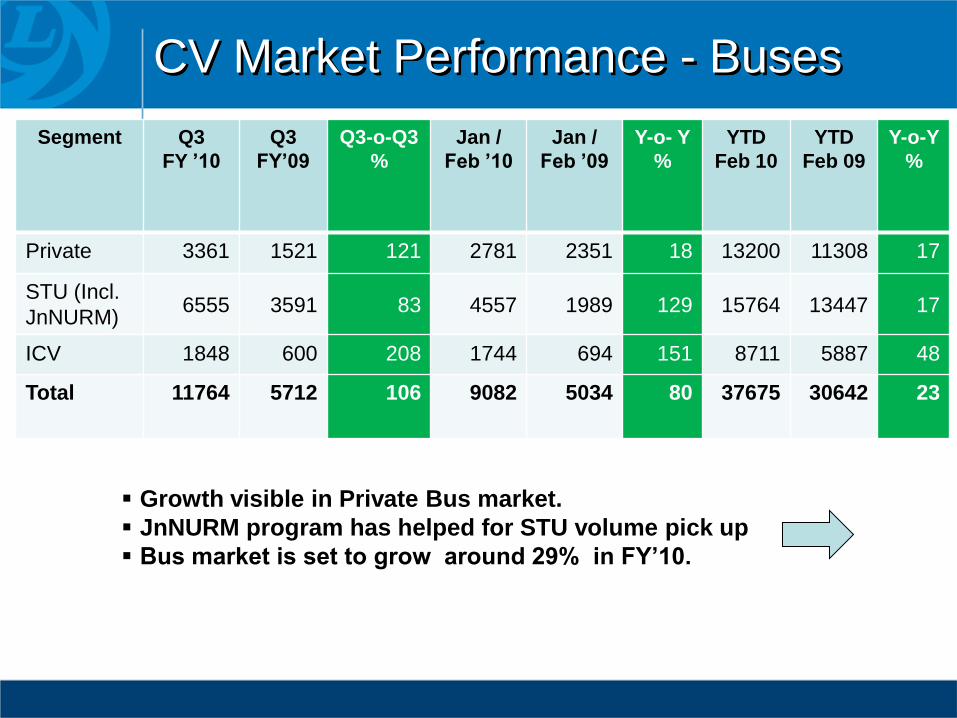
CV Market Performance - Buses
Growth visible in Private Bus market.
JnNURM program has helped for STU volume pick up
Bus market is set to grow around 29% in FY’10.
Segment Q3
FY ’10
Q3
FY’09
Q3-o-Q3
%
Jan /
Feb ’10
Jan /
Feb ’09
Y-o- Y
%
YTD
Feb 10
YTD
Feb 09
Y-o-Y
%
Private 3361 1521 121 2781 2351 18 13200 11308 17
STU (Incl.
JnNURM)6555 3591 83 4557 1989 129 15764 13447 17
ICV 1848 600 208 1744 694 151 8711 5887 48
Total 11764 5712 106 9082 5034 80 37675 30642 23
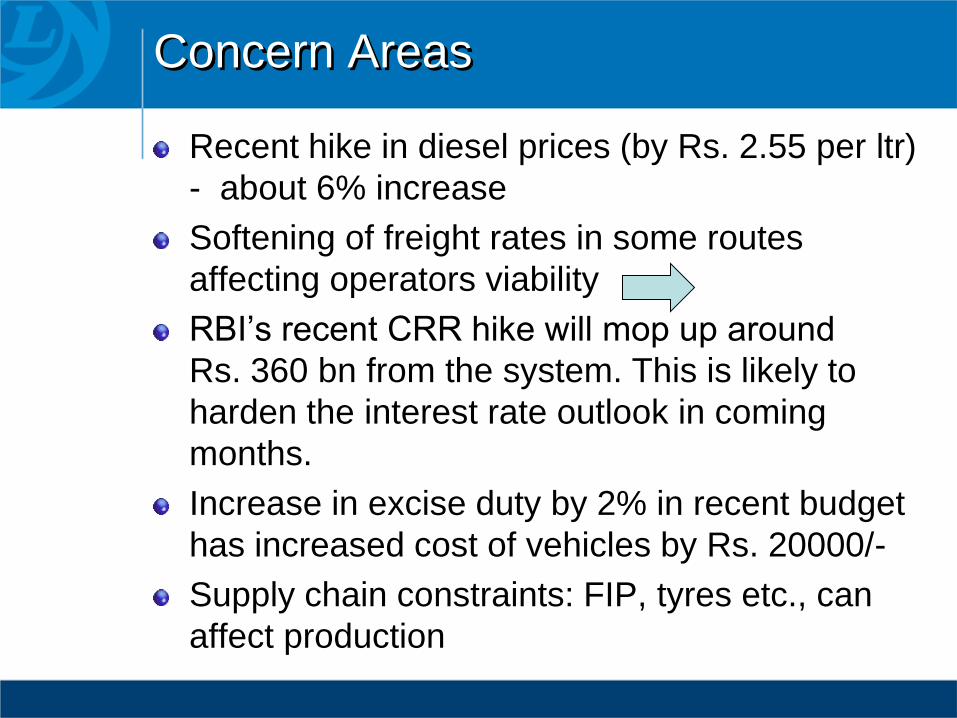
Concern Areas
Recent hike in diesel prices (by Rs. 2.55 per ltr)
- about 6% increase
Softening of freight rates in some routes
affecting operators viability
RBI’s recent CRR hike will mop up around
Rs. 360 bn from the system. This is likely to
harden the interest rate outlook in coming
months.
Increase in excise duty by 2% in recent budget
has increased cost of vehicles by Rs. 20000/-
Supply chain constraints: FIP, tyres etc., can
affect production
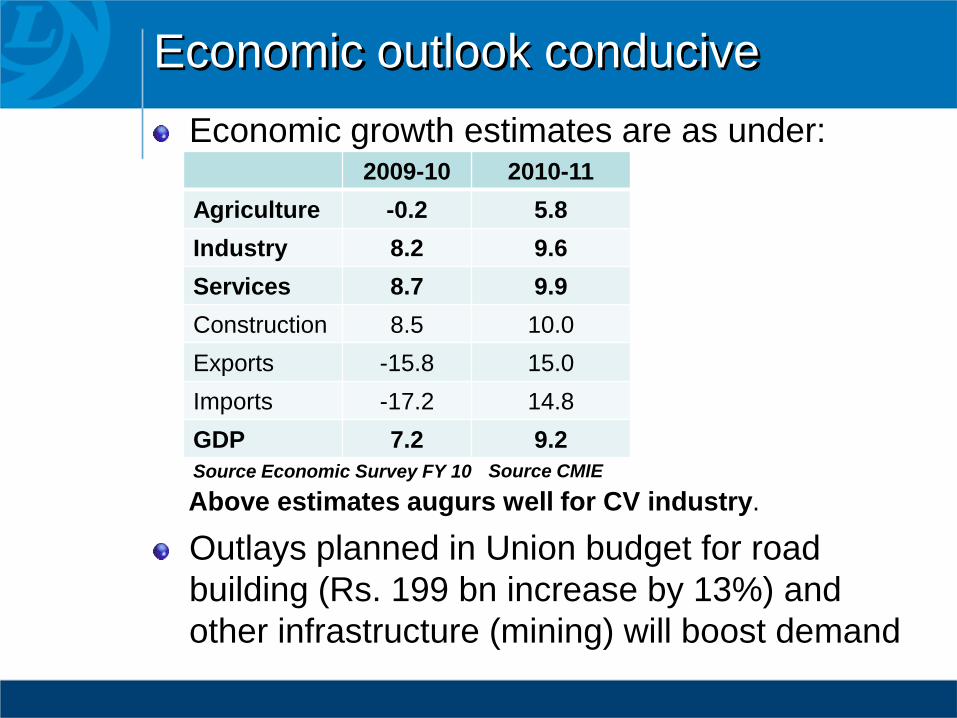
Economic outlook conducive
Economic growth estimates are as under:
Above estimates augurs well for CV industry.
Outlays planned in Union budget for road
building (Rs. 199 bn increase by 13%) and
other infrastructure (mining) will boost demand
2009-10 2010-11
Agriculture -0.2 5.8
Industry 8.2 9.6
Services 8.7 9.9
Construction 8.5 10.0
Exports -15.8 15.0
Imports -17.2 14.8
GDP 7.2 9.2
Source CMIESource Economic Survey FY 10
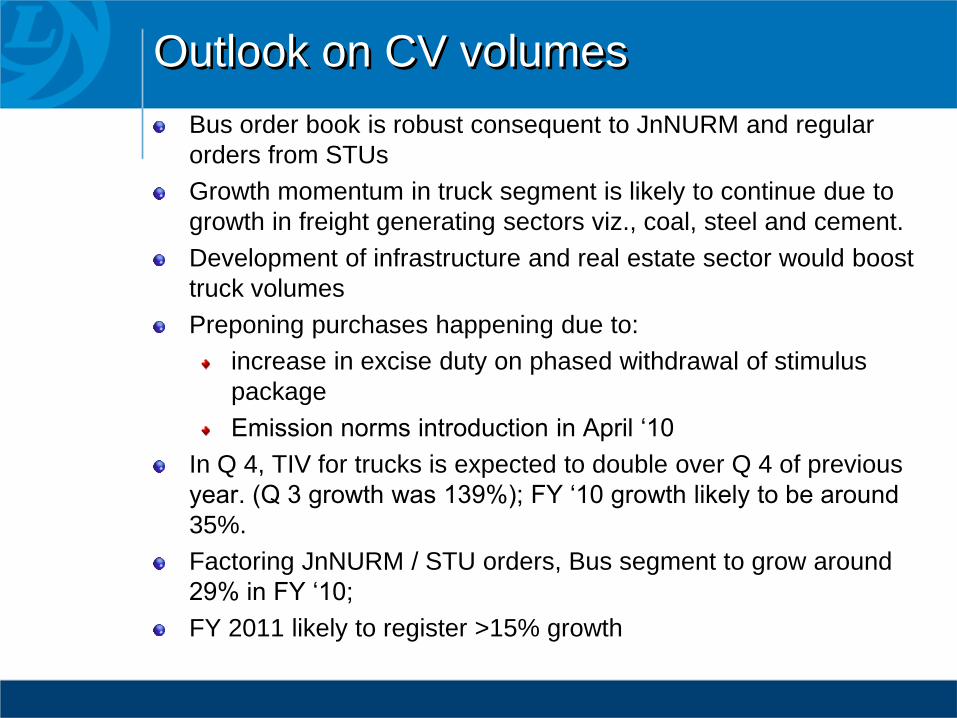
Outlook on CV volumes
Bus order book is robust consequent to JnNURM and regular
orders from STUs
Growth momentum in truck segment is likely to continue due to
growth in freight generating sectors viz., coal, steel and cement.
Development of infrastructure and real estate sector would boost
truck volumes
Preponing purchases happening due to:
increase in excise duty on phased withdrawal of stimulus
package
Emission norms introduction in April ‘10
In Q 4, TIV for trucks is expected to double over Q 4 of previous
year. (Q 3 growth was 139%); FY ‘10 growth likely to be around
35%.
Factoring JnNURM / STU orders, Bus segment to grow around
29% in FY ‘10;
FY 2011 likely to register >15% growth
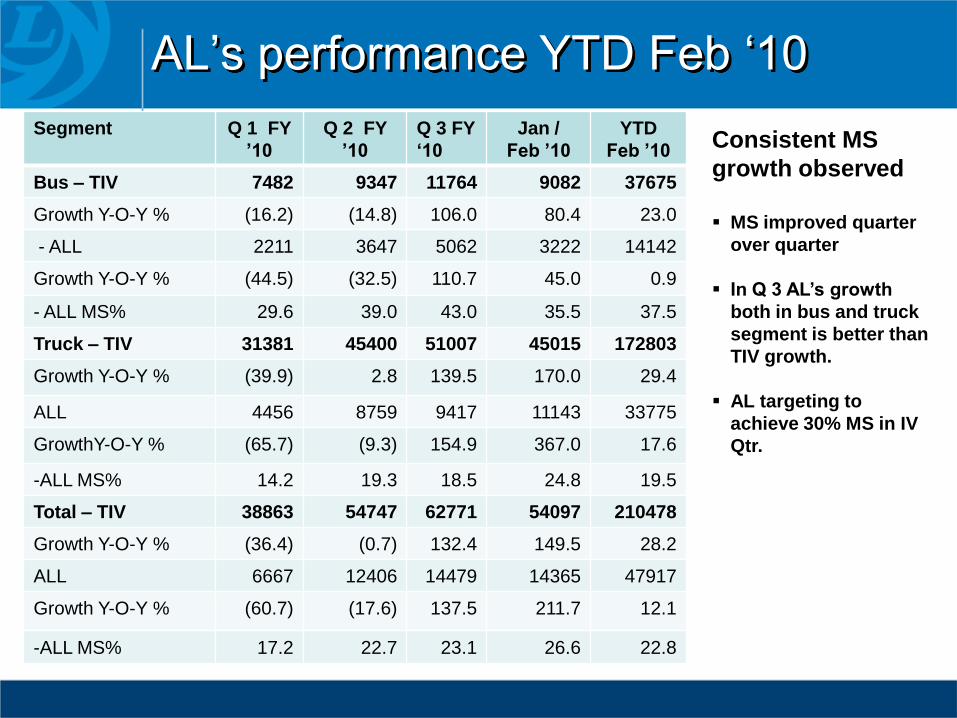
AL’s performance YTD Feb ‘10
Segment Q 1 FY
’10
Q 2 FY
’10
Q 3 FY
‘10
Jan /
Feb ’10
YTD
Feb ’10
Bus – TIV 7482 9347 11764 9082 37675
Growth Y-O-Y % (16.2) (14.8) 106.0 80.4 23.0
- ALL 2211 3647 5062 3222 14142
Growth Y-O-Y % (44.5) (32.5) 110.7 45.0 0.9
- ALL MS% 29.6 39.0 43.0 35.5 37.5
Truck – TIV 31381 45400 51007 45015 172803
Growth Y-O-Y % (39.9) 2.8 139.5 170.0 29.4
ALL 4456 8759 9417 11143 33775
GrowthY-O-Y % (65.7) (9.3) 154.9 367.0 17.6
-ALL MS% 14.2 19.3 18.5 24.8 19.5
Total – TIV 38863 54747 62771 54097 210478
Growth Y-O-Y % (36.4) (0.7) 132.4 149.5 28.2
ALL 6667 12406 14479 14365 47917
Growth Y-O-Y % (60.7) (17.6) 137.5 211.7 12.1
-ALL MS% 17.2 22.7 23.1 26.6 22.8
Consistent MS
growth observed
MS improved quarter
over quarter
In Q 3 AL’s growth
both in bus and truck
segment is better than
TIV growth.
AL targeting to
achieve 30% MS in IV
Qtr.
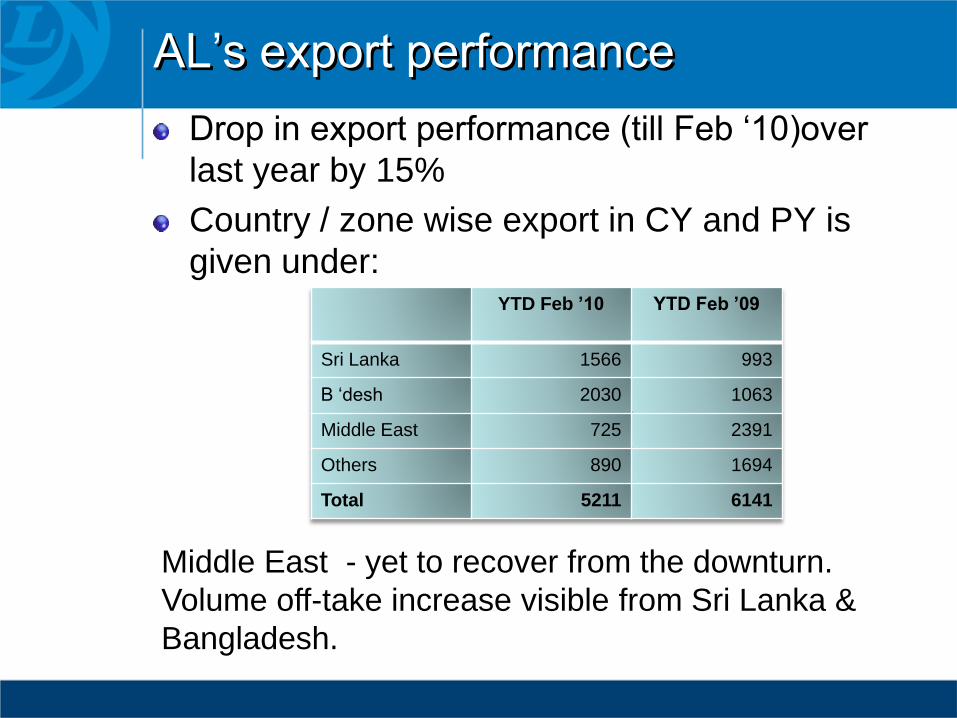
AL’s export performance
Drop in export performance (till Feb ‘10)over
last year by 15%
Country / zone wise export in CY and PY is
given under:YTD Feb ’10 YTD Feb ’09
Sri Lanka 1566 993
B ‘desh 2030 1063
Middle East 725 2391
Others 890 1694
Total 5211 6141
Middle East - yet to recover from the downturn.
Volume off-take increase visible from Sri Lanka &
Bangladesh.
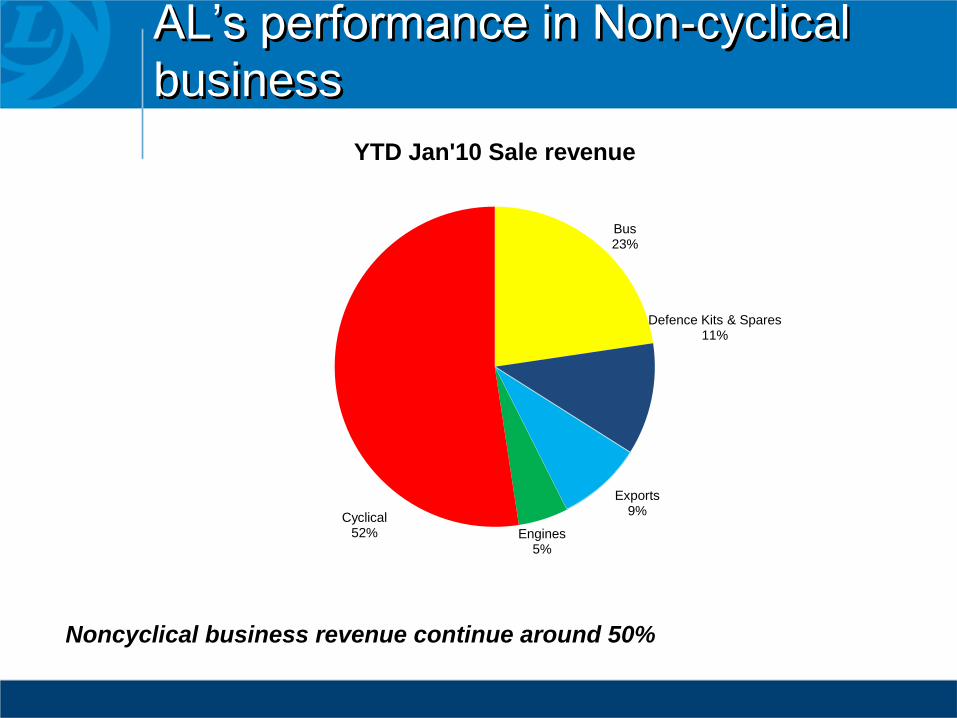
AL’s performance in Non-cyclical
business
Noncyclical business revenue continue around 50%
Bus23%
Defence Kits & Spares11%
Exports9%
Engines5%
Cyclical52%
YTD Jan'10 Sale revenue
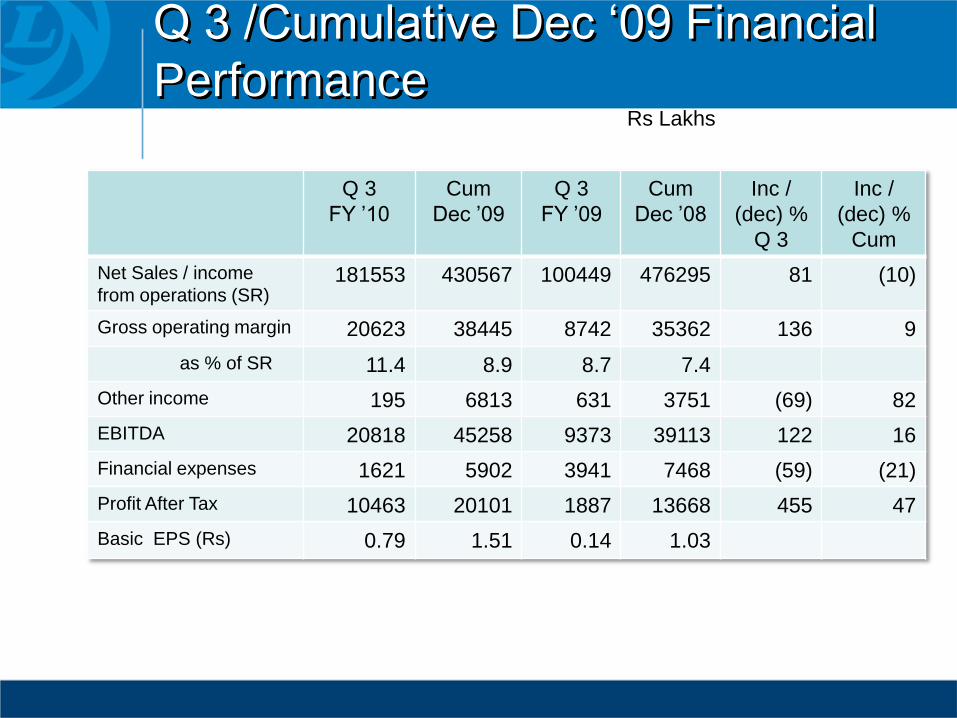
Q 3 /Cumulative Dec ‘09 Financial
Performance
Q 3
FY ’10
Cum
Dec ’09
Q 3
FY ’09
Cum
Dec ’08
Inc /
(dec) %
Q 3
Inc /
(dec) %
Cum
Net Sales / income
from operations (SR)181553 430567 100449 476295 81 (10)
Gross operating margin 20623 38445 8742 35362 136 9
as % of SR 11.4 8.9 8.7 7.4
Other income 195 6813 631 3751 (69) 82
EBITDA 20818 45258 9373 39113 122 16
Financial expenses 1621 5902 3941 7468 (59) (21)
Profit After Tax 10463 20101 1887 13668 455 47
Basic EPS (Rs) 0.79 1.51 0.14 1.03
Rs Lakhs
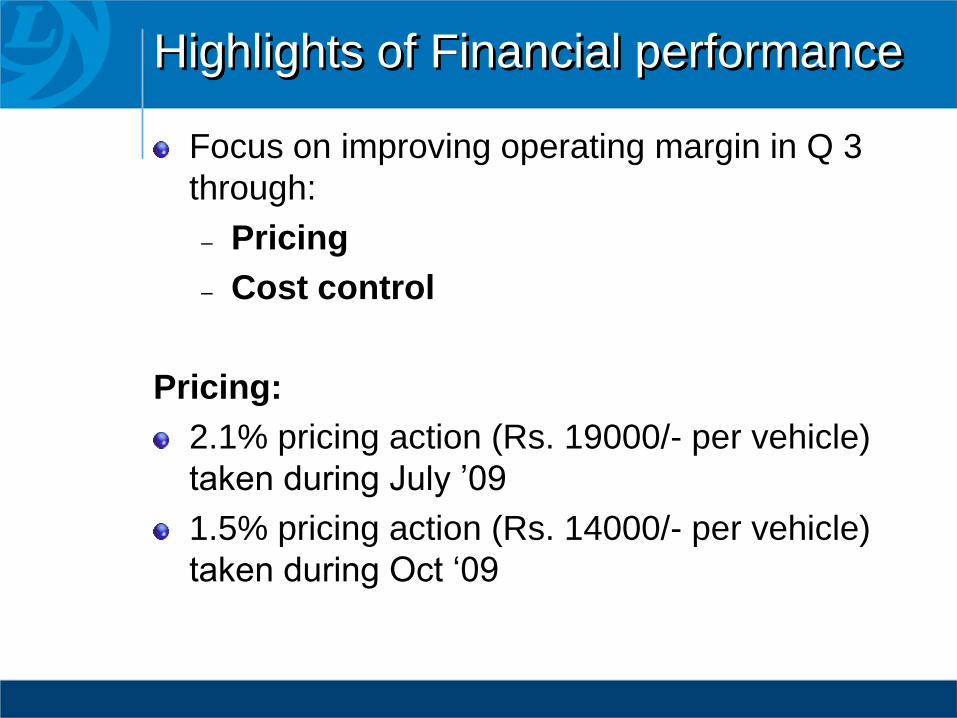
Highlights of Financial performance
Focus on improving operating margin in Q 3
through:
– Pricing
– Cost control
Pricing:
2.1% pricing action (Rs. 19000/- per vehicle)
taken during July ’09
1.5% pricing action (Rs. 14000/- per vehicle)
taken during Oct ‘09
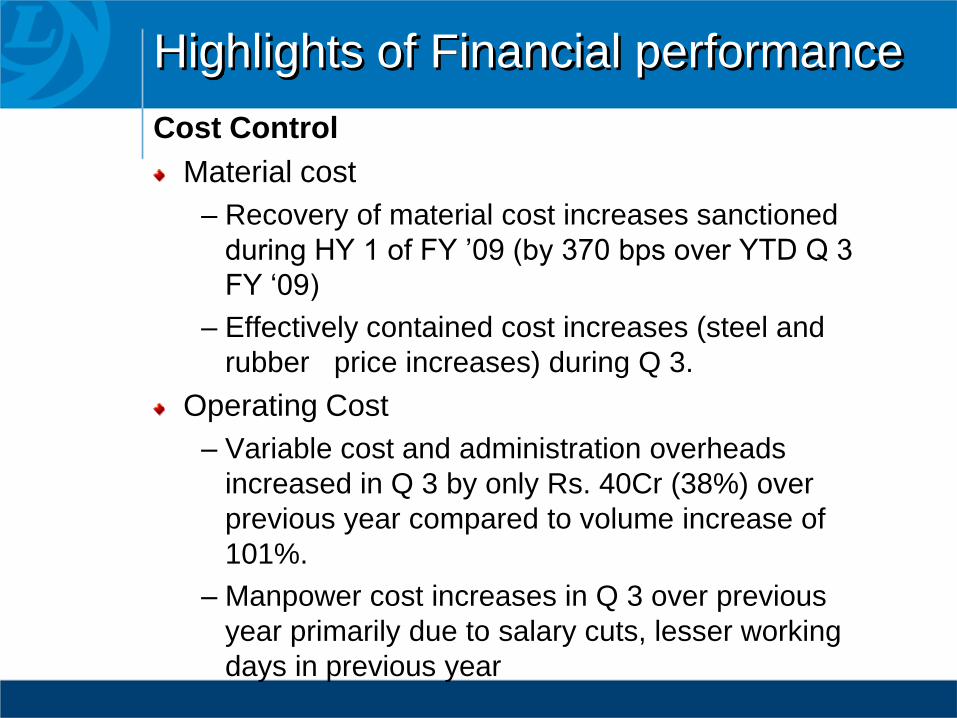
Highlights of Financial performance
Cost Control
Material cost
– Recovery of material cost increases sanctioned
during HY 1 of FY ’09 (by 370 bps over YTD Q 3
FY ‘09)
– Effectively contained cost increases (steel and
rubber price increases) during Q 3.
Operating Cost
– Variable cost and administration overheads
increased in Q 3 by only Rs. 40Cr (38%) over
previous year compared to volume increase of
101%.
– Manpower cost increases in Q 3 over previous
year primarily due to salary cuts, lesser working
days in previous year
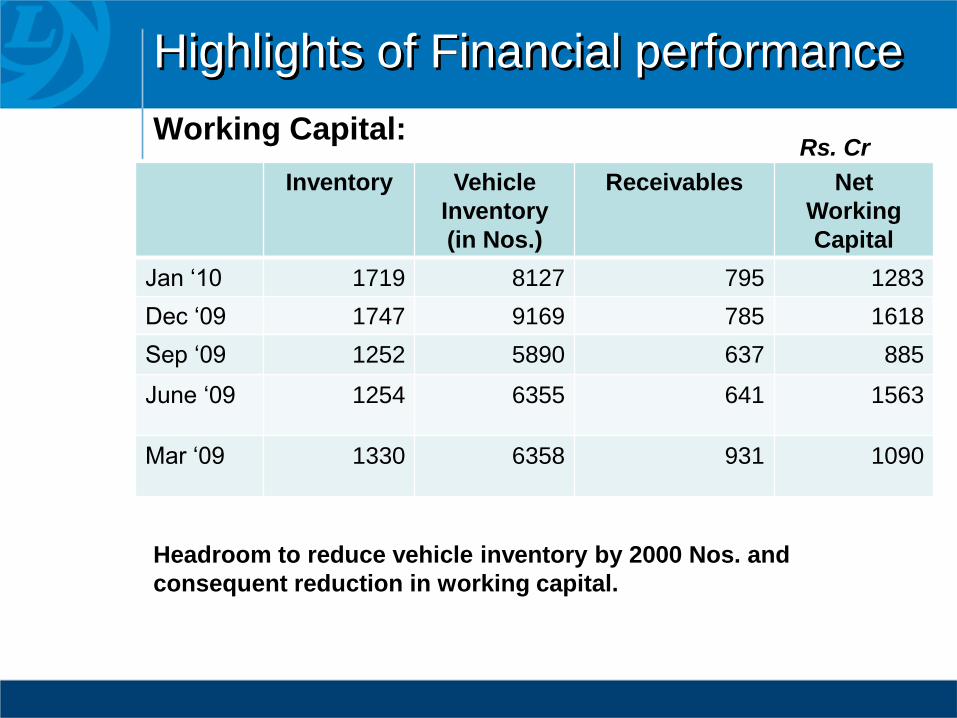
Highlights of Financial performance
Working Capital:
Inventory Vehicle
Inventory
(in Nos.)
Receivables Net
Working
Capital
Jan ‘10 1719 8127 795 1283
Dec ‘09 1747 9169 785 1618
Sep ‘09 1252 5890 637 885
June ‘09 1254 6355 641 1563
Mar ‘09 1330 6358 931 1090
Rs. Cr
Headroom to reduce vehicle inventory by 2000 Nos. and
consequent reduction in working capital.
Strategies/Plans
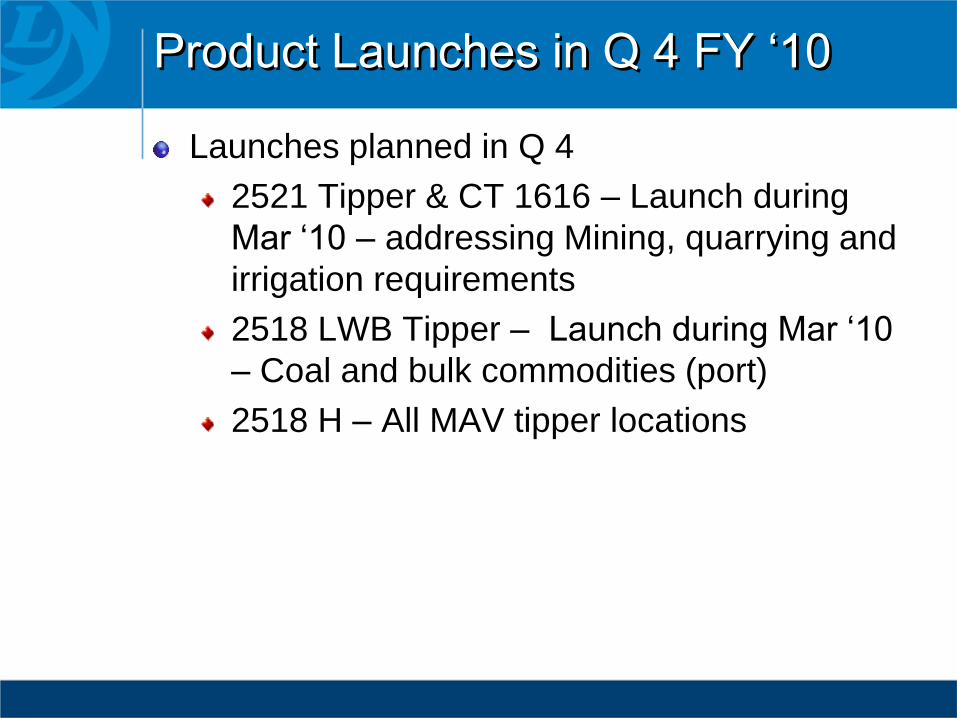
Product Launches in Q 4 FY ‘10
Launches planned in Q 4
2521 Tipper & CT 1616 – Launch during
Mar ‘10 – addressing Mining, quarrying and
irrigation requirements
2518 LWB Tipper – Launch during Mar ‘10
– Coal and bulk commodities (port)
2518 H – All MAV tipper locations
Future Models Planned
Bus
Stag BS 3 (40 seat with front door)
ULE/RESLF/FESLF – A/c and Non A/c
options with Diesel and CNG options
Luxura – 225 HP CRS BS III
12 Mtr 225 and 180 HP
Viking BS III & BS IV
Haulage
1616 FF (4x2), 1616SF (4x2), 2518 (6x2) &
3123 (8x2)
Future Models Planned
Tipper
1616 FF, 2523, 3123, 1619, 2519 to cater to
quarry, mining and construction activities
Tractors
4923 6x4 (cement), 4932 6x4 ODC, 4023
4x2 (market load) and 3518 4x2 (container).
Unveiling U Truck range
The U TRUCK platform
U 4932 Tractor & U 2523 Tipper unveiled in
recent Auto Expo.
U Truck platform will straddle entire range of
tractors, tippers and haulage covering 16 – 49
tonnage segments
Powered by BS III and BS IV engines (protected
for BS V)
H series (SCR) and Neptune (EGR) engines
with hp ranging from 160 to 380.
Meets wider choice of customer’s application
based requirements
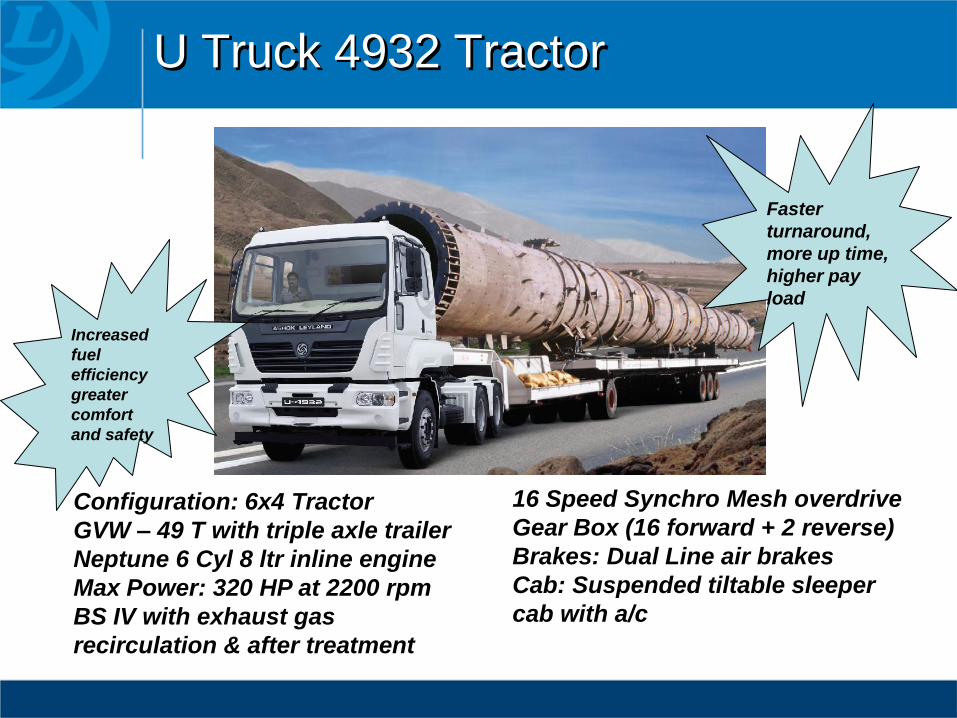
U Truck 4932 Tractor
Configuration: 6x4 Tractor
GVW – 49 T with triple axle trailer
Neptune 6 Cyl 8 ltr inline engine
Max Power: 320 HP at 2200 rpm
BS IV with exhaust gas
recirculation & after treatment
16 Speed Synchro Mesh overdrive
Gear Box (16 forward + 2 reverse)
Brakes: Dual Line air brakes
Cab: Suspended tiltable sleeper
cab with a/c
Faster
turnaround,
more up time,
higher pay
load
Increased
fuel
efficiency
greater
comfort
and safety
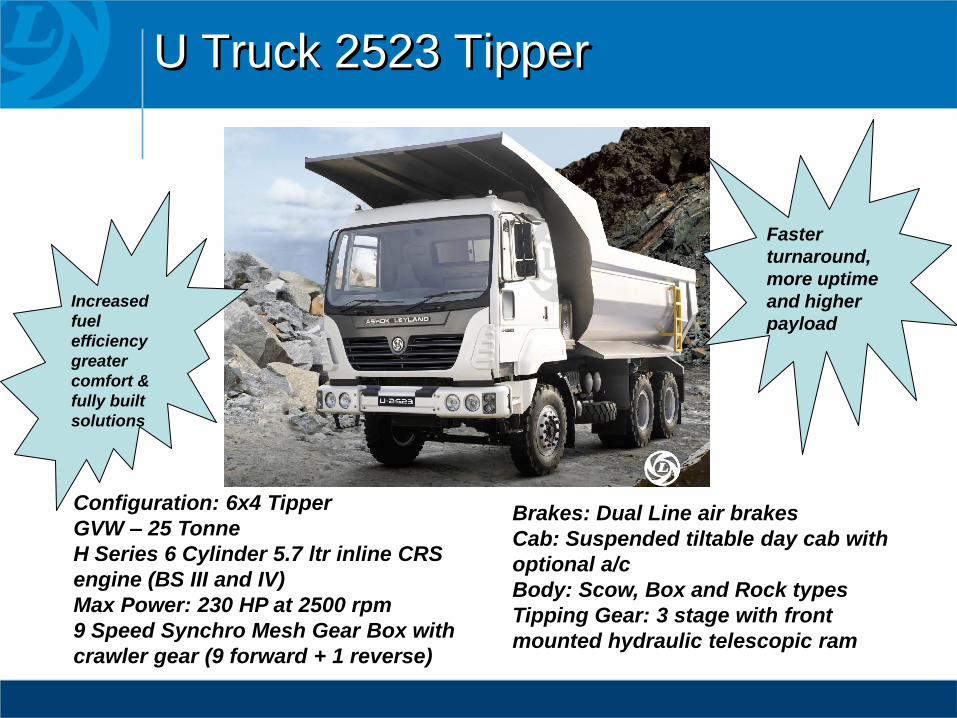
U Truck 2523 Tipper
Configuration: 6x4 Tipper
GVW – 25 Tonne
H Series 6 Cylinder 5.7 ltr inline CRS
engine (BS III and IV)
Max Power: 230 HP at 2500 rpm
9 Speed Synchro Mesh Gear Box with
crawler gear (9 forward + 1 reverse)
Brakes: Dual Line air brakes
Cab: Suspended tiltable day cab with
optional a/c
Body: Scow, Box and Rock types
Tipping Gear: 3 stage with front
mounted hydraulic telescopic ram
Increased
fuel
efficiency
greater
comfort &
fully built
solutions
Faster
turnaround,
more uptime
and higher
payload
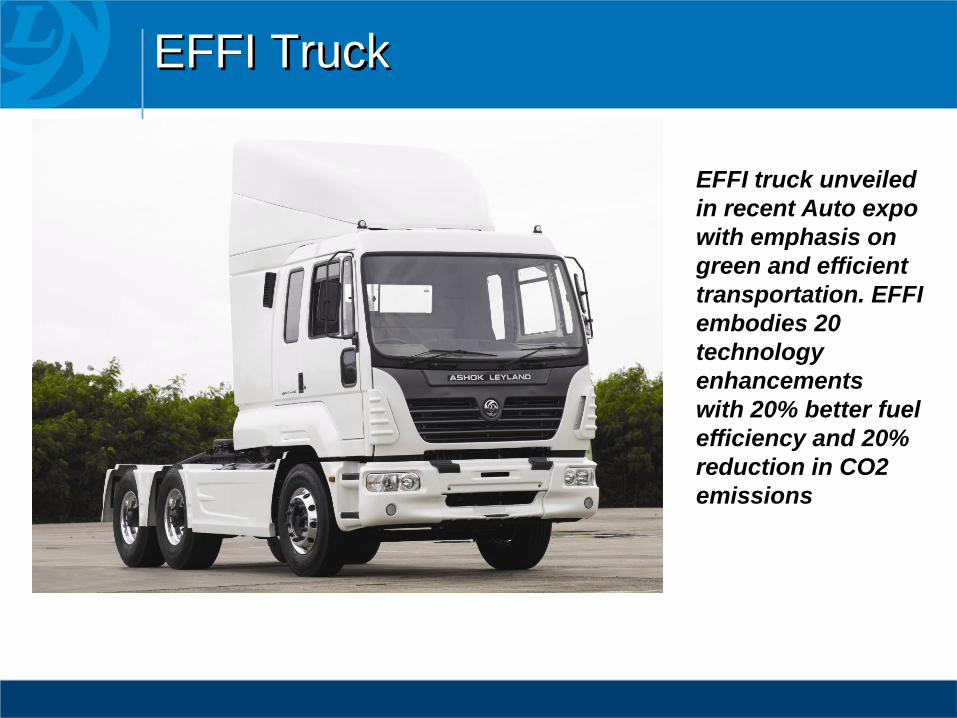
EFFI Truck
EFFI truck unveiled
in recent Auto expo
with emphasis on
green and efficient
transportation. EFFI
embodies 20
technology
enhancements
with 20% better fuel
efficiency and 20%
reduction in CO2
emissions
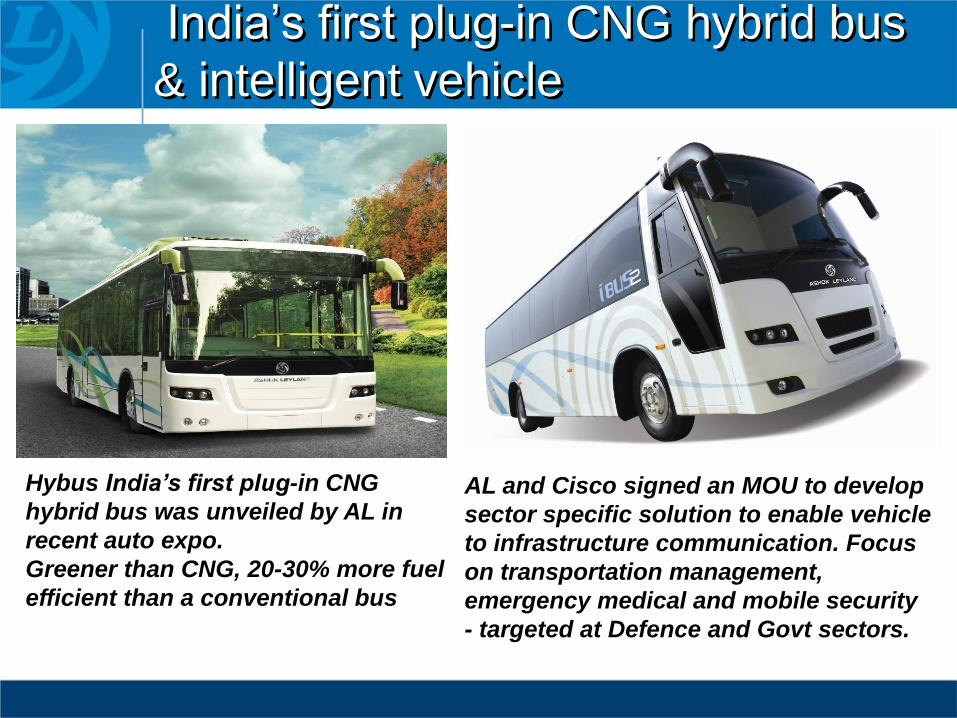
India’s first plug-in CNG hybrid bus
& intelligent vehicle
Hybus India’s first plug-in CNG
hybrid bus was unveiled by AL in
recent auto expo.
Greener than CNG, 20-30% more fuel
efficient than a conventional bus
AL and Cisco signed an MOU to develop
sector specific solution to enable vehicle
to infrastructure communication. Focus
on transportation management,
emergency medical and mobile security
- targeted at Defence and Govt sectors.
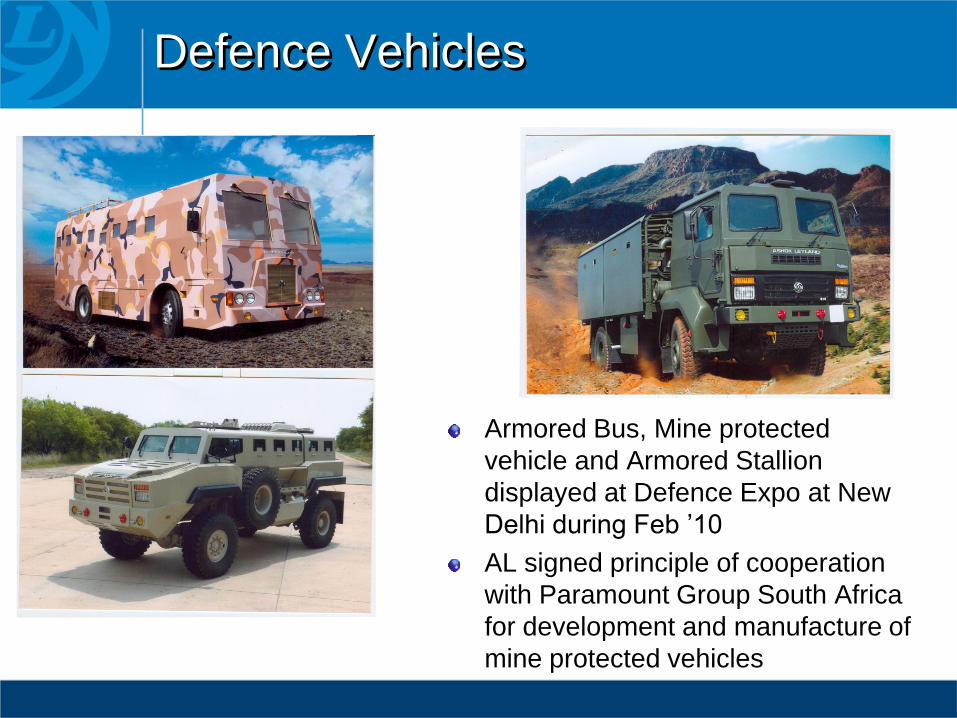
Defence Vehicles
Armored Bus, Mine protected
vehicle and Armored Stallion
displayed at Defence Expo at New
Delhi during Feb ’10
AL signed principle of cooperation
with Paramount Group South Africa
for development and manufacture of
mine protected vehicles
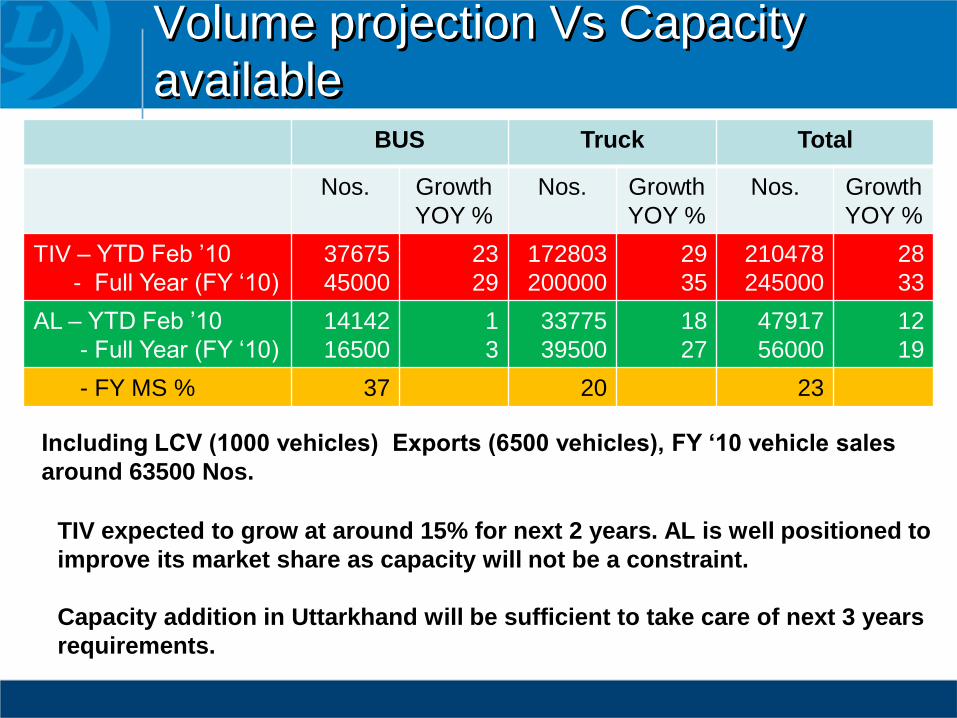
Volume projection Vs Capacity
availableBUS Truck Total
Nos. Growth
YOY %
Nos. Growth
YOY %
Nos. Growth
YOY %
TIV – YTD Feb ’10
- Full Year (FY ‘10)
37675
45000
23
29
172803
200000
29
35
210478
245000
28
33
AL – YTD Feb ’10
- Full Year (FY ‘10)
14142
16500
1
3
33775
39500
18
27
47917
56000
12
19
- FY MS % 37 20 23
Including LCV (1000 vehicles) Exports (6500 vehicles), FY ‘10 vehicle sales
around 63500 Nos.
TIV expected to grow at around 15% for next 2 years. AL is well positioned to
improve its market share as capacity will not be a constraint.
Capacity addition in Uttarkhand will be sufficient to take care of next 3 years
requirements.
Capacity creation at Uttarakhand
Uttarakhand plant would be highly integrated plant of
AL.
Total investment in the plant > Rs. 1100 Cr.
Supply sources identified within tax exempted areas
in Uttarakhand / Himachal Pradesh
All facilities commissioned on 5th Mar.2010
AL is likely to benefit from logistics for supply to
North, East and Western markets from this facility
Targeting to produce around 500 vehicles during
Mar. 2010
Capacity utilisation at Uttarakhand will be maximised
to secure these benefits in next few years
Margin Outlook
Targeting operating margins at around Q 3
levels for Q 4 to be supported by:
Pricing action Rs. 14500/- per vehicle
(1.4%) taken during Jan ‘10
Commodity based price increase pressure
(mainly steel, rubber and aluminum) to be
contained
Stringent controls on operating cost
incurrence to continue
Mix adverse due to higher quantum of STU
and JnNURM orders in Q 4
Full year margins targeted at around 10% of revenue
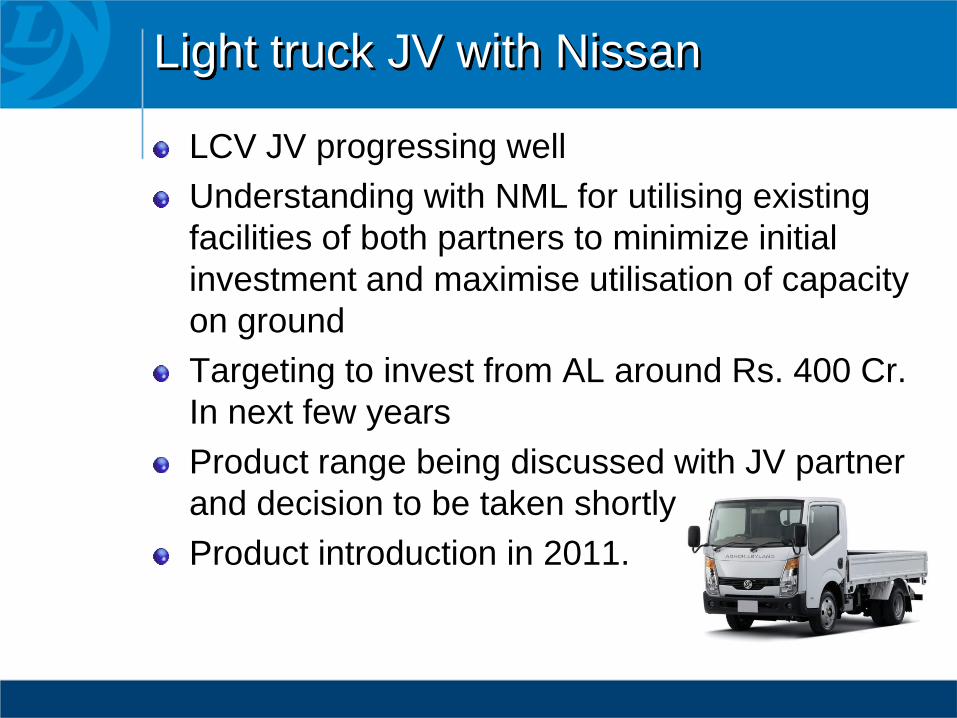
Light truck JV with Nissan
LCV JV progressing well
Understanding with NML for utilising existing
facilities of both partners to minimize initial
investment and maximise utilisation of capacity
on ground
Targeting to invest from AL around Rs. 400 Cr.
In next few years
Product range being discussed with JV partner
and decision to be taken shortly
Product introduction in 2011.
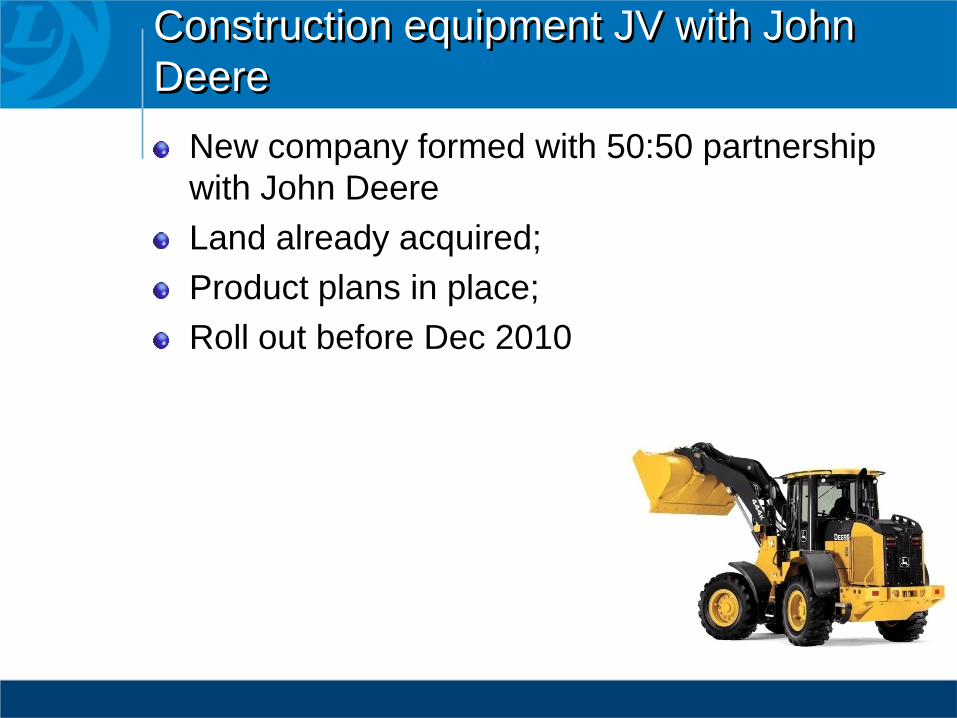
Construction equipment JV with John
Deere
New company formed with 50:50 partnership
with John Deere
Land already acquired;
Product plans in place;
Roll out before Dec 2010
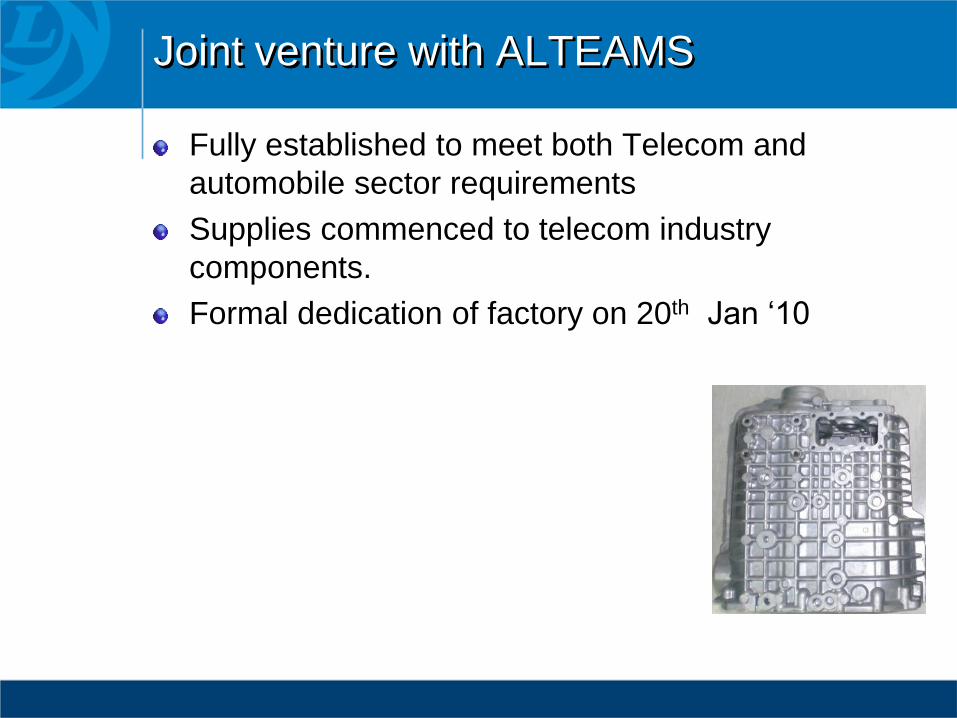
Joint venture with ALTEAMS
Fully established to meet both Telecom and
automobile sector requirements
Supplies commenced to telecom industry
components.
Formal dedication of factory on 20th Jan ‘10
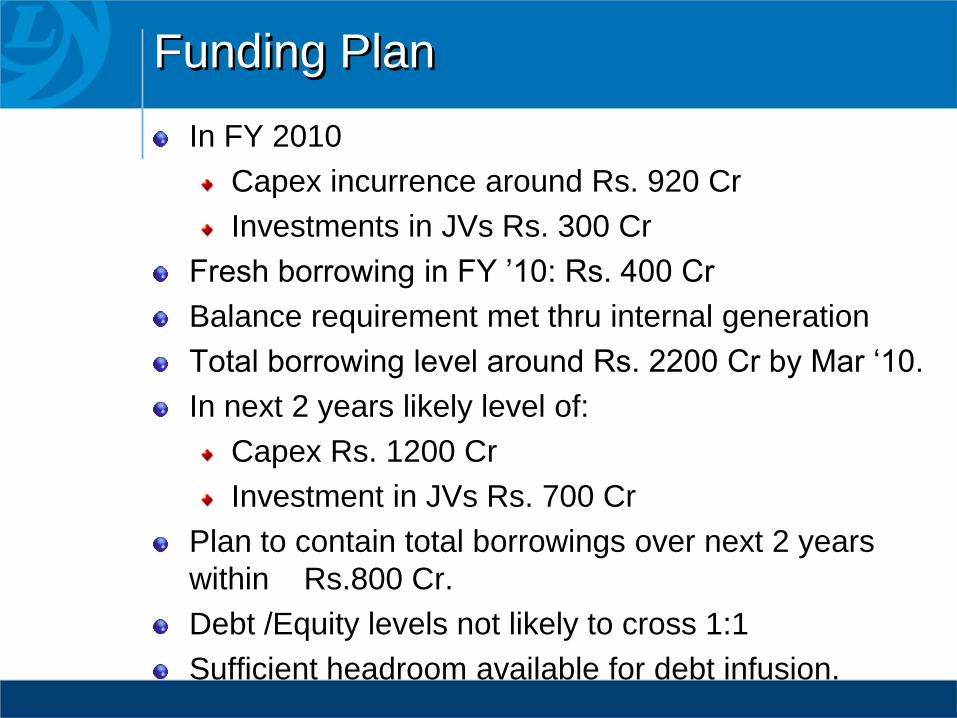
Funding Plan
In FY 2010
Capex incurrence around Rs. 920 Cr
Investments in JVs Rs. 300 Cr
Fresh borrowing in FY ’10: Rs. 400 Cr
Balance requirement met thru internal generation
Total borrowing level around Rs. 2200 Cr by Mar ‘10.
In next 2 years likely level of:
Capex Rs. 1200 Cr
Investment in JVs Rs. 700 Cr
Plan to contain total borrowings over next 2 years
within Rs.800 Cr.
Debt /Equity levels not likely to cross 1:1
Sufficient headroom available for debt infusion.
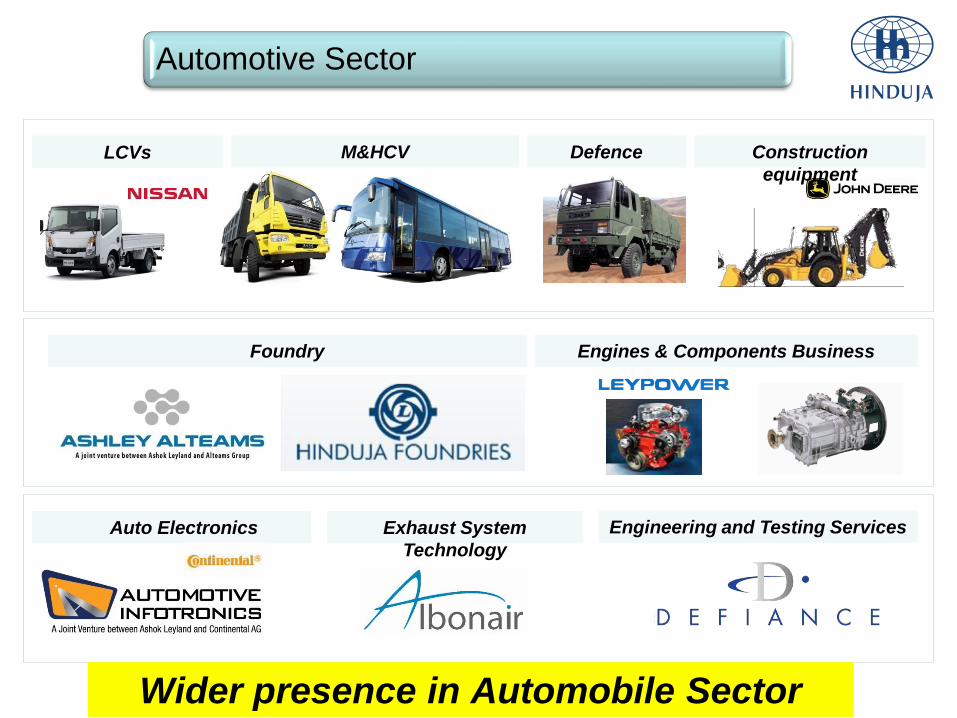
M&HCVLCVs Construction
equipment
Foundry Engines & Components Business
Auto Electronics Exhaust System
Technology
Engineering and Testing Services
Defence
Automotive Sector
Wider presence in Automobile Sector
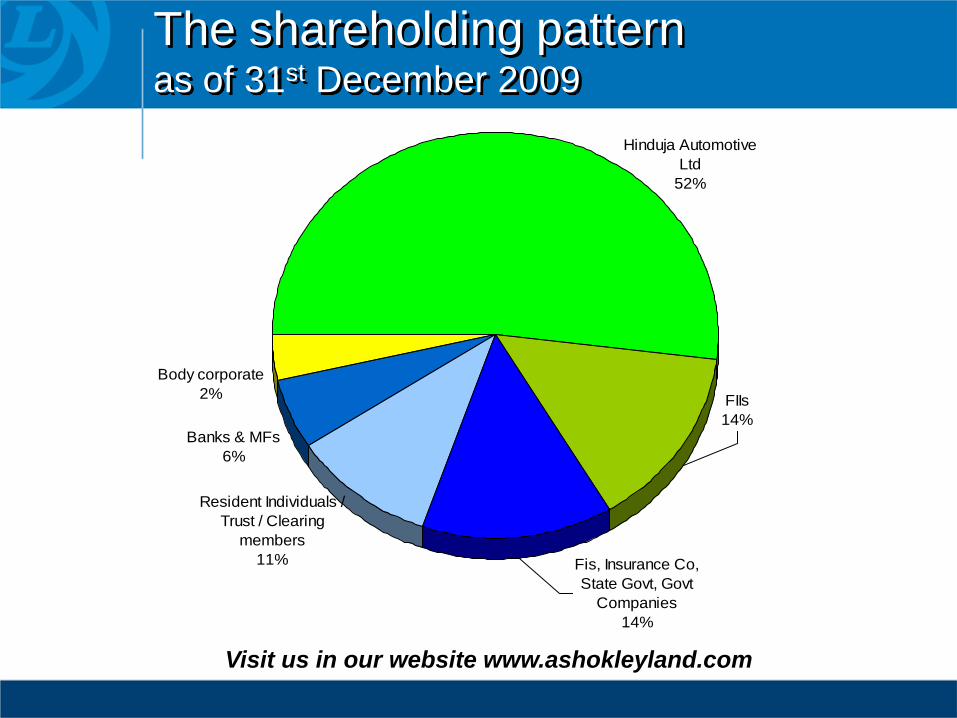
The shareholding pattern as of 31st December 2009
Banks & MFs
6%
Body corporate
2%
Hinduja Automotive
Ltd
52%
FIIs
14%
Resident Individuals /
Trust / Clearing
members
11% Fis, Insurance Co,
State Govt, Govt
Companies
14%
Visit us in our website www.ashokleyland.com
Thank You
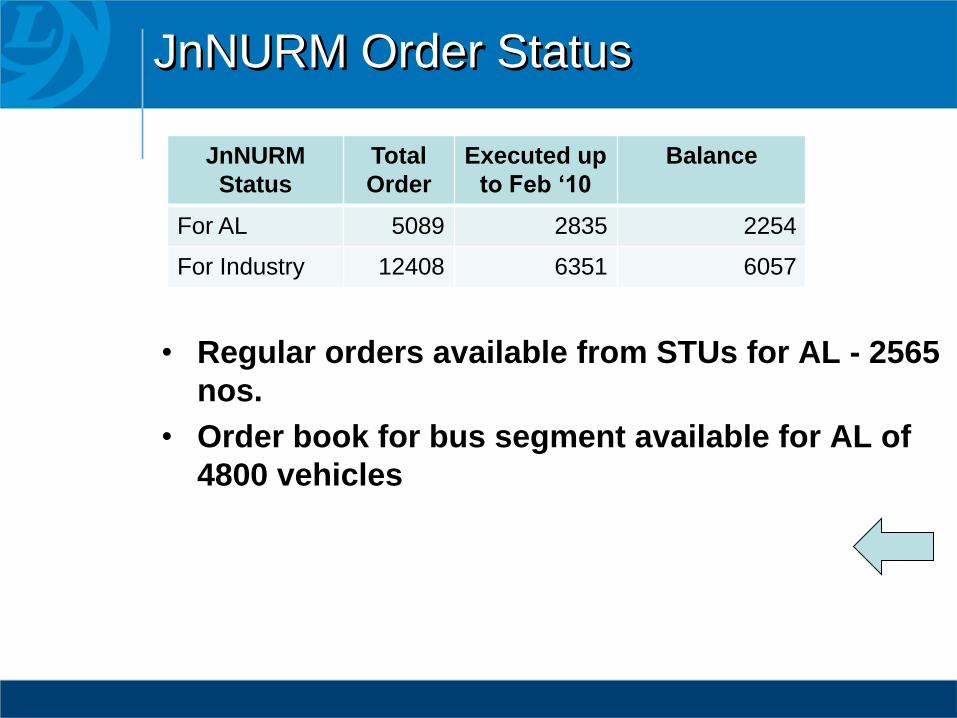
JnNURM Order Status
• Regular orders available from STUs for AL - 2565
nos.
• Order book for bus segment available for AL of
4800 vehicles
JnNURM
Status
Total
Order
Executed up
to Feb ‘10
Balance
For AL 5089 2835 2254
For Industry 12408 6351 6057
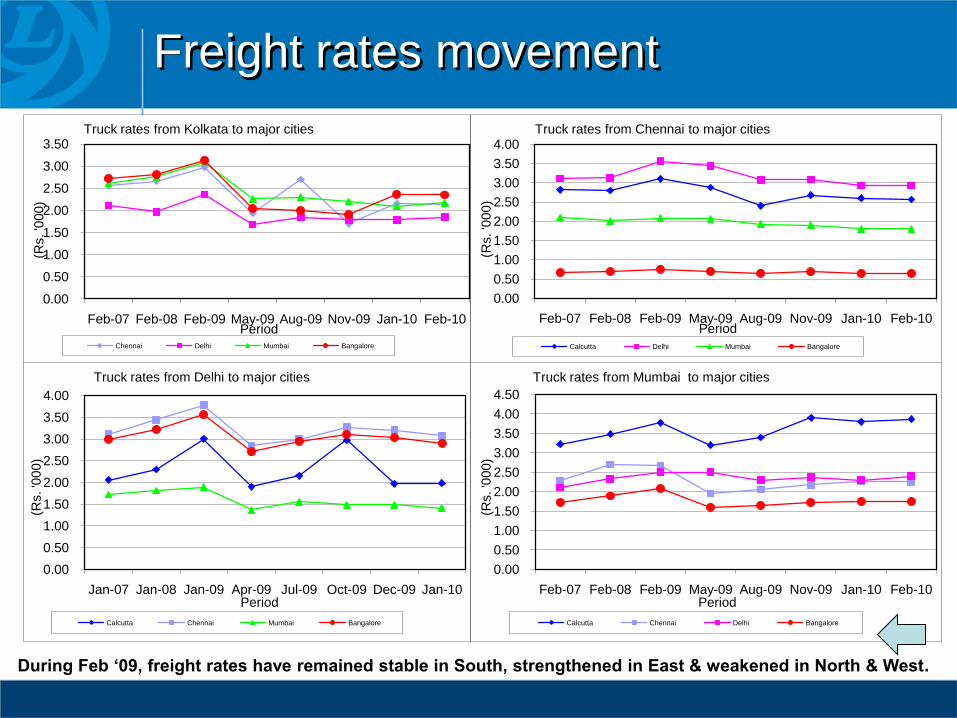
Freight rates movement
During Feb ‘09, freight rates have remained stable in South, strengthened in East & weakened in North & West.
Source: Business Line
0.00
0.50
1.00
1.50
2.00
2.50
3.00
3.50
Feb-07 Feb-08 Feb-09 May-09 Aug-09 Nov-09 Jan-10 Feb-10
(Rs. '0
00)
Period
Truck rates from Kolkata to major cities
Chennai Delhi Mumbai Bangalore
0.00
0.50
1.00
1.50
2.00
2.50
3.00
3.50
4.00
Feb-07 Feb-08 Feb-09 May-09 Aug-09 Nov-09 Jan-10 Feb-10
(Rs. '0
00)
Period
Truck rates from Chennai to major cities
Calcutta Delhi Mumbai Bangalore
0.00
0.50
1.00
1.50
2.00
2.50
3.00
3.50
4.00
Jan-07 Jan-08 Jan-09 Apr-09 Jul-09 Oct-09 Dec-09 Jan-10
(Rs. '0
00)
Period
Truck rates from Delhi to major cities
Calcutta Chennai Mumbai Bangalore
0.00
0.50
1.00
1.50
2.00
2.50
3.00
3.50
4.00
4.50
Feb-07 Feb-08 Feb-09 May-09 Aug-09 Nov-09 Jan-10 Feb-10
(Rs. '0
00)
Period
Truck rates from Mumbai to major cities
Calcutta Chennai Delhi Bangalore