Embed Size (px)
Citation preview

Investor Heterogeneity and Liquidity*
Kalok Chan
CUHK Business School
Chinese University of Hong Kong
Si Cheng
CUHK Business School
Chinese University of Hong Kong
Allaudeen Hameed
NUS Business School
National University of Singapore
February 11, 2021
__________________________________________ * Kalok Chan (email: [email protected]) and Si Cheng (email: [email protected]) are from the Chinese University of
Hong Kong, and Allaudeen Hameed (email: [email protected]) is from National University of Singapore. We thank an
anonymous referee, Jarrad Harford (the editor), Ruchith Dissanayake, Wayne Ferson, Fuwei Jiang, He Wang, David Whidbee,
conference and seminar participants at the Chinese University of Hong Kong, 2017 Asian Finance Association Annual Meeting,
2017 China International Conference in Finance, SFS Cavalcade Asia-Pacific 2017 for helpful comments. Chan acknowledges
financial support from the Hong Kong Research Grants Council (Project #: GRF 690013). Hameed acknowledges financial support
from NUS Academic Research Grant.

Investor Heterogeneity and Liquidity
Abstract
Fund flows are more correlated among funds with similar investment horizon, consistent with
correlated demand for liquidity. We find that stocks held by institutions with more heterogeneous
investment horizon are more liquid and have lower volatility of liquidity. Identification tests
confirm the improvement in stock liquidity holds when the increase in investor heterogeneity arises
from an exogenous shock due to the 2003 tax reform. Additionally, extreme flow-induced trading
by institutional funds has a bigger price impact when stocks have a less heterogeneous investor
base. Moreover, the premium associated with stock illiquidity is concentrated in stocks with low
investor heterogeneity.
Keywords: Liquidity, Volatility of Liquidity, Investor Heterogeneity, Illiquidity Premium
JEL Classification: G12, G23

1
I. Introduction
Institutional investors have been exerting dominating influence in financial markets, and
this represented a larger fraction of equity ownership and even a larger proportion of trading
volume. For instance, in the U.S. equity market, institutional investors have accounted for about
34% of equity ownership in 1980 and reached 67% in 2010 (Blume and Keim (2017)). Chordia,
Roll, and Subrahmanyam (2011) provide evidence that the monthly turnover on New York Stock
Exchange (NYSE) increased from about 5% to about 26% between 1993 and 2008. However,
institutional investors are far from homogenous in terms of their trading preferences (e.g.,
Falkenstein (1996), Bennet, Sias, and Starks (2003), Prado, Saffi, and Sturgess (2016), and Blume
and Keim (2017)).
Institutional investors can be quite different in terms of their investment objectives,
mandates, and clienteles. One key source of heterogeneity among institutional investors is their
investment horizon. Cella, Ellul, and Giannetti (2013) find that the university and foundation
endowments, pension funds and insurance companies tend to be long-horizon investors, while
hedge funds, bank trusts and investment companies tend to be short-horizon investors. As for the
mutual fund companies, which comprise of a great variety of strategies, their investment horizon
is around the middle of the spectrum.
In this paper, we examine how the heterogeneity of the investment horizon, as reflected in
the dispersion of investment horizon among institutional investors in stock, is related to the stock
liquidity. We postulate that the dispersion of investment horizon, as a reflection of the
heterogeneous investor base, can explain both the stock liquidity and volatility of liquidity. The
underlying reason is that if a stock has a homogeneous investor base, then investors are likely to
follow the same investment strategy and react to the same signals. Consequently, the order flows

2
for the stock would be correlated and this would give rise to correlated liquidity demand shocks
and hence, a coordinated demand for liquidity. Investor heterogeneity, on the other hand, reflects
the differences in investment strategy where investor-specific liquidity shocks are likely to be
absorbed by other investor types. In support of this line of reasoning, we find that the comovement
in fund flows among investment funds that share common investment horizon is indeed higher
than the comovement in flows among funds that differ in their investment horizon. Thus, when
institutional owners of stock have similar investment horizon and strategy, they face correlated
demand for liquidity and when a stock is held mostly by such institutions, the stock is likely to be
more illiquid.
Previous literature has shown that short-term and long-term institutions trade on diverse
signals and opportunities. Short-term institutions trade on temporary signals, such as information
(Yan and Zhang (2009)), liquidity provision opportunities (Da, Gao, and Jagannathan (2011),
Cheng, Hameed, Subrahmanyam, and Titman (2017)) and they are influenced by behavioral biases
(Cremers and Pareek (2015)). These short-term institutional investors display correlated selling
during periods of market turmoil to prevent outflows arising from short-term losses (e.g., Bernardo
and Welch (2004), Morris and Shin (2004), and Cella et al. (2013)). If trading activities in a stock
are dominated by short-term institutional investors, their correlated trading could lead to a bigger
price impact and higher fluctuations in liquidity. On the other hand, long-term institutions trade
primarily due to stochastic portfolio needs (e.g., index rebalancing) and long-term value investing
(Greenwald, Kahn, Sonkin, and van Biema (2001); Cremers and Pareek (2016)). Their clients
typically have longer investment horizons (such as participants in defined contribution retirement
plans) and tend to be less sensitive to fund performance (Sialm, Starks, and Zhang (2015)), so that
long-term institutions are exposed to less flow volatility, flow-performance sensitivity, as well as

3
flow-induced price pressure. As a result, if a stock has a heterogeneous investor base, the diverse
investment strategies makes it easier for different groups of investors to accommodate investor
specific liquidity shocks. For instance, active, short-horizon mutual funds can provide liquidity to
long-horizon index funds following index rebalancing, and long-horizon funds can provide
liquidity to active mutual funds during fire sales. Also, a wider difference in the types of
institutional investors holding a stock can also increase the supply of loanable shares to short-
sellers and, hence, lower the volatility of liquidity and increase stock liquidity.1 Overall, we predict
that the illiquidity and volatility of liquidity are lower for stocks with a more balanced composition
of short-term and long-term institutional investors.
Our empirical analyses begin with measuring heterogeneity in institutional investors
holding a stock in terms of their investment horizons. We first compute the churn rate of each
institution in each quarter, following Gaspar, Massa, and Matos (2005). The larger the churn rate,
the higher the institutional investors’ portfolio turnover, and the shorter the investors’ investment
period. Next, the stock-level heterogeneity in investment horizon (STDCR) is computed in each
quarter as the standard deviation of the churn rate of all institutions holding a stock, scaled by the
average churn rate of the same set of institutions. To relate STDCR to stock illiquidity, we examine
two dimensions of illiquidity: (a) price impact measure of illiquidity in Amihud (2002)
(LOGILLIQ) and (b) trading activity measure based on the inverse of stock turnover used in
Chordia, Subrahmanyam, and Anshuman (2001).2
1 Nagel (2005) and Chen, Hong, and Stein (2002), for example, show that stocks with higher institutional ownership have lower
short-sale constraints. Diamond and Verrecchia (1987) predict that lower short-sale constraints improve stock liquidity and the
empirical support is provided in Diether, Lee, and Werner (2009), among others. Different from these papers, we focus on the
heterogeneity in the investment horizon of institutional investors and its impact of liquidity and the volatility of liquidity. We also
show that our findings hold after controlling for the number of institutional owners, percentage of institutional ownership as well
as the concentration of institutional ownership in a stock. 2 Appendix A provides detailed description of all variables.

4
We find that investor heterogeneity is negatively related to both stock illiquidity and
volatility of liquidity, as conjectured. For instance, a one standard deviation increase in STDCR is
related to 0.70% lower stock illiquidity measured by LOGILLIQ for the NYSE/AMEX/Nasdaq
sample during the period 1982–2016. Additionally, a one standard deviation increase in STDCR is
associated with a 3.27% decrease in the volatility of LOGILLIQ. We obtain similar findings when
we use the trading activity measure of liquidity. The economic magnitude of our findings increases
by two to three times in the recent period from 2000 to 2016. This is consistent with the high
growth in the diversity of institutional investor base driving the cross-sectional variation in stock
liquidity and volatility of liquidity. Our basic findings are highly robust and remain intact after
controlling for many stock characteristics, including the level and concentration in institutional
ownership.
An important issue with our analyses is that investor heterogeneity and stock liquidity, as
well as liquidity volatility, maybe spuriously correlated due to reverse causality or presence of an
endogenous relation. For example, as liquid stocks can be bought or sold without large price impact,
both funds with a long or short investment horizon would include a liquid stock in their portfolios.
On the other hand, an illiquid stock is subject a larger transaction cost due to price impact, so that
only funds with a long investment horizon would include the illiquid stock. While it is difficult to
categorically reject this alternative, we employ two different approaches to alleviate the concerns
about endogeneity. First, we consider an identification strategy based on a tax reform that is
exogenous to firm liquidity but affects investor heterogeneity. The 2003 Jobs and Growth Tax
Relief Reconciliation Act in the United States (hereafter, the “2003 Tax Cut”) substantially
reduced dividend taxes. Sialm and Starks (2012) show that the change in tax code caused mutual
funds held by taxable investors to increase their relative likelihood of holding high dividend yield

5
stocks. This is in contrast to these stocks being primarily held by mutual funds favored by long-
term tax-qualified retirement accounts before 2003. Consistent with our expectation, the 2003 Tax
Cut significantly increased the heterogeneity of investors for consistent dividend payers, relative
to a matched control group of firms that initiated dividends following the tax cut. More importantly,
when investor heterogeneity increases due to the tax cut, we find a concurrent decline in stock
illiquidity and liquidity volatility. Our findings are amplified among stocks that experience a larger
increase in investor heterogeneity. For example, stock illiquidity decreases between 9% and 26%,
among stocks that register an above average increase in investor heterogeneity following the tax
cut.
Next, we use extreme institutional capital flows as exogenous liquidity shocks to establish
the effect of investor heterogeneity on liquidity. Coval and Stafford (2007) show that when many
funds are forced to liquidate their stock holdings within a short period due to heavy outflows, the
stocks experience fire sales and their prices temporarily deviate from fundamental values. They
find that extreme mutual fund outflows (inflows) exert significant price pressure that causes
declines (increases) in the stock prices followed by price reversals over the subsequent quarters.
Implicit in their fire sale story is that several different owners experience financial distress at the
same time and sell the stocks simultaneously. We postulate that the flow-induced price pressure
would be stronger in stocks with less heterogeneous investor base as these investors are more likely
to face correlated flow shocks arising from a similarity in investment horizon (or similarity due to
a common investment style or clientele). Indeed, we find that the price pressure and subsequent
stock return reversals induced by extreme capital flows is statistically and economically larger for
stocks with more homogeneous investor base. Taking all these findings together, our results are
unlikely to be driven by reverse causality from stock liquidity to investor heterogeneity.

6
Additionally, we find that the premium for illiquidity demanded by investors is
concentrated among stocks with low investor heterogeneity. Specifically, we compute the
illiquidity premium as the difference in the risk-adjusted returns on illiquid and liquid stocks (i.e.,
returns on illiquid stocks minus the returns on liquid stocks). The illiquidity premium among stocks
with low investor heterogeneity is a highly significant 12.32% per year, while the corresponding
illiquidity premium among stocks with high investor heterogeneity is an insignificant 2.21% per
annum. Hence, the level of stock illiquidity is a bigger concern among stocks with homogeneous
investors, and the stock price reflects a premium for the exposure to liquidity shocks arising from
correlated liquidity needs of its investor base. Overall, our evidence supports the notion that the
homogeneity of the investor base affects stock liquidity and stock price.
The remainder of the paper is organized as follows. In Section II, we describe the data and
the construction of the main variables, and present some stylized characteristics associated with
investor heterogeneity. In Section III, we examine the relationship between investor heterogeneity
and stock liquidity and liquidity volatility. In Section IV, we relate investor heterogeneity to the
illiquidity premium. A brief conclusion follows in Section V.
II. Data and Variable Construction
A. Data Sources
Our sample consists of all NYSE/AMEX/Nasdaq common stocks with share code 10 or
11, with daily and monthly stock data obtained from the Center for Research in Security Prices
(CRSP). We acquire quarterly institutional equity holdings from Thomson-Reuters Institutional
Holdings (13F) database and Mutual Fund Holdings database. 3 We obtain other fund
3 The institutional ownership data come from quarterly 13F filings of money managers to the U.S. Securities and Exchange (SEC).
The database contains the positions of all the institutional investment managers with more than $100 million U.S. dollars under
discretionary management. All holdings worth more than $200,000 U.S. dollars or 10,000 shares are reported in the database.

7
characteristics from the CRSP mutual fund database, such as monthly net-of-fee returns and total
net assets (TNA). Quarterly and annual financial statement data come from the COMPUSTAT
database. The full sample period ranges between 1982 and 2016. Our sample begins in 1982 as the
13F holdings information are only available from the 1980s and we require four quarters to
construct the proxy for investor heterogeneity. To minimize microstructure biases emanating from
low priced stocks, we exclude “penny” stocks whose prices are below $5 at the end of the previous
quarter.4
B. Main Variables
Our main measure of investor heterogeneity relies on the investment horizon of
institutional investors. We first compute the churn rate of fund 𝑓 in quarter 𝑞 : 𝐶𝑅𝑓,𝑞 =
∑ 𝐶�̃�𝑓,𝑞−𝑟+14𝑟=1 /4 , and 𝐶�̃�𝑓,𝑞 = ∑ |𝑁𝑖,𝑓,𝑞𝑃𝑖,𝑞 − 𝑁𝑖,𝑓,𝑞−1𝑃𝑖,𝑞−1 − 𝑁𝑖,𝑓,𝑞−1∆𝑃𝑖,𝑞|𝑖∈𝑆 /
∑ [(𝑁𝑖,𝑓,𝑞𝑃𝑖,𝑞 + 𝑁𝑖,𝑓,𝑞−1𝑃𝑖,𝑞−1)/2]𝑖∈𝑆 , where 𝑆 refers to the set of companies held by fund 𝑓, 𝑃𝑖,𝑞
and 𝑁𝑖,𝑓,𝑞 refer to the price and the number of shares of stock 𝑖 held by fund 𝑓 in quarter 𝑞 ,
respectively, following Gaspar et al. (2005). The churn rate of fund 𝑓 reflects the fund’s average
turnover of stocks held in the portfolio, i.e., the investment horizon of the fund. By construction,
the value of the churn rate ranges between 0 and 2. The larger the churn rate, the higher the
institutional investor’s portfolio turnover, which implies a shorter investment horizon.5 Hence, the
heterogeneity of a stock’s investor base is low when most investors owning the stock have similar
investment holding period.
We proceed to construct the measure of the heterogeneity of investors as follows. For stock
𝑖 in quarter 𝑞 , the variation in its investor base ( 𝑆𝑇𝐷𝐶𝑅𝑖,𝑞 ) is defined as 𝑈𝑆𝑇𝐷𝐶𝑅𝑖,𝑞
𝐶𝑅𝑖,𝑞, where
4 Our findings are robust to alternative data selection criterion such as excluding stocks below $1. 5 Unreported results suggest that the average churn rate is 0.2, indicating that on average it takes 10 quarters to churn the entire
portfolio once.

8
𝑈𝑆𝑇𝐷𝐶𝑅𝑖,𝑞 refers to the standard deviation of the churn rate of all funds that hold stock 𝑖 in quarter
𝑞, and 𝐶𝑅𝑖,𝑞 refers to the average churn rate of all funds holding stock 𝑖 at the same quarter. A low
STDCR indicates that all investors in the firm have similar investment horizon, either short-term
or long-term. When a stock is held by investors with heterogeneous investment horizon, the large
dispersion in holding periods across institutional shareholders implies a high STDCR. Unreported
analyses confirm the strong correlation between STDCR and the unscaled measure, USTDCR, and
the correlation is 0.8. Besides, scaling USTDCR by the average churn rate (CR) helps to isolate the
effect of investor heterogeneity from that of average churn rate, as STDCR displays a low
correlation of 0.37 with CR, and the correlation between USTDCR and CR is higher at 0.57. We
also show that the main findings on the relationship between investor heterogeneity and stock
liquidity hold when we use STDCR or USTDCR to measure dispersion in investor horizon.
Moreover, we report similar findings with alternative measures of investor heterogeneity in the
section on robustness tests.6
We relate investor heterogeneity to two aspects of stock liquidity: liquidity level and
volatility of liquidity. We consider two dimensions of stock illiquidity: (a) (the logarithm of)
Amihud (2002) measure of price impact, labeled LOGILLIQ; and (b) the inverse of stock turnover
which measures the level of trading activity, labeled 1/TURN. We define liquidity volatility as the
logarithm of the coefficient of variation of Amihud illiquidity or turnover, and label them
LOGCVILLIQ and LOGCVTURN, respectively. In comparing various measures of price impact,
6 The investment horizon can also be proxied by fund self-reported turnover, but CRSP only provides such information for mutual
funds. We rely on the 13F holdings information and churn rate to maximize the coverage of institutional trading activity. As a
robustness check, we measure the investment horizon of institutional investors using the turnover derived from their portfolio
holdings and obtain similar results.

9
Goyenko, Holden, and Trzcinka (2009) show that the LOGILLIQ outperforms other liquidity
measures.7
Our analyses also incorporate several stock-level control variables. These include
Log(Size), defined as the logarithm of the market capitalization of a stock; Log(BM), the logarithm
of the book-to-market ratio of a stock; Log(RetVol), the logarithm of the return volatility of a stock;
RETQ1, the stock returns over the previous quarter; RETQ2-4, the stock returns over the three
quarters ending at the beginning of the previous quarter; Num_Fund, the number of funds holding
the stock in the quarter; and IO, the percentage of institutional ownership of a stock. A detailed
description of all variables is provided in Appendix A.
C. Stylized Characteristics Associated with Investor Heterogeneity
1. Summary Statistics
Table 1 provides the summary statistics of stocks sorted into quintiles based on investor
heterogeneity (STDCR). Panel A first confirms that the variation in investor heterogeneity
(STDCR) in the cross-section of stocks coincides with the unscaled dispersion of investment
horizons among the institutional investors (USTDCR), and is not driven by a denominator effect
of average investment horizon (CR). It is apparent that investor heterogeneity is negatively related
to the future level and volatility of illiquidity. As shown in Panel A, stocks in the lowest quintile
in terms of investor heterogeneity have significantly higher illiquidity and volatility of liquidity
relative to stocks in the highest quintile. To provide an idea of the economic magnitude of these
differences, we scale the difference in values between the two extreme quintiles by the standard
deviation of these measures.8 The illiquidity of stocks in the low investor heterogeneity quintile is
7 Chordia et al. (2001) document that the volatility of trading activity, LOGCVTURN, is negatively related to the cross-section of
expected returns–a finding that is inconsistent with risk averse investors requiring higher returns on stocks with greater variability
in liquidity. 8 The standard deviation of LOGILLIQ, 1/TURN, LOGCVILLIQ and LOGCVTURN in the full sample is 3.320, 21.624, 0.442 and
0.585, respectively.

10
larger than the high quintile by 63% (37%) when measured by LOGILLIQ (1/TURN). Similarly,
the volatility of liquidity (LOGCVILLIQ) and trading activity (LOGCVTURN) in low investor
heterogeneity quintile is higher by 49% and 52%, respectively. As shown in Panel B of Table 1,
stocks in the highest quintile of investor heterogeneity appear to be larger, growth firms, have
lower return volatility, poorer past performance and exhibit more institutional participation in
terms of the number of funds and percentage owned by institutions.
The initial impression from Table 1 is that stocks with more heterogeneous investor base
are associated with higher liquidity and lower volatility of liquidity. In Section III, we formally
establish the relationship between investor heterogeneity and stock liquidity.
2. Comovement in Fund Flows
Prior literature shows that short-term and long-term institutions trade on diverse signals
and opportunities. Short-term institutions trade on temporary signals, such as information, liquidity
provision opportunities and they are influenced by behavioral biases (e.g., Yan and Zhang (2009),
Da et al. (2011), Cremers and Pareek (2015), and Cheng et al. (2017)), while long-term institutions
trade primarily due to stochastic portfolio needs such as index rebalancing and long-term value
investing (Greenwald et al. (2001), Cremers and Pareek (2016)). This suggests that investors in
funds with similar investment horizon are more likely to respond similarly and display more
correlated flows. To be more specific, the investment strategy adopted by a professional asset
manager reflects the investment horizon and risk preference of their investors. Therefore,
institutions with similar investment horizon could be exposed to more correlated inflows and
outflows due to the similar investment objectives and investor clientele. Both supply-side (e.g.,
correlated flow) and demand-side (e.g., correlated investment strategy) effects arising from
common investment horizon could have important implications on institutional trading and stock

11
liquidity. Given that the most existing evidence points to the demand-side explanation, we provide
additional evidence to link the investment horizon with comovement in fund flows. To do this, we
focus on the subset of open-end equity mutual funds (rather than aggregate 13F institutions) for
which we are able to obtain holdings and flows at the individual fund level.
For each mutual fund 𝑓, we compute the fund flow in a month 𝑚 as follows:
(1) 𝐹𝑙𝑜𝑤𝑓,𝑚 = [𝑇𝑁𝐴𝑓,𝑚 − 𝑇𝑁𝐴𝑓,𝑚−1 × (1 + 𝑟𝑓,𝑚)]/𝑇𝑁𝐴𝑓,𝑚−1
where 𝑇𝑁𝐴𝑓,𝑚 refers to the total net assets (TNA) of fund 𝑓 in month 𝑚, and 𝑟𝑓,𝑚 refers to fund
total return in the same month. In each quarter 𝑞 , mutual funds are then sorted into terciles
according to the average churn rate (CR) in the previous three years. For each fund-quarter, fund
flow comovement is estimated from the following bivariate regressions over the previous three
years,
(2) 𝐹𝑙𝑜𝑤𝑓,𝑚 = 𝛼𝑓,𝑚 + ∑ 𝛽𝐼𝑛,𝑓,𝑚+𝑖𝐹𝑙𝑜𝑤𝐼𝑛,𝑓,𝑚+𝑖
𝑘
𝑖=−𝑘+ ∑ 𝛽𝑂𝑢𝑡,𝑓,𝑚+𝑖𝐹𝑙𝑜𝑤𝑂𝑢𝑡,𝑓,𝑚+𝑖
𝑘
𝑖=−𝑘+ 𝜀𝑓,𝑚
where 𝐹𝑙𝑜𝑤𝑓,𝑚 refers to the flow of fund 𝑓 in month 𝑚, 𝐹𝑙𝑜𝑤𝐼𝑛,𝑓,𝑚+𝑖 refers to the equal- (or
value-) weighted flow across funds in the same tercile of churn rate as fund 𝑓, and 𝐹𝑙𝑜𝑤𝑂𝑢𝑡,𝑓,𝑚+𝑖
refers to the equal- (or value-) weighted flow across funds that are not in the same tercile of churn
rate as fund 𝑓. We also allow for the potential lead-lag effect on fund flows by including the
contemporaneous fund flows, as well as the fund flows in one month (𝑘 = 1) or two months (𝑘 =
2) before and after the current month in Equation (2). The comovement in fund flows among funds
with similar investment horizons (i.e., within the same CR tercile) is the sum of regression
coefficients, i.e., ∑ 𝛽𝐼𝑛,𝑓,𝑚+𝑖𝑖 . Similarly, ∑ 𝛽𝑂𝑢𝑡,𝑓,𝑚+𝑖𝑖 proxies for the comovement in fund flows
among funds with different investment horizons (i.e., in the other two CR terciles).
We report the results in Table 2. We find that across all CR terciles, flows to a mutual fund
comove more with flows to other funds with similar investment horizon and comove less with

12
flows into funds with different investment horizons. For instance, in Panel A, where portfolio flows
are equal-weighted and 𝑘 = 1, the fund flows of a low CR fund (i.e., long-term investment fund)
are highly correlated with flows to other funds within the same low CR group (∑ 𝛽𝐼𝑛,𝑓,𝑚+𝑖𝑖 = 0.80)
and comove less with flows to funds that are not in the low CR group (∑ 𝛽𝑂𝑢𝑡,𝑓,𝑚+𝑖𝑖 = 0.12). The
difference in these two comovement estimates is 0.68 and highly significant (t-stat = 9.58).
Similarly, for funds in the high CR tercile, their flows are significantly more correlated with other
high CR funds (∑ 𝛽𝐼𝑛,𝑓,𝑚+𝑖𝑖 = 0.98) than with flows to low CR funds (∑ 𝛽𝑂𝑢𝑡,𝑓,𝑚+𝑖𝑖 = 0.16). Our
findings are qualitatively similar when we estimate the comovement using a two-month lead-lag
effect of flows (Panel A) or fund flows are weighted by each fund’s lagged TNA (Panel B). The
latter finding suggests that differences in fund size are not likely to explain our results.
Interestingly, the estimates also indicate that fund flows comove more among high CR (i.e., short-
term) funds than low CR funds.
Our findings imply that a stock that is owned by investors with homogeneous investment
horizon is more likely to face similar (correlated) flow-induced price pressure, intensifying the
effect of aggregate fund flows on stock price and worsening the stock’s liquidity. On the other
hand, a stock with a diverse investor base is less prone to flow effects as the institutions holding
the stock face less correlated flows, hence, improving the stock’s liquidity. Similarly, higher
correlated flows may have a similar amplification effect on the stock’s volatility of liquidity. The
findings in Table 2 provide further motivation for our investigation of the relation between the
heterogeneity in investors’ investment horizon and stock liquidity.
III. Investor Heterogeneity and Stock Liquidity
In this section, we conduct an encompassing set of tests to examine whether the
heterogeneity in the investment horizon of investors owning the stock explains the cross-sectional

13
variation in the level and volatility of stock liquidity. We start by showing that stocks with more
heterogeneous investors are not only more liquid but also exhibit lower future variability of
liquidity and trading activity, after controlling for various stock characteristics that may affect
liquidity, including the level and concentration of institutional ownership. Our main results are
particularly stronger in recent years with a sharp increase in aggregate institutional participation.
A natural concern is that the investor heterogeneity and stock liquidity as well as liquidity volatility
may be spuriously correlated due to unobserved firm characteristics or reverse causality. We
alleviate this concern by examining the effects of an exogenous change in stock’s investor
heterogeneity based on the implementation of dividend tax reform in 2003. In addition, we use the
price pressure and subsequent return reversal arising from extreme institutional capital flows as a
setting to examine the differences in liquidity effects attributable to the relation between investor
heterogeneity and liquidity. We also have a couple of robustness tests at the end of this section.
A. Investor Heterogeneity and Stock Liquidity
To document the relationship between investor heterogeneity and stock liquidity, we
estimate the following quarterly Fama and MacBeth (1973) regression:
(3) 𝐼𝐿𝐿𝐼𝑄𝑖,𝑞 = 𝛼0 + 𝛽1𝑆𝑇𝐷𝐶𝑅𝑖,𝑞−1 + 𝑐𝑀𝑖,𝑞−1 + 𝑒𝑖,𝑞
where 𝐼𝐿𝐿𝐼𝑄𝑖,𝑞 refers to the stock illiquidity proxies 𝐿𝑂𝐺𝐼𝐿𝐿𝐼𝑄𝑖,𝑞 or 1/𝑇𝑈𝑅𝑁𝑖,𝑞 of stock 𝑖 in
quarter 𝑞, and 𝑆𝑇𝐷𝐶𝑅𝑖,𝑞−1 refers to stock 𝑖’s investor heterogeneity in investment horizon. The
vector M stacks all stock-specific control variables, including the Log(Size), Log(BM),
Log(RetVol), RETQ1, RETQ2-4, Num_Fund and IO. Since the stock illiquidity is highly persistent,
we also control for lagged stock illiquidity (as indicated by the AR(1) variable) and report Newey
and West (1987) adjusted t-statistics.

14
Panel A of Table 3 (models 1 to 4) shows that consistent with prior literature, stock
illiquidity measured by price impact or trading activity is higher for small value stocks and those
with a lower percentage of institutional ownership. Both proxies of illiquidity, LOGILLIQ and
1/TURN, exhibit a similar relationship with these firm characteristics, except that past losers
exhibit greater price impact based on LOGILLIQ but have higher trading volume (therefore lower
1/TURN). More importantly, investor heterogeneity is positively related to future stock liquidity,
and this relation is significant across all illiquidity measures and regression specifications. For
instance, in Model 2 (Model 4) of Panel A, one standard deviation increase in STDCR is related to
0.70% (2.60%) lower stock illiquidity when measured by LOGILLIQ (1/TURN).9
The U.S. equity market underwent substantial technological and structural changes in the
past decade that has improved stock liquidity and facilitated intensive trading activity (see Chordia
et al. (2011) and Chordia et al. (2014)). At the same time, there has been a sharp growth in the
diversity of institutional participation, including endowment funds, sovereign wealth funds, hedge
funds, exchange traded funds (ETFs) and high frequency traders (HFTs). The average institutional
ownership in our sample increases from 38% in the pre-2000 period to 55% in the post-2000
period.
To assess whether the investor heterogeneity has gained greater importance given the
growing trend of overall market liquidity and institutional participation, we report the estimates of
Equation (3) based on the recent sub-period from 2000 to 2016. As shown in Panel B of Table 3,
the inverse cross-sectional association between investor heterogeneity and stock illiquidity is
indeed much stronger in the recent sub-period. In terms of economic magnitude, a one standard
deviation increase in STDCR reduces the stock illiquidity by 1.93% (7.41%) when measured by
9 The impact of stock illiquidity measured by LOGILLIQ is −0.70%, computed as −0.064×0.361/3.320, where −0.064 is the
regression coefficient in Model 2, 0.361 is the standard deviation of STDCR, and 3.320 is the standard deviation of LOGILLIQ.

15
LOGILLIQ (1/TURN) as shown in Model 2 (Model 4).10 The almost three-fold increase in the
economic magnitude of the estimates in recent years emphasizes the growing impact of cross-
sectional variation in investor heterogeneity on stock liquidity. This is also not surprising as we
should expect our measure of heterogeneity in the investor base to be more reliable as institutional
ownership becomes a bigger fraction of total ownership of a stock.
We move on to examine the notion that a heterogeneous investor base may help absorb
investor-specific liquidity shocks and, hence reduce the liquidity volatility. To achieve this goal,
we replace the stock illiquidity in Equation (3) with stock liquidity volatility, i.e., proxied by the
volatility of Amihud price impact measure (LOGCVILLIQ) and volatility of trading activity
(LOGCVTURN). The results are reported in Table 3, models 5 to 8. The volatility of liquidity is
higher for small stocks and the stocks with lower institutional ownership, similar to the findings
on stock illiquidity. Stocks with higher return volatility tend to have lower volatility of liquidity.
Consistent with our hypothesis, we find that investor heterogeneity is negatively associated with
future volatility of stock liquidity. In Panel A, a one standard deviation increase in STDCR is
associated with a decrease in liquidity volatility of 3.27% (5.37%) measured by LOGCVILLIQ
(LOGCVTURN) over the entire sample period in Model 6 (Model 8). The results are also stronger
in the post-2000 sub-period. As presented in Panel B, a one standard deviation increase in STDCR
reduces liquidity volatility by an economically significant 6.18% (10.53%) measured by
LOGCVILLIQ (LOGCVTURN) in Model 6 (Model 8). The doubling of the economic magnitude
of the estimates in recent years suggests that the growing diversity of institutional investors has
10 The corresponding standard deviation that applies to STDCR, LOGILLIQ, 1/TURN, LOGCVILLIQ and LOGCVTURN in Panel
B of Table 3 are 0.491, 3.503, 12.543, 0.445 and 0.592, respectively.

16
also strengthened the cross-sectional relation between investor heterogeneity and the volatility of
liquidity.11
Our main measure of investor heterogeneity (STDCR) is defined as the dispersion of
investment horizons among the institutional investors (USTDCR) scaled by the average investment
horizon (CR). Panel C of Table 3 separately investigates these two components to shed more light
on the driving force of investor heterogeneity. Several findings are worth noting. First, the average
investment horizon (CR) is negatively related to illiquidity and volatility of liquidity. This is not
surprising as short-term institutions favor liquid stocks and stocks with less liquidity risk. Second,
the heterogeneity in investment horizons (USTDCR) remains significant after controlling for the
level of the investment horizon. Therefore, we confirm that investor heterogeneity is associated
with higher future stock liquidity and lower volatility of liquidity, and our measure of investor
heterogeneity (STDCR) reflects the dispersion of investment horizons and is not driven by a
denominator effect of average investment horizon of institutions.12
B. Identification Test Based on the 2003 Tax Cut
We next present results from an identification strategy using the passage of the U.S. Jobs
and Growth Tax Relief Reconciliation Act of 2003 (the “2003 Tax Cut”, for short) as an exogenous
shock to investor heterogeneity. Specifically, the 2003 Tax Cut reduced the top federal marginal
tax rate on qualified dividends from 38.6% to 15%, equalizing the tax rate on dividends and long-
term capital gains. The effect of the 2003 Tax Cut has been investigated in several studies. For
example, Chetty and Saez (2005) report that the huge increase in the number of firms that initiate
dividends immediately after the enactment of the law is not confounded by other factors that may
11 We have performed additional analysis which are not reported here, and find that the relationship between investor heterogeneity
and the volatility of liquidity is stronger in the sub-period with high institutional ownership, where high ownership is defined as
being above median ownership level over the entire sample period. 12 We also find that high STDCR is negatively related to stock return volatility, an important determinant of stock illiquidity. The
results are robust to controlling for illiquidity and other stock characteristics and are reported in Internet Appendix Table IA1.

17
influence the payout decision. The tax cut, which was effective from January 2003, presents a
natural experiment for our investigation of the effect of investor heterogeneity on stock liquidity.
Due to the large reduction in the dividend tax rate, the 2003 Tax Cut reduces the tax
disadvantage of dividends for the taxable investors. Sialm and Starks (2012) document that prior
to the 2003 Tax Cut, long-term mutual funds managing retirement accounts made significantly
higher dividend distributions than funds with taxable clienteles, while such difference attenuated
after the implementation of the 2003 Tax Cut. They show that mutual funds with taxable investors
are more likely to hold high dividend yield stocks after the 2003 tax reform. On the other hand,
they find that the effect of the tax reform on the behavior of long-term tax-qualified investors is
smaller as they are less sensitive to the changes in tax code. Therefore, for dividend-paying stocks,
the 2003 Tax Cut brought about a broadening of the investor clienteles, hence the increase in
investor heterogeneity.
We employ difference-in-differences approach to identify the influence of investor
heterogeneity. The treatment group consists of firms that consistently pay dividends in the three
years prior to the 2003 Tax Cut, i.e., from 2000 to 2002. Since the dividend-paying stocks could
be fundamentally different from those non-dividend-paying stocks, we select firms that initiate
dividends (dividend initiators) in the 2003 fiscal year as the control group. Following the results
of Sialm and Starks (2012), the effect of the tax cut on the investor heterogeneity of dividend
initiators is expected to be smaller as the incentive of long-term (tax qualified) funds to invest in
these stocks is not affected by the tax law change, while short-term (taxable investor) funds are
less likely to respond to dividend initiations as dividends are now taxed at a lower rate. To further
ensure that the firms in the control group are fundamentally similar, we match each firm in the
treatment group (dividend payers before 2003) with a control firm (dividend initiators) on several

18
key firm characteristics using the propensity-score-matching algorithm. Specifically, we compute
propensity scores based on a logistic regression using a list of firm characteristics including
Log(Size), Log(BM), RETQ1-4 (defined as the cumulative monthly stock returns over the past four
quarters), LOGILLIQ and STDCR. Additionally, we also control for characteristics related to the
firm’s ex-ante propensity to pay dividends in Fama and French (2001), Baker and Wurgler (2004),
and Hoberg and Prabhala (2009). The characteristics that determine the propensity to pay
dividends in these models are return on assets, leverage, and idiosyncratic volatility, in addition to
Log(Size) and Log(BM) (see also Hameed and Xie (2019)). Detailed definition of these variables
are provided in Appendix A. Unreported results confirm that the final set of stocks in the treatment
and control groups are comparable along these dimensions before the 2003 Tax Cut, justifying the
difference-in-differences research design.
We estimate the following difference-in-differences regression using data during the three
years before and after the 2003 Tax Cut:
(4) 𝑌𝑖,𝑞 = 𝛼0 + 𝛽1𝑇𝑟𝑒𝑎𝑡𝑖,𝑞 × 𝑃𝑜𝑠𝑡𝑖,𝑞 + 𝑐𝑀𝑖,𝑞−1 + 𝛼𝑖 + 𝛾𝑞 + 𝑒𝑖,𝑞
where the dependent variable 𝑌𝑖,𝑞 refers to investor heterogeneity in investment horizon (STDCR),
stock illiquidity (proxied by LOGILLIQ and 1/TURN), liquidity volatility (proxied by
LOGCVILLIQ and LOGCVTURN), or average monthly return of stock 𝑖 in quarter 𝑞, 𝑇𝑟𝑒𝑎𝑡𝑖,𝑞 is
a dummy variable that takes the value of one if stock 𝑖 consistently pays dividends in the three
years prior to the 2003 Tax Cut (treatment group) and zero for the control group, 𝑃𝑜𝑠𝑡𝑖,𝑞 is a
dummy variable that takes the value one after the tax cut (2004–2006) and zero otherwise. The
vector M stacks all other control variables, including the Log(Size), Log(BM), Log(RetVol),
RETQ1, RETQ2-4 and IO. 𝛼𝑖 is the stock dummy to absorb other time-invariant characteristics at
the stock level, and 𝛾𝑞 is the year-quarter dummy to absorb the aggregate market factors. Standard

19
errors clustered at both the stock and quarter level. The coefficient of interest is 𝛽1, which captures
the difference in the dependent variable between the treatment and control group induced by the
implementation of the tax cut.
The results are reported in Panel A of Table 4. Model 1 confirms that implementation of
the 2003 Tax Cut leads to higher investor heterogeneity among the dividend payers. Comparing
with the pre-treatment period and the control group (i.e., dividend initiators), the tax cut increases
the investor heterogeneity by 9.03% (scaled by the standard deviation of STDCR in the matched
sample) for the treated firms (i.e., dividend payers). Unreported results show that dividend payers
display higher churn rate after the tax reform, confirming that the higher investor heterogeneity
for treated firms is due to increased participation of short-term institutions. More importantly,
when investor heterogeneity increases due to the tax cut, there is a concurrent decline in stock
illiquidity and liquidity volatility in three out of four specifications. For instance, stock illiquidity
decreases by 2.81% and 21.73% when measured by LOGILLIQ and 1/TURN, respectively.
Similarly, the volatility of trading activity (measured by LOGCVTURN) decline by 10.47%.
However, we do not find evidence of change in the volatility of liquidity measured by
LOGCVILLIQ.
Using the specification in Equation (4), we also estimate the causal impact of STDCR on
stock returns. To the extent that higher investor heterogeneity increases stock liquidity, it is
possible that it also translates to lower stock returns. However, the estimates in Model 6 of Panel
A shows that there is no distinctive change in the difference of return between the treatment firms
and control firms, confirming that the identified changes in investor heterogeneity, stock illiquidity
and liquidity volatility are not mechanically related to other stock characteristics such as return.

20
To better establish the effect of investor heterogeneity on the decline in stock illiquidity
and liquidity volatility following the tax cut, we split the sample into two groups of firms. First,
we compute the change in average quarterly STDCR from three years before to three years after
the 2003 Tax Cut (denoted ∆STDCR), and partition the stocks into two subsamples based on
whether ∆STDCR is above or below the median breakpoint. If the effect of tax cut on stock
illiquidity and liquidity volatility is influenced by investor heterogeneity, we conjecture that the
effect should be more pronounced for the subsample with high ∆STDCR. We tabulate the results
for the subsamples of high and low ∆STDCR stocks in Panels B and C of Table 4, respectively.
Consistent with our expectations, we find that the decline in stock illiquidity and liquidity volatility
is concentrated among the stocks that experience a higher increase in investor heterogeneity (high
∆STDCR), and the results are highly significant in all specifications. For instance, stock illiquidity
decreases by 9.34% and 25.84% when measured by LOGILLIQ and 1/TURN, respectively.
Similarly, the volatility of stock liquidity and trading activity decline by 18.80% and 22.62%
measured by LOGCVILLIQ and LOGCVTURN, respectively. In addition, for dividend payers with
low ∆STDCR, the change in stock illiquidity and liquidity volatility is not significant for all
specifications except for one at the 10% level.13
Overall, our evidence reveals that an exogenous increase on investor heterogeneity (due to
the 2003 Tax Cut) leads to higher future stock liquidity and lower volatility of liquidity.
C. Does Investor Heterogeneity Affect Stock Liquidity Around Extreme Fund Flows?
To further establish the causal effect of investor heterogeneity on stock liquidity, this
section shows how the price pressure and subsequent return reversal arising from extreme
institutional capital flows would vary across stocks of different investor heterogeneity.
13 The results that include additional control variables are presented in Internet Appendix Table IA2.

21
Since open-end mutual funds usually do not maintain significant cash balances given the
equity benchmarks they track and rarely take short positions, when outside investors withdraw
their capital and mutual funds experience extreme outflows, mutual fund managers are forced to
sell some of the existing holdings quickly to cover redemptions. Coval and Stafford (2007)
document that when many funds are forced to sell the same security within a short period, the fire
sale stock will experience a significant drop in price over the selling period, followed by price
reversals which represent compensation to the liquidity providers. The opposite is true for flow-
induced purchases (i.e., fire purchases). Therefore, stocks experiencing fire sales are expected to
underperform in the immediate (i.e., formation) period due to price pressure, followed by
predictable price reversal in the subsequent (i.e., holding) period. Similarly, stocks are expected to
experience temporary price increases when experiencing heavy flow-induced purchases, followed
by correction of prices in the subsequent period. Hence, a simple liquidity supplying trading
strategy that goes long on stocks with extreme negative fund flows and goes short on stocks with
extreme positive flows is expected to generate negative returns in the formation period and positive
returns in the holding period. We hypothesize that if a heterogeneous investor base helps to
mitigate investor specific liquidity (or flow-induced) shocks, the contemporaneous price impact
and the subsequent reversal due to extreme fund flows should be weaker among firms with high
investor heterogeneity.
We investigate the impact of flow-induced mutual fund trading as follows. For each mutual
fund 𝑓, we compute the monthly fund flow as in Equation (1). To match with the quarterly holdings
data, we compute quarterly flow as the cumulative monthly flows over the quarter. Following
Coval and Stafford (2007), we construct two proxies for price pressure at the stock level. The first
proxy for price pressure in stock 𝑖 over quarter 𝑞, Pressure_1, is defined as:

22
(5)
𝑃𝑟𝑒𝑠𝑠𝑢𝑟𝑒_1𝑖,𝑞
=∑ (max(0, ∆𝐻𝑜𝑙𝑑𝑖𝑛𝑔𝑠𝑓,𝑖,𝑞) |𝑓𝑙𝑜𝑤𝑓,𝑞 > 𝑃𝐶𝑇90𝑞)𝑓 − ∑ (max(0, −∆𝐻𝑜𝑙𝑑𝑖𝑛𝑔𝑠𝑓,𝑖,𝑞) |𝑓𝑙𝑜𝑤𝑓,𝑞 < 𝑃𝐶𝑇10𝑞)𝑓
𝐴𝑣𝑔𝑉𝑜𝑙𝑢𝑚𝑒𝑖,𝑞−4:𝑞−2
where ∆𝐻𝑜𝑙𝑑𝑖𝑛𝑔𝑠𝑓,𝑖,𝑡 refers to the change in the number of shares of stock 𝑖 held by fund 𝑓 in
quarter 𝑞, 𝑓𝑙𝑜𝑤𝑓,𝑞 refers to the fund flow in the same quarter, 𝑃𝐶𝑇90𝑞 and 𝑃𝐶𝑇10𝑞 refer to the
90th and 10th percentile of capital flows across all funds in quarter 𝑞, 𝐴𝑣𝑔𝑉𝑜𝑙𝑢𝑚𝑒𝑖,𝑞−4:𝑞−2 refers
to the average trading volume of stock 𝑖 during quarters 𝑞 − 4 to 𝑞 − 2. Stocks with flows below
the PCT10 (above the PCT90) are considered to be stocks experiencing fire sales (fire purchases).
These stocks with extreme flows relative to their average trading volume are identified to be under
price pressure from flow-induced trading by mutual funds. As a robustness check, we consider a
second price pressure proxy, Pressure_2, is defined as:
(6)
𝑃𝑟𝑒𝑠𝑠𝑢𝑟𝑒_2𝑖,𝑞
=
∑ (max(0, 𝑓𝑙𝑜𝑤𝑓,𝑞)× max(0, ∆𝐻𝑜𝑙𝑑𝑖𝑛𝑔𝑠𝑓,𝑖,𝑞))𝑓 − ∑ (max(0, −𝑓𝑙𝑜𝑤𝑓,𝑞)× max(0, −∆𝐻𝑜𝑙𝑑𝑖𝑛𝑔𝑠𝑓,𝑖,𝑞))𝑓
𝐴𝑣𝑔𝑉𝑜𝑙𝑢𝑚𝑒𝑖,𝑞−4:𝑞−2
where all the variables are defined in the same way as in Pressure_1 above. As explained in Coval
and Stafford (2007), Pressure_2 takes into account both the gravity of the mutual fund flows as
well as the size of the transactions by the mutual funds (relative to the stock trading volume).
At the end of quarter 𝑞 , stocks are first sorted into deciles according to their lagged
quarterly price pressure during quarters 𝑞 − 4 to 𝑞 − 1. Stocks in the lowest price pressure decile
(Low_PP) experience the largest outflow-induced sales by mutual funds. On the other extreme,
stocks in the highest price pressure decile (High_PP) are those with the largest inflow-induced
purchases. Within each price pressure decile, stocks are further sorted into quintiles according to
the heterogeneity in investment horizon of its investors or STDCR, in quarter 𝑞. The quintile of
stocks with the lowest investor heterogeneity is labelled as Low_IH while the stocks in the highest

23
investor heterogeneity quintile are labelled as High_IH. The price impact of extreme fund flows
in quarters 𝑞 − 4 to 𝑞 − 1 and subsequent reversal of stock returns in quarters 𝑞 + 1 to 𝑞 + 4 are
captured by the following investment strategy. The strategy involves buying stocks experiencing
extreme fund outflow (Low_PP) and selling stocks experiencing the most severe fund inflow
(High_PP), and the returns on the reversal strategy are labelled as LMH_PP. To relate the return
reversals arising from flow-induced price pressure to investor heterogeneity, we implement the
reversal strategy within each investor heterogeneity (STDCR) sorted quintile.
Table 5 reports the value-weighted average monthly return on the LMH_PP portfolio
during the price pressure period (quarter 𝑞 − 4 to 𝑞 − 1), and the investment holding period
(quarter 𝑞 + 1 to 𝑞 + 4) for stocks that belong to each of the five investor heterogeneity (STDCR)
sorted quintiles over the entire sample period from 1982 to 2016. For the holding period returns,
we report the raw returns as well as the risk-adjusted returns computed using a five-factor model
that consists of the three Fama and French (1993) factors: the market factor (excess return on the
value-weighted CRSP market index over the one month T-bill rate, MKT), the size factor (small
minus big firm return premium, SMB), the book-to-market factor (high book-to-market minus low
book-to-market return premium, HML), the Carhart (1997) momentum factor (past winner minus
past loser return premium), as well as the Pástor and Stambaugh (2003) liquidity factor. As a
preview, the key result in Table 5 is that the payoff to the reversal strategy is significantly higher
for stocks with low investor heterogeneity, reinforcing our postulation that price pressure arising
from forced mutual fund trading increases when the investor base is homogeneous, and therefore
lowers stock liquidity and increases liquidity volatility.
Panel A of Table 5 presents the results when price pressure is measured by Pressure_1
defined earlier. As expected, when stocks are exposed to severe flow-motivated trading, the

24
difference in returns between fire sale and fire purchase portfolios (“LMH_PP”) during the period
of price pressure is most negative for firms with the lowest investor heterogeneity. In particular,
the fire sale stocks underperform the fire purchase stocks by 0.89% per month when the investor
heterogeneity is low (Low_IH), and this effect is both statistically significant and economically
sizable. On the other hand, the fire sale stocks underperform the fire purchase stocks by 0.23% per
month when the investor heterogeneity is high (High_IH). The net return difference during the
formation period between high and low investor heterogeneity stocks (HML_IH) is significant at
0.66% per month. This contemporaneous price pressure is followed by a strong return reversal in
the subsequent year for the Low_IH stocks. Specifically, for Low_IH stocks, the fire sale stocks
outperform the fire purchase stocks (depicted by LMH_PP) by a significant 0.58% per month in
raw return and 0.44% in five-factor alpha. On the other hand, for the group of stocks with High_IH,
we do not find significant predictable reversals during the holding period. The net difference in
reversal profits between High_IH and Low_IH stocks (HML_IH) is also statistically significant at
−0.51% per month in raw return and −0.39% in five-factor alpha.
We obtain similar results using the alternative price pressure measure, Pressure_2, as
shown in Panel B of Table 5. Stocks with low STDCR are exposed to significantly greater price
pressure associated with extreme mutual fund flows than stocks with high STDCR. The subsequent
stock return reversals are also higher for low STDCR stocks by 0.59% per month, adjusting for
factor exposures.
Hence, stocks with low investor heterogeneity experience greater price pressure emanating
from forced trading induced by severe mutual fund flows, followed by strong return reversals in
the subsequent period. On the other hand, stocks with a heterogeneous investor base display low
price pressure and muted return reversals, and hence, lower liquidity effects.

25
Since mutual fund investors chase past performance (e.g., Chevalier and Ellison (1997),
Sirri and Tufano (1998), Choi and Robertson (2020)), the stock performance in the underlying
portfolio could potentially drive the extreme fund flows and also directly affect the stock liquidity
and return reversals. As a robustness check, we consider a past performance-neutral trading
strategy. Specifically, at the end of quarter 𝑞, stocks are first sorted into 5 × 10 portfolios according
to their lagged return between quarter 𝑞 − 8 and 𝑞 − 5 (in quintiles) and price pressure between
quarter 𝑞 − 4 and 𝑞 − 1 (in deciles). Within each past return-price pressure group, stocks are
further sorted into quintiles according to their lagged investor heterogeneity in investment horizon
in quarter 𝑞. We focus on the same liquidity supplying trading strategy as described above. This
conditional sorting allows us to explicitly control for the past stock performance prior to the
extreme fund flows, thus the portfolios sorted by investor heterogeneity display similar past stock
performance, i.e., the portfolios are past performance-neutral.
The results are tabulated in Table 5, Panel C. For brevity, we present results where price
pressure is proxied by Pressure_1. We find consistent evidence across past performance-neutral
portfolios: stocks with low investor heterogeneity are exposed to more price pressure at the time
of extreme fund flows. For instance, the contemporaneous effect of fire sales and fire purchases is
a significant −0.86% for stocks with low investor heterogeneity (Low_IH), but the negative price
impact is considerably mitigated and becomes −0.22% for stocks with high investor heterogeneity
(High_IH). The net return difference in price pressure between high and low investor heterogeneity
stocks (HML_IH) is a large 0.64% per month. The subsequent monthly return reversal for stocks
with high investor heterogeneity is 0.55% lower in raw return and 0.42% lower in five-factor
alpha. 14 We also obtain similar results using an alternative past performance-neutral trading
14 In Internet Appendix Table IA3, we report the value-weighted average monthly portfolio return (LMH_PP) during the investment
holding period for stocks that belong to each of the five past stock performance sorted quintiles and five investor heterogeneity

26
strategy, where the lagged return and price pressure are measured during the same period between
quarter 𝑞 − 4 and 𝑞 − 1 (reported in Panel D of Table 5).
Overall, the empirical findings are in line with our conjecture that a heterogeneous investor
base helps absorb investor-specific liquidity shocks, therefore improves liquidity, reduces the
liquidity volatility, as well as minimizes the price pressure emanating from forced trading by open-
end mutual funds.
D. Robustness Tests
We provide two sets of robustness tests of the main results on the relation between investor
heterogeneity (STDCR) and liquidity (in terms of both level and volatility) in Table 3. First, we
show that our findings remain when we control for concentration in institutional ownership,
indicating that heterogeneous investment horizon is different from diffused ownership. Second,
our results are robust when investor heterogeneity is measured by differences in investment
horizon based on stock turnover, fund size or investment style.
1. Concentration of Ownership
Several studies show that the concentration of institutional ownership affects stock
liquidity. Heflin and Shaw (2000) and Gaspar and Massa (2007), for example, find that stocks with
greater concentration of ownership are less liquid as large owners may have better access to private
information, and consequently increase the information asymmetry. Brockman, Chung, and Yan
(2009) argue that block ownership reduces trading activity and hence lowers liquidity. We examine
if our measure of investor heterogeneity is subsumed by the effect of ownership concentration on
stock liquidity. We construct the concentration of institutional ownership of stock 𝑖 in quarter 𝑞
(STDCR) sorted quintiles. We find that the difference in return reversals between high and low investor heterogeneity stocks
(HML_IH) remains significantly negative in most past performance quintiles, implying that stocks with low investor heterogeneity
experience greater price pressure emanating from forced trading induced by severe mutual fund flows, followed by strong return
reversals in the subsequent period. Our findings remain robust to the alternative price pressure measure Pressure_2.

27
(𝐻𝐻𝐼𝑖,𝑞 ) as the Herfindahl index of all institutions owning the stock: 𝐻𝐻𝐼𝑖,𝑞 = ∑ (𝑆𝐻𝑅𝑖,𝑓,𝑞/𝑓
∑ 𝑆𝐻𝑅𝑖,𝑓,𝑞𝑓 )2, where 𝑆𝐻𝑅𝑖,𝑓,𝑞 refers to the number of shares of stock 𝑖 held by fund 𝑓 in quarter
𝑞. We add to the analyses in Table 3 by including HHI as an additional control variable as well as
including the interaction of STDCR and HHI in Equation (3). As reported in the Internet Appendix
Table IA4, a higher concentration of institutional ownership significantly increases the stock’s
illiquidity and volatility of liquidity but does not alter our main findings on the effects of investor
heterogeneity, STDCR.
2. Alternative Measures of Investor Heterogeneity
Next, we consider three alternative definitions of investor heterogeneity. First, the churn
rate measure that we construct to measure the investment horizon of institutions is affected by the
stock price changes. We therefore construct a turnover measure for the institutions that is free of
stock price fluctuation. Specifically, we first compute the fund-stock-level turnover for stock 𝑖
held by fund 𝑓 in a given quarter 𝑞 as follows: 𝑇�̃�𝑖,𝑓,𝑞 = |𝑁𝑖,𝑓,𝑞 − 𝑁𝑖,𝑓,𝑞−1|/𝑆𝐻𝑅𝑂𝑈𝑇𝑖,𝑞, where
𝑁𝑖,𝑓,𝑞 refer to the number of shares of stock 𝑖 held by fund 𝑓 in quarter 𝑞, and 𝑆𝐻𝑅𝑂𝑈𝑇𝑖,𝑞 refers
to the number of shares outstanding of stock 𝑖 in quarter 𝑞. Next, the turnover of fund 𝑓 in a given
quarter 𝑞 is computed as follows: 𝑇𝑂𝑓,𝑞 = ∑ 𝑇�̃�𝑓,𝑞−𝑟+14𝑟=1 /4 , where 𝑇�̃�𝑓,𝑞 is the investment
value-weighted average of the fund-stock-level turnover (𝑇�̃�𝑖,𝑓,𝑞) across all stocks held by fund 𝑓
in quarter 𝑞.15 Finally, the heterogeneity in the investment horizon of stock 𝑖 in a given quarter 𝑞
is computed as follows: 𝑆𝑇𝐷𝑇𝑂𝑖,𝑞 =𝑈𝑆𝑇𝐷𝑇𝑂𝑖,𝑞
𝑇𝑂𝑖,𝑞, where 𝑈𝑆𝑇𝐷𝑇𝑂𝑖,𝑞 refers to the standard deviation
of the turnover of all funds that hold stock 𝑖 in quarter 𝑞, 𝑇𝑂𝑖,𝑞 refers to the average turnover of all
funds that hold stock 𝑖 at the same time.
15 We compute the average turnover over the past four quarters to be consistent with our main measure of CR and STDCR. In Panel
B of Internet Appendix Table IA5, we report results using turnover from past quarter or two quarters and obtain similar findings.

28
Second, institutional investors may also vary in their investment strategies or clientele
along dimensions other than the investment horizon. For example, funds are frequently stratified
into groups based on their investment style (such as growth, value and momentum funds) or fund
size (large and small funds may have different strategies or clientele). To the extent that funds with
a similar investment style (or size) are likely to trade in tandem in search of stocks with high
expected returns, it is natural to consider fund size and style as alternative measures of investor
heterogeneity. Consequently, we consider two other proxies of investor heterogeneity in a stock
based on the dispersion in its institutional owners’ fund size and fund style. One proxy is STDTNA,
defined as the standard deviation of the TNA of all mutual funds that hold the stock, scaled by the
average TNA across these funds. Another proxy is STDSTYTNA, defined as the standard deviation
of the TNA by fund styles of all mutual funds that hold the stock, scaled by the average TNA
across fund styles. The styles of the mutual funds are defined according to Lipper objectives from
the CRSP mutual fund database. Both measures capture the dispersion in investor types based on
cross-sectional dispersion in fund size and fund style. Given the wide differences in investment
strategies related to fund size and style, these funds are likely to have similar trading needs within
the group but differ in demand for liquidity across groups. For instance, large funds trade their
portfolios less often than small funds (e.g., Busse, Chordia, Jiang, and Tang (2019)).
As shown in Table 6, estimates of Equation (3) using alternative measures of investor
heterogeneity show a similar statistical and economic impact as STDCR in Table 3: a higher
investor heterogeneity significantly decreases stock illiquidity and liquidity volatility. For
instance, one standard deviation increase in STDTO (STDTNA, STDSTYTNA) translates to 0.31%
(3.05%, 1.01%) lower illiquidity (LOGILLIQ) and 1.58% (7.47%, 2.14%) lower inverse of trading
activity (1/TURN). Similarly, when STDTO (STDTNA, STDSTYTNA) is increased by one standard

29
deviation, the volatility of liquidity (LOGCVILLIQ) decreases by 1.48% (14.24%, 4.02%) and the
volatility of trading activity (LOGCVTURN) decreases by 3.04% (16.79%, 5.62%).
Overall, we document the compelling evidence that an increase in the heterogeneity of a
stock’s investor base reduces the stock’s illiquidity and volatility of liquidity.
IV. Investor Heterogeneity and Illiquidity Premium
The above results deliver a message that a heterogeneous investor base improves the stock
liquidity and reduces the liquidity volatility. This finding is particularly stronger in the post-2000
period when the U.S. stock market experienced both higher liquidity and more diverse investor
participation. We move on to investigate the link between investor heterogeneity and the price of
illiquidity. The seminal paper by Amihud and Mendelson (1986) shows that differences in liquidity
have important price implications and investors demand a premium for holding illiquid assets.
Empirical evidence further confirms that stock illiquidity as a characteristic is positively priced in
the U.S. and around the world (e.g., Amihud (2002), Amihud, Hameed, Kang, and Zhang (2015)).
Ben-Rephael, Kadan, and Wohl (2015) argue that the liquidity premium in the U.S. market has
declined drastically over time. For example, they show that the average liquidity premium based
on the Amihud illiquidity measure was significant in the pre-2000 period and has become
insignificant in the post-2000 period. Our objective here is to investigate if liquidity premium
depends on the heterogeneity in the investor base. Specifically, we examine if investors in stocks
with lower investor heterogeneity require a higher premium for stock illiquidity. Our conjecture is
that the level of stock illiquidity is a bigger concern among stocks with homogeneous investors,
and the stock price is more likely to reflect a premium for illiquidity given their exposure to
liquidity shocks arising from similar trading needs of its investor base.
A. Analysis based on Portfolio Returns

30
We start by performing a portfolio-based analysis. At the end of quarter 𝑞, stocks are
sorted into quintiles according to their Amihud illiquidity (LOGILLIQ) and the level of investor
heterogeneity in investment horizon (STDCR) in quarter 𝑞 into quintiles. This process of
independently sorting stocks based on LOGILLIQ and STDCR in quarter 𝑞 generates 25 (i.e., 5 ×
5) portfolios. We then compute the monthly future returns (i.e., in quarter 𝑞 + 1) on a portfolio
that is long the high illiquidity stocks (i.e., buy High_ILLIQ quintile) and short the low illiquidity
stocks (i.e., sell Low_ILLIQ quintile) within each of the five STDCR sorted stock quintiles. The
return on the High_ILLIQ minus Low_ILLIQ or Illiquid-minus-Liquid (IML) portfolio represents
the premium for illiquidity within each STDCR ranked group. We also compute the IML portfolio
return across all stocks in the sample to gauge the average liquidity premium. In addition to the
raw portfolio returns, we report alphas from a five-factor model that consists of the three Fama
and French (1993) factors, the Carhart (1997) momentum factor, and the Pástor and Stambaugh
(2003) liquidity factor. The standard errors in all the estimations are corrected for autocorrelation
using the Newey and West (1987) method.
In Panel A1 of Table 7, the average (equal-weighted) illiquidity premium (IML) across all
stocks (column labelled “All”) is insignificant in raw return. However, the five-factor risk-adjusted
alpha on the IML portfolio becomes significantly positive at 0.28% per month (or 3.30% per
annum). Interestingly, the illiquidity return premium is much stronger among stocks with low
investor heterogeneity (Low_IH). For instance, illiquid stocks outperform liquid stocks by 0.66%
per month in raw return, and the magnitude increases to 1.03% per month (12.32% per annum) in
five-factor alpha if the stock’s institutional investors have similar investment horizon. On the other
extreme, stocks in the High_IH quintile display a small, insignificant IML alpha of 0.18% per
month. Hence, the premium for illiquidity emerges to be the highest among stocks with low
31
investor heterogeneity and the difference in illiquidity premium between low and high investor
heterogeneity groups is economically large.
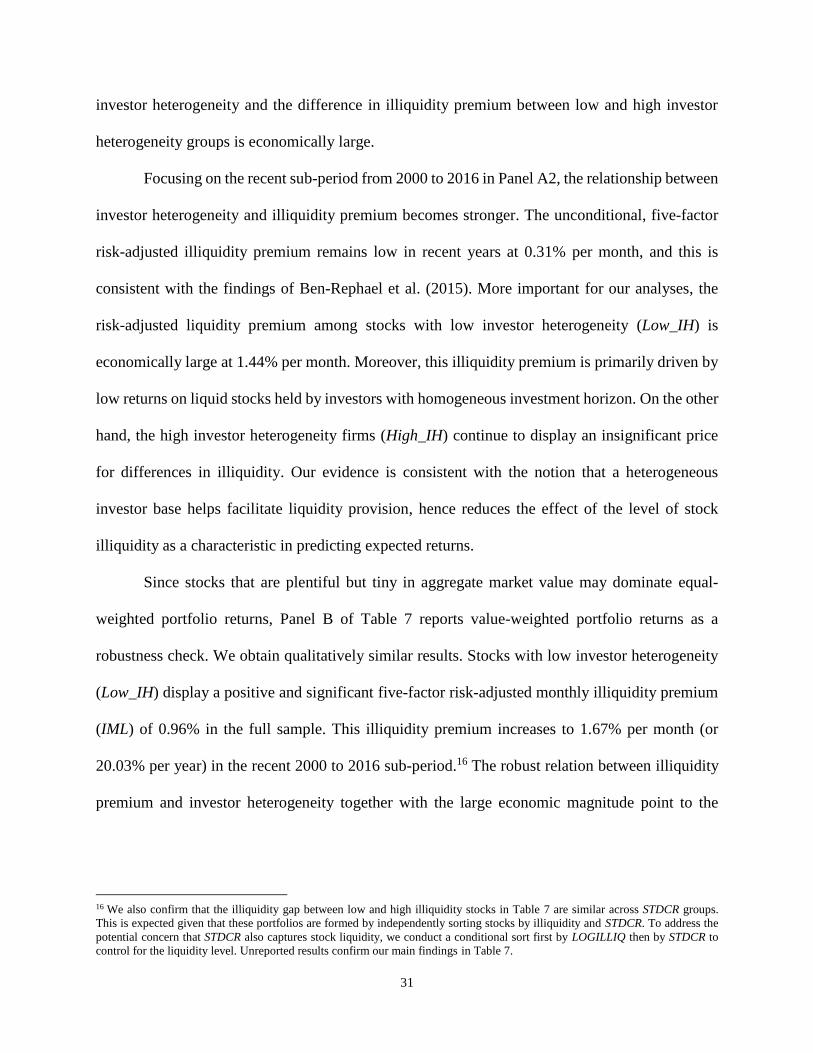
Focusing on the recent sub-period from 2000 to 2016 in Panel A2, the relationship between
investor heterogeneity and illiquidity premium becomes stronger. The unconditional, five-factor
risk-adjusted illiquidity premium remains low in recent years at 0.31% per month, and this is
consistent with the findings of Ben-Rephael et al. (2015). More important for our analyses, the
risk-adjusted liquidity premium among stocks with low investor heterogeneity (Low_IH) is
economically large at 1.44% per month. Moreover, this illiquidity premium is primarily driven by
low returns on liquid stocks held by investors with homogeneous investment horizon. On the other
hand, the high investor heterogeneity firms (High_IH) continue to display an insignificant price
for differences in illiquidity. Our evidence is consistent with the notion that a heterogeneous
investor base helps facilitate liquidity provision, hence reduces the effect of the level of stock
illiquidity as a characteristic in predicting expected returns.
Since stocks that are plentiful but tiny in aggregate market value may dominate equal-
weighted portfolio returns, Panel B of Table 7 reports value-weighted portfolio returns as a
robustness check. We obtain qualitatively similar results. Stocks with low investor heterogeneity
(Low_IH) display a positive and significant five-factor risk-adjusted monthly illiquidity premium
(IML) of 0.96% in the full sample. This illiquidity premium increases to 1.67% per month (or
20.03% per year) in the recent 2000 to 2016 sub-period.16 The robust relation between illiquidity
premium and investor heterogeneity together with the large economic magnitude point to the
16 We also confirm that the illiquidity gap between low and high illiquidity stocks in Table 7 are similar across STDCR groups.
This is expected given that these portfolios are formed by independently sorting stocks by illiquidity and STDCR. To address the
potential concern that STDCR also captures stock liquidity, we conduct a conditional sort first by LOGILLIQ then by STDCR to
control for the liquidity level. Unreported results confirm our main findings in Table 7.

32
important role played by the diversity of shareholders’ investment horizon and trading needs on
the price of illiquidity.
Next, we examine if the cross-sectional relation between illiquidity premium and investor
heterogeneity is affected by cross-firm variation in liquidity volatility. At the end of quarter 𝑞,
stocks are independently sorted into quintiles according to their Amihud illiquidity (LOGILLIQ),
liquidity volatility (LOGCVILLIQ) and investor heterogeneity in investment horizon (STDCR) in
that quarter. This generates a total of 125 (i.e., 5 × 5 × 5) portfolios sorted by LOGILLIQ,
LOGCVILLIQ, and STDCR. Using the average monthly returns on these 125 portfolios in quarter
𝑞 + 1, we compute the illiquidity premium (i.e., high LOGILLIQ minus low LOGILLIQ quintiles,
labelled IML) for stocks in the intersection of low/high quintiles based on LOGCVILLIQ and
STDCR characteristics.
Panel A of Table 8 shows that despite the variations in liquidity volatility, stocks with low
investor heterogeneity (Low_IH) consistently display significant equal-weighted monthly five-
factor-adjusted illiquidity premium of above 1%. The corresponding monthly five-factor-adjusted
illiquidity premium is not significantly different from zero for stocks with high investor
heterogeneity (High_IH), independent of the level of liquidity volatility. We obtain similar
findings in Panel B of Table 8 when stock returns are value-weighted. For instance, the monthly,
value-weighted five-factor-adjusted illiquidity premium is also economically large at 1.30%
(1.10%) for Low_IH stocks with low (high) liquidity volatility. This suggests a smaller role for
liquidity volatility in the pricing of the level of stock illiquidity. Overall, our findings consistently
point to the effect of the diversity of the investor base on stock illiquidity and its pricing. The level
of stock illiquidity is primarily priced among stocks with homogeneous investors, given their
exposure to liquidity shocks arising from similar trading needs of the investor base.

33
B. Fama-MacBeth Regressions
As a robustness check of the portfolio results, we explicitly control for other firm
characteristics and estimate the following multivariate specification:
(7)
𝑃𝑒𝑟𝑓𝑖,𝑞 = 𝛼0 + 𝛽1𝐷𝑢𝑚𝑚𝑦(𝑆𝑇𝐷𝐶𝑅)𝑖,𝑞−1 + 𝛽2𝐷𝑢𝑚𝑚𝑦(𝑆𝑇𝐷𝐶𝑅)𝑖,𝑞−1 × 𝐼𝐿𝐿𝐼𝑄𝑖,𝑞−1
+ 𝛽3𝐼𝐿𝐿𝐼𝑄𝑖,𝑞−1 + 𝑐𝑀𝑖,𝑞−1 + 𝑒𝑖,𝑞
where 𝑃𝑒𝑟𝑓𝑖,𝑞 refers to the average monthly return of stock 𝑖 in quarter 𝑞, 𝐷𝑢𝑚𝑚𝑦(𝑆𝑇𝐷𝐶𝑅)𝑖,𝑞−1
refers to two dummy variables for stock 𝑖 in quarter 𝑞 − 1: 𝐿𝑜𝑤_𝑆𝑇𝐷𝐶𝑅𝑖,𝑞−1 (takes a value of one
if the 𝑆𝑇𝐷𝐶𝑅𝑖,𝑞−1 is in the bottom quintile and zero otherwise), 𝐻𝑖𝑔ℎ_𝑆𝑇𝐷𝐶𝑅𝑖,𝑞−1 (takes a value
of one if the 𝑆𝑇𝐷𝐶𝑅𝑖,𝑞−1 is in the top quintile and zero otherwise), and 𝑆𝑇𝐷𝐶𝑅𝑖,𝑞−1 refers to the
investor heterogeneity in the investment horizon. 𝐼𝐿𝐿𝐼𝑄𝑖,𝑞−1 refers to the stock Amihud illiquidity
(LOGILLIQ). The vector M stacks all other control variables, including the LOGCVILLIQ,
Log(Size), Log(BM), Log(RetVol), RETQ1, RETQ2-4 and IO.
We consider regressions based on raw stock returns as well as stock returns adjusted for
the exposure to size, book-to-market and momentum (past one year return) characteristics per the
DGTW model of Daniel, Grinblatt, Titman, and Wermers (1997).17 The results are reported in
Internet Appendix Table IA6. Our main finding holds across different specifications: illiquid
stocks earn higher expected returns particularly when the investor base is not diversified, and is
robust to controlling for various stock characteristics that explain the cross-section of stock returns.
In particular, the interaction term Low STDCR × LOGILLIQ is positively associated with stock
returns in the subsequent quarter. In contrast, the interaction term High STDCR × LOGILLIQ does
17 In estimating the regression model, we skip one month between quarter 𝑞 and 𝑞 − 1, i.e., for STDCR measured at the end of
March, we compute average monthly stock return from May to July. Our findings remain the same if we do not skip one month.

34
not predict stock returns. Hence, stock illiquidity premium is concentrated in stocks with low
investor heterogeneity.
To summarize, we find that stocks held by institutional investors with similar investment
horizon are associated with higher illiquidity, higher liquidity volatility, and greater exposure to
liquidity shocks arising from extreme fund flows. We also document that the premium for
illiquidity is concentrated in stocks with homogeneous investor base. The overall findings suggest
that the heterogeneity of the stock’s investor base plays a critical role in affecting stock liquidity
(both level and volatility) and the pricing of stock illiquidity.
V. Conclusion
Institutional investors represent an increasing fraction of equity ownership over the last
few decades, and this has been accompanied by a dramatic increase in share turnover. Additionally,
there has been a sharp growth in the diversity of institutional investors and investment strategies.
For example, while a lot of institutional investors are of short-term investment horizon, many
others tend to be long-horizon investors. Our paper represents the first study to examine how the
composition of short-term and long-term institutions will affect the liquidity and liquidity
volatility.
We start with the result that fund flows to institutional investors are highly correlated with
flows to other funds that share similar investment horizon, and have low comovement with flows
to funds that have different horizons. This implies that stocks held by homogenous investors tend
to face highly correlated order flows and a more heterogeneous investor base facilitates the
accommodation of investor-specific flow or liquidity shocks. Consistent with this conjecture, the
heterogeneity of investment horizon among investors holding a stock is negatively related to stock
illiquidity. We find that investor heterogeneity (proxied by the standard deviation of the portfolio

35
churn rate across institutional investors holding a stock) is negatively related to the stock illiquidity
and volatility of liquidity, whereby the illiquidity measures are constructed based on the price
impact measure of Amihud (2002) and the trading activity measure based on the inverse of stock
turnover. This relationship is especially strong in the recent post-2000 period with growing
participation and diversity of institutional investors and investment strategies.
We report confirmatory evidence using two settings that help identify the effect of investor
heterogeneity on liquidity. First, we use the 2003 dividend tax cut as an exogenous shock to
examine the impact of investor heterogeneity on liquidity. We find that stocks that have been
paying dividends prior to 2003 register an increase in investor heterogeneity and consequently,
experience an improvement in stock liquidity. Second, we find that stocks with less heterogeneous
investors suffer bigger price pressure associated with fire sales by mutual funds. We find that a
heterogeneous investor base improves liquidity and reduces the volatility of liquidity by absorbing
liquidity shocks emanating from some investor types. Additionally, we find that the illiquidity
premium is concentrated among stocks with low investor heterogeneity.
With institutional investors representing a growing fraction of equity ownership and an
even larger proportion of trading activities, it is important to understand their influences on
financial markets. We show that a balanced composition of short-term and long-term institutions,
reflecting a higher degree of investor heterogeneity, will help reduce stock illiquidity and liquidity
volatility. Therefore, it is desirable for companies to attract a variety of institutions to hold the
shares, which helps to improve stock liquidity and reduce the cost of equity capital.

36
References
Amihud, Y. “Illiquidity and Stock Returns: Cross-Section and Time-Series Effects.” Journal of
Financial Markets, 5 (2002), 31–56.
Amihud, Y.; A. Hameed; W. Kang; and H. Zhang. “The Illiquidity Premium: International
Evidence.” Journal of Financial Economics, 117 (2015), 350–368.
Amihud, Y., and H. Mendelson. “Asset Pricing and the Bid-Ask Spread.” Journal of Financial
Economics, 17 (1986), 223–249.
Baker, M., and J. Wurgler. “A Catering Theory of Dividends.” Journal of Finance, 59 (2004),
1125–1165.
Ben-Raphael, A.; O. Kadan; and A. Wohl. “The Diminishing Liquidity Premium.” Journal of
Financial and Quantitative Analysis, 50 (2015), 197–229.
Bennett, J. A.; R. W. Sias; and L. T. Starks. “Greener Pastures and the Impact of Dynamic
Institutional Preferences.” Review of Financial Studies, 16 (2003), 1203−1238.
Bernardo, A. E., and I. Welch. “Liquidity and Financial Market Runs.” Quarterly Journal of
Economics, 119 (2004), 135–158.
Blume, M. E., and D. B. Keim. “The Changing Nature of Institutional Stock Investing.” Critical
Finance Review, 6 (2017), 1−41.
Brockman, P.; D. Y. Chung; and X. Yan. “Block Ownership, Trading Activity, and Market
Liquidity.” Journal of Financial and Quantitative Analysis, 44 (2009), 1403–1426.
Busse, J. A.; T. Chordia; L. Jiang; and Y. Tang. “Transaction Costs, Portfolio Characteristics, and
Mutual Fund Performance.” Forthcoming in Management Science (2019).
Carhart, M. M. “On Persistence in Mutual Fund Performance.” Journal of Finance, 52 (1997), 57–
82.
Cella, C.; A. Ellul; and M. Giannetti. “Investors’ Horizons and the Amplification of Market
Shocks.” Review of Financial Studies, 26 (2013), 1607–1648.
Chen, J.; H. Hong; and J. C. Stein. “Breadth of Ownership and Stock Returns.” Journal of
Financial Economics, 66 (2002), 171–205.
Cheng, S.; A. Hameed; A. Subrahmanyam; and S. Titman. “Short-Term Reversals: The Effects of
Past Returns and Institutional Exits.” Journal of Financial and Quantitative Analysis, 52
(2017), 143–173.

37
Chetty, R., and E. Saez. “Dividend Taxes and Corporate Behavior: Evidence from the 2003
Dividend Tax Cut.” Quarterly Journal of Economics, 120 (2005), 791–833.
Chevalier, J., and G. Ellison. “Risk Taking by Mutual Funds as a Response to Incentives.” Journal
of Political Economy, 105 (1997), 1167−1200.
Choi, J. J., and A. Z. Robertson. “What Matters to Individual Investors? Evidence from the Horse’s
Mouth.” Journal of Finance, 75 (2020), 1965−2020.
Chordia, T.; R. Roll; and A. Subrahmanyam. “Recent Trends in Trading Activity and Market
Quality.” Journal of Financial Economics, 101 (2011), 243–263.
Chordia T.; A. Subrahmanyam; and V. R. Anshuman. “Trading Activity and Expected Stock
Returns.” Journal of Financial Economics, 59 (2001), 3−32.
Chordia, T.; A. Subrahmanyam; and Q. Tong. “Have Capital Market Anomalies Attenuated in the
Recent Era of High Liquidity and Trading Activity?” Journal of Accounting and Economics,
58 (2014), 51–58.
Coval, J., and E. Stafford. “Asset Fire Sales (and Purchases) in Equity Markets.” Journal of
Financial Economics, 86 (2007), 479–512.
Cremers, M., and A. Pareek. “Short-Term Trading and Stock Return Anomalies: Momentum,
Reversal, and Share Issuance.” Review of Finance, 19 (2015), 1649–1701.
Cremers, M., and A. Pareek. “Patient Capital Outperformance: The Investment Skill of High
Active Share Managers Who Trade Infrequently.” Journal of Financial Economics, 122 (2016),
288–306.
Da, Z.; P. Gao; and R. Jagannathan. “Impatient Trading, Liquidity Provision, and Stock Selection
by Mutual Funds.” Review of Financial Studies, 24 (2011), 675–720.
Daniel, K.; M. Grinblatt; S. Titman; and R. Wermers. “Measuring Mutual Fund Performance with
Characteristic-based Benchmarks.” Journal of Finance, 52 (1997), 1035–1058.
Diamond, D. W., and R. E. Verrecchia. “Constraints on Short-Selling and Asset Price Adjustment
to Private Information.” Journal of Financial Economics, 18 (1987), 277–311.
Diether, K. B.; K.-H. Lee; and I. M. Werner. “Short-Sale Strategies and Return Predictability.”
Review of Financial Studies, 22 (2009), 575–607.
Falkenstein, E. G. “Preferences for Stock Characteristics as Revealed by Mutual Fund Portfolio
Holdings.” Journal of Finance, 51 (1996), 111–135.

38
Fama, E. F., and K. R. French. “Common Risk Factors in the Returns on Stocks and Bonds.”
Journal of Financial Economics, 33 (1993), 3–56.
Fama, E. F., and K. R. French. “Disappearing Dividends: Changing Firm Characteristics or Lower
Propensity to Pay?” Journal of Financial Economics, 60 (2001), 3–43.
Fama, E. F., and J. MacBeth. “Risk, Return, and Equilibrium: Empirical Tests.” Journal of
Political Economy, 71 (1973), 607–636.
Gao, X., and J. Ritter. “The Marketing of Seasoned Equity Offerings.” Journal of Financial
Economics, 97 (2010), 33–52.
Gaspar, J.-M., and M. Massa. “Local Ownership as Private Information: Evidence on the
Monitoring-Liquidity Trade-Off.” Journal of Financial Economics, 83 (2007), 751–792.
Gaspar, J.-M.; M. Massa; and P. Matos. “Shareholder Investment Horizons and the Market for
Corporate Control.” Journal of Financial Economics, 76 (2005), 135−165.
Goyenko, R. Y.; C. W. Holden; and C. A. Trzcinka. “Do Liquidity Measures Measure Liquidity?”
Journal of Financial Economics, 92 (2009), 153−181.
Greenwald, B. C. N.; J. Kahn; P. D. Sonkin; and M. van Biema. “Value Investing: From Graham
to Buffett and Beyond.” New York: Wiley Publishing (2001).
Hameed, A., and J. Xie. “Preference for Dividends and Return Comovement.” Journal of
Financial Economics, 132 (2019), 103–125.
Heflin, F., and K. W. Shaw. “Blockholder Ownership and Market Liquidity.” Journal of Financial
and Quantitative Analysis, 35 (2000), 621–633.
Hoberg, G., and N. R. Prabhala. “Disappearing Dividends, Catering, and Risk.” Review of
Financial Studies, 22 (2009), 79–116.
Morris, S., and H. S. Shin. “Liquidity Black Holes.” Review of Finance, 8 (2004), 1–18.
Nagel, S. “Short Sales, Institutional Investors and the Cross-Section of Stock Returns.” Journal of
Financial Economics, 78 (2005), 277–309.
Newey, W. K., and K. D. West. “A Simple Positive-Definite Heteroskedasticity and
Autocorrelation Consistent Covariance Matrix.” Econometrica, 55 (1987), 703–708.
Pástor, L., and R. Stambaugh. “Liquidity Risk and Expected Stock Returns.” Journal of Political
Economy, 113 (2003), 642–685.

39
Prado, M. P.; P. A. C. Saffi; and J. Sturgess. “Ownership Structure, Limits to Arbitrage, and Stock
Returns: Evidence from Equity Lending Markets.” Review of Financial Studies, 29 (2016),
3211–3244.
Sialm, C., and L. Starks. “Mutual Fund Tax Clienteles.” Journal of Finance, 67 (2012), 1397–
1422.
Sialm, C.; L. T. Starks; and H. Zhang. “Defined Contribution Pension Plans: Sticky or Discerning
Money?” Journal of Finance, 70 (2015), 805–838.
Sirri, E. R., and P. Tufano. “Costly Search and Mutual Fund Flows.” Journal of Finance, 53 (1998),
1589–1622.
Yan, X., and Z. Zhang. “Institutional Investors and Equity Returns: Are Short-Term Institutions
Better Informed?” Review of Financial Studies, 22 (2009), 893–924.

40
Appendix A: Variable Definitions
Variables Definitions
A. Investor Heterogeneity Measures
STDCR The heterogeneity in investment horizon of stock 𝑖 in a given quarter 𝑞 is computed as follows: 𝑆𝑇𝐷𝐶𝑅𝑖,𝑞 =𝑈𝑆𝑇𝐷𝐶𝑅𝑖,𝑞
𝐶𝑅𝑖,𝑞, where 𝑈𝑆𝑇𝐷𝐶𝑅𝑖,𝑞 refers to the standard deviation of the churn rate of all funds that hold stock 𝑖 in
quarter 𝑞, 𝐶𝑅𝑖,𝑞 refers to the average churn rate of all funds that hold stock 𝑖 at the same time. The churn rate
of fund 𝑓 in a given quarter 𝑞 is computed as follows: 𝐶𝑅𝑓,𝑞 = ∑ 𝐶�̃�𝑓,𝑞−𝑟+14𝑟=1 /4 , and 𝐶�̃�𝑓,𝑞 =
∑ |𝑁𝑖,𝑓,𝑞𝑃𝑖,𝑞 − 𝑁𝑖,𝑓,𝑞−1𝑃𝑖,𝑞−1 − 𝑁𝑖,𝑓,𝑞−1∆𝑃𝑖,𝑞|𝑖∈𝑆 / ∑ [(𝑁𝑖,𝑓,𝑞𝑃𝑖,𝑞 + 𝑁𝑖,𝑓,𝑞−1𝑃𝑖,𝑞−1)/2]𝑖∈𝑆 , where 𝑆 refers to the
set of companies held by fund 𝑓, 𝑃𝑖,𝑞 and 𝑁𝑖,𝑓,𝑞 refer to the price and the number of shares of stock 𝑖 held by
fund 𝑓 in quarter 𝑞, respectively, following Gaspar et al. (2005).
USTDCR The standard deviation of the churn rate of all funds that hold stock 𝑖 in quarter 𝑞 (𝑈𝑆𝑇𝐷𝐶𝑅𝑖,𝑞), defined the
same as in STDCR above.
CR The average churn rate of all funds that hold stock 𝑖 in quarter 𝑞 (𝐶𝑅𝑖,𝑞), defined the same as in STDCR above.
STDTO The heterogeneity in investment horizon of stock 𝑖 in a given quarter 𝑞 is computed as follows: 𝑆𝑇𝐷𝑇𝑂𝑖,𝑞 =𝑈𝑆𝑇𝐷𝑇𝑂𝑖,𝑞
𝑇𝑂𝑖,𝑞, where 𝑈𝑆𝑇𝐷𝑇𝑂𝑖,𝑞 refers to the standard deviation of the turnover of all funds that hold stock 𝑖 in
quarter 𝑞, 𝑇𝑂𝑖,𝑞 refers to the average turnover of all funds that hold stock 𝑖 at the same time. The turnover of
fund 𝑓 in a given quarter 𝑞 is computed as follows: 𝑇𝑂𝑓,𝑞 = ∑ 𝑇�̃�𝑓,𝑞−𝑟+14𝑟=1 /4 , and 𝑇�̃�𝑓,𝑞 refers to the
investment value-weighted average of the fund-stock-level turnover (𝑇�̃�𝑖,𝑓,𝑞) across all stocks held by the fund.
𝑇�̃�𝑖,𝑓,𝑞 = |𝑁𝑖,𝑓,𝑞 − 𝑁𝑖,𝑓,𝑞−1|/𝑆𝐻𝑅𝑂𝑈𝑇𝑖,𝑞, where 𝑁𝑖,𝑓,𝑞 refer to the number of shares of stock 𝑖 held by fund 𝑓
in quarter 𝑞, and 𝑆𝐻𝑅𝑂𝑈𝑇𝑖,𝑞 refers to the number of shares outstanding of stock 𝑖 in quarter 𝑞.
STDTNA The heterogeneity in fund size of stock 𝑖 in a given quarter 𝑞 is computed as follows: 𝑆𝑇𝐷𝑇𝑁𝐴𝑖,𝑞 =𝑆𝑡𝑑𝑒𝑣(𝑇𝑁𝐴𝑖,𝑞)
𝑇𝑁𝐴𝑖,𝑞, where 𝑆𝑡𝑑𝑒𝑣(𝑇𝑁𝐴𝑖,𝑞) refers to the standard deviation of the total net assets (TNA) of all funds
that hold stock 𝑖 in quarter 𝑞, 𝑇𝑁𝐴𝑖,𝑞 refers to the average TNA of all funds that hold stock 𝑖 at the same time.
STDSTYTNA The heterogeneity in style size of stock 𝑖 in a given quarter 𝑞 is computed as follows: 𝑆𝑇𝐷𝑆𝑇𝑌𝑇𝑁𝐴𝑖,𝑞 =𝑆𝑡𝑑𝑒𝑣(𝑆𝑇𝑌𝑇𝑁𝐴𝑖,𝑞)
𝑆𝑇𝑌𝑇𝑁𝐴𝑖,𝑞, where 𝑆𝑡𝑑𝑒𝑣(𝑆𝑇𝑌𝑇𝑁𝐴𝑖,𝑞) refers to the standard deviation of the TNA of all fund styles that
hold stock 𝑖 in quarter 𝑞, 𝑆𝑇𝑌𝑇𝑁𝐴𝑖,𝑞 refers to the average TNA of all fund styles that hold stock 𝑖 at the same
time.
B. Liquidity and Liquidity Volatility Measures
LOGILLIQ The logarithm of the stock illiquidity and the stock illiquidity measure in a given quarter 𝑞 is computed as
follows: 𝐼𝐿𝐿𝐼𝑄𝑖,𝑞 = (∑ |𝑅𝑖,𝑞,𝑑|/𝑉𝑂𝐿𝐷𝑖,𝑞,𝑑𝑑∈𝑞 )/𝐷𝑖,𝑞 × 106, where 𝑅𝑖,𝑞,𝑑 refers to the return of stock 𝑖 in day 𝑑
of quarter 𝑞, 𝑉𝑂𝐿𝐷𝑖,𝑞,𝑑 refers to the dollar trading volume at the same time, and 𝐷𝑖,𝑞 is the number of trading
days for stock 𝑖 in quarter 𝑞, following Amihud (2002). In addition, NASDAQ trading volume is adjusted
following Gao and Ritter (2010).
1/TURN The inverse of the stock turnover, and the stock turnover measure in a given quarter 𝑞 is computed as follows:
𝑇𝑈𝑅𝑁𝑖,𝑞 = (∑ 𝑉𝑂𝐿𝑖,𝑞,𝑑/𝑆𝐻𝑅𝑂𝑈𝑇𝑖,𝑞,𝑑𝑑∈𝑞 )/𝐷𝑖,𝑞 × 102, where 𝑉𝑂𝐿𝑖,𝑞,𝑑 refers to the trading volume of stock 𝑖
in day 𝑑 of quarter 𝑞, 𝑆𝐻𝑅𝑂𝑈𝑇𝑖,𝑞,𝑑 refers to the shares outstanding at the same time, and 𝐷𝑖,𝑞 is the number of
trading days for stock 𝑖 in quarter 𝑞. In addition, NASDAQ trading volume is adjusted following Gao and
Ritter (2010).
LOGCVILLIQ The logarithm of the coefficient of variation of illiquidity, and the coefficient of variation of illiquidity measure
in a given quarter 𝑞 is computed as follows: 𝐶𝑉𝐼𝐿𝐿𝐼𝑄𝑖,𝑞 =𝑆𝑡𝑑𝑒𝑣(𝐼𝐿𝐿𝐼𝑄𝑖,𝑞)
𝐼𝐿𝐿𝐼𝑄𝑖,𝑞, where 𝑆𝑡𝑑𝑒𝑣(𝐼𝐿𝐿𝐼𝑄𝑖,𝑞) refers to the
standard deviation of the daily illiquidity of stock 𝑖 in quarter 𝑞, 𝐼𝐿𝐿𝐼𝑄𝑖,𝑞 refers to the average daily illiquidity
of stock 𝑖 at the same time. The stock illiquidity is defined the same as in LOGILLIQ above.
LOGCVTURN The logarithm of the coefficient of variation of turnover, and the coefficient of variation of turnover measure
in a given quarter 𝑞 is computed as follows: 𝐶𝑉𝑇𝑈𝑅𝑁𝑖,𝑞 =𝑆𝑡𝑑𝑒𝑣(𝑇𝑈𝑅𝑁𝑖,𝑞)
𝑇𝑈𝑅𝑁𝑖,𝑞, where 𝑆𝑡𝑑𝑒𝑣(𝑇𝑈𝑅𝑁𝑖,𝑞) refers to the
standard deviation of the daily turnover of stock 𝑖 in quarter 𝑞, 𝑇𝑈𝑅𝑁𝑖,𝑞 refers to the average daily turnover of
stock 𝑖 at the same time. The stock turnover is defined the same as in 1/TURN above.

41
C. Stock Characteristics
Pressure_1 The fraction of average volume from extreme flow-motivated trading of stock 𝑖 in a given quarter 𝑞 is
computed as follows:
𝑃𝑟𝑒𝑠𝑠𝑢𝑟𝑒_1𝑖,𝑞 =
∑ (max(0, ∆𝐻𝑜𝑙𝑑𝑖𝑛𝑔𝑠𝑓,𝑖,𝑞)|𝑓𝑙𝑜𝑤𝑓,𝑞 > 𝑃𝐶𝑇90𝑞)𝑓 −∑ (max(0, −∆𝐻𝑜𝑙𝑑𝑖𝑛𝑔𝑠𝑓,𝑖,𝑞)|𝑓𝑙𝑜𝑤𝑓,𝑞 < 𝑃𝐶𝑇10𝑞)𝑓
𝐴𝑣𝑔𝑉𝑜𝑙𝑢𝑚𝑒𝑖,𝑞−4:𝑞−2,
where ∆𝐻𝑜𝑙𝑑𝑖𝑛𝑔𝑠𝑓,𝑖,𝑡 refers to the change in the number of shares of stock 𝑖 held by fund 𝑓 in quarter 𝑞,
𝑓𝑙𝑜𝑤𝑓,𝑞 refers to the fund flow in the same quarter, 𝑃𝐶𝑇90𝑞 and 𝑃𝐶𝑇10𝑞 refer to the 90th and 10th percentile
of flow across all funds in quarter 𝑞, 𝐴𝑣𝑔𝑉𝑜𝑙𝑢𝑚𝑒𝑖,𝑞−4:𝑞−2 refers to the average trading volume of stock 𝑖
between quarter 𝑞 − 4 and 𝑞 − 2, following Coval and Stafford (2007). Fund flow in a given month 𝑚 is
computed as follows: 𝐹𝑙𝑜𝑤𝑓,𝑚 = [𝑇𝑁𝐴𝑓,𝑚 − 𝑇𝑁𝐴𝑓,𝑚−1 × (1 + 𝑟𝑓,𝑚)]/𝑇𝑁𝐴𝑓,𝑚−1 , where 𝑇𝑁𝐴𝑓,𝑚 refers to
the TNA of fund 𝑓 in month 𝑚, and 𝑟𝑓,𝑚 refers to fund total return in the same month. Quarterly flow is
computed as the cumulative monthly flows over the quarter.
Pressure_2 The fraction of average volume from flow-motivated trading of stock 𝑖 in a given quarter 𝑞 is computed as
follows: 𝑃𝑟𝑒𝑠𝑠𝑢𝑟𝑒_2𝑖,𝑞 =∑ (max(0,𝑓𝑙𝑜𝑤𝑓,𝑞)× max(0,∆𝐻𝑜𝑙𝑑𝑖𝑛𝑔𝑠𝑓,𝑖,𝑞))𝑓 −∑ (max(0,−𝑓𝑙𝑜𝑤𝑓,𝑞)× max(0,−∆𝐻𝑜𝑙𝑑𝑖𝑛𝑔𝑠𝑓,𝑖,𝑞))𝑓
𝐴𝑣𝑔𝑉𝑜𝑙𝑢𝑚𝑒𝑖,𝑞−4:𝑞−2,
where all the variables are defined the same as in Pressure_1 above, following Coval and Stafford (2007).
Log (Size) The logarithm of the market capitalization of a stock, computed as the quarter-end stock price multiplied by
shares outstanding, in millions.
Log (BM) The logarithm of the book-to-market ratio of a stock, and the book-to-market ratio in a given quarter 𝑞 is
computed as: 𝐵𝑀𝑖,𝑞 = 𝐵𝐸𝑖,𝑞/𝑀𝐸𝑖,𝑞 , where 𝐵𝐸𝑖,𝑞 refers to the book value of equity of stock 𝑖 in quarter 𝑞,
computed as the summation of stockholders’ equity and deferred taxes, and 𝑀𝐸𝑖,𝑞 refers to its market value at
the end of the previous year.
Log (RetVol) The logarithm of the return volatility of a stock, computed as the standard deviation of daily stock returns in
each quarter.
RETQ1 The cumulative monthly stock returns over the previous quarter.
RETQ2-4 The cumulative monthly stock returns over the three quarters ending at the beginning of the previous quarter.
Num_Fund The number of funds that hold a certain stock in each quarter, in thousands.
IO The institutional ownership in a given quarter 𝑞 is computed as follows: 𝐼𝑂𝑖,𝑞 = ∑ 𝑆𝐻𝑅𝑖,𝑓,𝑞/𝑆𝐻𝑅𝑂𝑈𝑇𝑖,𝑞𝑓 ,
where 𝑆𝐻𝑅𝑖,𝑓,𝑞 refers to the number of shares of stock 𝑖 held by fund 𝑓 in quarter 𝑞, and 𝑆𝐻𝑅𝑂𝑈𝑇𝑖,𝑞 refers to
the shares outstanding at the same time.
HHI The concentration of institutional ownership in a given quarter 𝑞 is computed as follows:
𝐻𝐻𝐼𝑖,𝑞 = ∑ (𝑆𝐻𝑅𝑖,𝑓,𝑞/ ∑ 𝑆𝐻𝑅𝑖,𝑓,𝑞𝑓 )2𝑓 , where 𝑆𝐻𝑅𝑖,𝑓,𝑞 refers to the number of shares of stock 𝑖 held by fund 𝑓
in quarter 𝑞.
ROA The ratio of operating income before depreciation to total assets.
Leverage The ratio of long-term debt to total assets.
IVOL The standard deviation of residuals estimated from a market model using daily returns in the past year.

42
Table 1: Investor Heterogeneity and Stock Characteristics
Stocks are sorted into quintiles according to lagged investor heterogeneity in quarter 𝑞. Panel A reports, for each quintile portfolio, the average
investor heterogeneity (STDCR), standard deviation of the churn rate (USTDCR), average churn rate (CR) in quarter 𝑞, the average LOGILLIQ,
1/TURN, LOGCVILLIQ and LOGCVTURN in the following quarter 𝑞 + 1. Panel B reports Log(Size), Log(BM), Log(RetVol), Return, RETQ1,
RETQ2-4, Num_Fund and IO represented by each quintile portfolio in formation quarter 𝑞. The sample period ranges from 1982 to 2016. The row
“HML” reports the difference in values between high and low investor heterogeneity portfolios (“Top 20% − Bottom 20%”). Appendix A provides
the detailed definition of each variable. Newey-West adjusted t-statistics are shown in parentheses. Numbers with “*”, “**” and “***” are significant
at the 10%, 5% and 1% level, respectively.
Panel A: Stock Characteristics Sorted by Lagged Investor Heterogeneity
Rank of STDCR STDCR USTDCR CR Returnq+1 LOGILLIQq+1 1/TURNq+1 LOGCVILLIQq+1 LOGCVTURNq+1
Low 0.535 11.688 20.934 3.087 -1.488 20.099 0.404 0.215
2 0.681 15.379 22.208 3.243 -3.333 8.539 0.198 -0.046
3 0.748 16.552 21.868 3.486 -3.895 7.466 0.136 -0.125
4 0.828 18.050 21.447 3.531 -4.329 7.464 0.099 -0.180
High 1.103 27.497 21.710 3.520 -3.581 11.996 0.188 -0.091
HML 0.568*** 15.809*** 0.775 0.433* -2.093*** -8.103*** -0.216*** -0.305***
(7.60) (4.16) (1.25) (1.77) (-8.85) (-3.88) (-8.99) (-9.89)
Panel B: Stock Characteristics Sorted by Contemporaneous Investor Heterogeneity
Rank of STDCR Log (Size) Log (BM) Log (RetVol) Return RETQ1 RETQ2-4 Num_Fund IO
Low 4.765 -0.306 0.949 3.188 7.025 23.244 0.039 0.320
2 5.741 -0.478 0.910 3.320 6.438 22.737 0.077 0.480
3 6.122 -0.492 0.847 3.602 5.380 17.536 0.103 0.506
4 6.464 -0.513 0.787 3.505 5.037 12.956 0.139 0.509
High 6.107 -0.487 0.820 3.448 5.339 11.981 0.156 0.419
HML 1.343*** -0.180*** -0.128*** 0.260 -1.687*** -11.262*** 0.117*** 0.099***
(10.25) (-4.69) (-7.92) (0.87) (-4.51) (-8.98) (9.15) (6.35)

43
Table 2: Investor Heterogeneity and Comovement in Mutual Fund Flows
Mutual funds are sorted into terciles according to lagged churn rate (average in the previous three years) in
quarter 𝑞. For each fund 𝑓 in each quarter, fund flow comovement is estimated from the following bivariate
regressions over the previous three years,
𝐹𝑙𝑜𝑤𝑓,𝑚 = 𝛼𝑓,𝑚 + ∑ 𝛽𝐼𝑛,𝑓,𝑚+𝑖𝐹𝑙𝑜𝑤𝐼𝑛,𝑓,𝑚+𝑖𝑘𝑖=−𝑘 + ∑ 𝛽𝑂𝑢𝑡,𝑓,𝑚+𝑖𝐹𝑙𝑜𝑤𝑂𝑢𝑡,𝑓,𝑚+𝑖
𝑘𝑖=−𝑘 + 𝜀𝑓,𝑚,
where 𝐹𝑙𝑜𝑤𝑓,𝑚 refers to the flow of fund 𝑓 of month 𝑚, 𝐹𝑙𝑜𝑤𝐼𝑛,𝑓,𝑚+𝑖 and 𝐹𝑙𝑜𝑤𝑂𝑢𝑡,𝑓,𝑚+𝑖 refer to the equal-
or value-weighted flow across funds in (not in) the same tercile of churn rate as fund 𝑓. We also allow for
the potential lead-lag effect in fund flows by including the contemporaneous fund flows, as well as the fund
flows in one-month (𝑘 = 1) or two-months (𝑘 = 2) before and after the current month. This table presents
the average parameters (∑ 𝛽𝐼𝑛,𝑓,𝑚+𝑖𝑖 and ∑ 𝛽𝑂𝑢𝑡,𝑓,𝑚+𝑖𝑖 ) and their difference in each tercile portfolio
(‘WMO”), as well as the differences in values between high and low churn rate portfolios (“HML”). Panel
A employs equal-weighted portfolio flows (𝐹𝑙𝑜𝑤𝐼𝑛,𝑓,𝑚+𝑖 and 𝐹𝑙𝑜𝑤𝑂𝑢𝑡,𝑓,𝑚+𝑖 ), while Panel B employs
lagged-TNA weighted portfolio flows. Appendix A provides the detailed definition of each variable.
Newey-West adjusted t-statistics are shown in parentheses. Numbers with “*”, “**” and “***” are
significant at the 10%, 5% and 1% level, respectively.
Panel A: Fund Flow Comovement Sorted by Lagged Churn Rate (Equal-weighted)
Rank of CR [−1, +1] [−2, +2]
Within Outside WMO Within Outside WMO
Low 0.801*** 0.124*** 0.677*** 0.787*** 0.139*** 0.648***
(17.64) (4.44) (9.58) (14.14) (3.94) (7.39)
Med 0.740*** 0.328*** 0.412*** 0.725*** 0.338*** 0.387**
(9.51) (5.49) (3.07) (7.77) (4.70) (2.42)
High 0.977*** 0.157* 0.819*** 1.024*** 0.085 0.940***
(19.09) (1.92) (6.36) (16.19) (0.82) (5.87)
HML 0.176** 0.034 0.237** -0.054
(2.04) (0.36) (2.22) (-0.46)
Panel B: Fund Flow Comovement Sorted by Lagged Churn Rate (Value-weighted)
Rank of CR [−1, +1] [−2, +2]
Within Outside WMO Within Outside WMO
Low 0.676*** 0.409*** 0.267*** 0.654*** 0.428*** 0.225***
(14.68) (12.22) (3.95) (11.40) (10.01) (2.63)
Med 0.750*** 0.464*** 0.286* 0.840*** 0.369*** 0.471**
(9.54) (6.00) (1.89) (8.22) (3.46) (2.32)
High 0.927*** 0.652*** 0.275* 1.094*** 0.620*** 0.473**
(14.33) (6.17) (1.72) (13.32) (4.80) (2.45)
HML 0.251** 0.243** 0.440*** 0.192
(2.48) (2.26) (3.62) (1.45)

44
Table 3: Investor Heterogeneity, Stock Liquidity and Liquidity Volatility
This table presents the results of the following quarterly Fama-MacBeth regressions, as well as their
corresponding Newey-West adjusted t-statistics,
𝐼𝐿𝐿𝐼𝑄𝑖,𝑞 = 𝛼0 + 𝛽1𝑆𝑇𝐷𝐶𝑅𝑖,𝑞−1 + 𝑐𝑀𝑖,𝑞−1 + 𝑒𝑖,𝑞,
𝐶𝑉𝐼𝐿𝐿𝐼𝑄𝑖,𝑞 = 𝛼0 + 𝛽1𝑆𝑇𝐷𝐶𝑅𝑖,𝑞−1 + 𝑐𝑀𝑖,𝑞−1 + 𝑒𝑖,𝑞,
where 𝐼𝐿𝐿𝐼𝑄𝑖,𝑞 refers to the two stock illiquidity proxies 𝐿𝑂𝐺𝐼𝐿𝐿𝐼𝑄𝑖,𝑞 and 1/𝑇𝑈𝑅𝑁𝑖,𝑞 of stock 𝑖 in
quarter 𝑞 , 𝐶𝑉𝐼𝐿𝐿𝐼𝑄𝑖,𝑞 refers to the two stock liquidity volatility proxies 𝐿𝑂𝐺𝐶𝑉𝐼𝐿𝐿𝐼𝑄𝑖,𝑞 and
𝐿𝑂𝐺𝐶𝑉𝑇𝑈𝑅𝑁𝑖,𝑞, 𝑆𝑇𝐷𝐶𝑅𝑖,𝑞−1 refers to the investor heterogeneity in investment horizon, and the vector M
stacks all other control variables, including the Log(Size), Log(BM), Log(RetVol), RETQ1, RETQ2-4,
Num_Fund and IO. AR(1) refers to the lagged dependent variable. Panel A reports the regression results
over the entire sample period from 1982 to 2016, and Panel B reports similar statistics in the sub-period
from 2000 to 2016. Panel C further replaces 𝑆𝑇𝐷𝐶𝑅𝑖,𝑞−1 with 𝑈𝑆𝑇𝐷𝐶𝑅𝑖,𝑞−1 (defined as the standard
deviation of the churn rate of all funds holding the stock) and 𝐶𝑅𝑖,𝑞−1 (defined as the average churn rate of
all funds holding the stock) in the sub-period from 2000 to 2016. Appendix A provides detailed definitions
for each variable. Numbers with “*”, “**” and “***” are significant at the 10%, 5% and 1% level,
respectively.
Panel A: Stock Liquidity and Liquidity Volatility Regressed on Lagged Investor Heterogeneity (1982 – 2016)
LOGILLIQ 1/TURN LOGCVILLIQ LOGCVTURN
Model 1 Model 2 Model 3 Model 4 Model 5 Model 6 Model 7 Model 8
STDCR -0.056** -0.064*** -1.307** -1.556*** -0.034*** -0.040*** -0.082*** -0.087***
(-2.51) (-2.84) (-2.48) (-3.12) (-2.65) (-3.26) (-4.28) (-4.91)
Log (Size) -0.215*** -0.213*** -0.688*** -0.201*** -0.067*** -0.056*** -0.121*** -0.107***
(-21.64) (-23.55) (-9.94) (-5.30) (-15.59) (-25.90) (-18.58) (-46.50)
Log (BM) 0.023*** 0.024*** 0.478*** 0.548*** -0.004** -0.004** 0.013*** 0.012***
(5.23) (5.25) (6.75) (7.43) (-2.10) (-2.21) (3.83) (3.65)
Log (RetVol) -0.087*** -0.062*** 0.483*** 0.714*** -0.020** -0.014** -0.097*** -0.086***
(-7.14) (-5.62) (3.00) (4.41) (-2.39) (-1.98) (-12.93) (-11.87)
RETQ1 -0.497*** -0.508*** 2.402*** 1.983*** -0.029*** -0.038*** 0.029*** 0.016
(-20.38) (-20.62) (6.42) (5.47) (-4.12) (-5.42) (2.62) (1.59)
RETQ2-4 -0.021** -0.041*** 0.194 -0.004 -0.005 -0.013*** 0.008 -0.000
(-2.57) (-4.96) (1.31) (-0.03) (-1.25) (-2.77) (1.45) (-0.02)
Num_Fund 0.096* 0.570 -0.056 -0.078
(1.67) (1.24) (-1.04) (-1.09)
IO -0.356*** -6.182*** -0.104*** -0.161***
(-14.34) (-10.24) (-6.14) (-7.15)
AR (1) 0.869*** 0.842*** 0.794*** 0.770*** 0.527*** 0.524*** 0.399*** 0.390***
(143.56) (126.17) (62.85) (60.32) (34.37) (33.73) (47.09) (42.99)
Intercept 0.927*** 0.990*** 7.331*** 7.402*** 0.542*** 0.523*** 0.822*** 0.805***
(15.41) (16.61) (8.43) (9.13) (18.65) (25.88) (22.04) (30.67)
Adj-Rsq 0.969 0.969 0.689 0.693 0.593 0.594 0.575 0.577
# of Quarters 140 140 140 140 140 140 140 140
Obs 228,196 228,196 228,255 228,255 228,181 228,181 228,255 228,255

45
Table 3—Continued
Panel B: Stock Liquidity and Liquidity Volatility Regressed on Lagged Investor Heterogeneity (2000 – 2016)
LOGILLIQ 1/TURN LOGCVILLIQ LOGCVTURN
Model 1 Model 2 Model 3 Model 4 Model 5 Model 6 Model 7 Model 8
STDCR -0.130*** -0.138*** -1.771*** -1.894*** -0.062*** -0.056** -0.134*** -0.127***
(-3.80) (-3.80) (-4.04) (-4.50) (-2.69) (-2.51) (-4.29) (-4.19)
Log (Size) -0.247*** -0.236*** -0.641*** -0.141*** -0.087*** -0.049*** -0.154*** -0.108***
(-18.55) (-18.36) (-6.90) (-4.25) (-19.96) (-14.51) (-43.24) (-33.54)
Log (BM) 0.036*** 0.037*** 0.282*** 0.343*** 0.002 0.002 0.002 0.001
(6.52) (7.56) (6.62) (6.53) (0.85) (1.01) (0.51) (0.16)
Log (RetVol) -0.134*** -0.096*** 0.096 0.426** -0.050*** -0.035*** -0.110*** -0.085***
(-9.53) (-7.55) (0.67) (2.62) (-6.45) (-4.81) (-12.59) (-10.01)
RETQ1 -0.493*** -0.510*** 1.109*** 0.673*** -0.021** -0.044*** 0.045*** 0.014
(-16.58) (-16.36) (4.70) (3.68) (-2.40) (-4.94) (2.81) (0.90)
RETQ2-4 -0.021 -0.053*** -0.131 -0.338*** -0.002 -0.017** 0.017** -0.002
(-1.66) (-4.25) (-1.02) (-2.93) (-0.24) (-2.07) (2.50) (-0.23)
Num_Fund 0.355*** 2.264*** 0.247*** 0.291***
(12.06) (6.63) (10.86) (16.70) IO -0.462*** -4.354*** -0.187*** -0.261***
(-14.06) (-8.54) (-18.50) (-18.56)
AR (1) 0.867*** 0.827*** 0.805*** 0.772*** 0.569*** 0.556*** 0.377*** 0.355***
(125.78) (90.70) (50.07) (48.47) (24.01) (22.59) (38.23) (40.08)
Intercept 1.140*** 1.177*** 6.780*** 6.229*** 0.641*** 0.514*** 0.959*** 0.819***
(12.79) (12.48) (7.08) (7.69) (13.72) (12.83) (18.77) (17.22)
Adj-Rsq 0.974 0.975 0.739 0.744 0.677 0.679 0.597 0.603
# of Quarters 68 68 68 68 68 68 68 68
Obs 100,613 100,613 100,613 100,613 100,611 100,611 100,613 100,613
Panel C: Stock Liquidity and Liquidity Volatility Regressed on Lagged Investor Heterogeneity (2000 – 2016)
LOGILLIQ 1/TURN LOGCVILLIQ LOGCVTURN
Model 1 Model 2 Model 3 Model 4 Model 5 Model 6 Model 7 Model 8
USTDCR -0.004** -0.005*** -0.059*** -0.067*** -0.002* -0.002* -0.005*** -0.005***
(-2.56) (-2.73) (-2.82) (-3.34) (-1.90) (-1.74) (-3.42) (-3.35)
CR -0.012*** -0.011*** -0.108*** -0.062*** -0.005*** -0.005*** -0.003** -0.002*
(-7.34) (-7.97) (-4.86) (-3.60) (-6.43) (-6.22) (-2.45) (-1.83)
Log (Size) -0.258*** -0.261*** -0.480*** -0.154*** -0.080*** -0.051*** -0.145*** -0.110***
(-19.23) (-17.75) (-6.24) (-4.85) (-20.17) (-15.77) (-40.30) (-35.98)
Log (BM) 0.039*** 0.041*** 0.321*** 0.369*** 0.003 0.003 0.003 0.002
(7.05) (8.29) (6.94) (6.44) (1.24) (1.47) (0.72) (0.40)
Log (RetVol) -0.102*** -0.066*** 0.352** 0.571*** -0.036*** -0.024*** -0.094*** -0.075***
(-7.82) (-5.56) (2.43) (3.47) (-4.97) (-3.61) (-10.35) (-8.85)
RETQ1 -0.471*** -0.479*** 1.187*** 0.823*** -0.015 -0.033*** 0.049*** 0.022
(-15.27) (-14.69) (5.18) (4.40) (-1.61) (-3.66) (3.04) (1.39)
RETQ2-4 0.010 -0.019 0.186 -0.055 0.013 0.000 0.031*** 0.013*
(0.70) (-1.32) (1.42) (-0.50) (1.63) (0.03) (4.31) (1.80)
Num_Fund 0.233*** 0.893*** 0.179*** 0.216***
(9.02) (3.81) (9.92) (13.23) IO -0.430*** -3.864*** -0.154*** -0.227***
(-13.83) (-8.71) (-17.35) (-18.46)
AR (1) 0.848*** 0.808*** 0.793*** 0.766*** 0.554*** 0.543*** 0.371*** 0.352***
(105.23) (77.74) (47.07) (46.54) (23.46) (22.27) (40.50) (41.10)
Intercept 1.364*** 1.454*** 7.950*** 7.099*** 0.704*** 0.608*** 0.964*** 0.840***
(15.14) (14.20) (6.92) (7.28) (18.36) (17.52) (25.43) (23.26)
Adj-Rsq 0.975 0.975 0.742 0.746 0.680 0.683 0.600 0.605
# of Quarters 68 68 68 68 68 68 68 68
Obs 100,613 100,613 100,613 100,613 100,611 100,611 100,613 100,613

46
Table 4: Difference-In-Differences Estimates Around 2003 Tax Cut
Panel A presents the difference-in-differences estimates in the following quarterly panel regressions with
stock and quarter fixed effects and their corresponding t-statistics with standard errors clustered at both the
stock and quarter level,
𝑌𝑖,𝑞 = 𝛼0 + 𝛽1𝑇𝑟𝑒𝑎𝑡𝑖,𝑞 × 𝑃𝑜𝑠𝑡𝑖,𝑞 + 𝑐𝑀𝑖,𝑞−1 + 𝛼𝑖 + 𝛾𝑞 + 𝑒𝑖,𝑞,
where the dependent variable 𝑌𝑖,𝑞 refers to investor heterogeneity in investment horizon (𝑆𝑇𝐷𝐶𝑅𝑖,𝑞), stock
illiquidity (𝐼𝐿𝐿𝐼𝑄𝑖,𝑞), liquidity volatility (𝐶𝑉𝐼𝐿𝐿𝐼𝑄𝑖,𝑞), and average monthly return of stock 𝑖 in quarter 𝑞,
𝑇𝑟𝑒𝑎𝑡𝑖,𝑞 is a dummy variable that takes the value of one if stock 𝑖 consistently pays dividends in the three
years prior to the 2003 Tax Cut (treatment group) and zero for the control group, 𝑃𝑜𝑠𝑡𝑖,𝑞 is a dummy
variable that takes the value one within three years after the tax cut (2004 – 2006) and zero for three years
before the tax cut (2000 – 2002), and the vector M stacks all other control variables, including the Log(Size),
Log(BM), Log(RetVol), RETQ1, RETQ2-4 and IO. 𝛼𝑖 and 𝛾𝑞 refer to the stock and quarter fixed effects,
respectively. Panels B and C report similar statistics in subsamples with high and low ∆𝑆𝑇𝐷𝐶𝑅 ,
respectively. ∆𝑆𝑇𝐷𝐶𝑅 refers to the change in average quarterly 𝑆𝑇𝐷𝐶𝑅 from three years before to three
years after the tax cut, and high (low) ∆𝑆𝑇𝐷𝐶𝑅 subsample consists of stocks with above (below) median
∆𝑆𝑇𝐷𝐶𝑅. Appendix A provides detailed definitions for each variable. Numbers with “*”, “**” and “***”
are significant at the 10%, 5% and 1% level, respectively.
Panel A: Difference-In-Differences Estimates Around 2003 Tax Cut
STDCR LOGILLIQ 1/TURN LOGCVILLIQ LOGCVTURN RETURN
Model 1 Model 2 Model 3 Model 4 Model 5 Model 6
Treat × Post 0.013** -0.088*** -2.597*** -0.000 -0.056*** 0.523
(2.71) (-3.73) (-7.95) (-0.02) (-2.98) (1.13)
Log (Size) -0.002 -1.246*** -1.284*** -0.136*** -0.104*** -6.382***
(-0.64) (-47.26) (-5.28) (-14.39) (-8.59) (-10.46)
Log (BM) 0.030*** 0.292*** 2.096*** 0.008 0.035** -6.691***
(7.45) (7.71) (4.47) (0.82) (2.20) (-6.80)
Log (RetVol) 0.016*** 0.019 -1.138* -0.078*** -0.104*** -0.173
(4.09) (0.94) (-1.99) (-6.21) (-6.44) (-0.51)
RETQ1 -0.001 0.051 1.162 0.023 -0.041* -3.122***
(-0.15) (0.75) (1.63) (0.83) (-1.79) (-3.88)
RETQ2-4 -0.007** -0.081** -0.735** -0.009 0.000 -0.693
(-2.54) (-2.39) (-2.46) (-1.04) (0.03) (-1.24)
IO 0.020** -1.610*** 0.679 -0.212*** -0.227*** -2.026*
(2.41) (-10.22) (0.50) (-5.86) (-4.47) (-1.88)
Adj-Rsq 0.621 0.966 0.656 0.687 0.649 0.320
Obs 8,852 8,852 8,852 8,852 8,852 8,852

47
Table 4—Continued
Panel B: Difference-In-Differences Estimates Around 2003 Tax Cut (High ∆STDCR)
STDCR LOGILLIQ 1/TURN LOGCVILLIQ LOGCVTURN RETURN
Model 1 Model 2 Model 3 Model 4 Model 5 Model 6
Treat × Post 0.063*** -0.292** -3.089*** -0.075** -0.121*** 0.640
(5.40) (-2.70) (-2.86) (-2.57) (-3.54) (1.05)
Log (Size) -0.005 -1.272*** -1.801 -0.129*** -0.100*** -5.961***
(-0.81) (-17.99) (-1.47) (-6.42) (-4.00) (-7.88)
Log (BM) 0.025** 0.272*** 1.462 0.016 0.037 -6.664***
(2.34) (3.39) (1.68) (0.67) (1.16) (-6.61)
Log (RetVol) 0.019** 0.067 -1.033 -0.054** -0.058** -0.299
(2.29) (0.78) (-0.99) (-2.50) (-2.57) (-0.65)
RETQ1 0.001 0.053 1.733 0.008 -0.056** -3.598***
(0.10) (0.54) (1.39) (0.25) (-2.21) (-4.39)
RETQ2-4 -0.007 -0.099 -0.852 -0.014 -0.010 -0.987
(-1.30) (-1.47) (-1.53) (-0.88) (-0.49) (-1.55)
IO 0.003 -1.770*** -1.290 -0.161* -0.171* -1.405
(0.13) (-5.56) (-0.52) (-1.92) (-1.77) (-0.94)
Adj-Rsq 0.693 0.966 0.624 0.700 0.634 0.326
Obs 4,227 4,227 4,227 4,227 4,227 4,227
Panel C: Difference-In-Differences Estimates Around 2003 Tax Cut (Low ∆STDCR)
STDCR LOGILLIQ 1/TURN LOGCVILLIQ LOGCVTURN RETURN
Model 1 Model 2 Model 3 Model 4 Model 5 Model 6
Treat × Post -0.057*** 0.112 -1.583* 0.050 -0.012 0.772
(-5.14) (1.06) (-2.05) (1.51) (-0.31) (1.32)
Log (Size) -0.002 -1.178*** -1.227* -0.141*** -0.115*** -6.210***
(-0.38) (-14.71) (-2.04) (-7.39) (-4.35) (-8.25)
Log (BM) 0.026*** 0.300*** 1.788*** 0.012 0.049* -6.763***
(3.44) (4.41) (3.17) (0.57) (1.72) (-6.33)
Log (RetVol) 0.008 0.028 -1.726** -0.066** -0.124*** 0.225
(1.24) (0.52) (-2.52) (-2.70) (-4.80) (0.57)
RETQ1 -0.003 0.008 0.859 0.023 -0.048 -2.966***
(-0.25) (0.11) (1.46) (0.82) (-1.42) (-2.84)
RETQ2-4 -0.001 -0.060 -0.173 -0.016 0.016 -0.844
(-0.25) (-1.30) (-0.59) (-1.43) (0.87) (-1.53)
IO 0.044 -1.671*** 1.885 -0.313*** -0.278** -3.947**
(1.56) (-5.04) (0.66) (-3.42) (-2.26) (-2.17)
Adj-Rsq 0.563 0.968 0.661 0.681 0.646 0.334
Obs 4,401 4,401 4,401 4,401 4,401 4,401

48
Table 5: Stock Performance Around Extreme Fund Flows
In Panels A and B, at the end of quarter 𝑞, stocks are first sorted into deciles according to their lagged price
pressure between quarter 𝑞 − 4 and 𝑞 − 1. Within each price pressure group, stocks are further sorted into
quintiles according to their lagged investor heterogeneity in investment horizon in quarter 𝑞. The Low
(High) price pressure portfolio is comprised of the bottom (top) decile of stocks based on the quarterly
average price pressure between quarter 𝑞 − 4 and 𝑞 − 1, indicating stocks experiencing outflow-induced
sales (inflow-induced purchases). The Low (High) investor heterogeneity portfolio is comprised of the
bottom (top) quintile of stocks based on the investor heterogeneity in quarter 𝑞 and is labeled as “Low_IH”
(“High_IH”). This table reports the value-weighted average monthly return in the price pressure period
(quarter 𝑞 − 4 to 𝑞 − 1), as well as the holding period (quarter 𝑞 + 1 to 𝑞 + 4) for the investment strategy
of going long (short) the High (Low) investor heterogeneity stocks (“HML_IH”). The column “LMH_PP”
reports the difference in profits between fire sales and fire purchases portfolios. Stock returns are further
adjusted by a five-factor model comprising the three Fama-French factors (market, size and book-to-
market), the Carhart momentum factor, and the Pástor-Stambaugh liquidity factor. The price pressure is
proxied by Pressure_1 in Panel A and Pressure_2 in Panel B, respectively. Panels C and D report similar
statistics when we further control for the past performance. In Panel C, at the end of quarter 𝑞, stocks are
first sorted into 5 × 10 portfolios according to their lagged return between quarter 𝑞 − 8 and 𝑞 − 5
(quintiles) and price pressure between quarter 𝑞 − 4 and 𝑞 − 1 (deciles). Within each past return-price
pressure group, stocks are further sorted into quintiles according to their lagged investor heterogeneity in
investment horizon in quarter 𝑞. The price pressure is proxied by Pressure_1. Panel D reports similar
statistics where the lagged return is measured between quarter 𝑞 − 4 and 𝑞 − 1. The profits are reported for
the full sample from 1982 to 2016. Appendix A provides the detailed definition of each variable. Newey-
West adjusted t-statistics are shown in parentheses. Numbers with “*”, “**” and “***” are significant at
the 10%, 5% and 1% level, respectively.
Panel A: Returns (in %) Sorted by Extreme Flow-induced Mutual Fund Transactions (Pressure_1) and Investor Heterogeneity
Rank of STDCR Return Five-Factor adjusted Return
Pressure Holding Period Holding Period
LMH_PP Low High LMH_PP Low High LMH_PP
Low_IH -0.886*** 0.601** 0.021 0.579*** -0.462*** -0.900*** 0.439***
(-3.70) (2.17) (0.07) (3.52) (-4.04) (-6.51) (3.14)
2 -0.880*** 0.722*** 0.215 0.506*** -0.310*** -0.821*** 0.511***
(-2.93) (2.94) (0.66) (2.60) (-3.07) (-5.39) (2.86)
3 -0.758** 0.785*** 0.186 0.599*** -0.249*** -0.833*** 0.584***
(-2.47) (3.27) (0.59) (2.87) (-2.76) (-5.37) (3.07)
4 -0.469** 0.838*** 0.301 0.537** -0.259*** -0.658*** 0.399**
(-2.17) (3.49) (0.96) (2.58) (-2.66) (-5.05) (2.28)
High_IH -0.230* 0.796*** 0.729** 0.067 -0.300** -0.347* 0.048
(-1.92) (2.89) (2.25) (0.41) (-2.23) (-1.92) (0.26)
HML_IH 0.657*** 0.195 0.708*** -0.512** 0.162 0.553*** -0.391*
(2.82) (1.07) (3.04) (-2.59) (0.92) (2.82) (-1.95)

49
Table 5—Continued
Panel B: Returns (in %) Sorted by Flow-induced Mutual Fund Transactions (Pressure_2) and Investor Heterogeneity
Rank of STDCR
Return Five-Factor adjusted Return
Pressure Holding Period Holding Period
LMH_PP Low High LMH_PP Low High LMH_PP
Low_IH -0.598** 1.278*** 0.011 1.267*** 0.166 -0.966*** 1.131***
(-2.26) (4.46) (0.03) (6.82) (1.27) (-7.38) (7.02)
2 -0.078 1.276*** 0.039 1.237*** 0.161 -1.002*** 1.163***
(-0.24) (4.89) (0.11) (5.23) (1.43) (-7.13) (5.99)
3 -0.096 1.131*** 0.269 0.862*** 0.065 -0.765*** 0.829***
(-0.32) (4.74) (0.80) (3.66) (0.57) (-4.42) (3.59)
4 0.234 1.209*** 0.252 0.957*** 0.087 -0.733*** 0.819***
(1.04) (4.89) (0.83) (4.56) (0.79) (-5.79) (4.54)
High_IH 0.205 1.098*** 0.701** 0.397** 0.117 -0.428** 0.545***
(1.13) (4.74) (2.18) (2.01) (1.06) (-2.40) (2.61)
HML_IH 0.803*** -0.180 0.690*** -0.870*** -0.048 0.538*** -0.586**
(3.27) (-0.99) (2.84) (-3.57) (-0.30) (2.65) (-2.37)
Panel C: Returns (in %) Sorted by Extreme Flow-induced Mutual Fund Transactions (Pressure_1) and Investor Heterogeneity
(Past Performance-Neutral, q−8 to q−5)
Rank of STDCR
Return Five-Factor adjusted Return
Pressure Holding Period Holding Period
LMH_PP Low High LMH_PP Low High LMH_PP
Low_IH -0.861*** 0.684*** 0.057 0.627*** -0.366*** -0.867*** 0.502***
(-3.54) (2.67) (0.18) (3.80) (-3.28) (-6.20) (3.35)
2 -0.687*** 0.623*** 0.221 0.403** -0.427*** -0.782*** 0.355**
(-3.04) (2.59) (0.72) (2.38) (-4.60) (-5.87) (2.37)
3 -0.633** 0.796*** 0.194 0.602*** -0.230** -0.763*** 0.533***
(-2.10) (3.48) (0.63) (3.02) (-2.24) (-4.85) (2.94)
4 -0.508*** 0.836*** 0.314 0.522*** -0.228** -0.616*** 0.388**
(-2.76) (3.47) (1.11) (2.81) (-2.30) (-5.39) (2.43)
High_IH -0.224* 0.737*** 0.664** 0.073 -0.329** -0.410** 0.081
(-1.89) (2.70) (2.08) (0.45) (-2.48) (-2.34) (0.46)
HML_IH 0.637** 0.053 0.607*** -0.554*** 0.036 0.457*** -0.421**
(2.58) (0.32) (2.98) (-2.97) (0.21) (2.66) (-2.17)
Panel D: Returns (in %) Sorted by Extreme Flow-induced Mutual Fund Transactions (Pressure_1) and Investor Heterogeneity
(Past Performance-Neutral, q−4 to q−1)
Rank of STDCR
Return Five-Factor adjusted Return
Pressure Holding Period Holding Period
LMH_PP Low High LMH_PP Low High LMH_PP
Low_IH -0.932*** 0.638** -0.000 0.638*** -0.380*** -0.926*** 0.547***
(-4.35) (2.44) (-0.00) (3.57) (-3.24) (-7.23) (3.52)
2 -0.639*** 0.741*** 0.205 0.536*** -0.294*** -0.777*** 0.483***
(-3.37) (2.96) (0.67) (3.39) (-3.13) (-5.95) (3.35)
3 -0.513*** 0.828*** 0.363 0.465** -0.179* -0.622*** 0.443**
(-2.91) (3.62) (1.22) (2.36) (-1.80) (-4.65) (2.47)
4 -0.455*** 0.773*** 0.328 0.444*** -0.292*** -0.574*** 0.282*
(-2.78) (3.25) (1.23) (2.86) (-3.34) (-4.09) (1.68)
High_IH -0.276* 0.766*** 0.644** 0.122 -0.317** -0.447*** 0.130
(-1.92) (2.87) (2.01) (0.77) (-2.42) (-2.62) (0.78)
HML_IH 0.656*** 0.128 0.644*** -0.516** 0.062 0.480*** -0.417**
(3.40) (0.74) (3.09) (-2.55) (0.37) (2.69) (-2.08)
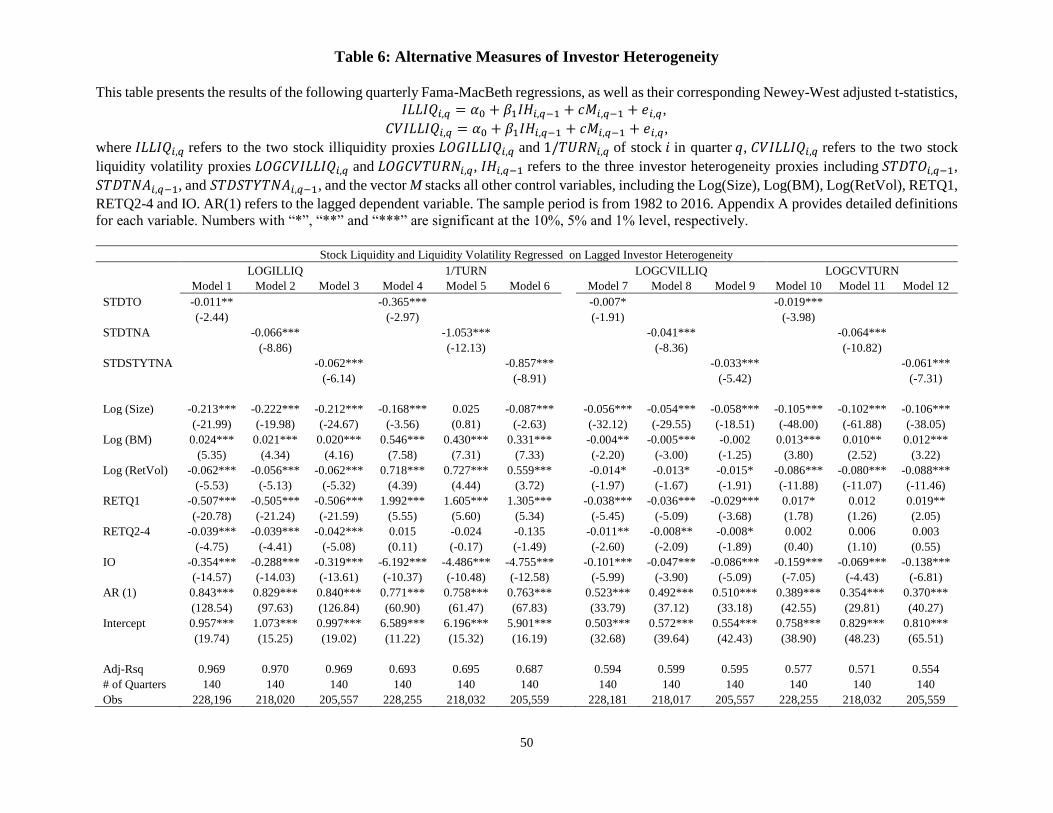
50
Table 6: Alternative Measures of Investor Heterogeneity
This table presents the results of the following quarterly Fama-MacBeth regressions, as well as their corresponding Newey-West adjusted t-statistics,
𝐼𝐿𝐿𝐼𝑄𝑖,𝑞 = 𝛼0 + 𝛽1𝐼𝐻𝑖,𝑞−1 + 𝑐𝑀𝑖,𝑞−1 + 𝑒𝑖,𝑞,
𝐶𝑉𝐼𝐿𝐿𝐼𝑄𝑖,𝑞 = 𝛼0 + 𝛽1𝐼𝐻𝑖,𝑞−1 + 𝑐𝑀𝑖,𝑞−1 + 𝑒𝑖,𝑞,
where 𝐼𝐿𝐿𝐼𝑄𝑖,𝑞 refers to the two stock illiquidity proxies 𝐿𝑂𝐺𝐼𝐿𝐿𝐼𝑄𝑖,𝑞 and 1/𝑇𝑈𝑅𝑁𝑖,𝑞 of stock 𝑖 in quarter 𝑞, 𝐶𝑉𝐼𝐿𝐿𝐼𝑄𝑖,𝑞 refers to the two stock
liquidity volatility proxies 𝐿𝑂𝐺𝐶𝑉𝐼𝐿𝐿𝐼𝑄𝑖,𝑞 and 𝐿𝑂𝐺𝐶𝑉𝑇𝑈𝑅𝑁𝑖,𝑞, 𝐼𝐻𝑖,𝑞−1 refers to the three investor heterogeneity proxies including 𝑆𝑇𝐷𝑇𝑂𝑖,𝑞−1,
𝑆𝑇𝐷𝑇𝑁𝐴𝑖,𝑞−1, and 𝑆𝑇𝐷𝑆𝑇𝑌𝑇𝑁𝐴𝑖,𝑞−1, and the vector M stacks all other control variables, including the Log(Size), Log(BM), Log(RetVol), RETQ1,
RETQ2-4 and IO. AR(1) refers to the lagged dependent variable. The sample period is from 1982 to 2016. Appendix A provides detailed definitions
for each variable. Numbers with “*”, “**” and “***” are significant at the 10%, 5% and 1% level, respectively.
Stock Liquidity and Liquidity Volatility Regressed on Lagged Investor Heterogeneity
LOGILLIQ 1/TURN LOGCVILLIQ LOGCVTURN
Model 1 Model 2 Model 3 Model 4 Model 5 Model 6 Model 7 Model 8 Model 9 Model 10 Model 11 Model 12
STDTO -0.011** -0.365*** -0.007* -0.019***
(-2.44) (-2.97) (-1.91) (-3.98) STDTNA -0.066*** -1.053*** -0.041*** -0.064***
(-8.86) (-12.13) (-8.36) (-10.82) STDSTYTNA -0.062*** -0.857*** -0.033*** -0.061***
(-6.14) (-8.91) (-5.42) (-7.31)
Log (Size) -0.213*** -0.222*** -0.212*** -0.168*** 0.025 -0.087*** -0.056*** -0.054*** -0.058*** -0.105*** -0.102*** -0.106***
(-21.99) (-19.98) (-24.67) (-3.56) (0.81) (-2.63) (-32.12) (-29.55) (-18.51) (-48.00) (-61.88) (-38.05)
Log (BM) 0.024*** 0.021*** 0.020*** 0.546*** 0.430*** 0.331*** -0.004** -0.005*** -0.002 0.013*** 0.010** 0.012***
(5.35) (4.34) (4.16) (7.58) (7.31) (7.33) (-2.20) (-3.00) (-1.25) (3.80) (2.52) (3.22)
Log (RetVol) -0.062*** -0.056*** -0.062*** 0.718*** 0.727*** 0.559*** -0.014* -0.013* -0.015* -0.086*** -0.080*** -0.088***
(-5.53) (-5.13) (-5.32) (4.39) (4.44) (3.72) (-1.97) (-1.67) (-1.91) (-11.88) (-11.07) (-11.46)
RETQ1 -0.507*** -0.505*** -0.506*** 1.992*** 1.605*** 1.305*** -0.038*** -0.036*** -0.029*** 0.017* 0.012 0.019**
(-20.78) (-21.24) (-21.59) (5.55) (5.60) (5.34) (-5.45) (-5.09) (-3.68) (1.78) (1.26) (2.05)
RETQ2-4 -0.039*** -0.039*** -0.042*** 0.015 -0.024 -0.135 -0.011** -0.008** -0.008* 0.002 0.006 0.003
(-4.75) (-4.41) (-5.08) (0.11) (-0.17) (-1.49) (-2.60) (-2.09) (-1.89) (0.40) (1.10) (0.55)
IO -0.354*** -0.288*** -0.319*** -6.192*** -4.486*** -4.755*** -0.101*** -0.047*** -0.086*** -0.159*** -0.069*** -0.138***
(-14.57) (-14.03) (-13.61) (-10.37) (-10.48) (-12.58) (-5.99) (-3.90) (-5.09) (-7.05) (-4.43) (-6.81)
AR (1) 0.843*** 0.829*** 0.840*** 0.771*** 0.758*** 0.763*** 0.523*** 0.492*** 0.510*** 0.389*** 0.354*** 0.370***
(128.54) (97.63) (126.84) (60.90) (61.47) (67.83) (33.79) (37.12) (33.18) (42.55) (29.81) (40.27)
Intercept 0.957*** 1.073*** 0.997*** 6.589*** 6.196*** 5.901*** 0.503*** 0.572*** 0.554*** 0.758*** 0.829*** 0.810***
(19.74) (15.25) (19.02) (11.22) (15.32) (16.19) (32.68) (39.64) (42.43) (38.90) (48.23) (65.51)
Adj-Rsq 0.969 0.970 0.969 0.693 0.695 0.687 0.594 0.599 0.595 0.577 0.571 0.554
# of Quarters 140 140 140 140 140 140 140 140 140 140 140 140
Obs 228,196 218,020 205,557 228,255 218,032 205,559 228,181 218,017 205,557 228,255 218,032 205,559

51
Table 7: Investor Heterogeneity and Illiquidity Premium
At the end of quarter 𝑞, stocks are sorted into quintiles according to their Amihud illiquidity (𝐿𝑂𝐺𝐼𝐿𝐿𝐼𝑄) and investor heterogeneity in investment horizon (𝑆𝑇𝐷𝐶𝑅)
in that quarter. The Low (High) stock illiquidity portfolio is comprised of the bottom (top) quintile of stocks based on the Amihud illiquidity and is labeled as
“Low_ILLIQ” (“High_ILLIQ”). The Low (High) investor heterogeneity portfolio is comprised of the bottom (top) quintile of stocks based on the investor
heterogeneity and is labeled as “Low_IH” (“High_IH”). Panel A reports, for each investor heterogeneity portfolio and All firms, the equal-weighted average monthly
return in quarter 𝑞 + 1 for the investment strategy of going long (short) the illiquid (liquid) stocks (“IML”). Stock returns are further adjusted by a five-factor model
comprising the three Fama-French factors (market, size and book-to-market), the Carhart momentum factor, and the Pástor-Stambaugh liquidity factor. Panel B
reports similar statistics for value-weighted portfolio returns. Panels A1 and B1 focus on the entire sample period from 1982 to 2016, while Panels A2 and B2 focus
on the sub-period from 2000 to 2016. Appendix A provides the detailed definition of each variable. Newey-West adjusted t-statistics are shown in parentheses.
Numbers with “*”, “**” and “***” are significant at the 10%, 5% and 1% level, respectively.
Rank of
LOGILLIQ
Return Five-Factor adjusted Return
Rank of STDCR All Rank of STDCR
All Low_IH 2 3 4 High_IH Low_IH 2 3 4 High_IH
Panel A: Equal-weighted Illiquidity Return Premium (in %) Sorted by Investor Heterogeneity
Panel A1: 1982 – 2016
Low_ILLIQ 0.430 0.889*** 1.148*** 1.054*** 1.103*** 1.043*** -0.772*** -0.220* 0.038 -0.017 0.113* -0.023
(0.99) (2.65) (4.30) (4.40) (4.92) (4.25) (-2.99) (-1.91) (0.51) (-0.31) (1.84) (-0.51)
High_ILLIQ 1.085*** 1.113*** 1.137*** 1.173*** 1.174*** 1.126*** 0.254* 0.180 0.201 0.260* 0.297** 0.252**
(4.39) (4.09) (4.03) (4.40) (4.56) (4.48) (1.84) (1.34) (1.37) (1.96) (2.19) (2.03)
IML 0.655* 0.224 -0.010 0.119 0.072 0.083 1.027*** 0.401** 0.163 0.277* 0.184 0.275**
(1.73) (0.98) (-0.06) (0.73) (0.45) (0.56) (3.40) (2.47) (0.96) (1.93) (1.38) (2.16)
Panel A2: 2000 – 2016 Low_ILLIQ -0.438 0.389 0.749* 0.747** 0.835** 0.701* -1.038*** -0.225 0.097 0.099 0.245*** 0.073
(-0.69) (0.80) (1.79) (2.01) (2.35) (1.86) (-3.31) (-1.35) (0.81) (1.08) (2.89) (1.03)
High_ILLIQ 0.980*** 1.027*** 1.040*** 1.040*** 1.085*** 1.004*** 0.403** 0.332* 0.303 0.357* 0.464** 0.379**
(3.11) (2.63) (2.60) (2.80) (3.14) (3.04) (2.22) (1.75) (1.46) (1.83) (2.41) (2.36)
IML 1.418** 0.638* 0.291 0.292 0.250 0.304 1.442*** 0.557** 0.206 0.258 0.219 0.306*
(2.54) (1.72) (1.01) (1.16) (1.19) (1.42) (3.89) (2.46) (0.92) (1.18) (1.11) (1.83)
Panel B: Value-weighted Illiquidity Return Premium (in %) Sorted by Investor Heterogeneity
Panel B1: 1982 – 2016
Low_ILLIQ 0.596 0.934** 1.044*** 1.007*** 0.983*** 0.997*** -0.648** -0.172 -0.097 -0.065 0.055 -0.001
(1.35) (2.53) (3.55) (4.18) (4.80) (4.48) (-2.16) (-1.16) (-0.93) (-1.07) (1.22) (-0.06)
High_ILLIQ 1.177*** 1.053*** 1.141*** 1.271*** 1.117*** 1.143*** 0.310** 0.066 0.101 0.368*** 0.185 0.222**
(5.01) (3.94) (3.98) (4.79) (4.16) (4.78) (2.56) (0.49) (0.74) (2.74) (1.19) (2.27)
IML 0.581 0.119 0.097 0.264 0.133 0.146 0.957*** 0.238 0.198 0.433*** 0.131 0.222**
(1.49) (0.40) (0.42) (1.31) (0.64) (0.89) (2.75) (1.16) (1.12) (2.77) (0.83) (2.23)
Panel B2: 2000 – 2016 Low_ILLIQ -0.544 0.320 0.489 0.467 0.473 0.476 -1.191*** -0.233 -0.129 -0.098 0.041 -0.001
(-0.82) (0.56) (1.06) (1.28) (1.53) (1.43) (-3.41) (-1.06) (-0.82) (-1.17) (0.77) (-0.06)
High_ILLIQ 1.083*** 0.848** 1.018** 1.140*** 1.030*** 1.004*** 0.478*** 0.094 0.185 0.430** 0.332 0.324**
(3.54) (2.10) (2.40) (3.04) (2.67) (3.14) (2.91) (0.45) (0.92) (2.03) (1.28) (2.57)
IML 1.627*** 0.528 0.530 0.673** 0.557* 0.528** 1.669*** 0.326 0.313 0.528** 0.291 0.325**
(2.86) (1.02) (1.48) (2.25) (1.80) (2.34) (4.13) (1.04) (1.38) (2.20) (1.14) (2.54)

52
Table 8: Investor Heterogeneity, Liquidity Volatility and Illiquidity Premium
At the end of quarter 𝑞, stocks are sorted into quintiles according to their Amihud illiquidity (𝐿𝑂𝐺𝐼𝐿𝐿𝐼𝑄), liquidity volatility (𝐿𝑂𝐺𝐶𝑉𝐼𝐿𝐿𝐼𝑄) and
investor heterogeneity in investment horizon (𝑆𝑇𝐷𝐶𝑅) in that quarter. The Low (High) stock illiquidity portfolio is comprised of the bottom (top)
quintile of stocks based on the Amihud illiquidity and is labeled as “Low_ILLIQ” (“High_ILLIQ”). The Low (High) stock liquidity volatility
portfolio is comprised of the bottom (top) quintile of stocks based on the coefficient of variation of Amihud illiquidity and is labeled as
“Low_CVILLIQ” (“High_CVILLIQ”). The Low (High) investor heterogeneity portfolio is comprised of the bottom (top) quintile of stocks based
on the investor heterogeneity and is labeled as “Low_IH” (“High_IH”). Panel A reports the equal-weighted average monthly return in quarter 𝑞 + 1
for the investment strategy of going long (short) the illiquid (liquid) stocks (“IML”) over the entire sample period from 1982 to 2016. Stock returns
are further adjusted by a five-factor model comprising the three Fama-French factors (market, size and book-to-market), the Carhart momentum
factor, and the Pástor-Stambaugh liquidity factor. Panel B reports similar statistics for value-weighted portfolio returns. Appendix A provides the
detailed definition of each variable. Newey-West adjusted t-statistics are shown in parentheses. Numbers with “*”, “**” and “***” are significant
at the 10%, 5% and 1% level, respectively.
Rank of
LOGILLIQ
Return Five-Factor adjusted Return
Low_IH High_IH Low_IH High_IH
Low_CVILLIQ High_CVILLIQ Low_CVILLIQ High_CVILLIQ Low_CVILLIQ High_CVILLIQ Low_CVILLIQ High_CVILLIQ
Panel A: Equal-weighted Illiquidity Return Premium (in %) Sorted by Liquidity Volatility and Investor Heterogeneity
Low_ILLIQ -0.116 0.006 1.106*** 0.803*** -1.165*** -0.761* 0.110 0.319*
(-0.23) (0.03) (4.87) (4.58) (-3.02) (-1.76) (1.62) (1.94)
High_ILLIQ 1.061*** 1.104*** 0.126 1.251*** 0.226 0.285* -0.321 0.399***
(3.00) (4.22) (0.31) (4.96) (0.67) (1.80) (-0.78) (3.07)
IML 1.178** 1.097*** -0.980** 0.448* 1.391*** 1.046** -0.431 0.080
(2.07) (3.56) (-2.39) (1.77) (2.84) (2.53) (-1.06) (0.38)
Panel B: Value-weighted Illiquidity Return Premium (in %) Sorted by Liquidity Volatility and Investor Heterogeneity
Low_ILLIQ 0.068 -0.004 1.001*** 0.661*** -1.013** -0.768* 0.071 0.182
(0.13) (-0.02) (4.87) (3.91) (-2.41) (-1.77) (1.25) (1.09)
High_ILLIQ 1.095*** 1.197*** 0.077 1.173*** 0.286 0.331** -0.325 0.252**
(3.08) (4.77) (0.18) (4.81) (0.82) (2.27) (-0.78) (1.98)
IML 1.027* 1.201*** -0.924** 0.512** 1.299** 1.100*** -0.396 0.070
(1.78) (3.97) (-2.23) (2.12) (2.47) (2.70) (-0.95) (0.36)

Internet Appendix Page 1
Internet Appendix
Investor Heterogeneity and Liquidity

Internet Appendix Page 2
Table IA1: Investor Heterogeneity and Return Volatility
This table presents the results of the following quarterly Fama-MacBeth regressions, as well as their
corresponding Newey-West adjusted t-statistics,
𝑅𝐸𝑇𝑉𝑂𝐿𝑖,𝑞 = 𝛼0 + 𝛽1𝑆𝑇𝐷𝐶𝑅𝑖,𝑞−1 + 𝑐𝑀𝑖,𝑞−1 + 𝑒𝑖,𝑞,
where 𝑅𝐸𝑇𝑉𝑂𝐿𝑖,𝑞 refers to the return volatility of stock 𝑖 in quarter 𝑞, computed as the standard deviation
of daily stock returns in that quarter. 𝑆𝑇𝐷𝐶𝑅𝑖,𝑞−1 refers to the investor heterogeneity in investment horizon,
and the vector M stacks all other control variables, including the Log(Size), Log(BM), RETQ1, RETQ2-4,
Num_Fund, IO, LOGILLIQ, 1/TURN, LOGCVILLIQ and LOGCVTURN. AR(1) refers to the lagged
dependent variable. Models 1 to 4 report the regression results over the entire sample period from 1982 to
2016, and models 5 to 8 report similar statistics in the sub-period from 2000 to 2016. Appendix A provides
detailed definitions for each variable. Numbers with “*”, “**” and “***” are significant at the 10%, 5%
and 1% level, respectively.
Stock Return Volatility Regressed on Lagged Investor Heterogeneity
1982 – 2016 2000 – 2016
Model 1 Model 2 Model 3 Model 4 Model 5 Model 6 Model 7 Model 8
STDCR -0.034** -0.012 -0.042*** -0.024* -0.051** -0.039* -0.057** -0.047**
(-2.46) (-0.89) (-3.13) (-1.85) (-2.34) (-1.91) (-2.59) (-2.31)
Log (Size) -0.069*** -0.040*** -0.092*** -0.087*** -0.078*** -0.042*** -0.089*** -0.086***
(-10.28) (-5.59) (-15.30) (-20.54) (-7.51) (-4.05) (-8.26) (-10.88)
Log (BM) -0.025* -0.027** -0.025* -0.028** 0.022 0.018 0.018 0.015
(-1.82) (-2.02) (-1.87) (-2.11) (1.08) (0.93) (0.91) (0.76)
RETQ1 -0.415*** -0.421*** -0.417*** -0.414*** -0.275** -0.286** -0.292** -0.287**
(-6.09) (-6.28) (-6.25) (-6.24) (-2.25) (-2.38) (-2.42) (-2.40)
RETQ2-4 -0.012 -0.009 -0.011 -0.010 0.011 0.014 0.016 0.015
(-0.44) (-0.32) (-0.41) (-0.37) (0.24) (0.31) (0.37) (0.34)
Num_Fund 0.252*** 0.188*** 0.108*** 0.119***
(5.39) (4.26) (3.98) (3.63)
IO 0.178*** 0.151*** 0.211*** 0.184***
(8.65) (7.46) (7.30) (6.41)
LOGILLIQ 0.003 0.022*** -0.008 0.021***
(0.52) (3.70) (-1.19) (2.96)
1/TURN 0.002*** 0.003*** 0.003*** 0.004***
(3.30) (4.74) (3.51) (5.47)
LOGCVILLIQ -0.041*** -0.054*** -0.082*** -0.089***
(-3.12) (-4.44) (-4.36) (-4.86)
LOGCVTURN -0.169*** -0.161*** -0.211*** -0.191***
(-14.90) (-15.92) (-16.82) (-14.71)
AR (1) 0.634*** 0.631*** 0.642*** 0.641*** 0.605*** 0.599*** 0.618*** 0.614***
(51.54) (50.10) (50.91) (50.13) (39.81) (39.57) (42.98) (43.47)
Intercept 1.188*** 1.018*** 1.284*** 1.189*** 1.329*** 1.134*** 1.336*** 1.235***
(21.82) (18.75) (25.77) (25.30) (16.81) (14.46) (14.99) (14.84)
Adj-Rsq 0.509 0.510 0.512 0.513 0.476 0.478 0.482 0.483
# of Quarters 140 140 140 140 68 68 68 68
Obs 228,224 228,224 228,272 228,272 100,612 100,612 100,613 100,613

Internet Appendix Page 3
Table IA2: Difference-In-Differences Estimates Around 2003 Tax Cut
Panel A presents the difference-in-differences estimates in the following quarterly panel regressions with
stock and quarter fixed effects and their corresponding t-statistics with standard errors clustered at both the
stock and quarter level,
𝑌𝑖,𝑞 = 𝛼0 + 𝛽1𝑇𝑟𝑒𝑎𝑡𝑖,𝑞 × 𝑃𝑜𝑠𝑡𝑖,𝑞 + 𝑐𝑀𝑖,𝑞−1 + 𝛼𝑖 + 𝛾𝑞 + 𝑒𝑖,𝑞,
where the dependent variable 𝑌𝑖,𝑞 refers to investor heterogeneity in investment horizon (𝑆𝑇𝐷𝐶𝑅𝑖,𝑞), stock
illiquidity (𝐼𝐿𝐿𝐼𝑄𝑖,𝑞), and liquidity volatility (𝐶𝑉𝐼𝐿𝐿𝐼𝑄𝑖,𝑞) of stock 𝑖 in quarter 𝑞, 𝑇𝑟𝑒𝑎𝑡𝑖,𝑞 is a dummy
variable that takes the value of one if stock 𝑖 consistently pays dividends in the three years prior to the 2003
Tax Cut (treatment group) and zero for the control group, 𝑃𝑜𝑠𝑡𝑖,𝑞 is a dummy variable that takes the value
one within three years after the tax cut (2004 – 2006) and zero for three years before the tax cut (2000 –
2002), and the vector M stacks all other control variables, including the Log(Size), Log(BM), Log(RetVol),
RETQ1, RETQ2-4, IO, ROA, Leverage and IVOL. 𝛼𝑖 and 𝛾𝑞 refer to the stock and quarter fixed effects,
respectively. Panels B and C report similar statistics in subsamples with high and low ∆𝑆𝑇𝐷𝐶𝑅 ,
respectively. ∆𝑆𝑇𝐷𝐶𝑅 refers to the change in average quarterly 𝑆𝑇𝐷𝐶𝑅 from three years before to three
years after the tax cut, and high (low) ∆𝑆𝑇𝐷𝐶𝑅 subsample consists of stocks with above (below) median
∆𝑆𝑇𝐷𝐶𝑅. Appendix A provides detailed definitions for each variable. Numbers with “*”, “**” and “***”
are significant at the 10%, 5% and 1% level, respectively.
Panel A: Difference-In-Differences Estimates Around 2003 Tax Cut
STDCR LOGILLIQ 1/TURN LOGCVILLIQ LOGCVTURN
Model 1 Model 2 Model 3 Model 4 Model 5
Treat × Post 0.010* -0.080*** -2.588*** 0.004 -0.051**
(1.86) (-3.12) (-7.26) (0.34) (-2.67)
Log (Size) -0.001 -1.221*** -1.317*** -0.132*** -0.097***
(-0.19) (-47.88) (-5.83) (-13.45) (-7.93)
Log (BM) 0.029*** 0.211*** 1.817*** -0.002 0.034*
(6.53) (5.05) (3.29) (-0.18) (1.85)
Log (RetVol) 0.001 0.014 -1.243* -0.064*** -0.081***
(0.09) (0.49) (-1.90) (-3.89) (-4.47)
RETQ1 -0.004 0.022 1.096 0.021 -0.044*
(-0.49) (0.34) (1.47) (0.76) (-1.87)
RETQ2-4 -0.008*** -0.079** -0.751** -0.007 0.003
(-3.47) (-2.43) (-2.58) (-0.81) (0.23)
IO 0.026*** -1.658*** 0.751 -0.223*** -0.247***
(3.03) (-9.79) (0.53) (-5.95) (-4.75)
ROA -0.012 -1.790*** -4.452* -0.285*** -0.189**
(-0.49) (-9.95) (-1.94) (-5.79) (-2.27)
Leverage 0.019 -0.411*** -2.340* -0.042 0.057
(1.21) (-5.66) (-1.82) (-1.66) (1.31)
IVOL 0.013*** 0.012 0.133 -0.010 -0.019**
(3.56) (0.60) (0.56) (-1.32) (-2.25)
Adj-Rsq 0.622 0.966 0.656 0.688 0.649
Obs 8,828 8,828 8,828 8,828 8,828

Internet Appendix Page 4
Table IA2—Continued
Panel B: Difference-In-Differences Estimates Around 2003 Tax Cut (High ∆STDCR)
STDCR LOGILLIQ 1/TURN LOGCVILLIQ LOGCVTURN
Model 1 Model 2 Model 3 Model 4 Model 5
Treat × Post 0.060*** -0.298** -3.245*** -0.073** -0.117***
(5.83) (-2.74) (-3.00) (-2.40) (-3.35)
Log (Size) -0.003 -1.248*** -1.813 -0.124*** -0.091***
(-0.50) (-17.32) (-1.46) (-5.97) (-3.26)
Log (BM) 0.031** 0.215** 1.317 0.001 0.048
(2.37) (2.64) (1.41) (0.06) (1.45)
Log (RetVol) 0.009 0.078 -1.290 -0.034 -0.040*
(0.91) (1.16) (-1.68) (-1.68) (-1.87)
RETQ1 0.001 0.027 1.695 0.008 -0.059**
(0.08) (0.29) (1.33) (0.24) (-2.37)
RETQ2-4 -0.008 -0.084 -0.838 -0.009 -0.009
(-1.44) (-1.31) (-1.55) (-0.56) (-0.47)
IO 0.010 -1.809*** -1.039 -0.173* -0.187*
(0.34) (-5.57) (-0.40) (-2.02) (-1.88)
ROA 0.096 -1.616*** -3.053 -0.443*** 0.032
(1.26) (-3.54) (-0.42) (-3.47) (0.16)
Leverage 0.054 -0.097 -0.367 -0.003 0.212
(1.13) (-0.27) (-0.15) (-0.03) (1.69)
IVOL 0.008 -0.004 0.273 -0.015 -0.016
(0.80) (-0.06) (0.46) (-1.07) (-0.87)
Adj-Rsq 0.694 0.966 0.624 0.702 0.635
Obs 4,208 4,208 4,208 4,208 4,208
Panel C: Difference-In-Differences Estimates Around 2003 Tax Cut (Low ∆STDCR)
STDCR LOGILLIQ 1/TURN LOGCVILLIQ LOGCVTURN
Model 1 Model 2 Model 3 Model 4 Model 5
Treat × Post -0.058*** 0.109 -1.569* 0.052 -0.007
(-5.36) (1.04) (-2.02) (1.53) (-0.17)
Log (Size) -0.002 -1.146*** -1.025* -0.145*** -0.111***
(-0.30) (-13.97) (-1.72) (-6.92) (-4.12)
Log (BM) 0.024*** 0.220*** 1.362** 0.002 0.047
(3.06) (3.11) (2.12) (0.08) (1.52)
Log (RetVol) -0.003 -0.008 -1.770*** -0.061** -0.087***
(-0.41) (-0.18) (-3.93) (-2.46) (-2.89)
RETQ1 -0.004 -0.019 0.725 0.022 -0.047
(-0.39) (-0.26) (1.22) (0.77) (-1.37)
RETQ2-4 -0.003 -0.062 -0.172 -0.015 0.020
(-0.48) (-1.39) (-0.59) (-1.28) (1.04)
IO 0.048 -1.744*** 1.416 -0.315*** -0.302**
(1.63) (-5.35) (0.50) (-3.35) (-2.50)
ROA -0.011 -1.774*** -10.469** -0.106 -0.180
(-0.22) (-3.64) (-2.23) (-0.82) (-1.16)
Leverage -0.003 -0.169 -0.794 -0.108 0.024
(-0.09) (-0.56) (-0.28) (-1.41) (0.19)
IVOL 0.010 0.041 0.088 -0.004 -0.030*
(1.32) (1.23) (0.22) (-0.31) (-1.78)
Adj-Rsq 0.563 0.968 0.663 0.681 0.647
Obs 4,395 4,395 4,395 4,395 4,395

Internet Appendix Page 5
Table IA3: Stock Performance Around Extreme Fund Flows
At the end of quarter 𝑞, stocks are first sorted into 5 × 10 portfolios according to their lagged return between
quarter 𝑞 − 8 and 𝑞 − 5 (quintiles) and price pressure between quarter 𝑞 − 4 and 𝑞 − 1 (deciles). Within
each past return-price pressure group, stocks are further sorted into quintiles according to their lagged
investor heterogeneity in investment horizon in quarter 𝑞. The Low (High) price pressure portfolio is
comprised of the bottom (top) decile of stocks based on the quarterly average price pressure between quarter
𝑞 − 4 and 𝑞 − 1, indicating stocks experiencing outflow-induced sales (inflow-induced purchases). The
Low (High) investor heterogeneity portfolio is comprised of the bottom (top) quintile of stocks based on
the investor heterogeneity in quarter 𝑞 and is labeled as “Low_IH” (“High_IH”). This table reports, for
each past return-investor heterogeneity group and all firms, the value-weighted average monthly return in
the holding period (quarter 𝑞 + 1 to 𝑞 + 4) for the investment strategy of going long (short) the Low (High)
price pressure stocks, as well as the investment strategy of going long (short) the High (Low) investor
heterogeneity stocks (“HML_IH”). Stock returns are further adjusted by a five-factor model comprising the
three Fama-French factors (market, size and book-to-market), the Carhart momentum factor, and the Pástor-
Stambaugh liquidity factor. The price pressure is proxied by Pressure_1 in Panel A and Pressure_2 in Panel
B, respectively. The profits are reported for the full sample from 1982 to 2016. Appendix A provides the
detailed definition of each variable. Newey-West adjusted t-statistics are shown in parentheses. Numbers
with “*”, “**” and “***” are significant at the 10%, 5% and 1% level, respectively.

Internet Appendix Page 6
Table IA3—Continued
Panel A: Returns (in %) Sorted by Extreme Flow-induced Mutual Fund Transactions (Pressure_1), Past Performance, and Investor Heterogeneity
Rank of
STDCR
Return Five-Factor adjusted Return
Rank of Past Performance Full Sample Rank of Past Performance
Full Sample Low 2 3 4 High Low 2 3 4 High
Low_IH 0.527* 0.673*** 1.065*** 0.845*** -0.404 0.627*** 0.470* 0.760*** 0.881*** 0.759*** -0.334 0.502***
(1.88) (2.92) (4.13) (3.29) (-1.27) (3.80) (1.92) (3.53) (3.24) (2.85) (-1.07) (3.35)
2 0.476** 0.080 0.115 0.189 0.285 0.403** 0.613*** 0.108 0.089 0.325 0.288 0.355**
(2.25) (0.40) (0.68) (0.85) (1.00) (2.38) (2.94) (0.52) (0.49) (1.39) (1.07) (2.37)
3 0.302 0.465** 0.272 0.269 1.163*** 0.602*** 0.388 0.367 0.276 0.263 1.074*** 0.533***
(1.18) (2.33) (1.29) (1.37) (4.26) (3.02) (1.40) (1.63) (1.28) (1.22) (3.99) (2.94)
4 0.629*** 0.345* 0.133 0.219 0.287 0.522*** 0.591** 0.334 0.087 0.243 0.308 0.388**
(2.82) (1.74) (0.75) (0.96) (1.10) (2.81) (2.39) (1.37) (0.44) (1.10) (1.21) (2.43)
High_IH -0.227 0.014 -0.113 -0.049 0.142 0.073 -0.229 -0.016 -0.150 -0.145 0.322 0.081
(-0.77) (0.06) (-0.55) (-0.21) (0.52) (0.45) (-0.77) (-0.07) (-0.54) (-0.61) (1.18) (0.46)
HML_IH -0.754* -0.659** -1.179*** -0.893** 0.546 -0.554*** -0.700* -0.777** -1.031*** -0.905** 0.656* -0.421**
(-1.87) (-2.08) (-3.91) (-2.37) (1.41) (-2.97) (-1.78) (-2.44) (-3.17) (-2.29) (1.70) (-2.17)
Panel B: Returns (in %) Sorted by Flow-induced Mutual Fund Transactions (Pressure_2), Past Performance, and Investor Heterogeneity
Rank of
STDCR
Return Five-Factor adjusted Return
Rank of Past Performance Full Sample Rank of Past Performance
Full Sample Low 2 3 4 High Low 2 3 4 High
Low_IH 1.221*** 0.958*** 1.000*** 0.993*** 1.086*** 1.091*** 1.110*** 0.912*** 0.935*** 1.011*** 1.070*** 0.965***
(3.91) (4.80) (3.49) (3.52) (3.32) (5.73) (4.09) (4.41) (3.16) (3.25) (3.35) (5.53)
2 0.840*** 0.835*** 0.783*** 0.587*** 1.391*** 1.073*** 1.033*** 0.865*** 0.773*** 0.746*** 1.395*** 1.054***
(3.56) (3.40) (3.61) (2.62) (5.06) (4.76) (4.36) (3.53) (3.42) (3.24) (5.18) (5.78)
3 0.939*** 0.606*** 0.407** 0.485** 1.266*** 0.898*** 0.986*** 0.645*** 0.402* 0.428* 1.260*** 0.842***
(3.99) (2.68) (2.06) (2.13) (3.90) (4.00) (3.88) (2.62) (1.85) (1.84) (4.09) (3.93)
4 1.221*** 0.425** 0.558*** 0.666*** 0.970*** 0.925*** 1.231*** 0.523** 0.531** 0.679*** 0.965*** 0.842***
(4.62) (2.06) (2.75) (2.72) (2.63) (4.65) (4.47) (2.21) (2.58) (2.79) (2.94) (4.77)
High_IH 0.562** 0.154 0.411* 0.302 1.034*** 0.348* 0.820*** 0.229 0.480** 0.418* 1.120*** 0.480***
(2.06) (0.75) (1.75) (1.19) (3.10) (1.85) (2.80) (1.07) (2.05) (1.75) (3.50) (2.62)
HML_IH -0.659* -0.804*** -0.589 -0.691* -0.052 -0.743*** -0.290 -0.683** -0.455 -0.593 0.050 -0.485**
(-1.78) (-2.91) (-1.61) (-1.94) (-0.11) (-3.34) (-0.77) (-2.45) (-1.24) (-1.50) (0.12) (-2.12)
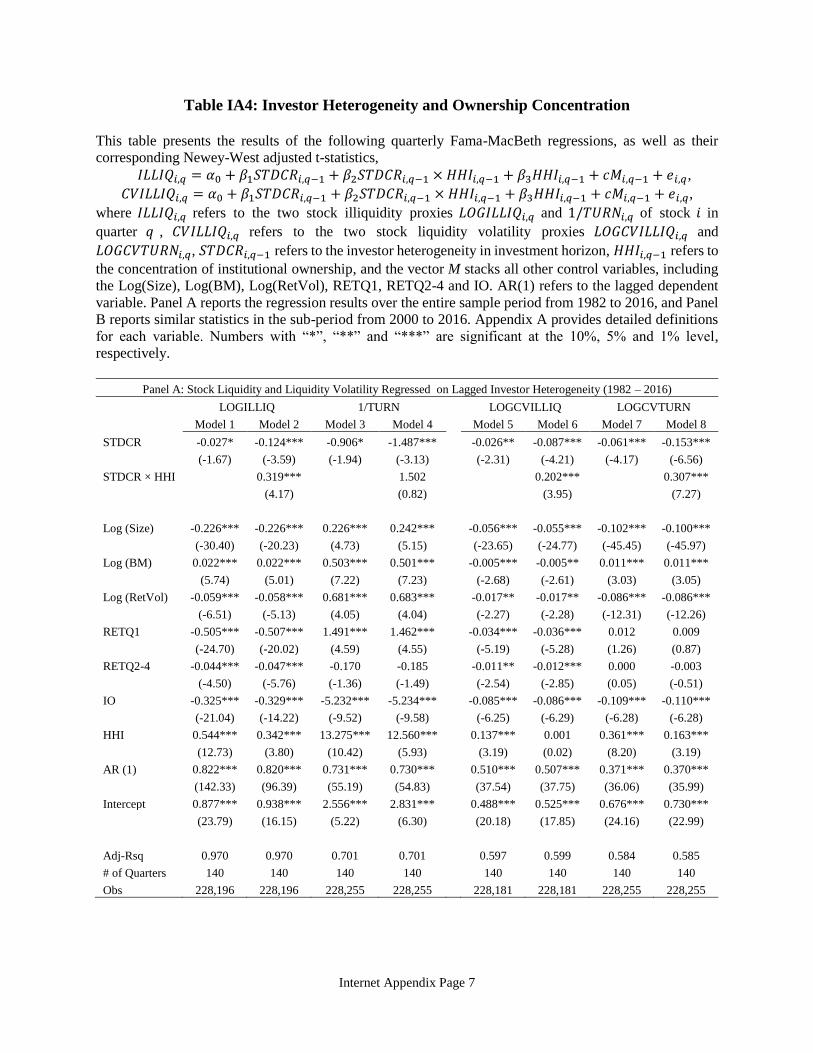
Internet Appendix Page 7
Table IA4: Investor Heterogeneity and Ownership Concentration
This table presents the results of the following quarterly Fama-MacBeth regressions, as well as their
corresponding Newey-West adjusted t-statistics,
𝐼𝐿𝐿𝐼𝑄𝑖,𝑞 = 𝛼0 + 𝛽1𝑆𝑇𝐷𝐶𝑅𝑖,𝑞−1 + 𝛽2𝑆𝑇𝐷𝐶𝑅𝑖,𝑞−1 × 𝐻𝐻𝐼𝑖,𝑞−1 + 𝛽3𝐻𝐻𝐼𝑖,𝑞−1 + 𝑐𝑀𝑖,𝑞−1 + 𝑒𝑖,𝑞,
𝐶𝑉𝐼𝐿𝐿𝐼𝑄𝑖,𝑞 = 𝛼0 + 𝛽1𝑆𝑇𝐷𝐶𝑅𝑖,𝑞−1 + 𝛽2𝑆𝑇𝐷𝐶𝑅𝑖,𝑞−1 × 𝐻𝐻𝐼𝑖,𝑞−1 + 𝛽3𝐻𝐻𝐼𝑖,𝑞−1 + 𝑐𝑀𝑖,𝑞−1 + 𝑒𝑖,𝑞,
where 𝐼𝐿𝐿𝐼𝑄𝑖,𝑞 refers to the two stock illiquidity proxies 𝐿𝑂𝐺𝐼𝐿𝐿𝐼𝑄𝑖,𝑞 and 1/𝑇𝑈𝑅𝑁𝑖,𝑞 of stock 𝑖 in
quarter 𝑞 , 𝐶𝑉𝐼𝐿𝐿𝐼𝑄𝑖,𝑞 refers to the two stock liquidity volatility proxies 𝐿𝑂𝐺𝐶𝑉𝐼𝐿𝐿𝐼𝑄𝑖,𝑞 and
𝐿𝑂𝐺𝐶𝑉𝑇𝑈𝑅𝑁𝑖,𝑞, 𝑆𝑇𝐷𝐶𝑅𝑖,𝑞−1 refers to the investor heterogeneity in investment horizon, 𝐻𝐻𝐼𝑖,𝑞−1 refers to
the concentration of institutional ownership, and the vector M stacks all other control variables, including
the Log(Size), Log(BM), Log(RetVol), RETQ1, RETQ2-4 and IO. AR(1) refers to the lagged dependent
variable. Panel A reports the regression results over the entire sample period from 1982 to 2016, and Panel
B reports similar statistics in the sub-period from 2000 to 2016. Appendix A provides detailed definitions
for each variable. Numbers with “*”, “**” and “***” are significant at the 10%, 5% and 1% level,
respectively.
Panel A: Stock Liquidity and Liquidity Volatility Regressed on Lagged Investor Heterogeneity (1982 – 2016)
LOGILLIQ 1/TURN LOGCVILLIQ LOGCVTURN
Model 1 Model 2 Model 3 Model 4 Model 5 Model 6 Model 7 Model 8
STDCR -0.027* -0.124*** -0.906* -1.487*** -0.026** -0.087*** -0.061*** -0.153***
(-1.67) (-3.59) (-1.94) (-3.13) (-2.31) (-4.21) (-4.17) (-6.56)
STDCR × HHI 0.319*** 1.502 0.202*** 0.307***
(4.17) (0.82) (3.95) (7.27)
Log (Size) -0.226*** -0.226*** 0.226*** 0.242*** -0.056*** -0.055*** -0.102*** -0.100***
(-30.40) (-20.23) (4.73) (5.15) (-23.65) (-24.77) (-45.45) (-45.97)
Log (BM) 0.022*** 0.022*** 0.503*** 0.501*** -0.005*** -0.005** 0.011*** 0.011***
(5.74) (5.01) (7.22) (7.23) (-2.68) (-2.61) (3.03) (3.05)
Log (RetVol) -0.059*** -0.058*** 0.681*** 0.683*** -0.017** -0.017** -0.086*** -0.086***
(-6.51) (-5.13) (4.05) (4.04) (-2.27) (-2.28) (-12.31) (-12.26)
RETQ1 -0.505*** -0.507*** 1.491*** 1.462*** -0.034*** -0.036*** 0.012 0.009
(-24.70) (-20.02) (4.59) (4.55) (-5.19) (-5.28) (1.26) (0.87)
RETQ2-4 -0.044*** -0.047*** -0.170 -0.185 -0.011** -0.012*** 0.000 -0.003
(-4.50) (-5.76) (-1.36) (-1.49) (-2.54) (-2.85) (0.05) (-0.51)
IO -0.325*** -0.329*** -5.232*** -5.234*** -0.085*** -0.086*** -0.109*** -0.110***
(-21.04) (-14.22) (-9.52) (-9.58) (-6.25) (-6.29) (-6.28) (-6.28)
HHI 0.544*** 0.342*** 13.275*** 12.560*** 0.137*** 0.001 0.361*** 0.163***
(12.73) (3.80) (10.42) (5.93) (3.19) (0.02) (8.20) (3.19)
AR (1) 0.822*** 0.820*** 0.731*** 0.730*** 0.510*** 0.507*** 0.371*** 0.370***
(142.33) (96.39) (55.19) (54.83) (37.54) (37.75) (36.06) (35.99)
Intercept 0.877*** 0.938*** 2.556*** 2.831*** 0.488*** 0.525*** 0.676*** 0.730***
(23.79) (16.15) (5.22) (6.30) (20.18) (17.85) (24.16) (22.99)
Adj-Rsq 0.970 0.970 0.701 0.701 0.597 0.599 0.584 0.585
# of Quarters 140 140 140 140 140 140 140 140
Obs 228,196 228,196 228,255 228,255 228,181 228,181 228,255 228,255

Internet Appendix Page 8
Table IA4—Continued
Panel B: Stock Liquidity and Liquidity Volatility Regressed on Lagged Investor Heterogeneity (2000 – 2016)
LOGILLIQ 1/TURN LOGCVILLIQ LOGCVTURN
Model 1 Model 2 Model 3 Model 4 Model 5 Model 6 Model 7 Model 8
STDCR -0.071** -0.172*** -1.170*** -1.992*** -0.024 -0.072* -0.075*** -0.182***
(-2.33) (-2.97) (-3.62) (-3.35) (-1.38) (-1.84) (-2.97) (-4.37)
STDCR × HHI 0.336*** 2.732** 0.150 0.357***
(2.83) (2.46) (1.66) (4.70)
Log (Size) -0.266*** -0.266*** 0.055** 0.078*** -0.046*** -0.045*** -0.102*** -0.100***
(-16.84) (-17.07) (2.34) (2.70) (-23.95) (-15.52) (-35.70) (-38.75)
Log (BM) 0.036*** 0.036*** 0.351*** 0.350*** 0.001 0.001 -0.002 -0.002
(7.61) (7.70) (5.92) (5.93) (0.31) (0.31) (-0.47) (-0.53)
Log (RetVol) -0.095*** -0.093*** 0.386** 0.389* -0.040*** -0.040*** -0.085*** -0.084***
(-7.36) (-7.24) (2.00) (1.99) (-8.21) (-5.57) (-11.37) (-11.09)
RETQ1 -0.495*** -0.499*** 0.506*** 0.460** -0.041*** -0.043*** 0.013 0.007
(-15.39) (-15.31) (2.78) (2.44) (-4.25) (-5.05) (0.85) (0.45)
RETQ2-4 -0.051*** -0.054*** -0.295*** -0.310*** -0.014** -0.016** 0.003 -0.001
(-4.07) (-4.36) (-2.77) (-2.82) (-2.34) (-2.11) (0.40) (-0.18)
IO -0.418*** -0.424*** -3.453*** -3.473*** -0.140*** -0.142*** -0.174*** -0.174***
(-13.09) (-13.31) (-7.79) (-7.76) (-19.57) (-14.60) (-14.30) (-13.96)
HHI 0.838*** 0.610*** 10.182*** 8.417*** 0.346*** 0.236** 0.571*** 0.339***
(8.48) (4.19) (12.29) (7.98) (11.67) (2.39) (13.47) (4.17)
AR (1) 0.793*** 0.791*** 0.719*** 0.718*** 0.529*** 0.525*** 0.325*** 0.323***
(67.88) (68.99) (44.33) (44.09) (40.04) (25.06) (37.06) (37.43)
Intercept 1.039*** 1.104*** 3.024*** 3.470*** 0.409*** 0.440*** 0.611*** 0.673***
(12.66) (12.19) (7.00) (6.22) (16.87) (8.49) (12.34) (11.33)
Adj-Rsq 0.976 0.976 0.753 0.753 0.686 0.687 0.614 0.615
# of Quarters 68 68 68 68 68 68 68 68
Obs 100,613 100,613 100,613 100,613 100,611 100,611 100,613 100,613

Internet Appendix Page 9
Table IA5: Investor Heterogeneity, Stock Liquidity and Liquidity Volatility
Panel A presents the results of the following quarterly Fama-MacBeth regressions, as well as their
corresponding Newey-West adjusted t-statistics,
𝐼𝐿𝐿𝐼𝑄𝑖,𝑞 = 𝛼0 + 𝛽1𝑆𝑇𝐷𝑇𝑂𝑖,𝑞−1 + 𝑐𝑀𝑖,𝑞−1 + 𝑒𝑖,𝑞,
𝐶𝑉𝐼𝐿𝐿𝐼𝑄𝑖,𝑞 = 𝛼0 + 𝛽1𝑆𝑇𝐷𝑇𝑂𝑖,𝑞−1 + 𝑐𝑀𝑖,𝑞−1 + 𝑒𝑖,𝑞,
where 𝐼𝐿𝐿𝐼𝑄𝑖,𝑞 refers to the two stock illiquidity proxies 𝐿𝑂𝐺𝐼𝐿𝐿𝐼𝑄𝑖,𝑞 and 1/𝑇𝑈𝑅𝑁𝑖,𝑞 of stock 𝑖 in
quarter 𝑞 , 𝐶𝑉𝐼𝐿𝐿𝐼𝑄𝑖,𝑞 refers to the two stock liquidity volatility proxies 𝐿𝑂𝐺𝐶𝑉𝐼𝐿𝐿𝐼𝑄𝑖,𝑞 and
𝐿𝑂𝐺𝐶𝑉𝑇𝑈𝑅𝑁𝑖,𝑞 , 𝑆𝑇𝐷𝑇𝑂𝑖,𝑞−1 refers to the investor heterogeneity in investment horizon based on the
average turnover in the previous four quarters, and the vector M stacks all other control variables, including
the Log(Size), Log(BM), Log(RetVol), RETQ1, RETQ2-4, Num_Fund and IO. AR(1) refers to the lagged
dependent variable. Panel B reports similar statistics where 𝑆𝑇𝐷𝑇𝑂𝑖,𝑞−1 is constructed using the turnover
in the previous quarter (models 1 to 4) or the average turnover in the previous two quarters (models 5 to 8).
The sample period is from 1982 to 2016. Appendix A provides detailed definitions for each variable.
Numbers with “*”, “**” and “***” are significant at the 10%, 5% and 1% level, respectively.
Panel A: Stock Liquidity and Liquidity Volatility Regressed on Lagged Investor Heterogeneity
LOGILLIQ 1/TURN LOGCVILLIQ LOGCVTURN
Model 1 Model 2 Model 3 Model 4 Model 5 Model 6 Model 7 Model 8
STDTO -0.017*** -0.011** -0.410*** -0.365*** -0.008** -0.007* -0.021*** -0.019***
(-4.79) (-2.44) (-3.00) (-2.97) (-2.57) (-1.91) (-3.98) (-3.98)
Log (Size) -0.213*** -0.213*** -0.659*** -0.168*** -0.066*** -0.056*** -0.120*** -0.105***
(-21.08) (-21.99) (-9.62) (-3.56) (-14.90) (-32.12) (-18.17) (-48.00)
Log (BM) 0.024*** 0.024*** 0.485*** 0.546*** -0.004* -0.004** 0.014*** 0.013***
(5.37) (5.35) (6.89) (7.58) (-1.97) (-2.20) (4.14) (3.80)
Log (RetVol) -0.088*** -0.062*** 0.482*** 0.718*** -0.020** -0.014* -0.097*** -0.086***
(-7.11) (-5.53) (3.00) (4.39) (-2.38) (-1.97) (-13.01) (-11.88)
RETQ1 -0.496*** -0.507*** 2.419*** 1.992*** -0.029*** -0.038*** 0.031*** 0.017*
(-20.56) (-20.78) (6.53) (5.55) (-4.03) (-5.45) (2.88) (1.78)
RETQ2-4 -0.020** -0.039*** 0.209 0.015 -0.004 -0.011** 0.010* 0.002
(-2.27) (-4.75) (1.45) (0.11) (-1.00) (-2.60) (1.80) (0.40)
Num_Fund 0.115** 0.847* -0.050 -0.060
(2.03) (1.85) (-0.92) (-0.83)
IO -0.354*** -6.192*** -0.101*** -0.159***
(-14.57) (-10.37) (-5.99) (-7.05)
AR (1) 0.870*** 0.843*** 0.795*** 0.771*** 0.527*** 0.523*** 0.399*** 0.389***
(144.78) (128.54) (63.41) (60.90) (34.06) (33.79) (46.76) (42.55)
Intercept 0.904*** 0.957*** 6.771*** 6.589*** 0.525*** 0.503*** 0.785*** 0.758***
(18.45) (19.74) (10.77) (11.22) (22.45) (32.68) (25.83) (38.90)
Adj-Rsq 0.969 0.969 0.689 0.693 0.593 0.594 0.575 0.577
# of Quarters 140 140 140 140 140 140 140 140
Obs 228,196 228,196 228,255 228,255 228,181 228,181 228,255 228,255
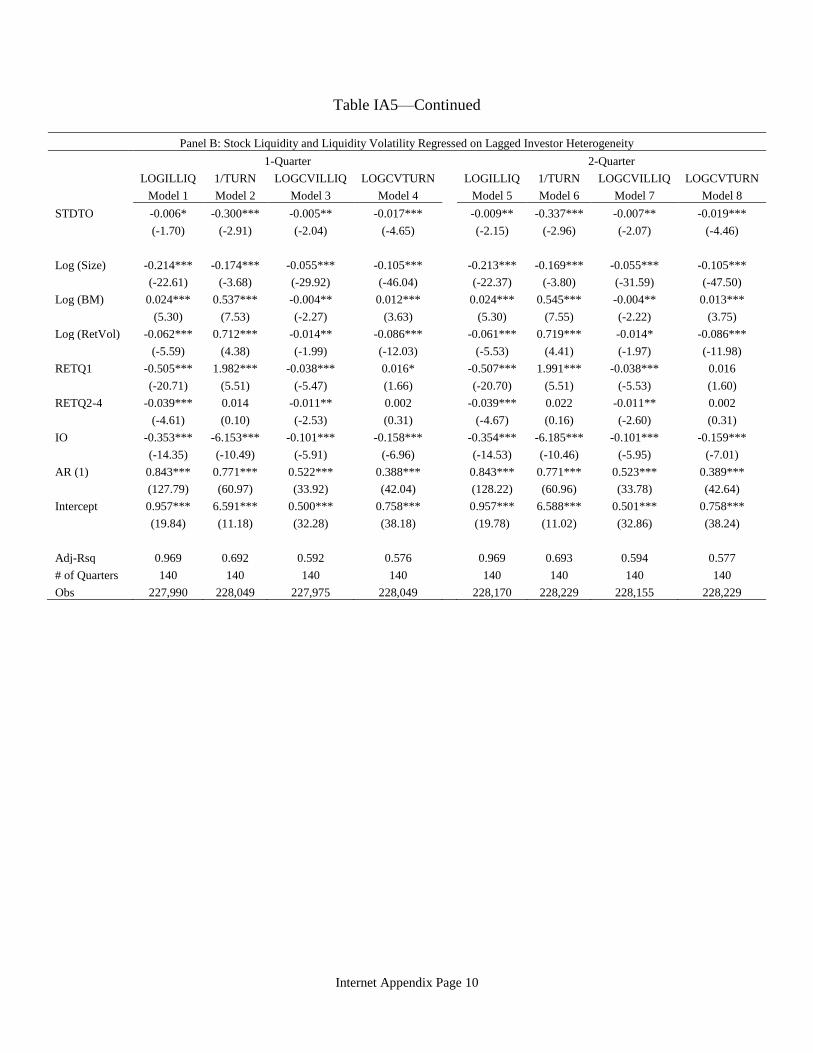
Internet Appendix Page 10
Table IA5—Continued
Panel B: Stock Liquidity and Liquidity Volatility Regressed on Lagged Investor Heterogeneity
1-Quarter 2-Quarter
LOGILLIQ 1/TURN LOGCVILLIQ LOGCVTURN LOGILLIQ 1/TURN LOGCVILLIQ LOGCVTURN
Model 1 Model 2 Model 3 Model 4 Model 5 Model 6 Model 7 Model 8
STDTO -0.006* -0.300*** -0.005** -0.017*** -0.009** -0.337*** -0.007** -0.019***
(-1.70) (-2.91) (-2.04) (-4.65) (-2.15) (-2.96) (-2.07) (-4.46)
Log (Size) -0.214*** -0.174*** -0.055*** -0.105*** -0.213*** -0.169*** -0.055*** -0.105***
(-22.61) (-3.68) (-29.92) (-46.04) (-22.37) (-3.80) (-31.59) (-47.50)
Log (BM) 0.024*** 0.537*** -0.004** 0.012*** 0.024*** 0.545*** -0.004** 0.013***
(5.30) (7.53) (-2.27) (3.63) (5.30) (7.55) (-2.22) (3.75)
Log (RetVol) -0.062*** 0.712*** -0.014** -0.086*** -0.061*** 0.719*** -0.014* -0.086***
(-5.59) (4.38) (-1.99) (-12.03) (-5.53) (4.41) (-1.97) (-11.98)
RETQ1 -0.505*** 1.982*** -0.038*** 0.016* -0.507*** 1.991*** -0.038*** 0.016
(-20.71) (5.51) (-5.47) (1.66) (-20.70) (5.51) (-5.53) (1.60)
RETQ2-4 -0.039*** 0.014 -0.011** 0.002 -0.039*** 0.022 -0.011** 0.002
(-4.61) (0.10) (-2.53) (0.31) (-4.67) (0.16) (-2.60) (0.31)
IO -0.353*** -6.153*** -0.101*** -0.158*** -0.354*** -6.185*** -0.101*** -0.159***
(-14.35) (-10.49) (-5.91) (-6.96) (-14.53) (-10.46) (-5.95) (-7.01)
AR (1) 0.843*** 0.771*** 0.522*** 0.388*** 0.843*** 0.771*** 0.523*** 0.389***
(127.79) (60.97) (33.92) (42.04) (128.22) (60.96) (33.78) (42.64)
Intercept 0.957*** 6.591*** 0.500*** 0.758*** 0.957*** 6.588*** 0.501*** 0.758***
(19.84) (11.18) (32.28) (38.18) (19.78) (11.02) (32.86) (38.24)
Adj-Rsq 0.969 0.692 0.592 0.576 0.969 0.693 0.594 0.577
# of Quarters 140 140 140 140 140 140 140 140
Obs 227,990 228,049 227,975 228,049 228,170 228,229 228,155 228,229

Internet Appendix Page 11
Table IA6: Investor Heterogeneity and Illiquidity Premium: Fama-MacBeth Regressions
This table presents the results of the following quarterly Fama-MacBeth regressions, as well as their
corresponding Newey-West adjusted t-statistics,
𝑃𝑒𝑟𝑓𝑖,𝑞 = 𝛼0 + 𝛽1𝐷𝑢𝑚𝑚𝑦(𝑆𝑇𝐷𝐶𝑅)𝑖,𝑞−1 + 𝛽2𝐷𝑢𝑚𝑚𝑦(𝑆𝑇𝐷𝐶𝑅)𝑖,𝑞−1 × 𝐼𝐿𝐿𝐼𝑄𝑖,𝑞−1 + 𝛽3𝐼𝐿𝐿𝐼𝑄𝑖,𝑞−1 +
𝑐𝑀𝑖,𝑞−1 + 𝑒𝑖,𝑞,
where 𝑃𝑒𝑟𝑓𝑖,𝑞 refers to the average monthly return (or DGTW-adjusted return) of stock 𝑖 in quarter 𝑞,
𝐷𝑢𝑚𝑚𝑦(𝑆𝑇𝐷𝐶𝑅)𝑖,𝑞−1 refers to two dummy variables including 𝐿𝑜𝑤 𝑆𝑇𝐷𝐶𝑅𝑖,𝑞−1 (takes a value of one if
the 𝑆𝑇𝐷𝐶𝑅𝑖,𝑞−1 is in the bottom quintile across all stocks in that quarter and zero otherwise) and
𝐻𝑖𝑔ℎ 𝑆𝑇𝐷𝐶𝑅𝑖,𝑞−1 (takes a value of one if the 𝑆𝑇𝐷𝐶𝑅𝑖,𝑞−1 is in the top quintile across all stocks in that
quarter and zero otherwise). 𝐼𝐿𝐿𝐼𝑄𝑖,𝑞−1 refers to the stock Amihud illiquidity. The vector M stacks all other
control variables, including the LOGCVILLIQ, Log(Size), Log(BM), Log(RetVol), RETQ1, RETQ2-4 and
IO. Model 1 reports the regression results on stock return, and Model 2 focuses on DGTW-adjusted return.
We skip one month between quarter 𝑞 and 𝑞 − 1. The sample period is from 1982 to 2016. Appendix A
provides detailed definitions for each variable. Numbers with “*”, “**” and “***” are significant at the
10%, 5% and 1% level, respectively.
Stock Return (in %) Regressed on Lagged Investor Heterogeneity and Liquidity
RETURN DGTW-adjusted
Model 1 Model 2
Low STDCR -0.037 -0.005
(-0.77) (-0.11)
High STDCR 0.027 0.016
(0.47) (0.26)
Low STDCR × LOGILLIQ 0.037** 0.040***
(2.43) (2.83)
High STDCR × LOGILLIQ 0.002 -0.001
(0.19) (-0.06)
LOGILLIQ 0.052* 0.040*
(1.79) (1.69)
LOGCVILLIQ -0.030 -0.031
(-0.41) (-0.46)
Log (Size) -0.147*** -0.129***
(-3.36) (-5.18)
Log (BM) -0.918*** -1.003***
(-11.41) (-13.61)
Log (RetVol) -0.468*** -0.404***
(-4.06) (-5.41)
RETQ1 -0.305 -0.619**
(-0.98) (-2.20)
RETQ2-4 0.105 -0.183
(0.58) (-1.47)
IO 0.231* 0.029
(1.82) (0.24)
Intercept 1.937*** 0.726***
(7.16) (3.22)
Adj-Rsq 0.097 0.067
# of Quarters 140 140
Obs 228,011 224,273