Embed Size (px)
Citation preview
Investor Communication
February 13, 2009
1
Update on transaction with Telenor
Business case
Financing plan
Contents
2
Update on transaction with Telenor
• On 28 October 2008, Unitech Ltd. entered into an agreement with Telenor whereby Telenor would acquire a 60% stake in Unitech Wireless via fresh equity infusion
• One of the closing conditions is the signing of definitive tower sharing and transmission agreements
• Commercial tower sharing agreements have now been signed
• Following the deal closure Unitech wireless will be managed by Telenor.
3
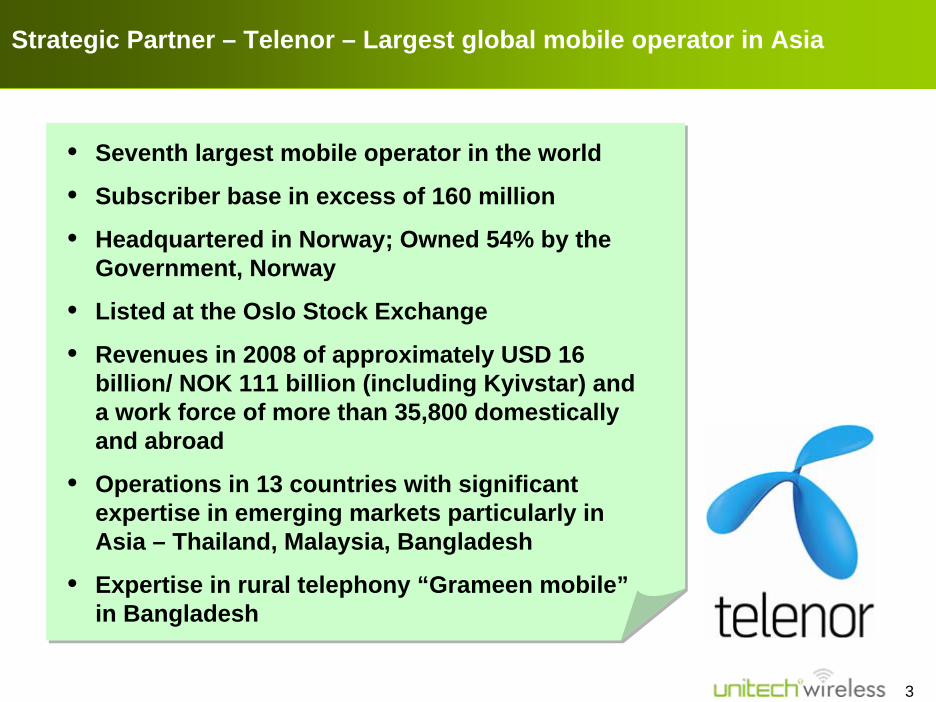
Strategic Partner – Telenor – Largest global mobile operator in Asia
• Seventh largest mobile operator in the world
• Subscriber base in excess of 160 million
• Headquartered in Norway; Owned 54% by the Government, Norway
• Listed at the Oslo Stock Exchange
• Revenues in 2008 of approximately USD 16 billion/ NOK 111 billion (including Kyivstar) and a work force of more than 35,800 domestically and abroad
• Operations in 13 countries with significant expertise in emerging markets particularly in Asia – Thailand, Malaysia, Bangladesh
• Expertise in rural telephony “Grameen mobile”in Bangladesh
4
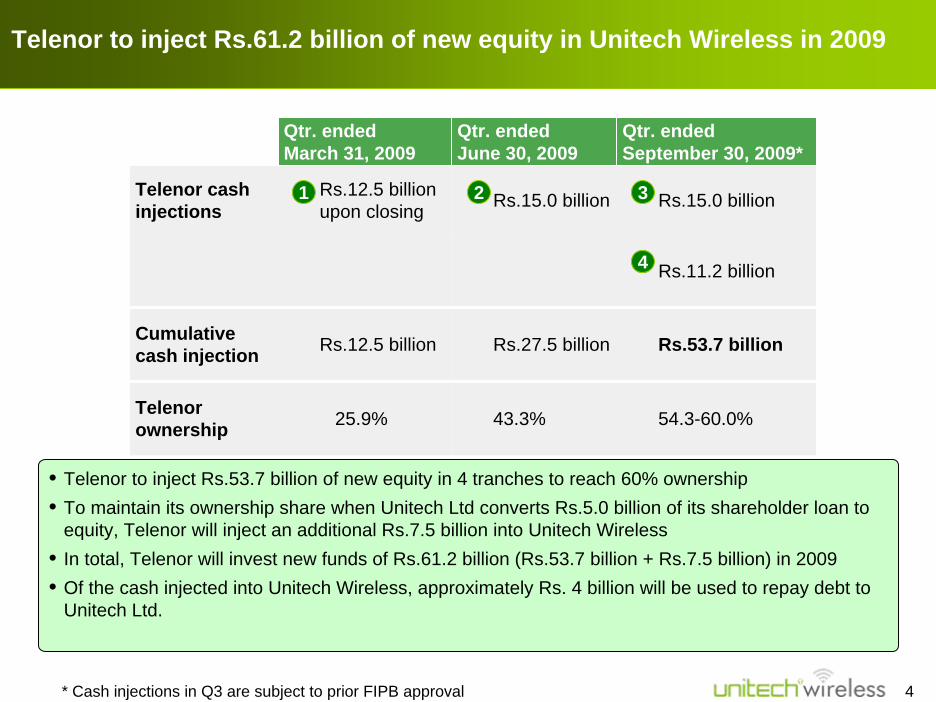
Qtr. ended March 31, 2009
Qtr. ended June 30, 2009
Qtr. ended September 30, 2009*
Telenor cash injections
Rs.12.5 billion upon closing Rs.15.0 billion Rs.15.0 billion
Rs.11.2 billion
Cumulative cash injection Rs.12.5 billion Rs.27.5 billion Rs.53.7 billion
Telenor ownership 25.9% 43.3% 54.3-60.0%
1 2 3
4
• Telenor to inject Rs.53.7 billion of new equity in 4 tranches to reach 60% ownership • To maintain its ownership share when Unitech Ltd converts Rs.5.0 billion of its shareholder loan to
equity, Telenor will inject an additional Rs.7.5 billion into Unitech Wireless • In total, Telenor will invest new funds of Rs.61.2 billion (Rs.53.7 billion + Rs.7.5 billion) in 2009• Of the cash injected into Unitech Wireless, approximately Rs. 4 billion will be used to repay debt to
Unitech Ltd.
Telenor to inject Rs.61.2 billion of new equity in Unitech Wireless in 2009
* Cash injections in Q3 are subject to prior FIPB approval
5
Impact on Unitech Limited Consolidated Balance Sheet
• Debt and Guarantees totalling INR 21 billion will be transferred to Unitech Wireless
• Approximately INR 4 billion will be paid to Unitech Limited by Unitech Wireless towards repayment of Shareholder loan.
• Unitech Limited will have an economic interest of 40% in Unitech Wireless. Based on entry valuation of Telenor, Unitech’s economic interest is valued at INR 40.80 billion.
6
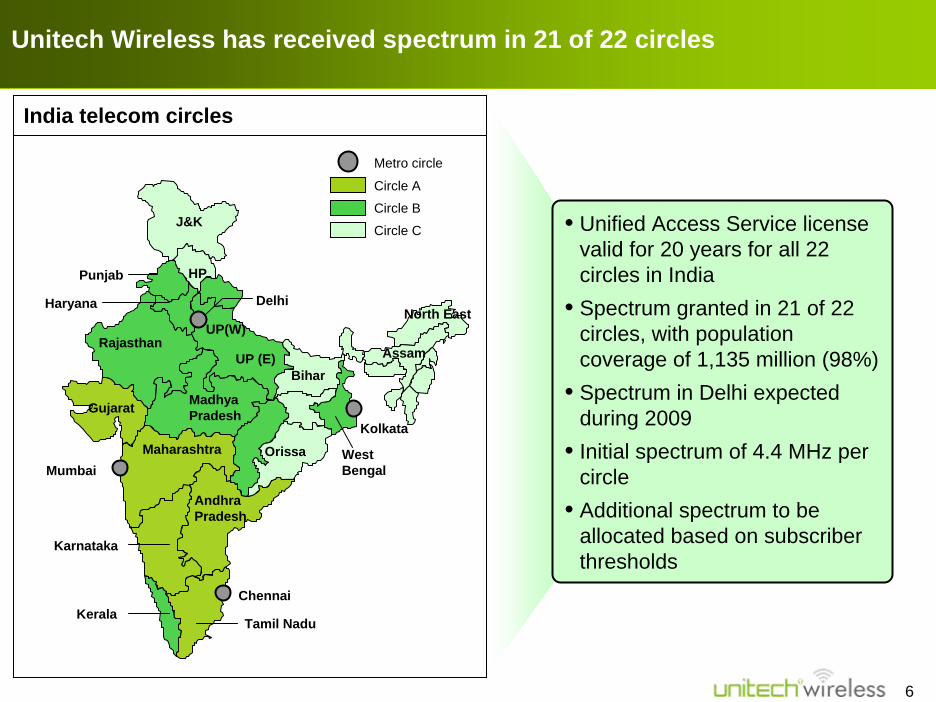
Unitech Wireless has received spectrum in 21 of 22 circles
India telecom circles
Circle A
Circle B
Circle C
Metro circle
• Unified Access Service license valid for 20 years for all 22 circles in India
• Spectrum granted in 21 of 22 circles, with population coverage of 1,135 million (98%)
• Spectrum in Delhi expected during 2009
• Initial spectrum of 4.4 MHz per circle
• Additional spectrum to be allocated based on subscriber thresholds
Mumbai
Chennai
Kolkata
UP(W)
Maharashtra
Gujarat
Andhra Pradesh
Tamil NaduKerala
Punjab
Haryana
BiharUP (E)
Rajasthan
Madhya Pradesh
West Bengal
HP
Orissa
Assam
North East
J&K
Delhi
Karnataka
7
Tower sharing agreement in place
• As announced on 11 February 2009, Unitech Wireless has signed an agreement for tower access and transmission with Wireless-TT Info Service Limited (WTTIL), the Tata Teleservices tower company and Quippo Telecom Infrastructure Limited (QTIL)
• In addition, an agreement for the provision of transmission services has been entered into with Tata Teleservices
• The tower sharing agreement covers approximately 40,000 sites, which will provide 55-60% population coverage by mid 2010
- Approx. 22,000 existing towers in place by April 2009
- Remaining towers to be built in 2009 and 2010 in accordance with needs of Unitech Wireless
• Tower sharing and transmission agreements have 20-year terms with 5-year extension options
8
Update on transaction with Telenor
Business plan
• Indian mobile market
• Market strategy
• Operational strategy
Financing plan
Contents
9
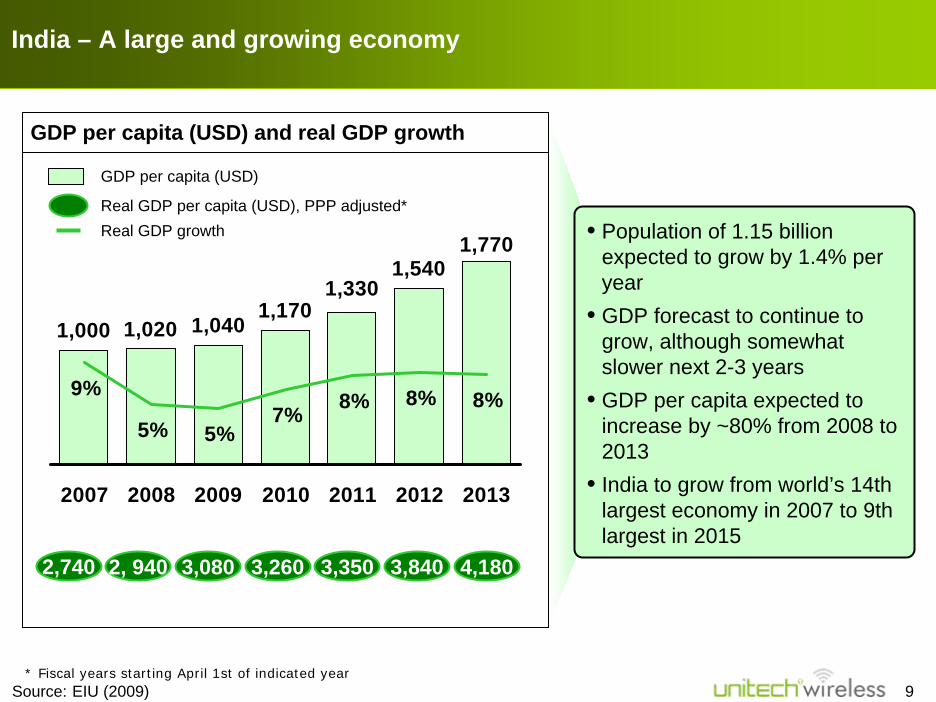
India – A large and growing economy
GDP per capita (USD) and real GDP growth
1,000 1,0401,170
1,5401,770
1,330
1,020
9%
5% 5%7% 8% 8% 8%
2007 2008 2009 2010 2011 2012 2013
Real GDP per capita (USD), PPP adjusted*
2,740 2, 940 3,080 3,260 3,350 3,840 4,180
• Population of 1.15 billion expected to grow by 1.4% per year
• GDP forecast to continue to grow, although somewhat slower next 2-3 years
• GDP per capita expected to increase by ~80% from 2008 to 2013
• India to grow from world’s 14th largest economy in 2007 to 9th largest in 2015
Source: EIU (2009)* Fiscal years starting April 1st of indicated year
Real GDP growth
GDP per capita (USD)
10
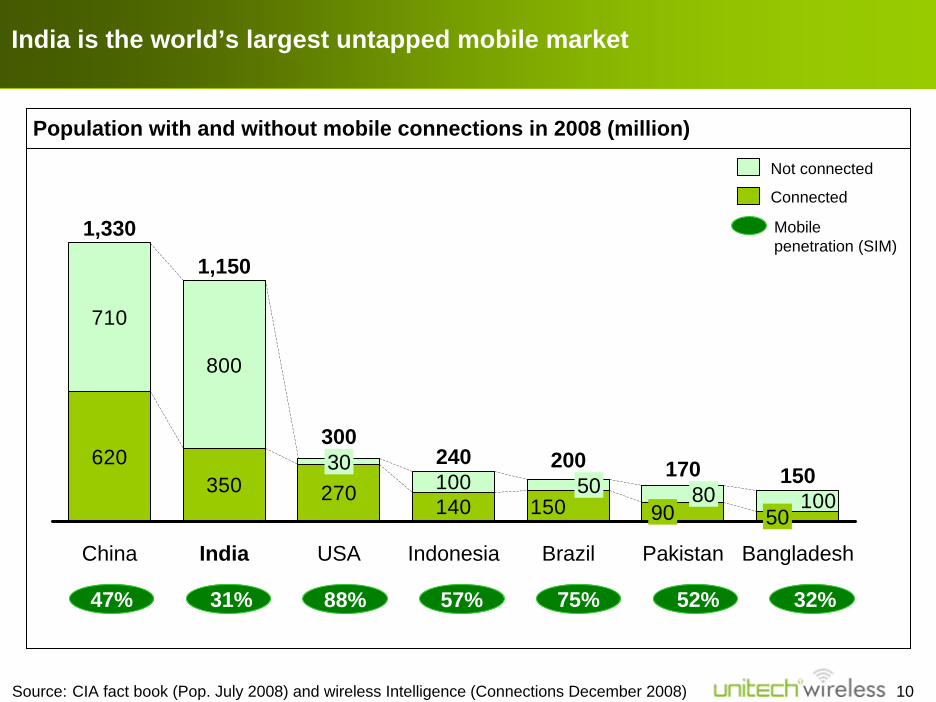
India is the world’s largest untapped mobile market
Population with and without mobile connections in 2008 (million)
47% 31% 88% 57% 52% 32%75%
620350 270 140
710
800
100150 100
300
USA
1,330
China
1,150
India
30 240
Indonesia
50200
Brazil
8090
170
Pakistan
50
150
Bangladesh
Not connected
Connected
Mobile penetration (SIM)
Source: CIA fact book (Pop. July 2008) and wireless Intelligence (Connections December 2008)
11Source: Unitech Wireless estimate
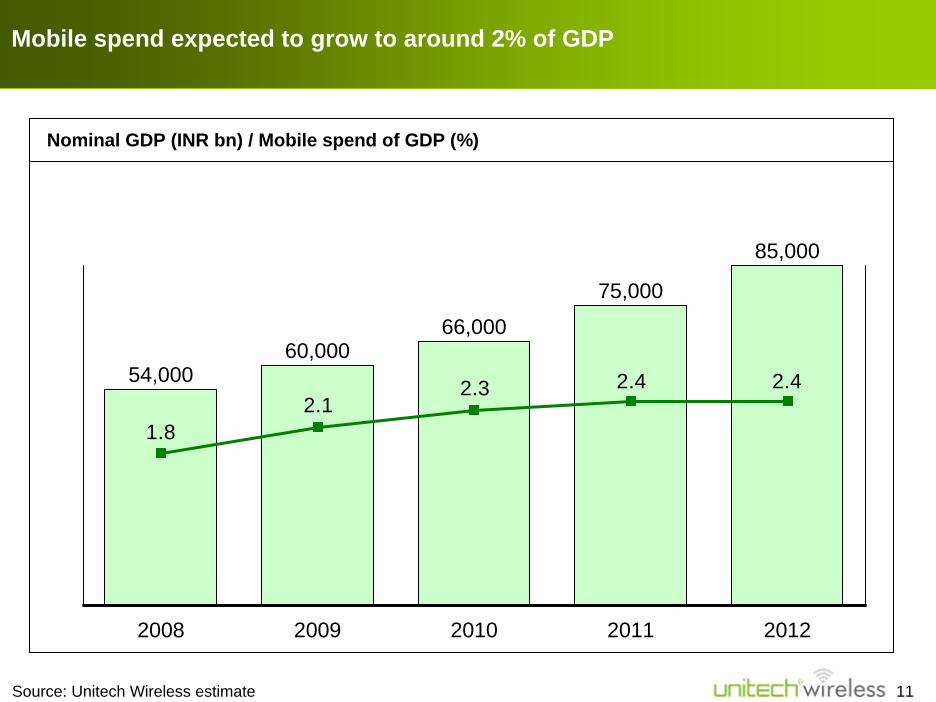
Mobile spend expected to grow to around 2% of GDP
Nominal GDP (INR bn) / Mobile spend of GDP (%)
2.42.42.32.1
1.8
2010 20112008
54,000
2012
75,000
60,000
85,000
66,000
2009
12Source: Unitech Wireless estimate
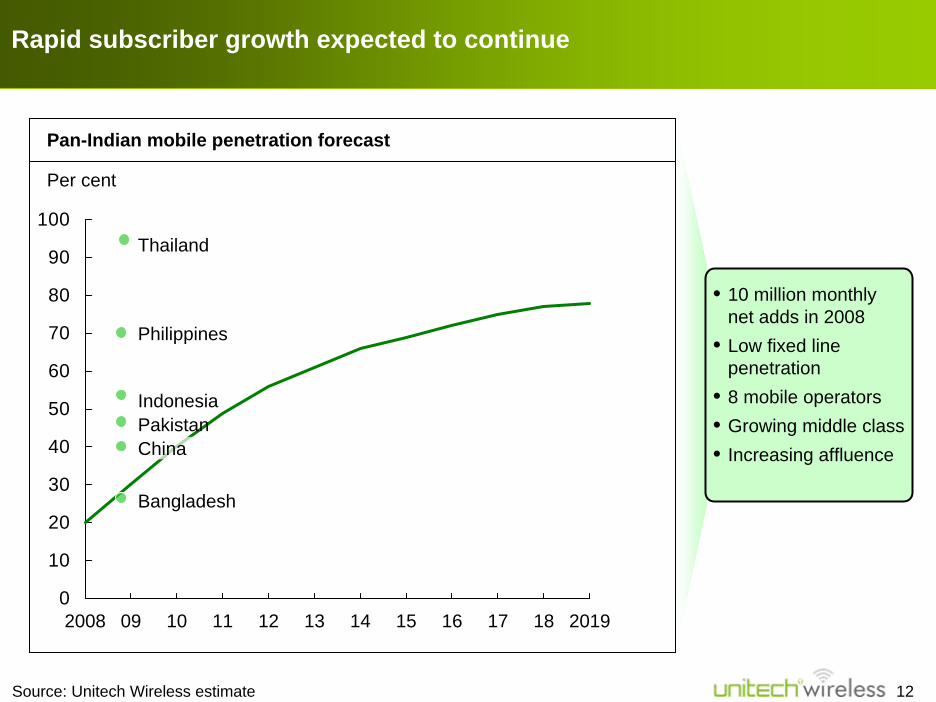
Rapid subscriber growth expected to continue
Pan-Indian mobile penetration forecast
0
10
20
30
40
50
60
70
80
90
100
2008 09 10 11 12 13 14 15 16 17 18 2019
Thailand
Indonesia
Bangladesh
PakistanChina
Philippines
• 10 million monthly net adds in 2008
• Low fixed line penetration
• 8 mobile operators• Growing middle class• Increasing affluence
Per cent
13
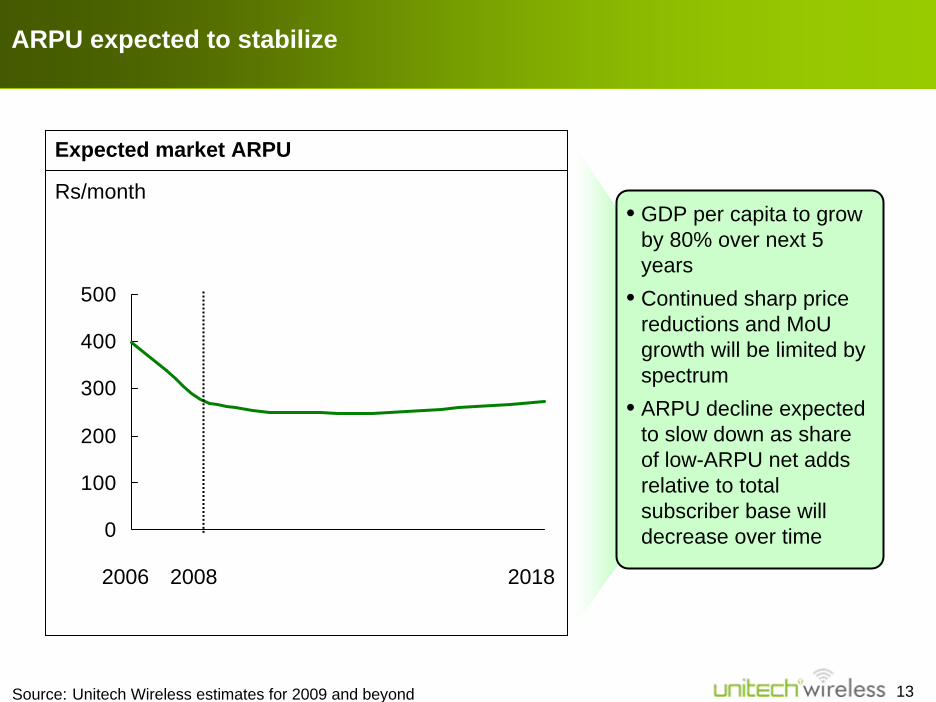
Expected market ARPU
ARPU expected to stabilize
0
100
200
300
400
500
20182006 2008
• GDP per capita to grow by 80% over next 5 years
• Continued sharp price reductions and MoUgrowth will be limited by spectrum
• ARPU decline expected to slow down as share of low-ARPU net adds relative to total subscriber base will decrease over time
Rs/month
Source: Unitech Wireless estimates for 2009 and beyond
14
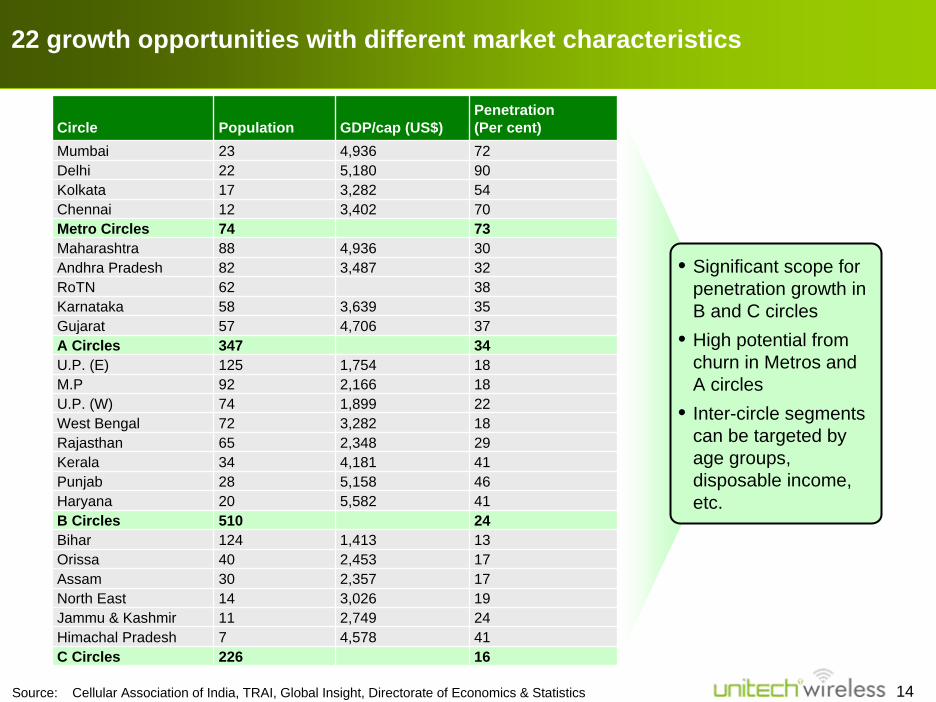
Circle Population GDP/cap (US$)Penetration (Per cent)
Mumbai 23 4,9365,1803,2823,402
4,9363,487
3,6394,706
1,7542,1661,8993,2822,3484,1815,1585,582
1,4132,4532,3573,0262,7494,578
72Delhi 22 90Kolkata 17 54Chennai 12 70Metro Circles 74 73Maharashtra 88 30Andhra Pradesh 82 32RoTN 62 38Karnataka 58 35Gujarat 57 37
Haryana 20 41B Circles 510 24Bihar 124 13Orissa 40 17Assam 30 17North East 14 19
A Circles 347 34U.P. (E) 125 18M.P 92 18U.P. (W) 74 22West Bengal 72 18Rajasthan 65 29Kerala 34 41Punjab 28 46
Jammu & Kashmir 11 24Himachal Pradesh 7 41C Circles 226 16
22 growth opportunities with different market characteristics
Source: Cellular Association of India, TRAI, Global Insight, Directorate of Economics & Statistics
• Significant scope for penetration growth in B and C circles
• High potential from churn in Metros and A circles
• Inter-circle segments can be targeted by age groups, disposable income, etc.
15
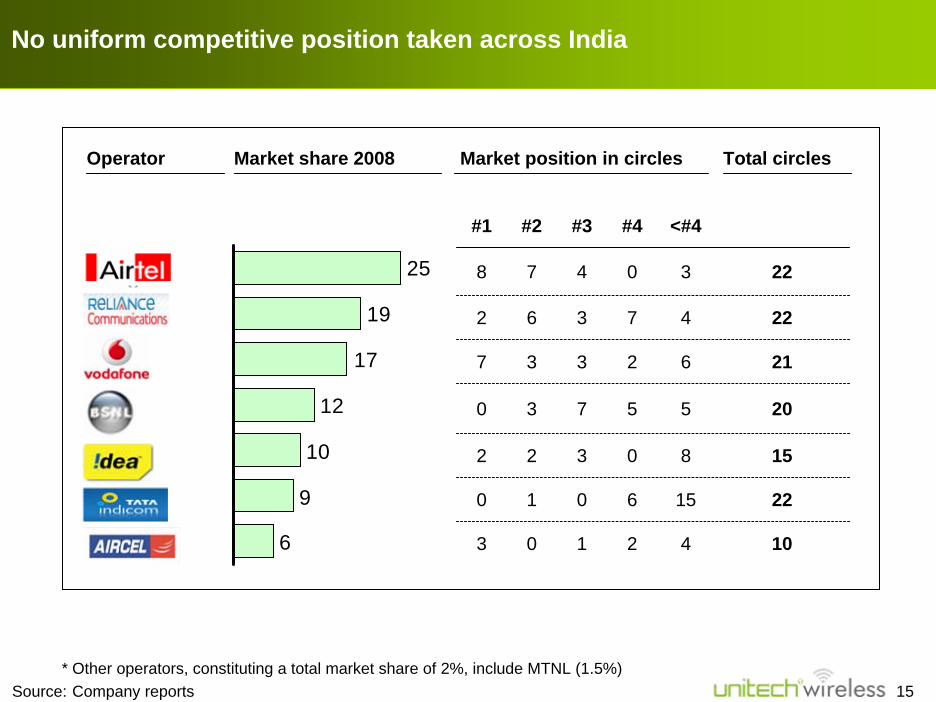
#1 #2 #3 #4 <#4
8 7 4 0 3
4
6
5
8
0 1 0 6 15 22
4
2 6 3 7
22
22
21
20
15
7 3 3 2
0 3 7 5
2 2 3 0
103 0 1 2
Operator
6
9
10
12
17
19
25
Market share 2008 Market position in circles Total circles
No uniform competitive position taken across India
* Other operators, constituting a total market share of 2%, include MTNL (1.5%) Source: Company reports
16
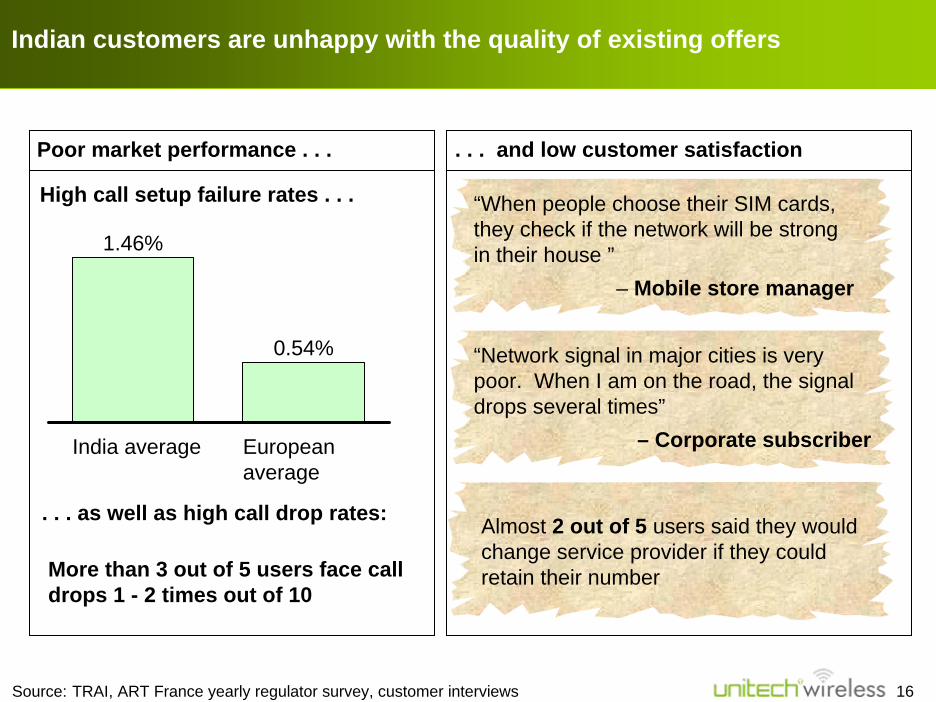
Indian customers are unhappy with the quality of existing offers
Source: TRAI, ART France yearly regulator survey, customer interviews
High call setup failure rates . . .
More than 3 out of 5 users face call drops 1 - 2 times out of 10
. . . as well as high call drop rates:
Poor market performance . . .
0.54%
European average
India average
1.46%
“When people choose their SIM cards, they check if the network will be strong in their house ”
– Mobile store manager
“Network signal in major cities is very poor. When I am on the road, the signal drops several times”
– Corporate subscriber
Almost 2 out of 5 users said they would change service provider if they could retain their number
. . . and low customer satisfaction
17
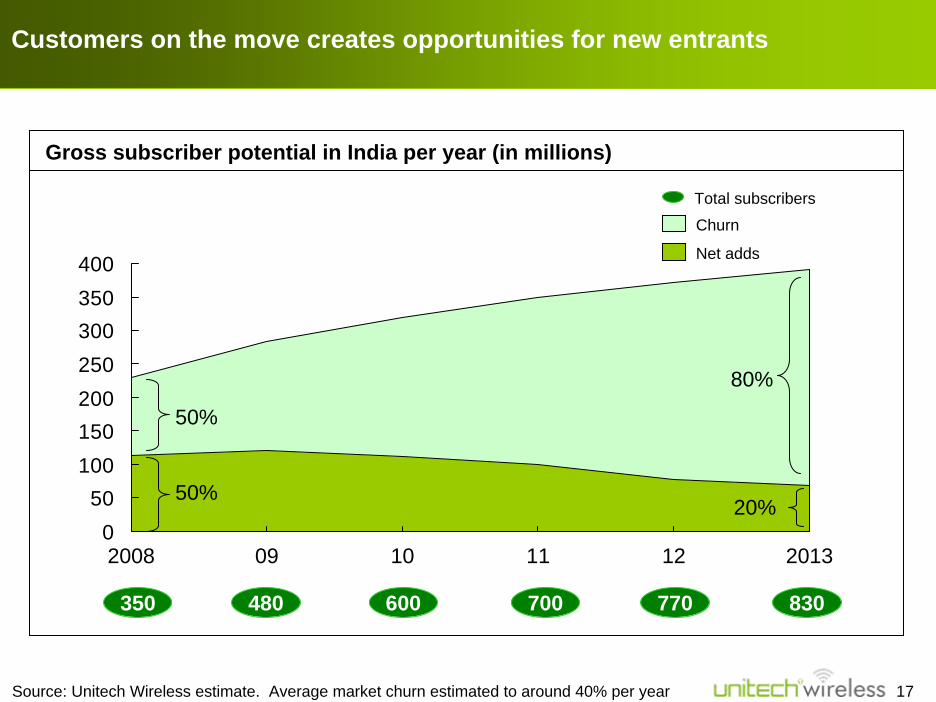
050
100150200250300350400
Churn
2008
Net adds
1009 20131211
Customers on the move creates opportunities for new entrants
Source: Unitech Wireless estimate. Average market churn estimated to around 40% per year
350 480 600 700 770 830
Total subscribers
50%
80%
50%20%
Gross subscriber potential in India per year (in millions)
18
Update on transaction with Telenor
Business plan
• Indian mobile market
• Market strategy
• Operational strategy
Financing plan
Contents
19
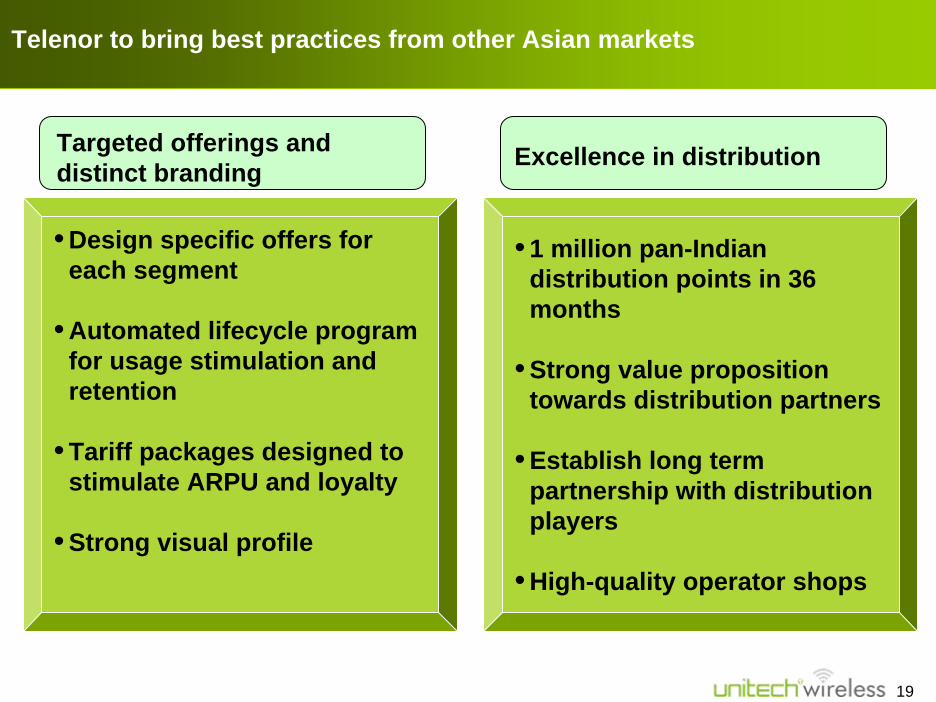
Telenor to bring best practices from other Asian markets
• Design specific offers for each segment
• Automated lifecycle program for usage stimulation and retention
• Tariff packages designed to stimulate ARPU and loyalty
• Strong visual profile
• 1 million pan-Indian distribution points in 36 months
• Strong value proposition towards distribution partners
• Establish long term partnership with distribution players
• High-quality operator shops
Targeted offerings and distinct branding Excellence in distribution
20
Telenor to bring best practices from other Asian markets
• Automated lifecycle program for usage stimulation and retention
• Adding value to the SIM
• Being the preferred SIM
• Knowing the customer
• One-to-one communication
• Tariff packages designed to stimulate ARPU and loyalty
Customer lifecycle management
21
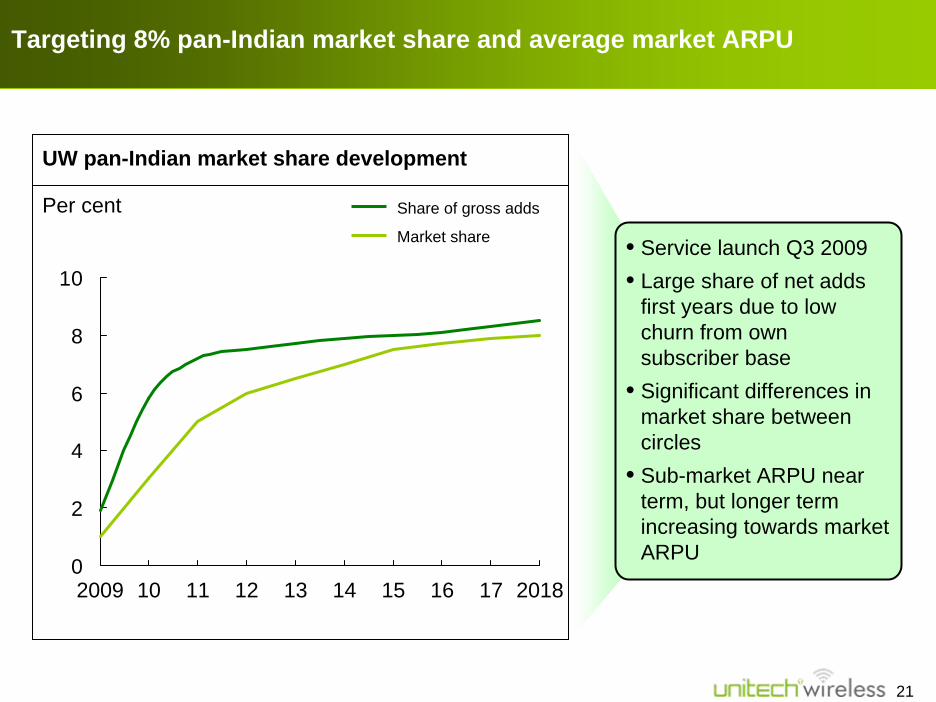
Targeting 8% pan-Indian market share and average market ARPU
0
2
4
6
8
10
Share of gross adds
Market share
2009 10 11 12 13 17 201815 1614
• Service launch Q3 2009• Large share of net adds
first years due to low churn from own subscriber base
• Significant differences in market share between circles
• Sub-market ARPU near term, but longer term increasing towards market ARPU
UW pan-Indian market share development
Per cent
22
Update on transaction with Telenor
Business plan
• Indian mobile market
• Market strategy
• Operational strategy
Financing plan
Contents
23
• Gradual network build-up
• Infrastructure sharing
• GSM equipment at competitive cost
• Full-scale IT outsourcing
• Long term cost and capexefficiency
Low cost operational model
24
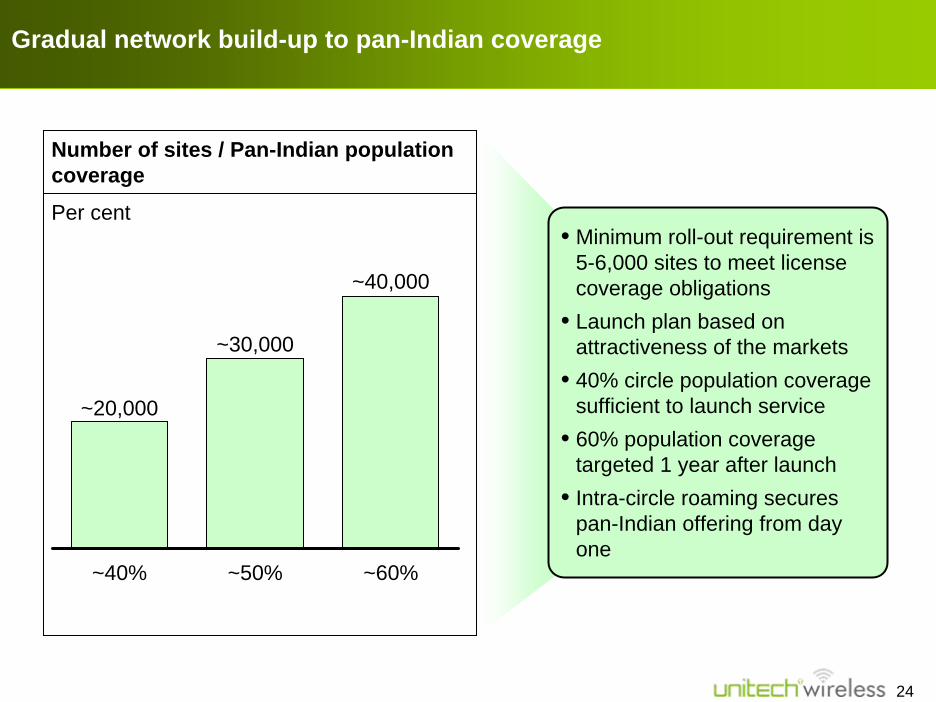
Gradual network build-up to pan-Indian coverage
Number of sites / Pan-Indian population coverage
Per cent
~20,000
~40%
~30,000
~50%
~40,000
~60%
• Minimum roll-out requirement is 5-6,000 sites to meet license coverage obligations
• Launch plan based on attractiveness of the markets
• 40% circle population coverage sufficient to launch service
• 60% population coverage targeted 1 year after launch
• Intra-circle roaming secures pan-Indian offering from day one
25
Infrastructure agreement with Tata/Quippo
• Tower sharing agreement with Tata/Quippo provides required coverage at launch and flexibility for further expansion
–40,000 towers by end 2010, of which 22,000 available by April 2009
• Lower opex in 2009-2010 than previously anticipated
• Tower sharing priced at fixed monthly rate per site, plus payment for actual power consumption
–Transmission between sites at a fixed monthly rate provided by Tata Teleservices
• Unitech Wireless may enter into additional tower rental agreements, in line with launch strategy and subscriber growth
26
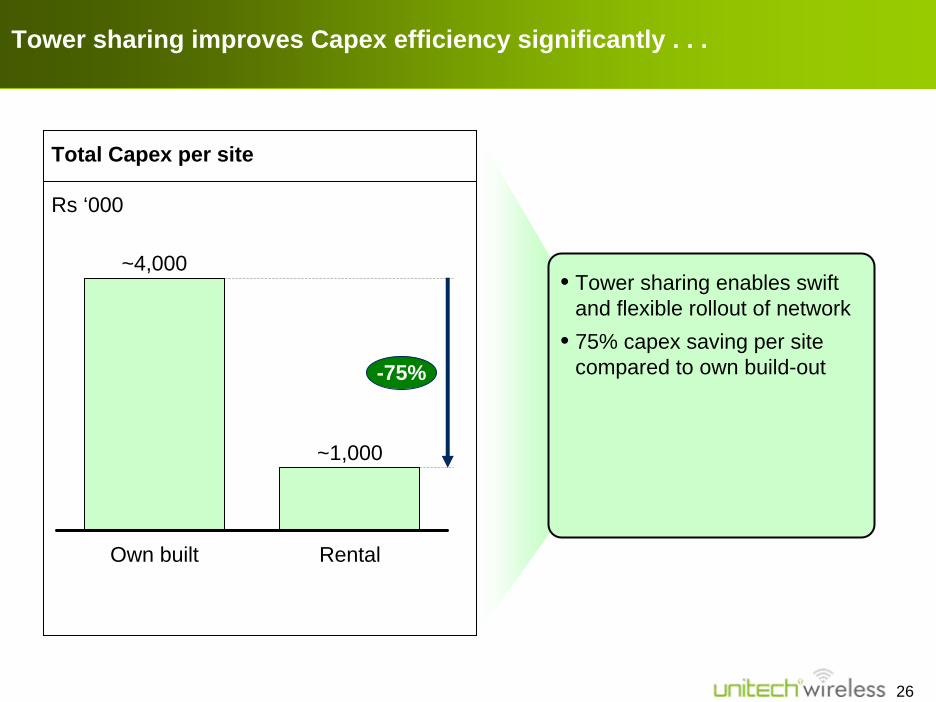
Tower sharing improves Capex efficiency significantly . . .
Total Capex per site
Rs ‘000
~4,000
Own built
~1,000
Rental
-75%
• Tower sharing enables swift and flexible rollout of network
• 75% capex saving per site compared to own build-out
27
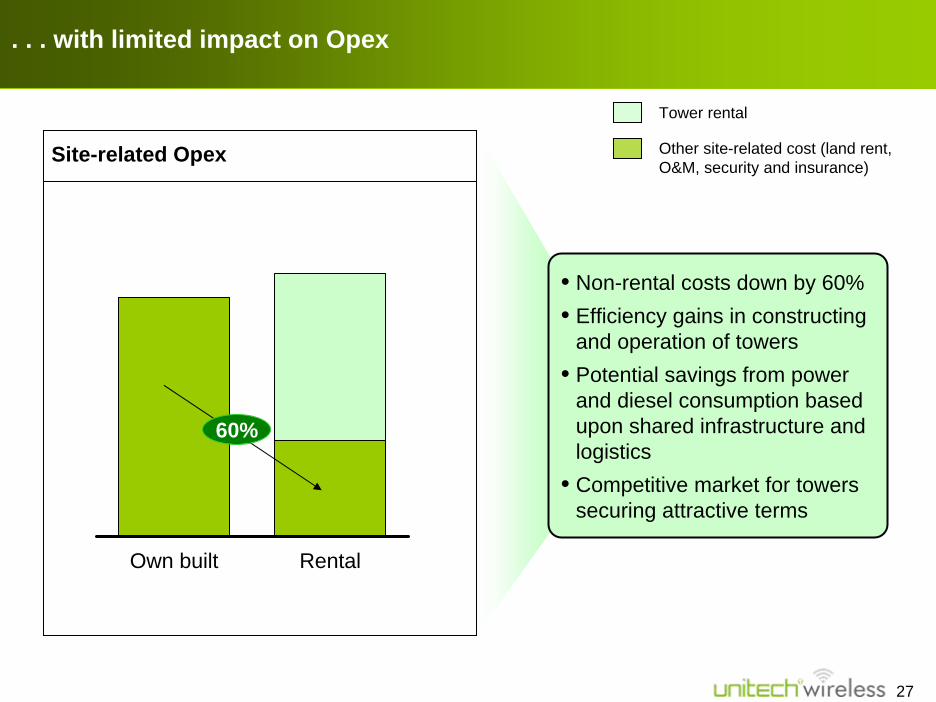
. . . with limited impact on Opex
Tower rental
Other site-related cost (land rent, O&M, security and insurance)
Site-related Opex
• Non-rental costs down by 60%• Efficiency gains in constructing
and operation of towers • Potential savings from power
and diesel consumption based upon shared infrastructure and logistics
• Competitive market for towers securing attractive terms
RentalOwn built
60%
28
GSM equipment at competitive cost
• No technology legacy
• High spectrum capacity utilisation
• Low equipment cost due to–Large volumes–Multiple vendors–Overall industry development
29
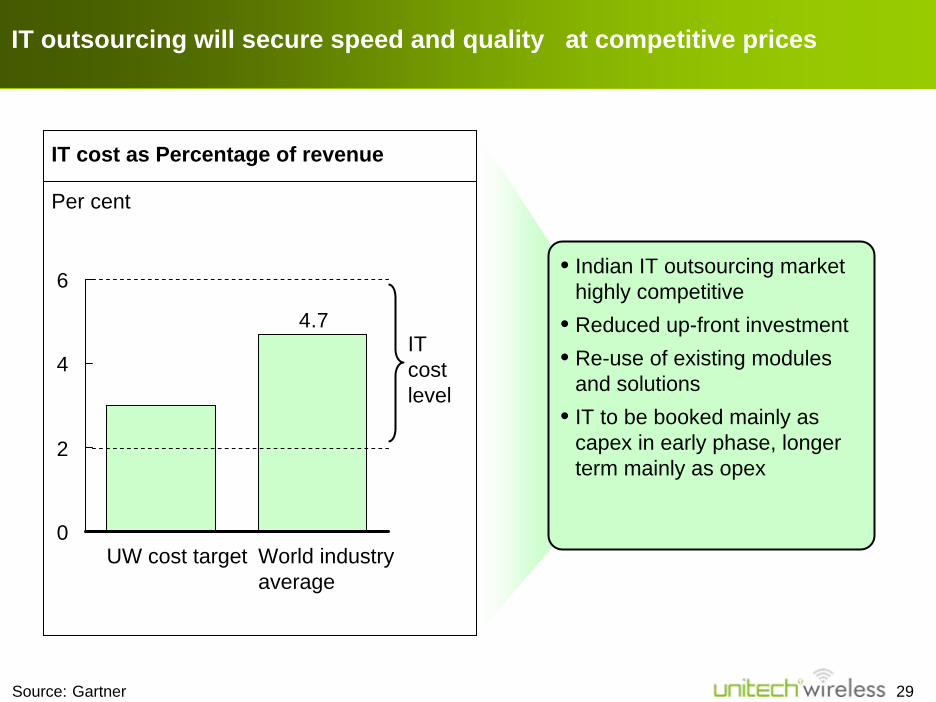
IT outsourcing will secure speed and quality at competitive prices
IT cost level
4.7
0
2
4
6
UW cost target World industry average
• Indian IT outsourcing market highly competitive
• Reduced up-front investment• Re-use of existing modules
and solutions• IT to be booked mainly as
capex in early phase, longer term mainly as opex
IT cost as Percentage of revenue
Per cent
Source: Gartner
30
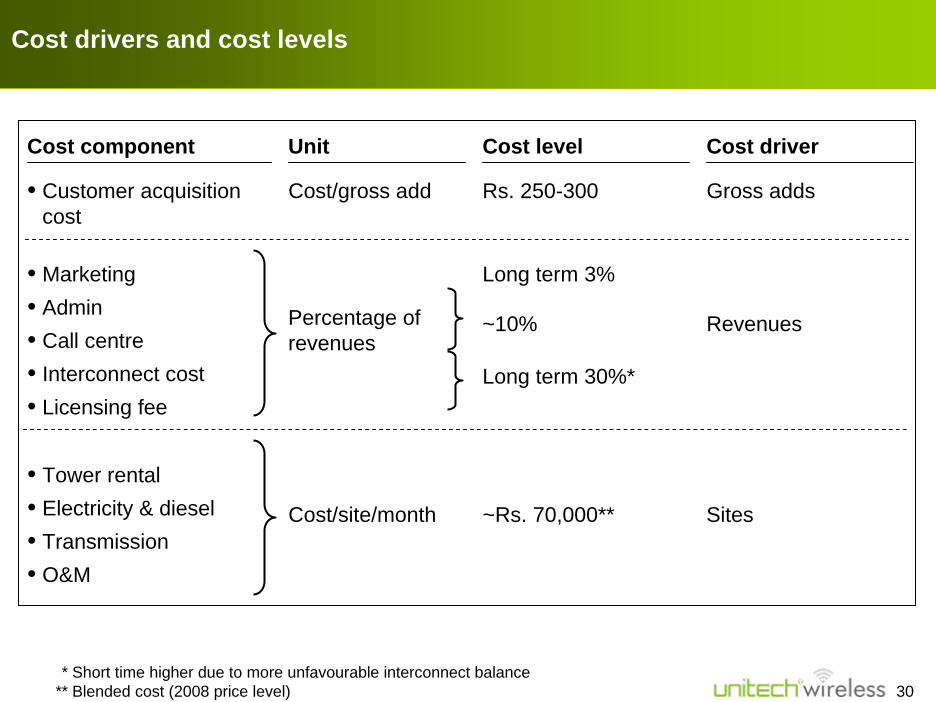
Cost drivers and cost levels
Cost component Unit Cost level Cost driver
• Customer acquisition cost
Rs. 250-300 Gross addsCost/gross add
• Tower rental• Electricity & diesel• Transmission• O&M
Cost/site/month ~Rs. 70,000** Sites
• Marketing• Admin• Call centre• Interconnect cost• Licensing fee
Long term 3%
Revenues~10%
Long term 30%*
Percentage of revenues
* Short time higher due to more unfavourable interconnect balance** Blended cost (2008 price level)
31
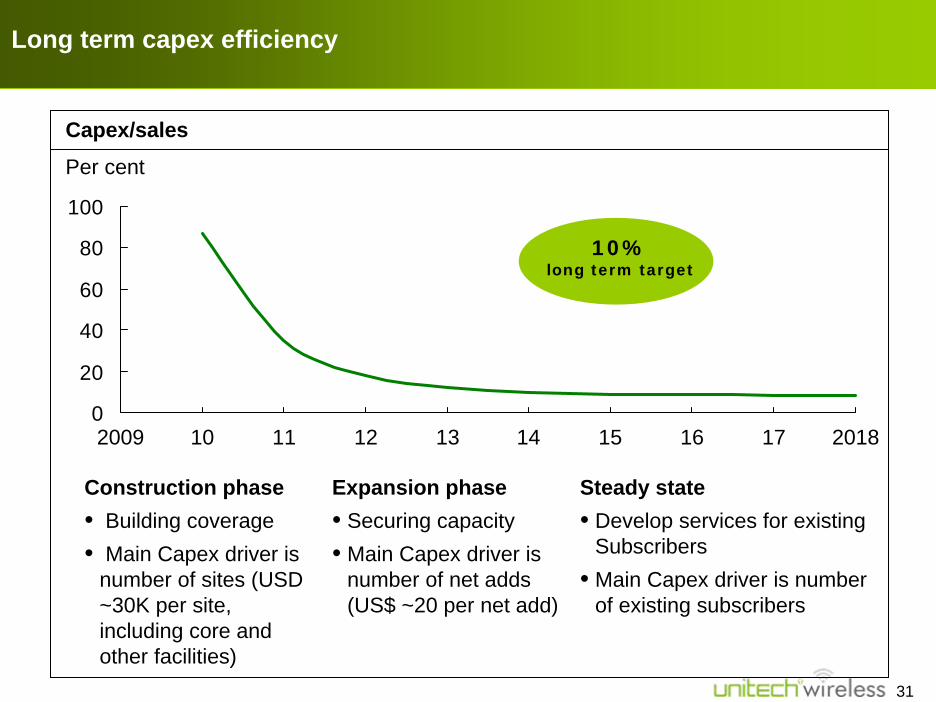
Long term capex efficiency
0
20
40
60
80
100
201817161514131211102009
Capex/sales
Per cent
Construction phase• Building coverage• Main Capex driver is
number of sites (USD ~30K per site, including core and other facilities)
Expansion phase• Securing capacity• Main Capex driver is
number of net adds (US$ ~20 per net add)
Steady state• Develop services for existing
Subscribers• Main Capex driver is number
of existing subscribers
10%long term target
32
Update on transaction with Telenor
Business case
Financing plan
Contents
33
Unitech Wireless financing plan
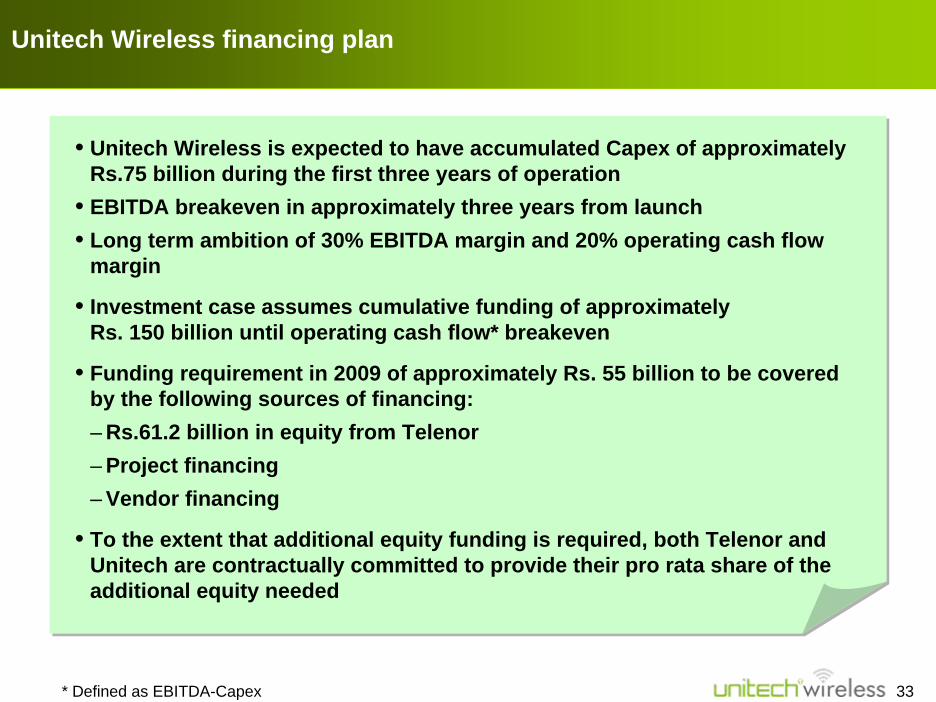
• Unitech Wireless is expected to have accumulated Capex of approximately Rs.75 billion during the first three years of operation
• EBITDA breakeven in approximately three years from launch • Long term ambition of 30% EBITDA margin and 20% operating cash flow
margin
• Investment case assumes cumulative funding of approximatelyRs. 150 billion until operating cash flow* breakeven
• Funding requirement in 2009 of approximately Rs. 55 billion to be covered by the following sources of financing:– Rs.61.2 billion in equity from Telenor– Project financing– Vendor financing
• To the extent that additional equity funding is required, both Telenor and Unitech are contractually committed to provide their pro rata share of the additional equity needed
* Defined as EBITDA-Capex
34
• Telenor has strong track record and experience in successfully launching operations in emerging markets
• A partnership with Telenor will benefit Unitech Ltd by creating long term shareholder value
• Tower sharing agreement reduces build-out capex by approximately 75%, with limited operating expense impact
• Fresh equity infusion from Telenor, project financing and vendor financing will take care of funding for first 3 years
Summary