Embed Size (px)
Citation preview

YouGov plcOutperforming the market in all geographies
Interim Results to 31 January 2012

Outperforming the marketInterim Results for the half-year ended 31 January 2012
Group – maintaining revenue growth well ahead of the overall research market
USA – continuing strong revenue growth of 35% (15% organic)
UK – revenue growth of 21% with new SixthSense reports business doubling
Germany – good progress under new CEO with return to underlying revenue growth of 9% and significant cost reductions made
Nordic – revenue increased by 13% reflecting successful development strategy
Middle East – locally generated business grew revenue by 26% although expected ending of Iraq contract meant overall revenue down by 4%
France - operation opened in October 2011 with panel already up to 62,000
Strong performance of BrandIndex continues with 47% year-on-year revenue increase - total revenue from data products up over 50%
2

Financial OverviewInterim Results for the half-year ended 31 January 2012
Organic revenue growth of 12%
Adjusted operating profit of £2.0m (2011: £2.2m)
Investment of £0.7m in teams to support new product and geographical expansion
Adjusted profit before tax of £2.2m (2011: £2.3m)
Adjusted earnings per share of 1.8p (2011: 2.1p)
Reported loss before tax of £0.3m (2011: £0.3m)
Good cash conversion - 160% of operating profits
Balance sheet remains strong – net cash of £10.3m (2011: £10.9m)
Dividend expected to commence following the Group’s full year results – reflecting Board’s confidence in YouGov’s position
3

Segmental Analysis - Revenue
H2 2012 Revenue
£m
H1 2011 Revenue
£m
Change %
OrganicChange*
%
UK 7.7 6.4 21%
America 9.6 7.1 35% 15%
Middle East 3.5 3.7 (4%)
Germany 5.0 6.4 (21%) 9%
Nordic 4.4 3.9 13%Corporate & Consol. Adjs. (0.3) (0.5)
Group 29.9 27.0 11% 12%
Interim Results for the half-year ended 31 January 2012
4
*from continuing operations

Segmental Analysis – Operating ProfitInterim Results for the half-year ended 31 January 2012
H1 2012Operating Profit
£m
H1 2012Margin
%
H1 2011Operating Profit
£m
H1 2011Margin
%
UK 1.5 19 1.3 20
America 1.0 10 1.0 14
Middle East 0.9 24 0.8 22
Germany 0.1 1 0.2 3
Nordics 0.3 6 0.1 4Corporate & Consol. Adjs. (1.8) (1.2)
Group 2.0 7 2.2 8
5

Revenue growth of £3m
Gross margin maintained
Operating expenses increase includes investment of £0.7m
Operating margin reflects this
Adjusted EPS of 1.8p
Group Income StatementInterim Results for the half-year ended 31 January 2012
H1 2012£m
H1 2011£m
Group Revenue 29.9 27.0
Cost of sales (7.4) (6.6)
Gross Profit 22.5 20.4
Gross margin % 75% 76%
Operating expenses (20.5) (18.2)
Group Operating Profit 2.0 2.2
Operating margin % 7% 8%
Adjusted EPS (p) 1.8 2.1
6

Balance SheetAt 31 Jan 2012
£mAt 31 Jan 2011
£m
Non-Current AssetsGoodwill 37.0 36.1Other intangible assets 9.7 11.4Other non-current assets 5.3 5.3
52.0 52.8Current AssetsTrade and other receivables 15.9 19.9Cash 10.3 10.9Total Current Assets 26.2 30.8
LiabilitiesTrade and other payables 13.8 17.4Provisions 1.0 2.3Total Current Liabilities 14.8 19.7
Net Current Assets 11.4 11.1
Provisions and other non-current liabilities 4.2 4.6Deferred taxation 3.3 3.6Total Non-Current Liabilities 7.5 8.2
Total Net Assets 55.9 55.7
Interim Results for the half-year ended 31 January 2012
Debtor days down 14 at 62 days
Deferred consideration of £5.1m (£2.8m in current liabilities)
Net cash of £10.3m
7
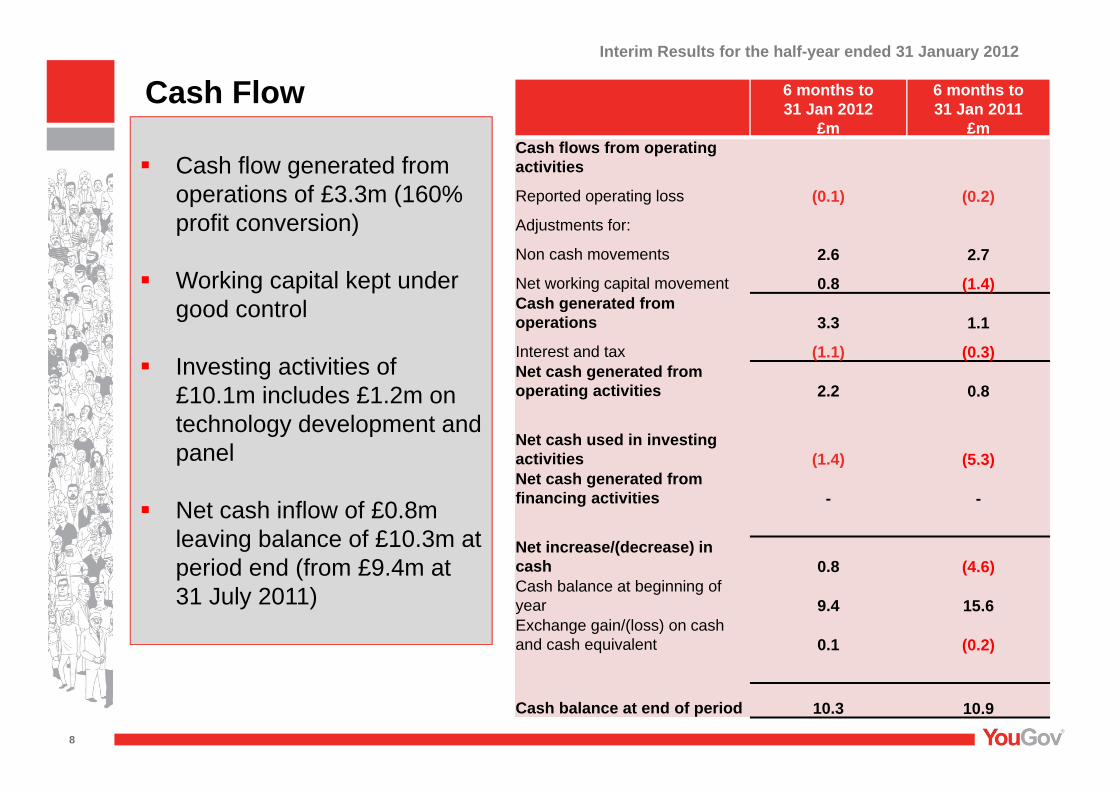
Cash flow generated from operations of £3.3m (160% profit conversion)
Working capital kept under good control
Investing activities of £10.1m includes £1.2m on technology development and panel
Net cash inflow of £0.8m leaving balance of £10.3m at period end (from £9.4m at 31 July 2011)
Cash FlowInterim Results for the half-year ended 31 January 2012
6 months to31 Jan 2012
£m
6 months to31 Jan 2011
£mCash flows from operating activities
Reported operating loss (0.1) (0.2)
Adjustments for:
Non cash movements 2.6 2.7
Net working capital movement 0.8 (1.4)Cash generated from operations 3.3 1.1
Interest and tax (1.1) (0.3)Net cash generated from operating activities 2.2 0.8
Net cash used in investing activities (1.4) (5.3)Net cash generated from financing activities - -
Net increase/(decrease) in cash 0.8 (4.6)Cash balance at beginning of year 9.4 15.6Exchange gain/(loss) on cash and cash equivalent 0.1 (0.2)
Cash balance at end of period 10.3 10.9
8

Operational Review – UK Interim Results for the half-year ended 31 January 2012
Half-yearto
31 Jan 2012£m
Half-yearto
31 Jan 2011£m
Change
%
Revenue 7.7 6.4 21
Operating Profit 1.5 1.3
Average Headcount 117 114
Overall growth well ahead of market Custom research up 20% - due to
international projects Omnibus revenues up 15% BrandIndex revenue up 15% - now
has over 30 UK clients SixthSense reports business has
350 customers with 150 titles covering some 500 topic areas
New MD appointed in September 2011
9

Operational Review – USInterim Results for the half-year ended 31 January 2012
Half-yearto
31 Jan 2012£m
Half-yearto
31 Jan 2011£m
Change
%
Revenue 9.6 7.1 35
Operating Profit 1.0 1.0
Average Headcount 98 74
Organic growth of 15% Harrison up 15% - met second
EBITDA earn-out threshold BrandIndex revenue doubled Definitive Insights revenue of £1.4m Major corporate clients now include
Bloomberg, Coca-Cola, Google, Microsoft & Panasonic
10

Operational Review – Middle EastInterim Results for the half-year ended 31 January 2012
Half-yearto
31 Jan 2012£m
Half-yearto
31 Jan 2011£m
Change
%
Revenue 3.5 3.7 (4)
Operating Profit 0.9 0.8
AverageHeadcount 46 43
Historic Iraq contract ended as expected in December 2011
Locally generated revenue up 26% -in line with planned transition
Online data services revenue doubled
Custom research up 17% Panel numbers grown by 53% - now
covers 21 countries in Middle East and North Africa
1111

Operational Review – GermanyInterim Results for the half-year ended 31 January 2012
Half-yearto
31 Jan 2012£m
Half-yearto
31 Jan 2011*
£m
OrganicChange*
%
Revenue 5.0 4.6 9
Operating Profit 0.1 (0.1)
Average Headcount 117 122
Turnaround progressing well under new CEO, who started September 2011
Underlying growth re-established Online products continued to grow
well – by 40% Staff numbers reduced - savings of
£0.5m in full year
1212
* Excludes businesses disposed of or discontinued in 2010/11

Operational Review – NordicInterim Results for the half-year ended 31 January 2012
Half-yearto
31 Jan 2012£m
Half-yearto
31 Jan 2011£m
Change
%
Revenue 4.4 3.9 13
Operating Profit 0.3 0.1
Average Headcount 70 66
Good momentum continues with market share gains
Brand profile growing in the region Denmark still strongest territory Syndicated products growing Annual Nordic Food and Health
Survey continuing to attract new clients
1313
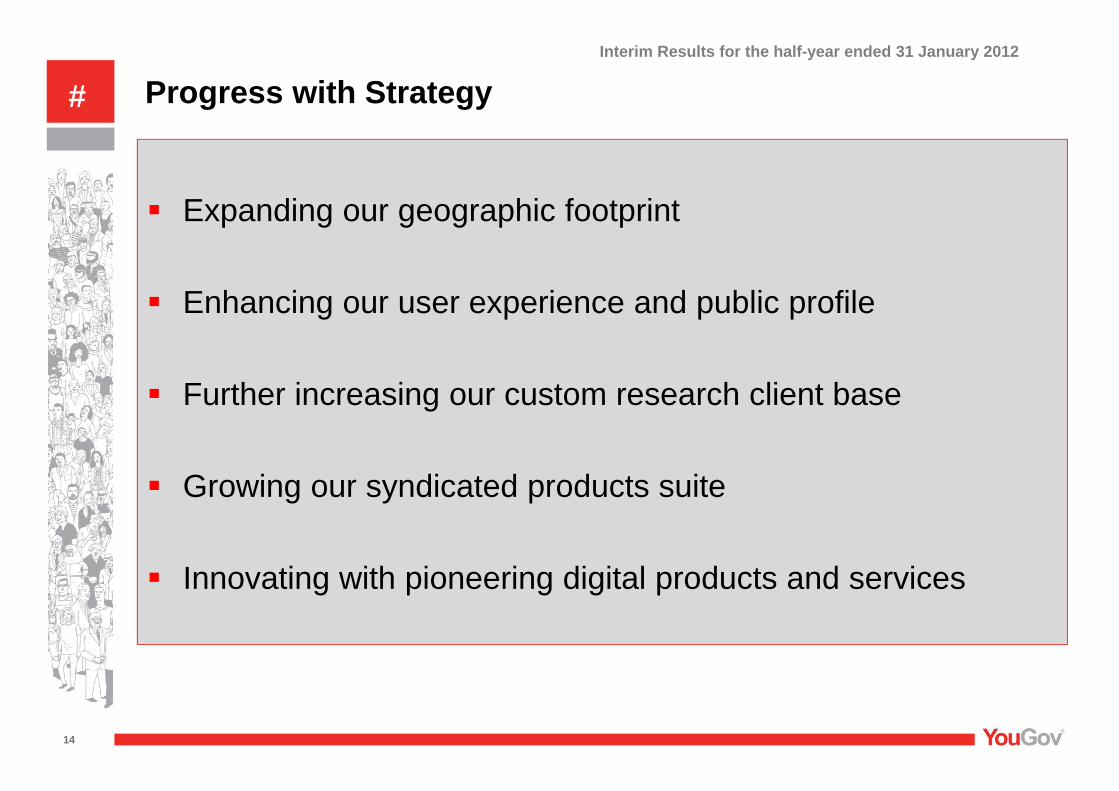
# Progress with Strategy
Expanding our geographic footprint
Enhancing our user experience and public profile
Further increasing our custom research client base
Growing our syndicated products suite
Innovating with pioneering digital products and services
14
Interim Results for the half-year ended 31 January 2012

Geographic GrowthInterim Results for the half-year ended 31 January 2012
15
YouGov France established in October 2011 Paris office - located downtown, near the Opera Panel of 62,000 as at 31 January 2012, growing Currently selling BrandIndex and Omnibus

Key YouGov ProductsInterim Results for the half-year ended 31 January 2012
16
YouGov BrandIndex2The fastest-growing part of our business - be enlarged with more levels of data.1,000 brands tracked daily, in-depth (US, UK, Germany, Middle East, Nordics, France)
YouGov OmnibusOmnibus offers clients fast, high-quality and cost-effective results. New role - International Head of Omnibus - appointed to lead roll-out into new territories, initially focussing on the USA
YouGov SixthSenseReports on trends within sectors based on individual studies, linked to and updated by YouGov data feeds
YouGov Investment Sector DataA single platform for all YouGov data flows targeted to the investment sector (includes continuous daily multi-country macro-economic data (HEAT), plus sector trackers, mini-BrandIndex and reports)
YouGov Data Combo & AnalyticsAdding YouGov data-sets to external data-sets, e.g. client data, Experian etc.
YouGov SoMA (release May 2012)The first robust data for social media analysis, a revolutionary flip from 'said' to 'heard‘
YouGov Executive Dashboard (release April 2012)A ‘situation room’ dashboard for executives wrapping all YouGov data into bespoke daily-conciergedvisualisation by specialists

SoMAInterim Results for the half-year ended 31 January 2012
17

YouGov Executive DashboardInterim Results for the half-year ended 31 January 2012
18

YouGov Investment Sector DataInterim Results for the half-year ended 31 January 2012
19

Trading across the Group remains in line with expectations
Ongoing benefits from our investment programme
Further innovations about to be launched YouGov Executive Dashboard, April 2012 YouGov SoMA (Social Media Analysis tool), May 2012
Confidence in YouGov’s position reflected in the planned introduction of a dividend (commencing late 2012)
Group OutlookInterim Results for the half-year ended 31 January 2012
20

Appendix

Our Global Management TeamInterim Results for the half-year ended 31 January 2012
Stephan ShakespeareCEO
Alan NewmanCFO
Tim BrittonCOO, EMEA
Doss StrusePresident, America
Doug RiversCIO
CEO
Stephan Shakespeare
CFO
Alan Newman
PresidentAmerica
Doss Struse
COOEMEA
Tim Britton
CIO
Doug Rivers
22