Embed Size (px)
Citation preview

Investor Presentation
4 December 2018
1

Introduction, strategic update and
governance
Chris BennGroup Finance Director
2

Strategic Update – a look back
Strong operational performance
Significant effect on customers
£50m profit (16/17 - £44m), resilient business
Increased development. Completions 17/18 (excluding
JV’s) = 839 v 16/17 = 723 (excluding JV’s)
Peers/Competitors – large developing housing groups
outside London in the south. New for profit RP’s
3

Strategic Update – a look forward
Continue to focus on
- maintaining assets
- building new social housing properties
- providing services to customers
Vision – everyone has home.
Balance risks v rewards.
Rent regime certainty
Exiting care and support
4

Strategic Update – a look forward
De-regulation, continues to be a good thing for the sector.
Growth strategy – merger opportunities, but not at any cost.
Development move east.
Political uncertainty/Brexit – scenario testing/contingency
planning.
5

Strategic update – Economic Environment
6
We assume a reasonably stable UK economy with stable inflation and
interest rates.
Brexit neutral except in the case of a hard Brexit –possible opportunities?
Brexit strategy and mitigations
– Brexit position paper looking at mitigations
– Liquidity– increase liquidity by March 2019 by an additional 3 months
– Delayed sales strategy either to reduce prices and sell, or immediately
switch tenure
– Other mitigations, cost reductions, asset sales.

Strategic update – Board control
7
Board control through financial planning and scenario testing
Board Living Business Plan – two additional plans per year with updated
development data
Property market
– Board and Executive Board reports and KPI’s
– Open market sales – risk sharing through JV’s
– Investment Panel monitoring monthly
– Void disposal programme, new development only committed once receipts are received
Pension consultation on defined benefit schemes

Risk Update
Chris BennGroup Finance Director
8

Risk
9
Rank Risk Title Risk Type
1 Operating Environment – Global and Economic (inc Brexit) Hazard
2 Breach of Cyber Security Operational
3Void Disposal Pool Programme - Significant event/s impact on forecast Yr2
incomeFinancial
4 Landlord H&S compliance issue leading to HSE engagement Operational
5 Reputational damage due to significant or sustained high-level crisis events. Strategic
6 H&S compliance issue leading to HSE engagement Operational
7 Reputational damage due to lack of positive influence from Aster within the sector Strategic
8 Shareholders are disengaged from support of strategic decision making. Strategic
9Liquidity - the group has insufficient cash to meet its commitments including on-
lendingFinancial
10 Insufficient security available to support funding the Group strategy Financial
11 Sales risk - sales delayed or fall in sales price Financial

Governance
Chris BennGroup Finance Director
10

Governance Overview
The Group continues to operate the “Overlap Boards” structure that it introduced in 2014.
The Group structure remains the same, except for the new Kilnwood Vale LLP Joint Venture.
Aster Group Ltd
Aster Communities
Synergy Housing Ltd
Aster Living
Aster Property
Ltd
Aster Homes
Aster Options
Ltd
Aster Treasury
PLC
Silbury Housing
Holdings Ltd
Silbury Housing Ltd
Aster Solar Ltd
Zebra Property
Solutions Ltd
White Rock
Land LLP
Boorley Green
LLP
Aster 3 Ltd
11
Kilnwood Vale LLP

Governance Structure
12
Executive Board
Group Leadership
Team
Group Health and Safety
Panel
Group Procurement
Panel
Group Investment
Panel
Customer & Community
Network
Customer Scrutiny
Panel
Customer Overview
Group
Group Treasury
Committee
Group Audit Committee
Group Risk &
Compliance Committee
Group Remuneration & Nominations
Committee
All Companies above are supported by the Committees below and the Executive Board
(coherent governance and assurance is provided by the reporting lines outlined in the delegation matrix)

Board oversight
• G1 & V1 regulatory position
• Monthly Board meetings
• Monthly business critical KPI’s
• Quarterly performance reports
• Delegation matrix
• Altair review of governance structure
13
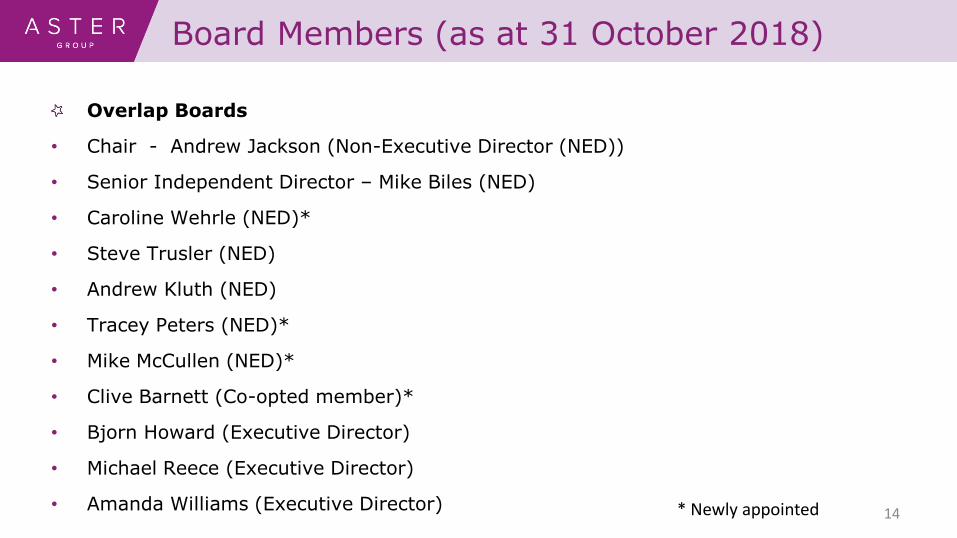
Board Members (as at 31 October 2018)
Overlap Boards
• Chair - Andrew Jackson (Non-Executive Director (NED))
• Senior Independent Director – Mike Biles (NED)
• Caroline Wehrle (NED)*
• Steve Trusler (NED)
• Andrew Kluth (NED)
• Tracey Peters (NED)*
• Mike McCullen (NED)*
• Clive Barnett (Co-opted member)*
• Bjorn Howard (Executive Director)
• Michael Reece (Executive Director)
• Amanda Williams (Executive Director)14* Newly appointed

Board Members (as at 31 October 2018)
Executive Board
• Bjorn Howard Group CEO
• Michael Reece Group Operations Director
• Amanda Williams Group Development Director
• Chris Benn Group Finance Director
• Dawn Fowler-Stevens Group Growth & Assurance Director
• Rachel Credidio Group People & Transformation Director
• Graeme Stanley Group Strategy Director
15

Financial Performance
Hadyn BeazerDeputy Finance Director
16

Group Results
March 2018
17

Aster Group P&L 31 March 2018
£’000s2018
Actual2018
Budget Variance2017
Stat Accts
Rent 152,142 153,297 (1,155) 148,436
Open Market Sales 935 - 935 4,031
Other 51,651 47,128 4,523 38,102
Income 204,728 200,425 4,303 190,569
Direct costs (147,430) (150,320) 2,890 (126,129)
Op. Profit 57,298 50,105 7,193 64,440
Increase in FV investment props
445 - 445 482
Share of profit in JVs 1,155 2,708 (1,553) 734
Interest (23,848) (22,599) (1,249) (25,248)
Profit after Interest 35,050 30,214 4,836 40,408
Sale of Assets 14,594 5,276 9,318 3,694
Profit for Year before tax 49,644 35,490 14,154 44,102
18

Profit Bridge - 2018£000 £000
Budgeted Net Profit 35,490
Turnover
Rental Income (incl voids) (661)
Service charge income (494)
First Tranche sales 2,553
Open market sales 935
Other 1,970
Cost of Sales 4,303
Employment Costs 274
Response and Major Repairs 802
Capitalised Major Repairs (Components) 4,987
Service Charge Costs (492)
Property Depreciation & Impairment (3,093)
Business support costs (2,442)
Bad Debts 1,449
First Tranche costs 1,889
Open market sale costs (796)
Other 312
2,890
Increase in FV of investment properties 445
Share of profits in JVs (1,553)
Interest (1,249)
Profit from property asset sales 9,318
Actual profit before tax 49,64419

Property Sales
Reported through other income (£5.7m):
• 380 1st tranche shared ownership £5.6m profit, 15.4% margin
• Open market sales (4 units sold, profit £0.1m)
Reported through asset disposals (£14.6m):
• 113 disposals through VDP & SOAP £11.6m profit
• 75 stair-casing £2.8m profit
• 45 right to buy/right to acquire £0.2m profit
JVs:
• White Rock 58 units and Boorley Green 35 units
20

Aster Group - Actual revenue by business
£’000s Actual Budget Variance
Aster Communities 130,072 124,740 5,332
Synergy Housing 66,099 66,250 (151)
Zebra Property 76 75 1
Aster Homes 97,155 72,620 24,535
Aster Living 7,551 8,505 (954)
Aster Property 61,294 61,477 (183)
Silbury Housing 1,560 1,503 57
Other 529 586 (57)
364,336 335,756 28,580
Consol Adj (159,608) (135,331) (24,277)
Total 204,728 200,425 4,303
21

Aster Group - Actual profit by business
£'000s Actual Budget Variance
Aster Group Ltd 10,339 - 10,339
Aster Communities 24,446 21,647 2,799
Synergy Housing 12,753 10,449 2,304
Zebra Property 175 16 159
Aster Homes 3,710 229 3,481
Aster Living (214) 501 (715)
Aster Property 1,304 1,293 (11)
Silbury Housing 222 152 70
White Rock LLP 561 1,725 (1,164)
Boorley Green LLP 535 983 (448)
Other (4,103) (1,505) (1,658)
Total 49,728 35,490 14,23822

Aster Group Balance Sheet at 31 March
£000’s2018 2017
Actual Actual
Housing properties 1,473,779 1,365,719
Other Assets/(liabilities) 205,495 228,423
Total Net Assets 1,679,274 1,594,142
Loans & Long Term Liabilities 938,798 912,924
Revaluation Reserve 404,633 409,214
Accumulated Surplus 335,635 271,796
Other Reserves/Provisions 208 208
Total Capital 1,679,274 1,594,142
Completed Housing EUV-SH 1,377,510 1,270,710
23

Aster Group Cash Flow
£000’s 2018 2017
March March
Cash flow from operating activities 126,003 114,637
Taxation (paid) / received (39) -
Investing activities:
Acquisition/construction (180,039) (120,405)
Sale proceeds 26,297 10,580
Other (1,025) (7,433)
(154,767) (117,258)
Financing activities:
Interest paid (27,600) (30,050)
New loans 50,000 100,000
Repayment of borrowings (1,394) (40,200)
21,006 29,750
Increase / (Decrease) in cash (7,797) 27,129 24

Historical trending
25

Historical financial performanceUK GAAP FRS 102 FRS 102 FRS 102 FRS 102
£'000s 2014 2015 2016 2017 2018Turnover 151,803 157,656 160,145 165,786 167,459
First Tranche Shared Ownership 7,563 15,119 15,618 20,752 36,334
Open market sales 342 2,106 3,219 4,031 935
PFI Finance debtor 35,422 - - - -
Turnover 195,130 174,881 178,982 190,569 204,728
Operating costs (108,507) (108,269) (101,804) (103,996) (112,270)
First Tranche Shared Ownership (4,873) (14,276) (14,831) (19,177) (30,742)
Open market sales costs (300) (1,834) (3,149) (3,047) (796)
PFI operating cost (35,422) - - - -
Operating Profit 46,028 50,502 59,198 64,349 60,920
Impairment - (49) (3,144) 91 (3,622)
Operating Profit after impairment 46,028 50,453 56,054 64,440 57,298
Profit on disposal of PPE 768 96 1,982 3,694 14,594
Share of profit / (loss) in JVs (219) (600) 635 734 1,155
Increase in fair value of investment properties - 2,539 482 482 445
Profit before interest and tax 46,577 52,488 59,153 69,350 73,492
Interest receivable 2,437 3,729 4,265 4,564 4,605
Interest payable (18,927) (26,288) (28,251) (28,624) (27,482)
Other finance income/(costs) (841) (1,504) (1,077) (1,188) (971)
Profit before tax 29,246 28,425 34,090 44,102 49,644
Tax (78) (15) (100) 77 84
Profit for the year 29,168 28,410 33,990 44,179 49,728
Exceptional (cost)/ income - - - - -
Statutory profit for the year 29,168 28,410 33,990 44,179 49,728 26

Historical financial performance
UK GAAP FRS 102 FRS 102 FRS 102 FRS 102
£'000s2014 2015 2016 2017 2018
Total fixed assets 1,196,946 1,279,032 1,344,411 1,409,532 1,514,310
Current assets 80,508 98,769 94,559 113,374 126,625
Cash at bank 82,740 82,788 81,743 108,872 101,075
Creditors (29,076) (41,777) (36,661) (37,636) (62,736)
Total assets less current liabilities 1,331,118 1,418,812 1,484,052 1,594,142 1,679,274
Creditors greater than 1 year (690,159) (777,499) (808,442) (875,104) (905,596)
Pension liability (30,272) (37,652) (33,773) (37,820) (33,202)
Net assets 610,687 603,661 641,837 681,218 740,476
Profit and loss reserve 58,333 209,558 250,953 294,654 353,566
Other reserves 552,354 394,103 390,884 386,564 386,910
Total reserves 610,687 603,661 641,837 681,218 740,476
EUV-Sh of completed social housing properties
1,131,697 1,233,820 1,097,310 1,270,710 1,377,510
27

Interest cover, net worth and cash
Aster Communities
Synergy
Interest cover Actual 2.21 2.15
Target > 1.00 1.00
Net worth Actual 56% 57%
Target < 75% 75%
28
Mar-18 Mar-17
Cash £m £m
Short term deposits 35.1 45.1
Cash at bank and in hand 66.0 63.8
101.1 108.9

Development Update
Paul Morgan
Director of Treasury
29

Development Strategy
Aspiration to increase the number of homes to over 1,100 a year
Balanced approach between rent and shared ownership from 19/20
Land led schemes to increase up to 50% of programme by 2022
Maximise grant opportunities to assist land led programme
Invest in rural communities
Partnerships with Local Authorities
Strengthened technical support with digital focus
30

Growth Strategy
• Maintain relationship with housebuilders
• Increased focus on land
• New contracting partnership
• Control on quality/delivery
• Value engineered throughout
• Range of contracting options
• Wider geographical cover
• Explore Partnership Opportunities
• Flexibility on tenure options with grant availability
31

The Programme
Green: In contract/On site/Defects (74 sites) Red and Blue: Approved schemes (21 sites)32

Joint Venture – Galliford Try
Three LLP’s - White Rock LLP, Boorley Green and Kilnwood Vale LLP
4 sites in the South West, 1 in Hampshire and 1 in West Sussex
1,450 homes including the affordable
120 homes forecast for 18/19
£48.3m of net profit forecast over life of projects to be shared 50/50
Long term partnership with common interest
LLP Board with equal representation
Linden Homes employed to deliver the schemes
33

Key Risks
Increased competition for land/premiums
High build prices – labour, availability and materials
Greater exposure on sales programme
Government policy changes
Market uncertainty (Brexit)
34

Mitigants
Land led programme within our control
With ability to change tenure
Increased grant levels available
Contractors Partnering Framework
Wide geographic cover
Wider tenure options more available35

Development Team
Stable and well established team
Embedded streamlined functions
Cultural leaders within the Aster Group
Skills and succession planning identified36

Shared Ownership sales
Robust sales monitoring
Average sale time – 12 weeks versus a target of 26 weeks
Actual Sales - £36m in 17/18
Actual Staircasing £6m in 17/18
Average share consistent at early 40%, with 81% off plan sales rate.
37

Shared Ownership Sales
• Internal Controls• Risk Map• Leadership Team• IP, ADE, Board• Team skills• Development and sales
• External Controls• Chair of NSG• Chair of NHF shared ownership steering group• Co-chair – Savills strategic sector group• Relationships with lenders • SO Chat hour
38

Sales – we do things differently
• Open 7 days and evenings
• Dominant web and social presence• Over 2,200 tracked calls from new users• 84% calls answered immediately
• Live Chat• Over 2,300 chats• 88% answered immediately • 98% answered within 0-10 secs• 1min 48sec average time on call
39

Treasury
Paul JeffriesBusiness Planning and
Treasury Manager
40

Treasury Highlights
• Bond tap – May 2018
- raised circa £61m @ all in cost of 3.35%
- created £150m of retained bonds
• Sold £20m retained bonds @ 3.41% (19/11/2018)
• MORhomes
- original sponsor and shareholder
- in principle commitment to borrow £40m
• Bank revolver facilities agreed in principle
41

Funding Structure - Loan Facilities Detail as at 31 March 2018
Including PFI
• £988m of facilities (including overdraft
£2.5m)
• £868m drawn
• £120m available
• £101m cash
42

Cashflow & Liquidity
• Treasury Policy
– sufficient committed facilities and cash for at
least 12 months.
- cash for 6 months of forecast spend.
• Margin call – Scenario of a fall 100bp’s in the yield
curve would lead to a cash collateral call of £6.5m. Nil
at 31 March 2018
43

Maturity Profile (existing debt)
44
(1,000)
(900)
(800)
(700)
(600)
(500)
(400)
(300)
(200)
(100)
0
Millions
Total Group Maturity Profile
Available
Variable
Fixed
2015 2016 2017 2018
Avg cost of debt (%) 3.85 3.75 3.51 3.46
Total debt (£m) 739 759 818 826

Hedging excl PFI as at 31 March 18
Fixed £717m
Variable £109m
Total £826m
Fixed Duration 12.4 years
45
87%
13%
Aster Group
Fixed/ Variable Split excl PFI
Fixed Variable

Re-financing Risk (existing debt excl PFI)
(350)
(300)
(250)
(200)
(150)
(100)
(50)
0
Millio
ns
Total Group Refinancing Risk
46
Group Policy (debt repayable):<15% in 12 month period<35% over five year period
Group Actual (debt repayable):<1.6% in 12 month period<13% over five year period

Security Utilisation
• Asset Cover tests, all facilities have a 10%
contingency.
• Open market value of properties 6 times EUV-sh
security value
• Pro-active approach to ensure development
properties are available for charging on a timely
basis for funding.
47

Treasury Strategy
• Mixed Funding strategy going forward
- Bank RCF’s
- Retained Bond issuance
- MORhomes MTN programme
• Maintain good liquidity. Brexit additional 3
months of liquidity
48

Summary
Chris Benn
Group Finance Director
49

Summary
Experienced Board and Executive Team
Strong financial performance to date
Well placed to meet the future challenges and
risks
Appendices
50

Thank you
Questions
51

Appendices
52
• Housing (Operations)
• Asset Management

Operations update
53

Focussing on…
• Population and demand
• Stock and customer profiles
• Our strategy
• Performance
• Welfare reforms54

Population & demand…
• Population continues to increase
• Demand for all tenures is strong
• Average house price in South West is £258,000
• Average house price in South East is £329,000
• Average private sector rents in the South East are £1,043 pcm
• Average private sector rents in the South West are £986 pcm
55

Demand and prices
56
Proportion
of Aster
Stock
Area*Population (2016-17
Growth)
Unemploy
ment
estimate -
June 18
Avg. Dwelling Price
(Sep17-18
Growth)
Avg.
Weekly
Social
Rent
(HAs)
(2018)
Avg.
Weekly
Market
Rent
(2018)
Discount
margin
30% Dorset 770,689 (0.44%) 2.85% £286,566 (1.97%) £102 £220 54%
25% Wiltshire 847,633 (0.97%) 3.30% £288,273 (3.87%) £104 £215 52%
23% Hampshire 1,623,807 (0.47%) 3.23% £265,020 (1.45%) £111 £239 54%
17% Somerset 1,203,125 (0.73%) 3.72% £288,443 (3.47%) £97 £202 52%
5% Devon & Cornwall 1,611,590 (0.96%) 2.79% £223,190 (2.73%) £88 £175 50%
Total: 6,056,124
South West 5,559,316 (0.77%) £253,771 £94 £203 54%
South East 9,080,825 (0.56%) £321,326 £111 £264 58%
UK 66,040,229 (0.60%) £249,408 (3%)
Average
across
*Dorset includes Poole BC & Bournemouth BC. Wiltshire incldues Swindon BC & Vale of White Horse. Hampshire includes
Sources: ONS, Land Registry, Hometrack

Landlord Strategy
• Customer focussed, easily accessible, good and safe landlord
services
• Key components:
• Our customers
• Our homes
• Digital evolution
• Income maximisation
57

58

59

60

Performance
Key Performance Indicator2016/17 2017/18 2018/19
YTD
2018/19
Target
Current tenant rent arrears (% of annual debit) 1.90% 1.95% 2.19% 3.00%
Former tenant rent arrears (% of annual debit) 1.31% 1.35% 1.31% 2.00%
Rent loss through voids (% of annual debit) 0.46% 0.78% 0.83% 0.76%
Rent collected as % of rent due 99.59% 99.25% 98.98% 99.6%
Re-let times (All standard relets) (days)17.16
days
18.80
days
21.92
days18 days
61

62

63

• Trusted Partner Status with the DWP – since Feb 2016
• Using the DWPs “Portal” – 3rd landlord to be given access
• Aster is part of the Strategic Landlords Group within the
DWP
• Working with the DWP on their plans to migrate all
claimants to UC
• Excellent working relationships with local DWP offices and
job centres developed and maintained
Welfare Reform: Partnership Working
64

65

66

Priorities
• Operational and financial performance
• Customer satisfaction
• Creating capacity / efficiency
• Delivering Landlord Strategy
• Our digital work
67

Asset Management Update
68

Housing stock
69

Stock condition
Investment in line with Savills
stock condition survey report
Key planned & cyclical
programmes delivered
Key performance indicators
delivered
Achieved £472K efficiencies
Continue to deliver long term
investment in housing stock
70

Safety First
Independent review of management structure
Strengthened health and safety team
In-house fire safety specialists
Active board scrutiny of H&S performance
Increased focus on staff wellbeing
71

Stock Rationalisation 2017-18
Total property disposals of £14.2m
£3.0m receipts from stock appraisals
Land enhancement generated £1.1m
Sale of commercial properties £2.1m
Voids disposal generated £8.0m
72