Embed Size (px)
Citation preview

Investor Presentation 4 September 2012
Aspial Corporation Limited
1
4 September 2012

ASPIALInvestor Presentation
OverviewAspial Corporation Ltd
Financials FY2009 – 1H2012
2
StrengthsGroup Highlights
OutlookStrategies Moving Forward
Conclusion

About Aspial� The company started out as a retailer of jewellery in 1970.� Today, Aspial Corporation Limited is an investment holding company with 3 core businesses, namely jewellery, property
development and financial service� Jewellery
- Leading jewellery retailer in Singapore with 72 retail stores across Singapore and 1 in Ho Chi Minh City- 4 established jewellery brands i.e. “Aspial”, “Lee Hwa Jewellery”, “Goldheart Jewellery” and “Citigems”
� Property Development- Successfully launched and completed more than 25 property projects in Singapore since 2001- Involved in commercial, residential and mixed developments in good locations in Singapore
� Financial Service- Provides pawnbroking services via a modern, professional and customer centric store concept- 24 locations in Singapore.- Listed Maxi-Cash on Catalist on 22 June 2012
� Listed on the Singapore Stock Exchange with market capitalisation of about S$580million as at 3 Sep 2012
3
Jewellery (44%)
Property (41%)
Financial Services (15%)
Financial Summary
S$’ 000 Year ended
31 Dec 2009
Year ended 31 Dec 2010
Year ended 31 Dec 2011
6 months ended 31 June 2012
Revenue 267,974 280,258 420,324 200,097
EBITDA 24,580 15,152 67,049 34,974
EBITDA Margin (%) 8.87% 5.41% 15.95% 17.48%
EBIT 19,949 9,050 60,702 31,906
Total Debt 147,342 212,901 321,651 278,079
Total Assets 319,713 385,079 569,512 587,702
EBITDA / Interest (x) 19.23 6.35 19.30 16.99
Debt to Assets (%) 46% 55% 56% 49%
Diversified Revenue Mix (Segmental Revenue Breakdown 2009-2011)

Aspial Corporation Ltd
Aspial International
Pte Ltd
Maxi-Cash Financial Services
Ltd
Aspial-Lee HwaJewellery Singapore
Pte Ltd
Aspial-LHJ Goldheart
100% 100% 49%
100%100%
81.08%
100% 100%
Maxi-Cash
100%
Jewellery Business Financial Services
Group Structure
Maxi-Cash Maxi-Cash
4
World Class Land Pte Ltd
Aspial-LHJ Jewellery
Pte Ltd
Goldheart Jewellery
Pte Ltd
CitigemsPte Ltd
World ClassPropertyPte Ltd
World ClassDevelopment
Pte Ltd
World ClassCapital Pte Ltd
Advance Property Pte Ltd
KensingtonLand
Pte Ltd
KensingtonVillage Pte Ltd
Bayfront Ventures
Pte Ltd
90%
100% 100% 80% 100% 40% 40% 50%
Property Development Business
Maxi-Cash Jewellery Group Pte
Ltd
Maxi-Cash Group Pte
Ltd
Maxi-Cash Jewellery
Pte Ltd

Jewellery Business
Our 4 key jewellery brands target different market
segments. This enables us to focus on fulfilling
customers’ preferences such as merchandise and price
range more effectively.
• Despite the lesser number of stores in 2011, we managed to improve store efficiency andachieve higher sales from existing retail stores.
• Revenue from the jewellery business increased by 8.9% from S$146.0 million in FY2010 toS$159.0 million in FY2011. The Group’s jewellery business registered pre-tax profits of S$4.0
5
S$159.0 million in FY2011. The Group’s jewellery business registered pre-tax profits of S$4.0million in FY2011 as compared to a loss of $2.8 million in FY2010.
Value SegmentMainstream
SegmentMass Luxury
SegmentLuxury Segment

Property Development
• Through World Class Land Pte Ltd, we are involved in commercial, residentialand mixed developments in good locations in Singapore.
• Since 2001, we have successfully launched and completed more than 25property projects in Singapore.
• Group revenue from the property development business surged 116.7% fromS$81.9 million in FY2010 to S$177.5 million in FY2011. Substantial growthin revenue was contributed by the progress recognition of revenue fromEspira Suites, Heritage East, SOHO Life, Onan Suites, Cavan Suites andPalmera East projects.
6
Project TypeTotalUnits
LaunchDate
UnitsLaunched
% Sold Based on
Units Launched
Expected TOP
CardiffResidence
Residential 163 4Q 2011 163 100% 1H 2013
ParcRosewood
Residential 689 1Q 2012 689 97% 1H 2013
EastVillage
Retail 108 1Q 2012 100 95% 2H 2013
EastVillage
Residential 90 1Q 2012 90 100% 2H 2013
8 Bassein Residential 74 2Q 2012 74 76% 2H 2014
Latest property development projects

Financial Service Business
• Our financial service business Maxi-Cash was incorporated Apr2008, and is recently listed on Catalist of SGX-ST on 22 June 2012.
• The financial service business has 3 wholly-owned subsidiaries:• Maxi-Cash Group which operates the pawnshops through its
subsidiaries• Maxi-Cash Jewellery which carries out the retail and trading of
pre-owned jewellery and watches; and• Maxi-Cash Jewellery Group, which manages the inventory
and carries out the trading of pre-owned jewellery and watches.• Since listing, Maxi-Cash’s share price
has been on a steady uptrend.
7
has been on a steady uptrend.Currently, shares are trading around45% above its IPO price. Marketcapitalisation of about S$130m as 3Sep 2012.
• In FY2011, Maxi-Cash achievedanother year of record loans to itscustomers. Its revenue increased by59.7% from S$54.9 million in FY2010to S$87.7 million in FY2011.
• By having the largest network ofpawnshops in Singapore, the Groupthrough Maxi-Cash continues tostrengthen its leadership position inthe market.

ASPIALInvestor Presentation
OverviewAspial Corporation Ltd
Financials FY2009 – 1H2012
8
StrengthsGroup Highlights
OutlookStrategies Moving Forward
Conclusion

S$’ 000 Year ended 31 Dec 2009
Year ended 31 Dec 2010
Year ended 31 Dec 2011
6 months ended 30 Jun
2012
Cash & Cash Equivalents
16,856 19,125 28,163 51,202
Properties Held for Sale
11,247 - - 3,596
Development Properties
126,091 166,496 262,933 182,888
Financial SummaryBalance Sheet
9
Total Assets 319,713 385,079 569,512 587,702
Long-term borrowings & loans
77,314 72,284 136,745 131,067
Short-term borrowings & loans
69,491 128,867 168,809 147,012
Total Liabilities
222,867 286,621 413,705 393,184
Net Assets 96,846 98,458 155,807 194,518
Total Equity 96,846 98,458 155,807 194,518

Financial SummaryIncome Statement
S$’000 Year ended 31 Dec 2009
Year ended 31 Dec 2010
Year ended 31 Dec 2011
6 months ended 30 Jun
2012
Revenue 276,974 280,258 420,324 200,097
Interest Expense 1,278 2,388 3,474 2,058
Share of Results from Associates
- 39 243 7,258
Profit before Tax 18,671 6,662 57,228 29,848
10
Profit before Tax 18,671 6,662 57,228 29,848
Operating Profit After Tax 11,350 2,325 45,612 16,733
Net Profit 14,632 5,595 47,618 25,045

ASPIALInvestor Presentation
OverviewAspial Corporation Ltd
Financials FY2009 – 1H2012
11
StrengthsGroup Highlights
OutlookStrategies Moving Forward
Conclusion

Investment Highlights
Diversified revenue streams and strong revenue growth from property and financial service businessesDiversified revenue streams and strong revenue growth from property and financial service businesses
Strong financial performance supported by largely-sold property projectsStrong financial performance supported by largely-sold property projects
Market leaders and strong brand names for Pawnbroking and Jewellery businessesMarket leaders and strong brand names for Pawnbroking and Jewellery businesses
1
2
3
12
Jewellery businessesJewellery businesses
Strong future cash flow and profit from largely-sold property projectsStrong future cash flow and profit from largely-sold property projects
Fast-growing developer with strategic JV with Fragrance Group. Huge potential from 3 newly-acquired sites Fast-growing developer with strategic JV with Fragrance Group. Huge potential from 3 newly-acquired sites
Excellent stock performance, MTN programme and dividend yieldExcellent stock performance, MTN programme and dividend yield
3
4
5
6

EBITDA / Interest (x) Debt to Assets (%)
(x)
Strong financial performance supported by healthy financial profile: Excellent Financial Profile with Strong Liquidity
1
19.23
6.35
19.30 16.99
-
5.00
10.00
15.00
20.00
25.00
FY09 FY10 FY11 1H12
46%
52%54%
47%
42%
44%
46%
48%
50%
52%
54%
56%
FY09 FY10 FY11 1H12
13
Current Assets / Short Term Debt (x) Current Ratio (x)
(x) (x)
FY09 FY10 FY11 1H12 FY09 FY10 FY11 1H12
4.12
2.73
3.17
3.67
-
0.50
1.00
1.50
2.00
2.50
3.00
3.50
4.00
4.50
FY09 FY10 FY11 1H12
1.98
1.67
2.04 2.14
-
0.50
1.00
1.50
2.00
2.50
FY09 FY10 FY11 1H12

Revenue (S$’M) EBITDA Margin (%)
Strong financial performance supported by healthy financial profile: Delivering Strong Growth in Earnings
1
277 280
420
200
-
50
100
150
200
250
300
350
400
450
FY09 FY10 FY11 1H12
9%
5%
16%17%
0%
5%
10%
15%
20%
FY09 FY10 FY11 1H12
14
Net Profit (S$’M) Return on Equity (%)
FY09 FY10 FY11 1H12 FY09 FY10 FY11 1H12
14.6
5.6
47.6
25.0
0.0
5.0
10.0
15.0
20.0
25.0
30.0
35.0
40.0
45.0
50.0
FY09 FY10 FY11 1H12
15%
6%
31%
13%
0%
5%
10%
15%
20%
25%
30%
35%
FY09 FY10 FY11 1H12
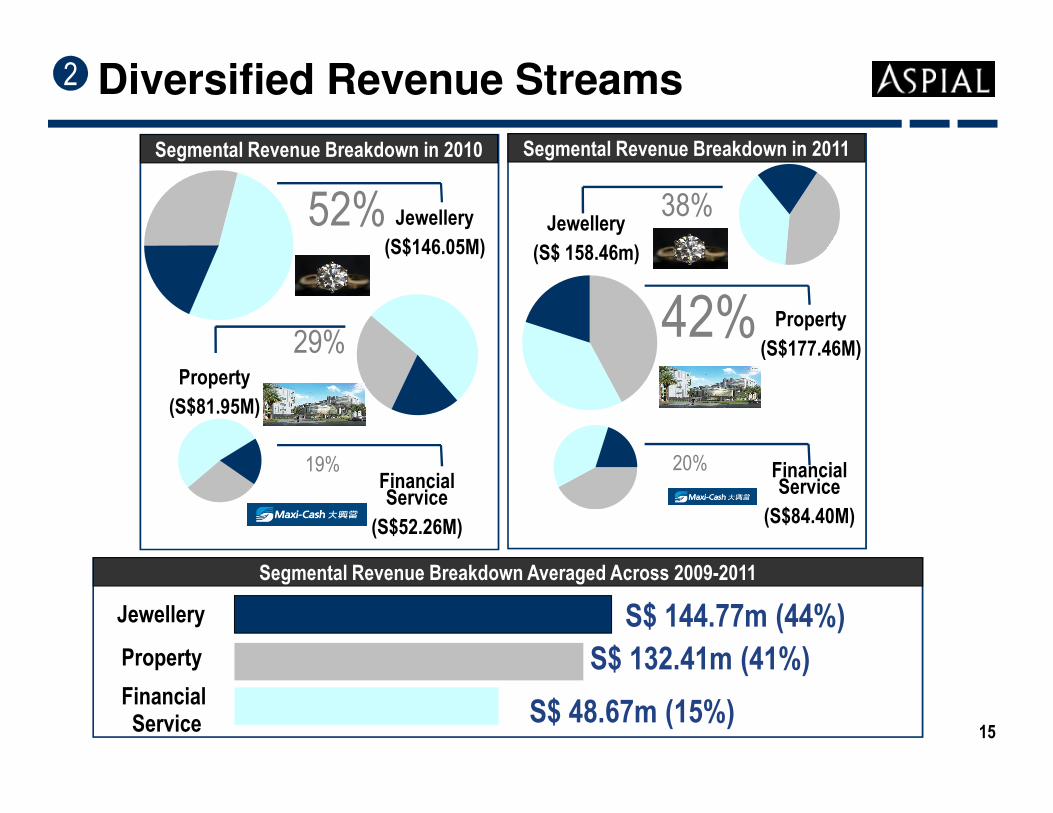
52%
29%
Jewellery
(S$146.05M)
Property
(S$81.95M)
Segmental Revenue Breakdown in 2010
CORPORATE PROFILEDiversified Revenue Streams
42%
38%Jewellery
(S$ 158.46m)
Property
(S$177.46M)
Segmental Revenue Breakdown in 2011
2
15
Financial Service
(S$52.26M)
(S$81.95M)
19% Financial Service
(S$84.40M)
20%
Segmental Revenue Breakdown Averaged Across 2009-2011
Jewellery S$ 144.77m (44%)Property S$ 132.41m (41%)Financial Service S$ 48.67m (15%)

Well-established Market Position Strong Pledge Book & Revenue Growth
Market Leading Position in Key BusinessesFinancial Service: Leader and Innovator in the Pawnbroking Industry
3
15.2
63.4
122.6
164.2
-
20.0
40.0
60.0
80.0
100.0
120.0
140.0
160.0
180.0
Trade Receivables($$'000)($$'000)
16
16
Central North West East
Bugis Ang Mo Kio Boon Lay Marine ParadeLucky Plaza Toa Payoh Jurong East BedokPeople's Park Northpoint Jurong West Joo ChiatSerangoon Road Woodlands Clementi Paya LebarBukit Merah Choa Chu Kang GeylangNex Mall Bukit Batok AljuniedHarbourfront Yew Tee
� Leader with the largest network of 24 strategic locations� Innovator offering contemporary, bank-like experience� Recession-Proof Business
FY09 FY10 FY11 1H12
9.4
52.3
84.4
46.4
-
10.0
20.0
30.0
40.0
50.0
60.0
70.0
80.0
90.0
FY09 FY10 FY11 1H12
Revenue($$'million)

• Parkway Parade
• Plaza Singapura
• Tampines Mall
• Tiong Bahru Plaza
• Novena Square
• VivoCity
•West Mall
• Changi Airport T1
• Changi Airport T3
• 313@Somerset
• Ang Mo Kio Hub
• Bugis Junction
• Causeway Point
• Citylink Mall
•Compass Point
• IMM
• Marina Bay Sands
• ION Orchard
• 313@Somerset
• AMK Hub
• Bugis Junction
• Causeway Point
• Centrepoint
• Lot 1
• Marina Square
• NEX
• Tiong Bahru Plaza
• Northpoint
• Parkway Parade
• Tampines Mall
• Bugis Junction
•Wisma Atria
• Changi Airport T2
• Tampines Mall
• ION Orchard
• Vivocity
• Jurong Point
• AMK Hub
• Toa Payoh HDB Hub
• NEX
• IMM
•313@Somerset
•Parkway Parade
• Citylink Mall
Market Leading Position in Key BusinessesJewellery: Largest network with 72 stores in Strategic Locations
3
17
• IMM
• ION Orchard
• Junction 8
• Jurong Point JP1
• Lot One
• Marina Bay Sands
• NEX
• Northpoint Shopping Centre
• Centrepoint
• Changi Airport
• Clementi Mall
• Compass Point
• Great World City
• Hougang Mall
• International Building
• Junction 8
• Jurong Point
• Tampines Mall
• VivoCity
•West Mall
•Wisma Atria
•Plaza Singapura
• Jurong Point
• Plaza Singapura
• Junction 8
• Causeway Point
• Marina Square
• Marina Bay Sands (2 shops)
• Centrepoint
• Paragon
• Citylink Mall
• Compass Point

Cardiff Residence Parc Rosewood 8 Bassein
Type Residential
Total Units 163
Launch Date 4Q 2011
Units Launched 163
Sold Based on Units Launched
100 %
Type Residential
Total Units 689
Launch Date 1Q 2012
Units Launched 689
Sold Based on Units Launched
97 %
Type Residential
Total Units 74
Launch Date 2Q 2012
Units Launched 74
Sold Based on Units Launched
76%
Strong Future Cashflow and Profit ContributionRobust sales of recent projects
4
18
Units Launched100 %
Expected TOP 1H 2013
Units Launched
Expected TOP 1H 2013
Units Launched
Expected TOP 2H 2014
East Village
Type Residential
Total Units 90
Launch Date 1Q 2012
Units Launched 90
Sold Based on Units Launched
100 %
Expected TOP 2H 2013
Type Retail
Total Units 108
Launch Date 1Q 2012
Units Launched 100
Sold Based on Units Launched
95 %
Expected TOP 2H 2013

Resi 100% sold
Retail 95% sold
East Village
Cardiff Residence� High revenue visibility
- Based on the units sold, the Group has locked in totalrevenue of more than S$400 million as at 30 Jun 2012which will be progressively recognised in accordance withthe stage of construction
Strong Future Cashflow and Profit ContributionRobust sales of recent projects
100% sold
4
� Good track records
26.0
49.2
150.0
200.0
250.0
Revenue & PBT
19
97% sold
76% sold
8 Bassein
Parc Rosewood
Retail 95% sold
137.8 81.9
177.5
74.4
9.0 26.5
-
50.0
100.0
FY09 FY10 FY11 1H12
18.9%
11.0%
27.7%
35.6%
0.0%
5.0%
10.0%
15.0%
20.0%
25.0%
30.0%
35.0%
40.0%
FY09 FY10 FY11 1H12
PBT Margin

5 Fast-Growing Developer with Strategic JV with FragranceHuge Potential from 3 newly-acquired sites
Tanah Merah Key Point Tai Keng Court
Type Residential
Total GFA
455,656
Target Launch
2H 2012
Est. No. 592 units
TypeRetail &
Residential
Total GFA 435,000
Target Launch
1H 2013
Est. No. Comm
450
Est. No. Resi 300
TypeRetail &
Residential
Total GFA 159,000
Target Launch
1H2013
Est. No Comm
100
Est. No. Resi 150
20
� Robust growth expected in revenue
- At current market prices, the potential sales revenue from the remaining unsold units of the projects launched and theprojects yet to be launched attributable to the Group is estimated to be in excess of S$1,000 million.
- Based on current prices, the Group is expected to enjoy a healthy margin from potential sales revenue for these projects.
� Increase in size of development
85,000
-
98,092
451,440
-
120,000
-
53,900
-
455,656 435,000
159,000
FY09 Apr'10 Nov'10 May'11 Jun'11 Mar'12 Apr'12 Aug'12
Tai Keng Court
Key Point
Tanah Merah
8 Bassein
East Village
Parc Rosewood
Cardiff Residence
GFA (sq. ft)

Excellent Stock Performance, MTN programme and Dividend Yield
6
� STOCK PEFORMANCE
� S$150 million Medium Term Note Programme
21
� Dividend
- The Group has proposed an interim dividend of 0.75 cents in 1H 2012 as compared to 0.50cents in 1H 2011 under its scrip dividend scheme
- The scrip dividend scheme which was introduced in January 2012, allows the Group to retaincash which would otherwise be payable as dividend. The cash is used to strengthen theGroup’s working capital and to fund future growth.
� S$150 million Medium Term Note Programme
- The Group established a S$150 million MTN programme in July 2012
- The Group has successfully launched and issued $85 million 3-year 5.00% notes under theprogramme
- The bond is used to support the Group’s working capital and to fund growth

ASPIALInvestor Presentation
OverviewAspial Corporation Ltd
Financials FY2009 – 1H2012
22
StrengthsGroup Highlights
OutlookStrategies Moving Forward
Conclusion

Outlook & Strategy
Financial Service
� Secure strategic locations where business is viable and Max-Cash is not represented
� Speed up planning and marketing of newly-acquired sites
� Rationalise store network to increase store efficiency
Strategy
� Demand for loans is likely to remain healthy
� Increasing acceptance of pawnbrokingas an alternative source of financing
Outlook
Property
Strategy
� URA Q2 2012 property index shows increase in residential property price
� Demand for property remains strong amidst the low-interest environment
Outlook
Jewellery
Strategy
� Singapore GDP growth expected to be about 1%
Outlook
23
represented
� Strengthen brand equity and awareness
� Ensure construction progress smoothly� Maintain tight control on operating cost

ASPIALInvestor Presentation
OverviewAspial Corporation Ltd
Financials FY2009 – 1H2012
24
StrengthsGroup Highlights
OutlookStrategies Moving Forward
Conclusion

Investment Highlights
Diversified revenue streams and strong revenue growth from property and financial service businessesDiversified revenue streams and strong revenue growth from property and financial service businesses
Strong financial performance supported by largely-sold property projectsStrong financial performance supported by largely-sold property projects
Market leaders and strong brand names for Pawnbroking and Jewellery businessesMarket leaders and strong brand names for Pawnbroking and Jewellery businesses
1
2
3
25
Jewellery businessesJewellery businesses
Strong future cash flow and profit from largely-sold property projectsStrong future cash flow and profit from largely-sold property projects
Fast-growing developer with strategic JV with Fragrance Group. Huge potential from 3 newly-acquired sites Fast-growing developer with strategic JV with Fragrance Group. Huge potential from 3 newly-acquired sites
Excellent stock performance, MTN programme and dividend yieldExcellent stock performance, MTN programme and dividend yield
3
4
5
6

Thank You
Aspial Corporation Limited
26

Important Notice
Important InformationThis presentation does not constitute or form any part of any offer or invitation to sell or issue, or any solicitation of any offer to subscribe for or purchase any securities and nothing
contained herein shall form the basis of or be relied upon in connection with any contract or commitment whatsoever. This presentation is being furnished to you solely for your
information and may not be reproduced or redistributed to any other person or published, in whole or in part, for any purpose. No representation or warranty, express or implied, of any
nature is given as to, and no reliance should be placed on, the fairness, correctness, accuracy or completeness of the information or opinions contained herein.
This presentation is being communicated only to persons who have professional experience in matters relating to investments and to persons to whom it may be lawful to communicate it
to (all such persons being referred to as "relevant persons"). This presentation is only directed at relevant persons. Solicitations resulting from this presentation will only be responded to if
the person concerned is a relevant person. Other persons should not rely or act upon this presentation or any of its contents.
The information and opinions in this presentation are provided as at the date of this presentation and are subject to change without notice. No assurance is made as to the accuracy of
this presentation and it may be incomplete or condensed and it may not contain all material information concerning the Company or the group of which the Company is a part (the
“Group”). The information in this presentation is not financial product advice and does not take into consideration the investment objectives, financial situation or particular needs of any
particular person. There is no obligation to update, modify or amend this communication or to otherwise notify the recipient if information, opinion, assumptions, projections, forecasts or
estimates set forth therein, changes or subsequently becomes inaccurate. None of United Engineering Limited (the "Company"), nor any member of the Group, nor any of their respective
affiliates, officers, employees, advisors or representatives shall have any liability whatsoever (in negligence or otherwise) for any loss howsoever arising from any use of or reliance on
the information or opinions contained in this presentation.
No offering of the Company’s securities will be registered under the U.S. Securities Act of 1933, as amended, or with any securities regulatory authority of any state or other jurisdiction of
the United States. Subject to certain exceptions, the Company’s securities may not be offered, sold or delivered within the United States or to, or for the account or benefit of, any U.S.
27
the United States. Subject to certain exceptions, the Company’s securities may not be offered, sold or delivered within the United States or to, or for the account or benefit of, any U.S.
person (as defined in Regulation S under the U.S. Securities Act).
Neither this presentation nor any copy of such presentation may be taken or transmitted into the United States or distributed, directly or indirectly, in the United States. The information
presented here is not an offer for sale within the United States of any securities of the Company.
The distribution of this presentation in certain jurisdictions may be restricted by law and persons into whose possession this presentation comes should inform themselves about, and
observe, any such restrictions.
By attending this presentation or by accepting this document, you will be taken to have represented, warranted and undertaken that: (i) you are a relevant person (as defined above); (ii)
you are not a person located in the United States or any agent, fiduciary or other intermediary acting on a non-discretionary basis for a principal giving instructions from within the United
States or any U.S. person; (iii) you are bound by the foregoing limitations; and (iv) that any investment in any securities of the Company will be made solely on the basis of the disclosure
document prepared by the Company and not on the basis of this presentation. Any failure to comply with these restrictions may constitute a limitation of applicable securities law.
Forward Looking StatementsThis presentation contains forward-looking statements which may be identified by their use of words like "plans", "expects", "will", “guidance"," anticipates", "believes", "intends", "projects",
"estimates" or other words of similar meaning. All statements that address expectations or projections about the future, including, but not limited to, statements about the strategy for
growth, product development, market position, expenditures, and financial results, are forward-looking statements.
All forward-looking statements are subject to risks and uncertainties as they are based on certain assumptions and expectations of future events. The Company cannot guarantee that
these assumptions and expectations are accurate or will be realised. The actual results, performance or achievements, could thus differ materially from those projected in any such
forward-looking statements. The Company has no obligation to, and does not intend to, publicly amend, modify or revise any forward looking statements, on the basis of any subsequent
developments, information or events, or otherwise.


![CKR Contract Services Pte Ltd v Asplenium Land Pte Ltd and ... · CKR Contract Services Pte Ltd v [2015] SGCA 24 Asplenium Land Pte Ltd 2 whether this clause was invalid andun enforceable](https://img.pdfslide.net/doc/110x75/5e4fb68444797e7a4f5fd6be/ckr-contract-services-pte-ltd-v-asplenium-land-pte-ltd-and-ckr-contract-services.jpg)


![Flexon (Pte) Ltd v Bean Innovations Pte Ltd and Another€¦ · Flexon (Pte) Ltd v Bean Innovations Pte Ltd and Another [2000] SGHC 219 ... The plaintiffs` mechanism (referred to](https://img.pdfslide.net/doc/110x75/5f5da0097df3824daf2154a2/flexon-pte-ltd-v-bean-innovations-pte-ltd-and-another-flexon-pte-ltd-v-bean.jpg)