Embed Size (px)
Citation preview

Investor Presentation
As of March 31, 2017
2
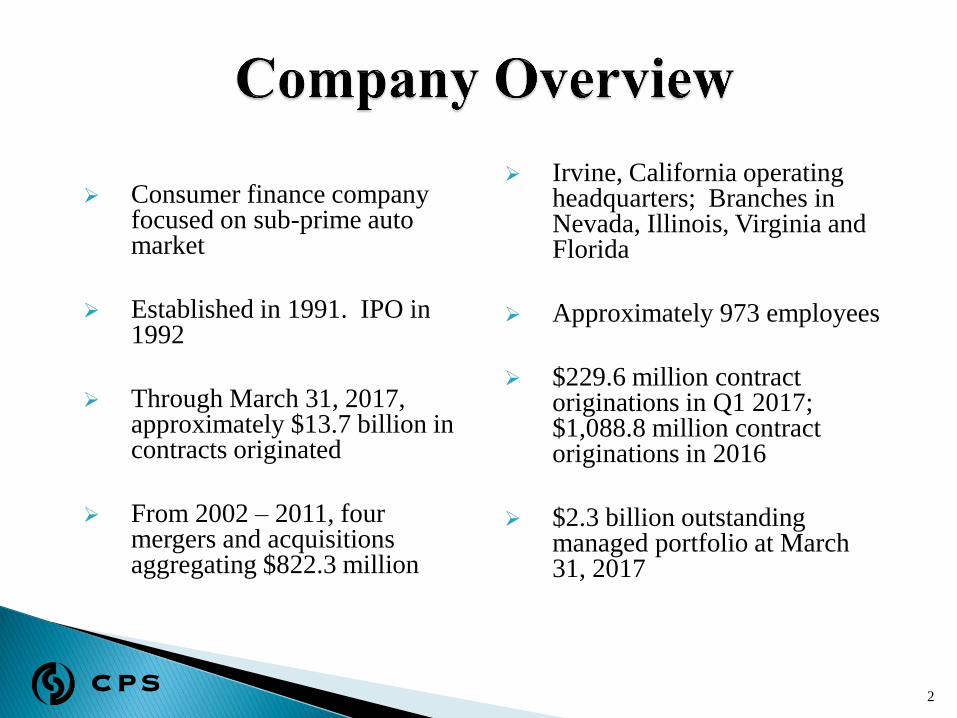
Consumer finance company focused on sub-prime auto market
Established in 1991. IPO in 1992
Through March 31, 2017, approximately $13.7 billion in contracts originated
From 2002 – 2011, four mergers and acquisitions aggregating $822.3 million
Irvine, California operating headquarters; Branches in Nevada, Illinois, Virginia and Florida
Approximately 973 employees
$229.6 million contract originations in Q1 2017; $1,088.8 million contract originations in 2016
$2.3 billion outstanding managed portfolio at March 31, 2017
3
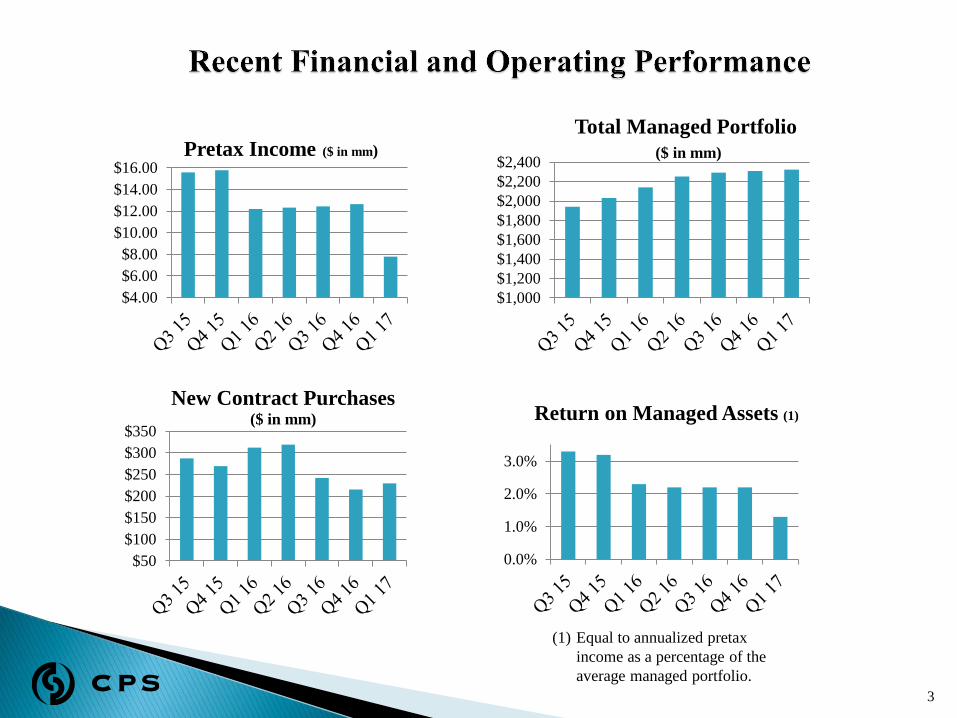
$1,000
$1,200
$1,400
$1,600
$1,800
$2,000
$2,200
$2,400
Total Managed Portfolio
($ in mm)
$4.00
$6.00
$8.00
$10.00
$12.00
$14.00
$16.00Pretax Income ($ in mm)
$50
$100
$150
$200
$250
$300
$350
New Contract Purchases ($ in mm)
(1) Equal to annualized pretax
income as a percentage of the
average managed portfolio.
0.0%
1.0%
2.0%
3.0%
Return on Managed Assets (1)
4
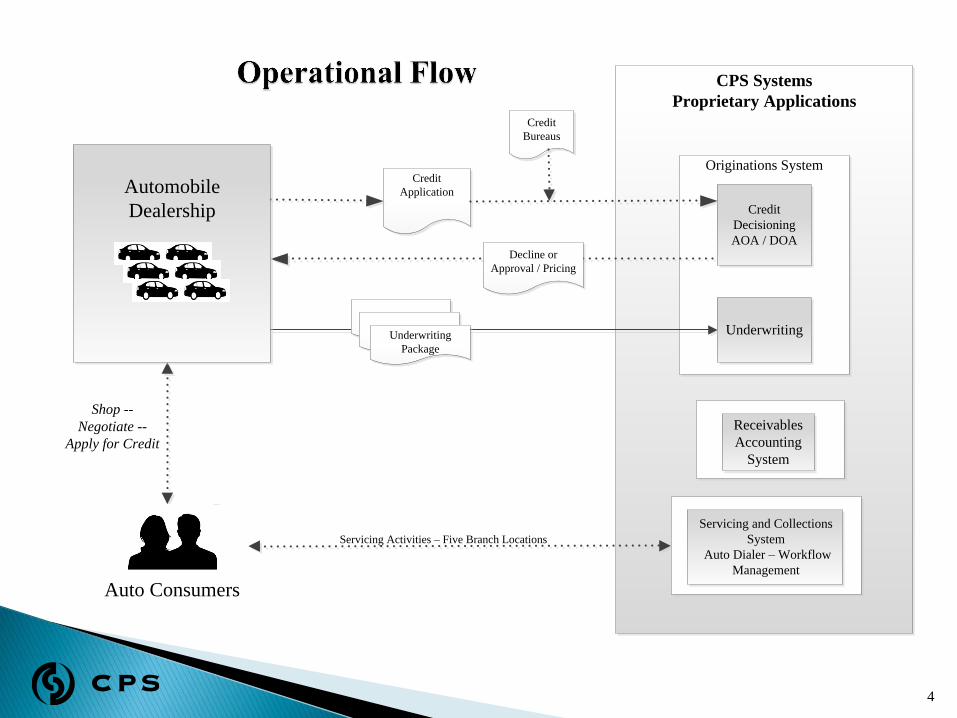
CPS Systems
Proprietary Applications
Credit
Decisioning
AOA / DOA
Underwriting
Servicing and Collections
System
Auto Dialer – Workflow
Management
Receivables
Accounting
System
Credit
Application
Servicing Activities – Five Branch Locations
Decline or
Approval / Pricing
Credit
Bureaus
Underwriting
Package
Originations System
Automobile
Dealership
Auto Consumers
Shop --
Negotiate --
Apply for Credit
5
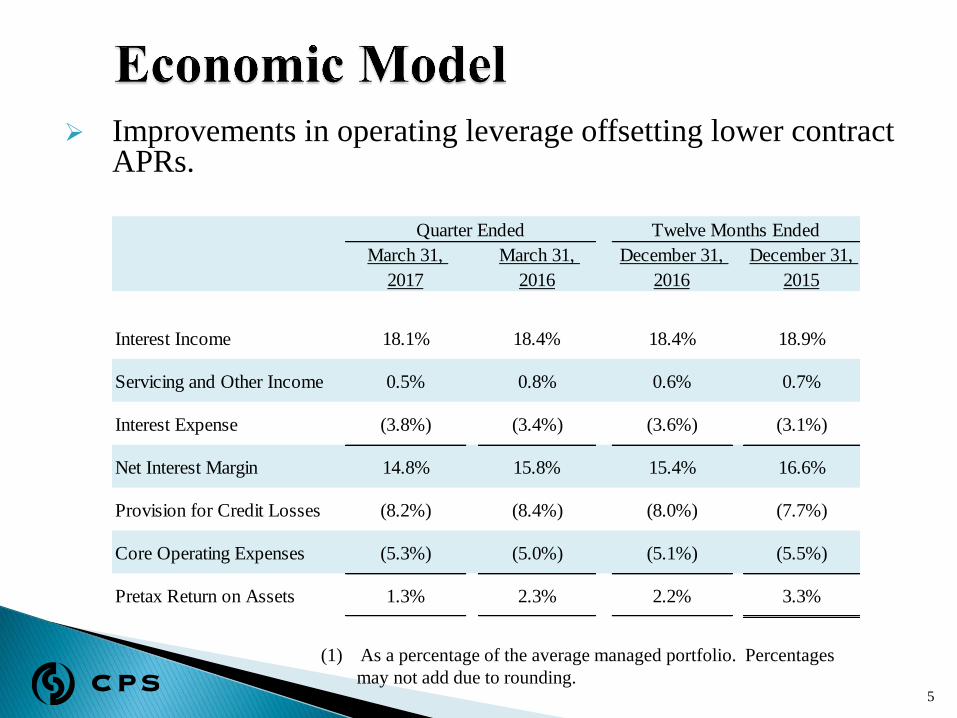
Improvements in operating leverage offsetting lower contract APRs.
(1) As a percentage of the average managed portfolio. Percentages
may not add due to rounding.
March 31,
2017
March 31,
2016
December 31,
2016
December 31,
2015
Interest Income 18.1% 18.4% 18.4% 18.9%
Servicing and Other Income 0.5% 0.8% 0.6% 0.7%
Interest Expense (3.8%) (3.4%) (3.6%) (3.1%)
Net Interest Margin 14.8% 15.8% 15.4% 16.6%
Provision for Credit Losses (8.2%) (8.4%) (8.0%) (7.7%)
Core Operating Expenses (5.3%) (5.0%) (5.1%) (5.5%)
Pretax Return on Assets 1.3% 2.3% 2.2% 3.3%
Quarter Ended Twelve Months Ended
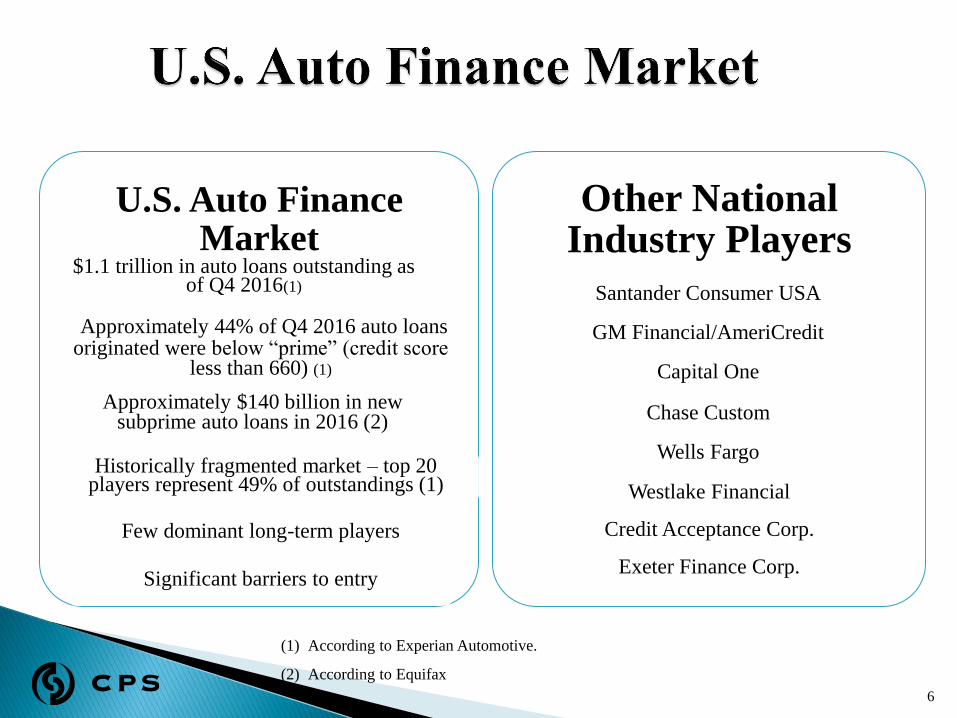
U.S. Auto Finance Market
$1.1 trillion in auto loans outstanding as of Q4 2016(1)
Approximately 44% of Q4 2016 auto loans originated were below “prime” (credit score
less than 660) (1)
Approximately $140 billion in new subprime auto loans in 2016 (2)
Historically fragmented market – top 20 players represent 49% of outstandings (1)
Few dominant long-term players
Significant barriers to entry
Other National Industry Players
Santander Consumer USA
GM Financial/AmeriCredit
Capital One
Chase Custom
Wells Fargo
Westlake Financial
Credit Acceptance Corp.
Exeter Finance Corp.
6
(1) According to Experian Automotive.
(2) According to Equifax
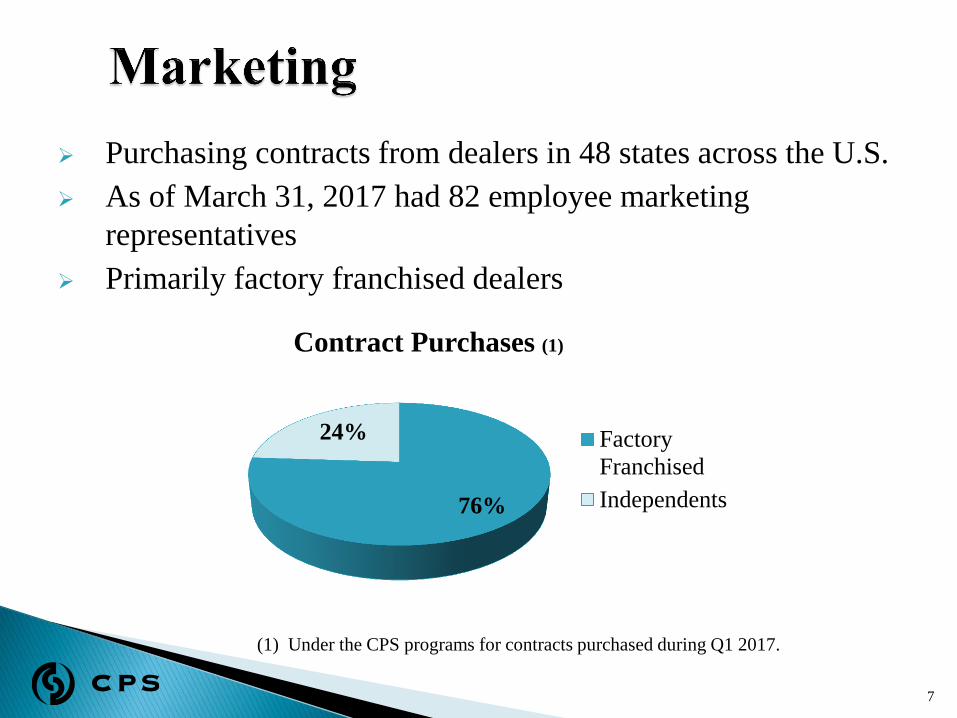
Purchasing contracts from dealers in 48 states across the U.S.
As of March 31, 2017 had 82 employee marketing
representatives
Primarily factory franchised dealers
7
(1) Under the CPS programs for contracts purchased during Q1 2017.
76%
24%
Contract Purchases (1)
Factory
Franchised
Independents
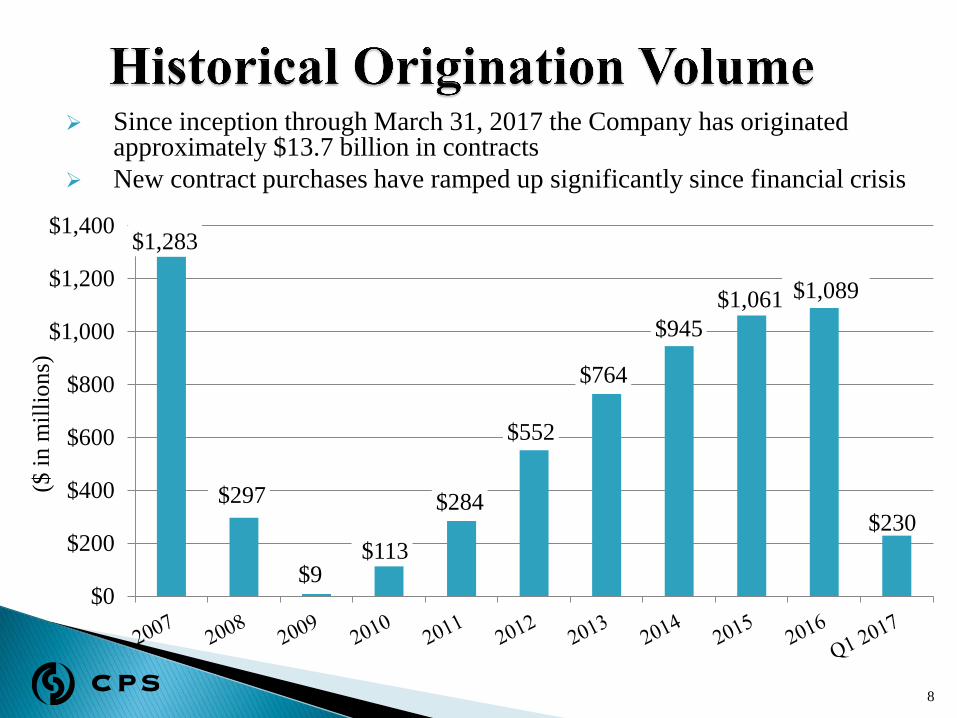
$284
$1,283
$297
$9 $113
$552
$764
$945
$0
$200
$400
$600
$800
$1,000
$1,200
$1,400
($ i
n m
illi
ons)
$1,089
8
Since inception through March 31, 2017 the Company has originated approximately $13.7 billion in contracts
New contract purchases have ramped up significantly since financial crisis
$1,061
$230
$0
$500
$1,000
$1,500
$2,000
$2,500
$898
($ i
n m
illi
on
s)
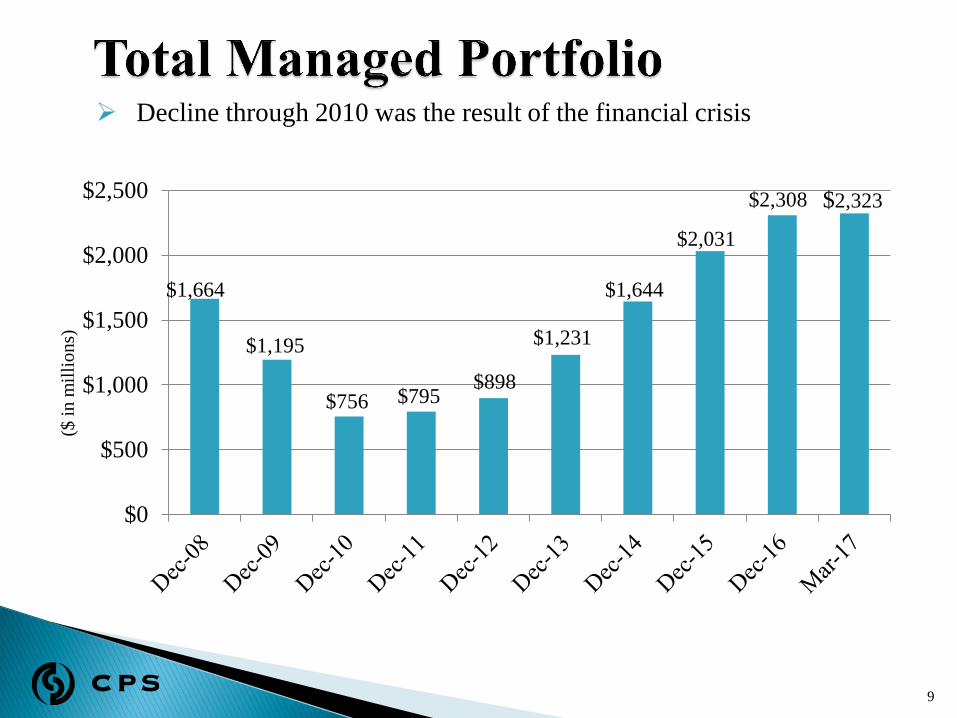
$2,308
$1,664
$1,195
$756 $795
$1,231
$1,644
$2,031
9
Decline through 2010 was the result of the financial crisis
$2,323
0%
4%
8%
12%
16%
20%
24%
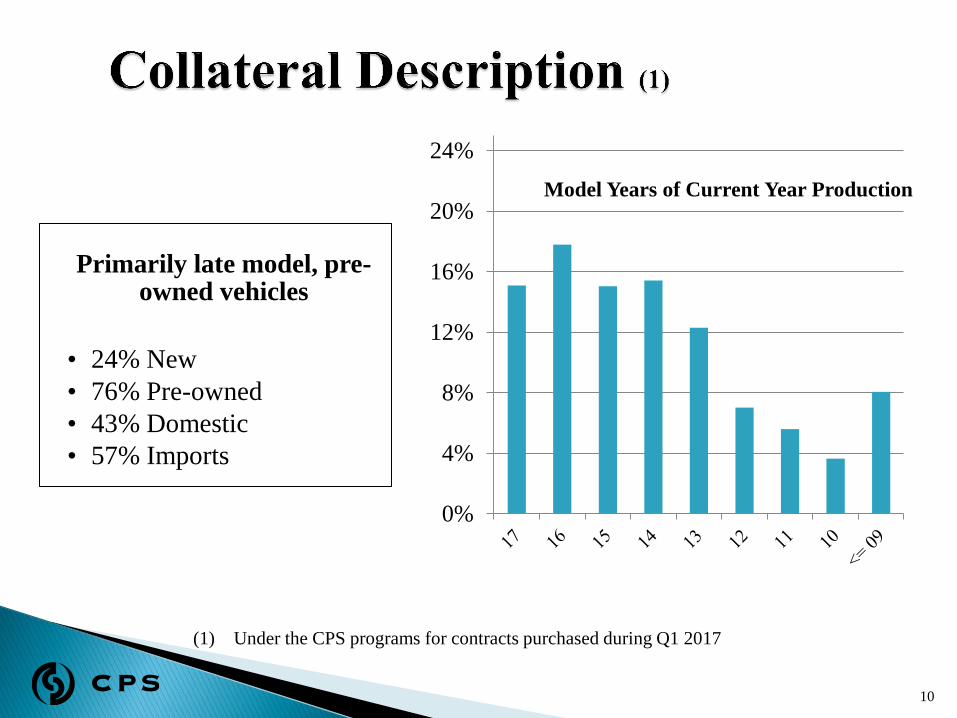
Model Years of Current Year Production
10
• 24% New
• 76% Pre-owned
• 43% Domestic
• 57% Imports
Primarily late model, pre-owned vehicles
(1) Under the CPS programs for contracts purchased during Q1 2017
11
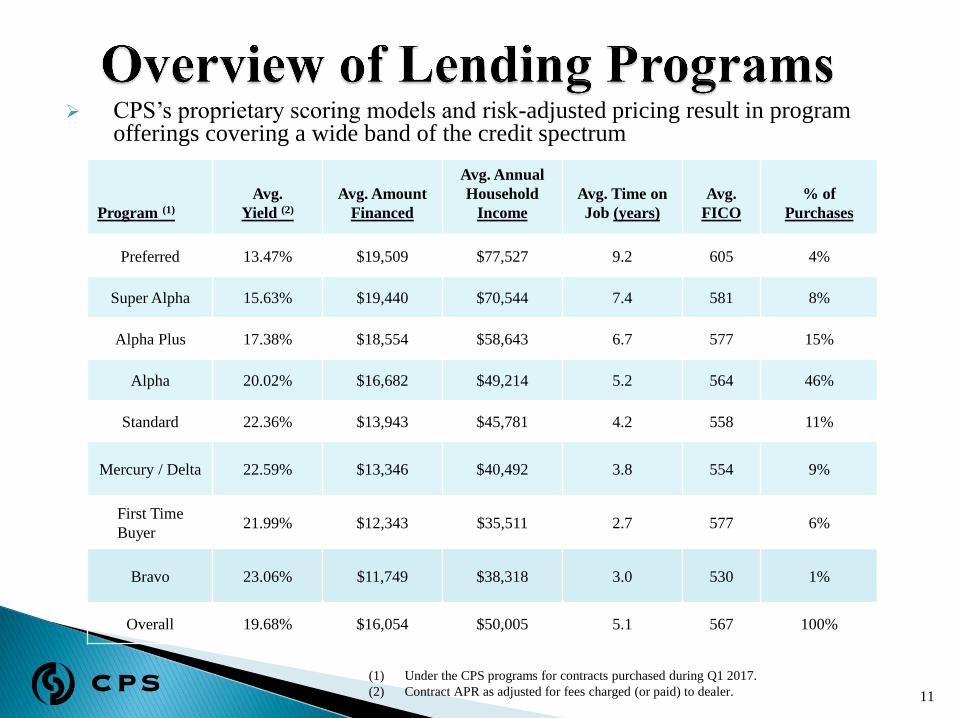
CPS’s proprietary scoring models and risk-adjusted pricing result in program offerings covering a wide band of the credit spectrum
(1) Under the CPS programs for contracts purchased during Q1 2017.
(2) Contract APR as adjusted for fees charged (or paid) to dealer.
Program (1)
Avg.
Yield (2)
Avg. Amount
Financed
Avg. Annual
Household
Income
Avg. Time on
Job (years)
Avg.
FICO
% of
Purchases
Preferred 13.47% $19,509 $77,527 9.2 605 4%
Super Alpha 15.63% $19,440 $70,544 7.4 581 8%
Alpha Plus 17.38% $18,554 $58,643 6.7 577 15%
Alpha 20.02% $16,682 $49,214 5.2 564 46%
Standard 22.36% $13,943 $45,781 4.2 558 11%
Mercury / Delta 22.59% $13,346 $40,492 3.8 554 9%
First Time
Buyer 21.99% $12,343 $35,511 2.7 577 6%
Bravo 23.06% $11,749 $38,318 3.0 530 1%
Overall 19.68% $16,054 $50,005 5.1 567 100%
12
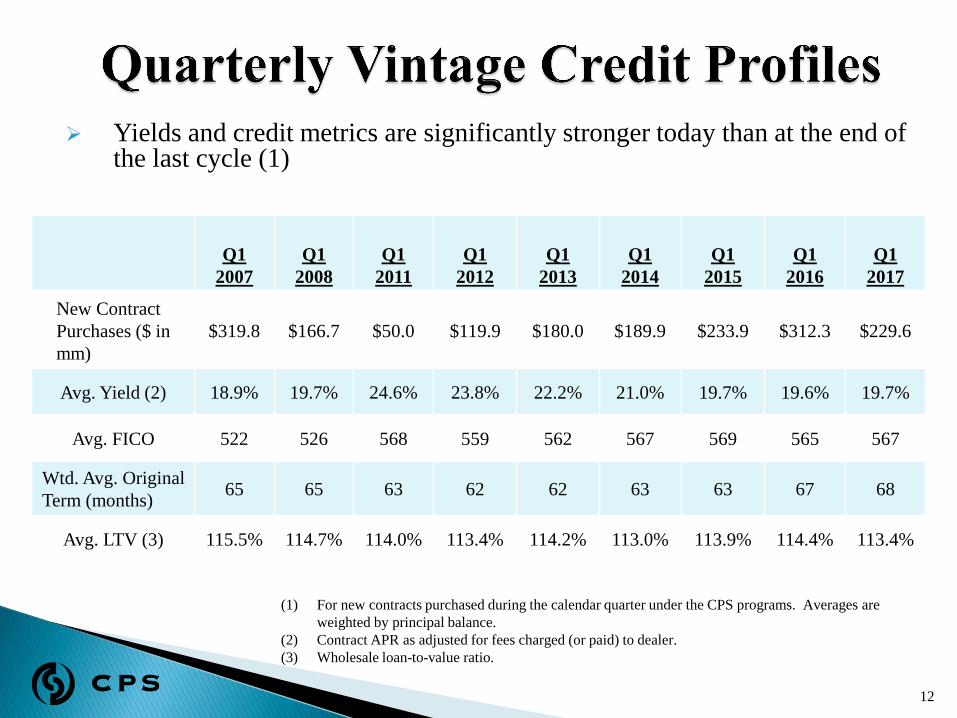
Yields and credit metrics are significantly stronger today than at the end of the last cycle (1)
(1) For new contracts purchased during the calendar quarter under the CPS programs. Averages are
weighted by principal balance.
(2) Contract APR as adjusted for fees charged (or paid) to dealer.
(3) Wholesale loan-to-value ratio.
Q1
2007
Q1
2008
Q1
2011
Q1
2012
Q1
2013
Q1
2014
Q1
2015
Q1
2016
Q1
2017
New Contract
Purchases ($ in
mm)
$319.8 $166.7 $50.0 $119.9 $180.0 $189.9 $233.9 $312.3 $229.6
Avg. Yield (2) 18.9% 19.7% 24.6% 23.8% 22.2% 21.0% 19.7% 19.6% 19.7%
Avg. FICO 522 526 568 559 562 567 569 565 567
Wtd. Avg. Original
Term (months) 65 65 63 62 62 63 63 67 68
Avg. LTV (3) 115.5% 114.7% 114.0% 113.4% 114.2% 113.0% 113.9% 114.4% 113.4%
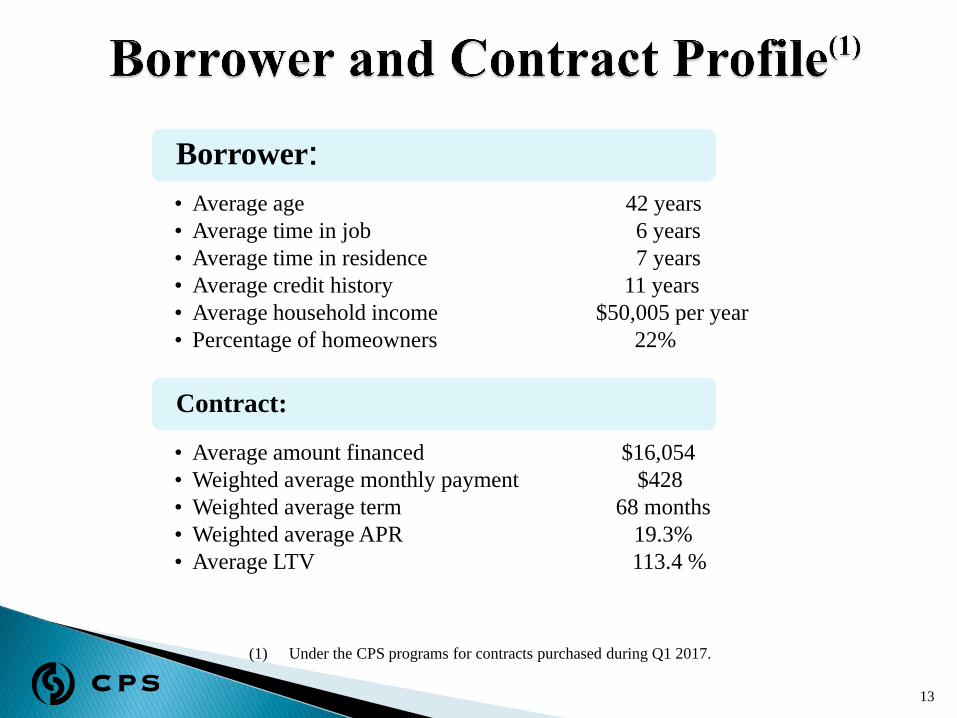
• Average age 42 years
• Average time in job 6 years
• Average time in residence 7 years
• Average credit history 11 years
• Average household income $50,005 per year
• Percentage of homeowners 22%
Borrower:
• Average amount financed $16,054
• Weighted average monthly payment $428
• Weighted average term 68 months
• Weighted average APR 19.3%
• Average LTV 113.4 %
Contract:
13
(1) Under the CPS programs for contracts purchased during Q1 2017.
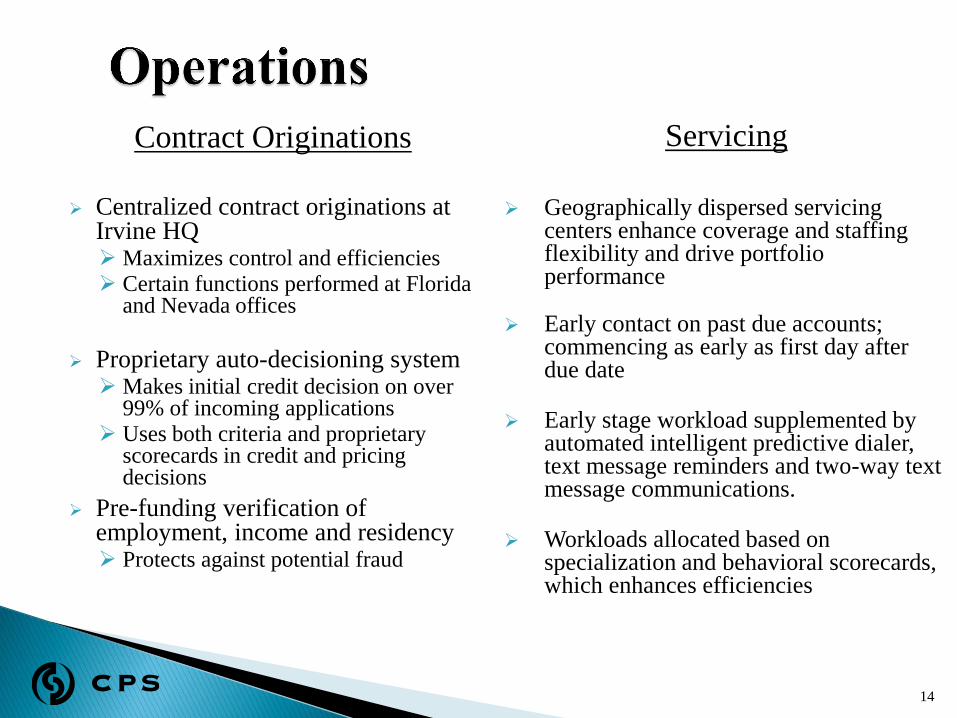
Contract Originations
Centralized contract originations at Irvine HQ Maximizes control and efficiencies Certain functions performed at Florida
and Nevada offices
Proprietary auto-decisioning system Makes initial credit decision on over
99% of incoming applications Uses both criteria and proprietary
scorecards in credit and pricing decisions
Pre-funding verification of employment, income and residency Protects against potential fraud
14
Servicing
Geographically dispersed servicing
centers enhance coverage and staffing flexibility and drive portfolio performance
Early contact on past due accounts; commencing as early as first day after due date
Early stage workload supplemented by automated intelligent predictive dialer, text message reminders and two-way text message communications.
Workloads allocated based on specialization and behavioral scorecards, which enhances efficiencies
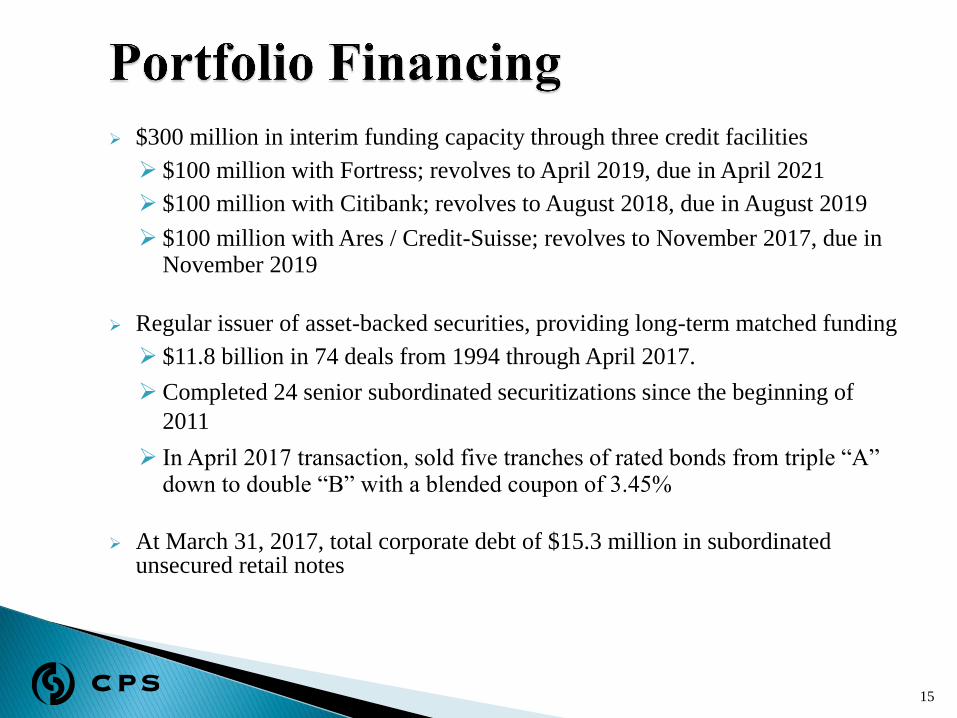
$300 million in interim funding capacity through three credit facilities
$100 million with Fortress; revolves to April 2019, due in April 2021
$100 million with Citibank; revolves to August 2018, due in August 2019
$100 million with Ares / Credit-Suisse; revolves to November 2017, due in November 2019
Regular issuer of asset-backed securities, providing long-term matched funding
$11.8 billion in 74 deals from 1994 through April 2017.
Completed 24 senior subordinated securitizations since the beginning of
2011
In April 2017 transaction, sold five tranches of rated bonds from triple “A” down to double “B” with a blended coupon of 3.45%
At March 31, 2017, total corporate debt of $15.3 million in subordinated unsecured retail notes
15
16
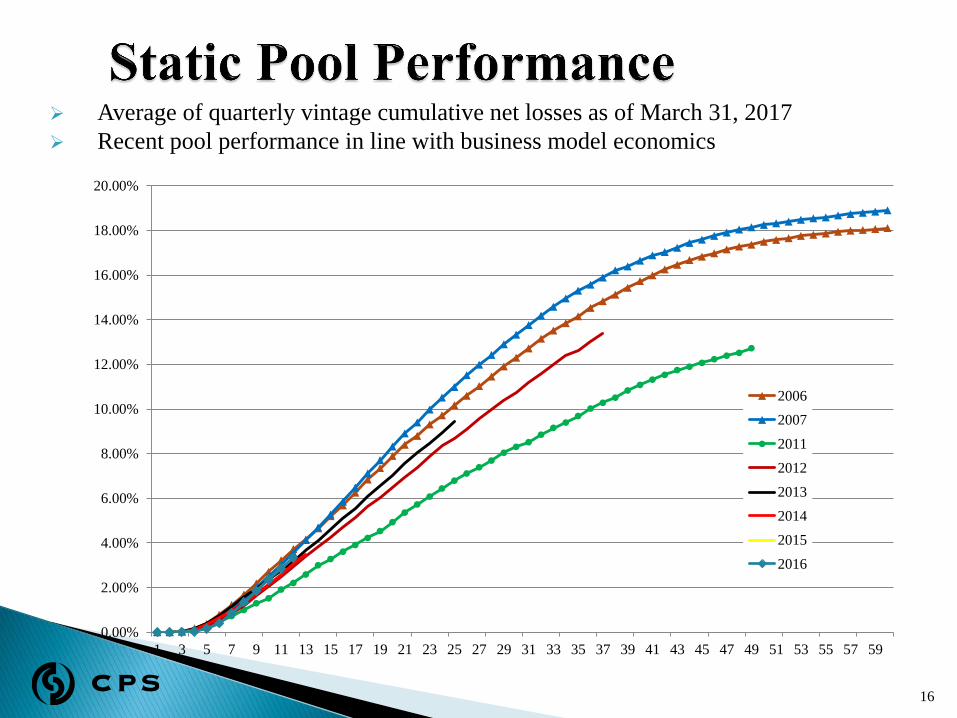
Average of quarterly vintage cumulative net losses as of March 31, 2017
Recent pool performance in line with business model economics
0.00%
2.00%
4.00%
6.00%
8.00%
10.00%
12.00%
14.00%
16.00%
18.00%
20.00%
1 3 5 7 9 11 13 15 17 19 21 23 25 27 29 31 33 35 37 39 41 43 45 47 49 51 53 55 57 59
2006
2007
2011
2012
2013
2014
2015
2016
17
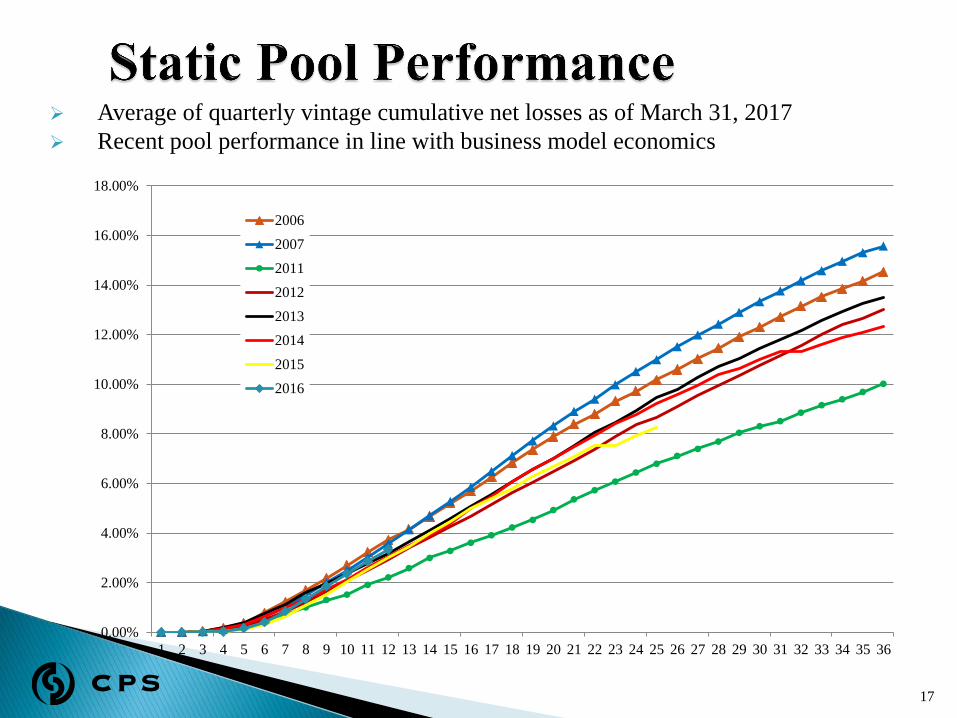
Average of quarterly vintage cumulative net losses as of March 31, 2017
Recent pool performance in line with business model economics
0.00%
2.00%
4.00%
6.00%
8.00%
10.00%
12.00%
14.00%
16.00%
18.00%
1 2 3 4 5 6 7 8 9 10 11 12 13 14 15 16 17 18 19 20 21 22 23 24 25 26 27 28 29 30 31 32 33 34 35 36
2006
2007
2011
2012
2013
2014
2015
2016
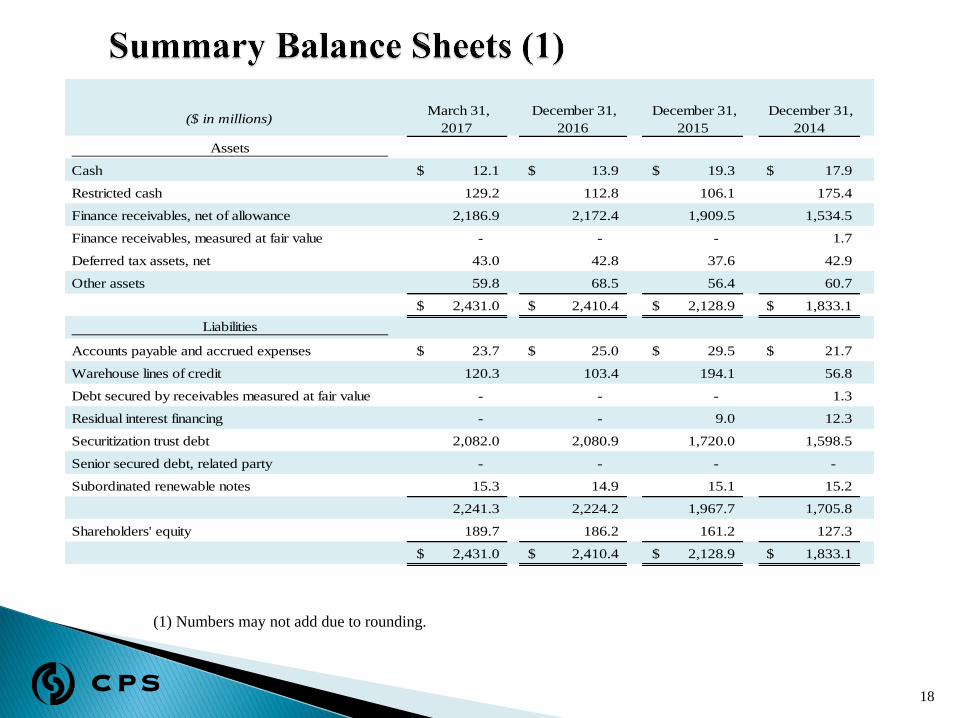
($ in millions) March 31,
2017
December 31,
2016
December 31,
2015
December 31,
2014
Assets
Cash 12.1$ 13.9$ 19.3$ 17.9$
Restricted cash 129.2 112.8 106.1 175.4
Finance receivables, net of allowance 2,186.9 2,172.4 1,909.5 1,534.5
Finance receivables, measured at fair value - - - 1.7
Deferred tax assets, net 43.0 42.8 37.6 42.9
Other assets 59.8 68.5 56.4 60.7
2,431.0$ 2,410.4$ 2,128.9$ 1,833.1$
Liabilities
Accounts payable and accrued expenses 23.7$ 25.0$ 29.5$ 21.7$
Warehouse lines of credit 120.3 103.4 194.1 56.8
Debt secured by receivables measured at fair value - - - 1.3
Residual interest financing - - 9.0 12.3
Securitization trust debt 2,082.0 2,080.9 1,720.0 1,598.5
Senior secured debt, related party - - - -
Subordinated renewable notes 15.3 14.9 15.1 15.2
2,241.3 2,224.2 1,967.7 1,705.8
Shareholders' equity 189.7 186.2 161.2 127.3
2,431.0$ 2,410.4$ 2,128.9$ 1,833.1$
18
(1) Numbers may not add due to rounding.
19
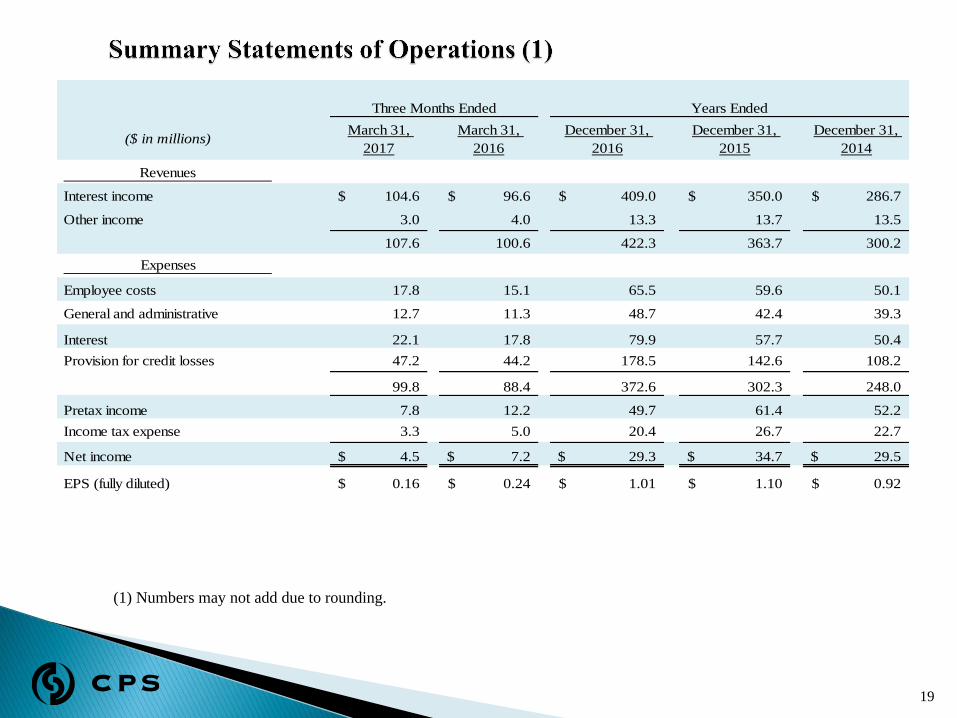
($ in millions) March 31,
2017
March 31,
2016
December 31,
2016
December 31,
2015
December 31,
2014
Revenues
Interest income 104.6$ 96.6$ 409.0$ 350.0$ 286.7$
Other income 3.0 4.0 13.3 13.7 13.5
107.6 100.6 422.3 363.7 300.2
Expenses
Employee costs 17.8 15.1 65.5 59.6 50.1
General and administrative 12.7 11.3 48.7 42.4 39.3
Interest 22.1 17.8 79.9 57.7 50.4
Provision for credit losses 47.2 44.2 178.5 142.6 108.2
99.8 88.4 372.6 302.3 248.0
Pretax income 7.8 12.2 49.7 61.4 52.2
Income tax expense 3.3 5.0 20.4 26.7 22.7
Net income 4.5$ 7.2$ 29.3$ 34.7$ 29.5$
EPS (fully diluted) 0.16$ 0.24$ 1.01$ 1.10$ 0.92$
Years EndedThree Months Ended
(1) Numbers may not add due to rounding.
20
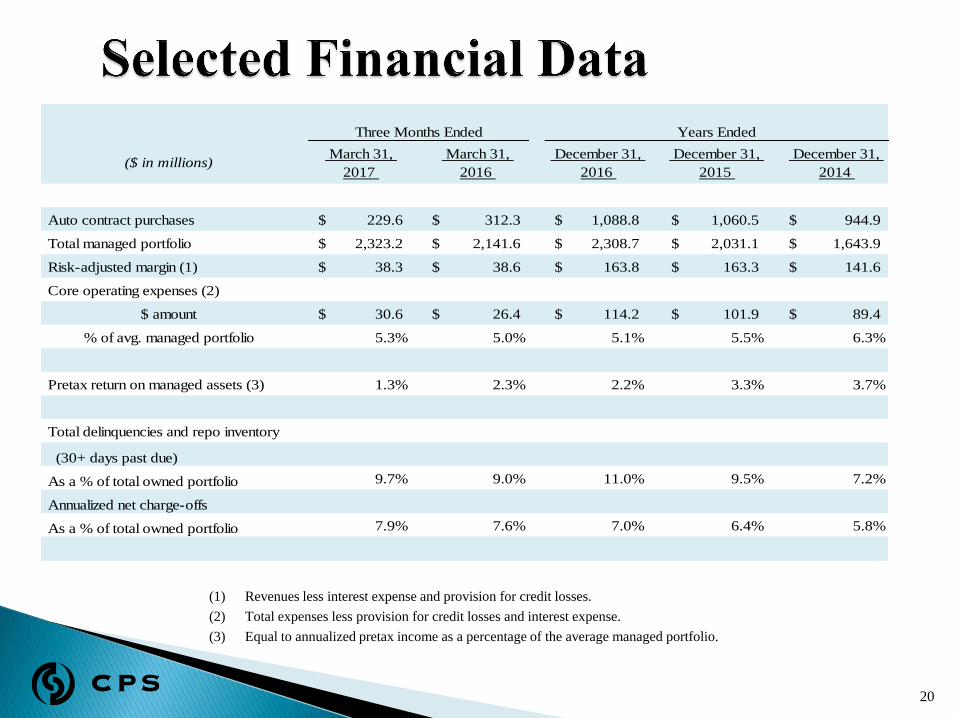
(1) Revenues less interest expense and provision for credit losses.
(2) Total expenses less provision for credit losses and interest expense.
(3) Equal to annualized pretax income as a percentage of the average managed portfolio.
($ in millions) March 31,
2017
March 31,
2016
December 31,
2016
December 31,
2015
December 31,
2014
Auto contract purchases 229.6$ 312.3$ 1,088.8$ 1,060.5$ 944.9$
Total managed portfolio 2,323.2$ 2,141.6$ 2,308.7$ 2,031.1$ 1,643.9$
Risk-adjusted margin (1) 38.3$ 38.6$ 163.8$ 163.3$ 141.6$
Core operating expenses (2)
$ amount 30.6$ 26.4$ 114.2$ 101.9$ 89.4$
% of avg. managed portfolio 5.3% 5.0% 5.1% 5.5% 6.3%
Pretax return on managed assets (3) 1.3% 2.3% 2.2% 3.3% 3.7%
Total delinquencies and repo inventory
(30+ days past due)
As a % of total owned portfolio 9.7% 9.0% 11.0% 9.5% 7.2%
Annualized net charge-offs
As a % of total owned portfolio 7.9% 7.6% 7.0% 6.4% 5.8%
Three Months Ended Years Ended
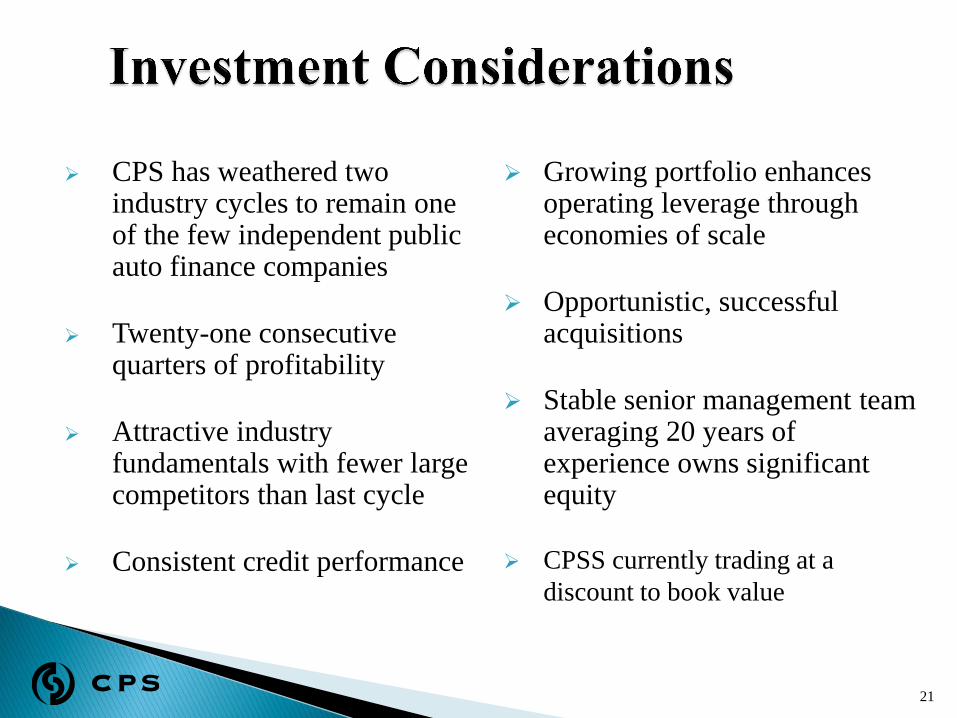
CPS has weathered two industry cycles to remain one of the few independent public auto finance companies
Twenty-one consecutive quarters of profitability
Attractive industry fundamentals with fewer large competitors than last cycle
Consistent credit performance
21
Growing portfolio enhances operating leverage through economies of scale
Opportunistic, successful acquisitions
Stable senior management team averaging 20 years of experience owns significant equity
CPSS currently trading at a
discount to book value
Any person considering an investment in securities issued by CPS is urged to review
the materials filed by CPS with the U.S. Securities and Exchange Commission
("Commission"). Such materials may be found by inquiring of the Commission‘s
EDGAR search page (http://www.sec.gov/edgar/searchedgar/companysearch.html)
using CPS's ticker symbol, which is "CPSS." Risk factors that should be considered
are described in Item 1A, “Risk Factors," of CPS's annual report on Form 10-K,
which report is on file with the Commission and available for review at the
Commission's website. Such description of risk factors is incorporated herein by
reference.
22
Information included in the preceding slides is believed to be accurate, but is not
necessarily complete. Such information should be reviewed in its appropriate
context. The implication that historical trends will continue in the future, or that
past performance is indicative of future results, is disclaimed. To the extent that one
reading the preceding material nevertheless makes such an inference, such inference
would be a forward-looking statement, and would be subject to risks and
uncertainties that could cause actual results to vary. Such risks include variable
economic conditions, adverse portfolio performance (resulting, for example, from
increased defaults by the underlying obligors), volatile wholesale values of
collateral underlying CPS assets, reliance on warehouse financing and on the capital
markets, fluctuating interest rates, increased competition, regulatory changes, the
risk of obligor default inherent in sub-prime financing, and exposure to litigation.
23


![Financial Results with Investor Presentation, Results Press Release & Auditors Report for March 31, 2015 [Result]](https://img.pdfslide.net/doc/110x75/577cb48f1a28aba7118c84de/financial-results-with-investor-presentation-results-press-release-auditors.jpg)


![Investor Presentation for March 31, 2016 [Company Update]](https://img.pdfslide.net/doc/110x75/577c7cff1a28abe0549cedb7/investor-presentation-for-march-31-2016-company-update.jpg)