Embed Size (px)
Citation preview
Investor Presentation
December 2013
24.02.2014
Table of Contents
1. Thai economy
2. Strengthening bank and client base
3. BBL’s financial results
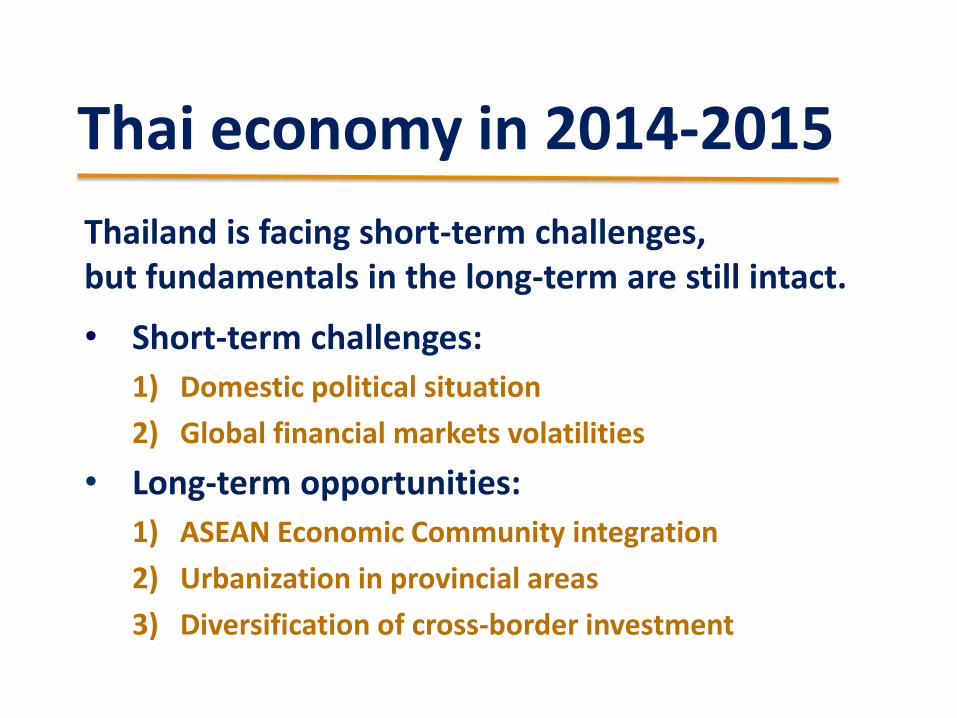
Thailand is facing short-term challenges, but fundamentals in the long-term are still intact.
• Short-term challenges:
1) Domestic political situation
2) Global financial markets volatilities
• Long-term opportunities:
1) ASEAN Economic Community integration
2) Urbanization in provincial areas
3) Diversification of cross-border investment
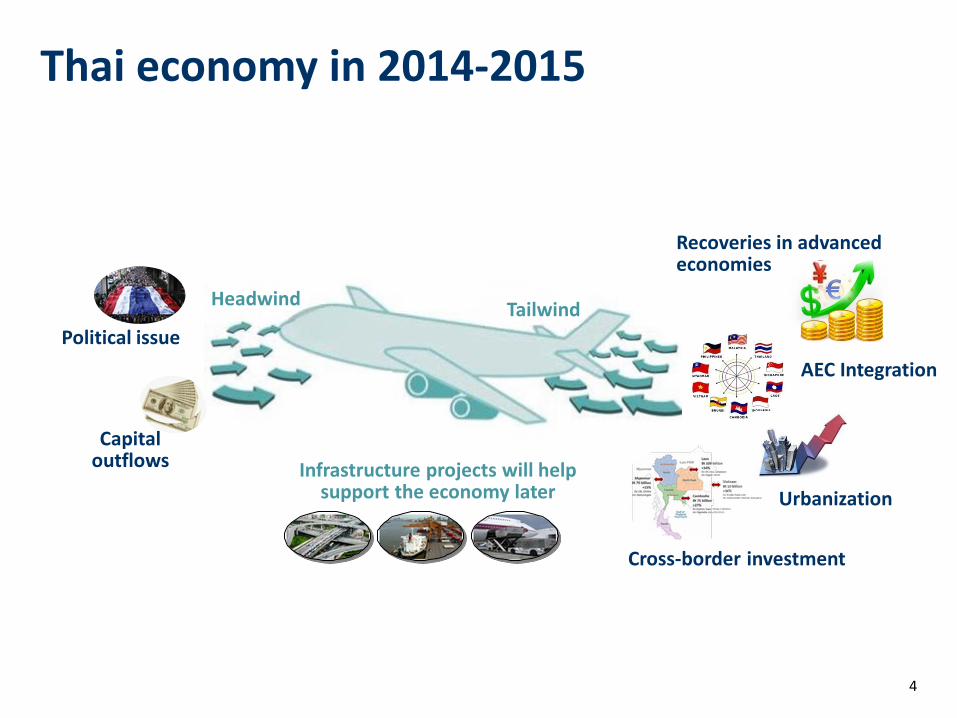
Thai economy in 2014-2015
4
Political issue
AEC Integration
Urbanization
Cross-border investment
Thai economy in 2014-2015
Infrastructure projects will help support the economy later
Headwind Tailwind
Capital outflows
Recoveries in advanced economies
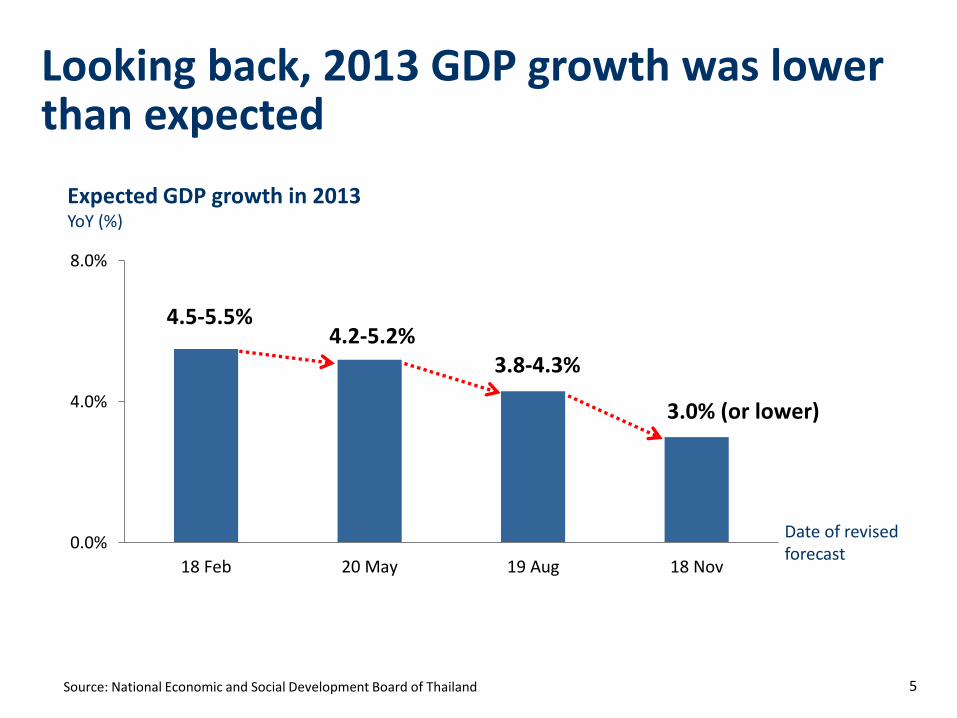
Source: National Economic and Social Development Board of Thailand
Expected GDP growth in 2013 YoY (%)
0.0%
4.0%
8.0%
18 Feb 20 May 19 Aug 18 Nov
5
4.5-5.5% 4.2-5.2%
3.8-4.3%
3.0% (or lower)
Date of revised forecast
Looking back, 2013 GDP growth was lower than expected
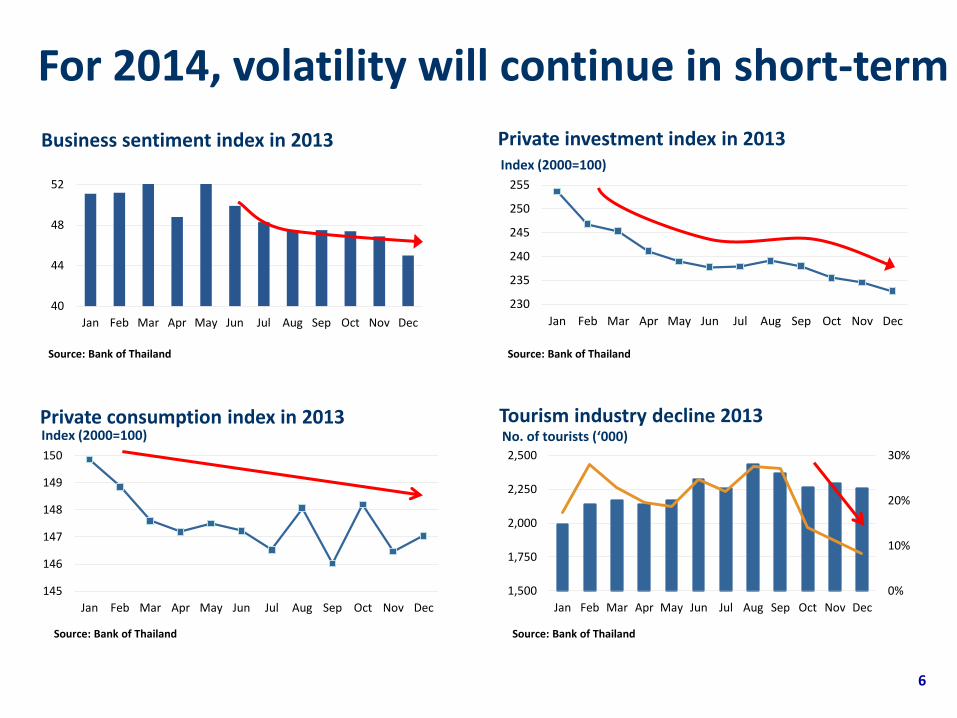
40
44
48
52
Jan Feb Mar Apr May Jun Jul Aug Sep Oct Nov Dec
Business sentiment index in 2013
Source: Bank of Thailand
145
146
147
148
149
150
Jan Feb Mar Apr May Jun Jul Aug Sep Oct Nov Dec
Private consumption index in 2013 Index (2000=100)
Source: Bank of Thailand
0%
10%
20%
30%
1,500
1,750
2,000
2,250
2,500
Jan Feb Mar Apr May Jun Jul Aug Sep Oct Nov Dec
Tourism industry decline 2013 No. of tourists (‘000)
Source: Bank of Thailand
230
235
240
245
250
255
Jan Feb Mar Apr May Jun Jul Aug Sep Oct Nov Dec
Private investment index in 2013
Source: Bank of Thailand
Index (2000=100)
6
For 2014, volatility will continue in short-term
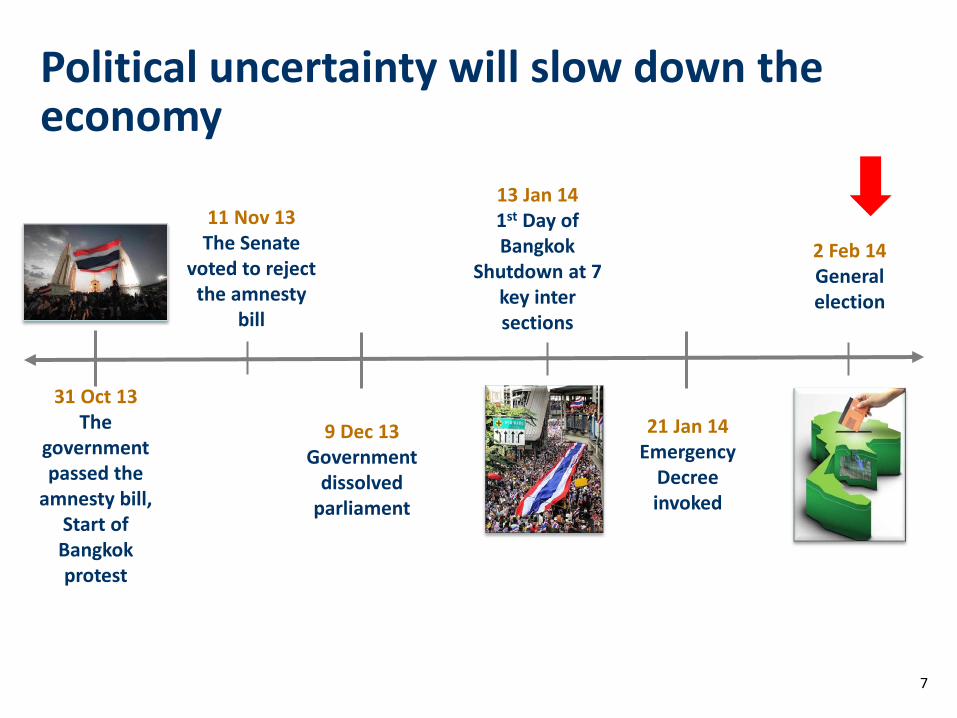
Political uncertainty will slow down the economy
7
31 Oct 13 The
government passed the
amnesty bill, Start of Bangkok protest
9 Dec 13 Government
dissolved parliament
13 Jan 14 1st Day of Bangkok
Shutdown at 7 key inter sections
11 Nov 13 The Senate
voted to reject the amnesty
bill
21 Jan 14 Emergency
Decree invoked
2 Feb 14 General election
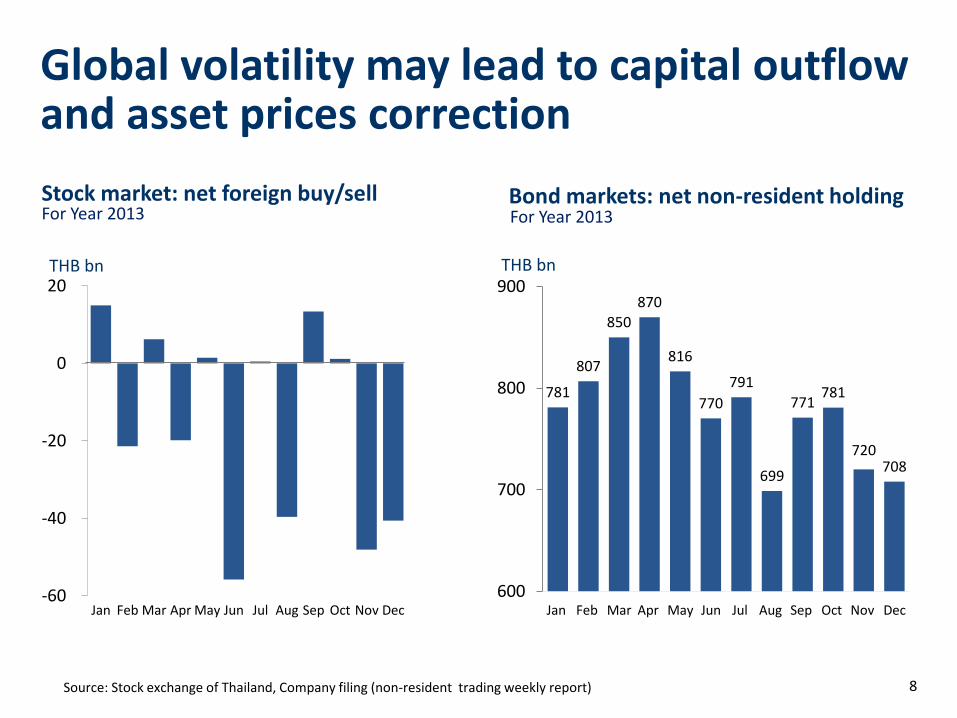
Global volatility may lead to capital outflow and asset prices correction
8 Source: Stock exchange of Thailand, Company filing (non-resident trading weekly report)
-60
-40
-20
0
20
Jan Feb Mar Apr May Jun Jul Aug Sep Oct Nov Dec
THB bn
Stock market: net foreign buy/sell For Year 2013 Bond markets: net non-resident holding
781
807
850
870
816
770
791
699
771 781
720 708
600
700
800
900
Jan Feb Mar Apr May Jun Jul Aug Sep Oct Nov Dec
For Year 2013
THB bn
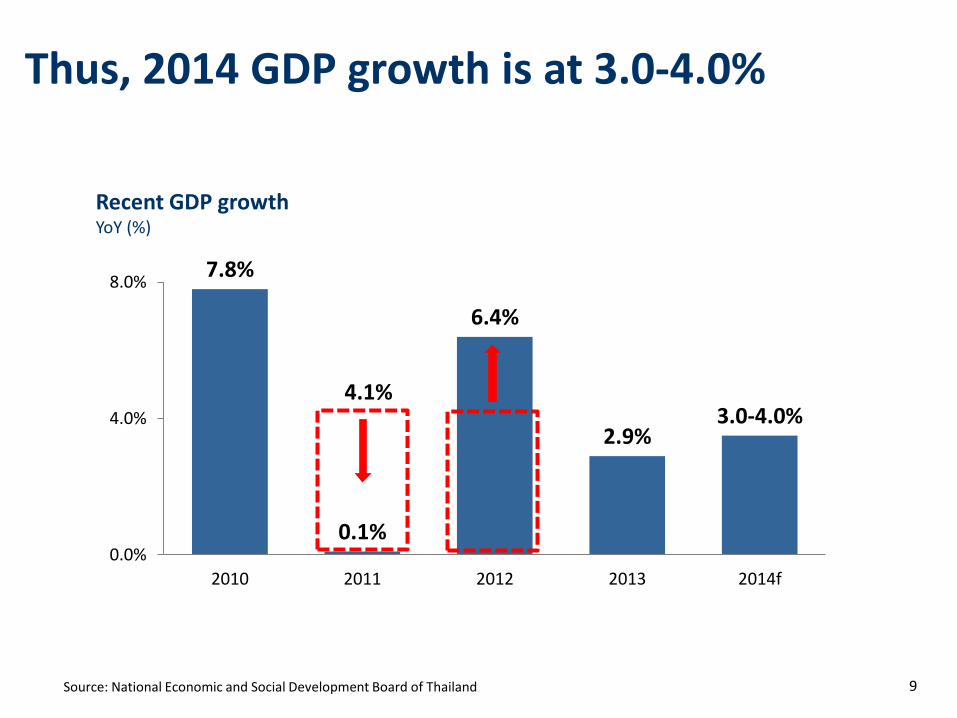
Thus, 2014 GDP growth is at 3.0-4.0%
Source: National Economic and Social Development Board of Thailand
Recent GDP growth YoY (%)
7.8%
0.1%
6.4%
2.9% 3.0-4.0%
0.0%
4.0%
8.0%
2010 2011 2012 2013 2014f
4.1%
9
10
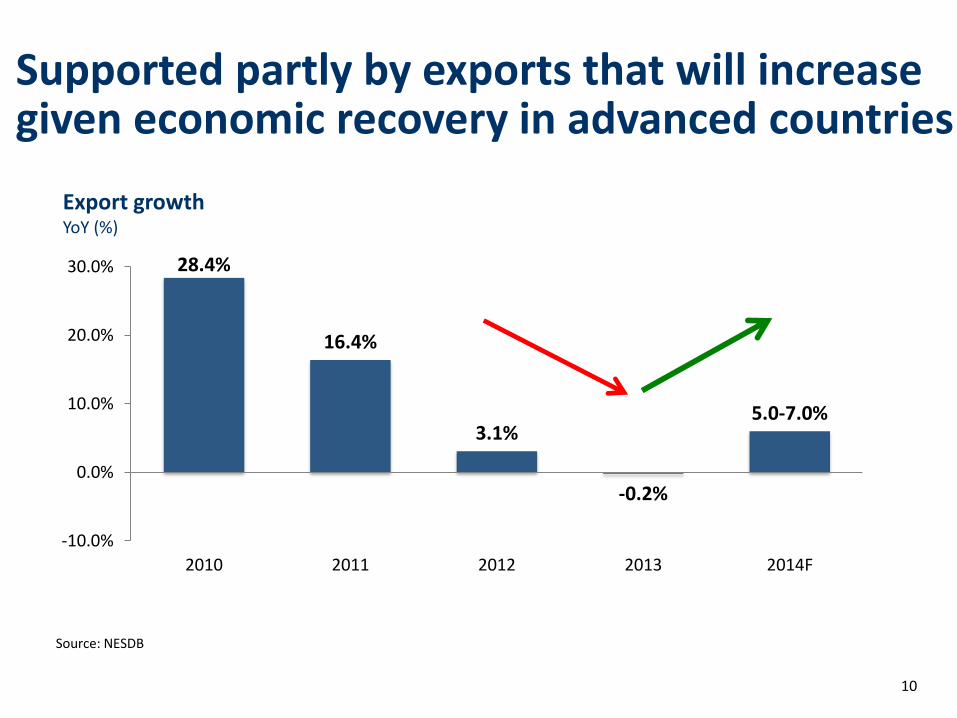
28.4%
16.4%
3.1%
-0.2%
5.0-7.0%
-10.0%
0.0%
10.0%
20.0%
30.0%
2010 2011 2012 2013 2014F
Source: NESDB
Supported partly by exports that will increase given economic recovery in advanced countries
Export growth
YoY (%)
11
We continue to strengthen ourselves according to long-term fundamental
drivers that are still intact
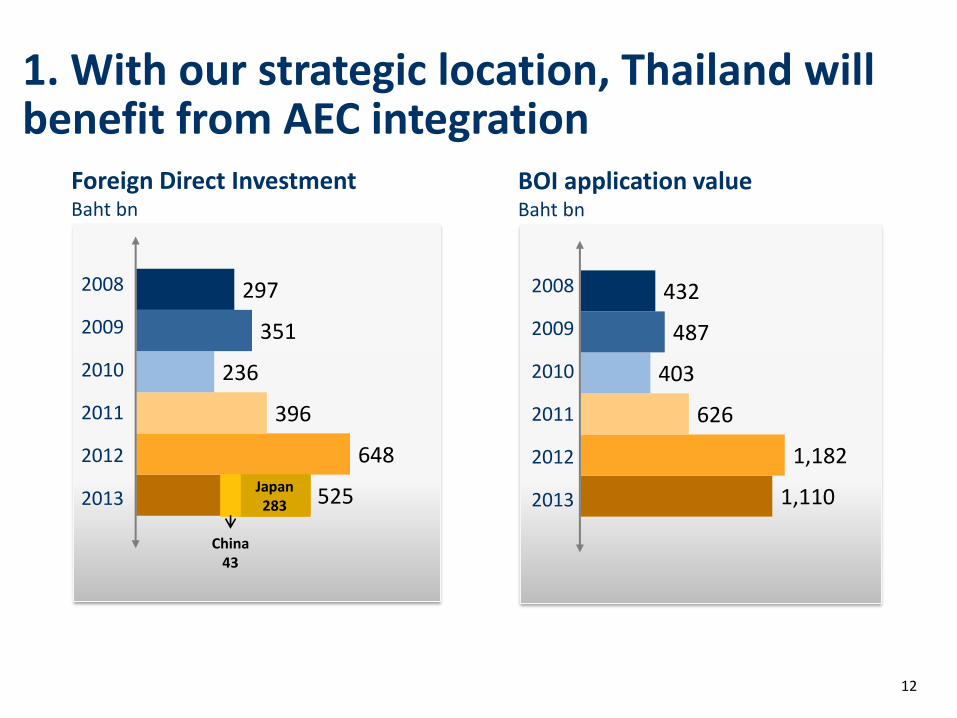
1. With our strategic location, Thailand will benefit from AEC integration
12
1,110
1,182
626
403
487
432
BOI application value Baht bn
2008
2009
2010
2011
2012
2013 525
648
396
236
351
297
Foreign Direct Investment Baht bn
2008
2009
2010
2011
2012
2013 Japan 283
China 43
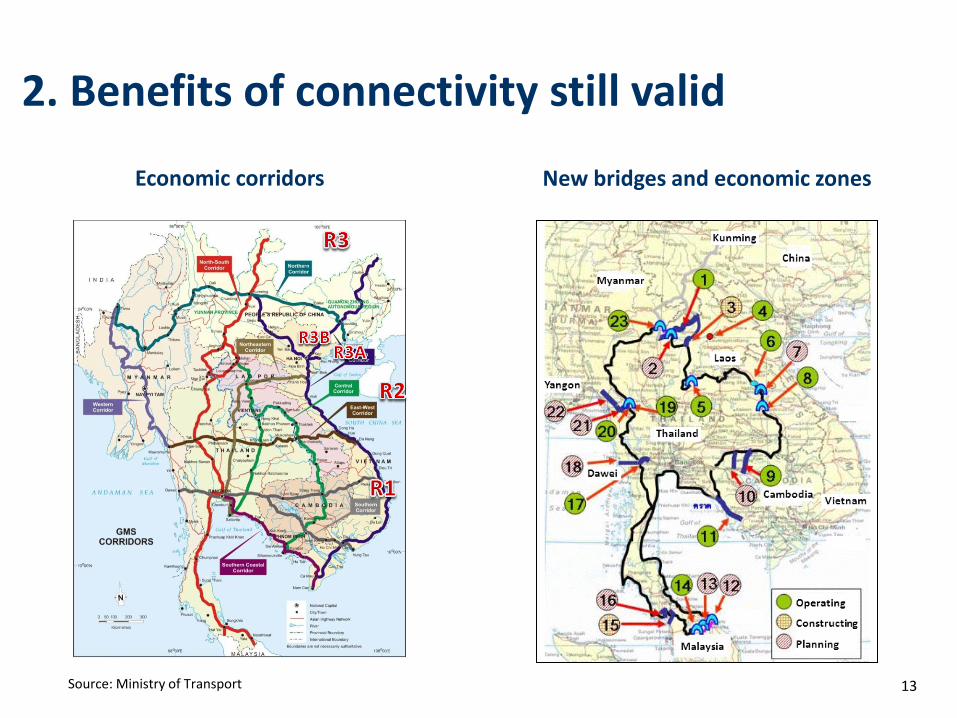
Source: Ministry of Transport
2. Benefits of connectivity still valid
Economic corridors New bridges and economic zones
13
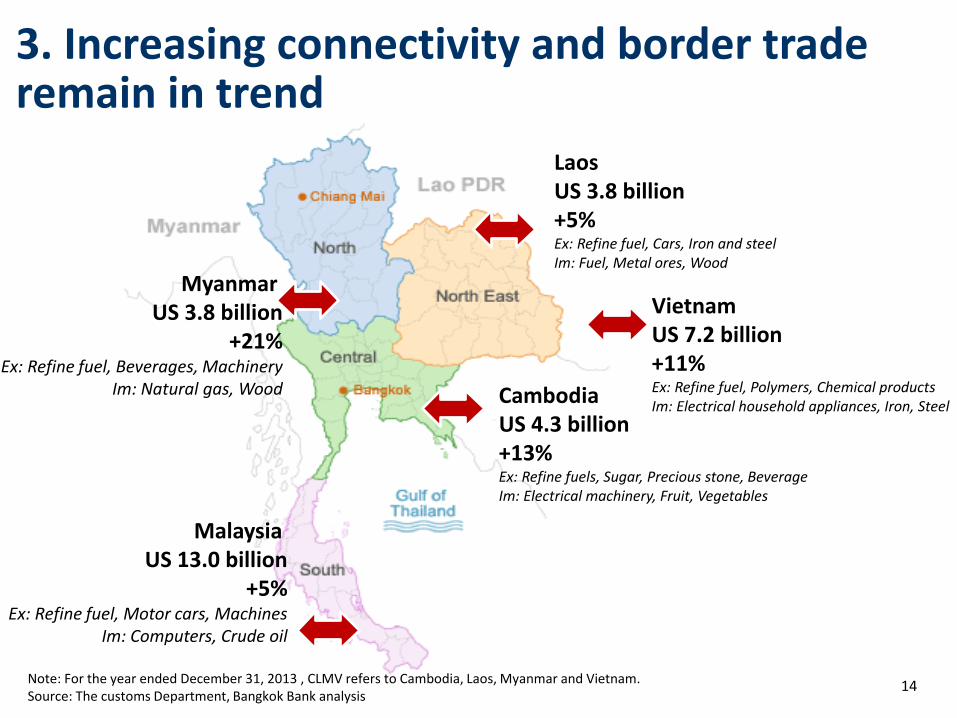
3. Increasing connectivity and border trade remain in trend
14 Note: For the year ended December 31, 2013 , CLMV refers to Cambodia, Laos, Myanmar and Vietnam. Source: The customs Department, Bangkok Bank analysis
Myanmar US 3.8 billion
+21% Ex: Refine fuel, Beverages, Machinery
Im: Natural gas, Wood
Laos US 3.8 billion +5% Ex: Refine fuel, Cars, Iron and steel Im: Fuel, Metal ores, Wood
Cambodia US 4.3 billion +13% Ex: Refine fuels, Sugar, Precious stone, Beverage Im: Electrical machinery, Fruit, Vegetables
Vietnam US 7.2 billion +11% Ex: Refine fuel, Polymers, Chemical products Im: Electrical household appliances, Iron, Steel
Malaysia US 13.0 billion
+5% Ex: Refine fuel, Motor cars, Machines Im: Computers, Crude oil
15
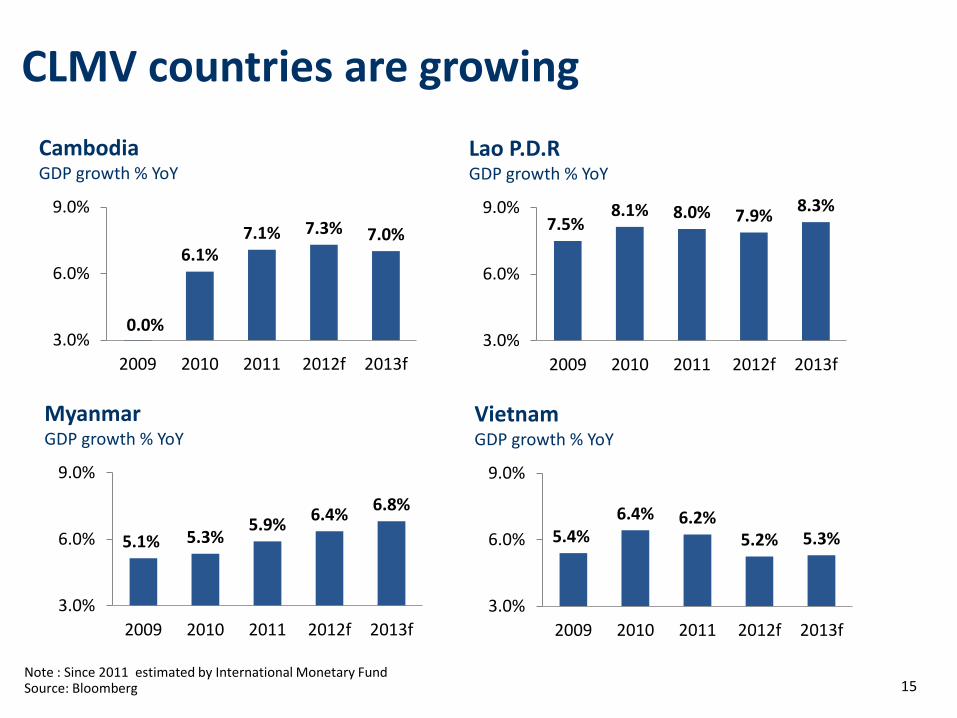
CLMV countries are growing
6.1% 7.1% 7.3% 7.0%
3.0%
6.0%
9.0%
2009 2010 2011 2012f 2013f
Note : Since 2011 estimated by International Monetary Fund Source: Bloomberg
Cambodia GDP growth % YoY
5.1% 5.3% 5.9%
6.4% 6.8%
3.0%
6.0%
9.0%
2009 2010 2011 2012f 2013f
Myanmar GDP growth % YoY
7.5% 8.1% 8.0% 7.9%
8.3%
3.0%
6.0%
9.0%
2009 2010 2011 2012f 2013f
Lao P.D.R GDP growth % YoY
5.4% 6.4% 6.2%
5.2% 5.3%
3.0%
6.0%
9.0%
2009 2010 2011 2012f 2013f
Vietnam GDP growth % YoY
0.0%
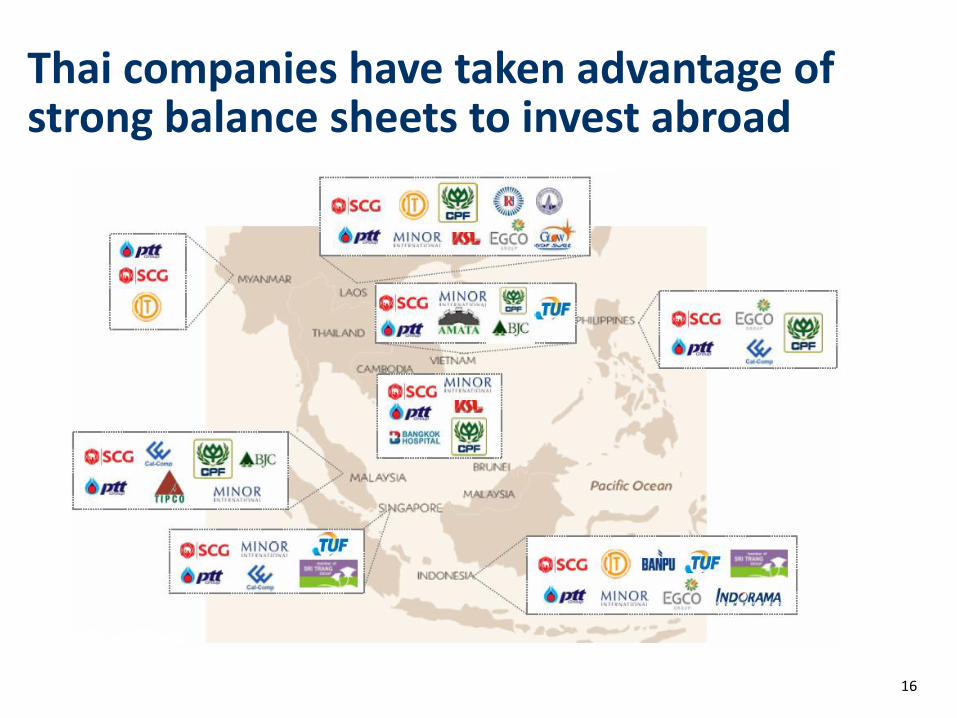
Thai companies have taken advantage of strong balance sheets to invest abroad
16
Bangkok Bank
Conservative balance sheet and superior liquidity management– no concerns from short-term challenges
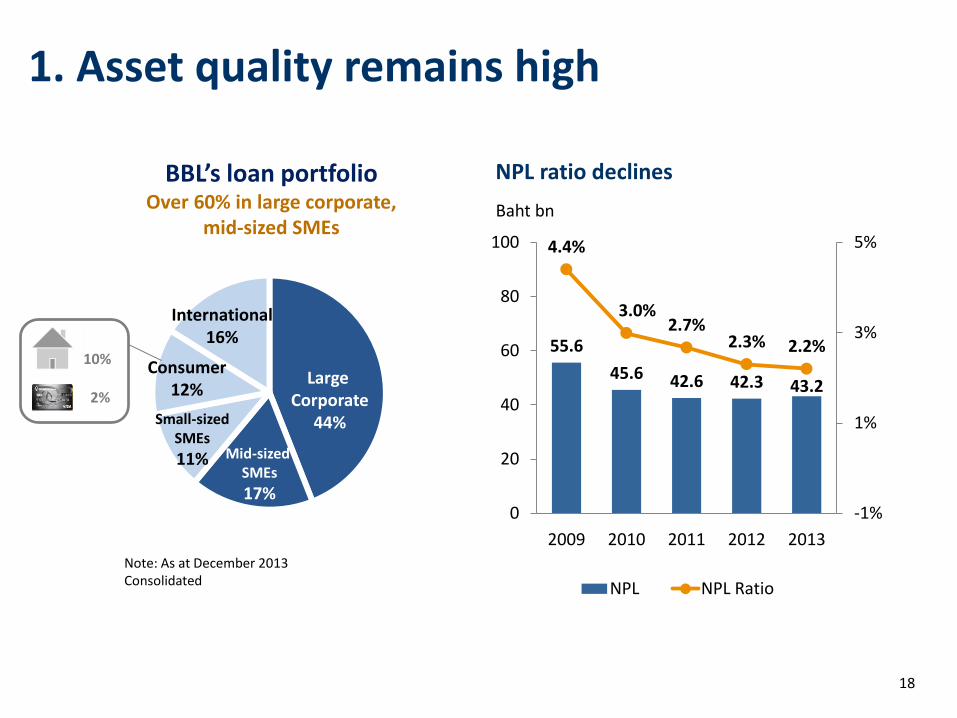
1. Asset quality remains high
18
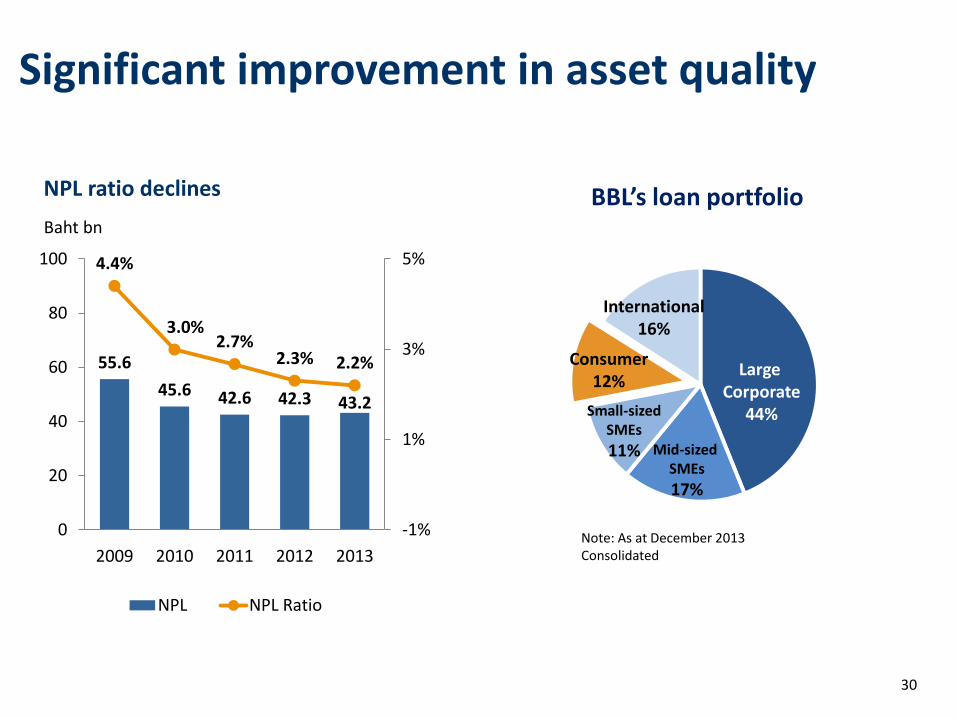
BBL’s loan portfolio Over 60% in large corporate,
mid-sized SMEs
Note: As at December 2013 Consolidated
Large Corporate
44%
Mid-sized SMEs
17%
Small-sized SMEs
11%
Consumer 12%
International 16%
10%
2%
55.6
45.6 42.6 42.3 43.2
4.4%
3.0% 2.7%
2.3% 2.2%
-1%
1%
3%
5%
0
20
40
60
80
100
2009 2010 2011 2012 2013
NPL NPL Ratio
NPL ratio declines
Baht bn
19
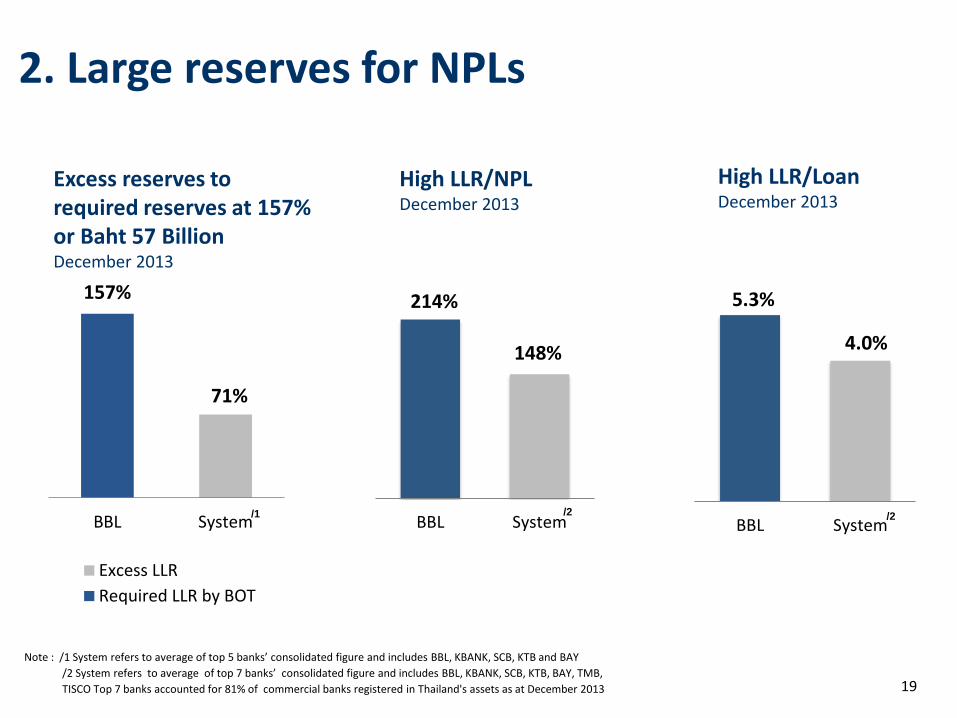
2. Large reserves for NPLs
157%
71%
BBL System
Excess LLR
Required LLR by BOT
BBL System
214%
148%
BBL System
5.3%
4.0%
Note : /1 System refers to average of top 5 banks’ consolidated figure and includes BBL, KBANK, SCB, KTB and BAY
/2 System refers to average of top 7 banks’ consolidated figure and includes BBL, KBANK, SCB, KTB, BAY, TMB,
TISCO Top 7 banks accounted for 81% of commercial banks registered in Thailand's assets as at December 2013
/1
Excess reserves to required reserves at 157% or Baht 57 Billion December 2013
High LLR/NPL December 2013
High LLR/Loan December 2013
/2 /2
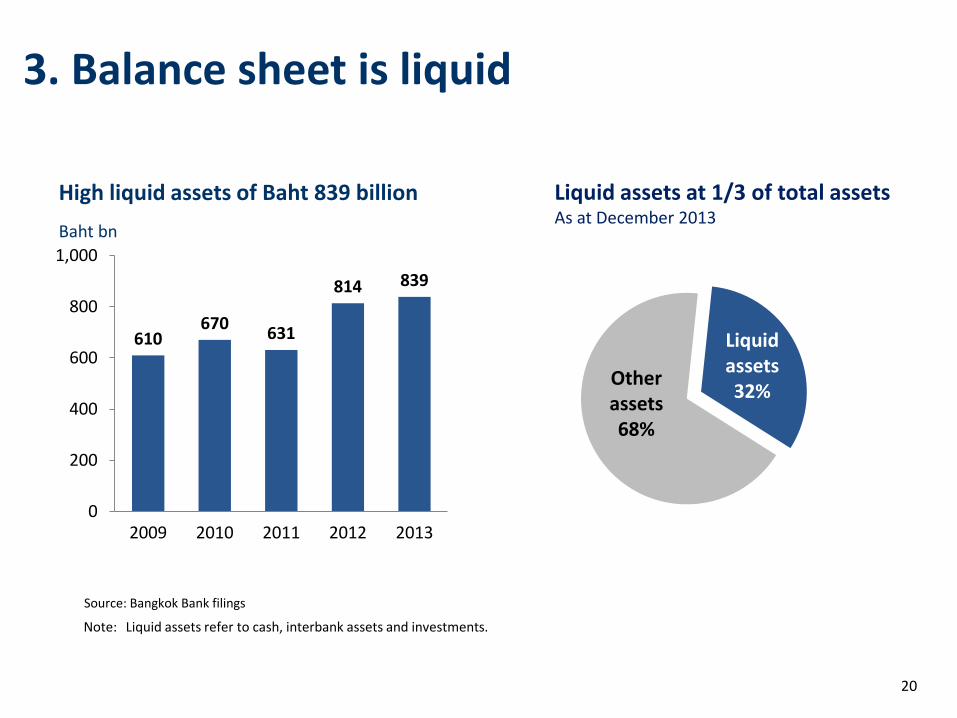
3. Balance sheet is liquid
20
20
Note: Liquid assets refer to cash, interbank assets and investments.
High liquid assets of Baht 839 billion
610 670
631
814 839
0
200
400
600
800
1,000
2009 2010 2011 2012 2013
Source: Bangkok Bank filings
Baht bn
Liquid assets at 1/3 of total assets
As at December 2013
Liquid assets 32%
Other assets 68%
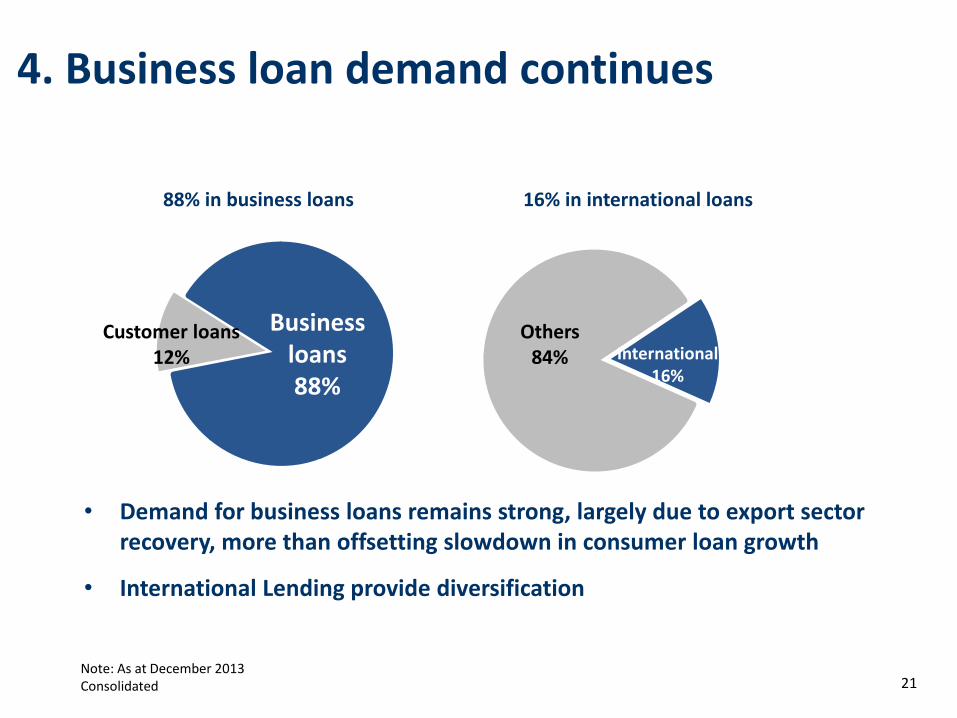
4. Business loan demand continues
21
88% in business loans
Note: As at December 2013 Consolidated
• Demand for business loans remains strong, largely due to export sector recovery, more than offsetting slowdown in consumer loan growth
• International Lending provide diversification
Business loans 88%
Customer loans 12%
16% in international loans
International 16%
Others 84%
Strong fundamentals – well placed to benefit from opportunities
Bangkok Bank
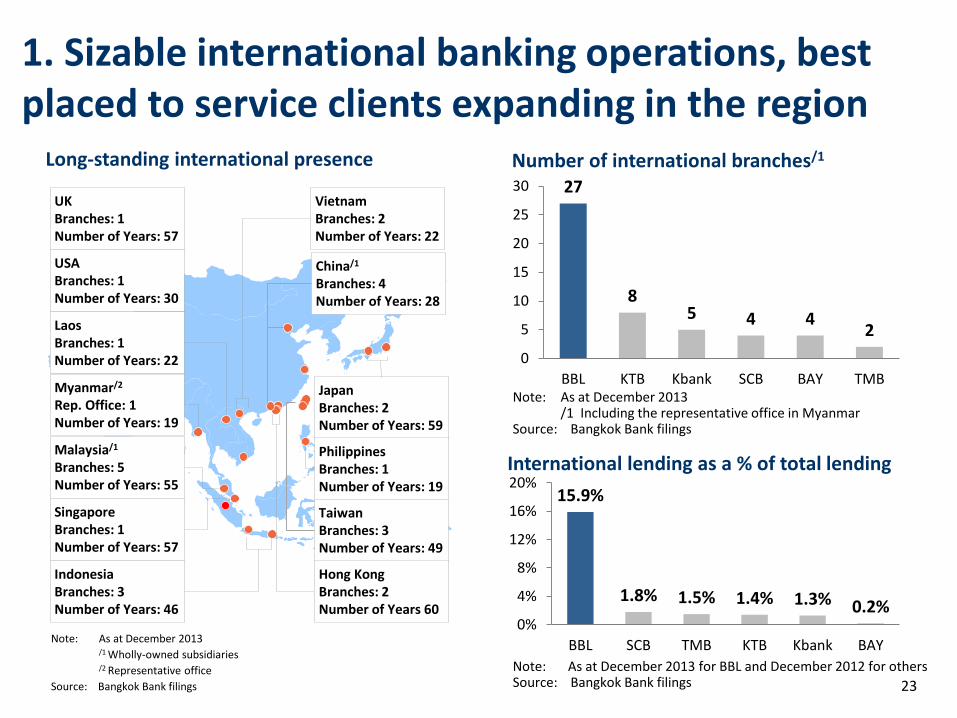
1. Sizable international banking operations, best placed to service clients expanding in the region
23
Long-standing international presence
Japan Branches: 2 Number of Years: 59
UK Branches: 1 Number of Years: 57
USA Branches: 1 Number of Years: 30
Laos Branches: 1 Number of Years: 22
Philippines Branches: 1 Number of Years: 19
Vietnam Branches: 2 Number of Years: 22
China/1
Branches: 4 Number of Years: 28
Myanmar/2
Rep. Office: 1 Number of Years: 19
Malaysia/1
Branches: 5 Number of Years: 55
Singapore Branches: 1 Number of Years: 57
Indonesia Branches: 3 Number of Years: 46
Taiwan Branches: 3 Number of Years: 49
Hong Kong Branches: 2 Number of Years 60
Note: As at December 2013
/1 Wholly-owned subsidiaries
/2 Representative office
Source: Bangkok Bank filings
International lending as a % of total lending
15.9%
1.8% 1.5% 1.4% 1.3% 0.2% 0%
4%
8%
12%
16%
20%
BBL SCB TMB KTB Kbank BAY
Note: As at December 2013 for BBL and December 2012 for others Source: Bangkok Bank filings
Number of international branches/1
27
8 5 4 4
2
0
5
10
15
20
25
30
BBL KTB Kbank SCB BAY TMBNote: As at December 2013 /1 Including the representative office in Myanmar Source: Bangkok Bank filings
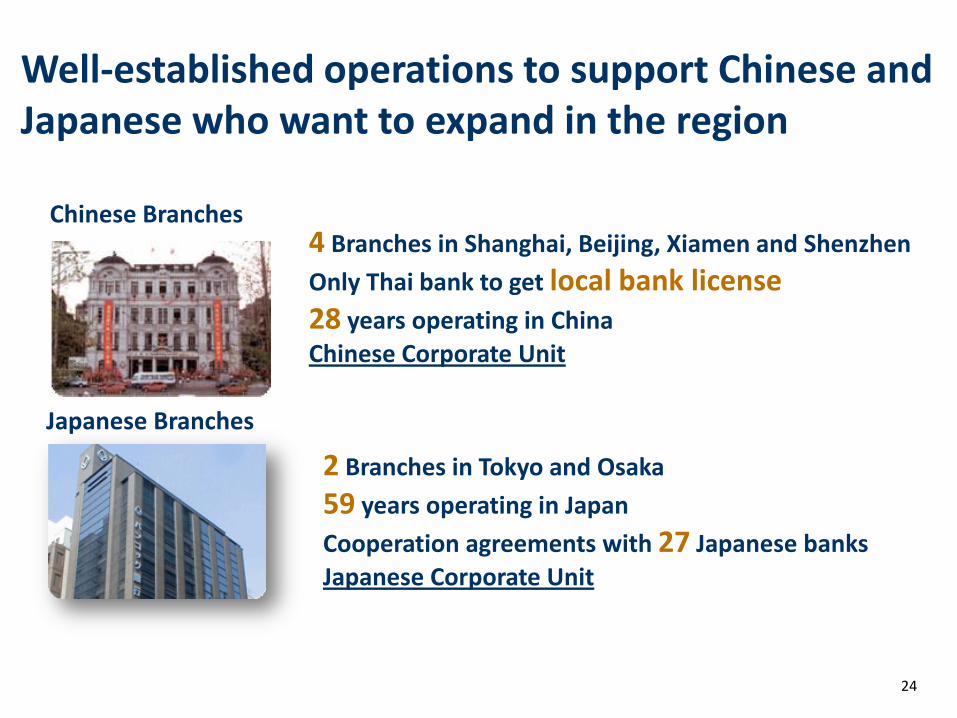
Well-established operations to support Chinese and Japanese who want to expand in the region
24
4 Branches in Shanghai, Beijing, Xiamen and Shenzhen
Only Thai bank to get local bank license 28 years operating in China
Chinese Corporate Unit
Chinese Branches
2 Branches in Tokyo and Osaka
59 years operating in Japan
Cooperation agreements with 27 Japanese banks
Japanese Corporate Unit
Japanese Branches
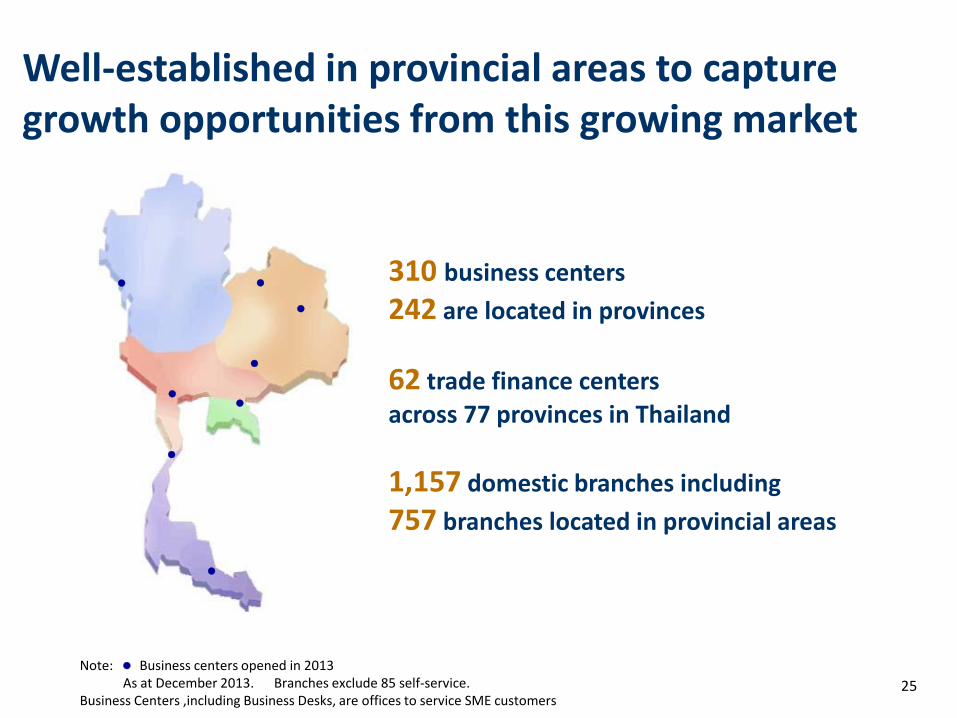
Well-established in provincial areas to capture growth opportunities from this growing market
Note: Business centers opened in 2013 As at December 2013. Branches exclude 85 self-service.
Business Centers ,including Business Desks, are offices to service SME customers
310 business centers
242 are located in provinces
62 trade finance centers
across 77 provinces in Thailand
1,157 domestic branches including
757 branches located in provincial areas
25
26
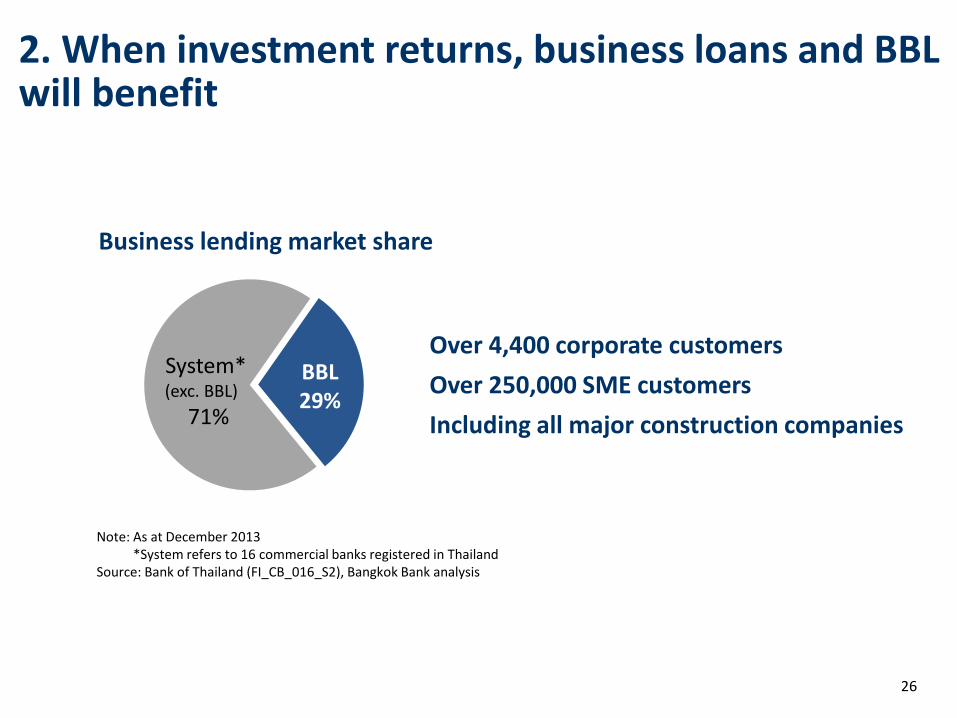
2. When investment returns, business loans and BBL will benefit
Over 4,400 corporate customers
Over 250,000 SME customers
Including all major construction companies
Note: As at December 2013 *System refers to 16 commercial banks registered in Thailand Source: Bank of Thailand (FI_CB_016_S2), Bangkok Bank analysis
Business lending market share
29% System* (exc. BBL)
71%
BBL 29%
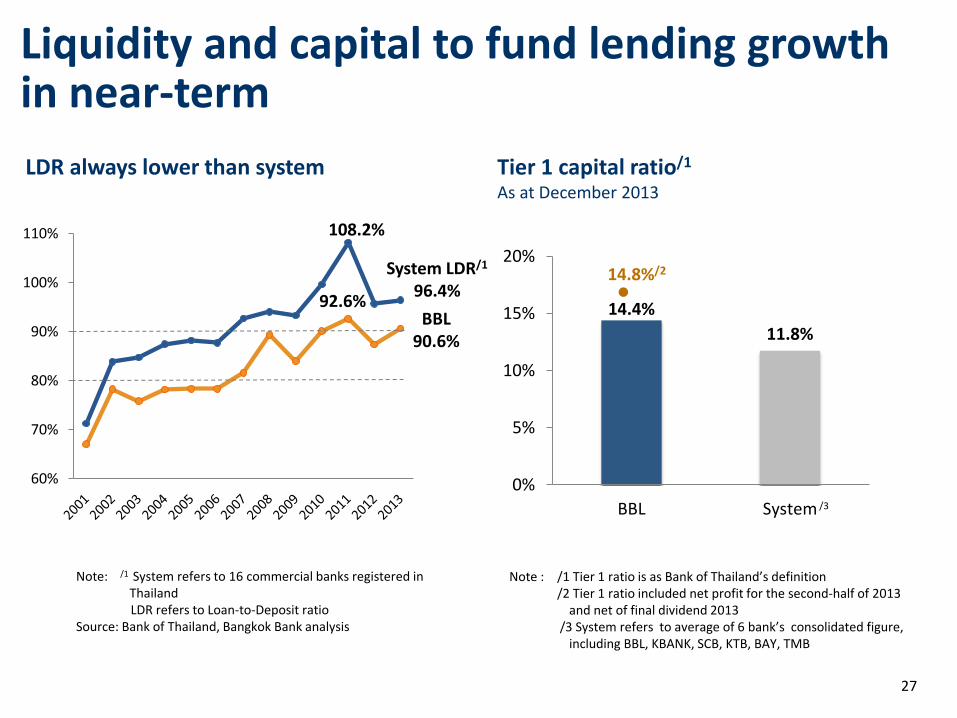
Liquidity and capital to fund lending growth in near-term
27
60%
70%
80%
90%
100%
110%
System LDR/1
96.4%
BBL 90.6%
92.6%
108.2%
LDR always lower than system
Note: /1 System refers to 16 commercial banks registered in Thailand
LDR refers to Loan-to-Deposit ratio Source: Bank of Thailand, Bangkok Bank analysis
14.4%
11.8%
0%
5%
10%
15%
20%
BBL System
Tier 1 capital ratio/1
As at December 2013
Note : /1 Tier 1 ratio is as Bank of Thailand’s definition /2 Tier 1 ratio included net profit for the second-half of 2013
and net of final dividend 2013 /3 System refers to average of 6 bank’s consolidated figure,
including BBL, KBANK, SCB, KTB, BAY, TMB
14.8%/2
/3
Financial results Sustainable growth across business cycles
Year 2013
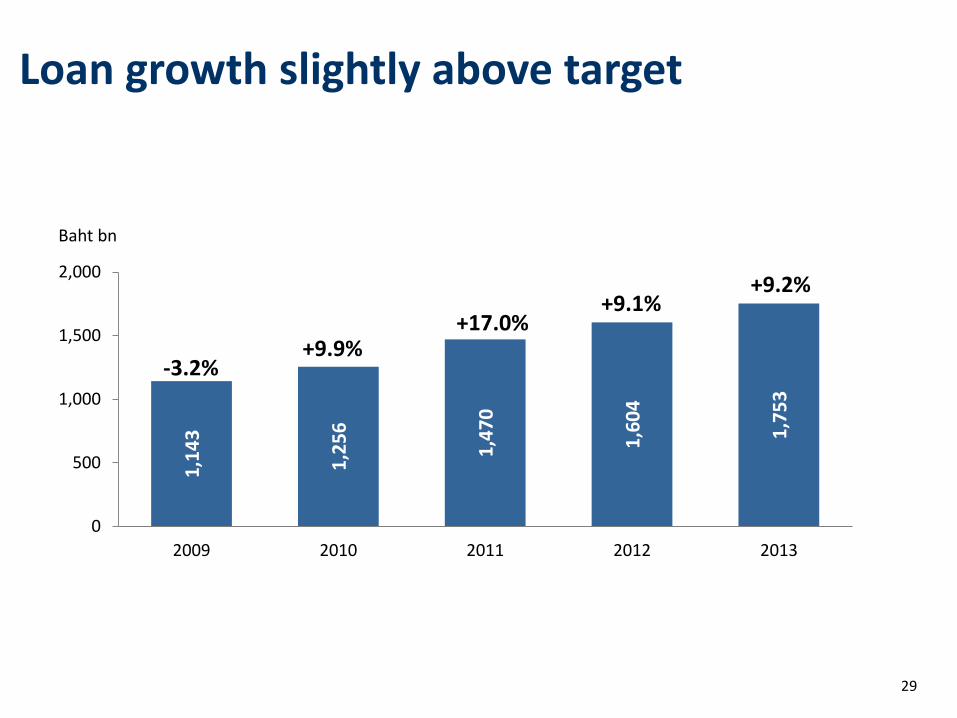
1,1
43
1,2
56
1,4
70
1,6
04
1,7
53
0
500
1,000
1,500
2,000
2009 2010 2011 2012 2013
Loan growth slightly above target
29
Baht bn
+9.2%
-3.2% +9.9%
+17.0% +9.1%
55.6
45.6 42.6 42.3 43.2
4.4%
3.0% 2.7%
2.3% 2.2%
-1%
1%
3%
5%
0
20
40
60
80
100
2009 2010 2011 2012 2013
NPL NPL Ratio
30
Significant improvement in asset quality
NPL ratio declines
Baht bn
BBL’s loan portfolio
Note: As at December 2013 Consolidated
Large Corporate
44%
Mid-sized SMEs
17%
Small-sized SMEs
11%
Consumer 12%
International 16%
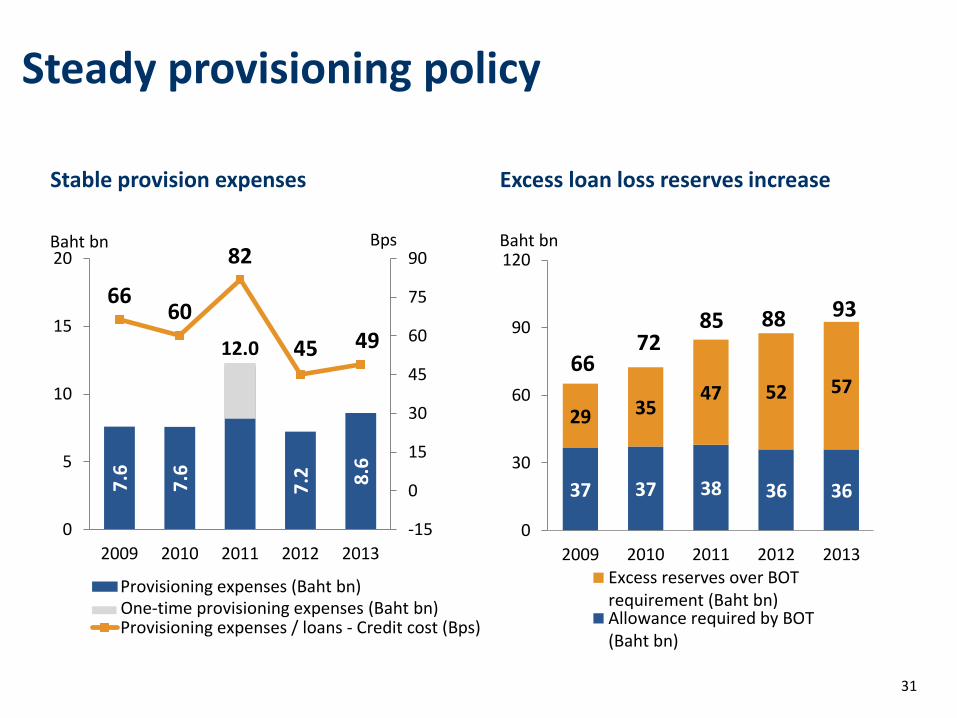
Steady provisioning policy 7
.6
7.6
12.0
7.2
8.6
66 60
82
45 49
-15
0
15
30
45
60
75
90
0
5
10
15
20
2009 2010 2011 2012 2013
Provisioning expenses (Baht bn)
Provisioning expenses / loans - Credit cost (Bps)One-time provisioning expenses (Baht bn)
31
Baht bn Bps Baht bn
37 37 38 36 36
29 35 47 52 57
0
30
60
90
120
2009 2010 2011 2012 2013Excess reserves over BOTrequirement (Baht bn)Allowance required by BOT(Baht bn)
88 93 85 72
66
Stable provision expenses Excess loan loss reserves increase
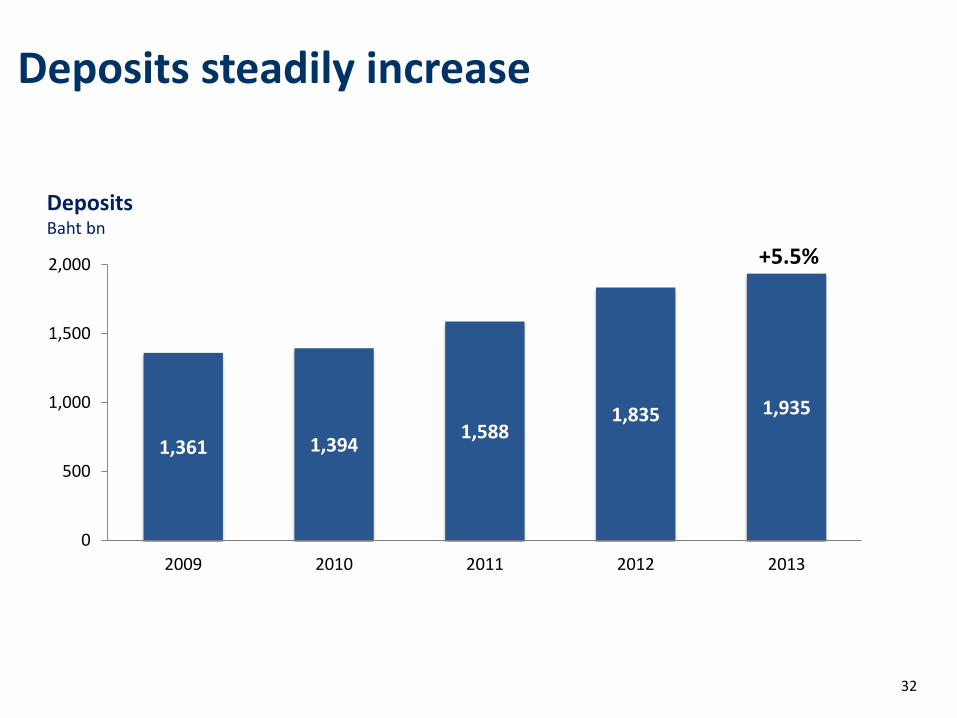
1,361 1,394 1,588
1,835 1,935
0
500
1,000
1,500
2,000
2009 2010 2011 2012 2013
+5.5%
Deposits Baht bn
32
Deposits steadily increase
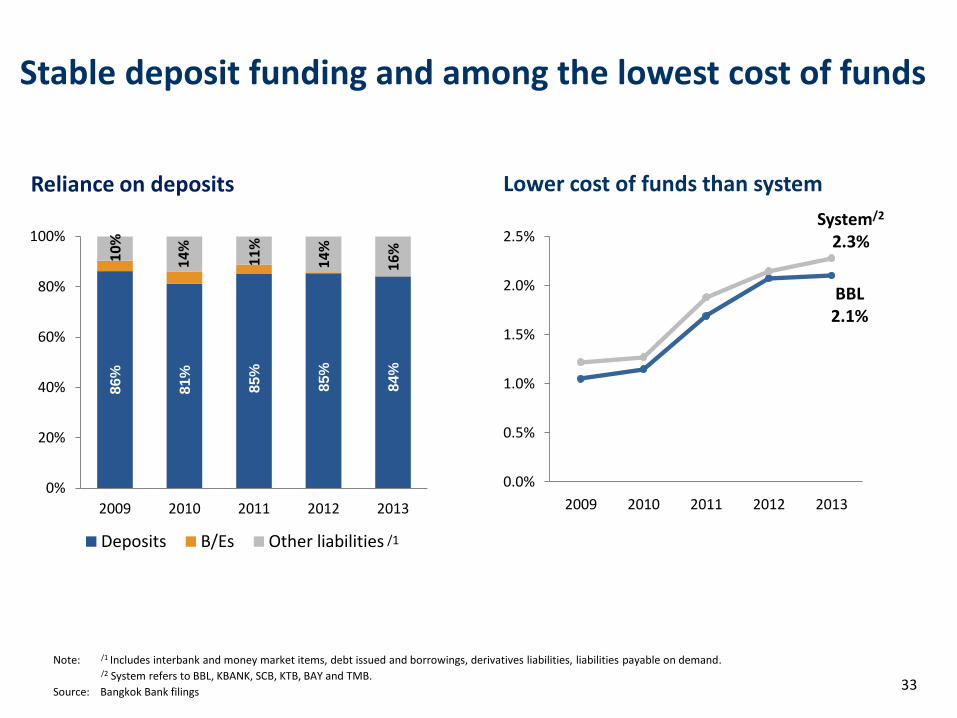
Stable deposit funding and among the lowest cost of funds
Lower cost of funds than system
0.0%
0.5%
1.0%
1.5%
2.0%
2.5%
2009 2010 2011 2012 2013
System/2
2.3%
BBL 2.1%
33
Note: /1 Includes interbank and money market items, debt issued and borrowings, derivatives liabilities, liabilities payable on demand.
/2 System refers to BBL, KBANK, SCB, KTB, BAY and TMB.
Source: Bangkok Bank filings
86
%
81
%
85%
85%
84%
10
%
14
%
11
%
14
%
16
%
0%
20%
40%
60%
80%
100%
2009 2010 2011 2012 2013
Deposits B/Es Other liabilities /1
Reliance on deposits
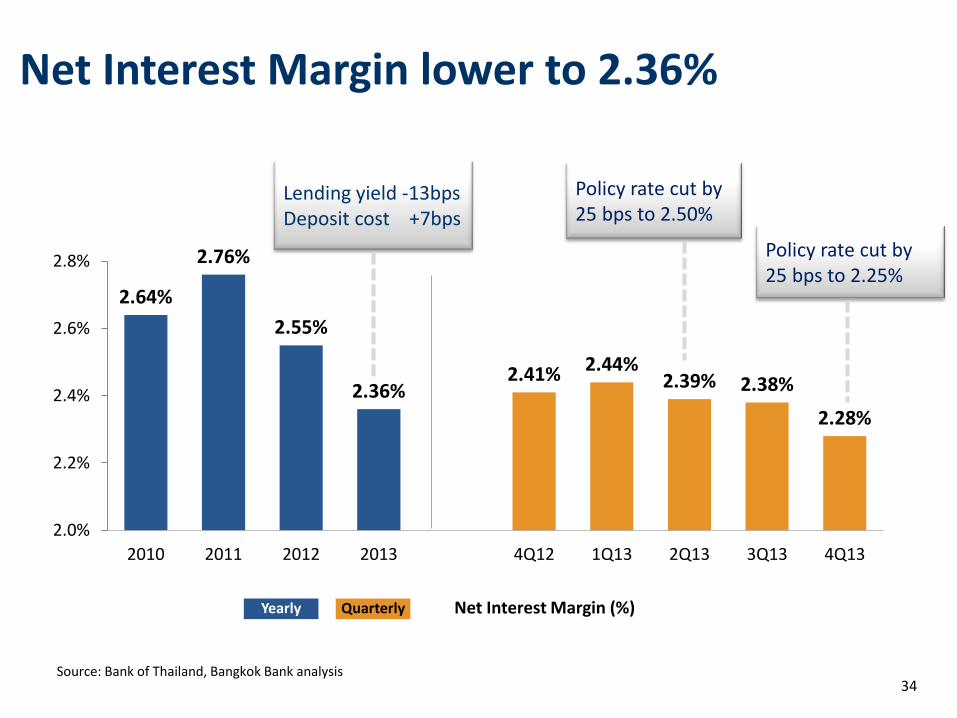
Net Interest Margin lower to 2.36%
Source: Bank of Thailand, Bangkok Bank analysis
2.64%
2.76%
2.55%
2.36% 2.41% 2.44%
2.39% 2.38%
2.28%
2.0%
2.2%
2.4%
2.6%
2.8%
2010 2011 2012 2013 4Q12 1Q13 2Q13 3Q13 4Q13
Quarterly Yearly Net Interest Margin (%)
34
Lending yield -13bps Deposit cost +7bps
Policy rate cut by 25 bps to 2.50%
Policy rate cut by 25 bps to 2.25%
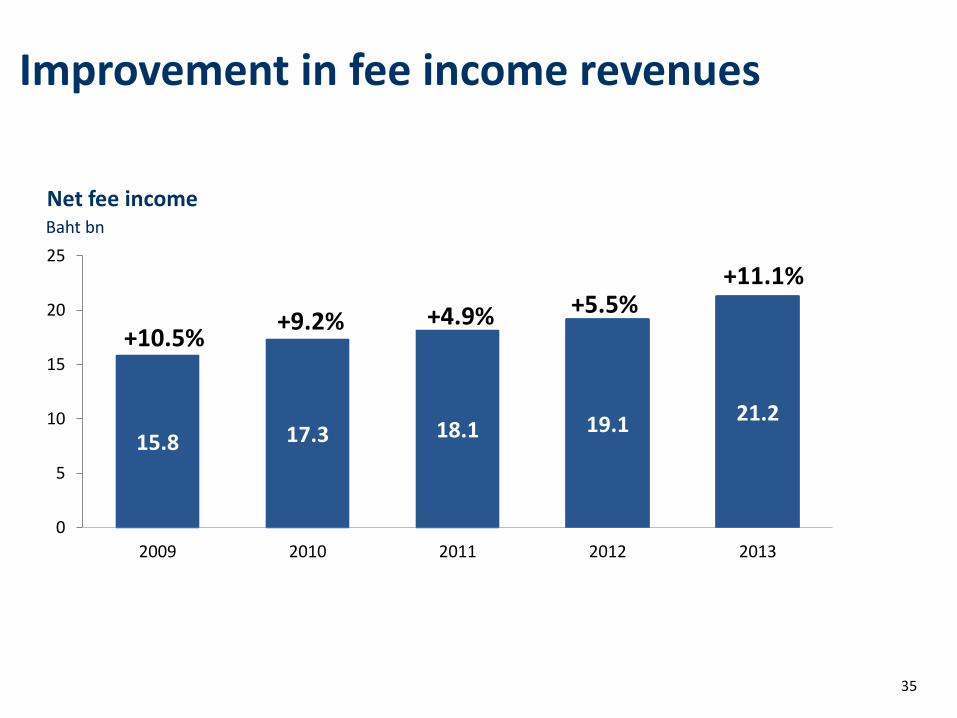
Improvement in fee income revenues
15.8 17.3 18.1 19.1 21.2
0
5
10
15
20
25
2009 2010 2011 2012 2013
Baht bn
+5.5% +4.9% +9.2%
35
+11.1%
+10.5%
Net fee income
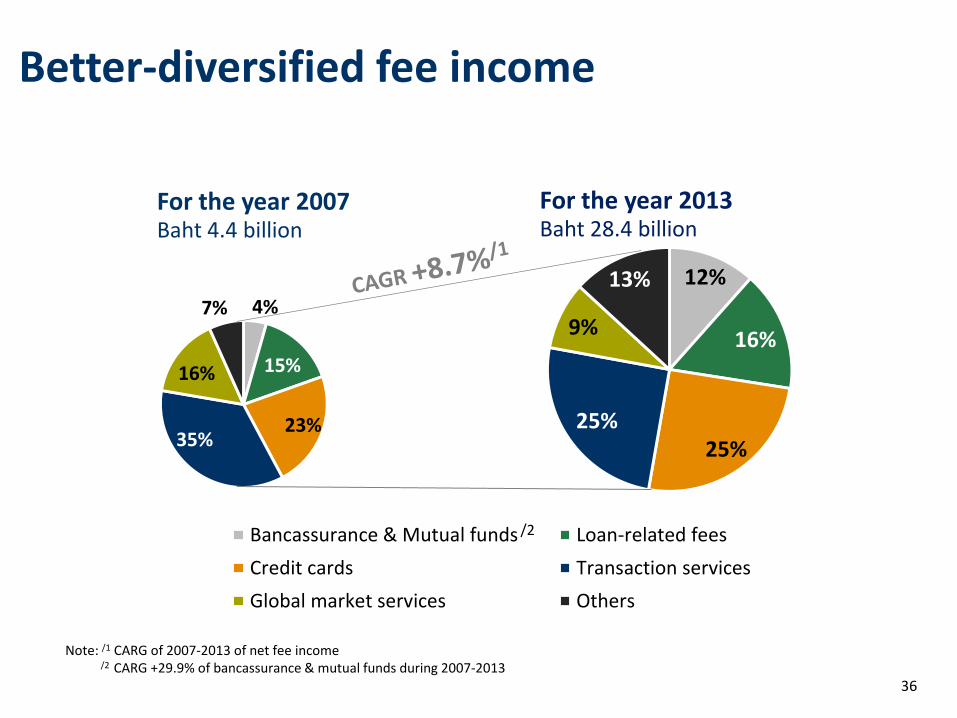
Better-diversified fee income
12%
16%
25% 25%
9%
13%
Bancassurance & Mutual funds Loan-related fees
Credit cards Transaction services
Global market services Others
4%
15%
23% 35%
16%
7%
For the year 2007 Baht 4.4 billion
For the year 2013 Baht 28.4 billion
36
Note: /1 CARG of 2007-2013 of net fee income /2 CARG +29.9% of bancassurance & mutual funds during 2007-2013
/2
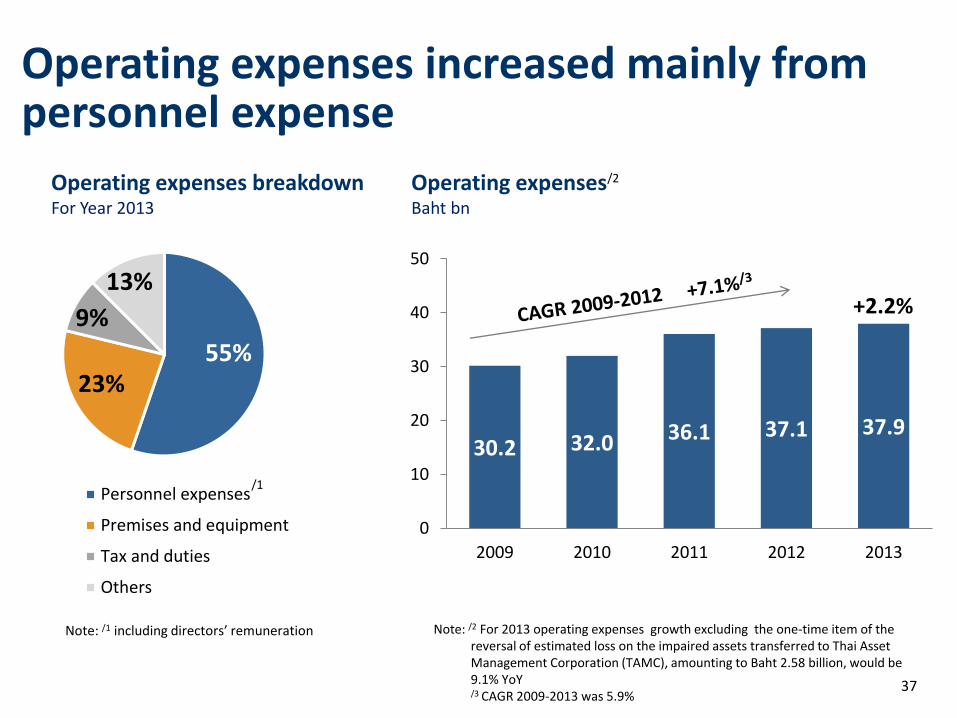
Operating expenses increased mainly from personnel expense
30.2 32.0 36.1 37.1 37.9
0
10
20
30
40
50
2009 2010 2011 2012 2013
+2.2%
37
Operating expenses breakdown For Year 2013
55% 23%
9%
13%
Personnel expenses
Premises and equipment
Tax and duties
Others
/1
Note: /1 including directors’ remuneration
Operating expenses Baht bn
/2
Note: /2 For 2013 operating expenses growth excluding the one-time item of the reversal of estimated loss on the impaired assets transferred to Thai Asset Management Corporation (TAMC), amounting to Baht 2.58 billion, would be 9.1% YoY /3 CAGR 2009-2013 was 5.9%
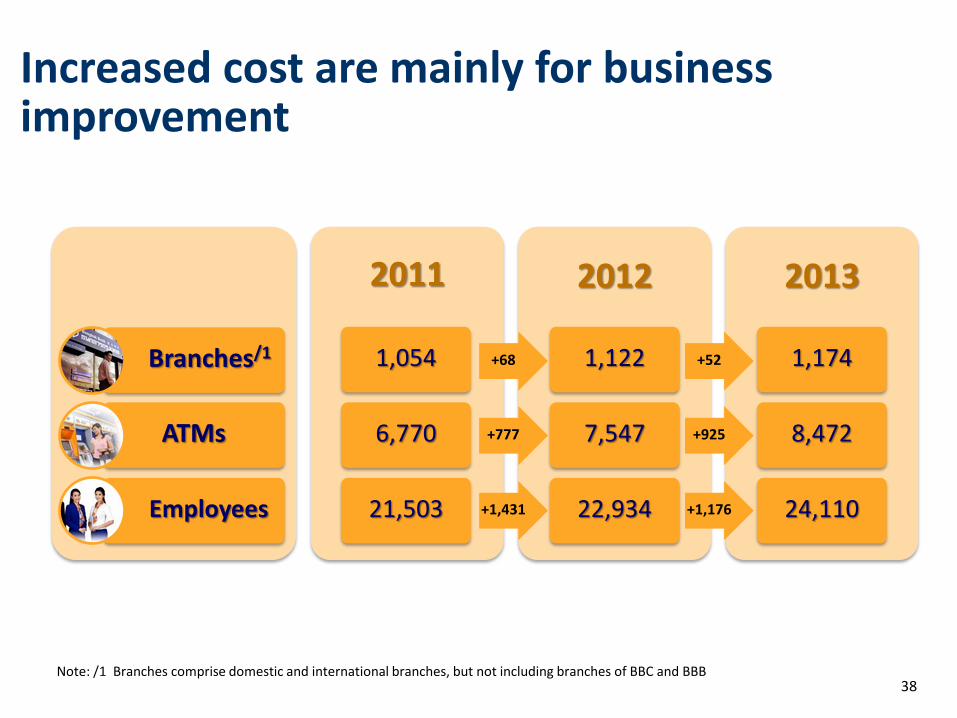
Increased cost are mainly for business improvement
38 Note: /1 Branches comprise domestic and international branches, but not including branches of BBC and BBB
Branches/1
ATMs
Employees
2011
1,054
6,770
21,503
2012
1,122
7,547
22,934
2013
1,174
8,472
24,110
+68
+777
+1,431
+52
+925
+1,176
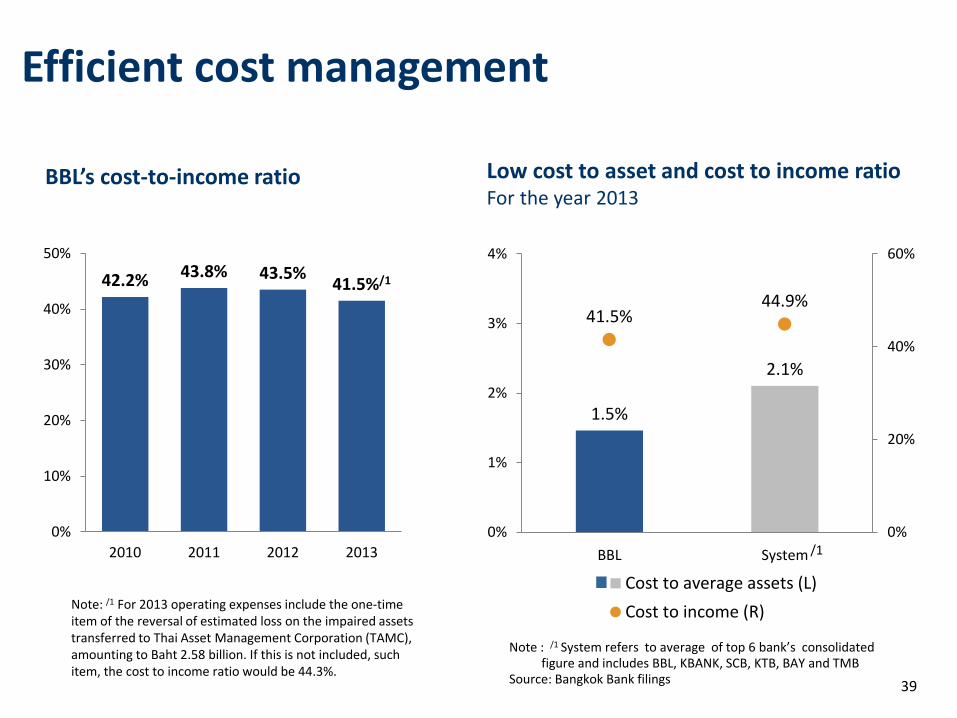
1.5%
2.1%
41.5% 44.9%
0%
20%
40%
60%
0%
1%
2%
3%
4%
BBL System
Cost to average assets (L)
Cost to income (R)
Low cost to asset and cost to income ratio For the year 2013
BBL’s cost-to-income ratio
Efficient cost management
39
42.2% 43.8% 43.5% 41.5%/1
0%
10%
20%
30%
40%
50%
2010 2011 2012 2013
Note: /1 For 2013 operating expenses include the one-time item of the reversal of estimated loss on the impaired assets transferred to Thai Asset Management Corporation (TAMC), amounting to Baht 2.58 billion. If this is not included, such item, the cost to income ratio would be 44.3%.
/1
Note : /1 System refers to average of top 6 bank’s consolidated figure and includes BBL, KBANK, SCB, KTB, BAY and TMB
Source: Bangkok Bank filings
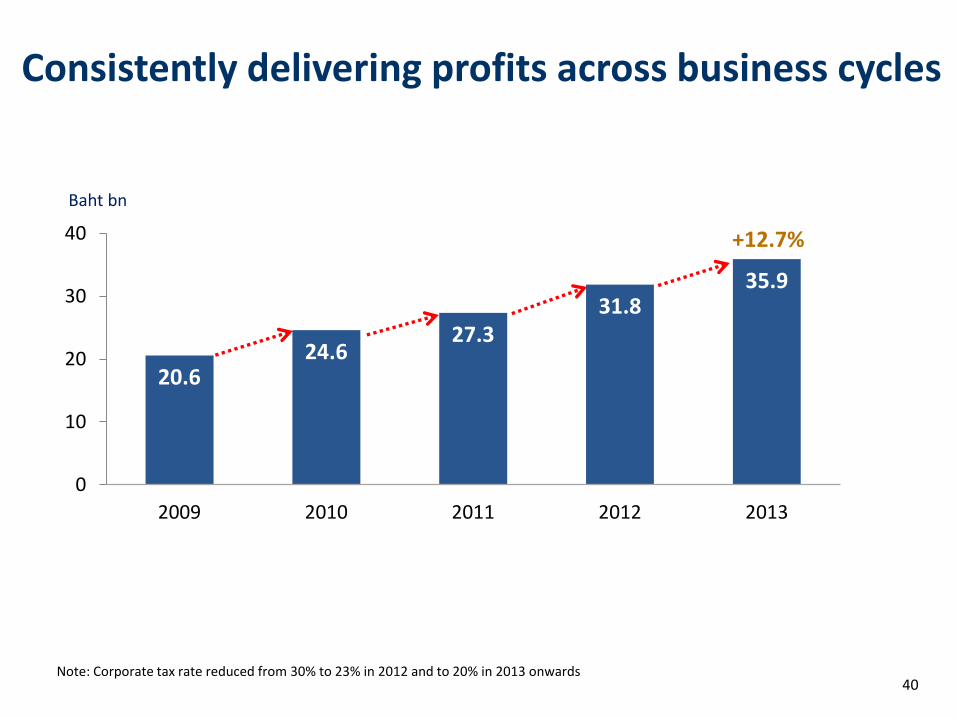
Consistently delivering profits across business cycles
20.6 24.6
27.3 31.8
35.9
0
10
20
30
40
2009 2010 2011 2012 2013
Baht bn
+12.7%
40 Note: Corporate tax rate reduced from 30% to 23% in 2012 and to 20% in 2013 onwards
Summary
With our prudent and conservative approach, BBL will be able to withstand short-term volatility
and continues to deliver steady growth across business cycles
41
This presentation is made by Bangkok Bank and may not be copied, altered, offered, sold or otherwise distributed to any other person by any recipient without the consent of Bangkok Bank. Although all reasonable effort has been made to ensure the facts stated herein are accurate and that the opinions contained herein are fair and reasonable, this document is selective in nature and is intended to provide an introduction to, and overview of, the business of Bangkok Bank. Where any information and statistics are quoted from any external source, such information or statistics should not be interpreted as having been adopted or endorsed by Bangkok bank as being accurate. Neither Bangkok Bank nor any of its directors, officers, employees, and advisors nor any other person shall have any liability whatsoever for loss howsoever arising, directly or indirectly, from any use of this information. The facts and information contained herein are as up to date as is reasonably possible and may be subject to revision in the future. Neither Bangkok Bank nor any of its directors, officers, employees or advisors nor any other person makes any representation or warranty, express or implied, as to the accuracy or completeness of the information contained in this presentation. Neither Bangkok Bank nor any of its directors, officers, employees and advisors nor any other person shall have any liability whatsoever for loss howsoever arising, directly or indirectly, from any use of this presentation. This presentation may contain projections or other forward-looking statements related to Bangkok Bank that involve risks and uncertainties. Readers are cautioned that these statements are only projections and may differ materially from actual future results or events. All forward-looking statements are based on information available to Bangkok Bank on the date of its posting and Bangkok Bank assumes no obligation to update such statements unless otherwise required by applicable law. This presentation does not constitute an offer or invitation to subscribe for, or purchase, any shares of Bangkok Bank.
Contact: Investor Relations Team Tel (66) 2 626 4981 Fax (66) 2 231 4890 Email: [email protected] Bangkok Bank Website www.bangkokbank.com
For further information
42