Embed Size (px)
Citation preview

STRICTLY PRIVATE AND CONFIDENTIAL
Investor Presentation
March 2021
1
STRICTLY PRIVATE AND CONFIDENTIAL
Disclaimer
2
This presentation (this “Presentation”) is provided for informational purposes only and has been prepared to assist interested parties in making their own evaluation with respect to a potential business combination between Cerberus Telecom Acquisition
Corp. (“CTAC”) and KORE Wireless (“KORE” or the “Company”) (the “Proposed Transaction”) and for no other purpose. No representations or warranties, express or implied are given in, or in respect of, this Presentation. To the fullest extent permitted by law
in no circumstances will CTAC, KORE or any of their respective subsidiaries, shareholders or affiliates, or any of their respective partners, directors, officers, employees, advisers, consultants, agents or other representatives (collectively, “Representatives”) be
responsible or liable for any direct, indirect, consequential or other loss or loss of profit arising from the provision or use of this Presentation, its contents, its omissions, reliance on the information contained within it, or on opinions communicated in relation
thereto or otherwise arising in connection therewith. Industry and market data used in this Presentation have been obtained from third-party industry publications and sources as well as from research reports prepared for other purposes. None of CTAC,
KORE nor any of their respective Representatives has independently verified the data obtained from these sources and cannot assure you of the data’s accuracy or completeness. This data is subject to change. In furnishing this Presentation each of CTAC,
KORE, and their respective Representatives expressly disclaims any obligation to update any information contained herein or to correct any omissions, inaccuracies, or errors. In addition, this Presentation does not purport to be all-inclusive or to contain all
of the information that may be required to make a full or complete analysis of KORE or the Proposed Transaction. Viewers of this Presentation should each make their own independent evaluation of KORE and of the relevance and adequacy of the
information and should make such other investigations as they deem necessary.
Forward-Looking Statements
This Presentation includes certain statements that are not historical facts but are forward-looking statements for purposes of the safe harbor provisions under the United States Private Securities Litigation Reform Act of 1995. Forward-looking statements
generally are accompanied by words such as “believe,” “may,” “will,” “estimate,” “continue,” “anticipate,” “intend,” “expect,” “should,” “would,” “plan,” “predict,” “potential,” “seem,” “seek,” “future,” “outlook,” and similar expressions that predict or
indicate future events or trends or that are not statements of historical matters. These forward-looking statements include, but are not limited to, statements regarding estimates and forecasts of revenue and other financial and performance metrics and
projections of market opportunity and expectations. These statements are based on various assumptions and on the current expectations of CTAC or the Company’s management, as applicable as projected revenue and Adjusted EBITDA (as defined
herein) are not predictions of actual performance. These forward-looking statements are provided for illustrative purposes only and are not intended to serve as, and must not be relied on by any investor or other person as, a guarantee, an assurance, a
prediction or a definitive statement of fact or probability. Actual events and circumstances are difficult or impossible to predict and will differ from assumptions. Many actual events and circumstances are beyond the control of CTAC and/or the
Company. These forward-looking statements are subject to a number of risks and uncertainties, including general economic, financial, legal, political and business conditions and changes in domestic and foreign markets; the potential effects of COVID-
19; risks related to the rollout of the Company’s business and the timing of expected business milestones; changes in the assumptions underlying the Company’s expectations regarding its future business; the effects of competition on the Company’s future
business; and the outcome of judicial proceedings to which the Company is, or may become a party. If the risks materialize or assumptions prove incorrect, actual results could differ materially from the results implied by these forward-looking statements.
There may be additional risks that the Company presently does not know or that the Company currently believes are immaterial that could also cause actual results to differ materially from those contained in the forward-looking statements. In addition,
forward-looking statements reflect the Company’s expectations, plans or forecasts of future events and views as of the date of this Presentation. The Company and CTAC anticipate that subsequent events and developments will cause these assessments
to change. However, while the Company and/or CTAC may elect to update these forward-looking statements at some point in the future, each of the Company and CTAC specifically disclaims any obligation to do so. These forward-looking statements
should not be relied upon as representing the Company’s assessments as of any date subsequent to the date of this Presentation. Accordingly, undue reliance should not be placed upon the forward-looking statements.
Use of Projections
This Presentation contains projected financial information with respect to KORE. Such projected financial information constitutes forward-looking information, and is for illustrative purposes only and should not be relied upon as necessarily being indicative of
future results. The Company’s independent auditors have not audited, reviewed, compiled or performed any procedures with respect to the projections for the purpose of their inclusion in this Presentation, and accordingly, they did not express an opinion
or provide any other form of assurance with respect thereto for the purpose of this Presentation. The assumptions and estimates underlying such financial forecast information are inherently uncertain and are subject to a wide variety of significant business,
economic, competitive and other risks and uncertainties. See “Forward-Looking Statements” above. Actual results may differ materially from the results contemplated by the financial forecast information contained in this Presentation, and the inclusion of
such information in this Presentation is not intended, and should not be regarded, as a representation by any person that the results reflected in such forecasts will be achieved.
No Offer or Solicitation
This Presentation is not intended to, and shall not constitute (i) a solicitation of a proxy, consent or authorization with respect to any securities or in respect of the Proposed Transaction or (ii) an offer to sell or the solicitation of an offer to buy or a
recommendation to purchase any security of CTAC, the Company or any of their respective affiliates, nor shall there be any sale of securities in any jurisdiction in which such offer, solicitation or sale would be unlawful prior to registration or qualification
under the securities laws of any such jurisdiction. No offering of securities shall be made except by means of a prospectus meeting the requirements of Section 10 of the Securities Act or in reliance on an exemption from the registration requirements of the
Securities Act. You should not construe the contents of this Presentation as legal, tax, accounting or investment advice or a recommendation. You should consult your own counsel and tax and financial advisors as to legal, financial, and related matters
concerning the matters described herein, and, by accepting this Presentation, you confirm that you are not relying upon the information contained herein to make any decision.
STRICTLY PRIVATE AND CONFIDENTIAL
Disclaimer (Cont’d)
3
Non-GAAP Financial Measures
This Presentation includes certain financial measures not presented in accordance with generally accepted accounting principles (“GAAP”) including, but not limited to EBITDA, Adjusted EBITDA and certain ratios and other metrics derived therefrom. These
non-GAAP financial measures are not measures of financial performance in accordance with GAAP and may exclude items that are significant in understanding and assessing the Company’s financial results. Therefore, these measures should not be
considered in isolation or as an alternative to net income, cash flows from operations or other measures of profitability, liquidity or performance under GAAP. You should be aware that the Company’s Presentation of these measures may not be
comparable to similarly-titled measures used by other companies. The Company believes these non-GAAP measures of financial results provide useful information to management and investors regarding certain financial and business trends relating to the
Company’s financial condition and results of operations. The Company believes that the use of these non-GAAP financial measures provides an additional tool for investors to use in evaluating ongoing operating results and trends in the Company, and in
comparing the Company’s financial measures with those of other similar companies, many of which present similar non-GAAP financial measures to investors. These non-GAAP financial measures are subject to inherent limitations as they reflect the
exercise of judgments by management about which expense and income are excluded or included in determining these non-GAAP financial measures. Please refer to footnotes where presented on each page of this Presentation or to the tables therein
for a reconciliation of these measures to what the Company believes are the most directly comparable measure evaluated in accordance with GAAP. This Presentation also includes certain projections of non-GAAP financial measures. The Company does
not provide reconciliations of EBITDA, Adjusted EBITDA, or Adjusted EBITDA margin to net income on a forward-looking basis because the Company is unable to forecast the amount or significance of certain items required to develop meaningful
comparable GAAP financial measures without unreasonable efforts. These items include gains or losses on sale or consolidation transactions, accelerated depreciation, impairment charges, gains or losses on retirement of debt and variations in effective
tax rate, which are difficult to predict and estimate and are primarily dependent on future events, but which are excluded from the Company's calculations of EBITDA, Adjusted EBITDA, and Adjusted EBITDA margin. Certain monetary amounts,
percentages and other figures included in this Presentation have been subject to rounding adjustments. Certain other amounts that appear in this Presentation may not sum due to rounding.
In connection with the contemplated filing by CTAC of a proxy statement / prospectus on Form S-4 with respect to the Proposed Transaction, and in the course of the review by the SEC of such proxy statement / prospectus, CTAC may make changes to
the information presented in this Presentation, including, without limitation, the description of the Company’s business and the financial information and other data (including the prospective financial information and other data) included in this
Presentation. Comments by the SEC on information in the proxy statement / prospectus may require modification or reformulation of the information we present in this Presentation, and any such modification or reformulation could be significant. In
particular, we note that the SEC has adopted certain rules regarding the use of Adjusted EBITDA and other financial measures that do not comply with generally accepted accounting principles in the United States, which rules will be applicable to the
proxy statement / prospectus expected to be filed with respect to the Proposed Transaction.
Participants in the Solicitation
CTAC and its directors and executive officers may be deemed participants in the solicitation of proxies from CTAC’s stockholders with respect to the Proposed Transaction. A list of the names of those directors and executive officers and a description of
their interests in CTAC is contained in CTAC’s Registration Statement on Form S-1, as effective on October 21, 2020, which was filed with the SEC and is available free of charge at the SEC’s web site at www.sec.gov, or by directing a written request to
CTAC at 875 Third Avenue, 11th Floor, New York NY, 10022. Additional information regarding the interests of such participants will be contained in the proxy statement / prospectus for the Proposed Transaction when available.
The Company and its directors and executive officers may also be deemed to be participants in the solicitation of proxies from the stockholders of CTAC in connection with the Proposed Transaction. A list of the names of such directors and executive
officers and information regarding their interests in the Proposed Transaction will be included in the proxy statement / prospectus for the Proposed Transaction when available.
Trademarks
This Presentation contains trademarks, service marks, trade names and copyrights of KORE and other companies, which are the property of their respective owners. Solely for convenience, some of the trademarks, service marks, trade names and
copyrights referred to in this Presentation may be listed without the TM, SM © or ® symbols, but CTAC and the Company will assert, to the fullest extent under applicable law, the rights of the applicable owners, if any, to these trademarks, service marks,
trade names and copyrights.
Additional Information
CTAC intends to file with the SEC a proxy statement / prospectus on Form S-4 relating to the Proposed Transaction, which will be mailed to its stockholders once definitive. This Presentation does not contain, or purport to contain, all the information that
should be considered concerning the Proposed Transaction and is not intended to form the basis of any investment decision or any other decision in respect of the Proposed Transaction. CTAC’s stockholders and other interested persons are advised to
read, when available, the preliminary proxy statement / prospectus and the amendments thereto and the proxy statement / prospectus and other documents filed in connection with the Proposed Transaction, as these materials will contain important
information about the Company, CTAC and the Proposed Transaction. When available, the proxy statement / prospectus and other relevant materials for the Proposed Transaction will be mailed to stockholders of CTAC as of a record date to be
established for voting on the proposed Business Combination. Stockholders will also be able to obtain copies of the preliminary proxy statement / prospectus, the definitive proxy statement / prospectus and other documents filed with the SEC, without
charge, once available, at the SEC’s website at www.sec.gov, or by directing a written request to CTAC at 875 Third Avenue, 11th Floor, New York NY, 10022.
Term Loan/Deal Terms
This Presentation does not reflect the potential amendment of the Company’s term loan indebtedness, and certain other terms of the Proposed Transaction that are subject to ongoing negotiation.
PCAOB Audit
In connection with the preparation of the proxy statement / prospectus related to the Proposed Transaction, the Company will be re-auditing its financial statements for prior years ended December 31 in accordance with the standards established by the
Public Company Accounting Oversight Board (PCAOB), as required by the rules and regulations of the U.S. Securities and Exchange Commission. Such re-audit may result in revisions and/or changes to the Company’s financial statements, as compared
to the Company’s current financial statements presented herein which have been audited pursuant to the standards promulgated by the American Institute of Certified Public Accountants (AICPA), which changes and revisions cannot be quantified at
this time and which may be material. Accordingly, you should not place undue reliance on the historical financial information contained in this Presentation.
STRICTLY PRIVATE AND CONFIDENTIAL
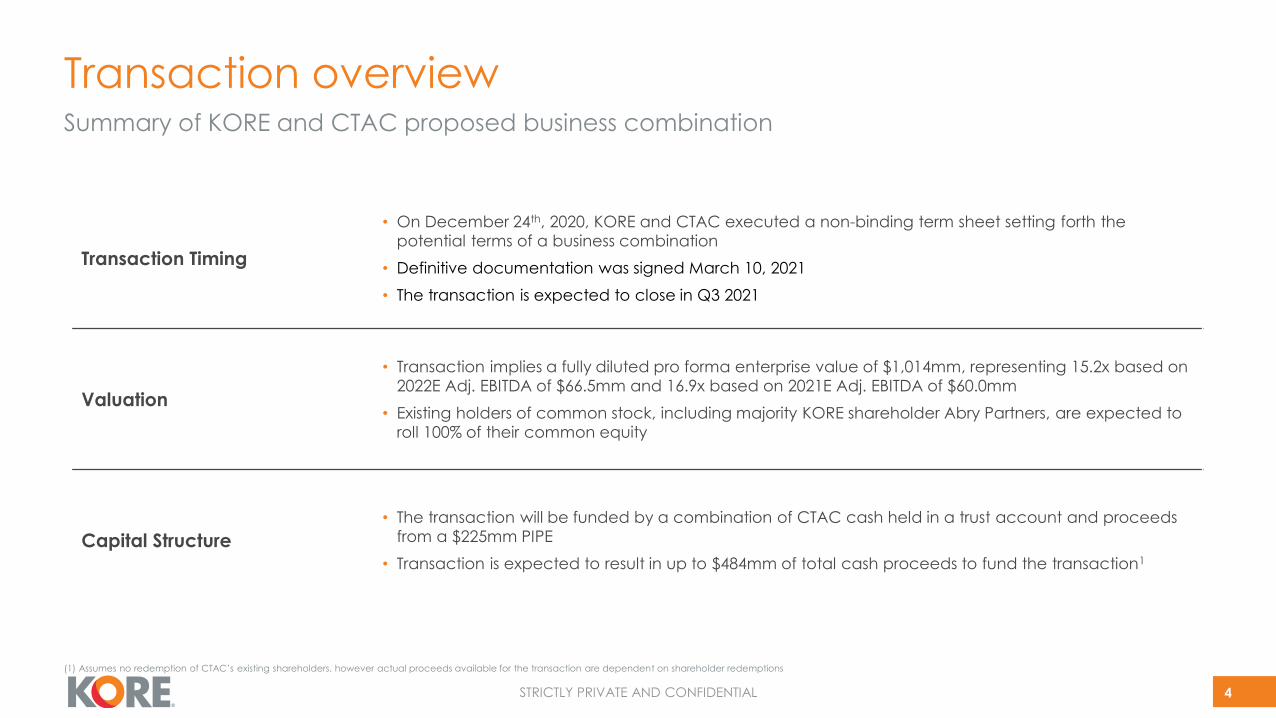
Transaction overview
4
Summary of KORE and CTAC proposed business combination
Transaction Timing
• On December 24th, 2020, KORE and CTAC executed a non-binding term sheet setting forth the
potential terms of a business combination
• Definitive documentation was signed March 10, 2021
• The transaction is expected to close in Q3 2021
Valuation
• Transaction implies a fully diluted pro forma enterprise value of $1,014mm, representing 15.2x based on
2022E Adj. EBITDA of $66.5mm and 16.9x based on 2021E Adj. EBITDA of $60.0mm
• Existing holders of common stock, including majority KORE shareholder Abry Partners, are expected to
roll 100% of their common equity
Capital Structure
• The transaction will be funded by a combination of CTAC cash held in a trust account and proceeds
from a $225mm PIPE
• Transaction is expected to result in up to $484mm of total cash proceeds to fund the transaction1
(1) Assumes no redemption of CTAC’s existing shareholders, however actual proceeds available for the transaction are dependent on shareholder redemptions
STRICTLY PRIVATE AND CONFIDENTIAL
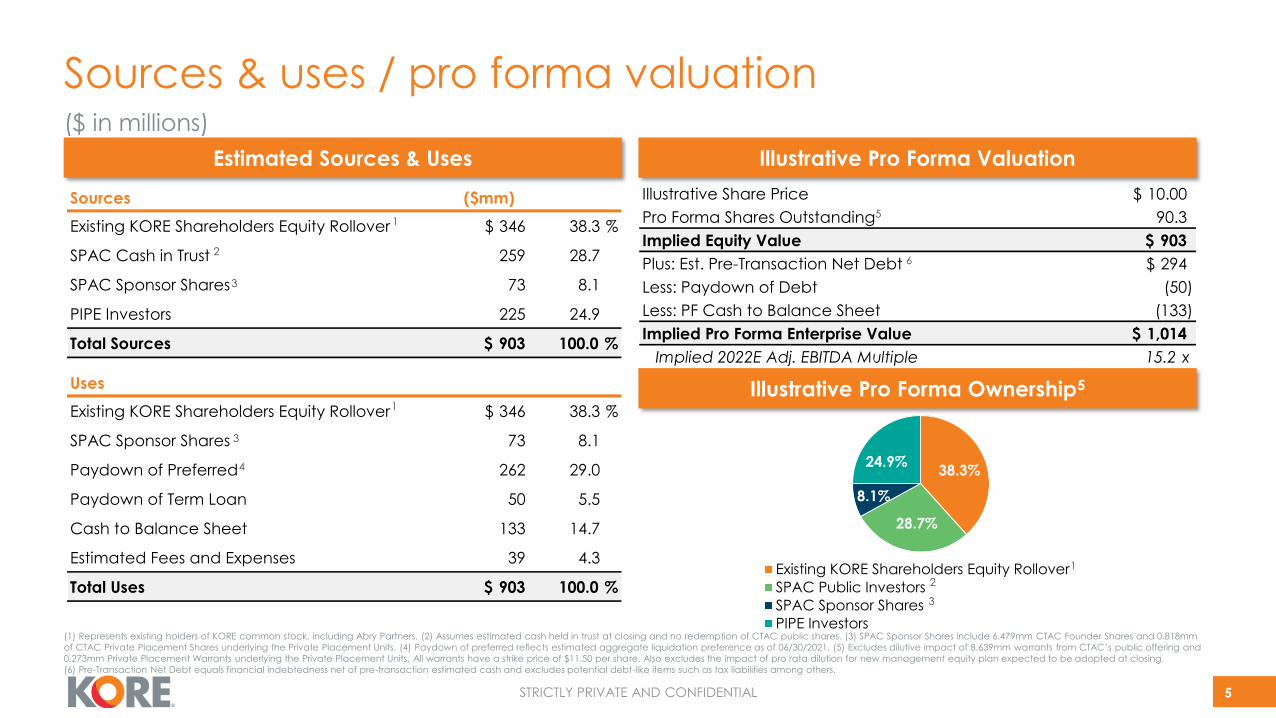
Sources & uses / pro forma valuation
5
Estimated Sources & Uses
($ in millions)
Illustrative Pro Forma Valuation
(1) Represents existing holders of KORE common stock, including Abry Partners. (2) Assumes estimated cash held in trust at closing and no redemption of CTAC public shares. (3) SPAC Sponsor Shares include 6.479mm CTAC Founder Shares and 0.818mm
of CTAC Private Placement Shares underlying the Private Placement Units. (4) Paydown of preferred reflects estimated aggregate liquidation preference as of 06/30/2021. (5) Excludes dilutive impact of 8.639mm warrants from CTAC’s public offering and
0.273mm Private Placement Warrants underlying the Private Placement Units. All warrants have a strike price of $11.50 per share. Also excludes the impact of pro rata dilution for new management equity plan expected to be adopted at closing.
(6) Pre-Transaction Net Debt equals financial indebtedness net of pre-transaction estimated cash and excludes potential debt-like items such as tax liabilities among others.
Illustrative Pro Forma Ownership5
3
3
3
2
2
1
1
1
5
4 38.3%
28.7%
8.1%
24.9%
Existing KORE Shareholders Equity Rollover
SPAC Public Investors
SPAC Sponsor Shares
PIPE Investors
6
Illustrative Share Price $ 10.00
Pro Forma Shares Outstanding 90.3
Implied Equity Value $ 903
Plus: Est. Pre-Transaction Net Debt $ 294
Less: Paydown of Debt (50)
Less: PF Cash to Balance Sheet (133)
Implied Pro Forma Enterprise Value $ 1,014
Implied 2022E Adj. EBITDA Multiple 15.2 x
Sources ($mm)
Existing KORE Shareholders Equity Rollover $ 346 38.3 %
SPAC Cash in Trust 259 28.7
SPAC Sponsor Shares 73 8.1
PIPE Investors 225 24.9
Total Sources $ 903 100.0 %
Uses
Existing KORE Shareholders Equity Rollover $ 346 38.3 %
SPAC Sponsor Shares 73 8.1
Paydown of Preferred 262 29.0
Paydown of Term Loan 50 5.5
Cash to Balance Sheet 133 14.7
Estimated Fees and Expenses 39 4.3
Total Uses $ 903 100.0 %
STRICTLY PRIVATE AND CONFIDENTIAL
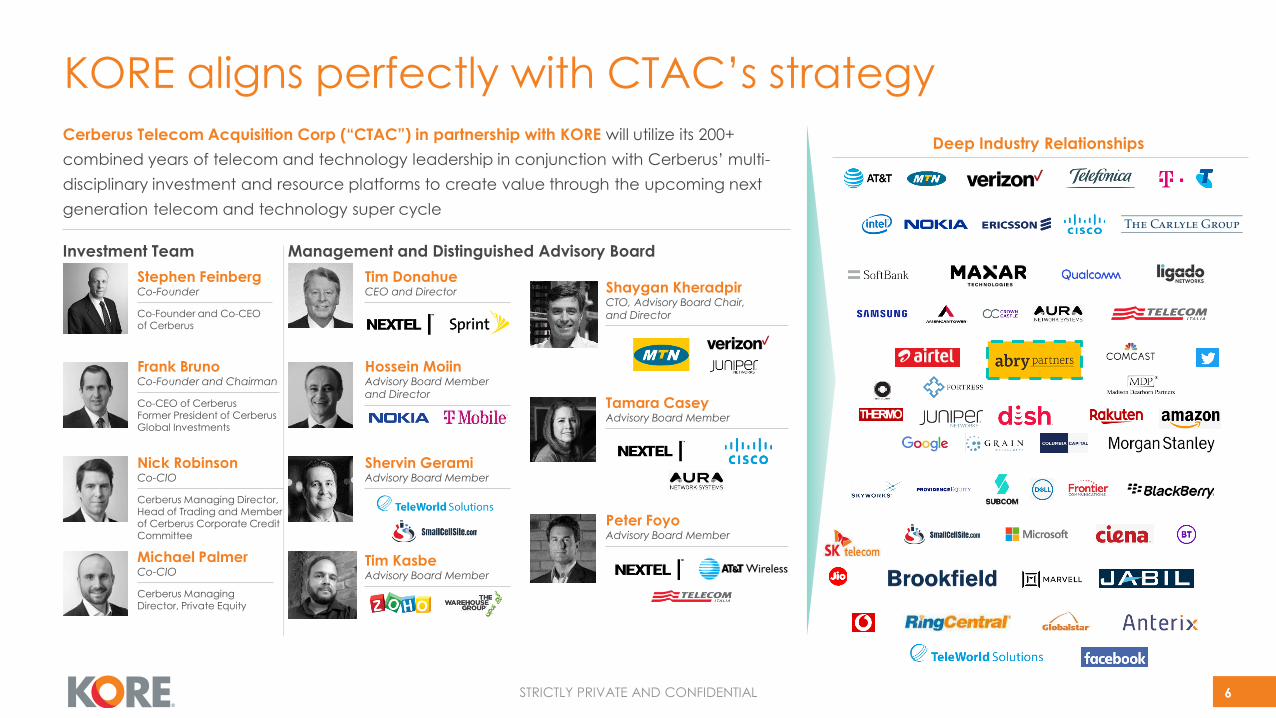
KORE aligns perfectly with CTAC’s strategy
6
Nick RobinsonCo-CIO
Cerberus Managing Director, Head of Trading and Member of Cerberus Corporate Credit Committee
Investment Team
Tim DonahueCEO and Director
Management and Distinguished Advisory Board
Michael PalmerCo-CIO
Cerberus Managing Director, Private Equity
Shaygan KheradpirCTO, Advisory Board Chair, and Director
Hossein MoiinAdvisory Board Member and Director
Tamara CaseyAdvisory Board Member
Shervin GeramiAdvisory Board Member
Peter FoyoAdvisory Board Member
Frank BrunoCo-Founder and Chairman
Co-CEO of CerberusFormer President of Cerberus Global Investments
Cerberus Telecom Acquisition Corp (“CTAC”) in partnership with KORE will utilize its 200+
combined years of telecom and technology leadership in conjunction with Cerberus’ multi-
disciplinary investment and resource platforms to create value through the upcoming next
generation telecom and technology super cycle
Deep Industry Relationships
Stephen FeinbergCo-Founder
Co-Founder and Co-CEO of Cerberus
Tim KasbeAdvisory Board Member
STRICTLY PRIVATE AND CONFIDENTIAL
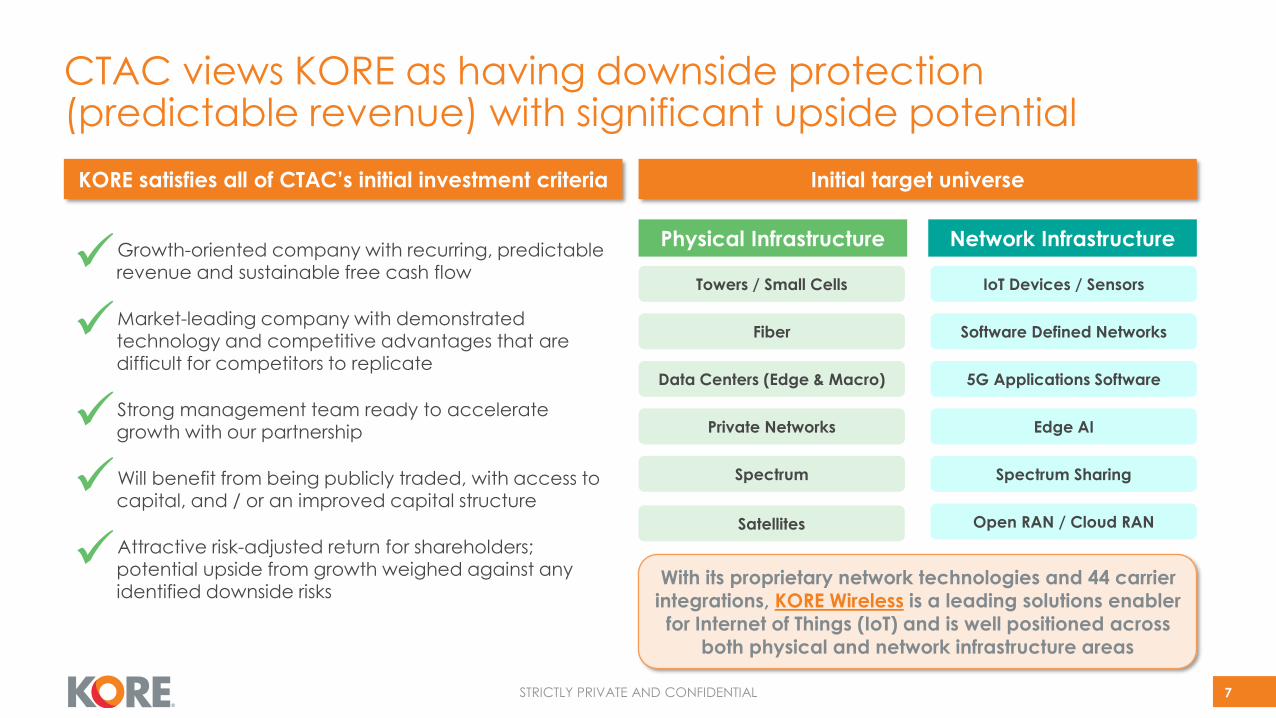
✓Growth-oriented company with recurring, predictable revenue and sustainable free cash flow
✓Market-leading company with demonstrated technology and competitive advantages that are difficult for competitors to replicate
✓Strong management team ready to accelerate growth with our partnership
✓Will benefit from being publicly traded, with access to capital, and / or an improved capital structure
✓Attractive risk-adjusted return for shareholders; potential upside from growth weighed against any identified downside risks
CTAC views KORE as having downside protection (predictable revenue) with significant upside potential
KORE satisfies all of CTAC’s initial investment criteria Initial target universe
With its proprietary network technologies and 44 carrier
integrations, KORE Wireless is a leading solutions enabler
for Internet of Things (IoT) and is well positioned across
both physical and network infrastructure areas
7
Physical Infrastructure Network Infrastructure
Towers / Small Cells
Fiber
Data Centers (Edge & Macro)
Private Networks
Spectrum
Satellites
IoT Devices / Sensors
Software Defined Networks
5G Applications Software
Edge AI
Spectrum Sharing
Open RAN / Cloud RAN
✓
✓
✓
✓
✓

Business Overview
STRICTLY PRIVATE AND CONFIDENTIAL 9
With the oncoming tidal wave of
connected devices, KORE’s mission is to
simplify the complexities of IoT and help
customers Deploy, Manage, and Scale
their mission-critical IoT solutions
STRICTLY PRIVATE AND CONFIDENTIAL
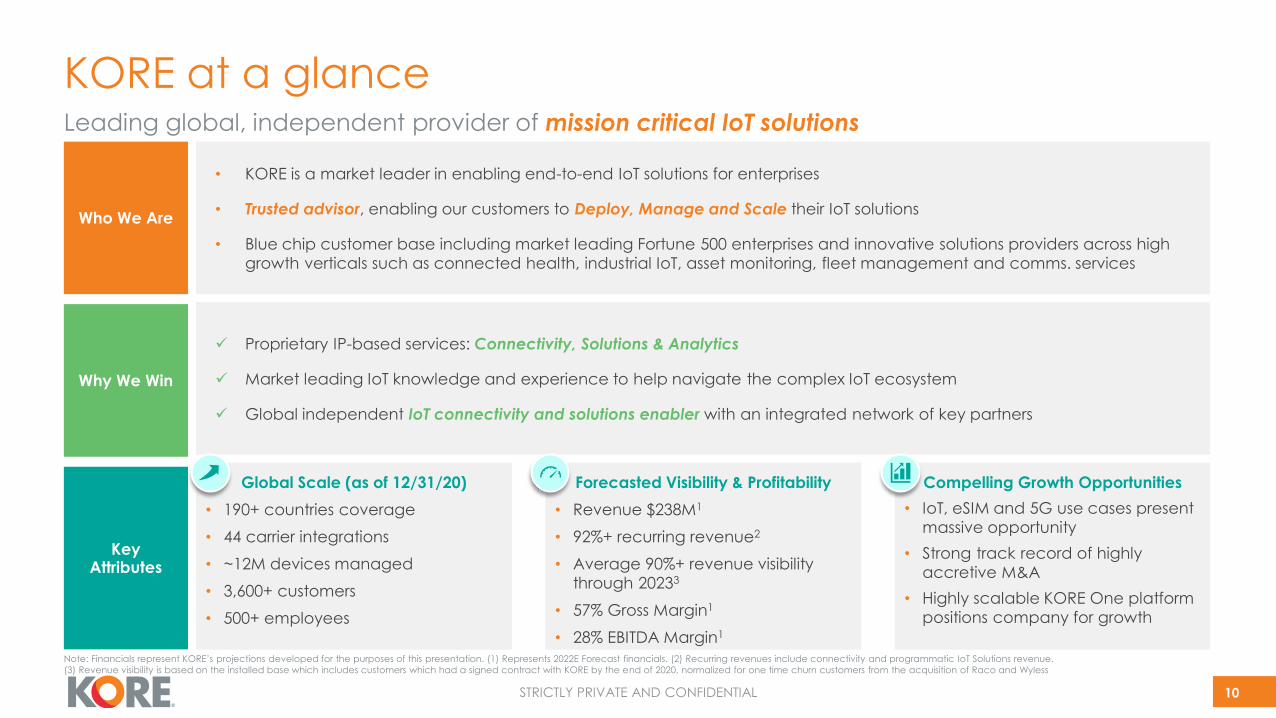
Compelling Growth Opportunities
• IoT, eSIM and 5G use cases present
massive opportunity
• Strong track record of highly
accretive M&A
• Highly scalable KORE One platform
positions company for growth
KORE at a glance
10
• KORE is a market leader in enabling end-to-end IoT solutions for enterprises
• Trusted advisor, enabling our customers to Deploy, Manage and Scale their IoT solutions
• Blue chip customer base including market leading Fortune 500 enterprises and innovative solutions providers across high
growth verticals such as connected health, industrial IoT, asset monitoring, fleet management and comms. services
✓ Proprietary IP-based services: Connectivity, Solutions & Analytics
✓ Market leading IoT knowledge and experience to help navigate the complex IoT ecosystem
✓ Global independent IoT connectivity and solutions enabler with an integrated network of key partners
Global Scale (as of 12/31/20)
• 190+ countries coverage
• 44 carrier integrations
• ~12M devices managed
• 3,600+ customers
• 500+ employees
Who We Are
Why We Win
Key Attributes
Forecasted Visibility & Profitability
• Revenue $238M1
• 92%+ recurring revenue2
• Average 90%+ revenue visibility
through 20233
• 57% Gross Margin1
• 28% EBITDA Margin1
Leading global, independent provider of mission critical IoT solutions
Note: Financials represent KORE’s projections developed for the purposes of this presentation. (1) Represents 2022E Forecast financials. (2) Recurring revenues include connectivity and programmatic IoT Solutions revenue.
(3) Revenue visibility is based on the installed base which includes customers which had a signed contract with KORE by the end of 2020, normalized for one time churn customers from the acquisition of Raco and Wyless
STRICTLY PRIVATE AND CONFIDENTIAL
Primary pricing methodProduct line Product description
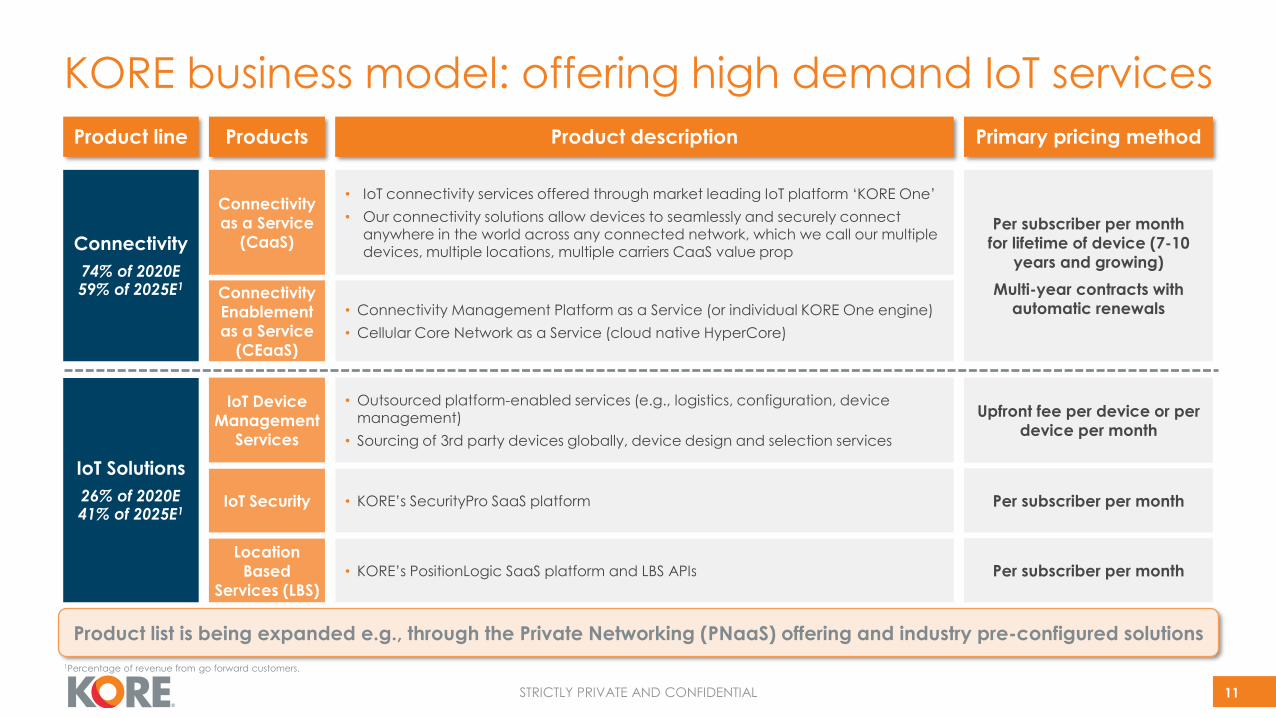
Connectivity
74% of 2020E59% of 2025E1
Per subscriber per month
for lifetime of device (7-10
years and growing)
Multi-year contracts with
automatic renewals
IoT Solutions
26% of 2020E41% of 2025E1
• IoT connectivity services offered through market leading IoT platform ‘KORE One’
• Our connectivity solutions allow devices to seamlessly and securely connect anywhere in the world across any connected network, which we call our multiple devices, multiple locations, multiple carriers CaaS value prop
• Connectivity Management Platform as a Service (or individual KORE One engine)
• Cellular Core Network as a Service (cloud native HyperCore)
Products
Connectivity
as a Service
(CaaS)
Connectivity
Enablement
as a Service
(CEaaS)
IoT Device
Management
Services
Location
Based
Services (LBS)
• Outsourced platform-enabled services (e.g., logistics, configuration, device management)
• Sourcing of 3rd party devices globally, device design and selection services
IoT Security
• KORE’s PositionLogic SaaS platform and LBS APIs Per subscriber per month
• KORE’s SecurityPro SaaS platform Per subscriber per month
Upfront fee per device or per
device per month
11
KORE business model: offering high demand IoT services
Product list is being expanded e.g., through the Private Networking (PNaaS) offering and industry pre-configured solutions
1Percentage of revenue from go forward customers.
STRICTLY PRIVATE AND CONFIDENTIAL
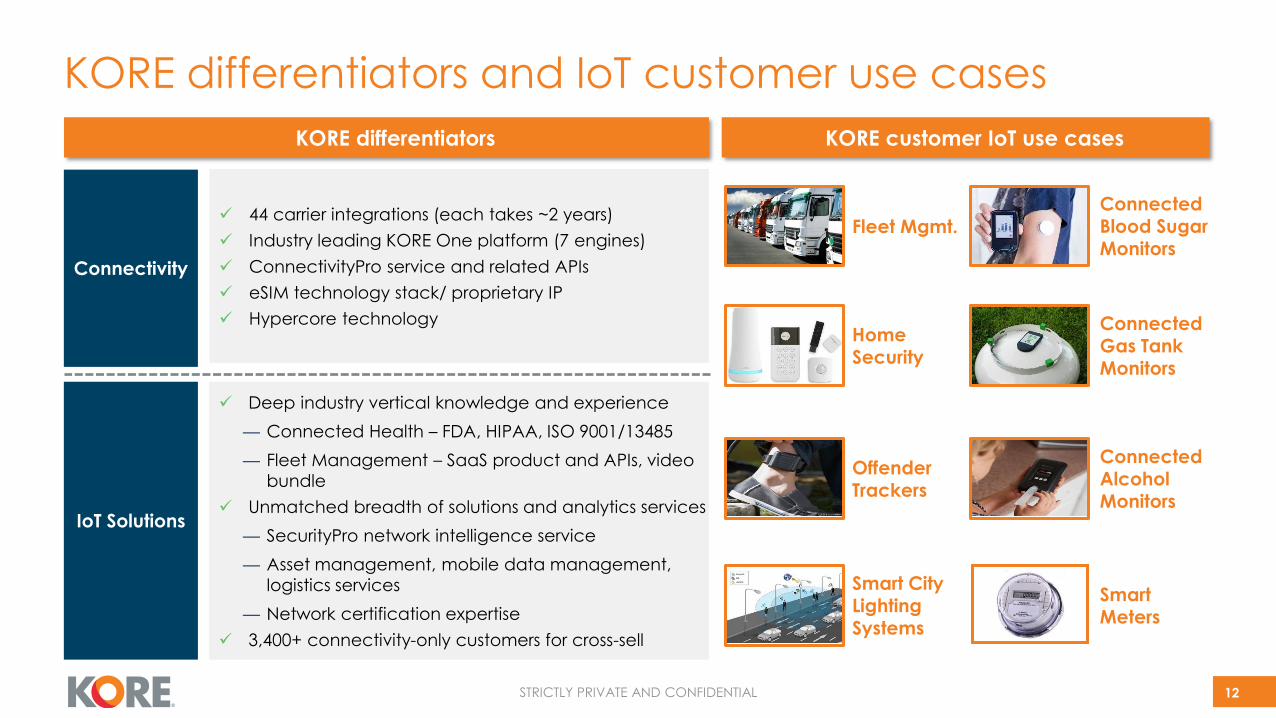
✓ 44 carrier integrations (each takes ~2 years)
✓ Industry leading KORE One platform (7 engines)
✓ ConnectivityPro service and related APIs
✓ eSIM technology stack/ proprietary IP
✓ Hypercore technology
Connectivity
IoT Solutions
12
Fleet Mgmt.
Connected Blood Sugar Monitors
Connected Gas Tank Monitors
Connected Alcohol Monitors
Offender Trackers
Smart Meters
Smart City Lighting Systems
Home Security
KORE differentiators and IoT customer use cases
✓ Deep industry vertical knowledge and experience
— Connected Health – FDA, HIPAA, ISO 9001/13485
— Fleet Management – SaaS product and APIs, video
bundle
✓ Unmatched breadth of solutions and analytics services
— SecurityPro network intelligence service
— Asset management, mobile data management,
logistics services
— Network certification expertise
✓ 3,400+ connectivity-only customers for cross-sell
• KORE differentiators • KORE customer IoT use cases
STRICTLY PRIVATE AND CONFIDENTIAL
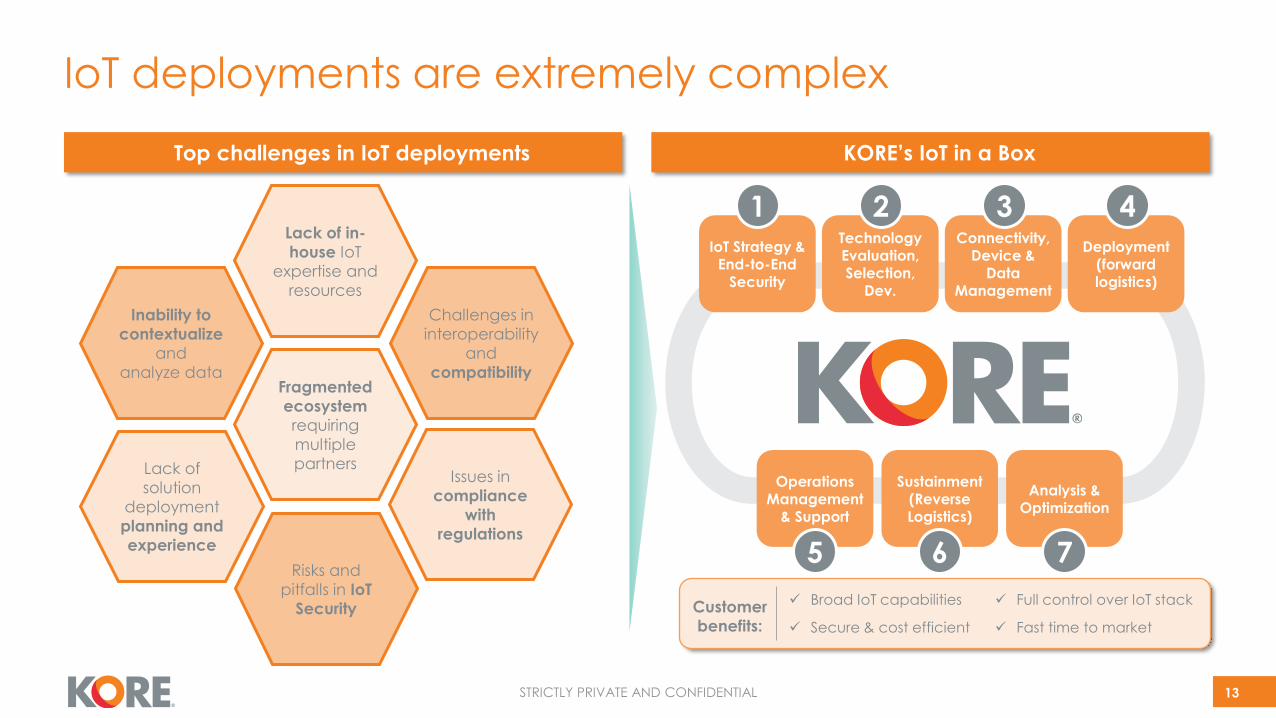
• Top challenges in IoT deployments
IoT deployments are extremely complex
Inability to
contextualize
and
analyze dataFragmented
ecosystem
requiring
multiple
partners
Challenges in
interoperability
and
compatibility
Lack of
solution
deployment
planning and
experience
Issues in
compliance
with
regulations
Lack of in-
house IoT
expertise and
resources
Risks and
pitfalls in IoT
Security
• KORE’s IoT in a Box
IoT Strategy & End-to-End
Security
Technology Evaluation, Selection,
Dev.
Connectivity, Device &
Data Management
Deployment (forward logistics)
Operations Management
& Support
Sustainment (Reverse Logistics)
Analysis & Optimization
1 2 3 4
13
✓ Broad IoT capabilities
✓ Secure & cost efficient
✓ Full control over IoT stack
✓ Fast time to market
Customer
benefits:
5 6 7
STRICTLY PRIVATE AND CONFIDENTIAL
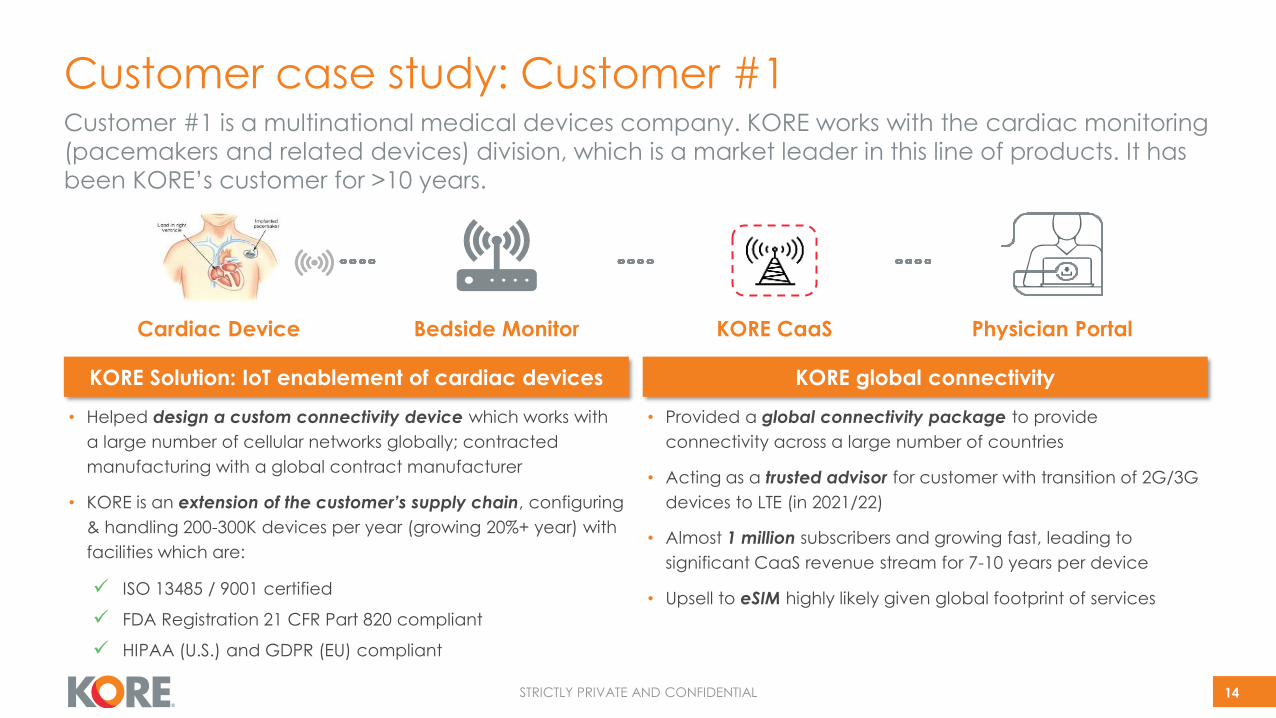
Customer case study: Customer #1
KORE global connectivity
• Provided a global connectivity package to provide
connectivity across a large number of countries
• Acting as a trusted advisor for customer with transition of 2G/3G
devices to LTE (in 2021/22)
• Almost 1 million subscribers and growing fast, leading to
significant CaaS revenue stream for 7-10 years per device
• Upsell to eSIM highly likely given global footprint of services
KORE Solution: IoT enablement of cardiac devices
• Helped design a custom connectivity device which works with
a large number of cellular networks globally; contracted
manufacturing with a global contract manufacturer
• KORE is an extension of the customer’s supply chain, configuring
& handling 200-300K devices per year (growing 20%+ year) with
facilities which are:
✓ ISO 13485 / 9001 certified
✓ FDA Registration 21 CFR Part 820 compliant
✓ HIPAA (U.S.) and GDPR (EU) compliant
Physician PortalKORE CaaSCardiac Device Bedside Monitor
14
Customer #1 is a multinational medical devices company. KORE works with the cardiac monitoring
(pacemakers and related devices) division, which is a market leader in this line of products. It has
been KORE’s customer for >10 years.
STRICTLY PRIVATE AND CONFIDENTIAL
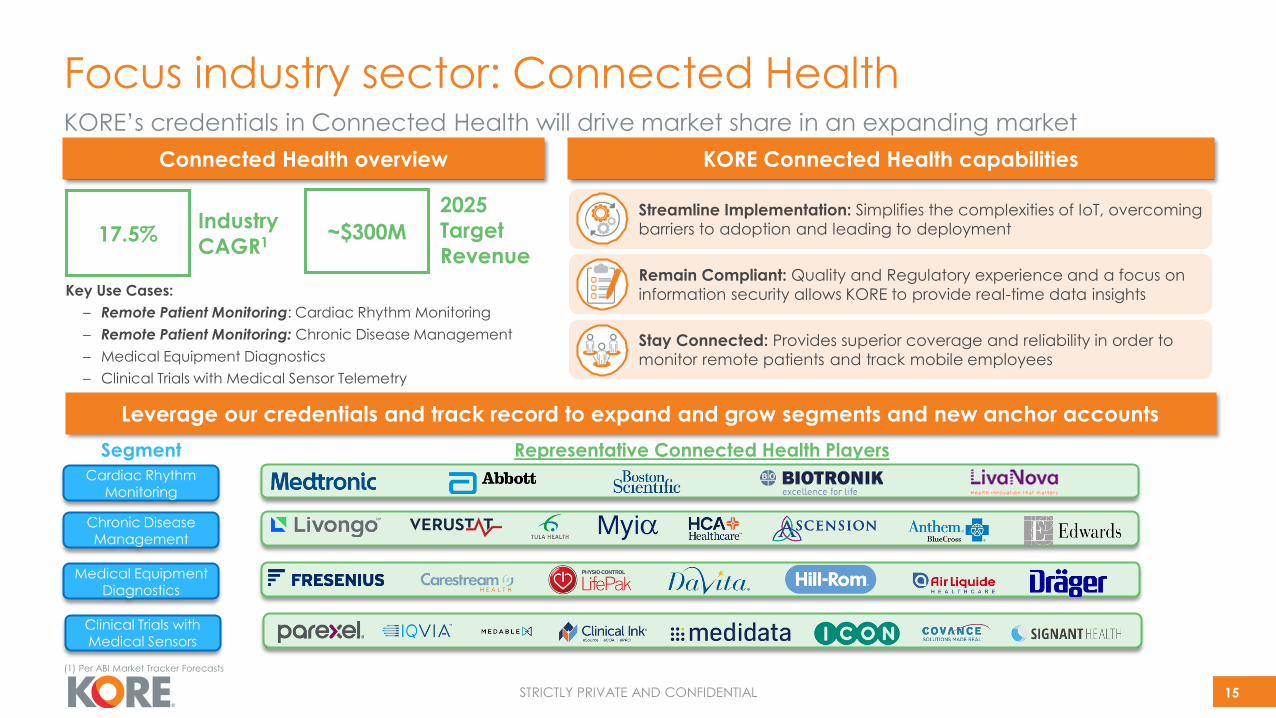
Streamline Implementation: Simplifies the complexities of IoT, overcoming
barriers to adoption and leading to deployment
Remain Compliant: Quality and Regulatory experience and a focus on
information security allows KORE to provide real-time data insights
Stay Connected: Provides superior coverage and reliability in order to
monitor remote patients and track mobile employees
Focus industry sector: Connected Health
15
KORE’s credentials in Connected Health will drive market share in an expanding market
KORE Connected Health capabilitiesConnected Health overview
Leverage our credentials and track record to expand and grow segments and new anchor accounts
Key Use Cases:
– Remote Patient Monitoring: Cardiac Rhythm Monitoring
– Remote Patient Monitoring: Chronic Disease Management
– Medical Equipment Diagnostics
– Clinical Trials with Medical Sensor Telemetry
Representative Connected Health Players
Industry
CAGR117.5% ~$300M
2025
Target
Revenue
Cardiac Rhythm Monitoring
Segment
Chronic Disease Management
Medical Equipment Diagnostics
Clinical Trials with Medical Sensors
(1) Per ABI Market Tracker Forecasts
STRICTLY PRIVATE AND CONFIDENTIAL
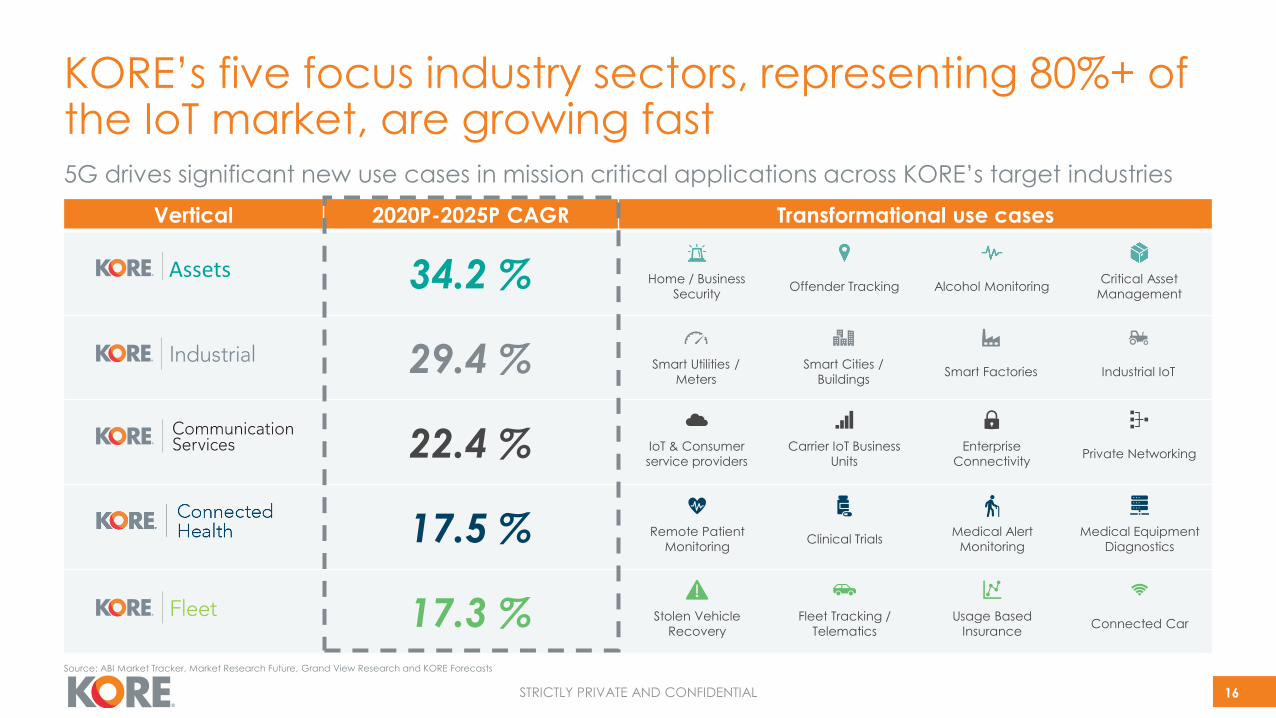
KORE’s five focus industry sectors, representing 80%+ of the IoT market, are growing fast
Vertical 2020P-2025P CAGR Transformational use cases
34.2 %
29.4 %
22.4 %
17.5 %
17.3 %
16
Remote Patient
Monitoring Clinical Trials
Medical Alert
Monitoring
Medical Equipment
Diagnostics
Stolen Vehicle
Recovery
Fleet Tracking /
Telematics
Usage Based
InsuranceConnected Car
IoT & Consumer
service providers
Carrier IoT Business
Units
Enterprise
ConnectivityPrivate Networking
Smart Utilities /
Meters
Smart Cities /
BuildingsSmart Factories Industrial IoT
Home / Business
SecurityOffender Tracking
Critical Asset
ManagementAlcohol Monitoring
5G drives significant new use cases in mission critical applications across KORE’s target industries
Source: ABI Market Tracker, Market Research Future, Grand View Research and KORE Forecasts
Assets
STRICTLY PRIVATE AND CONFIDENTIAL
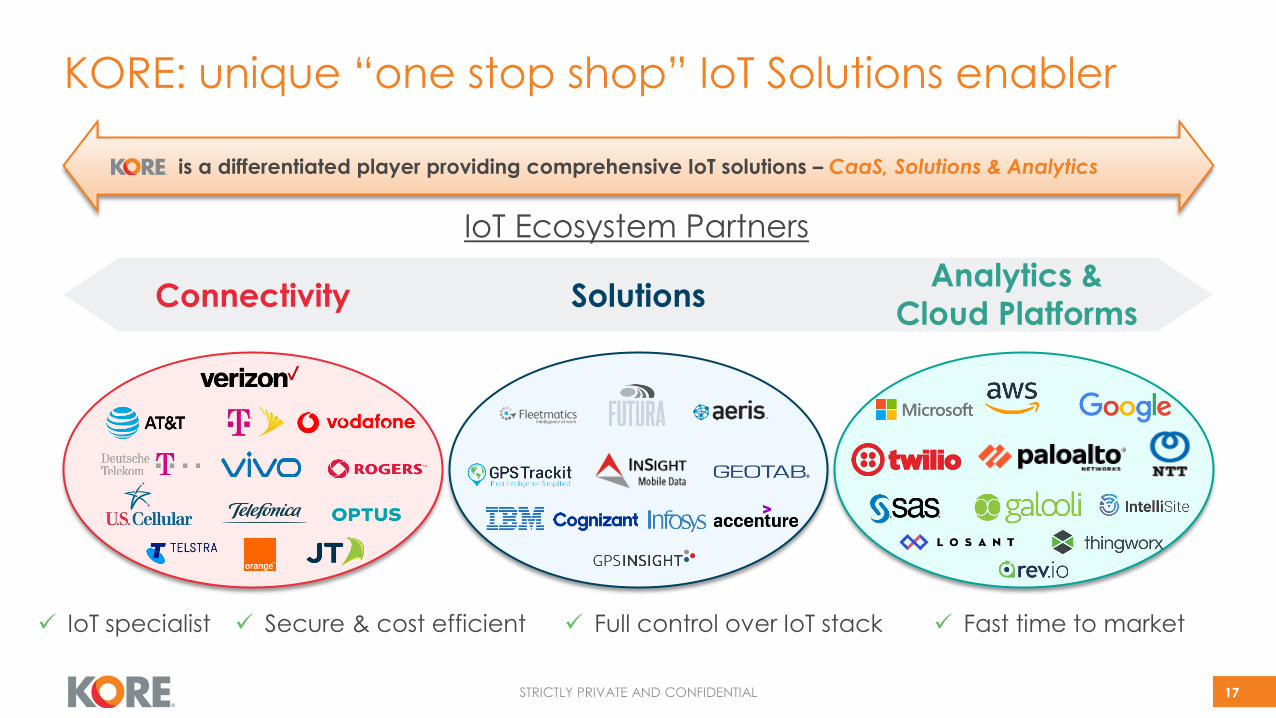
KORE: unique “one stop shop” IoT Solutions enabler
17
SolutionsAnalytics &
Cloud PlatformsConnectivity
✓ IoT specialist ✓ Secure & cost efficient ✓ Full control over IoT stack ✓ Fast time to market
is a differentiated player providing comprehensive IoT solutions – CaaS, Solutions & Analytics
IoT Ecosystem Partners
STRICTLY PRIVATE AND CONFIDENTIAL
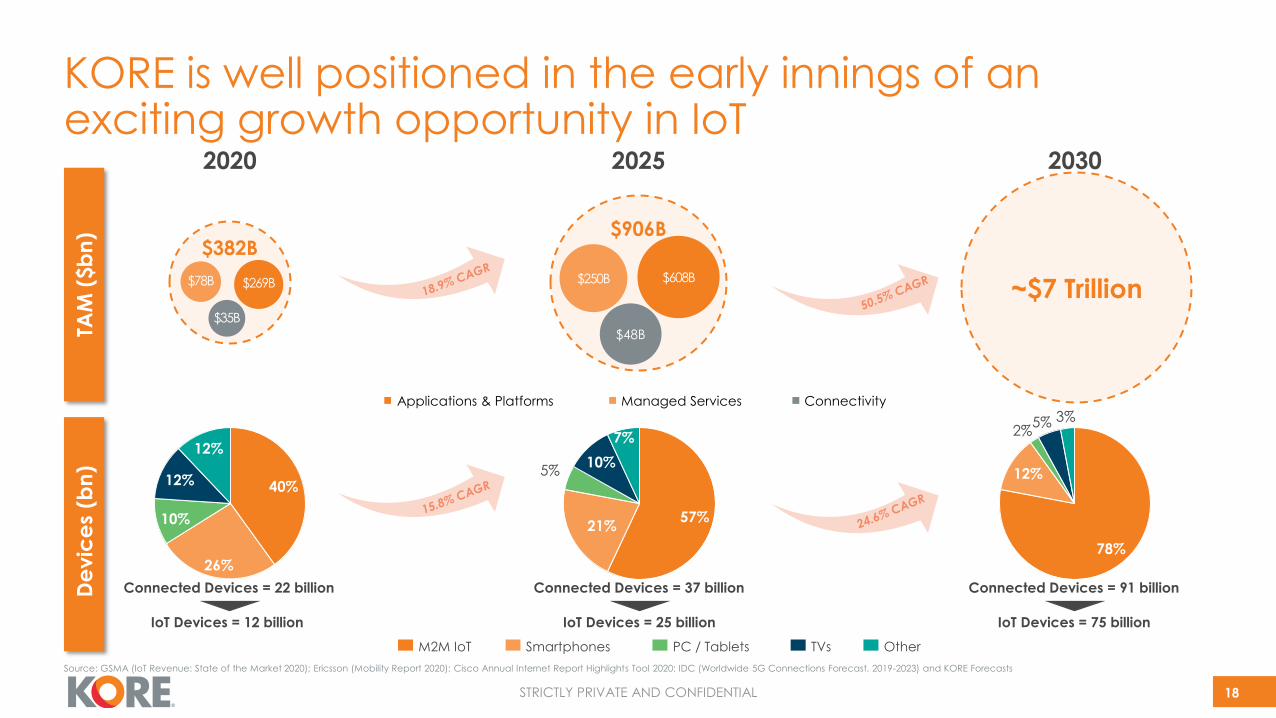
KORE is well positioned in the early innings of an exciting growth opportunity in IoT
18
2020 2025 2030
TAM
($b
n)
De
vic
es
(bn
)
Applications & Platforms Managed Services Connectivity
$906B
~$7 Trillion
$382B
$78B
$35B
$269B $250B $608B
$48B
IoT Devices = 12 billion
Connected Devices = 22 billion
IoT Devices = 25 billion
Connected Devices = 37 billion
IoT Devices = 75 billion
Connected Devices = 91 billion
40%
26%
10%
12%
12%
M2M IoT TVsSmartphones PC / Tablets Other
57%21%
10%5%
7%
78%
12%
2%5% 3%
Source: GSMA (IoT Revenue: State of the Market 2020); Ericsson (Mobility Report 2020); Cisco Annual Internet Report Highlights Tool 2020; IDC (Worldwide 5G Connections Forecast, 2019-2023) and KORE Forecasts
STRICTLY PRIVATE AND CONFIDENTIAL
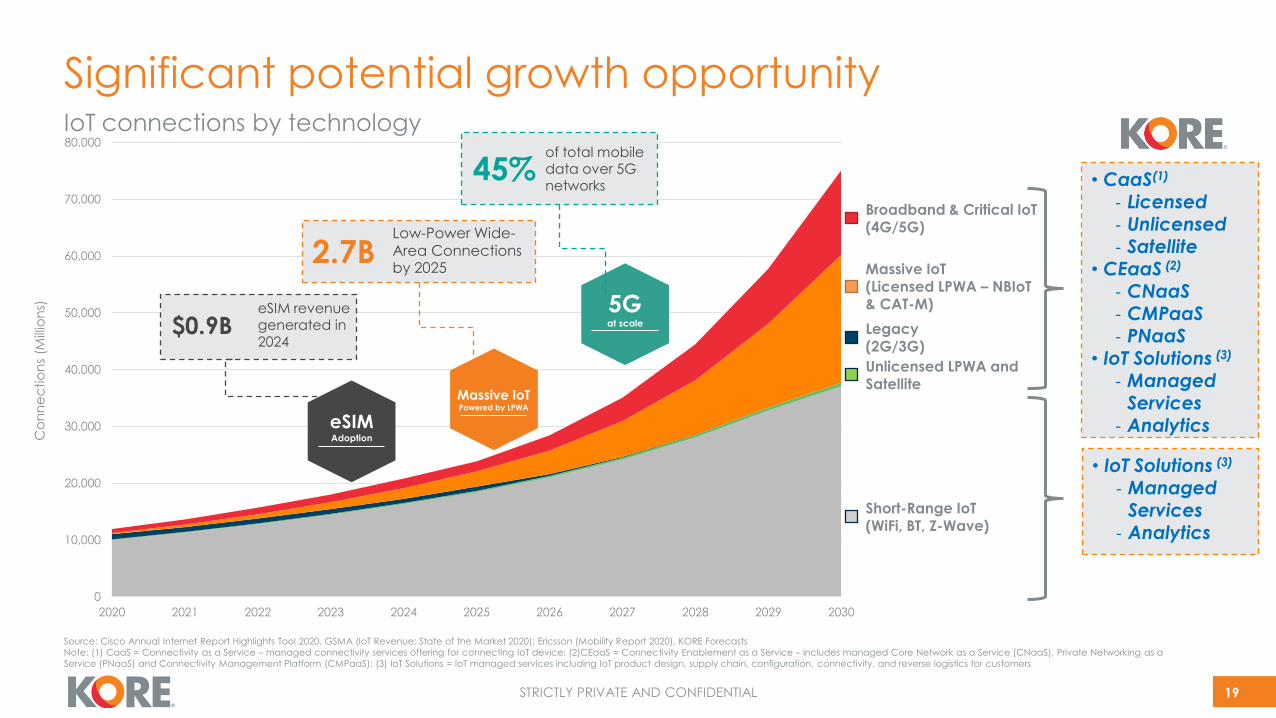
• CaaS(1)
‐ Licensed‐ Unlicensed‐ Satellite
• CEaaS (2)
‐ CNaaS‐ CMPaaS‐ PNaaS
• IoT Solutions (3)
‐ Managed Services
‐ Analytics
19
0
10,000
20,000
30,000
40,000
50,000
60,000
70,000
80,000
2020 2021 2022 2023 2024 2025 2026 2027 2028 2029 2030
Co
nn
ec
tio
ns
(Mill
ion
s)
Significant potential growth opportunityIoT connections by technology
Massive IoT Powered by LPWA
2.7BLow-Power Wide-Area Connections by 2025
5Gat scale
of total mobile data over 5G networks
45%
eSIMAdoption
eSIM revenue generated in 2024
$0.9B
Broadband & Critical IoT(4G/5G)
Massive IoT (Licensed LPWA – NBIoT & CAT-M)
Legacy(2G/3G)
Unlicensed LPWA and Satellite
Short-Range IoT(WiFi, BT, Z-Wave)
• IoT Solutions (3)
‐ Managed Services
‐ Analytics
Source: Cisco Annual Internet Report Highlights Tool 2020, GSMA (IoT Revenue: State of the Market 2020); Ericsson (Mobility Report 2020), KORE Forecasts
Note: (1) CaaS = Connectivity as a Service – managed connectivity services offering for connecting IoT device; (2)CEaaS = Connectivity Enablement as a Service – includes managed Core Network as a Service (CNaaS), Private Networking as a
Service (PNaaS) and Connectivity Management Platform (CMPaaS); (3) IoT Solutions = IoT managed services including IoT product design, supply chain, configuration, connectivity, and reverse logistics for customers
STRICTLY PRIVATE AND CONFIDENTIAL
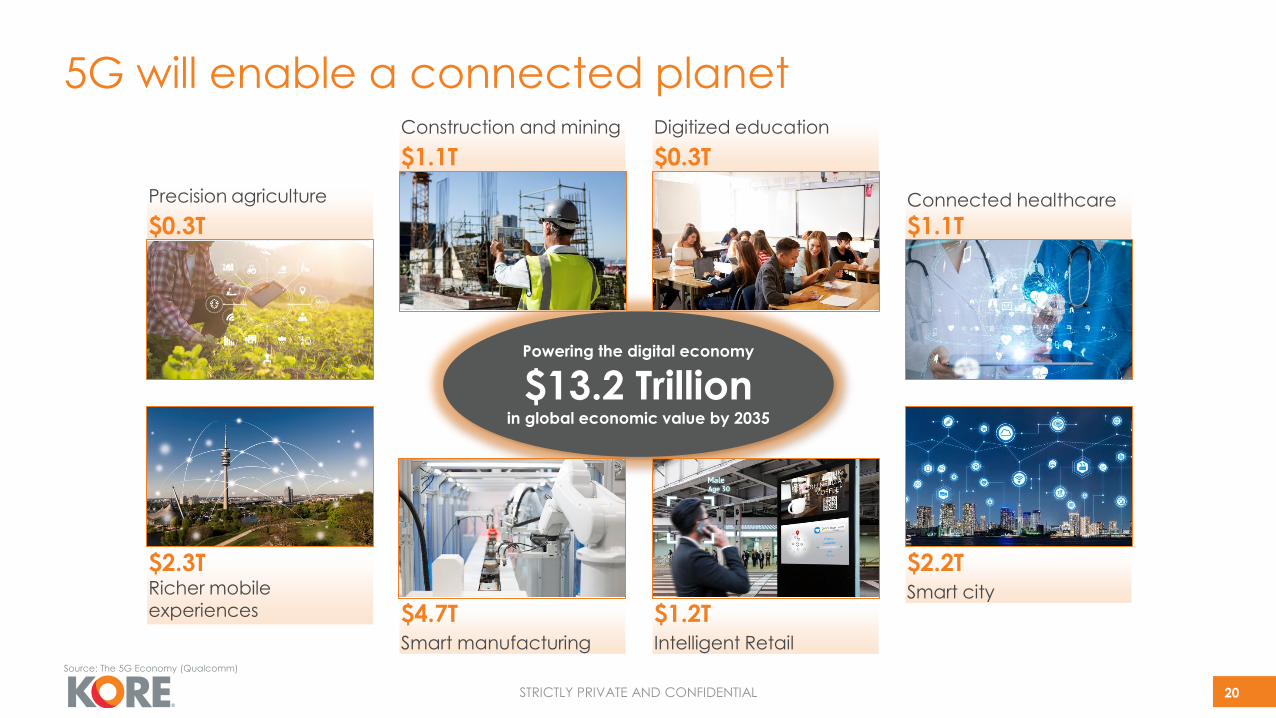
Connected healthcare
$1.1T
Digitized education
$0.3T
Construction and mining
$1.1T
$2.3TRicher mobile experiences
$2.2TSmart city
$4.7TSmart manufacturing
$1.2TIntelligent Retail
20
Powering the digital economy
$13.2 Trillionin global economic value by 2035
Precision agriculture
$0.3T
5G will enable a connected planet
Source: The 5G Economy (Qualcomm)
STRICTLY PRIVATE AND CONFIDENTIAL
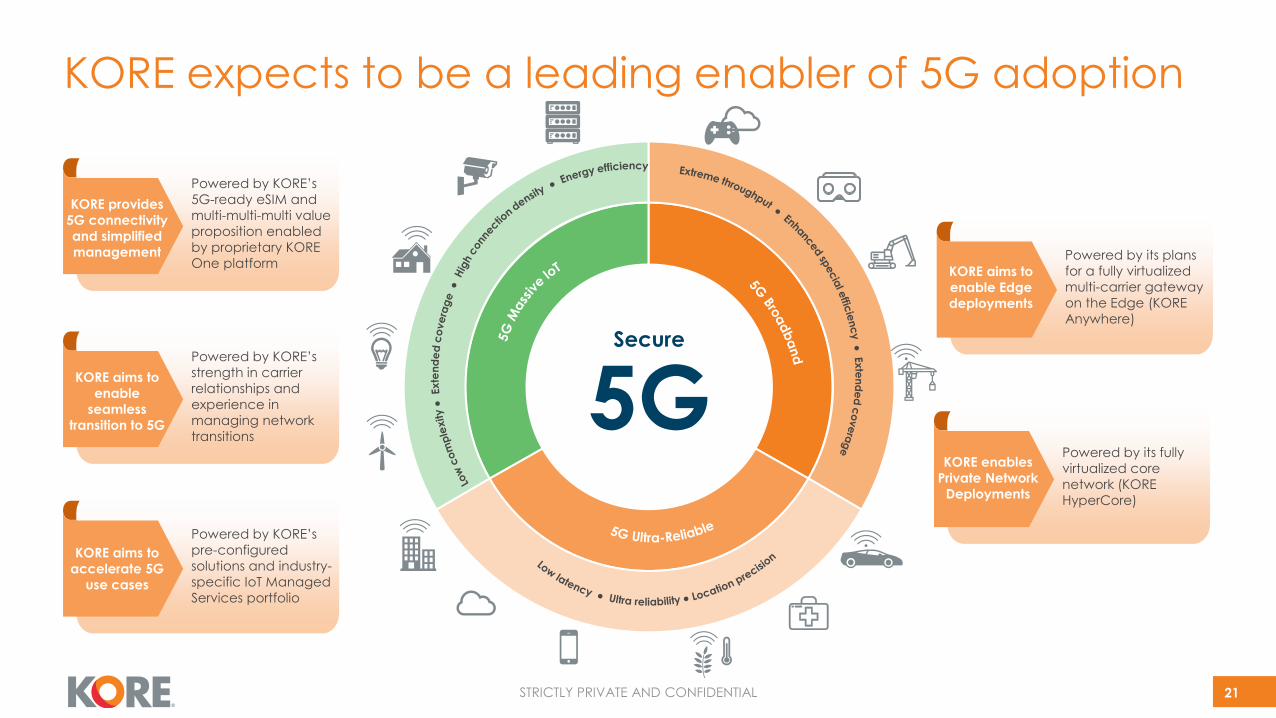
KORE expects to be a leading enabler of 5G adoption
21
Powered by KORE’s
5G-ready eSIM and
multi-multi-multi value
proposition enabled
by proprietary KORE
One platform
KORE provides
5G connectivity
and simplified
management
Powered by KORE’s
strength in carrier
relationships and
experience in
managing network
transitions
KORE aims to
enable
seamless
transition to 5G
Powered by KORE’s
pre-configured
solutions and industry-
specific IoT Managed
Services portfolio
KORE aims to
accelerate 5G
use cases
Powered by its plans
for a fully virtualized
multi-carrier gateway
on the Edge (KORE
Anywhere)
KORE aims to
enable Edge
deployments
Powered by its fully
virtualized core
network (KORE
HyperCore)
KORE enables
Private Network
Deployments
5GSecure
STRICTLY PRIVATE AND CONFIDENTIAL
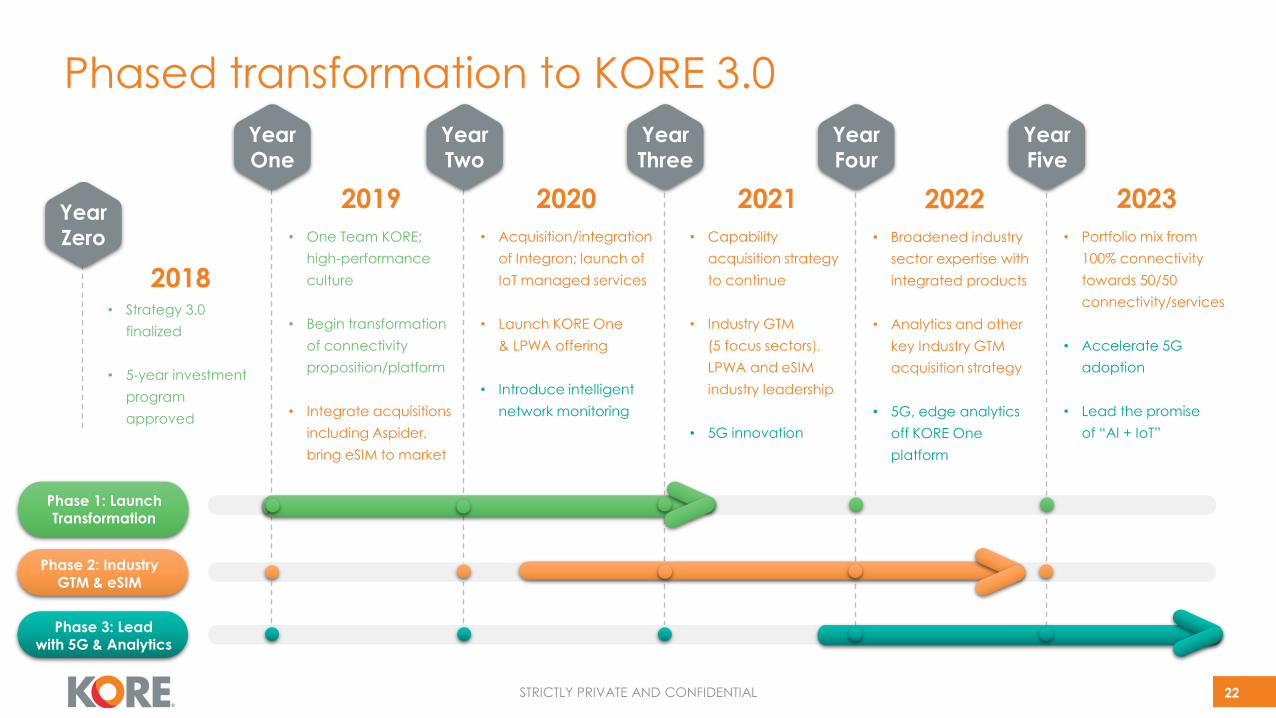
Year Two
Year Three
Year Four
Year Five
Year One
22
2018
Year Zero
• Strategy 3.0
finalized
• 5-year investment
program
approved
2019
• One Team KORE;
high-performance
culture
• Begin transformation
of connectivity
proposition/platform
• Integrate acquisitions
including Aspider,
bring eSIM to market
2020
• Acquisition/integration
of Integron; launch of
IoT managed services
• Launch KORE One
& LPWA offering
• Introduce intelligent
network monitoring
2021
• Capability
acquisition strategy
to continue
• Industry GTM
(5 focus sectors),
LPWA and eSIM
industry leadership
• 5G innovation
2022
• Broadened industry
sector expertise with
integrated products
• Analytics and other
key Industry GTM
acquisition strategy
• 5G, edge analytics
off KORE One
platform
2023
• Portfolio mix from
100% connectivity
towards 50/50
connectivity/services
• Accelerate 5G
adoption
• Lead the promise
of “AI + IoT”
Phase 3: Lead with 5G & Analytics
Phase 1: Launch Transformation
Phase 2: Industry GTM & eSIM
Phased transformation to KORE 3.0
STRICTLY PRIVATE AND CONFIDENTIAL
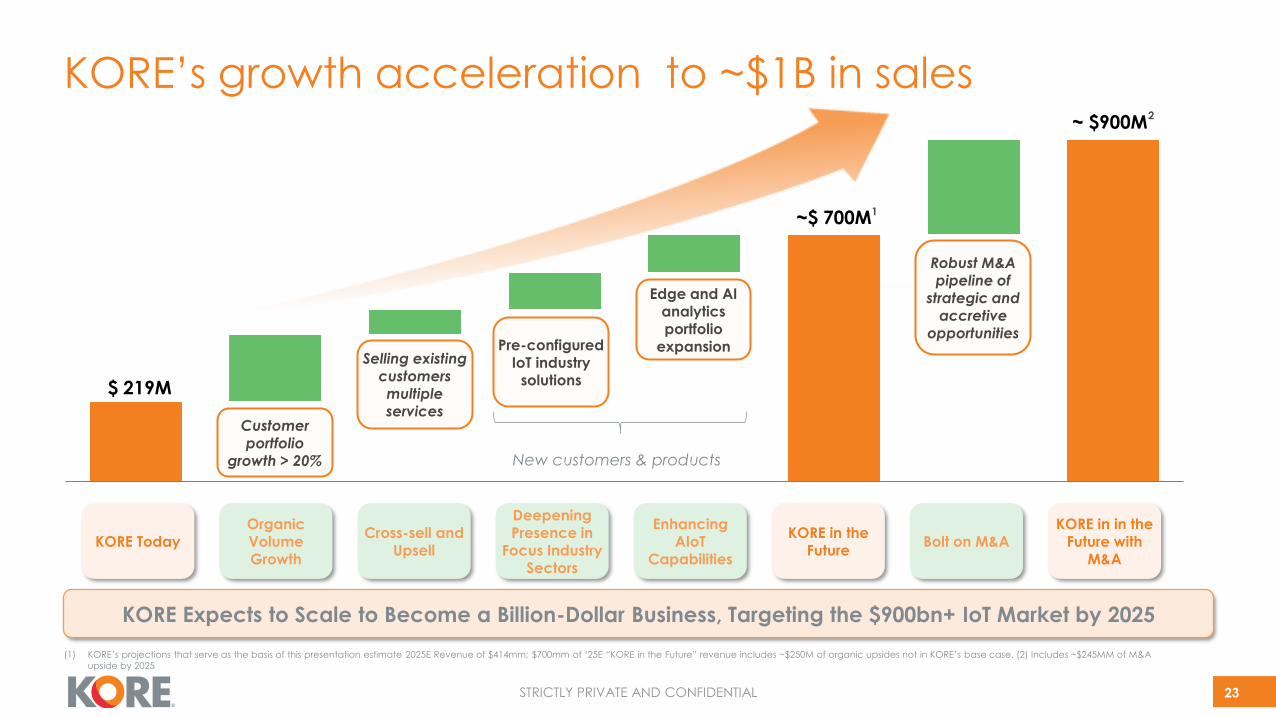
$ 219M
~$ 700M
~ $900M
KORE’s growth acceleration to ~$1B in sales
23
KORE Expects to Scale to Become a Billion-Dollar Business, Targeting the $900bn+ IoT Market by 2025
Selling existing customers multiple services
Robust M&A pipeline of
strategic and accretive
opportunities
KORE TodayEnhancing
AIoT Capabilities
Cross-sell and Upsell
Bolt on M&AKORE in in the
Future with M&A
Deepening Presence in
Focus Industry Sectors
Organic Volume Growth
Edge and AI analytics portfolio
expansionPre-configured IoT industry
solutions
Customer portfolio
growth > 20% New customers & products
KORE in the Future
(1) KORE’s projections that serve as the basis of this presentation estimate 2025E Revenue of $414mm; $700mm of ‘25E “KORE in the Future” revenue includes ~$250M of organic upsides not in KORE’s base case. (2) Includes ~$245MM of M&A
upside by 2025
2
1
STRICTLY PRIVATE AND CONFIDENTIAL
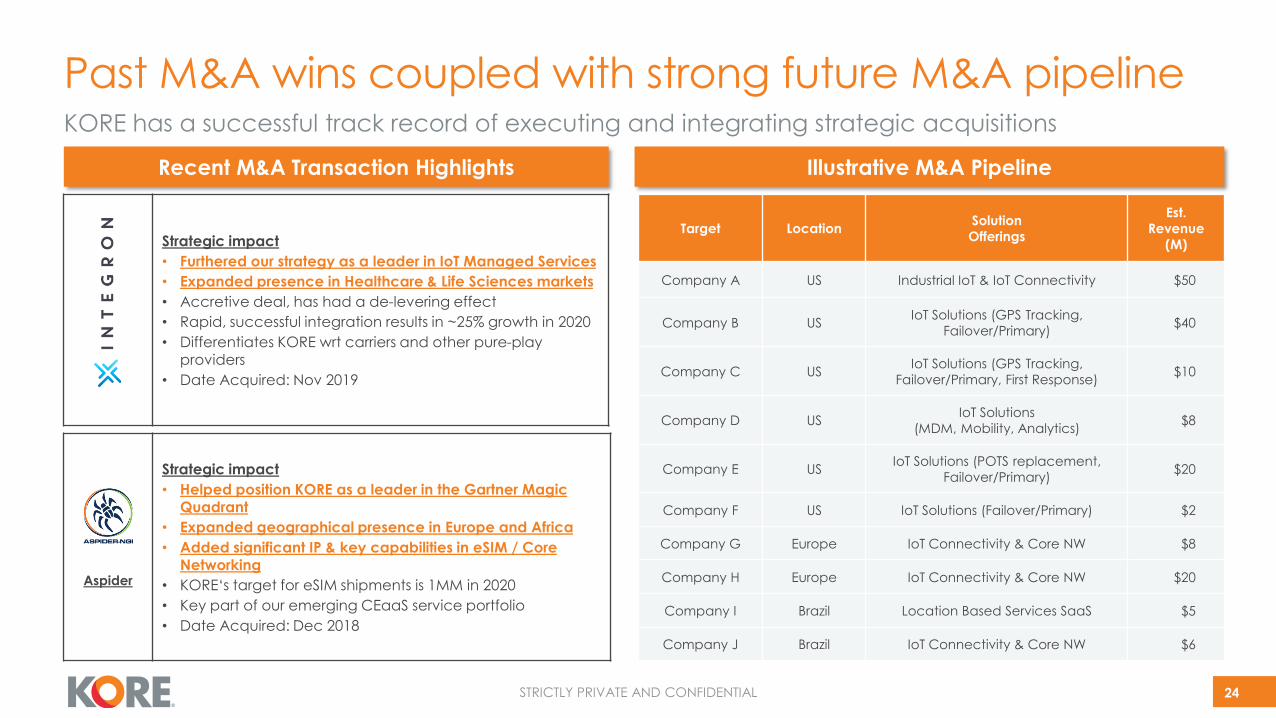
Illustrative M&A PipelineRecent M&A Transaction Highlights
Aspider
Strategic impact
• Helped position KORE as a leader in the Gartner Magic
Quadrant
• Expanded geographical presence in Europe and Africa
• Added significant IP & key capabilities in eSIM / Core Networking
• KORE‘s target for eSIM shipments is 1MM in 2020
• Key part of our emerging CEaaS service portfolio
• Date Acquired: Dec 2018
Past M&A wins coupled with strong future M&A pipeline
Target LocationSolution
Offerings
Est.
Revenue
(M)
Company A US Industrial IoT & IoT Connectivity $50
Company B USIoT Solutions (GPS Tracking,
Failover/Primary)$40
Company C USIoT Solutions (GPS Tracking,
Failover/Primary, First Response)$10
Company D USIoT Solutions
(MDM, Mobility, Analytics)$8
Company E USIoT Solutions (POTS replacement,
Failover/Primary)$20
Company F US IoT Solutions (Failover/Primary) $2
Company G Europe IoT Connectivity & Core NW $8
Company H Europe IoT Connectivity & Core NW $20
Company I Brazil Location Based Services SaaS $5
Company J Brazil IoT Connectivity & Core NW $6
24
KORE has a successful track record of executing and integrating strategic acquisitions
Strategic impact
• Furthered our strategy as a leader in IoT Managed Services
• Expanded presence in Healthcare & Life Sciences markets
• Accretive deal, has had a de-levering effect
• Rapid, successful integration results in ~25% growth in 2020
• Differentiates KORE wrt carriers and other pure-play
providers
• Date Acquired: Nov 2019
STRICTLY PRIVATE AND CONFIDENTIAL
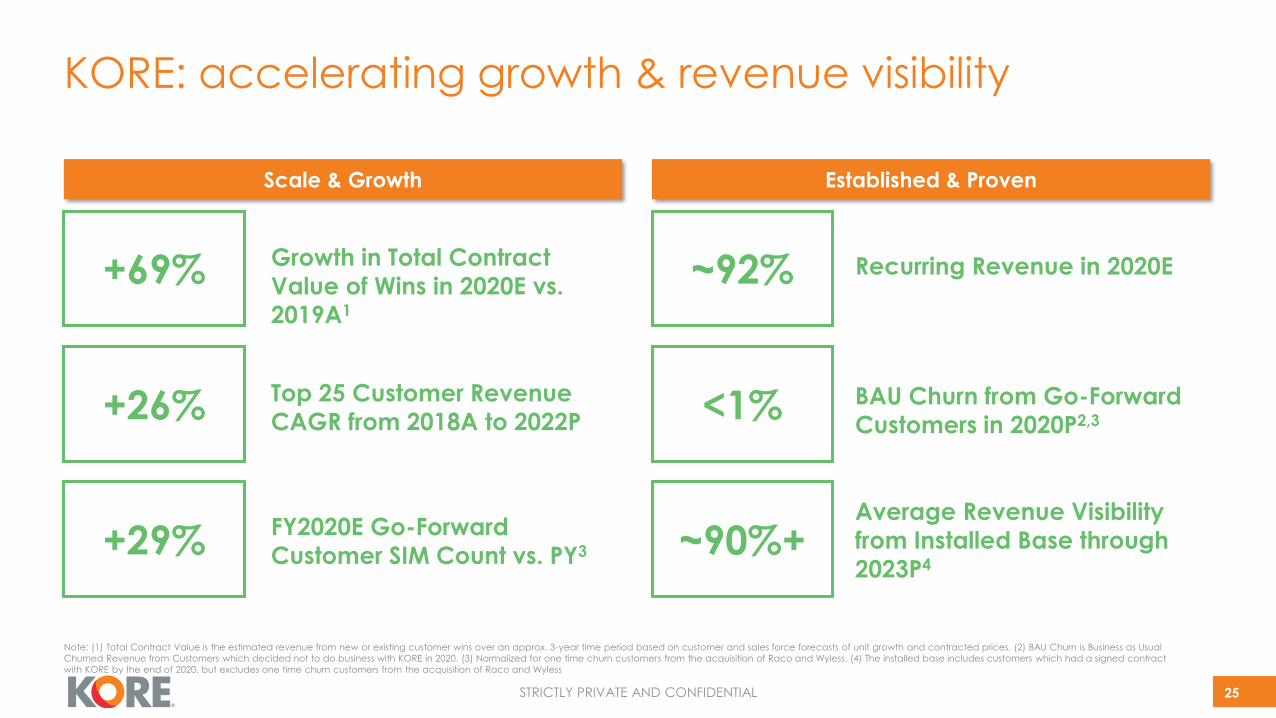
KORE: accelerating growth & revenue visibility 25
Scale & Growth
Growth in Total Contract
Value of Wins in 2020E vs.
2019A1
+69%
Scale & Growth Established & Proven
Top 25 Customer Revenue
CAGR from 2018A to 2022P+26%
Recurring Revenue in 2020E~92%
FY2020E Go-Forward
Customer SIM Count vs. PY3+29%Average Revenue Visibility
from Installed Base through
2023P4~90%+
25
<1% BAU Churn from Go-Forward
Customers in 2020P2,3
Note: (1) Total Contract Value is the estimated revenue from new or existing customer wins over an approx. 3-year time period based on customer and sales force forecasts of unit growth and contracted prices. (2) BAU Churn is Business as Usual
Churned Revenue from Customers which decided not to do business with KORE in 2020. (3) Normalized for one time churn customers from the acquisition of Raco and Wyless. (4) The installed base includes customers which had a signed contract
with KORE by the end of 2020, but excludes one time churn customers from the acquisition of Raco and Wyless
STRICTLY PRIVATE AND CONFIDENTIAL
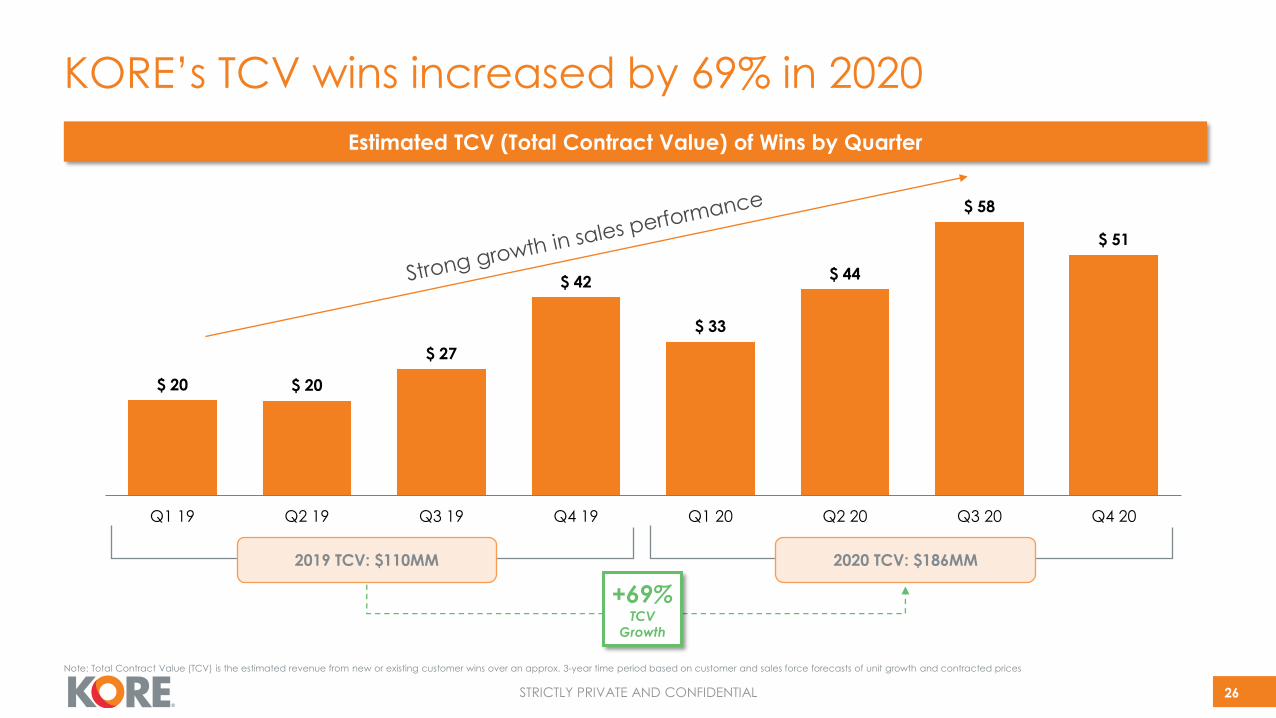
$ 20 $ 20
$ 27
$ 42
$ 33
$ 44
$ 58
$ 51
Q1 19 Q2 19 Q3 19 Q4 19 Q1 20 Q2 20 Q3 20 Q4 20
KORE’s TCV wins increased by 69% in 2020
26
2019 TCV: $110MM 2020 TCV: $186MM
+69%TCV
Growth
Estimated TCV (Total Contract Value) of Wins by Quarter
Note: Total Contract Value (TCV) is the estimated revenue from new or existing customer wins over an approx. 3-year time period based on customer and sales force forecasts of unit growth and contracted prices
STRICTLY PRIVATE AND CONFIDENTIAL
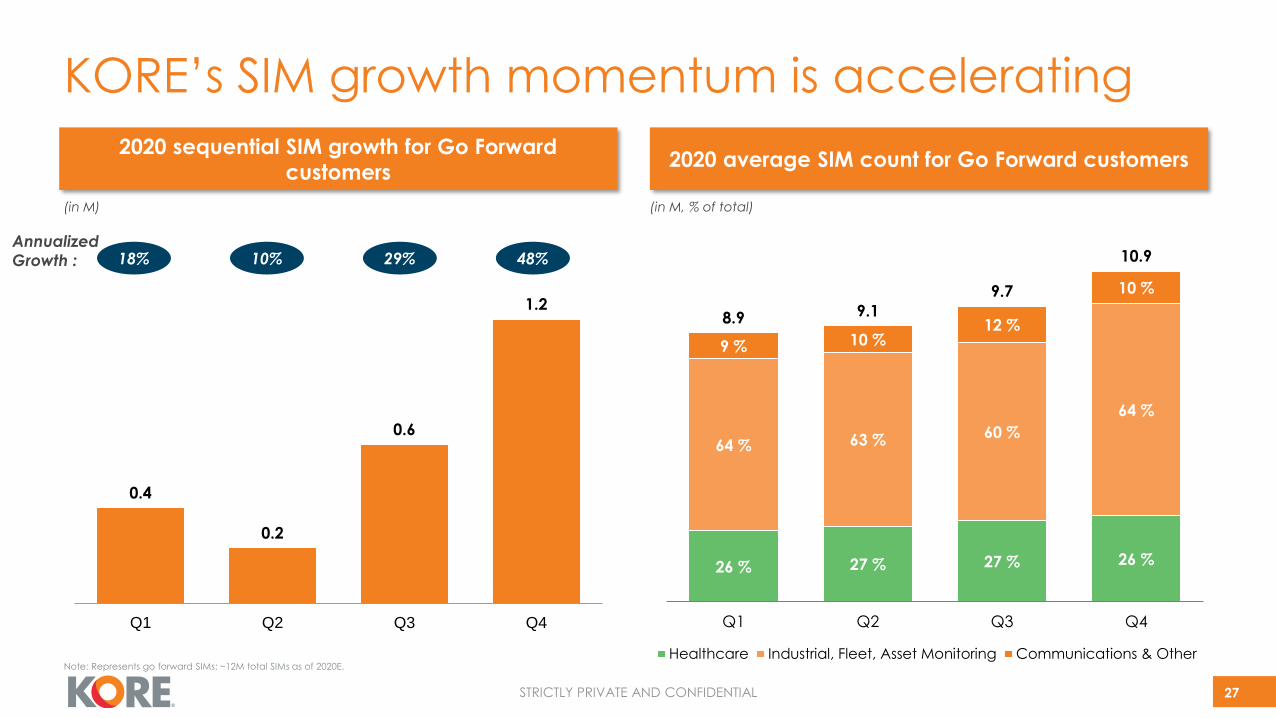
KORE’s SIM growth momentum is accelerating
27
2020 sequential SIM growth for Go Forward
customers
(in M)
2020 average SIM count for Go Forward customers
(in M, % of total)
18% 48%10% 29%Annualized
Growth :
Note: Represents go forward SIMs; ~12M total SIMs as of 2020E.
0.4
0.2
0.6
1.2
Q1 Q2 Q3 Q4
26 % 27 % 27 % 26 %
64 % 63 % 60 %
64 %
9 % 10 % 12 %
10 %
8.9 9.1
9.7
10.9
Q1 Q2 Q3 Q4
Healthcare Industrial, Fleet, Asset Monitoring Communications & Other

Financial Overview

STRICTLY PRIVATE AND CONFIDENTIAL
Historicals Prelim. Forecast CAGR
(US$ in millions) 2019A 2020P 2021P 2022P 2023P 2024P 2025P '21P-'25P
CaaS $ 125 $ 137 $ 144 $ 163 $ 187 $ 213 $ 246 14 %
% Growth 9 % 9 % 5 % 13 % 15 % 14 % 15 %
IoT Solutions 47 55 59 70 89 120 168 30 %
% Growth 20 % 16 % 8 % 17 % 28 % 35 % 40 %
One Time Churn 33 22 15 5 - - - -
Total Revenue $ 206 $ 214 $ 219 $ 238 $ 276 $ 333 $ 414 17 %
% Total Growth 3 % 4 % 2 % 9 % 16 % 21 % 24 %
(-) COGS (82) (98) (94) (102) (117) (140) (172)
Total Gross Profit $ 123 $ 116 $ 125 $ 136 $ 158 $ 193 $ 242 18 %
% Gross Margin 60 % 54 % 57 % 57 % 57 % 58 % 58 %
(-) SG&A1 (66) (59) (65) (69) (77) (86) (101)
Adj. EBITDA $ 57 $ 57 $ 60 $ 67 $ 82 $ 107 $ 140 24 %
% Adj. EBITDA Margin 28 % 26 % 27 % 28 % 30 % 32 % 34 %
Total Capex (12) (12) (12) (13) (13)
Unlevered FCF2 $ 32 $ 42 $ 60 $ 91 $ 123
Cum. FCF 32 75 135 226 349
Pro forma financial summary
29
Note: Financials represent KORE’s projections through 2025E developed for the purposes of this presentation. 2020 results are preliminary and unaudited, refer to disclaimer for prior periods. Historicals are pro forma adjusted for the impact of the Integron
and Aspider acquisitions. (1) Assumes $1.5mm of public company costs. (2) Unlevered FCF defined as Adj. EBITDA less total capex, less cash adjustments, less increases in NWC; refer to page 42 for a reconciliation of Reported to Adj. EBITDA. (3) 2021E and
2022E Adjusted Total Revenue growth of 13.9% and 15.1%, respectively, excluding the normalization of one time churn customers from the acquisition of Raco and Wyless and adjusting for the known one time impact of 2G/3G sunsetting as KORE
transitions customers to LTE/5G networks ($17.3mm and $21.7mm in 2021E and 2022E, respectively)
3 3
STRICTLY PRIVATE AND CONFIDENTIAL
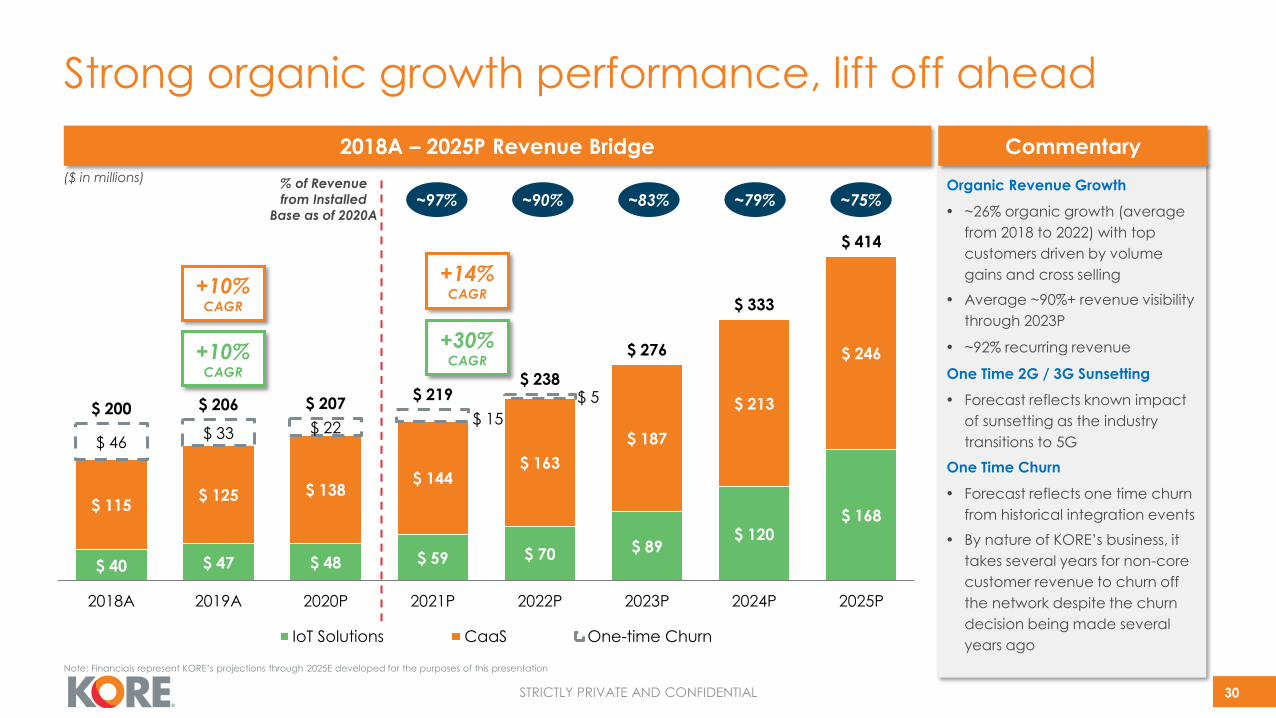
$ 40 $ 47 $ 48 $ 59 $ 70 $ 89 $ 120
$ 168 $ 115
$ 125 $ 138 $ 144
$ 163
$ 187
$ 213
$ 246
$ 46 $ 33 $ 22
$ 15
$ 5 $ 200 $ 206 $ 207
$ 219 $ 238
$ 276
$ 333
$ 414
2018A 2019A 2020P 2021P 2022P 2023P 2024P 2025P
IoT Solutions CaaS One-time Churn
Strong organic growth performance, lift off ahead
2018A – 2025P Revenue Bridge
($ in millions)Organic Revenue Growth
• ~26% organic growth (average
from 2018 to 2022) with top
customers driven by volume
gains and cross selling
• Average ~90%+ revenue visibility
through 2023P
• ~92% recurring revenue
One Time 2G / 3G Sunsetting
• Forecast reflects known impact
of sunsetting as the industry
transitions to 5G
One Time Churn
• Forecast reflects one time churn
from historical integration events
• By nature of KORE’s business, it
takes several years for non-core
customer revenue to churn off
the network despite the churn
decision being made several
years ago
Commentary
+10% CAGR
+10% CAGR
+14% CAGR
+30% CAGR
~90% ~83% ~79% ~75%~97%% of Revenue
from Installed
Base as of 2020A
Note: Financials represent KORE’s projections through 2025E developed for the purposes of this presentation
30
STRICTLY PRIVATE AND CONFIDENTIAL
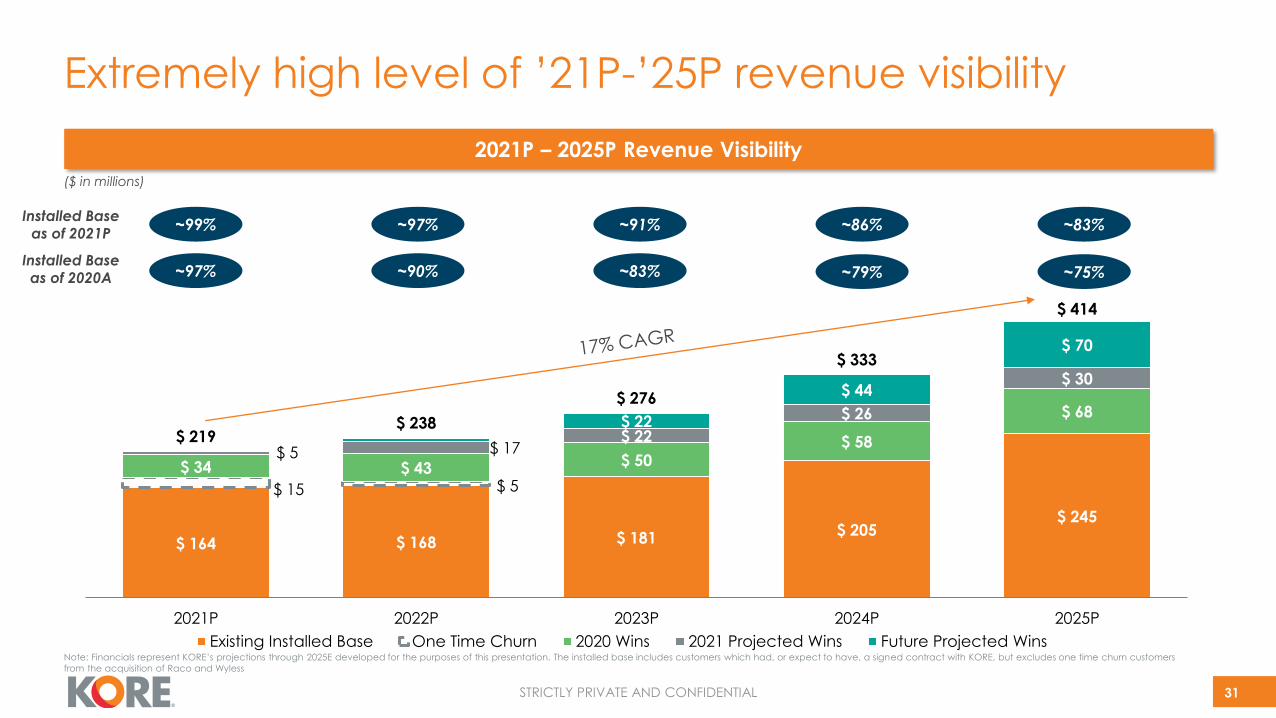
~90% ~83% ~79% ~75%~97%
2021P – 2025P Revenue Visibility
Extremely high level of ’21P-’25P revenue visibility
Installed Base as of 2020A
($ in millions)
~97% ~91% ~86% ~83%~99%Installed Base
as of 2021P
31
Note: Financials represent KORE’s projections through 2025E developed for the purposes of this presentation. The installed base includes customers which had, or expect to have, a signed contract with KORE, but excludes one time churn customers
from the acquisition of Raco and Wyless
$ 164 $ 168 $ 181 $ 205
$ 245
$ 15 $ 5 $ 34 $ 43
$ 50 $ 58
$ 68
$ 5 $ 17 $ 22
$ 26
$ 30
$ 22
$ 44
$ 70
$ 219 $ 238
$ 276
$ 333
$ 414
2021P 2022P 2023P 2024P 2025P
Existing Installed Base One Time Churn 2020 Wins 2021 Projected Wins Future Projected Wins
STRICTLY PRIVATE AND CONFIDENTIAL
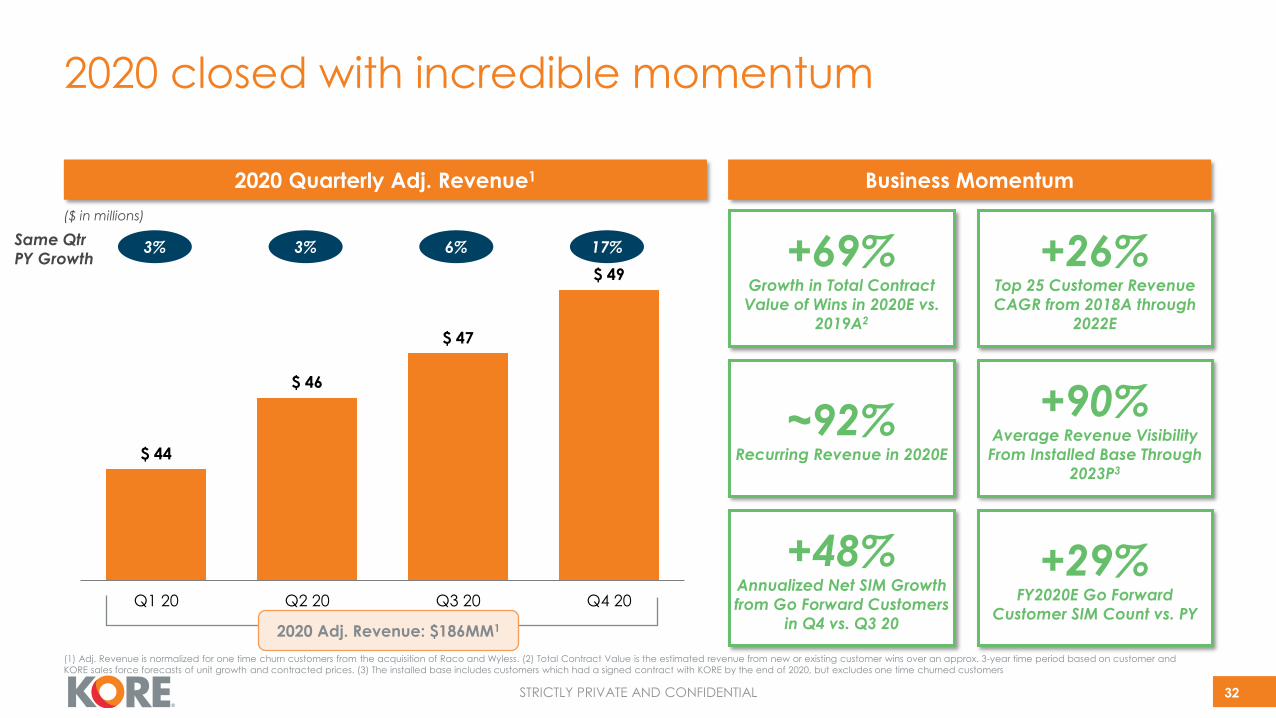
2020 closed with incredible momentum
32
2020 Quarterly Adj. Revenue1
($ in millions)
a2020 Adj. Revenue: $186MM1
Business Momentum
+69%Growth in Total Contract
Value of Wins in 2020E vs.
2019A2
+26%Top 25 Customer Revenue
CAGR from 2018A through
2022E
~92%Recurring Revenue in 2020E
+90%Average Revenue Visibility
From Installed Base Through
2023P3
3% 17%3% 6%Same Qtr
PY Growth
+48%Annualized Net SIM Growth
from Go Forward Customers
in Q4 vs. Q3 20
+29%FY2020E Go Forward
Customer SIM Count vs. PY
$ 44
$ 46
$ 47
$ 49
Q1 20 Q2 20 Q3 20 Q4 20
(1) Adj. Revenue is normalized for one time churn customers from the acquisition of Raco and Wyless. (2) Total Contract Value is the estimated revenue from new or existing customer wins over an approx. 3-year time period based on customer and
KORE sales force forecasts of unit growth and contracted prices. (3) The installed base includes customers which had a signed contract with KORE by the end of 2020, but excludes one time churned customers

Benchmarking
STRICTLY PRIVATE AND CONFIDENTIAL
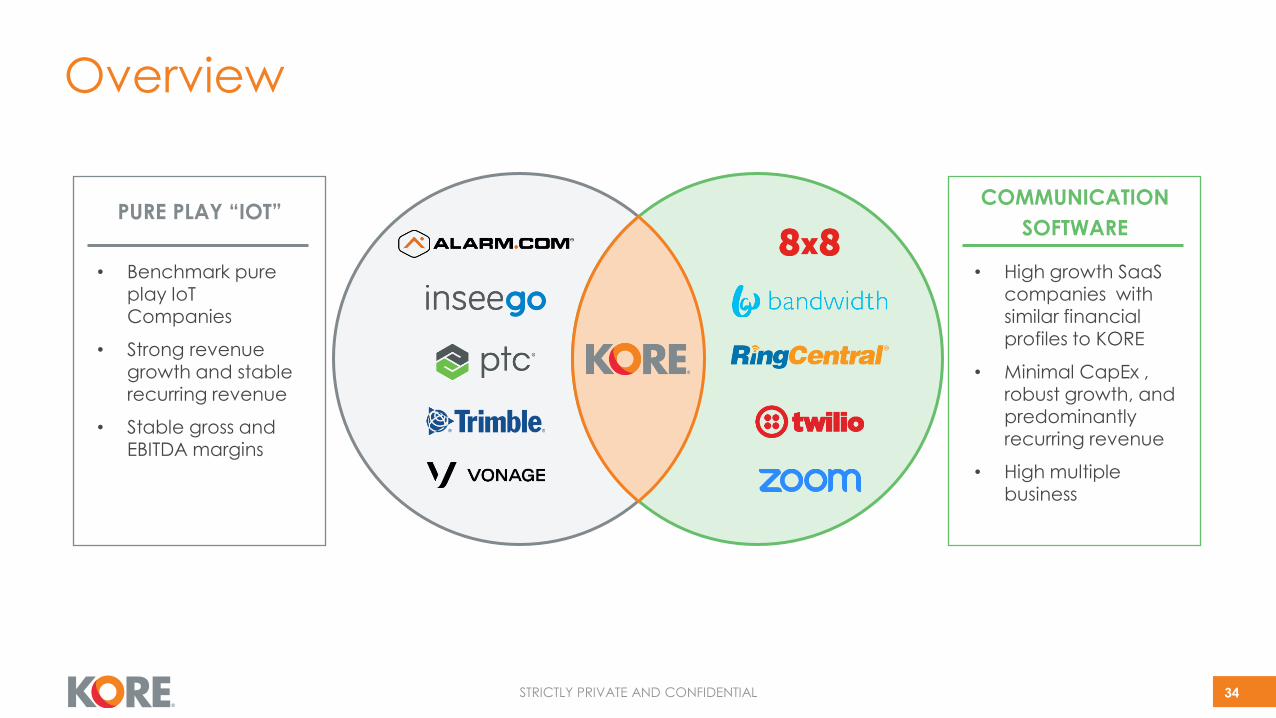
Overview
34
PURE PLAY “IOT”COMMUNICATION
SOFTWARE
• Benchmark pure play IoT Companies
• Strong revenue growth and stable recurring revenue
• Stable gross and EBITDA margins
• High growth SaaS companies with similar financial profiles to KORE
• Minimal CapEx , robust growth, and predominantly recurring revenue
• High multiple business
STRICTLY PRIVATE AND CONFIDENTIAL
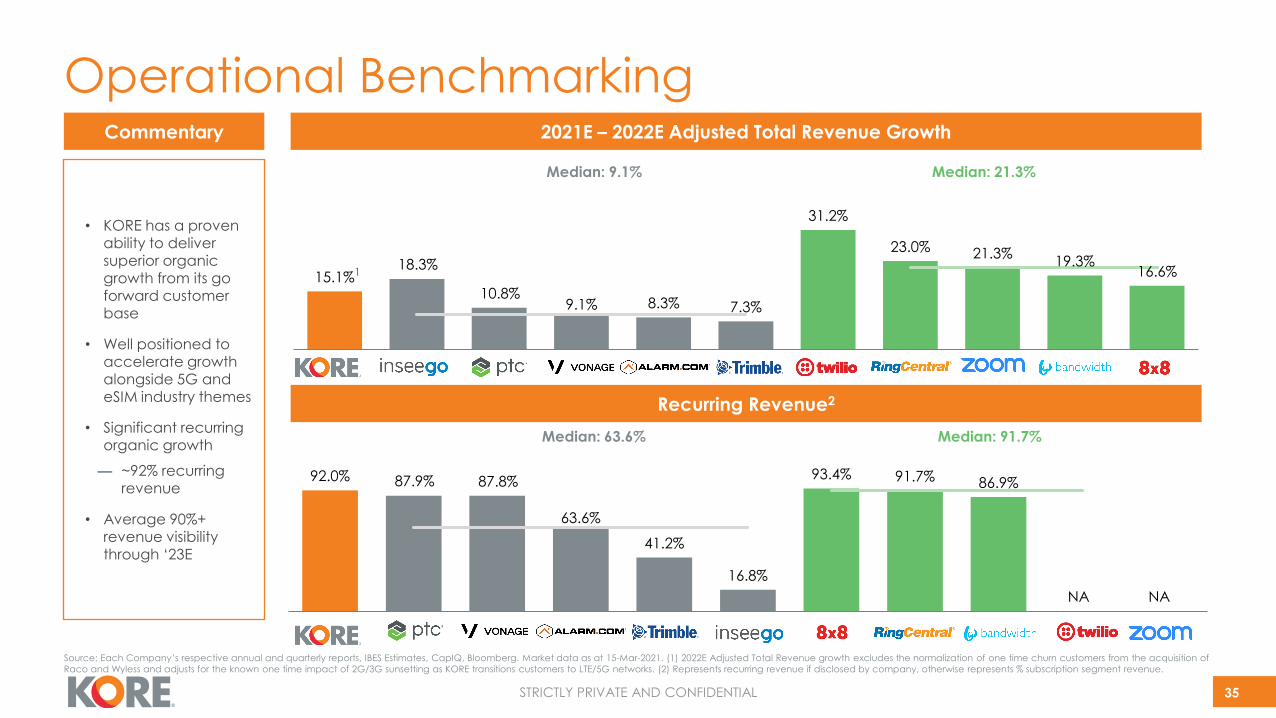
92.0% 87.9% 87.8%
63.6%
41.2%
16.8%
93.4% 91.7% 86.9%
King PTC VG ALRM TRMB INSG EGHT RNG BAND ZM TWLO
Median: 63.6% Median: 91.7%
NANA
15.1%18.3%
10.8%9.1% 8.3% 7.3%
31.2%
23.0% 21.3%19.3%
16.6%
King INSG PTC VG ALRM TRMB TWLO RNG ZM BAND EGHT
Median: 9.1% Median: 21.3%
Operational Benchmarking
35
Recurring Revenue2
2021E – 2022E Adjusted Total Revenue Growth
• KORE has a proven ability to deliver superior organic growth from its go forward customer base
• Well positioned to accelerate growth alongside 5G and eSIM industry themes
• Significant recurring organic growth
— ~92% recurring revenue
• Average 90%+ revenue visibility through ‘23E
Commentary
1
Source: Each Company’s respective annual and quarterly reports, IBES Estimates, CapIQ, Bloomberg. Market data as at 15-Mar-2021. (1) 2022E Adjusted Total Revenue growth excludes the normalization of one time churn customers from the acquisition of
Raco and Wyless and adjusts for the known one time impact of 2G/3G sunsetting as KORE transitions customers to LTE/5G networks. (2) Represents recurring revenue if disclosed by company, otherwise represents % subscription segment revenue.
STRICTLY PRIVATE AND CONFIDENTIAL
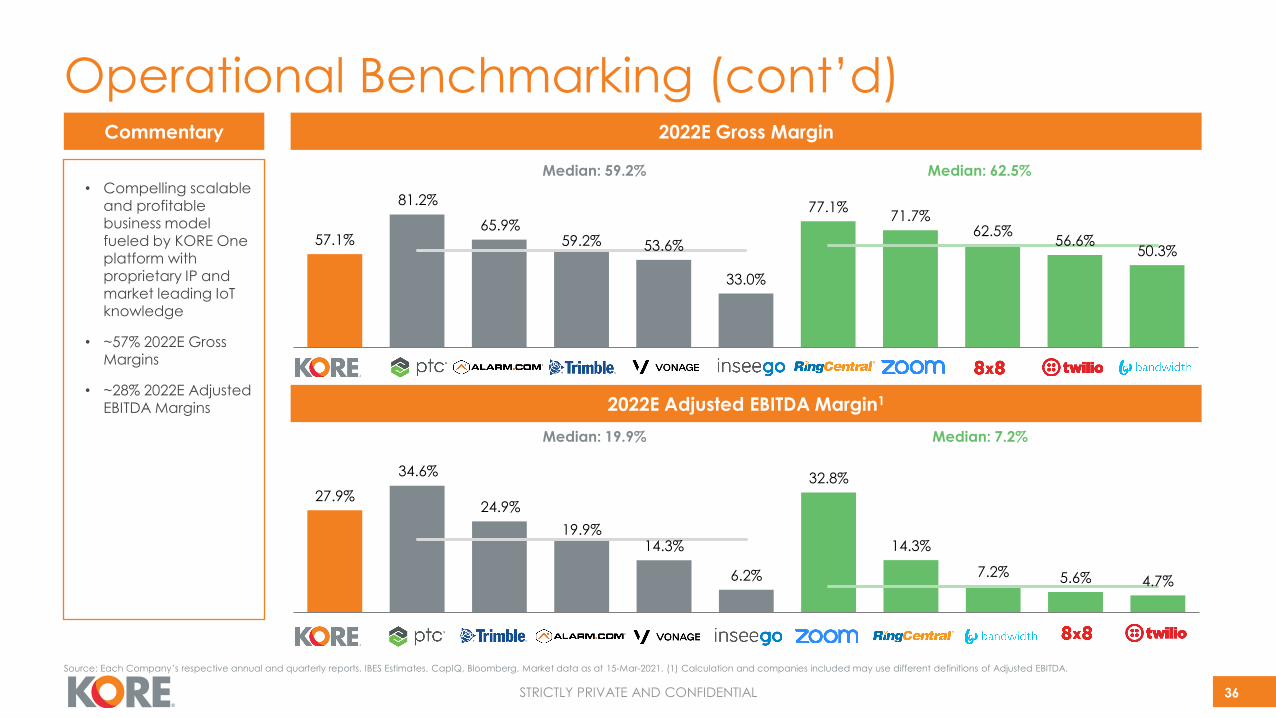
27.9%
34.6%
24.9%
19.9%14.3%
6.2%
32.8%
14.3%
7.2% 5.6% 4.7%
King PTC TRMB ALRM VG INSG ZM RNG BAND EGHT TWLO
Median: 19.9% Median: 7.2%
57.1%
81.2%
65.9%59.2% 53.6%
33.0%
77.1%71.7%
62.5%56.6%
50.3%
King PTC ALRM TRMB VG INSG RNG ZM EGHT TWLO BAND
Median: 59.2% Median: 62.5%
Operational Benchmarking (cont’d)
36
2022E Adjusted EBITDA Margin1
2022E Gross MarginCommentary
• Compelling scalable and profitable business model
fueled by KORE One platform with proprietary IP and market leading IoT knowledge
• ~57% 2022E Gross Margins
• ~28% 2022E Adjusted
EBITDA Margins
Source: Each Company’s respective annual and quarterly reports, IBES Estimates, CapIQ, Bloomberg. Market data as at 15-Mar-2021. (1) Calculation and companies included may use different definitions of Adjusted EBITDA.

STRICTLY PRIVATE AND CONFIDENTIAL
2.0x
8.0x
2.7x 1.6x 1.2x
(1.1)x
5.2x 5.0x
(1.7)xKORE INSG VG TRMB PTC ALRM BAND RNG ZM TWLO EGHT
Median: 1.6x Median: 5.0x
NM NM
15.2x
64.5x
31.5x24.6x 23.0x 17.9x
NMNM NM NM NM
KING INSG ALRM PTC TRMB VG TWLO EGHT BAND RNG ZM
Median: 24.6x
4.3x8.5x
6.3x 5.7x 4.0x 2.5x
22.0x18.9x 17.5x
6.2x 6.2x
KORE PTC ALRM TRMB INSG VG ZM TWLO RNG EGHT BAND
Median: 5.7x Median: 17.5x
Valuation Benchmarking
37
EV / 2022E Adjusted EBITDA2
EV / 2022E Revenue
Net Debt / 2020E Adjusted EBITDA2
• This Transaction provides an attractive entry
point…deal valuation at significant discount to benchmarks
— Multiple strategic ways to perform
— Numerous upsides not included
• KORE has a successful track record of executing and integrating strategic acquisitions
• Active pipeline of future acquisition candidates
Commentary
Source: Each Company’s respective annual and quarterly reports, IBES Estimates, CapIQ, Bloomberg. Market data as at 15-Mar-2021 (1) Represents illustrative values pro forma for this transaction. (2) Not meaningful due to negative EBITDA.
(2) Calculation and companies included may use different definitions of Adjusted EBITDA; represents net debt of latest financial statement.
1
1
12

Appendix
STRICTLY PRIVATE AND CONFIDENTIAL
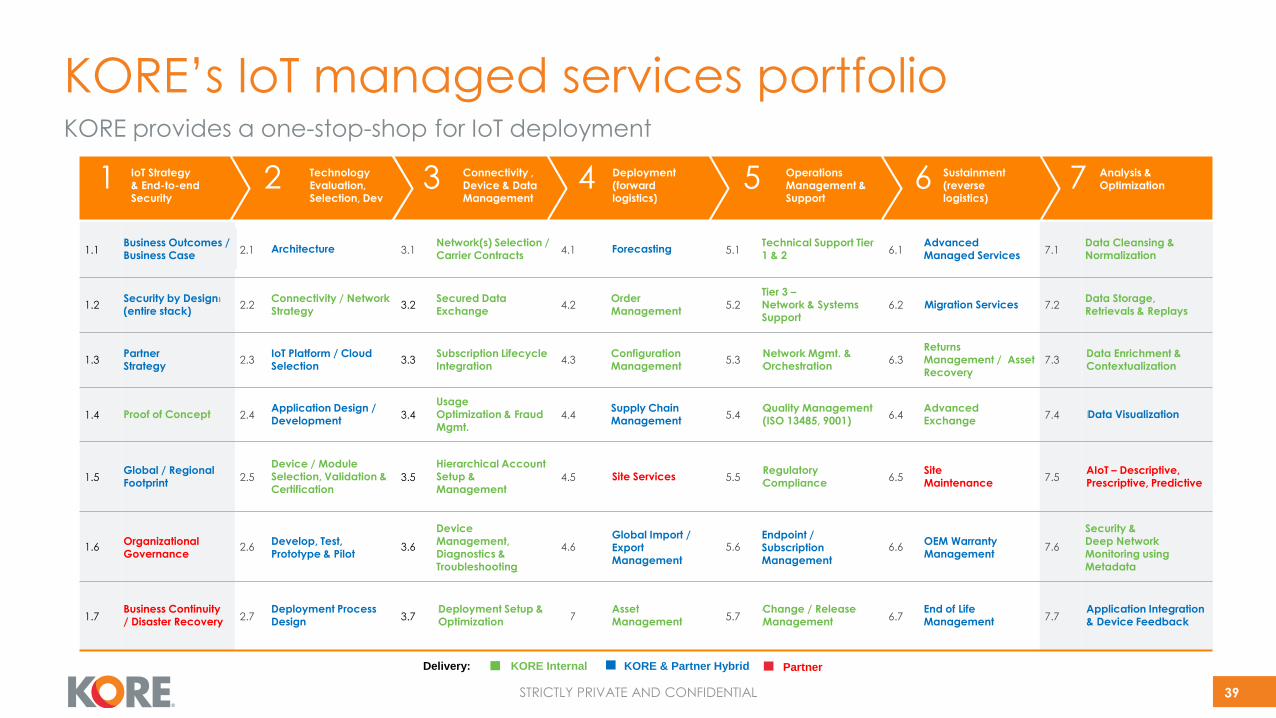
KORE’s IoT managed services portfolio
39
KORE provides a one-stop-shop for IoT deployment
Delivery: KORE Internal KORE & Partner Hybrid Partner
1.1Business Outcomes / Business Case
2.1 Architecture 3.1Network(s) Selection / Carrier Contracts
4.1 Forecasting 5.1Technical Support Tier 1 & 2
6.1Advanced Managed Services
7.1Data Cleansing & Normalization
1.2Security by Design(entire stack)
2.2Connectivity / Network Strategy
3.2Secured Data Exchange
4.2Order Management
5.2
Tier 3 –
Network & Systems Support
6.2 Migration Services 7.2Data Storage, Retrievals & Replays
1.3Partner
Strategy2.3
IoT Platform / Cloud
Selection3.3
Subscription Lifecycle
Integration4.3
Configuration
Management5.3
Network Mgmt. &
Orchestration6.3
Returns Management / Asset Recovery
7.3Data Enrichment &
Contextualization
1.4 Proof of Concept 2.4Application Design / Development
3.4UsageOptimization & Fraud Mgmt.
4.4Supply Chain Management
5.4Quality Management(ISO 13485, 9001)
6.4Advanced Exchange
7.4 Data Visualization
1.5Global / Regional Footprint
2.5Device / Module Selection, Validation & Certification
3.5Hierarchical Account Setup & Management
4.5 Site Services 5.5RegulatoryCompliance
6.5Site Maintenance
7.5AIoT – Descriptive, Prescriptive, Predictive
1.6Organizational Governance
2.6Develop, Test, Prototype & Pilot
3.6
Device Management, Diagnostics & Troubleshooting
4.6Global Import / Export Management
5.6Endpoint / Subscription Management
6.6OEM Warranty Management
7.6
Security & Deep Network Monitoring using Metadata
1.7Business Continuity / Disaster Recovery
2.7Deployment Process Design
3.7Deployment Setup & Optimization
4.7Asset Management
5.7Change / Release Management
6.7End of Life Management
7.7Application Integration & Device Feedback
1 3 4 5 6 72IoT Strategy & End-to-end Security
Technology Evaluation, Selection, Dev
Connectivity ,Device & DataManagement
Deployment (forward logistics)
Operations Management & Support
Sustainment(reverse logistics)
Analysis & Optimization
Business Outcomes / Business Case
OrganizationalGovernance
Site Maintenance
Site ServicesAIoT – Descriptive, Prescriptive, Predictive
Connectivity / Network Strategy
IoT Platform / Cloud Selection
Application Design / Development
Architecture
Develop, Test, Prototype & Pilot
Deployment Process Design
Device / Module Selection, Validation & Certification
Network(s) Selection / Carrier Contracts
Secured Data Exchange
Subscription Lifecycle Integration
UsageOptimization & Fraud Mgmt.
Hierarchical Account Setup & Management
Device Management, Diagnostics & Troubleshooting
Deployment Setup & Optimization
Forecasting
OrderManagement
Global Import / Export Management
Partner Strategy
Proof of Concept
Global / RegionalFootprint
Business Continuity / Disaster Recovery
ConfigurationManagement
Supply ChainManagement
AssetManagement
Change / ReleaseManagement
Network Mgmt. & Orchestration
Technical Support Tier 1 & 2
Tier 3 –Network & Systems Support
Quality Management(ISO 13485, 9001)
RegulatoryCompliance
Endpoint / Subscription Management
Advanced Managed Services
Migration Services
AdvancedExchange
Returns Management / Asset Recovery
OEM Warranty Management
End of Life Management
Data Cleansing & Normalization
Data Storage, Retrievals & Replays
Data Enrichment & Contextualization
Data Visualization
Security & Deep Network Monitoring using Metadata
Application Integration & Device Feedback
Security by Design (entire stack)
STRICTLY PRIVATE AND CONFIDENTIAL
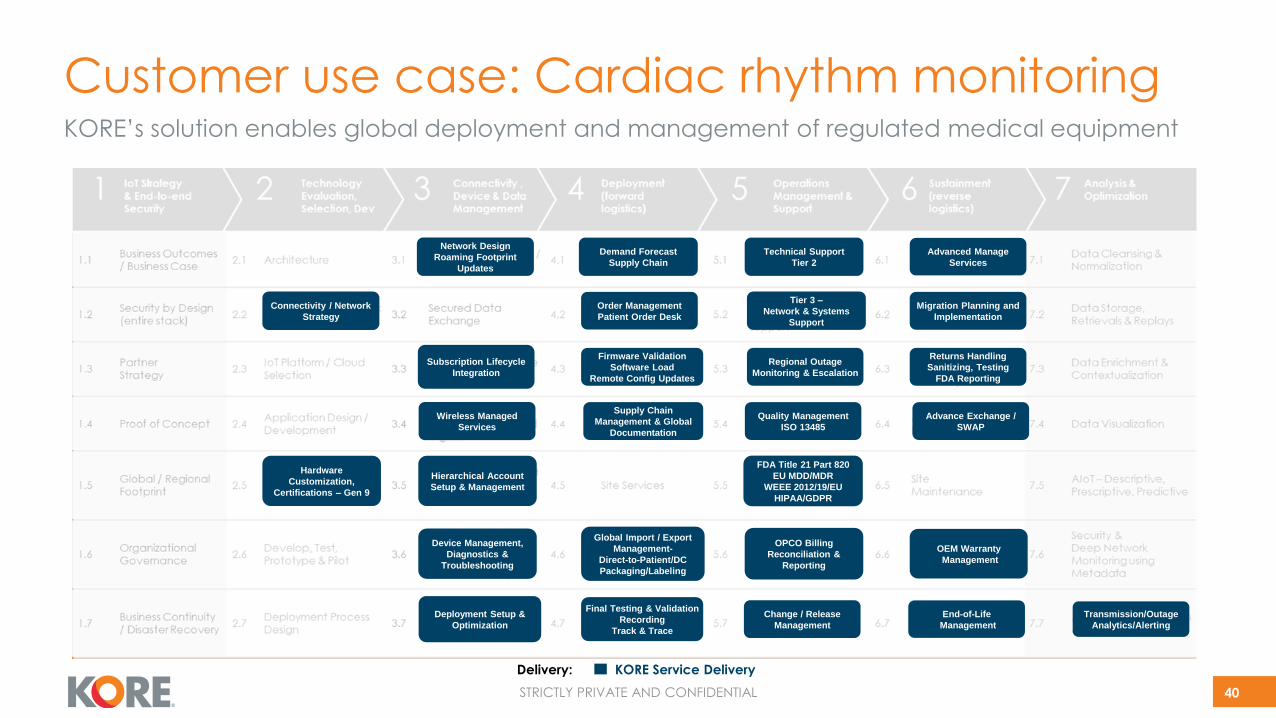
Customer use case: Cardiac rhythm monitoring
KORE Service DeliveryDelivery:
40
Hardware
Customization,
Certifications – Gen 9
Demand Forecast
Supply Chain
Deployment Setup &
Optimization
Subscription Lifecycle
Integration
Network Design
Roaming Footprint
Updates
Wireless Managed
Services
OPCO Billing
Reconciliation &
Reporting
Transmission/Outage
Analytics/Alerting
Firmware Validation
Software Load
Remote Config Updates
Advanced Manage
Services
FDA Title 21 Part 820
EU MDD/MDR
WEEE 2012/19/EU
HIPAA/GDPR
Quality Management
ISO 13485
Returns Handling
Sanitizing, Testing
FDA Reporting
Final Testing & Validation
Recording
Track & Trace
Global Import / Export
Management-
Direct-to-Patient/DC
Packaging/Labeling
Hierarchical Account
Setup & Management
Device Management,
Diagnostics &
Troubleshooting
Order Management
Patient Order Desk
Supply Chain
Management & Global
Documentation
Technical Support
Tier 2
Tier 3 –
Network & Systems
Support
Regional Outage
Monitoring & Escalation
Change / Release
Management
Advance Exchange /
SWAP
Migration Planning and
Implementation
OEM Warranty
Management
End-of-Life
Management
Connectivity / Network
Strategy
KORE’s solution enables global deployment and management of regulated medical equipment
STRICTLY PRIVATE AND CONFIDENTIAL
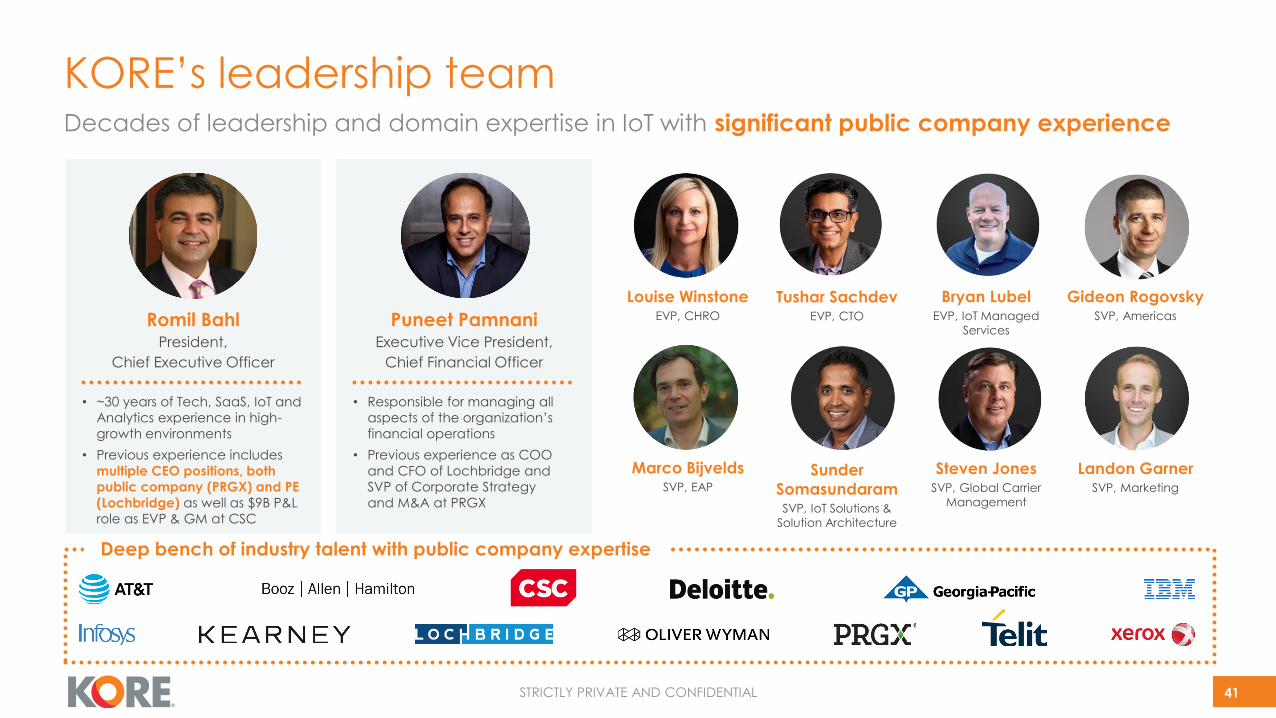
KORE’s leadership teamDecades of leadership and domain expertise in IoT with significant public company experience
Romil BahlPresident,
Chief Executive Officer
Puneet PamnaniExecutive Vice President,
Chief Financial Officer
41
Gideon RogovskySVP, Americas
Marco BijveldsSVP, EAP
Sunder
SomasundaramSVP, IoT Solutions &
Solution Architecture
Louise WinstoneEVP, CHRO
Landon GarnerSVP, Marketing
Bryan LubelEVP, IoT Managed
Services
Steven JonesSVP, Global Carrier
Management
Tushar SachdevEVP, CTO
Deep bench of industry talent with public company expertise
• ~30 years of Tech, SaaS, IoT and
Analytics experience in high-
growth environments
• Previous experience includes
multiple CEO positions, both
public company (PRGX) and PE
(Lochbridge) as well as $9B P&L
role as EVP & GM at CSC
• Responsible for managing all
aspects of the organization’s
financial operations
• Previous experience as COO
and CFO of Lochbridge and
SVP of Corporate Strategy
and M&A at PRGX
STRICTLY PRIVATE AND CONFIDENTIAL
• Founded in 1989, Abry Partners (“Abry”) is a sector-
focused private equity firm investing primarily in
media, communications, software, and business
and information services companies
• Completed over $82bn of investments involving
over 550 properties
• >55 investment professionals based in Boston, MA,
investing globally
• Raised over $18bn of equity capital through 19
investment funds
• Actively managing over $5.0 billion of capital
• Abry’s longstanding relationships with limited
partners include Fortune 100 pension funds, leading
university endowments, major insurance
companies and prominent investment funds
Abry Partners overview
Selected Communications Investments
42
STRICTLY PRIVATE AND CONFIDENTIAL
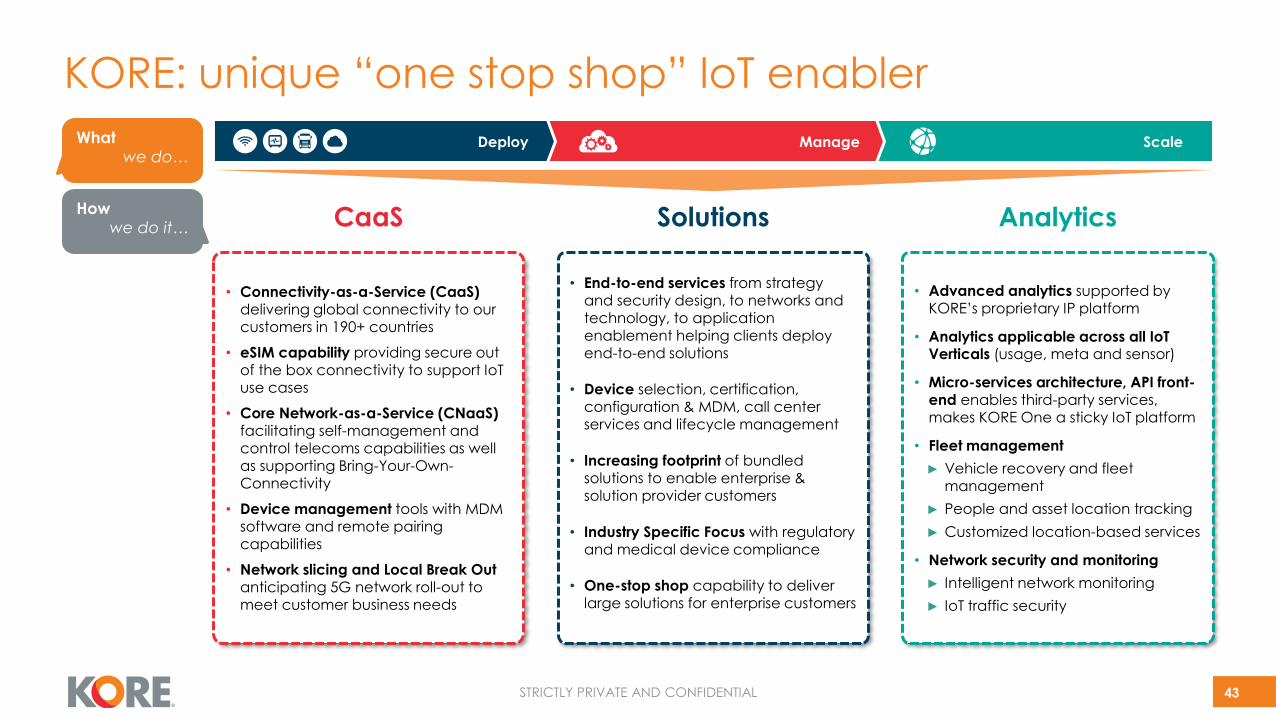
KORE: unique “one stop shop” IoT enabler
What
we do…
How
we do it… Analytics
• Advanced analytics supported by KORE’s proprietary IP platform
• Analytics applicable across all IoT Verticals (usage, meta and sensor)
• Micro-services architecture, API front-end enables third-party services, makes KORE One a sticky IoT platform
• Fleet management
► Vehicle recovery and fleet management
► People and asset location tracking
► Customized location-based services
• Network security and monitoring
► Intelligent network monitoring
► IoT traffic security
CaaS
• Connectivity-as-a-Service (CaaS) delivering global connectivity to our customers in 190+ countries
• eSIM capability providing secure out of the box connectivity to support IoT use cases
• Core Network-as-a-Service (CNaaS) facilitating self-management and control telecoms capabilities as well as supporting Bring-Your-Own-Connectivity
• Device management tools with MDM software and remote pairing capabilities
• Network slicing and Local Break Out anticipating 5G network roll-out to meet customer business needs
Solutions
• End-to-end services from strategy and security design, to networks and technology, to application enablement helping clients deploy
end-to-end solutions
• Device selection, certification, configuration & MDM, call center services and lifecycle management
• Increasing footprint of bundled solutions to enable enterprise & solution provider customers
• Industry Specific Focus with regulatory and medical device compliance
• One-stop shop capability to deliver large solutions for enterprise customers
ScaleManageDeploy
43
STRICTLY PRIVATE AND CONFIDENTIAL
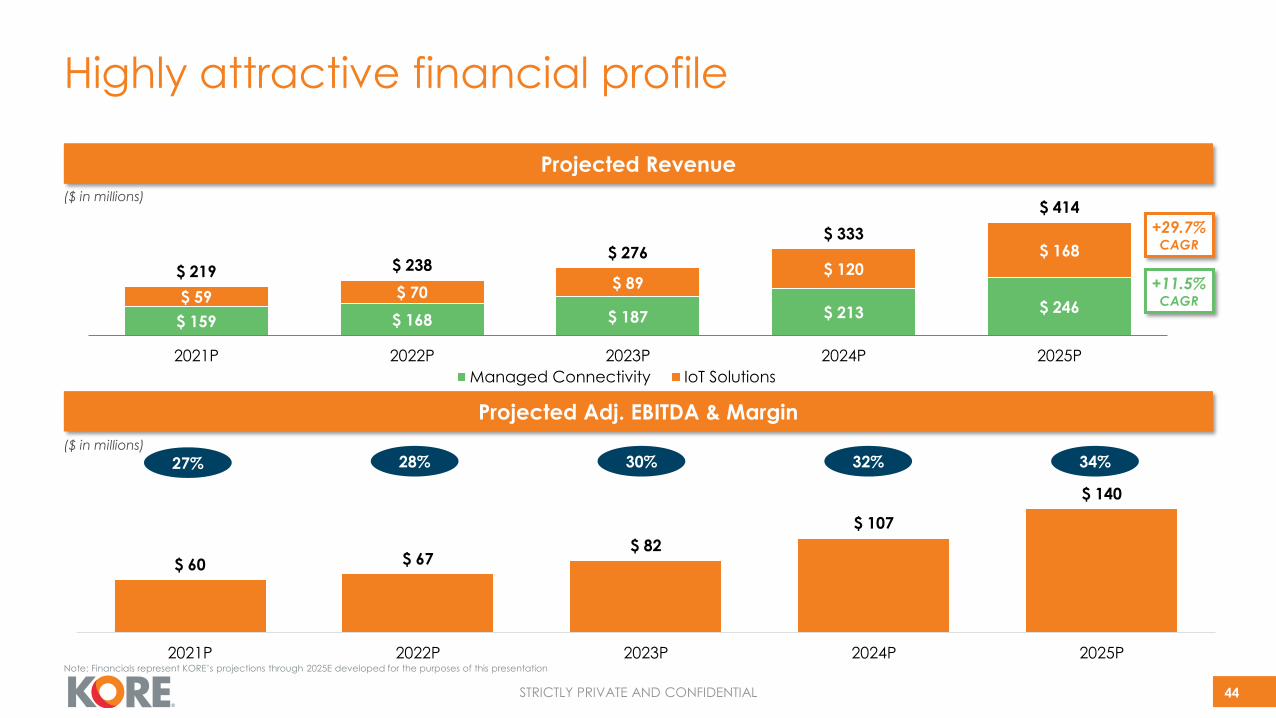
Highly attractive financial profile
Projected Revenue
Projected Adj. EBITDA & Margin
27% 32%28% 34%30%
44
($ in millions)
($ in millions)
+29.7% CAGR
+11.5% CAGR
Note: Financials represent KORE’s projections through 2025E developed for the purposes of this presentation
$ 159 $ 168 $ 187 $ 213 $ 246 $ 59 $ 70
$ 89 $ 120
$ 168
$ 219 $ 238 $ 276
$ 333
$ 414
2021P 2022P 2023P 2024P 2025P
Managed Connectivity IoT Solutions
$ 60 $ 67 $ 82
$ 107
$ 140
2021P 2022P 2023P 2024P 2025P
STRICTLY PRIVATE AND CONFIDENTIAL
$ 20 $ 33
$ 20
$ 44 $ 27
$ 58
$ 42
$ 51
$ 110
$ 186
2019 2020
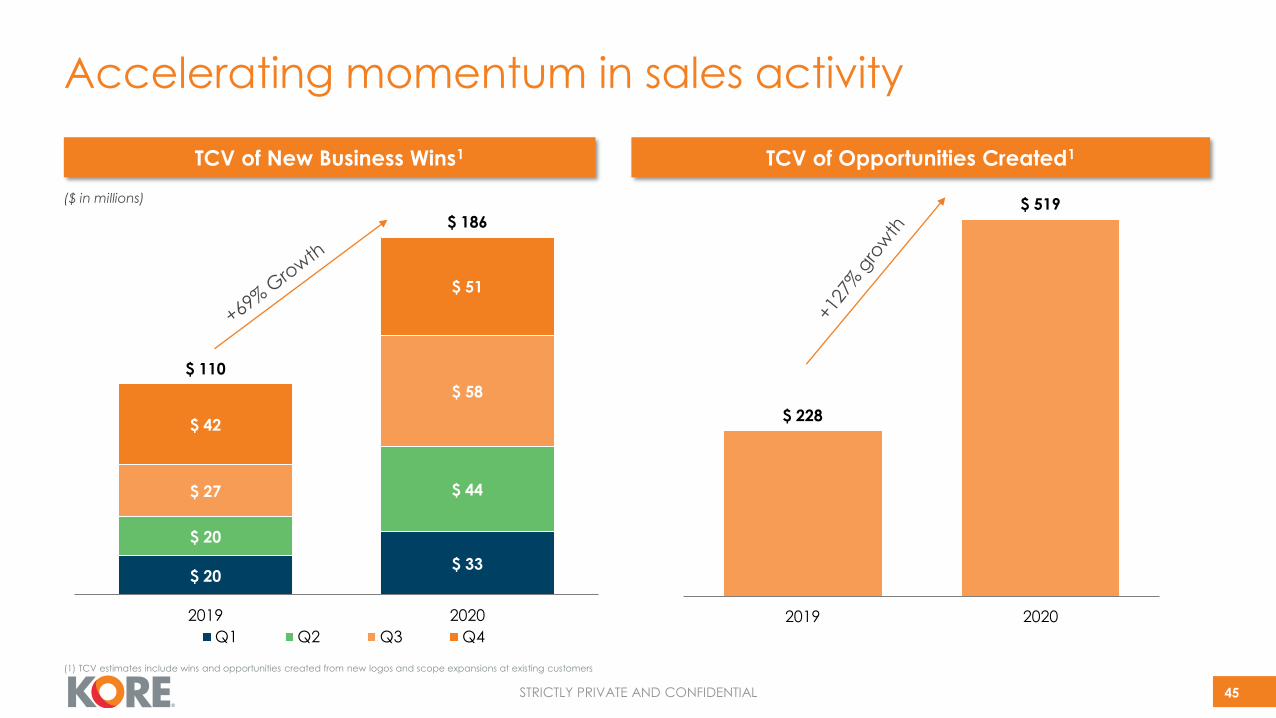
Accelerating momentum in sales activity
45
TCV of New Business Wins1
($ in millions)
TCV of Opportunities Created1
$ 20 $ 33
$ 20
$ 44 $ 27
$ 58
$ 42
$ 51
$ 109
$ 186
2019 2020
Q1 Q2 Q3 Q4
$ 228
$ 519
2019 2020
(1) TCV estimates include wins and opportunities created from new logos and scope expansions at existing customers
STRICTLY PRIVATE AND CONFIDENTIAL
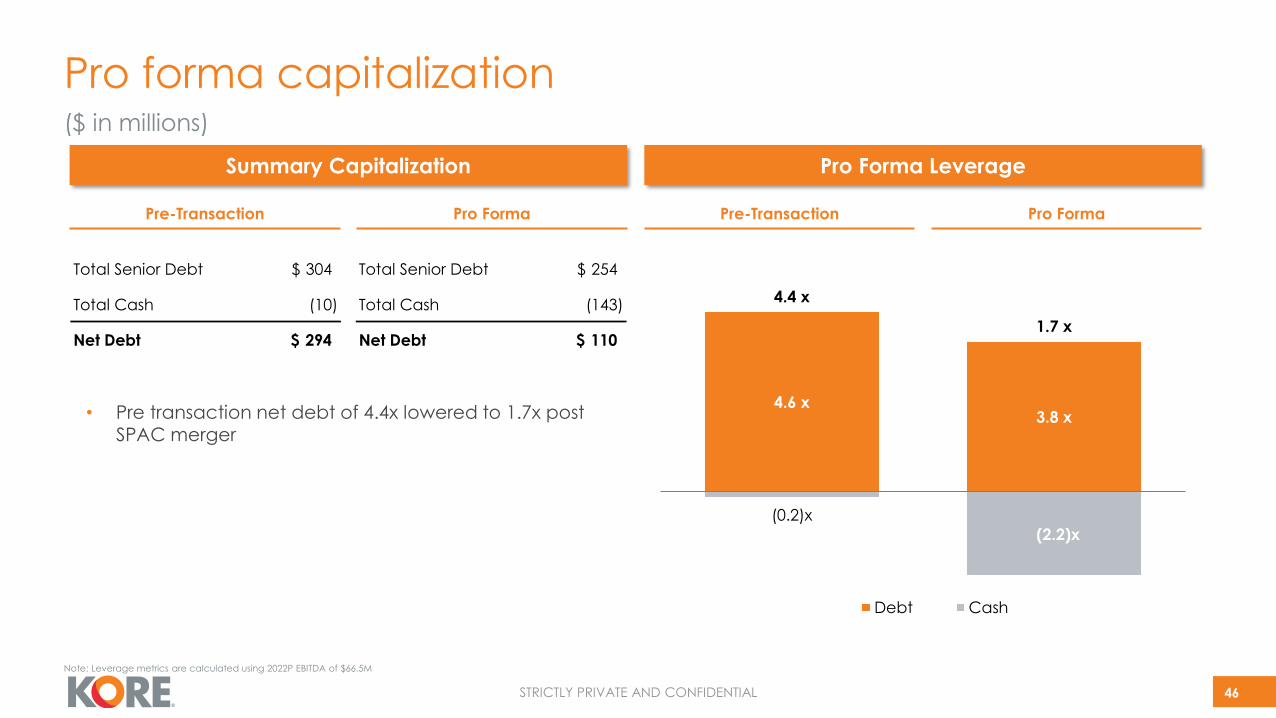
Pro forma capitalization
46
Summary Capitalization
($ in millions)
Pro Forma Leverage
Pre-Transaction Pro Forma
• Pre transaction net debt of 4.4x lowered to 1.7x post SPAC merger
Pre-Transaction Pro Forma
Note: Leverage metrics are calculated using 2022P EBITDA of $66.5M
Total Senior Debt $ 304 Total Senior Debt $ 254
Total Cash (10) Total Cash (143)
Net Debt $ 294 Net Debt $ 110
4.6 x3.8 x
(0.2)x
(2.2)x
4.4 x
1.7 x
Debt Cash
STRICTLY PRIVATE AND CONFIDENTIAL
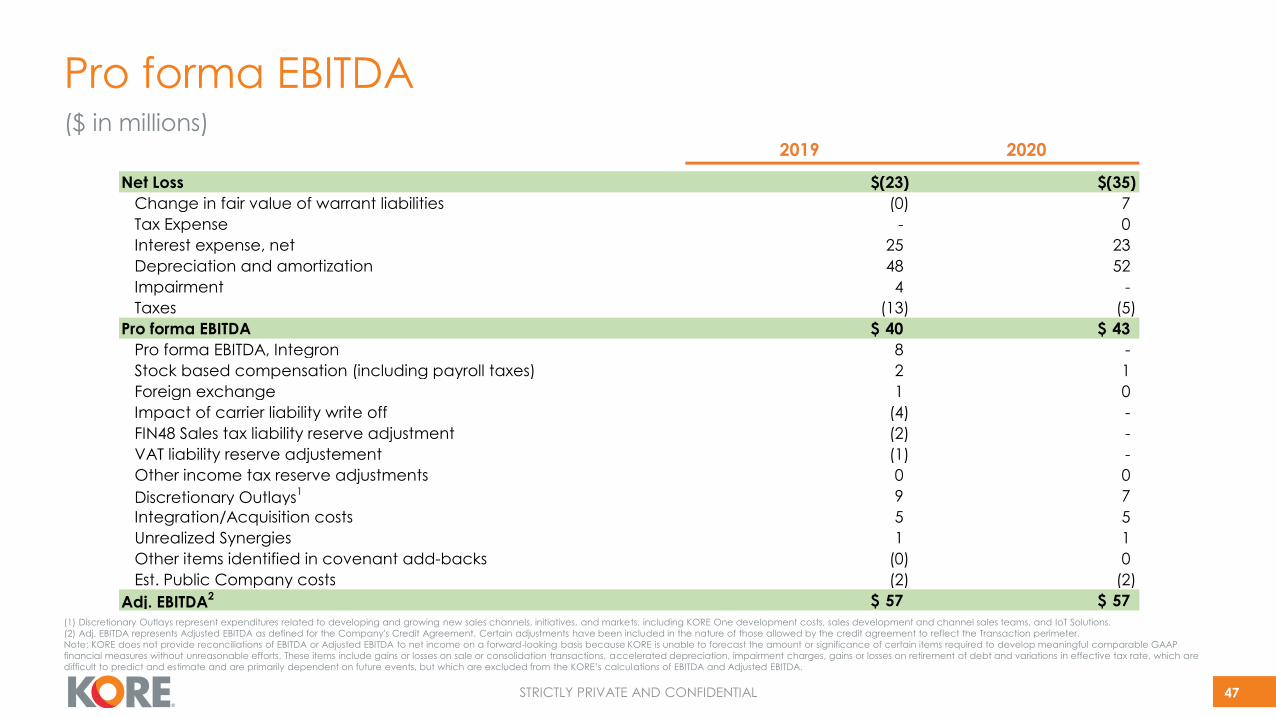
Pro forma EBITDA
47
($ in millions)
(1) Discretionary Outlays represent expenditures related to developing and growing new sales channels, initiatives, and markets, including KORE One development costs, sales development and channel sales teams, and IoT Solutions.
(2) Adj. EBITDA represents Adjusted EBITDA as defined for the Company's Credit Agreement. Certain adjustments have been included in the nature of those allowed by the credit agreement to reflect the Transaction perimeter.
Note: KORE does not provide reconciliations of EBITDA or Adjusted EBITDA to net income on a forward-looking basis because KORE is unable to forecast the amount or significance of certain items required to develop meaningful comparable GAAP
financial measures without unreasonable efforts. These items include gains or losses on sale or consolidation transactions, accelerated depreciation, impairment charges, gains or losses on retirement of debt and variations in effective tax rate, which are
difficult to predict and estimate and are primarily dependent on future events, but which are excluded from the KORE’s calculations of EBITDA and Adjusted EBITDA.
2019 2020
Net Loss $(23) $(35)
Change in fair value of warrant liabilities (0) 7
Tax Expense - 0
Interest expense, net 25 23
Depreciation and amortization 48 52
Impairment 4 -
Taxes (13) (5)
Pro forma EBITDA $ 40 $ 43
Pro forma EBITDA, Integron 8 -
Stock based compensation (including payroll taxes) 2 1
Foreign exchange 1 0
Impact of carrier liability write off (4) -
FIN48 Sales tax liability reserve adjustment (2) -
VAT liability reserve adjustement (1) -
Other income tax reserve adjustments 0 0
Discretionary Outlays1 9 7
Integration/Acquisition costs 5 5
Unrealized Synergies 1 1
Other items identified in covenant add-backs (0) 0
Est. Public Company costs (2) (2)
Adj. EBITDA2 $ 57 $ 57
STRICTLY PRIVATE AND CONFIDENTIAL
These Risk Factors are being provided to certain sophisticated institutional investors for potential investment in Cerberus Telecom Acquisition Corp. (“CTAC”) as part of a proposed business combination between KORE Wireless Group, Inc. (“KORE”) and CTAC pursuant to which KORE will become a publicly traded operating company (the “Business Combination”). Investing in securities (the “Securities”) to be issued in the Business Combination involves a high degree of risk. Investors should carefully consider the risks and uncertainties inherent in an investment in us and in the Securities, including those described below, before subscribing for the Securities. If we cannot address any of the following risks and uncertainties effectively, or any other risks and difficulties that may arise in the future, our business, financial condition or results of operations could be materially and adversely affected. The risks described below are not the only ones we face. Additional risks that we currently do not know about or that we currently believe to be immaterial could also have a material adverse effect on our business, financial condition or results of operations. You should review the investor presentation and perform your own due diligence prior to making an investment.• the occurrence of any event, change or other circumstances that could give rise to the termination of negotiations and any subsequent definitive agreements
with respect to the Business Combination; • the outcome of any legal proceedings that may be instituted against CTAC, the combined company or others following the announcement of the Business
Combination and any definitive agreements with respect thereto; • the inability to complete the Business Combination due to the failure to obtain approval of the shareholders of CTAC, to obtain financing to complete the
Business Combination or to satisfy other conditions to closing; • changes to the proposed structure of the Business Combination that may be required or appropriate as a result of applicable laws or regulations or as a
condition to obtaining regulatory approval of the Business Combination;
• the ability to meet stock exchange listing standards following the consummation of the Business Combination; • the risk that the Business Combination disrupts current plans and operations of the Company, including relationships with customers, suppliers and business
partners, as a result of the announcement and consummation of the Business Combination; • the ability to recognize the anticipated benefits of the Business Combination, which may be affected by, among other things, competition, the ability of the
combined company to grow and manage growth profitably, maintain relationships with customers and suppliers and retain its management and key employees;
• costs related to the Business Combination; • changes in applicable laws or regulations, including foreign laws or regulations KORE is subject to; • the possibility that the Company or the combined company may be adversely affected by other economic, business, and/or competitive factors;
• the Company’s estimates of expenses and profitability; • the ability of the Company to control costs, including costs related to becoming a public company, the cost of procured cellular network connectivity,
procured devices for resale, and operating expenses;• the need to raise additional capital to finance operations or acquisitions, which may not be available on acceptable terms, or at all;• exposure to compliance obligations and risks under anti-corruption, export controls and economic sanctions laws and regulations of the United States and
applicable non-U.S. jurisdictions in which we operate, and instances of non-compliance may have a material adverse effect the results of operations of the business;
Select Risk Factors for PIPE Investors
48
STRICTLY PRIVATE AND CONFIDENTIAL
• the Company’s dependence on cellular carrier networks as the base layer for its IoT connectivity network services, and its ability to maintain good relationships
and favorable terms and conditions with these cellular network carrier vendors;• the Company’s dependence on certain device and software vendors as critical components of its IoT solutions, and its ability to maintain its relationship with
these device and software vendors;• the ability of the Company to accurately predict changes in customer demand due to matters beyond its control, maintain customers (particularly its largest
customers) and attract new customers;• the ability of the Company to successfully maintain market position and introduce new features in the Company’s technology and software offerings in a timely
fashion, including, but not limited to, integration of existing solutions with third-party software; • the actions of Company competitors, including consolidation within the industry, pricing changes or the introduction of new solutions; • service outages - including outages resulting from a failure of the Company’s 3rd party data centers, outages in the cellular carrier networks that the Company
uses for its connectivity services, or defects and bugs in either the Company’s own technology or 3rd party hardware and software used for any of its market offerings - may lead to a demand for a potential refund of previously charged amounts, or for potential liability claims from customers;
• security breaches, compromises of information security and any related occurrences, as well as the transmission, use and disclosure of user data and personal information could give rise to liabilities or additional costs as a result of laws, governmental regulations and mobile network operator and other customer requirements or differing views of personal privacy rights;
• fire, earthquake or natural hazards affecting some of the customer’s facilities or any of its 3rd party data centers may lead to an inability to provide its products and services for a period of time;
• the ability of the Company to obtain or maintain relevant intellectual property licenses or to protect its trademarks and internally developed software;• technological developments affecting the Company’s industry, which are evolving rapidly and the ability to secure agreements with existing vendors for future
technologies;• potential claims of IP infringement from 3rd parties;• misappropriation of the Company’s intellectual property which could place the Company at a material disadvantage;• the ability of the Company to maintain and enhance its reputation, brand recognition and business, along with the security and reliability of its products and
services;• any financial forecasts presented may not prove accurate;• the benefits of the Business Combination may not meet the expectations of investors, stockholders and financial analysts, which may depress the price of the
securities of the Company;• provisions in our organizational documents which may delay or discourage takeover attempts that shareholders may consider favorable;• the ability to maintain customer relationships, existing pricing, and existing subscriptions, through upcoming cellular network sunsets; and• other risks and uncertainties set forth in the section entitled “Risk Factors” and “Cautionary Note Regarding Forward-Looking Statements” in CTAC’s Registration
Statement on Form S-1 dated October 19, 2020.
Select Risk Factors for PIPE Investors (Cont’d)
49