Embed Size (px)
Citation preview

Salal Power Station, J&K
Clean Power For Every Home
INVESTOR PRESENTATION
FINANCIAL YEAR 18-19 : MARCH’2019
2
NHPC Today
Financial Highlights
Financial Ratios
Other Business Initiatives
Projects At Glance
Presentation Outline
Our Vision: To be a global leading organization for sustainable development of clean power through
competent, responsible and innovative values.

NHPC-Today 3
NHPC-Energising India With Hydropower
Subansiri Lower Project Teesta V, Sikkim
4
Installed
Capacity
Under
Construction
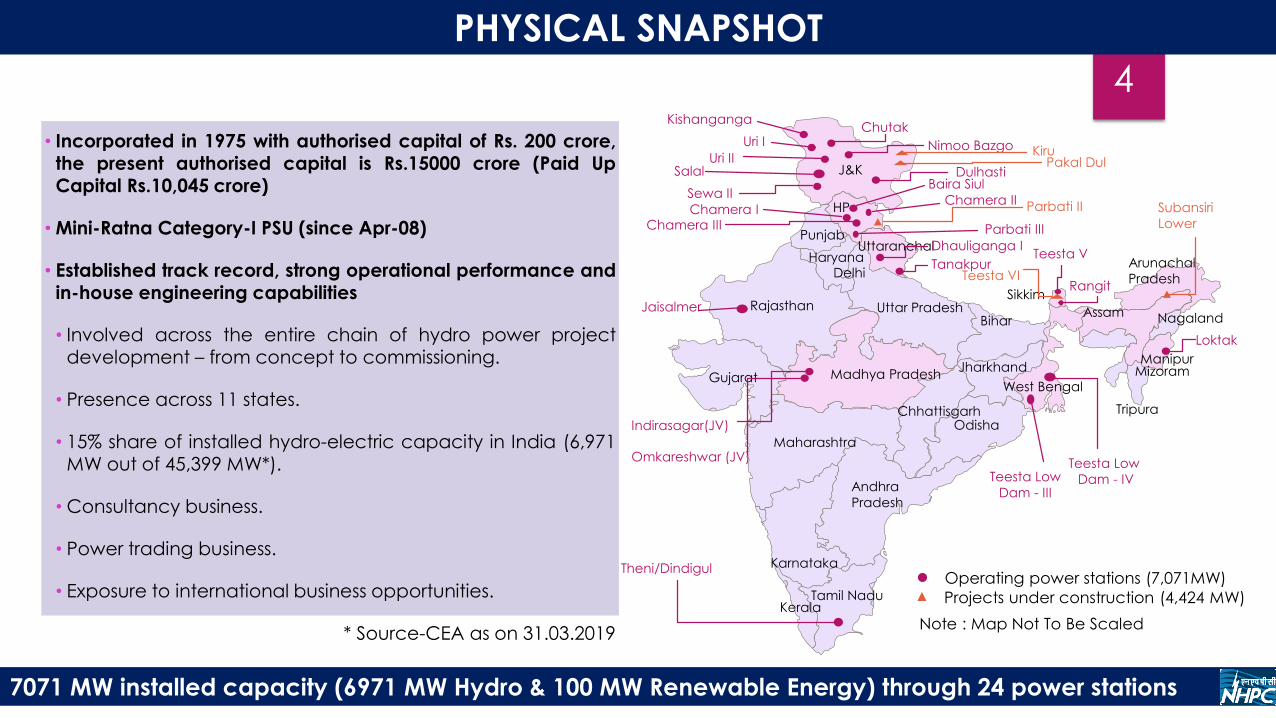
PHYSICAL SNAPSHOT
Awaiting
Clearances
Under
Pipeline
7071 MW installed capacity (6971 MW Hydro & 100 MW Renewable Energy) through 24 power stations
• Incorporated in 1975 with authorised capital of Rs. 200 crore,the present authorised capital is Rs.15000 crore (Paid UpCapital Rs.10,045 crore)
• Mini-Ratna Category-I PSU (since Apr-08)
• Established track record, strong operational performance andin-house engineering capabilities
• Involved across the entire chain of hydro power projectdevelopment – from concept to commissioning.
• Presence across 11 states.
• 15% share of installed hydro-electric capacity in India (6,971MW out of 45,399 MW*).
• Consultancy business.
• Power trading business.
• Exposure to international business opportunities.
* Source-CEA as on 31.03.2019
J&K
HP
Punjab
Haryana
Rajasthan
Uttaranchal
Uttar Pradesh
Gujarat Madhya Pradesh
Odisha
Bihar
Maharashtra
Andhra
Pradesh
Karnataka
Tamil NaduKerala
Chhattisgarh
Jharkhand
Sikkim
Arunachal
Pradesh
Assam Nagaland
ManipurMizoram
Tripura
Delhi
Loktak
Teesta Low
Dam - IVTeesta Low
Dam - III
West Bengal
Indirasagar(JV)
Omkareshwar (JV)
Chamera IIIChamera I
Sewa II
Salal
Uri I
Uri II
KishangangaChutak
Nimoo Bazgo
DulhastiBaira Siul
Parbati II
Parbati III
Subansiri
Lower
Chamera II
Dhauliganga I
TanakpurTeesta V
Rangit
Operating power stations (7,071MW)
Projects under construction (4,424 MW)
Jaisalmer
Theni/Dindigul
Note : Map Not To Be Scaled
Pakal DulKiru
Teesta VI
5
Installed
Capacity
Under
Construction
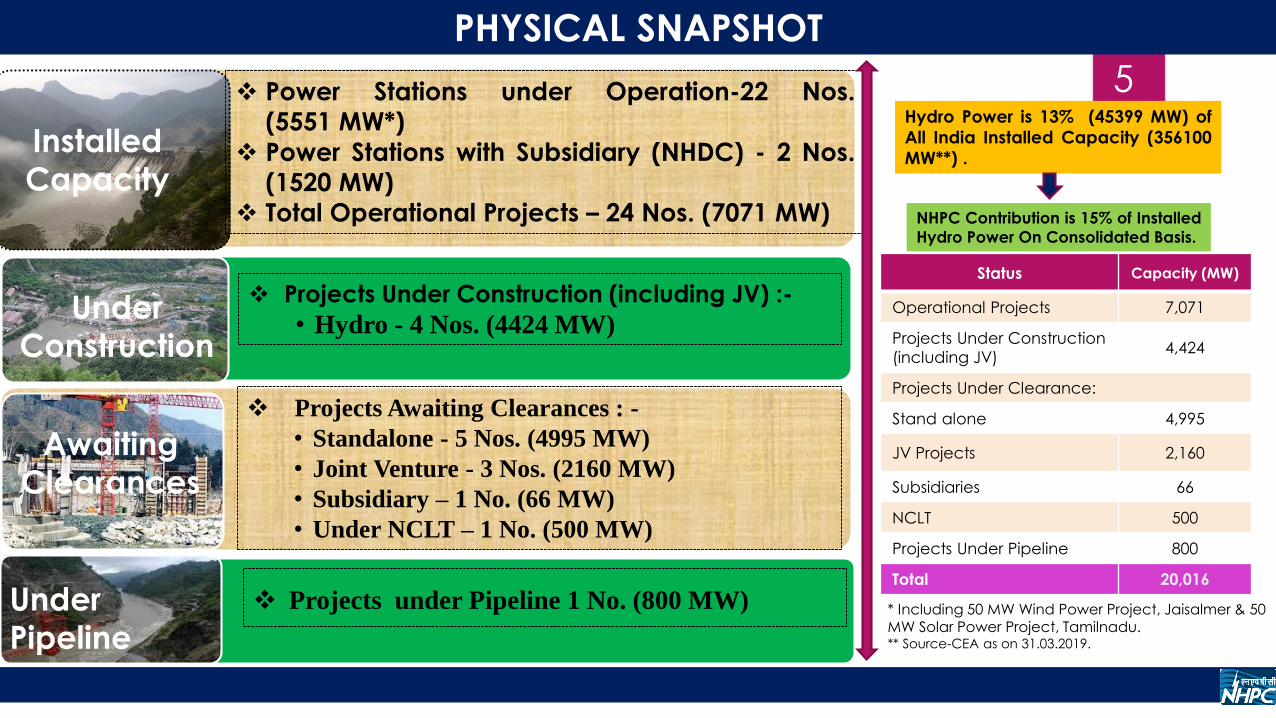
Power Stations under Operation-22 Nos.(5551 MW*)
Power Stations with Subsidiary (NHDC) - 2 Nos.(1520 MW)
Total Operational Projects – 24 Nos. (7071 MW)
PHYSICAL SNAPSHOT
Projects Under Construction (including JV) :-
• Hydro - 4 Nos. (4424 MW)
Awaiting
Clearances
Projects Awaiting Clearances : -
• Standalone - 5 Nos. (4995 MW)
• Joint Venture - 3 Nos. (2160 MW)
• Subsidiary – 1 No. (66 MW)
• Under NCLT – 1 No. (500 MW)
Under
Pipeline
Projects under Pipeline 1 No. (800 MW)
Hydro Power is 13% (45399 MW) of
All India Installed Capacity (356100
MW**) .
NHPC Contribution is 15% of Installed
Hydro Power On Consolidated Basis.
* Including 50 MW Wind Power Project, Jaisalmer & 50 MW Solar Power Project, Tamilnadu.** Source-CEA as on 31.03.2019.
Status Capacity (MW)
Operational Projects 7,071
Projects Under Construction
(including JV)4,424
Projects Under Clearance:
Stand alone 4,995
JV Projects 2,160
Subsidiaries 66
NCLT 500
Projects Under Pipeline 800
Total 20,016
6
Installed
Capacity
Under
Construction
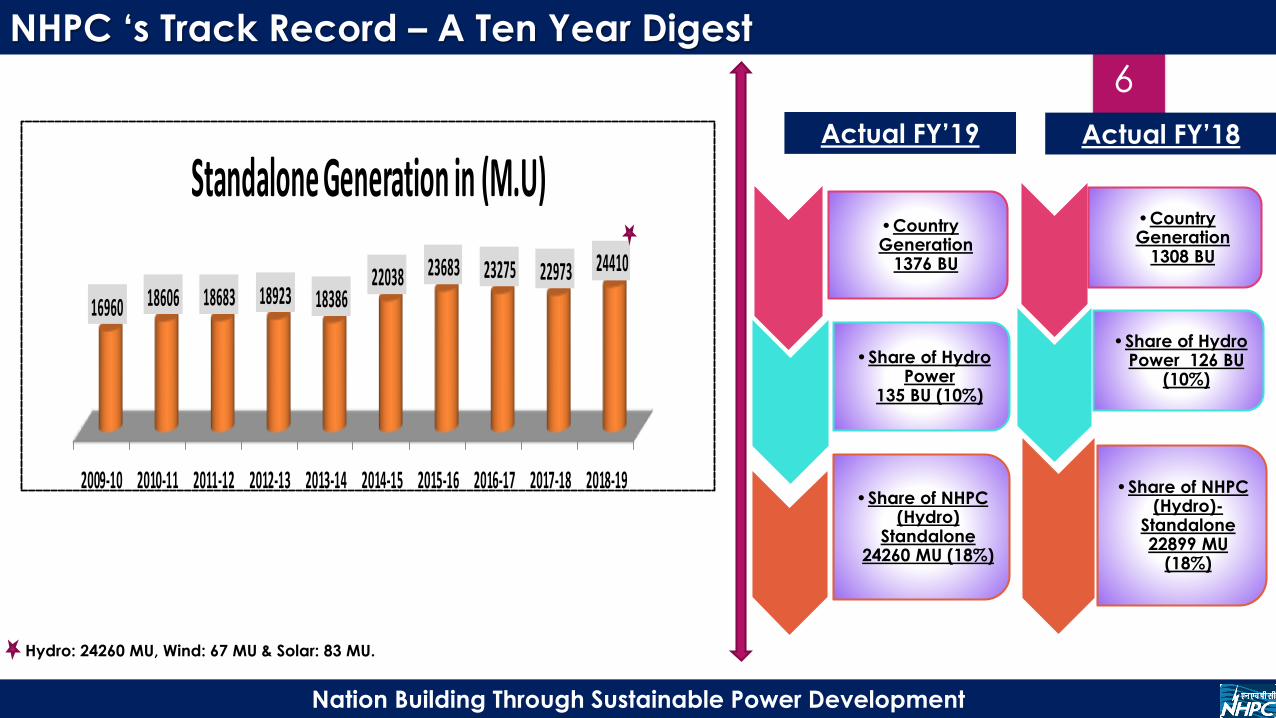
NHPC ‘s Track Record – A Ten Year Digest
Awaiting
Clearances
Nation Building Through Sustainable Power Development
Actual FY’19 Actual FY’18
•Country Generation
1376 BU
•Share of Hydro Power
135 BU (10%)
•Share of NHPC (Hydro)
Standalone 24260 MU (18%)
•Country Generation
1308 BU
•Share of Hydro Power 126 BU
(10%)
•Share of NHPC (Hydro)-
Standalone 22899 MU
(18%)
2009-10 2010-11 2011-12 2012-13 2013-14 2014-15 2015-16 2016-17 2017-18 2018-19
16960 18606 18683 18923 1838622038 23683 23275 22973 24410
Standalone Generation in (M.U)
Hydro: 24260 MU, Wind: 67 MU & Solar: 83 MU.

Financial Highlights
7
Clean Power For Every Home
Sewa II, J&K Chamera I, Himachal

8
Financial Highlights : Standalone
Awaiting
Clearances
Pipelined
Projects
Revenue & Expenditure-Analysis
76648345 8729 8359
9086
2124 24302796 2769 2631
6.00%
15.00%18.00%
14.60%
0%
2%
4%
6%
8%
10%
12%
14%
16%
18%
20%
0
1000
2000
3000
4000
5000
6000
7000
8000
9000
10000
2014-15 2015-16 2016-17 2017-18 2018-19
Revenue Vs. Net Profit Vs. Dividend
Revenue Net Profit Dividend Rs. In Crore
Rs. In Crore
14.00 %
Sales
Revenue
90%
Other
Income
10%
Revenue FY’19
Employees
Benefits, 28%
Generation
Expenses, 13%
Depreciation, 26%
Finance
Charge
s, 14%
Other Expenses,
19%
Expenditure FY’19
Particulars
FY’19 FY’18 % Change
12 Months Qtr-4 12
Months
Qtr-4 12
Months
Qtr-4
Revenue from Operation 8161.18 1950.34 6938.22 1137.34 17.63 71.48
Other Income 924.78 235.91 1420.55 268.73 -34.90 -12.21
Total Income (A) 9085.96 2186.25 8358.77 1406.07 8.70 55.49
Purchase of Power - Trading 12.68 12.68 0.00 0.00
Generation Expenses 796.85 152.58 716.39 84.71 11.23 80.12
Employee Benefits Expense 1704.65 440.23 1535.89 433.22 10.99 1.62
Finance Costs 894.88 222.81 922.32 217.85 -2.98 2.28
Depre. & Amort. Expense 1589.99 411.45 1395.51 344.52 13.94 19.43
Other Expenses 1165.53 361.70 972.36 233.03 19.87 55.22
Total Expenditure(B) 6164.58 1601.45 5542.47 1313.33 11.22 21.94
Rate Regu. Income (C) 823.40 570.05 62.33 -161.33 1221.03 453.34
PBT (A-B+C) 3744.78 1154.85 2878.63 -68.59 30.09 1783.70
Tax 1114.23 662.56 109.60 -268.39 916.63 346.86
Profit After Tax 2630.55 492.29 2769.03 199.80 -5.00 146.39Interim Dividend - 7.10% & Final Dividend 7.50%.

9
Statement of Assets & Liabilities
Awaiting
Clearances
Equity and Liabilities FY’19 FY’18
Share Holder’s Funds 29214.73 28351.82
Loan Funds-Long Term 17044.63 16728.20
Deferred Tax Liabilities 3610.63 3145.39
Other Long term Liabilities & Provisions 3910.44 1688.94
Current Liabilities & Provisions 5828.94 5653.25
Total Equity & Liabilities 59609.37 55567.60
ASSETS
PPE (incl. investment property) 22945.18 19094.60
Capital Work in Progress 14898.11 18813.96
Other Intangible Asset 906.66 923.38
Non Current Financial Asset 6636.74 4667.17
Non Current Assets (Others) 2153.30 1961.31
Regulatory Asset 6492.61 5669.21
Trade Receivables 2623.09 1097.07
Cash and Bank Balances 390.63 1472.39
Current Assets (Others) 2563.05 1868.51
Total Assets 59609.37 55567.60
Rs. In Crore

10
Debtors Position
Awaiting
Clearances
Pipelined
Projects
Rs. In Crore
Top Five Debtors (in Crs.)
Name 31.03.19 31.03.18
Total More than 60 days Total More than 60 days
PDD, J&K 977 684 597 514
UPPCL, UP 780 573 88 -
BSES Yamuna 241 215 334 334
PSPCL, Punjab 188 34 49 -
WBSEDCL 107 - 79 1
Total Debtors (in Crs.)
S. N. Particulars As on
31.03.19
As on
31.12.18
As on
30.09.18
As on
30.06.18
As on
31.03.18
1 Trade Receivables 2623 2627 2490 1811 1097
2 More than 60 days
(Net of Provn.)
1575 1894 1339 845 888
11
Incentives Position
Awaiting
Clearances
Pipelined
Projects
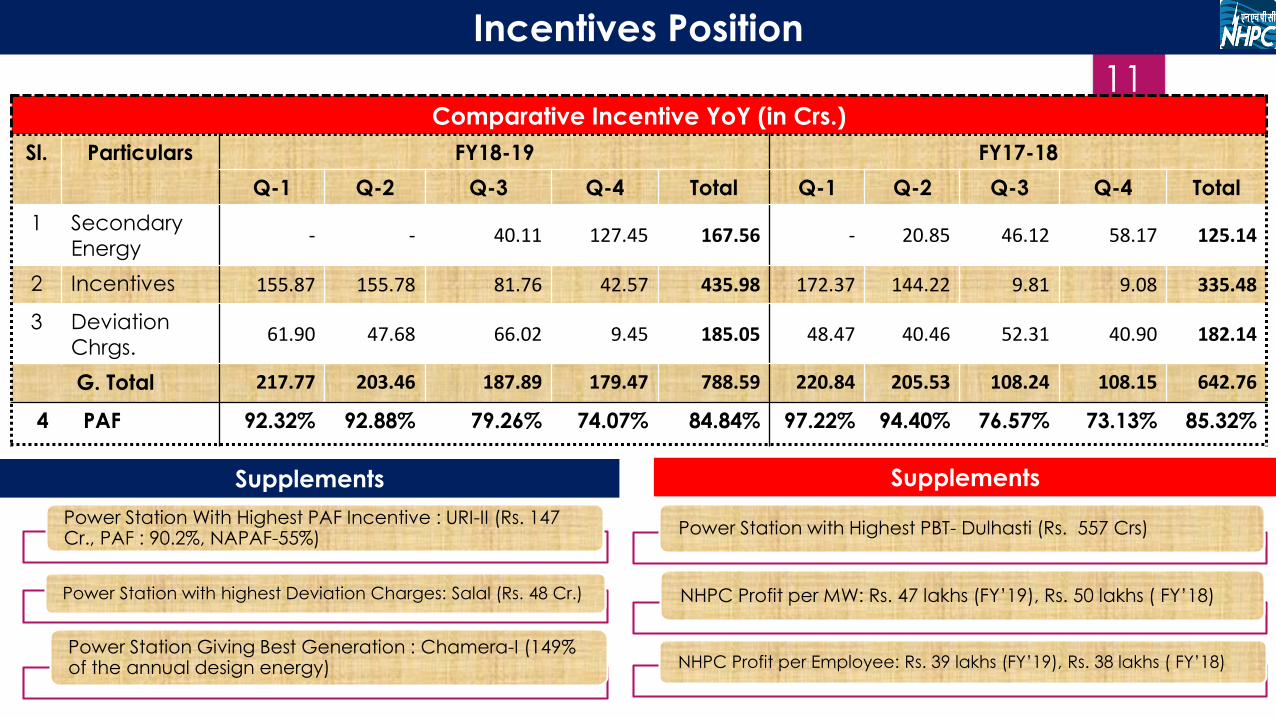
Rs. In CroreComparative Incentive YoY (in Crs.)
Sl. Particulars FY18-19 FY17-18
Q-1 Q-2 Q-3 Q-4 Total Q-1 Q-2 Q-3 Q-4 Total
1 Secondary
Energy- - 40.11 127.45 167.56 - 20.85 46.12 58.17 125.14
2 Incentives 155.87 155.78 81.76 42.57 435.98 172.37 144.22 9.81 9.08 335.48
3 Deviation
Chrgs.61.90 47.68 66.02 9.45 185.05 48.47 40.46 52.31 40.90 182.14
G. Total 217.77 203.46 187.89 179.47 788.59 220.84 205.53 108.24 108.15 642.76
4 PAF 92.32% 92.88% 79.26% 74.07% 84.84% 97.22% 94.40% 76.57% 73.13% 85.32%
Supplements Supplements
Power Station with Highest PBT- Dulhasti (Rs. 557 Crs)
NHPC Profit per MW: Rs. 47 lakhs (FY’19), Rs. 50 lakhs ( FY’18)
NHPC Profit per Employee: Rs. 39 lakhs (FY’19), Rs. 38 lakhs ( FY’18)
Power Station With Highest PAF Incentive : URI-II (Rs. 147 Cr., PAF : 90.2%, NAPAF-55%)
Power Station with highest Deviation Charges: Salal (Rs. 48 Cr.)
Power Station Giving Best Generation : Chamera-I (149% of the annual design energy)

12
Key Financials : FY’19
Pipelined
Projects
P&L Standalone
Total Income 9086
EBITDA 6151
EBITDA Margin* 68%
PAT 2631
Profit Margin 29%
Dividend Pay Out (FY‘19) Rs. 1.46 Per Share/
56% of Profit
Balance Sheet Standalone
Share Capital 10045
Net worth 29215
Long Term Debt 17045
Cash & Bank Bal. 391
Gross Block 39610
CWIP 14898
` In Crore
Shareholding pattern as on 31.03.19
979
21242430
2796 27692631
332664
1661
1985
1436 146734% 31%
68% 71%
52%56%
0%
20%
40%
60%
80%
0
500
1000
1500
2000
2500
3000
2013-14 2014-15 2015-16 2016-17 2017-18 2018-19
Dividend Pay out
Net Profit Dividend DIV. Payout Ratio
* EBITDA calculation doesn’t include Finance Charges of Rs. 77 Crore, Depreciation of
Rs. 2 Crore and Other Income of Rs.21 Crore which pertains to Subansiri Lower Project.
FII 4.90%
GOI-73.33%
Individual/HUF-
5.36%
DII 16.21%
Others-
0.20%

13
NHPC – Key Ratios
** Stock Price (BSE): as on 24.05.19 Rs. 23.05 & as on 31.03.18 Rs. 27.65*Weighted Avg. no, of Shares for EPS Calculation (FY’19) -1021.88 Cr.
S. No. Particulars FY’19 FY’18
Particulars Standalone Consolidated Standalone Consolidated
1. PAT (In Cr.) 2630.55 2595.61 2769.03 2513.90
2. Net-worth (In Cr.) 29214.73 30797.81 28351.82 30041.19
3. No. of Equity Shares 1004.50 1004.50 1025.93 1025.93
4. EPS 2.57* 2.54* 2.70 2.45
5. Earning Yield(%)** 11.15 11.02 9.76 8.86
6. Dividend Per Share 1.46 1.40
7. Dividend Yield(%)** 6.33 5.06
8. Book Value per share 29.08 30.66 27.64 29.28
9. PB Ratio** 0.79 0.75 1.00 0.94
10. PE Ratio** 8.97 9.07 10.24 11.29
11. Return On Net worth (%) 9.00 8.43 9.77 8.37
12. Market Capitalisation (In Cr.)** 23154 28367
13. Debt Equity Ratio 0.71 0.67 0.65 0.61

NHDC Ltd. (Subsidiary) –Snapshots :FY18-19
14Shareholding Pattern : 51:49 (NHPC : GoMP)
Installed Capacity : 1520 MW
Design Energy : 2120.17 MU
Generation : 1921.23 MU (FY’19), 1325.25 (FY’18)
PAF : 93.89% (FY’19), 90.64% (FY18)
Revenue from operations : Rs. 805 Crs. (FY’19), 785 Crs (FY’18)
PAT : 491 Crs. (FY19), 553 Crs. (FY18)
1367
951
1307
785 805
182266 293 271 233
766639
931
553 491
0
500
1000
1500
2014-15 2015-16 2016-17 2017-18 2018-19
Financial Performance
Sales Revenue Other Income PAT
3,691
2,933
4,749
1,3251,921
91.43% 93.26%
93.64%
90.64%
93.89%
89%
90%
91%
92%
93%
94%
95%
0
1,000
2,000
3,000
4,000
5,000
2014-15 2015-16 2016-17 2017-18 2018-19
Physical Performance
Generation (MU) PAF
PAF Incentive : FY19- Rs. 38 Crs. FY18- Rs. 24 Crs.
15
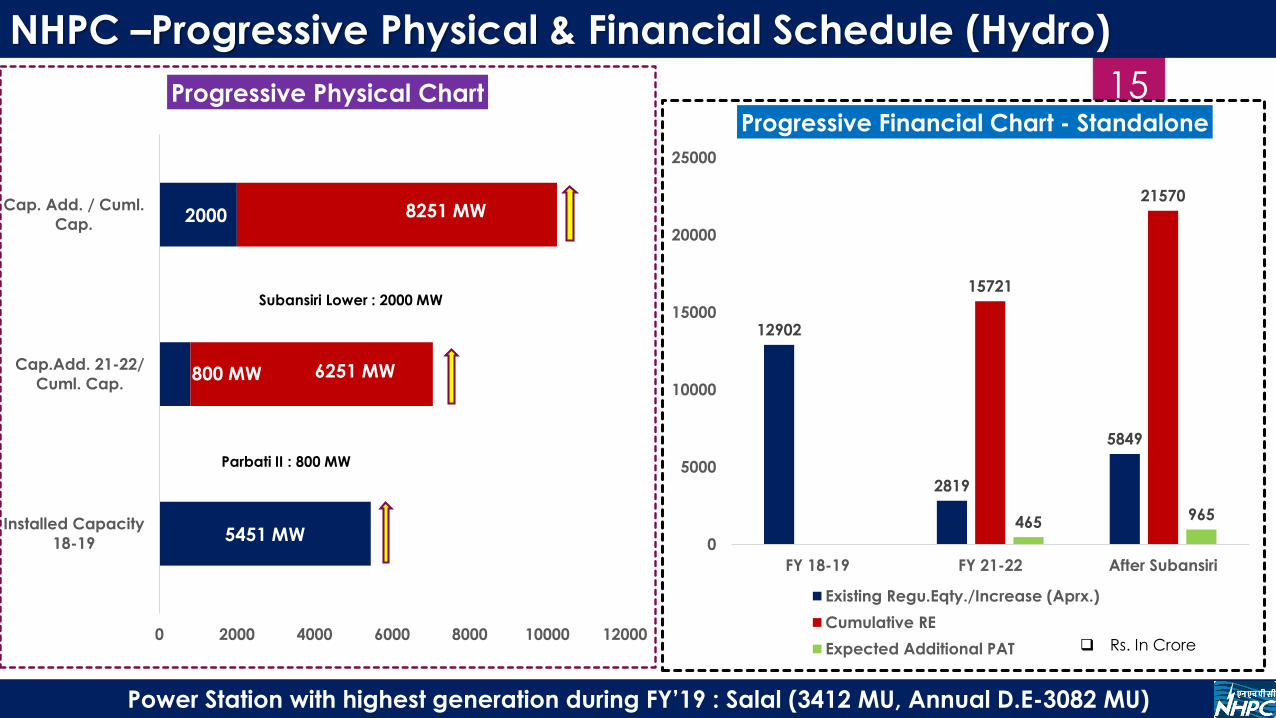
NHPC –Progressive Physical & Financial Schedule (Hydro)
Power Station with highest generation during FY’19 : Salal (3412 MU, Annual D.E-3082 MU)
5451 MW
800 MW
2000
0 2000 4000 6000 8000 10000 12000
Installed Capacity
18-19
Cap.Add. 21-22/
Cuml. Cap.
Cap. Add. / Cuml.
Cap.
Progressive Physical Chart
6251 MW
8251 MW
Subansiri Lower : 2000 MW
12902
2819
5849
15721
21570
465965
0
5000
10000
15000
20000
25000
FY 18-19 FY 21-22 After Subansiri
Progressive Financial Chart - Standalone
Existing Regu.Eqty./Increase (Aprx.)
Cumulative RE
Expected Additional PAT Rs. In Crore
Parbati II : 800 MW

16
NHPC – CAPEX
Going Forward CAPEX is expected to be higher after resumption of active Construction works at Subansiri
Lower Project and clearance of pipelined projects.
F.YAmount (Rs. In
Crore)Remarks
2014-15 2615 (Actual)
2015-16 2793 (Actual)
2016-17 2438 (Actual)
2017-18 2722 (Actual)
2018-19 2213 (Actual)
2019-20 3806 (BE)

17
All Units of Kishanganga H. E. Project has been put under commercial operation (Unit # 1 w.e.f. 18.05.2018 & Unit # 2 & Unit # 3 w.e.f. 24.05.2018).
NHPC – Major Highlights FY’19
Unit # 1 & 2 of Parbati-II HE Project (4 x 200 MW) in Himachal Pradesh has been successfully synchronized with the grid on 14.09.2018 & 22.09.2018
respectively.
Memorandum of Understanding (MOU) has been signed with the Indian Army for construction of underground caverns and semi underground
bunkers at various locations in India on turnkey basis.
CCEA in its meeting held on 07.03.2019 has given its approval for investment sanction for acquisition of M/s Lanco Teesta Power Limited and
execution of balance works of Teesta VI H.E. Project 500 MW (4*125 MW) in Sikkim by NHPC Limited with an estimated cost of Rs. 5748.04 crores.
A Memorandum of Understanding has been exchanged among NHPC Limited, Jammu & Kashmir State Power Development Department
(JKPDD) and J&K State Power Development Corporation (JKSPDC) for execution of 850 MW Ratle Hydroelectric Project (Jammu & Kashmir) in the
august presence of Prime Minister of India on 3rd Feb 2019. The estimated cost of the project is Rs. 5719 crore.
Hon’ble Prime Minister has laid the foundation stone of 624MW Kiru Hydroelectric Project on February 03, 2019. This project is owned by Chenab
Valley Power Projects Pvt. Ltd, a joint venture between NHPC, JKSPDC Ltd. (A Jammu & Kashmir government undertaking) and PTC Ltd. The
estimated cost of the project is Rs. 4288 crore.
The company has completed buyback of 21.43 crore number of equity shares at Rs.28/- per share with total issue size of Rs.600 crore.
Investment expenditure of Rs. 1600 crore in respect of Dibang Multipurpose Project (2880 MW) has been recommended by PIB for pre-investment activities of
the project.
NHPC has been appointed as an Aggregator under Pilot Scheme II of the Ministry of Power where NHPC would procure 2500 MW thermal power
from the selected generators through bidding route and sell the same to DISCOMS for the next three years.

Other Business Initiative
18
Clean Power For EVERY HOME
Solar EnergyWind Energy

19
Other Business Initiative
32 MW Solar Power Project in Jalaun, Uttar Pradesh
JVC of NHPC Ltd. & UPNEDA namely ‘Bundelkhand Saur UrjaLimited’ formed on 02.02.2015
Share of NHPC & UPNEDA : >=74:<=26
Current Status: Signing of PPA under Progress. 63.491 Ha land got transferred from UPNEDA and Mutation of the land in favour ofBSUL finalised. Bidding process under progress.
NHPC is in process of development of Floating Solar Power project in Kollam, Kerala.
As desired by Kerala State Electricity Board (KSEB), 10 MW shall be developed in Ist Phase.
Current Status : Tender finalized & the work is under award stage. Signing of PPA with KSEB is in process.
10 MW Floating Solar Project, Kerala
Solar Power
100 MW Solar Park in Odisha
MNRE has conveyed in-principle approval for setting up of one solar park of capacity 100 MW in Odisha by NHPC.
40 MW shall be developed in Ist Phase at the identified land in Ganjam District.
Approval of State Technical Committee (STC) for 40 MW has been conveyed by M/s Green Energy Development Corporation ofOdisha Ltd (GEDCOL).
Current Status : Signing of PPA and connectivity approval in process. Actions for EPC bidding initiated.
20
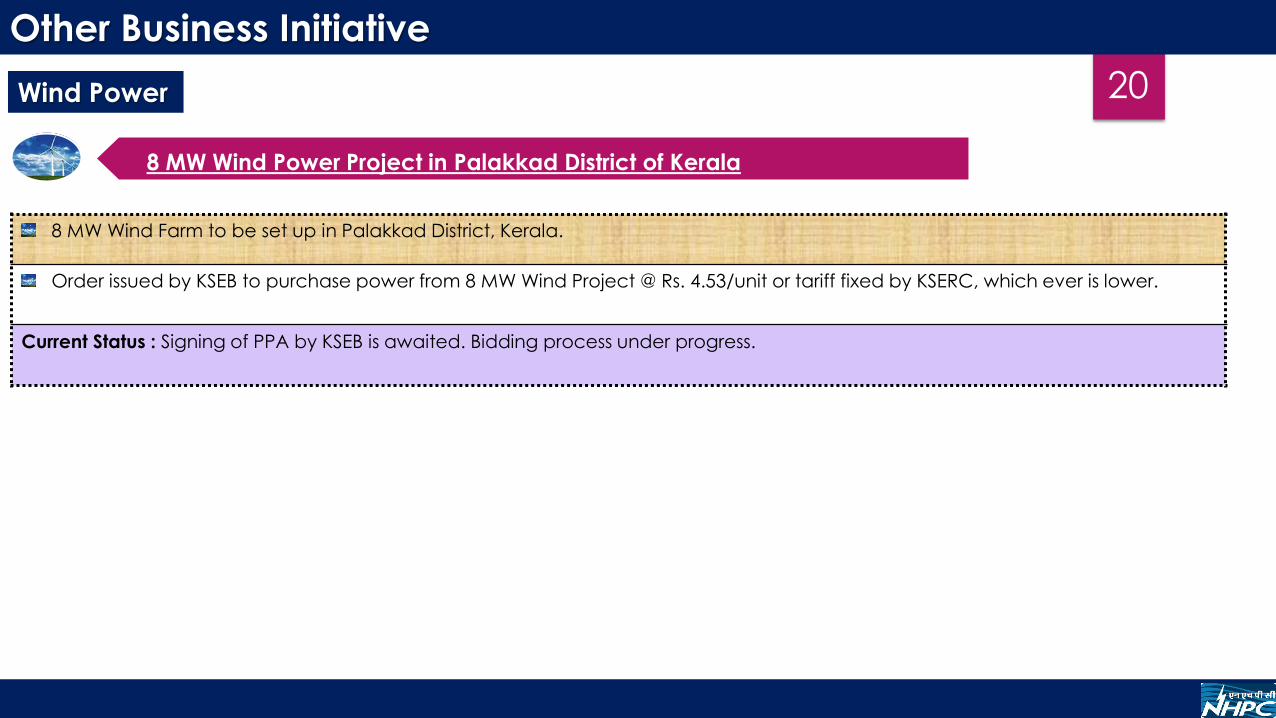
Other Business Initiative
8 MW Wind Farm to be set up in Palakkad District, Kerala.
Order issued by KSEB to purchase power from 8 MW Wind Project @ Rs. 4.53/unit or tariff fixed by KSERC, which ever is lower.
Current Status : Signing of PPA by KSEB is awaited. Bidding process under progress.
8 MW Wind Power Project in Palakkad District of Kerala
Wind Power

NHPC Projects At A Glance
21
NHPC-Energising India With Hydropower
22
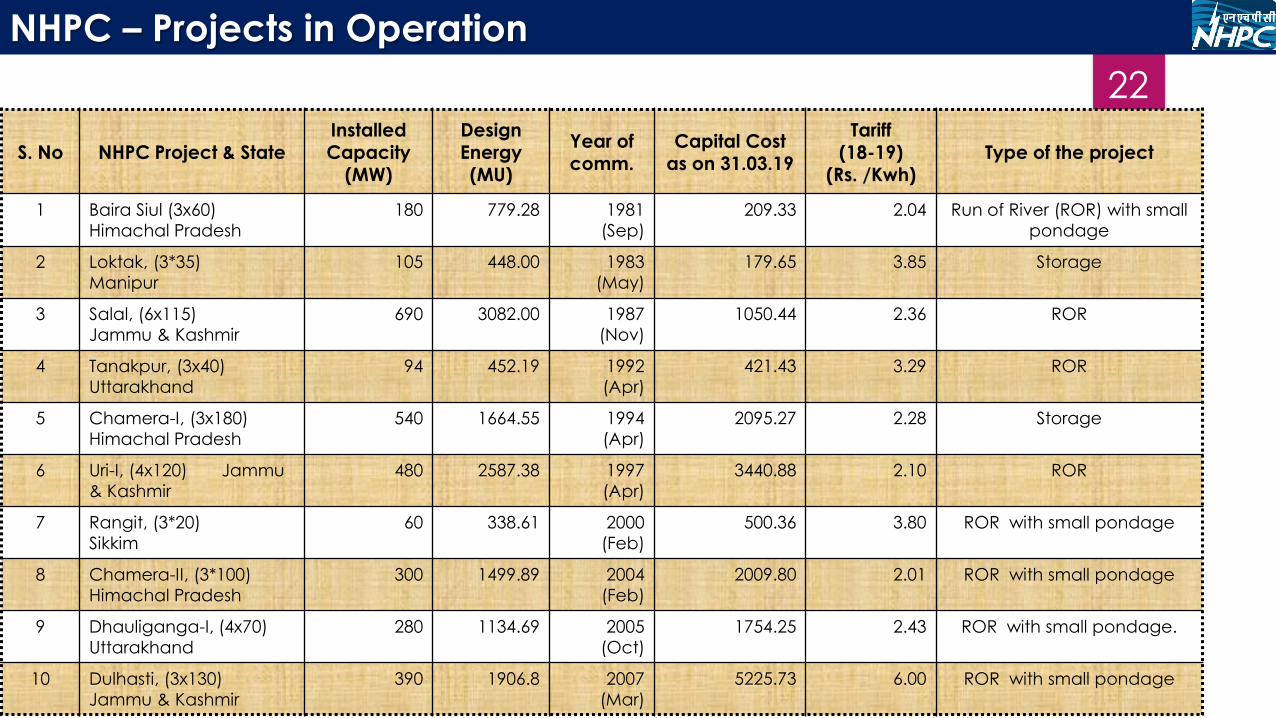
NHPC – Projects in Operation
S. No NHPC Project & StateInstalled Capacity
(MW)
Design Energy (MU)
Year of comm.
Capital Costas on 31.03.19
Tariff (18-19)
(Rs. /Kwh)Type of the project
1 Baira Siul (3x60)
Himachal Pradesh
180 779.28 1981
(Sep)
209.33 2.04 Run of River (ROR) with small
pondage
2 Loktak, (3*35)
Manipur
105 448.00 1983
(May)
179.65 3.85 Storage
3 Salal, (6x115)
Jammu & Kashmir
690 3082.00 1987
(Nov)
1050.44 2.36 ROR
4 Tanakpur, (3x40)
Uttarakhand
94 452.19 1992
(Apr)
421.43 3.29 ROR
5 Chamera-I, (3x180)
Himachal Pradesh
540 1664.55 1994
(Apr)
2095.27 2.28 Storage
6 Uri-I, (4x120) Jammu
& Kashmir
480 2587.38 1997
(Apr)
3440.88 2.10 ROR
7 Rangit, (3*20)
Sikkim
60 338.61 2000
(Feb)
500.36 3.80 ROR with small pondage
8 Chamera-II, (3*100)
Himachal Pradesh
300 1499.89 2004
(Feb)
2009.80 2.01 ROR with small pondage
9 Dhauliganga-I, (4x70)
Uttarakhand
280 1134.69 2005
(Oct)
1754.25 2.43 ROR with small pondage.
10 Dulhasti, (3x130)
Jammu & Kashmir
390 1906.8 2007
(Mar)
5225.73 6.00 ROR with small pondage
23
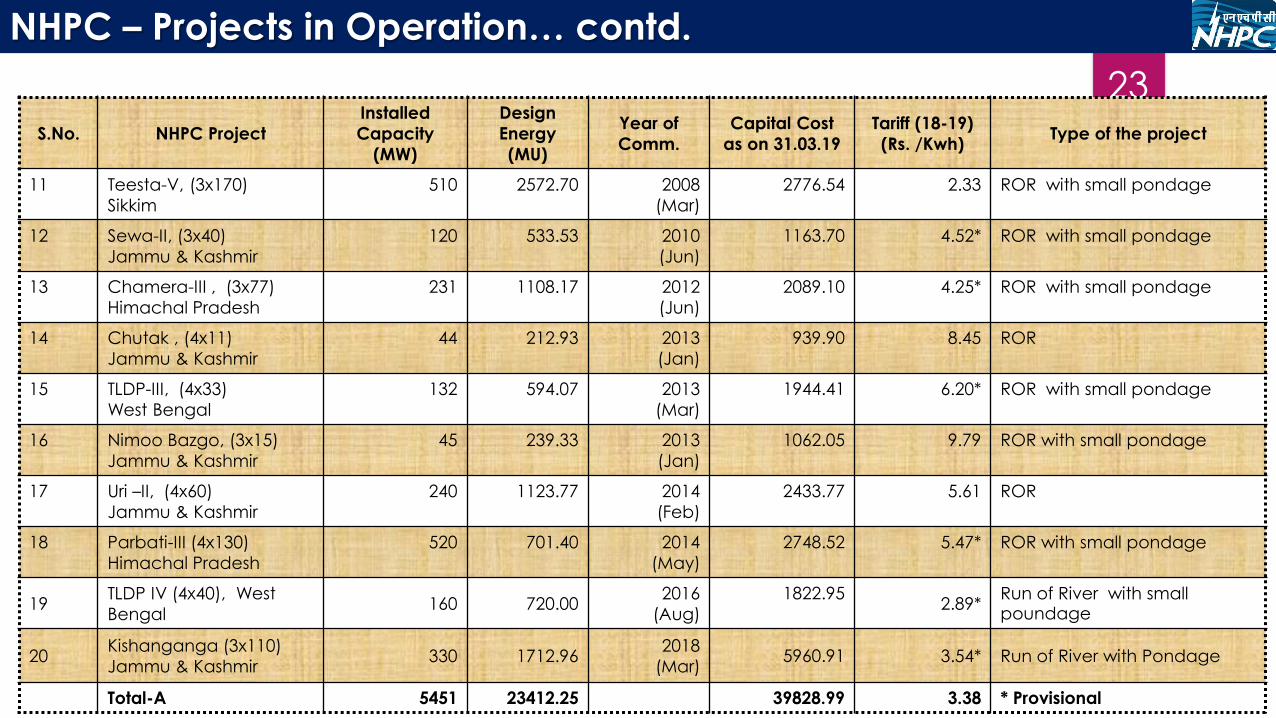
NHPC – Projects in Operation… contd.
S.No. NHPC Project
Installed
Capacity
(MW)
Design
Energy
(MU)
Year of
Comm.
Capital Cost
as on 31.03.19
Tariff (18-19)
(Rs. /Kwh)Type of the project
11 Teesta-V, (3x170)
Sikkim
510 2572.70 2008
(Mar)
2776.54 2.33 ROR with small pondage
12 Sewa-II, (3x40)
Jammu & Kashmir
120 533.53 2010
(Jun)
1163.70 4.52* ROR with small pondage
13 Chamera-III , (3x77)
Himachal Pradesh
231 1108.17 2012
(Jun)
2089.10 4.25* ROR with small pondage
14 Chutak , (4x11)
Jammu & Kashmir
44 212.93 2013
(Jan)
939.90 8.45 ROR
15 TLDP-III, (4x33)
West Bengal
132 594.07 2013
(Mar)
1944.41 6.20* ROR with small pondage
16 Nimoo Bazgo, (3x15)
Jammu & Kashmir
45 239.33 2013
(Jan)
1062.05 9.79 ROR with small pondage
17 Uri –II, (4x60)
Jammu & Kashmir
240 1123.77 2014
(Feb)
2433.77 5.61 ROR
18 Parbati-III (4x130)
Himachal Pradesh
520 701.40 2014
(May)
2748.52 5.47* ROR with small pondage
19TLDP IV (4x40), West
Bengal160 720.00
2016
(Aug)
1822.952.89*
Run of River with small poundage
20Kishanganga (3x110)
Jammu & Kashmir 330 1712.96
2018
(Mar)5960.91 3.54* Run of River with Pondage
Total-A 5451 23412.25 39828.99 3.38 * Provisional

24
NHPC – Projects in Operation… contd.
S.No ProjectInstalled
Capacity(MW)
Design
Energy (MU)
Year of Comm.
Capital Cost Tariff 18-19 (Rs./Kwh)
Type of the project
1 Indrasagar, (8x125) Madhya Pradesh
1000 1442.70 2005 4615.11 4.29 Storage
2 Omkareshwar,
(8x65) Madhya Pradesh
520 677.47 2007 3013.85 6.65 Storage
Total-C 1520 2120.17 7628.96
Renewable Energy
S.No ProjectInstalled Capacity
(MW)
Design Energy (MU)
Year of Comm.
Capital Cost as on
31.03.2019
Tariff 18-19 (Rs./unit)
Place of Project
1 Wind Power 50 94.25 2016 330.26 3.69* Lakhmana, Jaisalmer
2 Solar Power 50 105.96 2018 286.00 4.41 Theni/Dindigul District, Tamilnadu
Total-B 100 200.21 616.26 *Excluding GBI of Rs. 0.50 per unit & REC.
Sub Total Stand-alone(A+B)5551 23612.46 40445.25
Operational Projects with Subsidiary
Grand Total-D:(A+B+C)
7071 25732.63

25
NHPC: Projects Under Construction
NHPC ProjectInstalled
Capacity(MW)
Design Energy (MU)
Type of the project
CCEA Estimated
Cost (Rs. Crore)(Price Level)
Anticipated
Project Cost (Rs. Crore)
Provisional
Project
Expenditure till –Mar’19 (Rs. Crore)
Expected
Commissioning Schedule
Subansiri Lower (250X8)Assam/ Ar. Pradesh
2000 7421 Reservoir 6285.33 (Dec02) 19496.34 (Apr’17)
10723.47 Within 4 years after
resumption of work
Parbati II (200x4) Himachal
Pradesh
800 3108.66 Run of River
with small pondage
3919.59 (Dec01) 9394.80 (Apr’18) 7244.66 FY 21-22 (Q-3)
Total (A) 2800 10529.66 10204.92 28891.14 17968.13
Project Under Construction-JV
S.No ProjectsInstalled
Capacity (MW)
Design Energy
(MUs)Cost (In Cr.) & PL
Expected
Commissioning
Schedule
Status
1 Chenab valley Power Projects Ltd. (JV between NHPC (49%) JKSPDC (49%), & PTC (2%)
i)Pakal Dul (4x250)
J&K1000 3330.18
8112
(Mar 13)FY 23-24 (Q-2)
DAM & Power House Package awarded & work started.
Tendering for HRT & HM packages are in progress. E&M
package has already been awarded.
ii)Kiru (4x156)
J&K624 2272.02
4288
(July18) FY 23-24 (Q-2) Investment approval for construction of the project is
available and the work shall be started soon.
TOTAL (B) 1624 5602.20 12400
Grand Total (A+B) 4424 16131.86

26
NHPC Standalone Projects Under Clearance
S.No. ProjectsInstalled Capacity
(MW)
Design Energy (MUs)
Cost (In Crore)
& PLStatus
1
Kotli Bhel–IA (3x65)
(Uttarakhand)195 1025.50
2321(Mar 19)
PIB had recommended the project for investment subject to clearancefrom Hon’ble SC for Uttarakhand Projects. Decision of Hon’ble SC is
awaited.
2
Teesta-IV (4x130)(Sikkim)
520 23735630
(Mar 19)
All statutory clearances received except forest clearance (stage-II). FRACompliance is underway. Approval of pre-investment activities isavailable and draft PIB memo for implementation of project submitted.
3
Dibang(12x240) (Ar. Pradesh)
2880 1122328007
(Mar 19)
Concurrence to Project, Environment Clearance, Forest Clearance(Stage-I) and FRA clearance available. Investment approval of Rs. 1600crore has been recommended for pre-investment activities & balanceclearances of the project. Material for cabinet note for the samesubmitted to MoP.
4
Tawang –I (3x200)(Ar. Pradesh)
600 29635342
(Mar 19)
All statutory Clearances have been received except Forest clearance.FRA compliance is underway and Basin Study Report has beensubmitted and accepted. After receipt of Forest Clearance (Stage-I),the process for PIB / CCEA shall be initiated. Approval of Pre-investmentactivities is available.
5
Tawang –II (4x200)(Ar. Pradesh)
800 36226769
(Mar 19)
All statutory clearances received except forest clearance (stage-II). FRACompliance is underway. Approval of pre-investment activities isavailable.
Total 4995 21206.50 48069
27
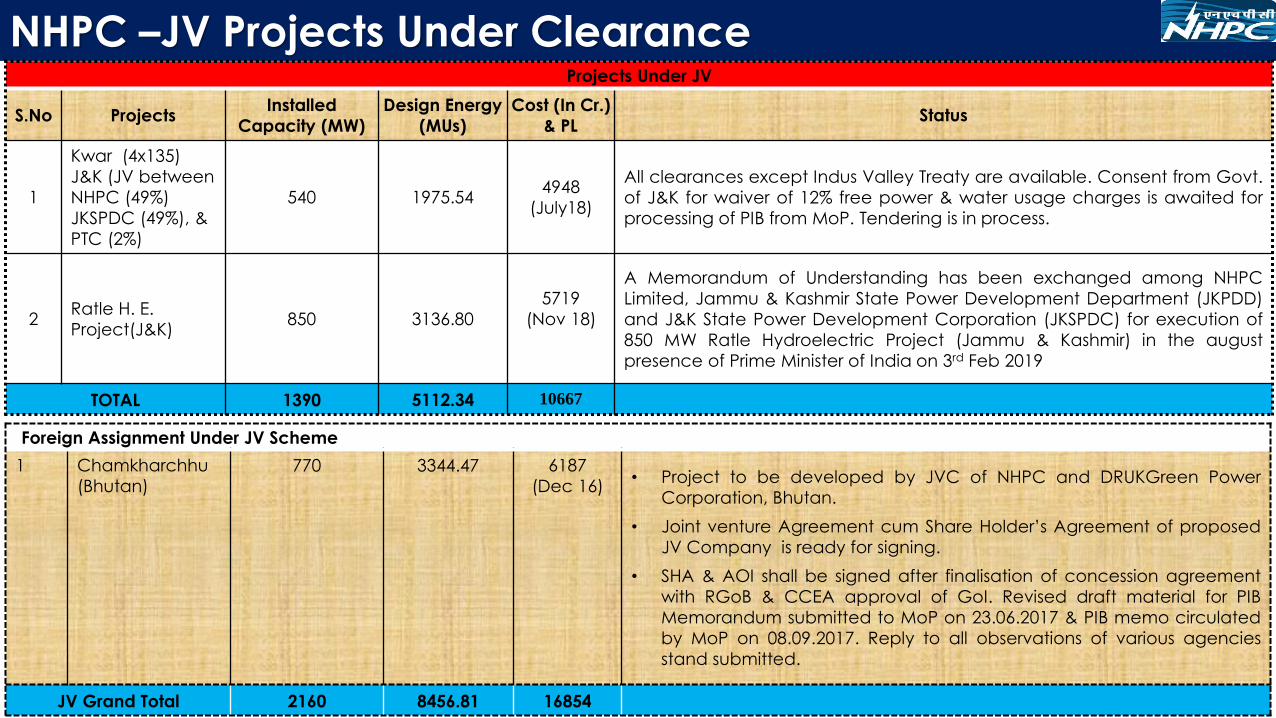
NHPC –JV Projects Under Clearance
Foreign Assignment Under JV Scheme
1 Chamkharchhu
(Bhutan)770 3344.47 6187
(Dec 16)• Project to be developed by JVC of NHPC and DRUKGreen Power
Corporation, Bhutan.
• Joint venture Agreement cum Share Holder’s Agreement of proposed
JV Company is ready for signing.
• SHA & AOI shall be signed after finalisation of concession agreement
with RGoB & CCEA approval of GoI. Revised draft material for PIB
Memorandum submitted to MoP on 23.06.2017 & PIB memo circulated
by MoP on 08.09.2017. Reply to all observations of various agencies
stand submitted.
JV Grand Total 2160 8456.81 16854
Projects Under JV
S.No ProjectsInstalled
Capacity (MW)
Design Energy
(MUs)
Cost (In Cr.)
& PLStatus
1
Kwar (4x135)
J&K (JV between
NHPC (49%)
JKSPDC (49%), &
PTC (2%)
540 1975.544948
(July18)
All clearances except Indus Valley Treaty are available. Consent from Govt.
of J&K for waiver of 12% free power & water usage charges is awaited for
processing of PIB from MoP. Tendering is in process.
2Ratle H. E.
Project(J&K)850 3136.80
5719
(Nov 18)
A Memorandum of Understanding has been exchanged among NHPC
Limited, Jammu & Kashmir State Power Development Department (JKPDD)
and J&K State Power Development Corporation (JKSPDC) for execution of
850 MW Ratle Hydroelectric Project (Jammu & Kashmir) in the august
presence of Prime Minister of India on 3rd Feb 2019
TOTAL 1390 5112.34 10667

28
NHPC –Subsidiary Under Clearance
Projects Under Subsidiary
S.No Projects
Installed Capacity
(MW)
Design Energy (MUs)
Cost (In Cr.) & PL
Status
1 Loktak D/S (2x33) Manipur
(JV between NHPC (74%) & Govt. of Manipur (26%)
66 333.76 1392(Dec18)
JVC formed & Board started functioning. All statutory clearances of project except CCEA are
available. Tendering of all major works is in process. Different tariff models have been explored to get the
actual status of commercial viability of project &submitted to MoP.
TOTAL 66 333.76 1392
Projects Under NCLT
S.No ProjectsInstalled Capacity
(MW)
Design Energy (MUs)
Cost (In Cr.) & PL
Status
1 Teesta VI (4x125) Sikkim
500 2400 5748(July’18)
CCEA in its meeting held on 07.03.2019 has given itsapproval for investment sanction for acquisition of M/sLanco Teesta Power Limited and execution of balanceworks of the project.
TOTAL 500 2400 5748

29
NHPC –Projects Under Pipeline
S. No. Projects StateInstalled Capacity
(MW)
Projects Under FR/DPR Preparation
1 Bursar* Jammu & Kashmir 800
Total 800
*DPR submitted to CEA on 06.01.2017 & the same is under examination at CEA/CWC.
30
NHPC-Energising India With Hydropower


![Financial Results with Investor Presentation, Results Press Release & Auditors Report for March 31, 2015 [Result]](https://img.pdfslide.net/doc/110x75/577cb48f1a28aba7118c84de/financial-results-with-investor-presentation-results-press-release-auditors.jpg)


![Investor Presentation - Financial year ended March 31, 2016 [Company Update]](https://img.pdfslide.net/doc/110x75/577c7e191a28abe054a08e01/investor-presentation-financial-year-ended-march-31-2016-company-update.jpg)