Embed Size (px)
Citation preview
Suzlon Energy LimitedInvestor PresentationFinancial Year 2021
2
Disclaimer
• This presentation and the accompanying slides (the “Presentation”), which have been prepared by Suzlon Energy Limited (the “Company”), have been preparedsolely for information purposes and DOES not constitute any offer, recommendation or invitation to purchase or subscribe for any securities, and shall not formthe basis of or be relied on in connection with any contract or binding commitment whatsoever. The Presentation is not intended to form the basis of anyinvestment decision by a prospective investor. No offering of securities of the Company will be made except by means of a statutory offering document containingdetailed information about the Company.
• This Presentation has been prepared by the Company based on information and data which the Company considers reliable, but the Company makes norepresentation or warranty, express or implied, whatsoever, and no reliance shall be placed on, the truth, accuracy, reliability or fairness of the contents of thisPresentation. This Presentation may not be all inclusive and may not contain all of the information that you may consider material. Any liability in respect of thecontents of, or any omission from, this Presentation is expressly excluded. In particular, but without prejudice to the generality of the foregoing, no representationor warranty whatsoever is given in relation to the reasonableness or achievability of any projections contained in the Presentation or in relation to the bases andassumptions underlying such projections and you must satisfy yourself in relation to the reasonableness, achievability and accuracy thereof.
• Certain matters discussed in this Presentation may contain statements regarding the Company’s market opportunity and business prospects that are individuallyand collectively forward-looking statements. Such forward-looking statements are not guarantees of future performance and are subject to known and unknownrisks, uncertainties and assumptions that are difficult to predict. These risks and uncertainties include, but are not limited to, the performance of the Indianeconomy and of the economies of various international markets, the performance of the wind power industry in India and world-wide, the Company’s ability tosuccessfully implement its strategy, the Company’s future levels of growth and expansion, technological implementation, changes and advancements, changes inrevenue, income or cash flows, the Company’s market preferences and its exposure to market risks, as well as other risks. The Company’s actual results, levels ofactivity, performance or achievements could differ materially and adversely from results expressed in or implied by this Presentation. The Company assumes noobligation to update any forward-looking information contained in this Presentation. Any forward-looking statements and projections made by third partiesincluded in this Presentation are not adopted by the Company and the Company is not responsible for such third party statements and projections.
• No responsibility or liability is accepted for any loss or damage howsoever arising that you may suffer as a result of this Presentation and any and all responsibilityand liability is expressly disclaimed by the Management, the Shareholders and the Company or any of them or any of their respective directors, officers, affiliates,employees, advisers or agents.
• No offering of the Company’s securities will be registered under the U.S. Securities Act of 1933, as amended (the “Securities Act”). Accordingly, unless anexemption from registration under the Securities Act is available, the Company’s securities may not be offered, sold, resold, delivered or distributed, directly orindirectly, into the United States or to, or for the account or benefit of, any U.S. Person (as defined in regulation S under the Securities Act).
• The distribution of this document in certain jurisdictions may be restricted by law and persons into whose possession this presentation comes should informthemselves about and observe any such restrictions. Any failure to comply with these restrictions may constitute a violation of the laws of such jurisdiction.
3
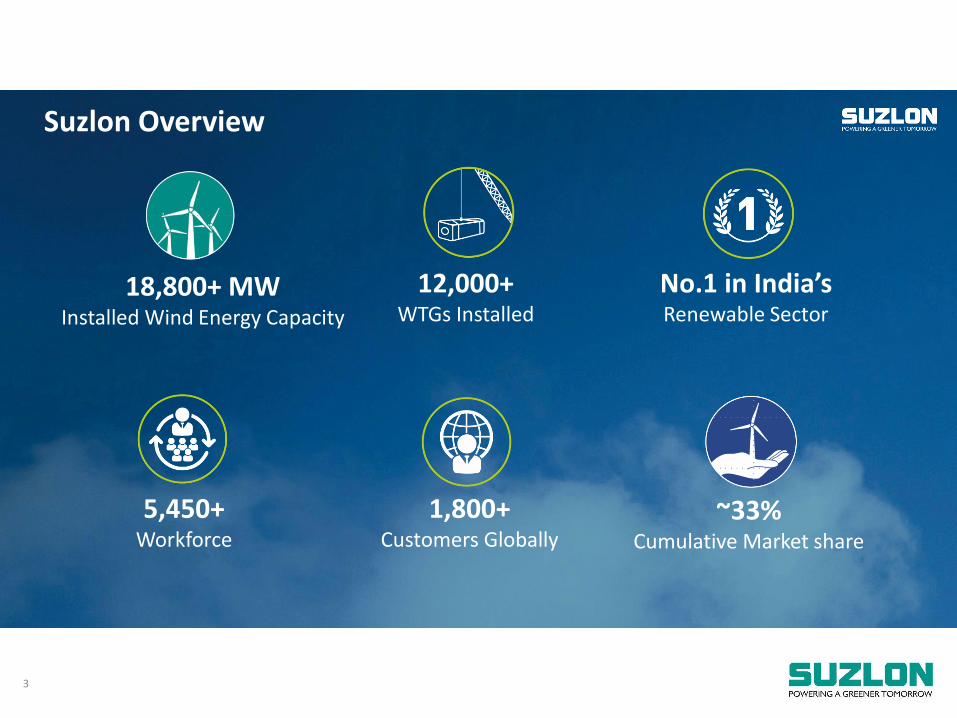
Suzlon Overview
5,450+Workforce
1,800+Customers Globally
~33% Cumulative Market share
18,800+ MWInstalled Wind Energy Capacity
12,000+WTGs Installed
No.1 in India’sRenewable Sector
4
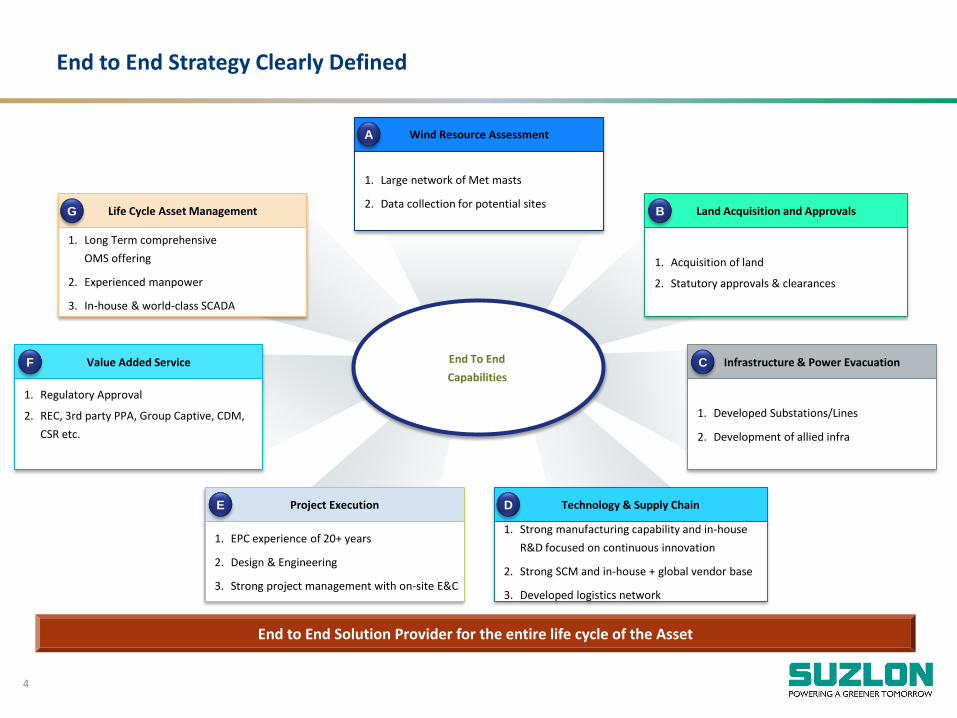
End to End Strategy Clearly Defined
End to End Solution Provider for the entire life cycle of the Asset
Wind Resource Assessment
1. Large network of Met masts
2. Data collection for potential sitesLand Acquisition and Approvals
1. Acquisition of land
2. Statutory approvals & clearances
Infrastructure & Power Evacuation
1. Developed Substations/Lines
2. Development of allied infra
Technology & Supply Chain
1. Strong manufacturing capability and in-house
R&D focused on continuous innovation
2. Strong SCM and in-house + global vendor base
3. Developed logistics network
Project Execution
1. EPC experience of 20+ years
2. Design & Engineering
3. Strong project management with on-site E&C
Value Added Service
1. Regulatory Approval
2. REC, 3rd party PPA, Group Captive, CDM,
CSR etc.
Life Cycle Asset Management
1. Long Term comprehensive
OMS offering
2. Experienced manpower
3. In-house & world-class SCADA
End To End
Capabilities
A
BG
CF
E D
5
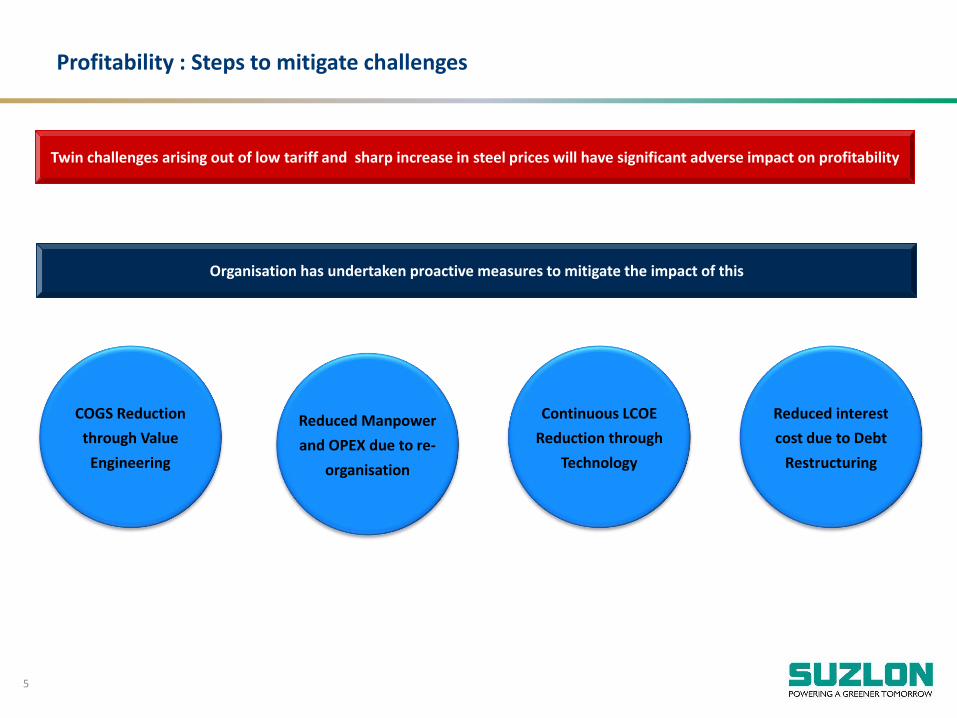
Organisation has undertaken proactive measures to mitigate the impact of this
COGS Reduction
through Value
Engineering
Continuous LCOE
Reduction through
Technology
Reduced Manpower
and OPEX due to re-
organisation
Reduced interest
cost due to Debt
Restructuring
Profitability : Steps to mitigate challenges
Twin challenges arising out of low tariff and sharp increase in steel prices will have significant adverse impact on profitability
6
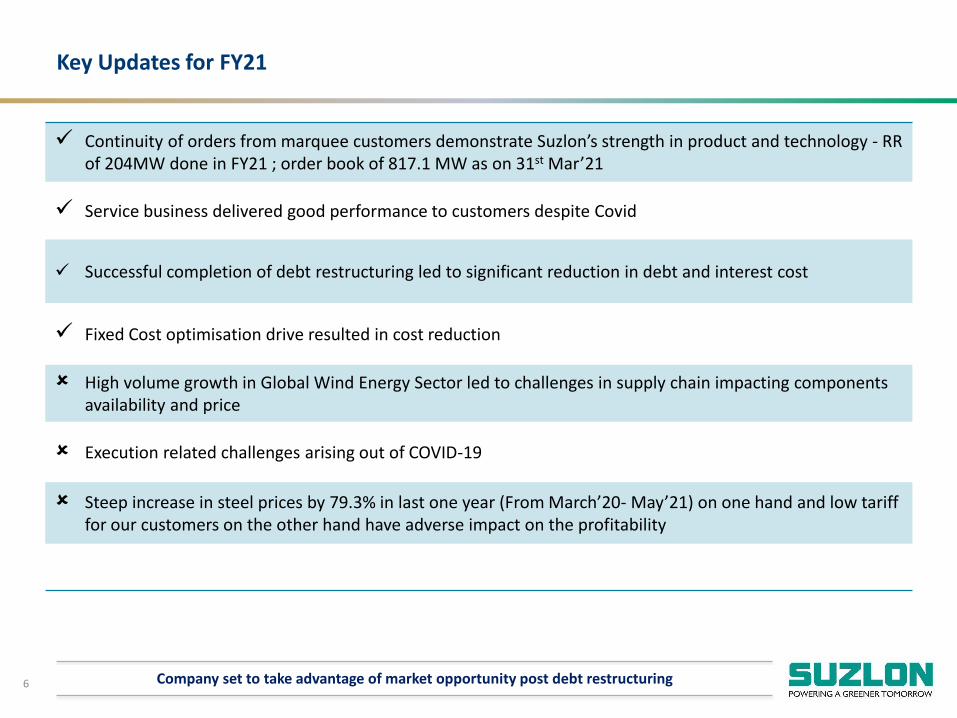
Key Updates for FY21
Company set to take advantage of market opportunity post debt restructuring
Continuity of orders from marquee customers demonstrate Suzlon’s strength in product and technology - RR of 204MW done in FY21 ; order book of 817.1 MW as on 31st Mar’21
Service business delivered good performance to customers despite Covid
Successful completion of debt restructuring led to significant reduction in debt and interest cost
Fixed Cost optimisation drive resulted in cost reduction
High volume growth in Global Wind Energy Sector led to challenges in supply chain impacting components availability and price
Execution related challenges arising out of COVID-19
Steep increase in steel prices by 79.3% in last one year (From March’20- May’21) on one hand and low tariff for our customers on the other hand have adverse impact on the profitability
7
Financial Performance Industry Outlook
Suzlon Strengths Detailed Financials
Technology
8
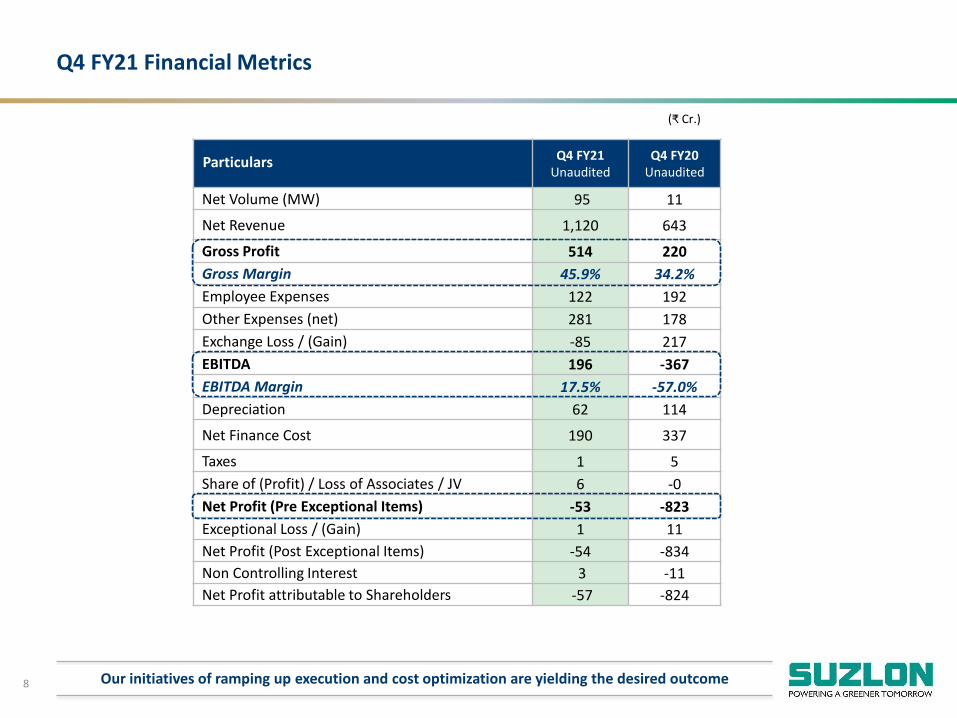
Q4 FY21 Financial Metrics
Particulars Q4 FY21Unaudited
Q4 FY20Unaudited
Net Volume (MW) 95 11
Net Revenue 1,120 643
Gross Profit 514 220
Gross Margin 45.9% 34.2%
Employee Expenses 122 192
Other Expenses (net) 281 178
Exchange Loss / (Gain) -85 217
EBITDA 196 -367
EBITDA Margin 17.5% -57.0%
Depreciation 62 114
Net Finance Cost 190 337
Taxes 1 5
Share of (Profit) / Loss of Associates / JV 6 -0
Net Profit (Pre Exceptional Items) -53 -823
Exceptional Loss / (Gain) 1 11
Net Profit (Post Exceptional Items) -54 -834
Non Controlling Interest 3 -11
Net Profit attributable to Shareholders -57 -824
(₹ Cr.)
Our initiatives of ramping up execution and cost optimization are yielding the desired outcome
9
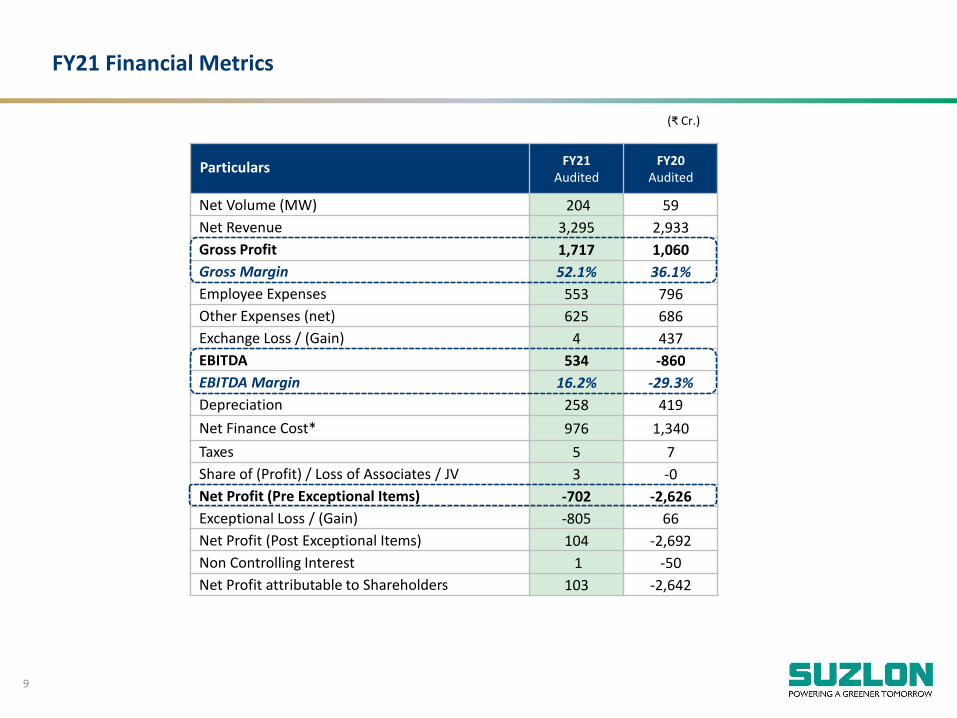
FY21 Financial Metrics
Particulars FY21Audited
FY20Audited
Net Volume (MW) 204 59
Net Revenue 3,295 2,933
Gross Profit 1,717 1,060
Gross Margin 52.1% 36.1%
Employee Expenses 553 796
Other Expenses (net) 625 686
Exchange Loss / (Gain) 4 437
EBITDA 534 -860
EBITDA Margin 16.2% -29.3%
Depreciation 258 419
Net Finance Cost* 976 1,340
Taxes 5 7
Share of (Profit) / Loss of Associates / JV 3 -0
Net Profit (Pre Exceptional Items) -702 -2,626
Exceptional Loss / (Gain) -805 66
Net Profit (Post Exceptional Items) 104 -2,692
Non Controlling Interest 1 -50
Net Profit attributable to Shareholders 103 -2,642
(₹ Cr.)
10
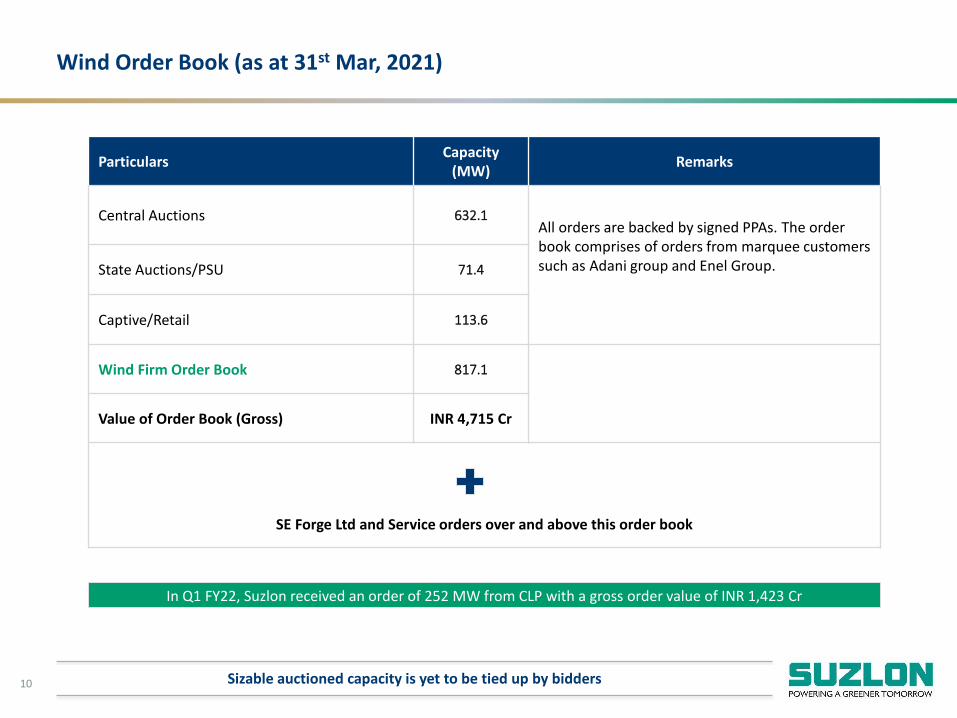
Wind Order Book (as at 31st Mar, 2021)
Sizable auctioned capacity is yet to be tied up by bidders
ParticularsCapacity
(MW)Remarks
Central Auctions 632.1All orders are backed by signed PPAs. The order book comprises of orders from marquee customers such as Adani group and Enel Group.State Auctions/PSU 71.4
Captive/Retail 113.6
Wind Firm Order Book 817.1
Value of Order Book (Gross) INR 4,715 Cr
SE Forge Ltd and Service orders over and above this order book
In Q1 FY22, Suzlon received an order of 252 MW from CLP with a gross order value of INR 1,423 Cr
11
Financial Performance Industry Outlook
Suzlon Strengths Detailed Financials
Technology
12
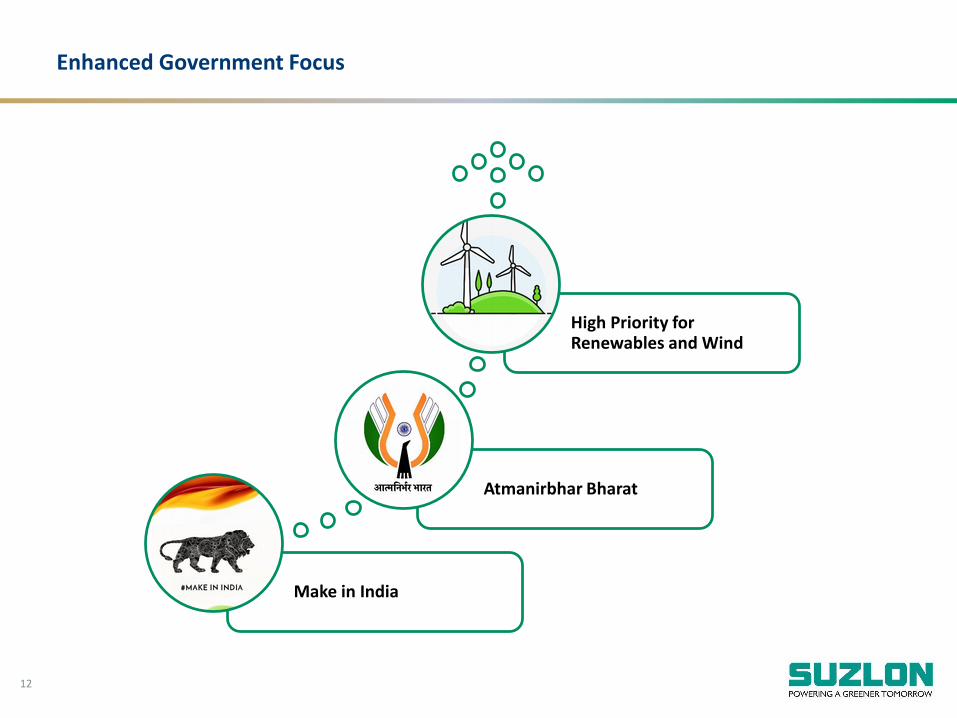
Enhanced Government Focus
Make in India
Atmanirbhar Bharat
High Priority for Renewables and Wind
13
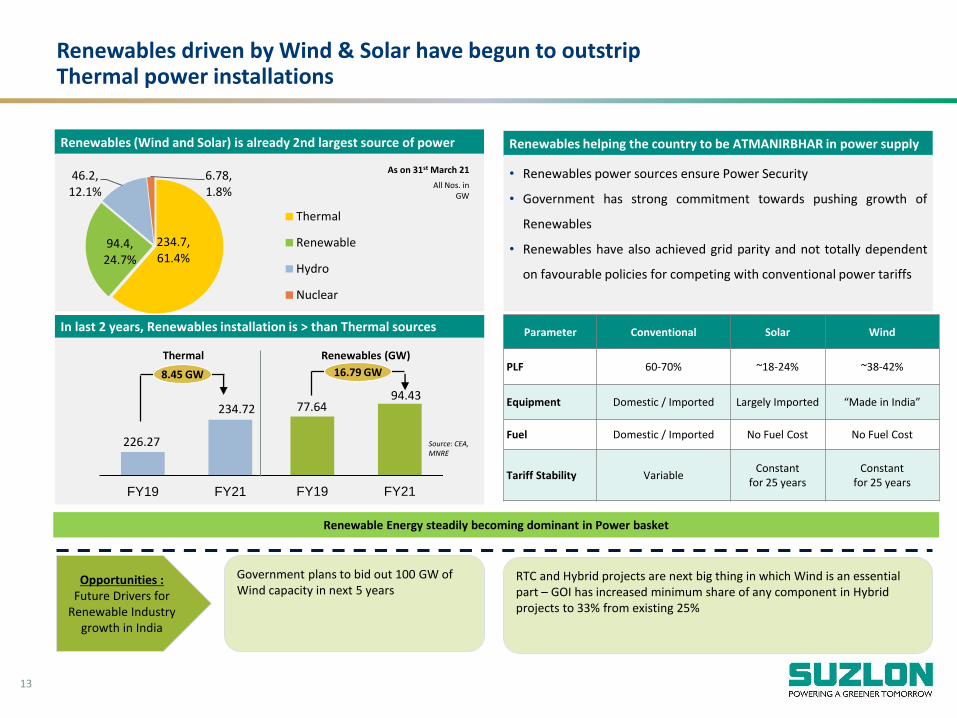
Renewables driven by Wind & Solar have begun to outstrip Thermal power installations
Renewables (Wind and Solar) is already 2nd largest source of power
8.45 GW 16.79 GW
Thermal Renewables (GW)
Source: CEA, MNRE
Parameter Conventional Solar Wind
PLF 60-70% ~18-24% ~38-42%
Equipment Domestic / Imported Largely Imported “Made in India”
Fuel Domestic / Imported No Fuel Cost No Fuel Cost
Tariff Stability VariableConstant
for 25 yearsConstant
for 25 years
In last 2 years, Renewables installation is > than Thermal sources
226.27
234.72
FY19 FY21
All Nos. in GW
As on 31st March 21
Renewable Energy steadily becoming dominant in Power basket
Renewables helping the country to be ATMANIRBHAR in power supply
• Renewables power sources ensure Power Security
• Government has strong commitment towards pushing growth of
Renewables
• Renewables have also achieved grid parity and not totally dependent
on favourable policies for competing with conventional power tariffs
234.7,61.4%
94.4,24.7%
46.2,12.1%
6.78,1.8%
Thermal
Renewable
Hydro
Nuclear
FY19 FY21
77.6494.43
Opportunities :Future Drivers for
Renewable Industry growth in India
Government plans to bid out 100 GW of Wind capacity in next 5 years
RTC and Hybrid projects are next big thing in which Wind is an essential part – GOI has increased minimum share of any component in Hybrid projects to 33% from existing 25%
14
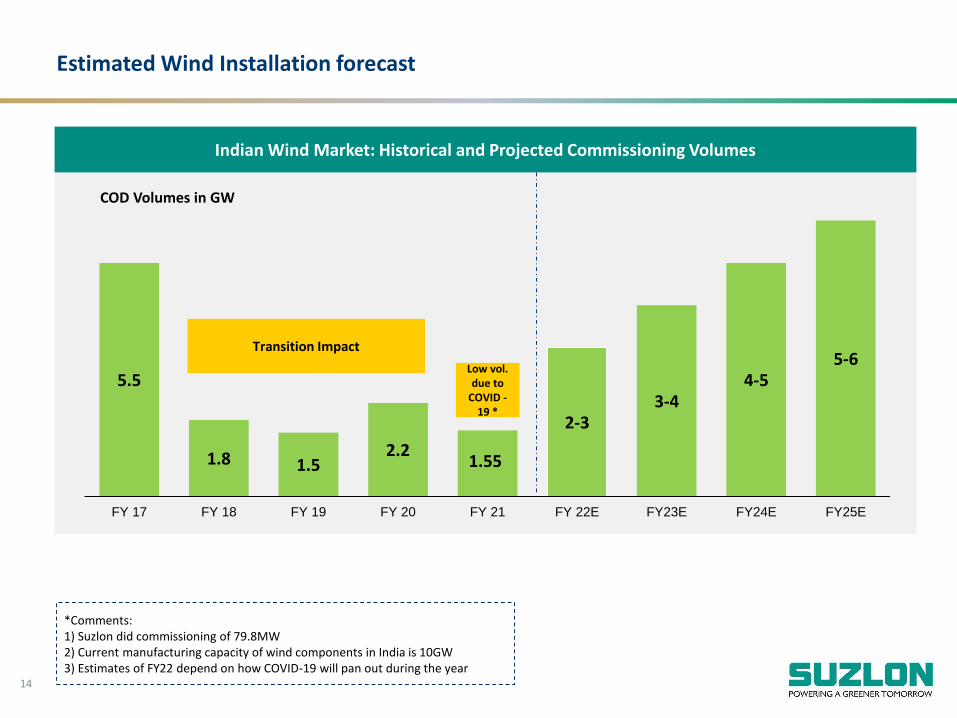
Estimated Wind Installation forecast
Indian Wind Market: Historical and Projected Commissioning Volumes
5.5
1.8 1.52.2
2-33-4
4-55-6
FY 17 FY 18 FY 19 FY 20 FY 21 FY 22E FY23E FY24E FY25E
COD Volumes in GW
Transition Impact
Low vol. due to
COVID -19 *
1.55
*Comments:1) Suzlon did commissioning of 79.8MW2) Current manufacturing capacity of wind components in India is 10GW3) Estimates of FY22 depend on how COVID-19 will pan out during the year
15
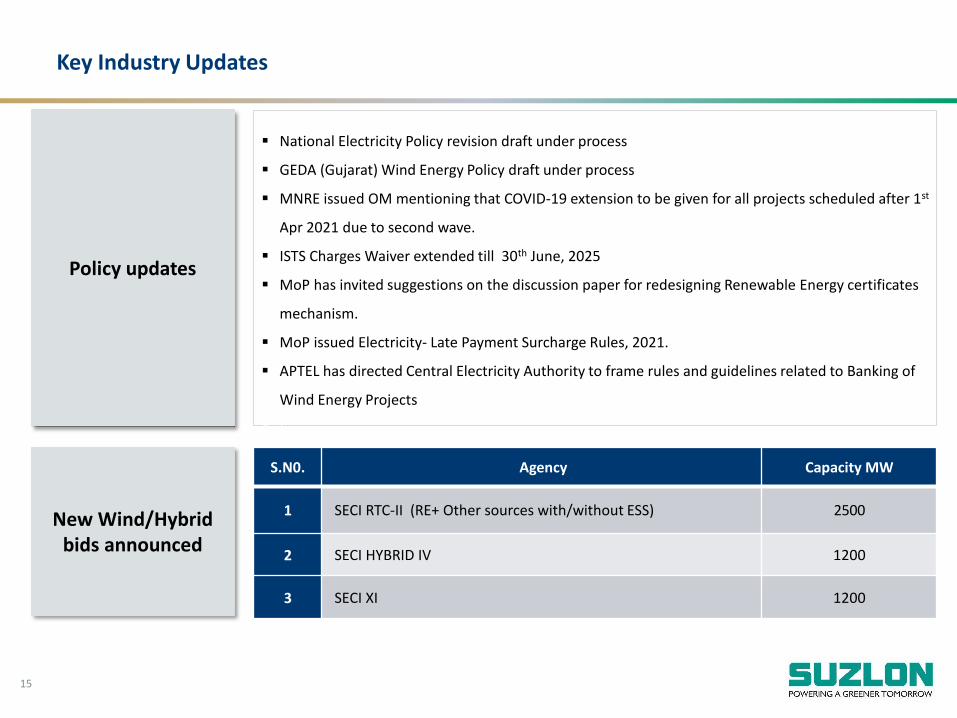
Key Industry Updates
Policy updates
National Electricity Policy revision draft under process
GEDA (Gujarat) Wind Energy Policy draft under process
MNRE issued OM mentioning that COVID-19 extension to be given for all projects scheduled after 1st
Apr 2021 due to second wave.
ISTS Charges Waiver extended till 30th June, 2025
MoP has invited suggestions on the discussion paper for redesigning Renewable Energy certificates
mechanism.
MoP issued Electricity- Late Payment Surcharge Rules, 2021.
APTEL has directed Central Electricity Authority to frame rules and guidelines related to Banking of
Wind Energy Projects
(
New Wind/Hybrid bids announced
S.N0. Agency Capacity MW
1 SECI RTC-II (RE+ Other sources with/without ESS) 2500
2 SECI HYBRID IV 1200
3 SECI XI 1200
16
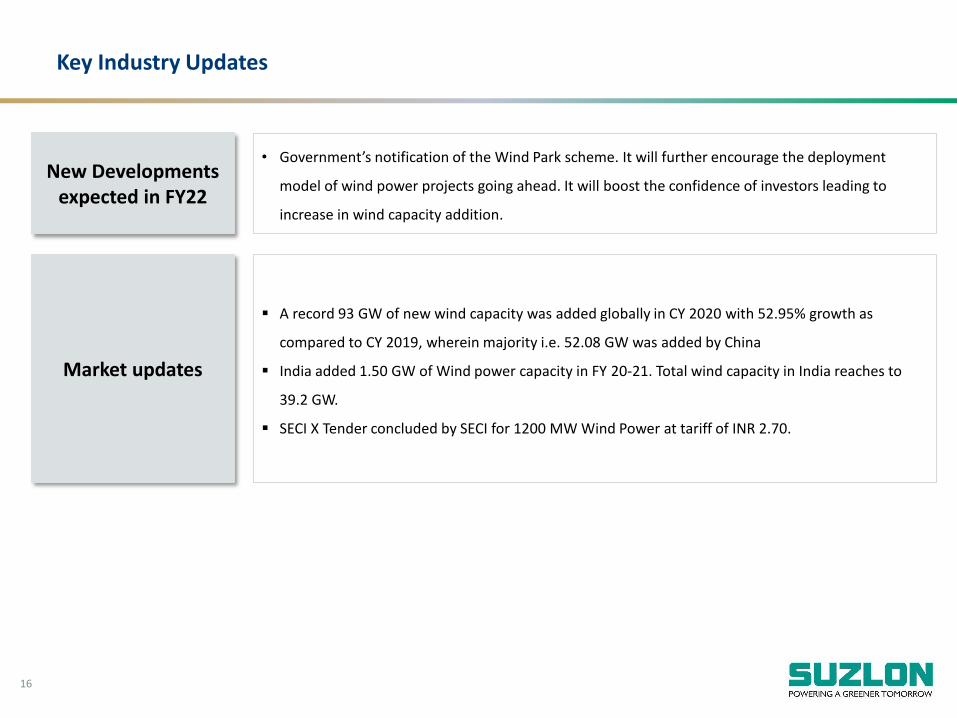
Key Industry Updates
Market updates
A record 93 GW of new wind capacity was added globally in CY 2020 with 52.95% growth as
compared to CY 2019, wherein majority i.e. 52.08 GW was added by China
India added 1.50 GW of Wind power capacity in FY 20-21. Total wind capacity in India reaches to
39.2 GW.
SECI X Tender concluded by SECI for 1200 MW Wind Power at tariff of INR 2.70.
New Developments expected in FY22
• Government’s notification of the Wind Park scheme. It will further encourage the deployment
model of wind power projects going ahead. It will boost the confidence of investors leading to
increase in wind capacity addition.
17
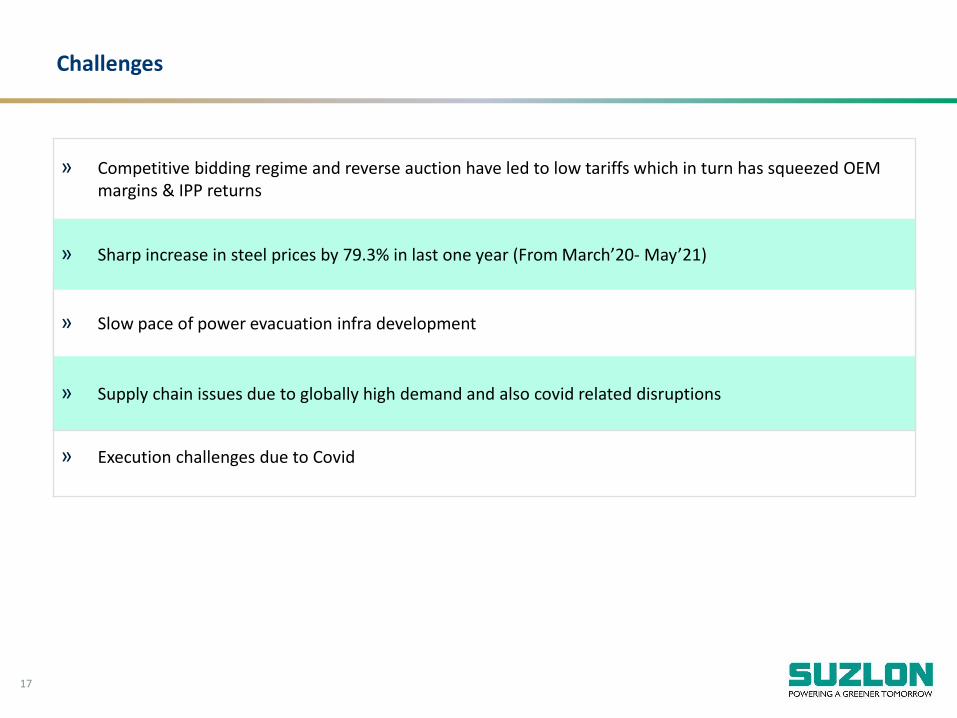
Challenges
» Execution challenges due to Covid
» Competitive bidding regime and reverse auction have led to low tariffs which in turn has squeezed OEM margins & IPP returns
» Sharp increase in steel prices by 79.3% in last one year (From March’20- May’21)
» Slow pace of power evacuation infra development
» Supply chain issues due to globally high demand and also covid related disruptions
18
Financial Performance Industry Outlook
Suzlon Strengths Detailed Financials
Technology
19
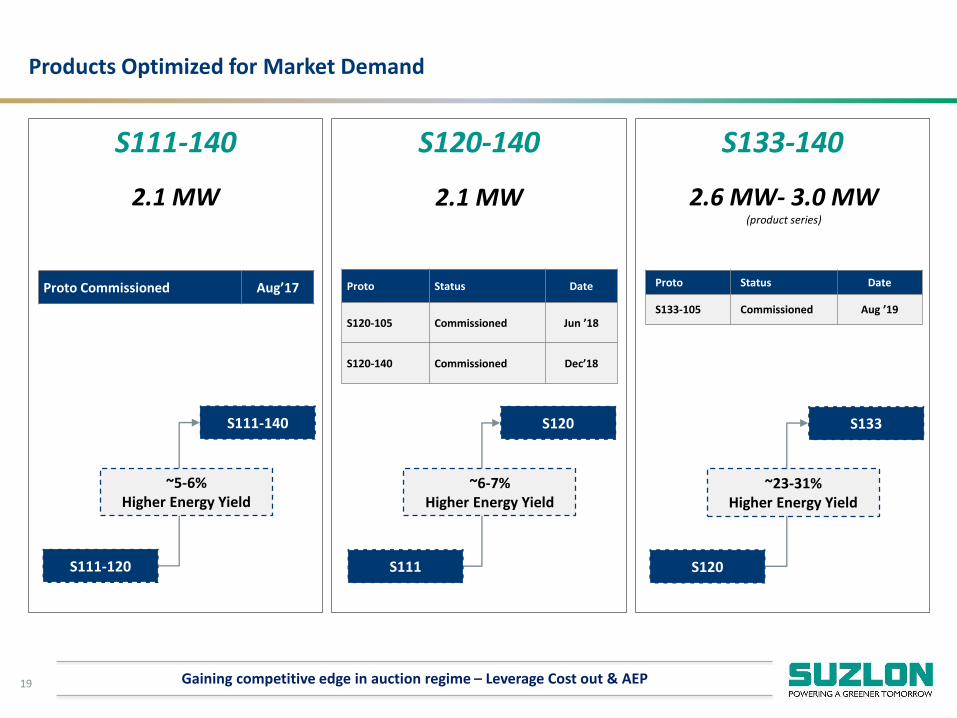
Products Optimized for Market Demand
Gaining competitive edge in auction regime – Leverage Cost out & AEP
S111-120
S111-140
~5-6% Higher Energy Yield
S111-140
2.1 MW
S111
S120
~6-7% Higher Energy Yield
S120-140
2.1 MW
S120
S133
~23-31%Higher Energy Yield
S133-140
2.6 MW- 3.0 MW(product series)
Proto Status Date
S120-105 Commissioned Jun ’18
S120-140 Commissioned Dec’18
Proto Commissioned Aug’17 Proto Status Date
S133-105 Commissioned Aug ’19

20
Product Development
Enables us to reach untapped wind sites in challenging terrains
S133: New Product SB 63 – Won SKOCH award for Corporate Excellence
S133 – 105
S128 has already been listed in the RLMM list
The testing is in progress for our next generation of blade – SB65 and wind
turbine – S133
S133 Turbine Model – Applied for RLMM Listing
Multiple Tower Options (Hybrid Lattice, Steel Tubular)
21
Financial Performance Industry Outlook
Suzlon Strengths Detailed Financials
Technology
22
Suzlon’s Strengths in Indian Wind Energy Market
End-to-end service provider with strong presence across value chain & customer segments
Full Turnkey Solution Provider
Strong Customer Relationship
Best In Class Service Capabilities
Pan India Presence
Technology Leadership
25 Years Track Record
23
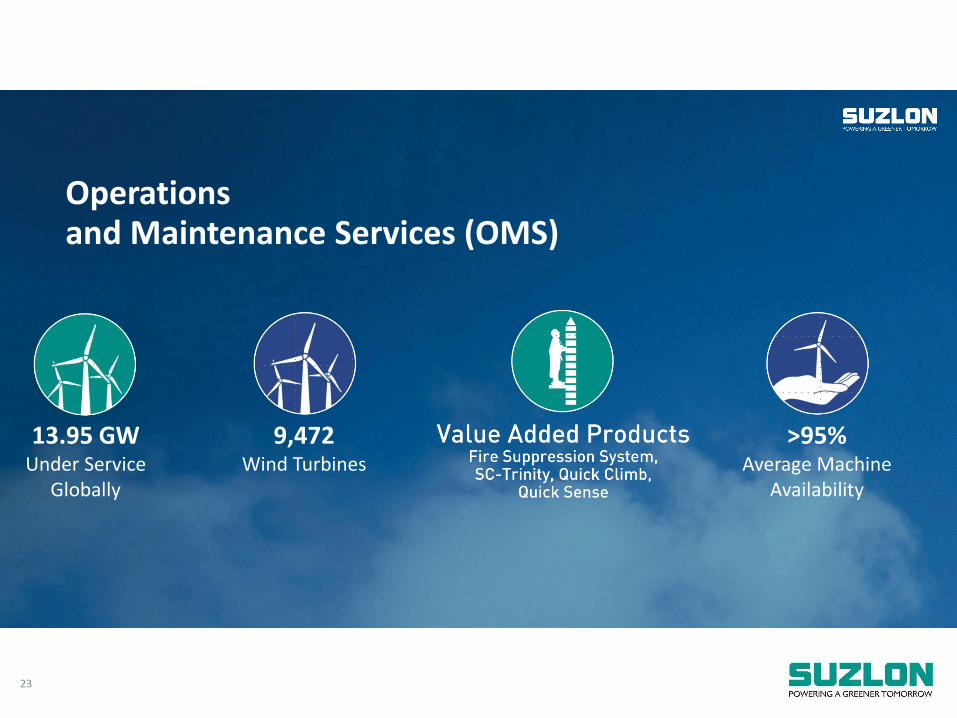
Operations and Maintenance Services (OMS)
>95%Average Machine
Availability
9,472Wind Turbines
13.95 GWUnder Service
Globally
24
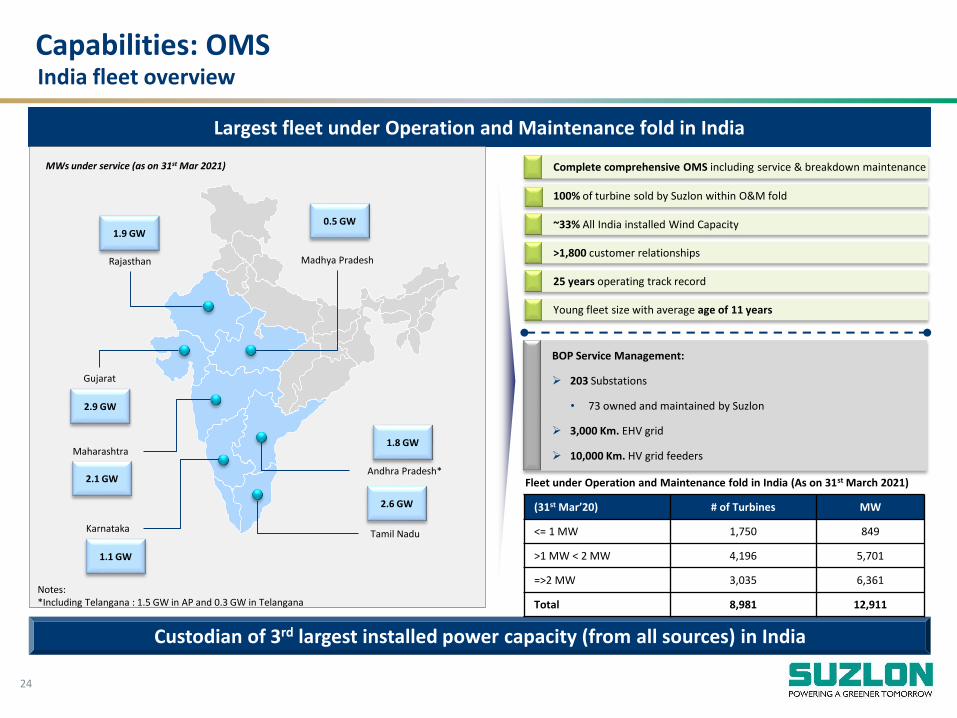
Largest fleet under Operation and Maintenance fold in India
Complete comprehensive OMS including service & breakdown maintenance
100% of turbine sold by Suzlon within O&M fold
~33% All India installed Wind Capacity
>1,800 customer relationships
25 years operating track record
Young fleet size with average age of 11 years
BOP Service Management:
203 Substations
• 73 owned and maintained by Suzlon
3,000 Km. EHV grid
10,000 Km. HV grid feeders
Custodian of 3rd largest installed power capacity (from all sources) in India
India fleet overview
Rajasthan
Gujarat
Maharashtra
Madhya Pradesh
Andhra Pradesh*
KarnatakaTamil Nadu
1.9 GW
2.9 GW
0.5 GW
2.1 GW
1.1 GW
1.8 GW
2.6 GW
Notes:*Including Telangana : 1.5 GW in AP and 0.3 GW in Telangana
MWs under service (as on 31st Mar 2021)
Capabilities: OMS
(31st Mar’20) # of Turbines MW
<= 1 MW 1,750 849
>1 MW < 2 MW 4,196 5,701
=>2 MW 3,035 6,361
Total 8,981 12,911
Fleet under Operation and Maintenance fold in India (As on 31st March 2021)
25
Financial Performance Industry Outlook
Suzlon Strengths Detailed Financials
Technology
26
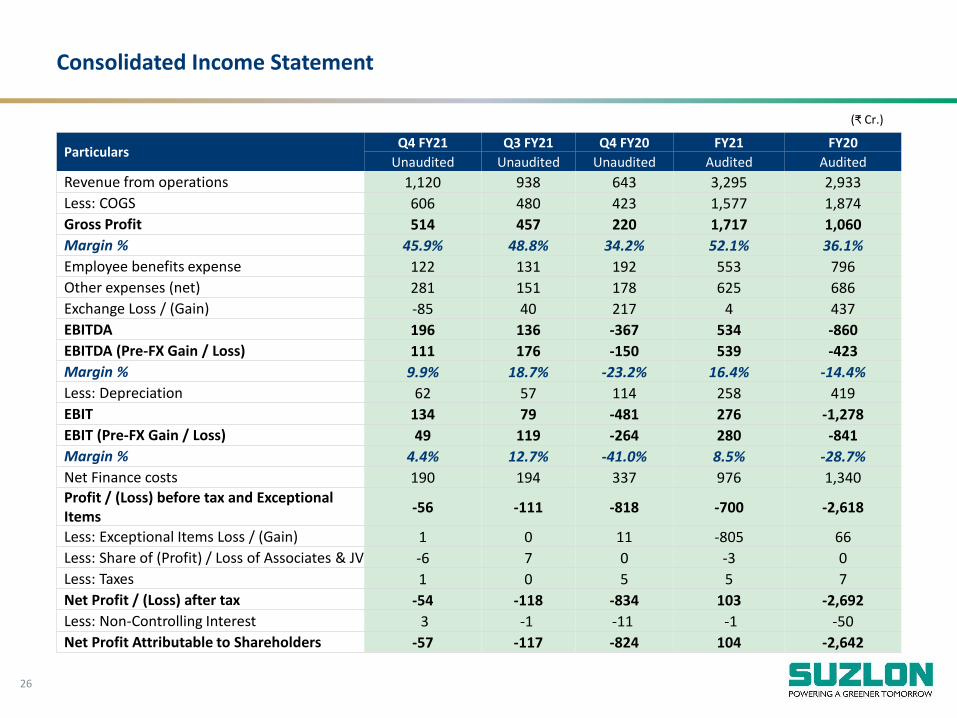
ParticularsQ4 FY21 Q3 FY21 Q4 FY20 FY21 FY20
Unaudited Unaudited Unaudited Audited Audited
Revenue from operations 1,120 938 643 3,295 2,933
Less: COGS 606 480 423 1,577 1,874
Gross Profit 514 457 220 1,717 1,060
Margin % 45.9% 48.8% 34.2% 52.1% 36.1%
Employee benefits expense 122 131 192 553 796
Other expenses (net) 281 151 178 625 686
Exchange Loss / (Gain) -85 40 217 4 437
EBITDA 196 136 -367 534 -860
EBITDA (Pre-FX Gain / Loss) 111 176 -150 539 -423
Margin % 9.9% 18.7% -23.2% 16.4% -14.4%
Less: Depreciation 62 57 114 258 419
EBIT 134 79 -481 276 -1,278
EBIT (Pre-FX Gain / Loss) 49 119 -264 280 -841
Margin % 4.4% 12.7% -41.0% 8.5% -28.7%
Net Finance costs 190 194 337 976 1,340 Profit / (Loss) before tax and Exceptional Items
-56 -111 -818 -700 -2,618
Less: Exceptional Items Loss / (Gain) 1 0 11 -805 66
Less: Share of (Profit) / Loss of Associates & JV -6 7 0 -3 0
Less: Taxes 1 0 5 5 7
Net Profit / (Loss) after tax -54 -118 -834 103 -2,692
Less: Non-Controlling Interest 3 -1 -11 -1 -50
Net Profit Attributable to Shareholders -57 -117 -824 104 -2,642
Consolidated Income Statement
(₹ Cr.)
27
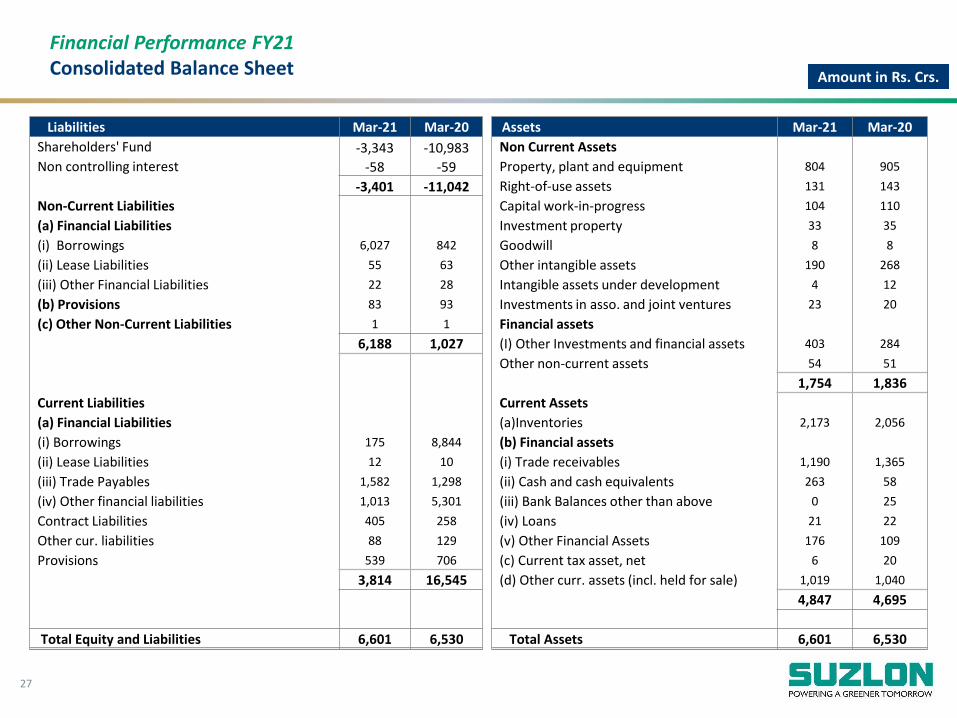
Financial Performance FY21Consolidated Balance Sheet Amount in Rs. Crs.
Liabilities Mar-21 Mar-20 Assets Mar-21 Mar-20
Shareholders' Fund -3,343 -10,983 Non Current Assets
Non controlling interest -58 -59 Property, plant and equipment 804 905
-3,401 -11,042 Right-of-use assets 131 143
Non-Current Liabilities Capital work-in-progress 104 110
(a) Financial Liabilities Investment property 33 35
(i) Borrowings 6,027 842 Goodwill 8 8
(ii) Lease Liabilities 55 63 Other intangible assets 190 268
(iii) Other Financial Liabilities 22 28 Intangible assets under development 4 12
(b) Provisions 83 93 Investments in asso. and joint ventures 23 20
(c) Other Non-Current Liabilities 1 1 Financial assets
6,188 1,027 (I) Other Investments and financial assets 403 284
Other non-current assets 54 51
1,754 1,836
Current Liabilities Current Assets
(a) Financial Liabilities (a)Inventories 2,173 2,056
(i) Borrowings 175 8,844 (b) Financial assets
(ii) Lease Liabilities 12 10 (i) Trade receivables 1,190 1,365
(iii) Trade Payables 1,582 1,298 (ii) Cash and cash equivalents 263 58
(iv) Other financial liabilities 1,013 5,301 (iii) Bank Balances other than above 0 25
Contract Liabilities 405 258 (iv) Loans 21 22
Other cur. liabilities 88 129 (v) Other Financial Assets 176 109
Provisions 539 706 (c) Current tax asset, net 6 20
3,814 16,545 (d) Other curr. assets (incl. held for sale) 1,019 1,040
4,847 4,695
Total Equity and Liabilities 6,601 6,530 Total Assets 6,601 6,530
28
Thank You!
Thank You!